UBS Turkish Senior Management One-on-One … · UBS Turkish Senior Management One-on-One Conference...
40
UBS Turkish Senior Management One-on-One Conference LONDON, FEBRUARY 2008 PHILIPP HAAS – CHAIRMAN IDIL BORA – IR MANAGER
Transcript of UBS Turkish Senior Management One-on-One … · UBS Turkish Senior Management One-on-One Conference...

UBS Turkish Senior Management One-on-One Conference
LONDON, FEBRUARY 2008
PHILIPP HAAS – CHAIRMANIDIL BORA – IR MANAGER

This presentation has been prepared by EastPharma Ltd (the “Company”) solely for its use at the presentation to investors to be made in September 2007. By attending the meeting where this presentation is made, or by reading the presentation slides, you agree to be bound by the following limitations.This document is not a prospectus. This document does not constitute or form part of any offer or invitation to sell or issue, or any solicitation of any offer to purchase or subscribe for, any securities of the Company, nor shall any part of it nor the fact of its distribution form part of or be relied on in connection with any contract or investment decision relating thereto, nor does it constitute a recommendation regarding the securities of the Company.This presentation is being supplied to you solely for your information. This presentation and its contents are confidential and may not be further copied, distributed or passed on to any other person or published or reproduced directly or indirectly, in whole or in part, by any medium or in any form for any purpose. The information contained in this presentation must be kept confidential and must not be used for any other purpose. Neither this presentation nor any copy of it nor the information contained in it may be taken or transmitted in or into the United States, Canada, Japan or Australia, or distributed, directly or indirectly, in or into the United States, Canada or Australia, or distributed or redistributed in Japan or to any resident thereof. Any failure to comply with these restrictions may constitute a violation of United States, Canadian, Japanese or Australian securities laws. The distribution of this presentation in other jurisdictions may be restricted by law, and persons into whose possessions this presentation comes should inform themselves about, and observe, any such restrictions.This document and its contents are confidential and may not be reproduced, redistributed or passed on, directly or indirectly, to any other person or published, in whole or in part, for any purpose, and it is intended for distribution in the United Kingdom only to and is directed only at: (i) persons who have professional experience in matters relating to investments falling within the definition of “investment professionals” in Article 19(5) of the Financial Services and Markets Act 2000 (Financial Promotion) Order 2005 (the “Order”); or (ii) persons falling within Article 49(2)(a) to (d) of the Order; or (iii) to those persons to whom it can otherwise lawfully be distributed (all such persons together being referred to as “relevant persons”). This document must not be acted upon by persons who are not relevant persons. Any investment or investment activity to which this communication relates is available only to relevant persons and will be engaged in only with relevant persons.The information in this presentation is given in confidence and the recipients of this presentation should not base any behaviour in relation to qualifying investments or relevant
Important Notice - Disclaimer
2
The information in this presentation is given in confidence and the recipients of this presentation should not base any behaviour in relation to qualifying investments or relevant products (as defined in Financial Services and Markets Act 2000 (as amended) (“FSMA”) and the Code of Market Conduct (made pursuant to FSMA) which would amount to market abuse for the purposes of FSMA on the information in this presentation until after the information has been made generally available. Nor should the recipient use the information in this presentation in any way which would constitute “market abuse”.This presentation has been prepared by, and is the sole responsibility of, the Company. The information set out herein has not been verified by the Company or any other person. No representation or warranty, express or implied, is or will be made by the Company or any of its affiliates, directors, officers or employees, or any other person as to the accuracy, completeness or fairness of the information or opinions contained in this presentation and any reliance you place on them will be at your sole risk. Without prejudice to the foregoing, the Company, their advisors and their respective affiliates, directors, officers or employees do not and will not accept any liability whatsoever for any loss howsoever arising, directly or indirectly, from use of this presentation or its contents or otherwise arising in connection therewith. The Company’s securities have not been nor will they be registered under the United States Securities Act of 1933, as amended (the “Securities Act”) and may not be offered or sold in the United States except to qualified institutional buyers (as defined in Rule 144A) in reliance on Rule 144A or another exemption from, or in a transaction not subject to, the registration requirements of the Securities Act. The Company’s securities have not been nor will they be registered under the applicable securities laws of any state or jurisdiction of Australia, Canada or Japan and, subject to certain exceptions, may not be offered or sold within Australia, Canada or Japan or to or for the benefit of any national, resident or citizen of Australia, Canada or Japan.Certain statements in this presentation constitute “forward-looking statements”. These statements, which contain the words “anticipate”, “believe”, “intend”, “estimate”, “expect” and words of similar meaning, reflect the Directors’ beliefs and expectations and are subject to risks and uncertainties that may cause actual results to differ materially. These risks and uncertainties include, among other factors, changing business or other market conditions and the prospects for growth anticipated by the management of the Company. These and other factors could adversely affect the outcome and financial effects of the plans and events described herein. As a result, you are cautioned not to place undue reliance on such forward-looking statements. The Company and their advisors and each of their respective members, directors, officers and employees disclaim any obligation to update the Company’s view of such risks and uncertainties or to publicly announce the result of any revision to the forward-looking statements made herein, except where it would be required to do so under applicable law.
� EastPharma At A Glance
� Turkish Pharma Market
� Recent Developments in EastPharma
Agenda
3
� Company Outlook – EastPharma (EAST.LI)
� Financial Performance Overview – 9M’ 07
� Appendix

EastPharma At A Glance
A leading branded generic pharmaceutical companyA leading branded generic pharmaceutical companyA leading branded generic pharmaceutical companyA leading branded generic pharmaceutical companyA leading branded generic pharmaceutical companyA leading branded generic pharmaceutical companyA leading branded generic pharmaceutical companyA leading branded generic pharmaceutical company
Consolidation platform for Turkish & Eastern European Pharma MarketsConsolidation platform for Turkish & Eastern European Pharma MarketsConsolidation platform for Turkish & Eastern European Pharma MarketsConsolidation platform for Turkish & Eastern European Pharma MarketsConsolidation platform for Turkish & Eastern European Pharma MarketsConsolidation platform for Turkish & Eastern European Pharma MarketsConsolidation platform for Turkish & Eastern European Pharma MarketsConsolidation platform for Turkish & Eastern European Pharma Markets
4
Turkey’s first fully institutionally managed companyTurkey’s first fully institutionally managed companyTurkey’s first fully institutionally managed companyTurkey’s first fully institutionally managed companyTurkey’s first fully institutionally managed companyTurkey’s first fully institutionally managed companyTurkey’s first fully institutionally managed companyTurkey’s first fully institutionally managed company
Listed on London Main Stock Exchange (GDR)Listed on London Main Stock Exchange (GDR)Listed on London Main Stock Exchange (GDR)Listed on London Main Stock Exchange (GDR)Listed on London Main Stock Exchange (GDR)Listed on London Main Stock Exchange (GDR)Listed on London Main Stock Exchange (GDR)Listed on London Main Stock Exchange (GDR)
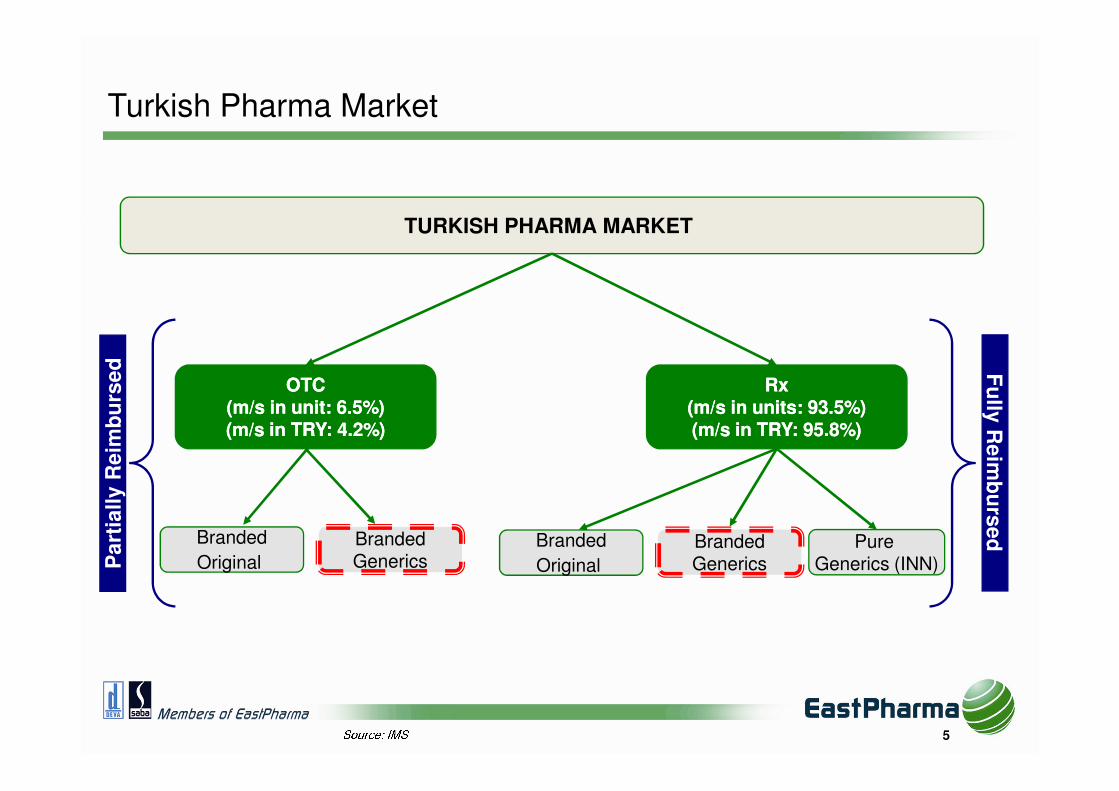
Turkish Pharma Market
OTCOTC
TURKISH PHARMA MARKET
RxRx
Pa
rtia
lly R
eim
bu
rse
d Fu
lly R
eim
bu
rse
d
5
(m/s in unit: 6.5%)(m/s in unit: 6.5%)(m/s in TRY: 4.2%)(m/s in TRY: 4.2%)
Branded
Original
(m/s in units: 93.5%)(m/s in units: 93.5%)(m/s in TRY: 95.8%)(m/s in TRY: 95.8%)
BrandedGenerics
BrandedGenericsP
art
iall
y R
eim
bu
rse
d Fu
lly R
eim
bu
rse
dPure Generics (INN)
Branded
Original
Source: IMS
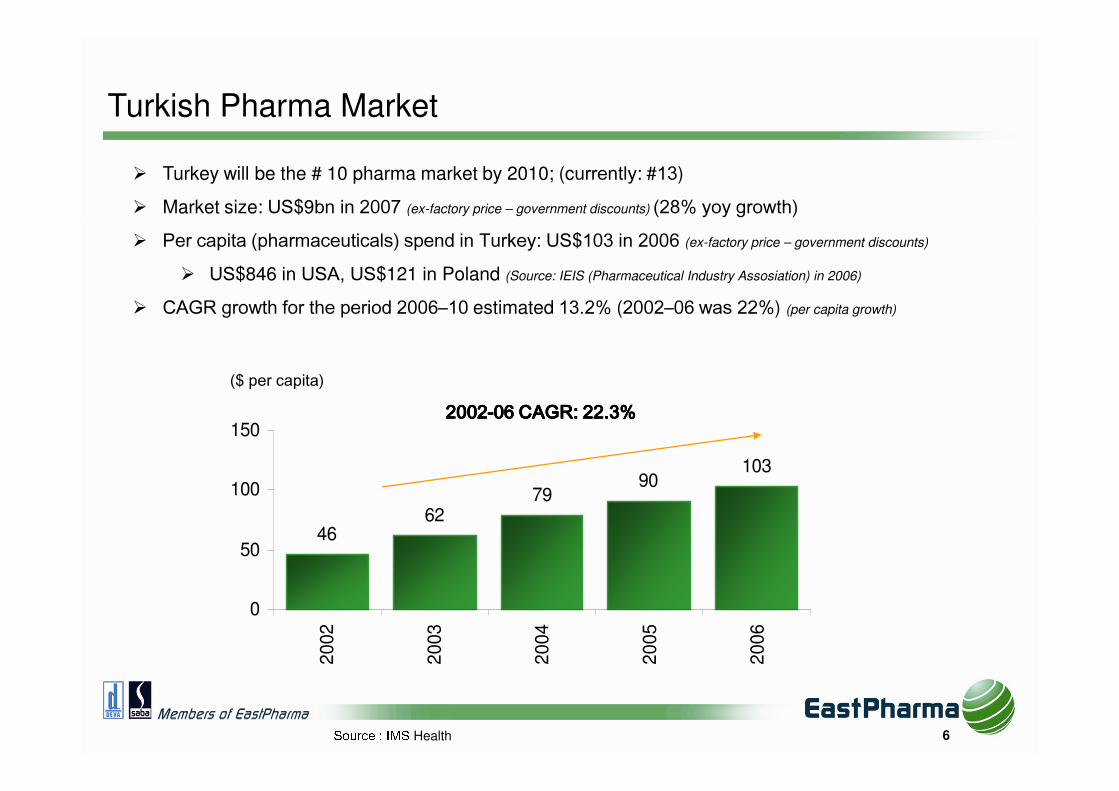
� Turkey will be the # 10 pharma market by 2010; (currently: #13)
� Market size: US$9bn in 2007 (ex-factory price – government discounts) (28% yoy growth)� Per capita (pharmaceuticals) spend in Turkey: US$103 in 2006 (ex-factory price – government discounts)
� US$846 in USA, US$121 in Poland (Source: IEIS (Pharmaceutical Industry Assosiation) in 2006)
� CAGR growth for the period 2006–10 estimated 13.2% (2002–06 was 22%) (per capita growth)
($ per capita)
Turkish Pharma Market
6Source : IMS Health
4662
7990
103
0
50
100
150
2002
2003
2004
2005
2006
2002200220022002----06 CAGR: 22.3%06 CAGR: 22.3%06 CAGR: 22.3%06 CAGR: 22.3%

EastPharmaEastPharmaEastPharmaEastPharma isisisis thethethethe 5thththth largestlargestlargestlargest playerplayerplayerplayer inininin TurkishTurkishTurkishTurkish PharmaceuticalPharmaceuticalPharmaceuticalPharmaceutical MarketMarketMarketMarket based on units
Turkish Pharma Market
ULAGAY5.3%
EASTPHARMA5.1%
SANOFI - AVENTIS4.3%
NOVARTIS 4.2% ECZACIBASI
- ZENVITA 4.1%
GLAXOSMITHKLINE 3.4%
YOY Growth in Units:
� Market: 8.3%
� EastPharma: 16.4%
7
Source: IMS Health (12M’ 07)ABDI IBRAHIM 9.2%
BAYER7.6%
BILIM6.9%
OTHERS 49.9%
YOY Growth in US$:
� Market: 28.1%
� EastPharma: 36.6%

January – June 2007
� Sales incentive system: based on volume sales
� Implementation started in January
� Acquisitions:
� Saba Pharmaceutical
� New Rep Offices:
� Georgia
Recent Developments in EastPharma
June – December 2007
� Term sheet signed
� Introduction of new sales structure
� New sales incentive system: based on
profitability
� Restructuring started in September
� Sales slow down in 3Q due to sales &
8
� Construction of Cerkezkoy and Kosekoy started
� Headquarter in Levent sold
marketing restructuring
� Implementation started in December
� New Rep Offices:
� Russia,
� Continuous Reorganization:
� Resignation of COO
� Successful transition to new headquarter
� Listed on LSE (GDR)

STRATEGY

Operational TurnaroundOperational TurnaroundOperational TurnaroundOperational Turnaround�Increase market share & profitablity
– EastPharma market share in units: 5.1% in 12M’ 07; (4.7% in 12M’ 06)– Expansion / restructuring of the sales force with a new sales incentive system– Expansion of manufacturing capacity– Introduction of New Products with higher margins
� Targeting growth in new cardiovascular and other higher margin products
EastPharma Strategy: Long Term Value Creation
10
� Targeting growth in new cardiovascular and other higher margin products � Increasing Portfolio diversification
Financial TurnaroundFinancial TurnaroundFinancial TurnaroundFinancial Turnaround� Restructuring led by new management
– Disposal of noncore assets for proceeds of ~US$100mn – Customer and product-driven agressive strategy– Cost savings initiatives
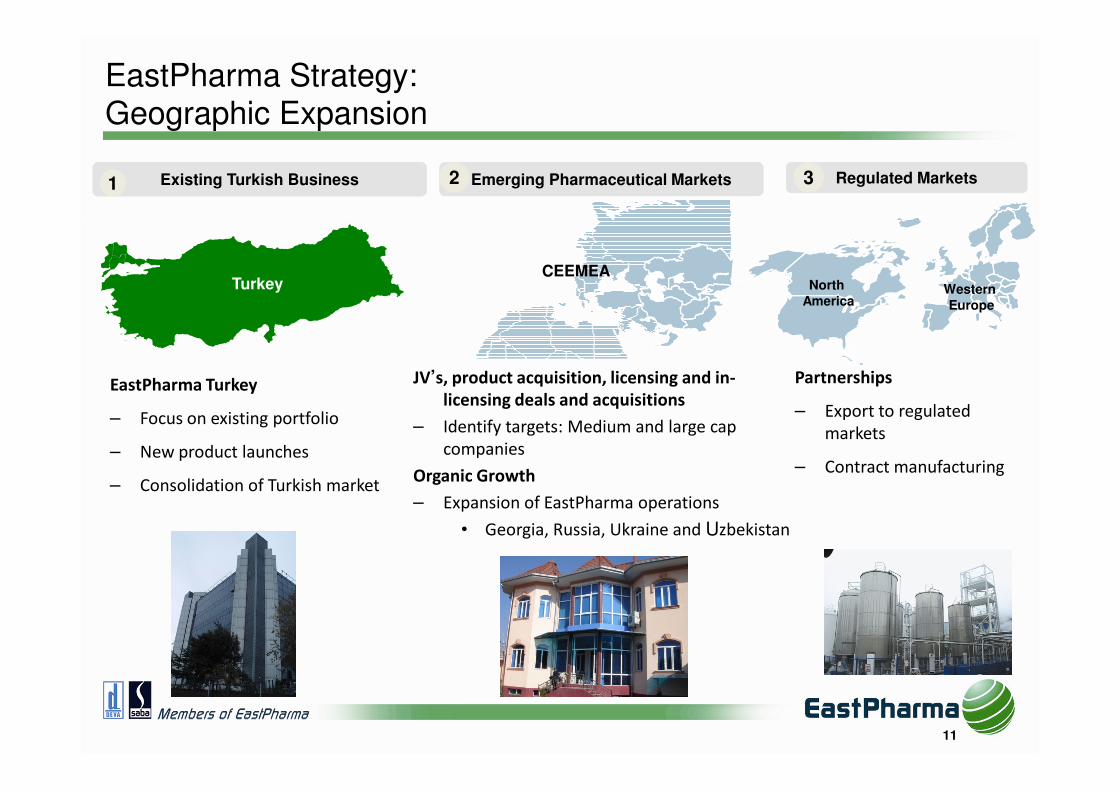
EastPharma Turkey
Turkey
JV’s, product acquisition, licensing and in-
licensing deals and acquisitions
CEEMEA
Existing Turkish Business Emerging Pharmaceutical Markets1 2
EastPharma Strategy: Geographic Expansion
Regulated Markets
Partnerships
3
North
AmericaWestern
Europe
11
– Focus on existing portfolio
– New product launches
– Consolidation of Turkish market
licensing deals and acquisitions
– Identify targets: Medium and large cap
companies
Organic Growth
– Expansion of EastPharma operations
• Georgia, Russia, Ukraine and Uzbekistan
– Export to regulated
markets
– Contract manufacturing

Strong Marketing Capabilities
12
Former Organisation:Former Organisation:Former Organisation:Former Organisation:� Strong sales and marketing organisation
� 15 regions in Turkey with 23 offices� 864 representatives
� 6 groups of medical representatives� 1 group of pharmacy representatives
� 89 regional chief and managers As of January 2008. Excludes sales force presence in Georgia and Azerbaijan.New Organisation:New Organisation:New Organisation:New Organisation:� Efficiency and profit orriented sales and marketing force
� 15 regions in Turkey with 23 offices � 773 representatives
� 8 groups of medical representatives � 86 regional managers

Acquisitions: SABA PHARMACEUTICALS
Synergies CreatedSynergies CreatedSynergies CreatedSynergies Created1. Broadened Sales Team
� Sales Force increased from 60 to 140 people� Increased # of Regional Managers from 11 to 18� Increased # of doctors visited from 7,300 to 21,000� Increased # of pharmacists visited from 2,200 to 7,400
2. Increased Product Portfolio
13
2. Increased Product Portfolio
� Actively promoted products increased from 2 to 5 products � Application undertaken for Dentamax, an antibiotic registered by Deva, to allow SABA sales
representatives to sell the product , started selling in January 20083. Optimized Operational Processes
� Introduced new sales incentive system � Moving production of Saba’s products to EastPharma’s facilities, decreased costs

Acquisitions: SABA PHARMACEUTICALS
Attractive Valuation
� Purchased for US$ 14 mn
� 2006 Sales (unaudited): US$ 8 mn
� 2007 Sales (unaudited): US$ 15 mn
1x 07E Sales1x 07E Sales1x 07E Sales1x 07E Sales1x 07E Sales1x 07E Sales1x 07E Sales1x 07E Sales
14
Financial Turnaround
� Sales improved 73% from 2006 in US$ terms
� Net profit improved 419% from 2006 in US$ terms v loss in 2005
1x 07E Sales1x 07E Sales1x 07E Sales1x 07E Sales1x 07E Sales1x 07E Sales1x 07E Sales1x 07E Sales

Regional Growth
Georgia Deva Rep. Office:
Address: Shio Mgvimeli № 1 B Vera, TBİLİSİ, GEORGIA PK. 0179
4 rep4 rep4 rep4 rep4 rep4 rep4 rep4 rep........ offices in the former Soviet Union: offices in the former Soviet Union: offices in the former Soviet Union: offices in the former Soviet Union: offices in the former Soviet Union: offices in the former Soviet Union: offices in the former Soviet Union: offices in the former Soviet Union: Georgia, Moscow (Russia), Azerbaijan and UzbekistanGeorgia, Moscow (Russia), Azerbaijan and UzbekistanGeorgia, Moscow (Russia), Azerbaijan and UzbekistanGeorgia, Moscow (Russia), Azerbaijan and UzbekistanGeorgia, Moscow (Russia), Azerbaijan and UzbekistanGeorgia, Moscow (Russia), Azerbaijan and UzbekistanGeorgia, Moscow (Russia), Azerbaijan and UzbekistanGeorgia, Moscow (Russia), Azerbaijan and Uzbekistan
15
Baku / Azerbaijan Office:
Address: Istiklaliye Sok No: 31 Baku / AZERBAIJAN
Uzbekistan Deva Office:
Address: Deva Rep. Office Yusuf Hachacip Sok. No. 37 Taskent / UZBEKISTAN
Moscow / Russia Deva Office:
Address: Russian Federation, 109316 Moscow, Ostapovsky Proezd 5, Stroyenie 1, Office 811

Enlargement of Product Portfolio
Total revenues of products and licenses to be acquired:
� Revenues of approx US$ 90mn in 2007
Successful completion of this transaction will provide;
� Purchase of 8 complemantary products plus licenses of 8 products, all rights and registrations for Turkey. One of these products includes export rights to Russia and all CIS countries
Term sheet signed for the purchaseTerm sheet signed for the purchaseTerm sheet signed for the purchaseTerm sheet signed for the purchaseTerm sheet signed for the purchaseTerm sheet signed for the purchaseTerm sheet signed for the purchaseTerm sheet signed for the purchase of of of of of of of of productsproductsproductsproductsproductsproductsproductsproducts and and and and and and and and licenslicenslicenslicenslicenslicenslicenslicenses from es from es from es from es from es from es from es from aaaaaaaa leading multinational, researchleading multinational, researchleading multinational, researchleading multinational, researchleading multinational, researchleading multinational, researchleading multinational, researchleading multinational, research--------based pharmaceutical based pharmaceutical based pharmaceutical based pharmaceutical based pharmaceutical based pharmaceutical based pharmaceutical based pharmaceutical compancompancompancompancompancompancompancompanyyyyyyyy
16
� Increase EastPharma’s exposure in key therapeutic areas
� Estimated additional EBITDA to EastPharma of approx. US$ 45mn
� Estimated additional sales expenses for these products: US$ 7-10mn
Closing is expected in April 2008
EastPharma expected to EastPharma expected to EastPharma expected to EastPharma expected to EastPharma expected to EastPharma expected to EastPharma expected to EastPharma expected to become:become:become:become:become:become:become:become:
Further details of this transaction are subject to a confidentiality agreement
�� 7th 7th 7th 7th 7th 7th 7th 7th largest player in revenue terms in Turkey v. 11th previouslylargest player in revenue terms in Turkey v. 11th previouslylargest player in revenue terms in Turkey v. 11th previouslylargest player in revenue terms in Turkey v. 11th previouslylargest player in revenue terms in Turkey v. 11th previouslylargest player in revenue terms in Turkey v. 11th previouslylargest player in revenue terms in Turkey v. 11th previouslylargest player in revenue terms in Turkey v. 11th previously�� 3th 3th 3th 3th 3th 3th 3th 3th largest player largest player largest player largest player largest player largest player largest player largest player in Turkey based on units in Turkey based on units in Turkey based on units in Turkey based on units in Turkey based on units in Turkey based on units in Turkey based on units in Turkey based on units v. v. v. v. v. v. v. v. 5th 5th 5th 5th 5th 5th 5th 5th previouslypreviouslypreviouslypreviouslypreviouslypreviouslypreviouslypreviously

Sales ForceSales ForceSales ForceSales ForceSales ForceSales ForceSales ForceSales Force
Competitive Advantage of EastPharma
Strong Brand NameStrong Brand NameStrong Brand NameStrong Brand NameStrong Brand NameStrong Brand NameStrong Brand NameStrong Brand Name
High MarketshareHigh MarketshareHigh MarketshareHigh MarketshareHigh MarketshareHigh MarketshareHigh MarketshareHigh Marketshare
17
High MarketshareHigh MarketshareHigh MarketshareHigh MarketshareHigh MarketshareHigh MarketshareHigh MarketshareHigh Marketshare
Large Distribution NetworkLarge Distribution NetworkLarge Distribution NetworkLarge Distribution NetworkLarge Distribution NetworkLarge Distribution NetworkLarge Distribution NetworkLarge Distribution Network
Production CapabilityProduction CapabilityProduction CapabilityProduction CapabilityProduction CapabilityProduction CapabilityProduction CapabilityProduction Capability

Current Therapeutic Breakdown in Units
Anti-infectives
39%
Respiratory
System
6%
Cardiovascular
System
4%
Central Nervous
System
4%
Others
10%
18
(1) Includes inter-segment sales Source: IMS (12M ’07)
Musculo
Skeletal
22%
Alimentary &
Metabolism
15%

Respiratory
9%
Anti-infectives
13%
Gastro
18% Central
Nervous
System
21%
Therapeutic Breakdown in Units in 2010
19
Cardio
18%
21%
Musculo-
Skeletal
21%
Company Estimates

EastPharma Market Share Growing
Market Share – UnitsMarket Share – Revenue
3.1% 3.1% 3.0% 3.2% 3.4% 3,7%
%1
%2
%3
%44.6% 4.9% 4.7% 5.1% 4.9%
3,5%
%2
%4
%6
20
Source: IMS Source: IMS
Rank 10 Rank 10 Rank 10 Rank 10 6 6 6 6 6 6 6 6 5 55 55 55 5Rank 11 12 Rank 11 12 Rank 11 12 Rank 11 12 12 12 12 12 11 10
Note: Market share data for Human pharmaceuticals segment
%0
%1
31/12/04 31/12/05 31/12/06 31/12/07 31/01/08 14/02/08
%0
31/12/04 31/12/05 31/12/06 31/12/07 31/01/08 14/02/08

EastPharma Leading Products’ Market Shares in Turkish Market
20%
24%
15%
11%
19%
22%
15%
9%
22% 24%
18%
9% 9%
21%
15% 15%
8% 9% 10%
15%
20%
25%
30% M/S %
21
RankRankRankRank(1)(1)(1)(1) 1111 1111 1111 6 6
# of competitors# of competitors# of competitors# of competitors(1)(1)(1)(1) 9 8 11111 11111111 11113
Source: IMS
(1) As of 1M ‘08
8%
0%
5%
10%
Cefaks Amoklavin Deklarit Degastrol Devasid
2005 2006 2007 1M' 08 2005 2006 2007 1M' 08 2005 2006 2007 1M' 08 2005 2006 2007 1M' 08 2005 2006 2007 1M' 08
NA
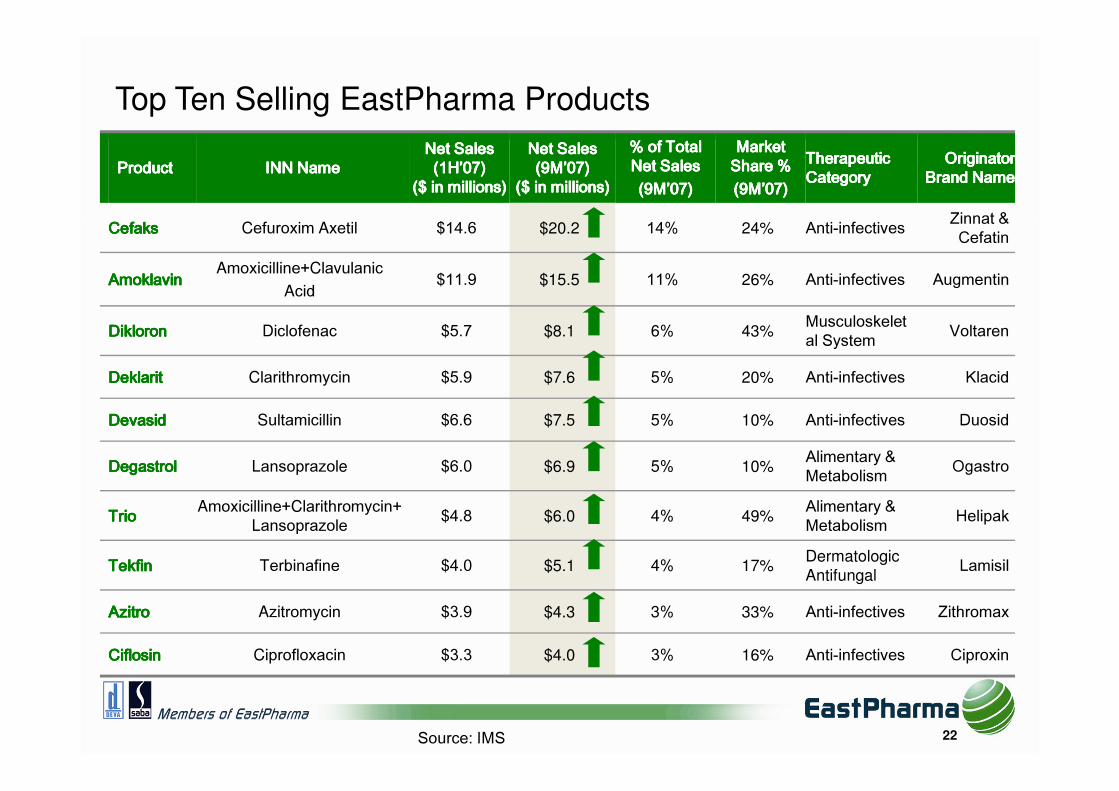
Top Ten Selling EastPharma Products
ProductProductProductProduct INN NameINN NameINN NameINN NameNet Sales Net Sales Net Sales Net Sales ((((1H’1H’1H’1H’00007777))))
($ in millions)($ in millions)($ in millions)($ in millions)Net Sales Net Sales Net Sales Net Sales ((((9M’9M’9M’9M’00007777))))
($ in millions)($ in millions)($ in millions)($ in millions)
% of Total % of Total % of Total % of Total Net SalesNet SalesNet SalesNet Sales((((9M’9M’9M’9M’00007777))))
MarketMarketMarketMarketShare %Share %Share %Share %((((9M’9M’9M’9M’00007777))))
Therapeutic Therapeutic Therapeutic Therapeutic CategoryCategoryCategoryCategory
Originator Originator Originator Originator Brand NameBrand NameBrand NameBrand Name
CefaksCefaksCefaksCefaks Cefuroxim Axetil $14.6 $20.2 14% 24% Anti-infectives Zinnat & Cefatin
AmoklavinAmoklavinAmoklavinAmoklavin Amoxicilline+Clavulanic Acid $11.9 $15.5 11% 26% Anti-infectives Augmentin
DikloronDikloronDikloronDikloron Diclofenac $5.7 $8.1 6% 43%Musculoskeletal System Voltaren
DeklaritDeklaritDeklaritDeklarit Clarithromycin $5.9 $7.6 5% 20% Anti-infectives Klacid
22
DevasidDevasidDevasidDevasid Sultamicillin $6.6 $7.5 5% 10% Anti-infectives Duosid
DegastrolDegastrolDegastrolDegastrol Lansoprazole $6.0 $6.9 5% 10%Alimentary & Metabolism Ogastro
TrioTrioTrioTrio Amoxicilline+Clarithromycin+Lansoprazole $4.8 $6.0 4% 49%
Alimentary & Metabolism Helipak
TekfinTekfinTekfinTekfin Terbinafine $4.0 $5.1 4% 17%Dermatologic Antifungal
Lamisil
AzitroAzitroAzitroAzitro Azitromycin $3.9 $4.3 3% 33% Anti-infectives Zithromax
CiflosinCiflosinCiflosinCiflosin Ciprofloxacin $3.3 $4.0 3% 16% Anti-infectives Ciproxin
Source: IMS

EastPharma Product Launches – Introduced in 2007
2007 INTRODUCED2007 INTRODUCED2007 INTRODUCED2007 INTRODUCEDNEW PRODUCTSNEW PRODUCTSNEW PRODUCTSNEW PRODUCTS MOLECULEMOLECULEMOLECULEMOLECULE THERAPHEUTIC THERAPHEUTIC THERAPHEUTIC THERAPHEUTIC CATEGORYCATEGORYCATEGORYCATEGORY ORIGINATOR ORIGINATOR ORIGINATOR ORIGINATOR BRAND NAMEBRAND NAMEBRAND NAMEBRAND NAME MoleculeMoleculeMoleculeMoleculeMarket SizeMarket SizeMarket SizeMarket Size2007 2007 2007 2007 (US$ mn)(US$ mn)(US$ mn)(US$ mn) THERAPHEUTIC THERAPHEUTIC THERAPHEUTIC THERAPHEUTIC CLASS CLASS CLASS CLASS Therapheutic Therapheutic Therapheutic Therapheutic ClassClassClassClassMarket SizeMarket SizeMarket SizeMarket Size2007 2007 2007 2007 (US$ mn)(US$ mn)(US$ mn)(US$ mn)COLASTINCOLASTINCOLASTINCOLASTIN----LLLL ATORVASTATIN CARDIOVASCULAR SYSTEM LIPITOR-PFIZER 161STATINS (HMG-COA RED) 212PANDEV PANDEV PANDEV PANDEV PANTOPRAZOLE ALIMENTARY T.&METABOLISM PANTPAS-BAYER 61
ACID PUMPINHIBITORS 307LUXAT LUXAT LUXAT LUXAT MONTELUKAST RESPIRATORY SYSTEM SINGULAIR-MSD 76RESPIRATORY SYSTEM 77LOSAPRES PLUSLOSAPRES PLUSLOSAPRES PLUSLOSAPRES PLUS LOSARTAN + HCl CARDIOVASCULAR SYSTEM HYZAAR-MSD 49ANGIOTENS-II ANTAG. COMB 219NIMELIDNIMELIDNIMELIDNIMELID NIMESULIDE MUSCULO- SKELETAL SYSTEM MESULID-PFIZER 11
ANTIRHEUMATICS NON-S PLN 372TORADOL- NON-NARCOTIC
23
KETRODOLKETRODOLKETRODOLKETRODOL KETOROLAC NERVOUS SYSTEM TORADOL-ROCHE 2NON-NARCOTIC ANALGESICS 127CONIELCONIELCONIELCONIEL BENIDIPINE CARDIOVASCULAR SYSTEM CONIEL-KYOWA HAKKO 1
CALCIUM ANTAGONISTS PLAIN 102DOXAFIN DOXAFIN DOXAFIN DOXAFIN DESLORATADINE RESPIRATORYSYSTEM AERIUS-SCHERING PLOUGH 29ANTIHISTAMINES SYSTEMIC 86DEGRA DEGRA DEGRA DEGRA (SINGLE DOZE) SILDENAFIL G.U.SYSTEM & SEX HORMONES VIAGRA-PFIZER 0
ERECTILE DYSFUNCTION PRD 94MAGCAR MAGCAR MAGCAR MAGCAR MAGNESIUM CARBONATE + CALCIUM CARBONATE ALIMENTARY T.& METABOLISM RENNIE-ROCHE 7 PLAIN ANTACIDS 31TOTAL MARKETTOTAL MARKETTOTAL MARKETTOTAL MARKET 397397397397 1,6271,6271,6271,627
Source: IMS

EastPharma Product Launches – Introduced in 2007
Units TRY
LUXAT * 5,8% 5,4% LOSAPRES PLUS * 4,9% 4,7%
CONIEL ** 1,6% 2,0%
NIMELID * 5,8% 4,6% DEVASID * 8,5% 10,4%
PERFORMANCE REACHED IN 12 MONTHS
MARKETSHARE IN 1M' 08
24Source: IMS
PANDEV * 10,8% 10,1% COLASTIN-L * 2,1% 1,6%
DOXAFIN * 5,1% 3,8% MAGCAR * 9,5% 9,3%
PERFORMANCE REACHED IN 6 MONTHS
PERFORMANCE REACHED IN 1 MONTH
* Considered in molecule market** Considered in ATC4. (Coniel has no competitor in the market.)

EastPharma Product Launches – Pending2008 PRODUCTS2008 PRODUCTS2008 PRODUCTS2008 PRODUCTS MOLECULEMOLECULEMOLECULEMOLECULE THERAPHEUTIC THERAPHEUTIC THERAPHEUTIC THERAPHEUTIC CATEGORYCATEGORYCATEGORYCATEGORY ORIGINATORORIGINATORORIGINATORORIGINATORBRAND NAMEBRAND NAMEBRAND NAMEBRAND NAME MoleculeMoleculeMoleculeMoleculeMarket SizeMarket SizeMarket SizeMarket Size2007200720072007(US$ mn)(US$ mn)(US$ mn)(US$ mn) THERAPHEUTIC CLASS THERAPHEUTIC CLASS THERAPHEUTIC CLASS THERAPHEUTIC CLASS Therapheutic Therapheutic Therapheutic Therapheutic ClassClassClassClassMarket SizeMarket SizeMarket SizeMarket Size2007 (US2007 (US2007 (US2007 (US$ mn)$ mn)$ mn)$ mn)CEFAKS 250CEFAKS 250CEFAKS 250CEFAKS 250(new form)
CEFUROKSIMAKSETIL SYSTEMIC ANTI-INFECTIVES CEFATIN-ROCHEZINNAT-GSK 151 CEPHALOSPORINS ORAL 285CITREX CITREX CITREX CITREX (DROP) - (new form) CITALOPRAM NERVOUS SYSTEM CIPRAM-LUNDBECK 27 SSRI ANTIDEPRESSANTS 166GENTAMISINGENTAMISINGENTAMISINGENTAMISIN(new form) GENTAMICIN SYSTEMIC ANTI-INFECTIVES GARAMICIN-SCHERING PLOUGH 4 AMINOGLYCOSIDES 7NEOTAB AMPNEOTAB AMPNEOTAB AMPNEOTAB AMP(new form)
FAMOTIDINE-AMP LYOPH 20 MG 2 5 ML ALIMENTARY T.& METABOLISM FAMODIN- SANDOZ 14 H2 ANTAGONISTS 23NERVOUS RISPERDAL- 61 ATIPICAL 204
*
*
*
25
RESTELARESTELARESTELARESTELA RISPERIDONE NERVOUS SYSTEM RISPERDAL-JOHNSON&JOHNSON 61 ATIPICAL ANTIPSYCHOTICS 204MOTISMOTISMOTISMOTIS DOMPERIDONE ALIMENTARY T.& METABOLISM MOTILIUM-JANSSEN CILAG 4 GASTROPROKINETICS 29LEVOSIDLEVOSIDLEVOSIDLEVOSID LEVOFLOXACIN SYSTEMIC ANTI-INFECTIVES TAVANIC-AVENTIS 75 ORAL FLUOROQUINOLONES 179ALEMAXALEMAXALEMAXALEMAX ALENDRONIC ACID MUSCULO-SKELETAL SYSTEM FOSAMAX-MSD 30 BISPHOSPH OSTEOPOROSIS 49ZELEFTZELEFTZELEFTZELEFT SERTRALINE NERVOUS SYSTEM LUSTRAL-PFIZER 30 SSRI ANTIDEPRESSANTS 166CANDEXIL CANDEXIL CANDEXIL CANDEXIL CANDESARTAN CILEXETIL CARDIOVASCULAR SYSTEM ATACAND PLUS-ASTRAZENECA 56 ANGIOTENS-II ANTAGONIST 219MUKOSİSTMUKOSİSTMUKOSİSTMUKOSİST ACETYLSYSTEIN RESPIRATORY SYSTEM MUCOMYST - BMS 74 EXPECTORANS 93
TOTAL MARKETTOTAL MARKETTOTAL MARKETTOTAL MARKET 526526526526 1,4201,4201,4201,420Company Data
*
* licenced

Investing to Accomodate the Growth
� New Headquarters� Successfully moved as of October 1st, 2007
New factories
3x Larger Headquarters3x Larger Headquarters3x Larger Headquarters3x Larger Headquarters3x Larger Headquarters3x Larger Headquarters3x Larger Headquarters3x Larger Headquarters
3x Larger Production Capacity3x Larger Production Capacity3x Larger Production Capacity3x Larger Production Capacity3x Larger Production Capacity3x Larger Production Capacity3x Larger Production Capacity3x Larger Production Capacity
26
� New factories� Cerkezkoy: 4 Buildings
- Beta-lactam- Cephalosporin
- Oncology
- General Production
� Kosekoy: 1 Building- Injectables

Çerkezköy Plant Levent Plant
Manufacturing Capabilities
27
[ADD
PICTURE]
Topkapı PlantKöseköy Plants
� Current capacity: 100mn units
� New production capacity: 350mn units
� FDA and EMEA approvals

FINANCIAL FINANCIAL FINANCIAL FINANCIAL FINANCIAL FINANCIAL FINANCIAL FINANCIAL PERFORMANCE OVERVIEW PERFORMANCE OVERVIEW –– 9M9M’’’’’’’’ 0707070707070707FINANCIAL FINANCIAL FINANCIAL FINANCIAL FINANCIAL FINANCIAL FINANCIAL FINANCIAL PERFORMANCE OVERVIEW PERFORMANCE OVERVIEW –– 9M9M’’’’’’’’ 0707070707070707
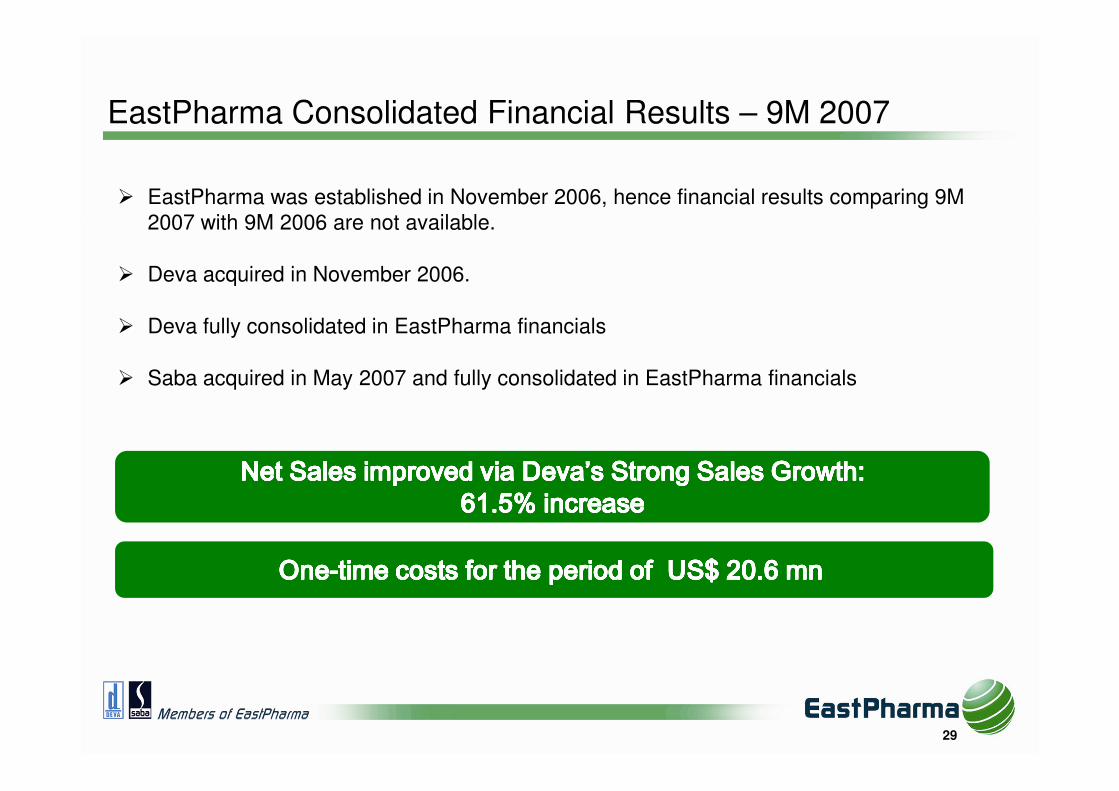
� EastPharma was established in November 2006, hence financial results comparing 9M 2007 with 9M 2006 are not available.
� Deva acquired in November 2006.
� Deva fully consolidated in EastPharma financials
� Saba acquired in May 2007 and fully consolidated in EastPharma financials
EastPharma Consolidated Financial Results – 9M 2007
Net Sales improved via DevaNet Sales improved via DevaNet Sales improved via DevaNet Sales improved via DevaNet Sales improved via DevaNet Sales improved via DevaNet Sales improved via DevaNet Sales improved via Deva’s Strong ’s Strong ’s Strong ’s Strong ’s Strong ’s Strong ’s Strong ’s Strong Sales Sales Sales Sales Sales Sales Sales Sales GrowthGrowthGrowthGrowthGrowthGrowthGrowthGrowth::::::::61.5% increase61.5% increase61.5% increase61.5% increase61.5% increase61.5% increase61.5% increase61.5% increase
OneOneOneOneOneOneOneOne--------time costs for the period time costs for the period time costs for the period time costs for the period time costs for the period time costs for the period time costs for the period time costs for the period of of of of of of of of US$ 20.6 mn US$ 20.6 mn US$ 20.6 mn US$ 20.6 mn US$ 20.6 mn US$ 20.6 mn US$ 20.6 mn US$ 20.6 mn
29

Summary Consolidated Financials – EastPharma (IFRS figures)
Net Sales� 61.5% increase at Deva
� Positive impact of new product launches
� New incentive system
� Contributions:
- Human Pharma Revenue: 88%
- API: 4%
- Veterinary Products: 5%
- Consumer Goods: 3%
$142.1
$172.7
$128.6
$59.6
$118.5
$165.0
$100.6
$161.5
2004 2005 2006 3M'07 6M'07 9M'07 9M'06 9M'07
EP consolidated Deva *Deva *
61.5%
30
- Consumer Goods: 3% 2004 2005 2006 3M'07 6M'07 9M'07 9M'06 9M'07
$66.4
$85.3
$48.6
$26.1
$55.5
$75.9
$43.8
$78.4
2004 2005 2006 3M'07 6M'07 9M'07 9M'06 9M'07
EP consolidatedGross Profit
� 78% increase at Deva
� Relatively limited increase in COGS
� Targeting better margins with new products
* CMB results (Capital Market Board)
Deva * Deva *
78%

Contribution of New Launches in Value Terms
Cardiovascular segment Cardiovascular segment Cardiovascular segment Cardiovascular segment Cardiovascular segment Cardiovascular segment Cardiovascular segment Cardiovascular segment as % of sales increased as % of sales increased as % of sales increased as % of sales increased as % of sales increased as % of sales increased as % of sales increased as % of sales increased from 3.9% in 1Q to 7.0% in 3Q’07from 3.9% in 1Q to 7.0% in 3Q’07from 3.9% in 1Q to 7.0% in 3Q’07from 3.9% in 1Q to 7.0% in 3Q’07from 3.9% in 1Q to 7.0% in 3Q’07from 3.9% in 1Q to 7.0% in 3Q’07from 3.9% in 1Q to 7.0% in 3Q’07from 3.9% in 1Q to 7.0% in 3Q’07
� Colastin (Atorvastatin) included in reimbursement list in June ’07
� Coniel (Benidipine) included in reimbursement list in July ’07
31
Gastro segment Gastro segment Gastro segment Gastro segment Gastro segment Gastro segment Gastro segment Gastro segment as % of sales increased as % of sales increased as % of sales increased as % of sales increased as % of sales increased as % of sales increased as % of sales increased as % of sales increased from 15% in 1Q to 16.8% in 3Qfrom 15% in 1Q to 16.8% in 3Qfrom 15% in 1Q to 16.8% in 3Qfrom 15% in 1Q to 16.8% in 3Qfrom 15% in 1Q to 16.8% in 3Qfrom 15% in 1Q to 16.8% in 3Qfrom 15% in 1Q to 16.8% in 3Qfrom 15% in 1Q to 16.8% in 3Q ’07’07’07’07’07’07’07’07
� Pandev (Pantoprazole) included in reimbursement list in June ‘07
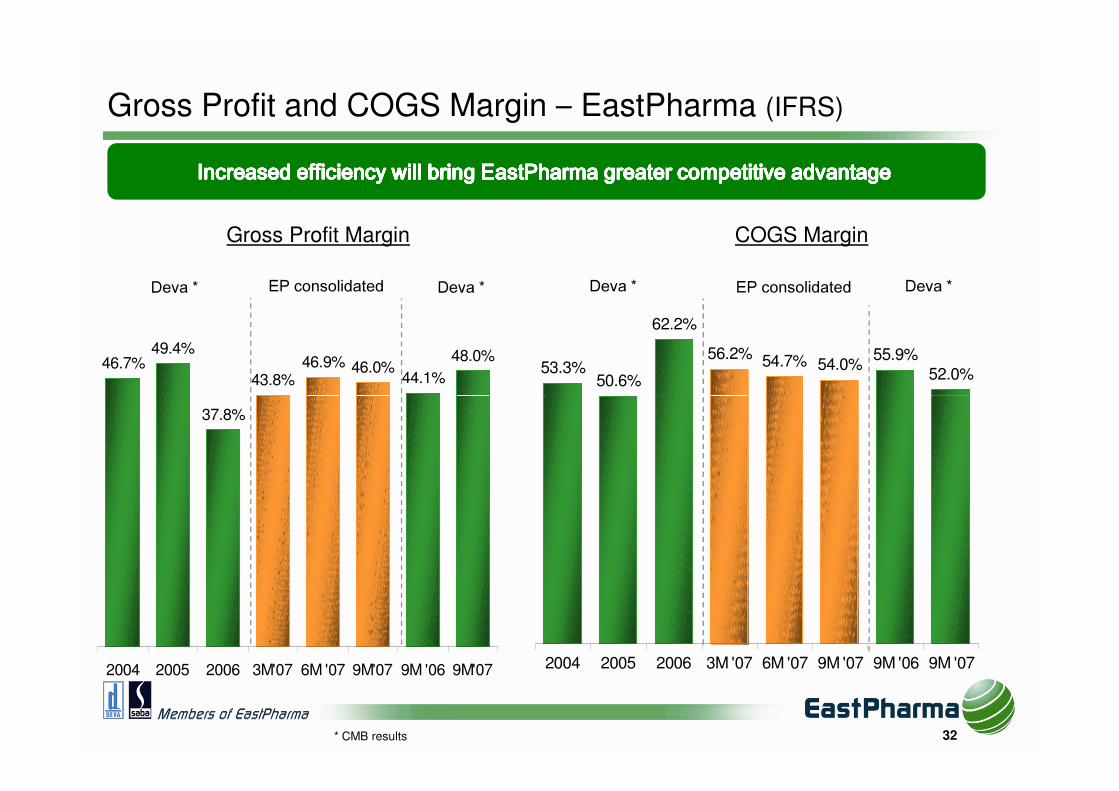
46.7%49.4%
43.8%46.9% 46.0%
44.1%
48.0%
Gross Profit and COGS Margin – EastPharma (IFRS)
Gross Profit Margin COGS Margin
53.3%50.6%
62.2%
56.2% 54.7% 54.0%55.9%
52.0%
EP consolidated EP consolidatedDeva * Deva *
Increased efficiency will bring EastPharma greater competitive advantage Increased efficiency will bring EastPharma greater competitive advantage Increased efficiency will bring EastPharma greater competitive advantage Increased efficiency will bring EastPharma greater competitive advantage Increased efficiency will bring EastPharma greater competitive advantage Increased efficiency will bring EastPharma greater competitive advantage Increased efficiency will bring EastPharma greater competitive advantage Increased efficiency will bring EastPharma greater competitive advantage
Deva * Deva *
32
37.8%
2004 2005 2006 3M'07 6M '07 9M'07 9M '06 9M'07 2004 2005 2006 3M '07 6M '07 9M '07 9M '06 9M '07
* CMB results

Summary Consolidated Financials – EastPharma (IFRS - US$, mn)
EBITDA(1)
�Sales and Gross Margin improvements have a positive impact
$24.0
$31.1
($9.2)
$11.4
$21.7
$28.6
($1.4)
$30.5
EP consolidatedDeva * Deva *
33(1) Earnings Before Interest, Taxation, Depreciation & Amortisation (Note: excludes other gains and losses and gain on monetary position)
($9.2)
2004 2005 2006 3M'07 6M'07 9M'07 9M'06 9M'07
Operational turnaround strategy
Focus on increasing market share & profitability
– Expansion & restructuring of the sales force with a new sales incentive system
– Expansion of manufacturing capacity
– Introduction of new products with higher margins
– Increased portfolio diversification
* CMB results

Marketing ExpensesGeneral
Administration Expenses
24.0%
26.1%
31.7%
27.1%
Research & Development Expenses
2.2%17.8%
EP consolidated
Operating Margins – EastPharma (IFRS)
Deva * EP consolidatedDeva * EP consolidatedDeva *
34
20.6%21.4%
2004 2005 2006 3M'07 6M'07 9M'07
1.4%
1.2%
1.0%
1.1%1.2%
2004 2005 2006 3M'07 6M'07 9M'07
9.1%8.2% 8.2%
6.8%
8.9%
2004 2005 2006 3M'07 6M'07 9M'07
* CMB results

Saba: Financial Highlights (US$, mn)
� 73% increase in Net Sales: US$ 8mn
� Continuing gross margin improvement: 58% (51% in previous period)
Focus on niche marketFocus on niche marketFocus on niche marketFocus on niche marketFocus on niche marketFocus on niche marketFocus on niche marketFocus on niche marketssssssss to to to to to to to to be competitivebe competitivebe competitivebe competitivebe competitivebe competitivebe competitivebe competitive
35
� Increase in operating expenses in line with sales team growth
� Sales Force increased from 60 to 140 people
� Net profit US$ 0.47 mn

Normalized Consolidated Financials – EastPharma (IFRS)
EastPharma is inline with its operational targets EastPharma is inline with its operational targets EastPharma is inline with its operational targets EastPharma is inline with its operational targets EastPharma is inline with its operational targets EastPharma is inline with its operational targets EastPharma is inline with its operational targets EastPharma is inline with its operational targets
(US$, thousand)
Nine month
period ended 30
September 2007
Normalized
income statement
Revenue 164,967 164,967
Cost of sales (89,080) (88,483)
Gross profit 75,887 76,484
Operating expenses (61,486) (58,567)
Investment revenue 3,447 3,447
36
Source: Company Management
Investment revenue 3,447 3,447
Finance costs (19,446) (5,491)
Other gains and losses (2,267) 905
Profit / (Loss) before tax (3,864) 16,777
Current tax expense (3,448) (3,448)
Deferred tax expense (3,131) (6,955)
Income tax expense (6,580) (10,404)
Net loss for the period (10,444) 6,373
Attributable to:Equity holders of the parent (8,435) 5,147
Minority interest (2,009) 1,226
(10,444) 6,373
(US$, thousand)
Adjustment on hedging currency risk 13,955 - Additional provision on severance pay
for restructuring of personnel 1,995 -
Impairment of property, plant 3,172 - Payment for environmental liability 1,520 - Non-recurring costs in total 20,642
Non-recurring Costs for the period

Outlook
Gro
wth
Drive
rsG
rowt
h Dr
ivers
Gro
wth
Drive
rsG
rowt
h Dr
ivers �Georgia
�Russia & Ukraine
�Utilise additional production capacity and manufacturing expertise
�US�Europe
37
\
Gro
wth
Drive
rsG
rowt
h Dr
ivers
Gro
wth
Drive
rsG
rowt
h Dr
ivers
HHHH1 ‘071 ‘071 ‘071 ‘07 FY ‘07FY ‘07FY ‘07FY ‘07 HHHH1 ‘081 ‘081 ‘081 ‘08 FY ‘08FY ‘08FY ‘08FY ‘08
�Impact on 2007 year end financials
�Existing product range– Cost base
reduction– Restructuring of
marketing / sales force
2009 and 2009 and 2009 and 2009 and BeyondBeyondBeyondBeyond
Turkish Pharmaceutical Market GrowthTurkish Pharmaceutical Market GrowthTurkish Pharmaceutical Market GrowthTurkish Pharmaceutical Market Growth

IR Contact Details:
Idil Bora – IR Manager
Email : [email protected] / [email protected]
D. Phone : +90 212 6929326
Fax : +90 212 6970614
Address: Halkali Mah. Basin Ekspres Cad. 34303 No:1
Kucukcekmece - Istanbul
THANK YOU FOR YOUR INTEREST...THANK YOU FOR YOUR INTEREST...

APPENDIXAPPENDIXAPPENDIXAPPENDIXAPPENDIXAPPENDIXAPPENDIXAPPENDIXAPPENDIXAPPENDIXAPPENDIXAPPENDIXAPPENDIXAPPENDIXAPPENDIXAPPENDIX
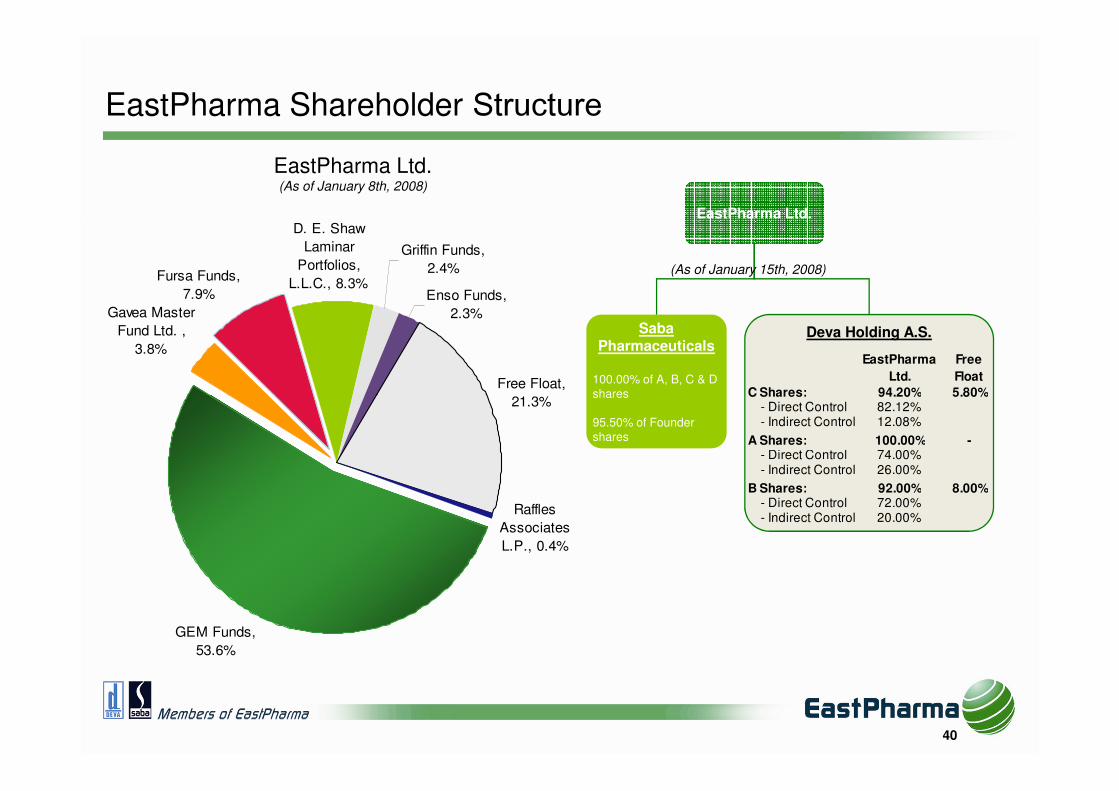
EastPharma Shareholder StructureEastPharma Ltd.(As of January 8th, 2008)
Saba Pharmaceuticals
100.00% of A, B, C & D shares
EastPharma Ltd.
Deva Holding A.S.
EastPharma
Ltd.
Free
Float
C Shares: 94.20% 5.80%
Gavea Master
Fund Ltd. ,
3.8%
Fursa Funds,
7.9%
D. E. Shaw
Laminar
Portfolios,
L.L.C., 8.3%
Griffin Funds,
2.4%
Enso Funds,
2.3%
Free Float,
21.3%
(As of January 15th, 2008)
40
shares
95.50% of Founder shares
C Shares: 94.20% 5.80%- Direct Control 82.12%- Indirect Control 12.08%
A Shares: 100.00% -- Direct Control 74.00%- Indirect Control 26.00%
B Shares: 92.00% 8.00%- Direct Control 72.00%- Indirect Control 20.00%
Raffles
Associates
L.P., 0.4%
21.3%
GEM Funds,
53.6%