UBS on Aftershocks v2
11
UBS on Aershocks Strategies for rebuilding wealth in an uncertain world
Transcript of UBS on Aftershocks v2

UBS onA ershocks
Strategies for rebuilding wealth in an uncertain world

UBS on Aft ershocks 2
Summary
The global Financial crisis and its a ft ershocks
fundamentally altered the investment landscape,
and investors will need to cope with the results
for years to come. We expect that investors
who are in the midst of repairing their personal
balance sheets and net worth positions will do so
against a backdrop of more moderate economic
growth and investment returns, heightened risk
aversion, and concern that other low-probability,
high-impact events will inevitably surface.
There is no simple solution to each of these
challenges. Instead, an approach that incorporates
a mix of both traditional and non-traditional
strategies is required to help rebuild balance
sheets and restore wealth. In this report, we focus
on increasing cash � ow, deploying cash balances
more actively, diversifying outside of traditional
assets, hedging against extreme events and
enhancing debt management.
Mike Ryan, CFAHead, WMR-AmericasJuly 2010
This report has been prepared by UBS Financial Services, Inc.
UBS on A ershocks 3
A ershocksStrategies for rebuilding wealth in an uncertain world
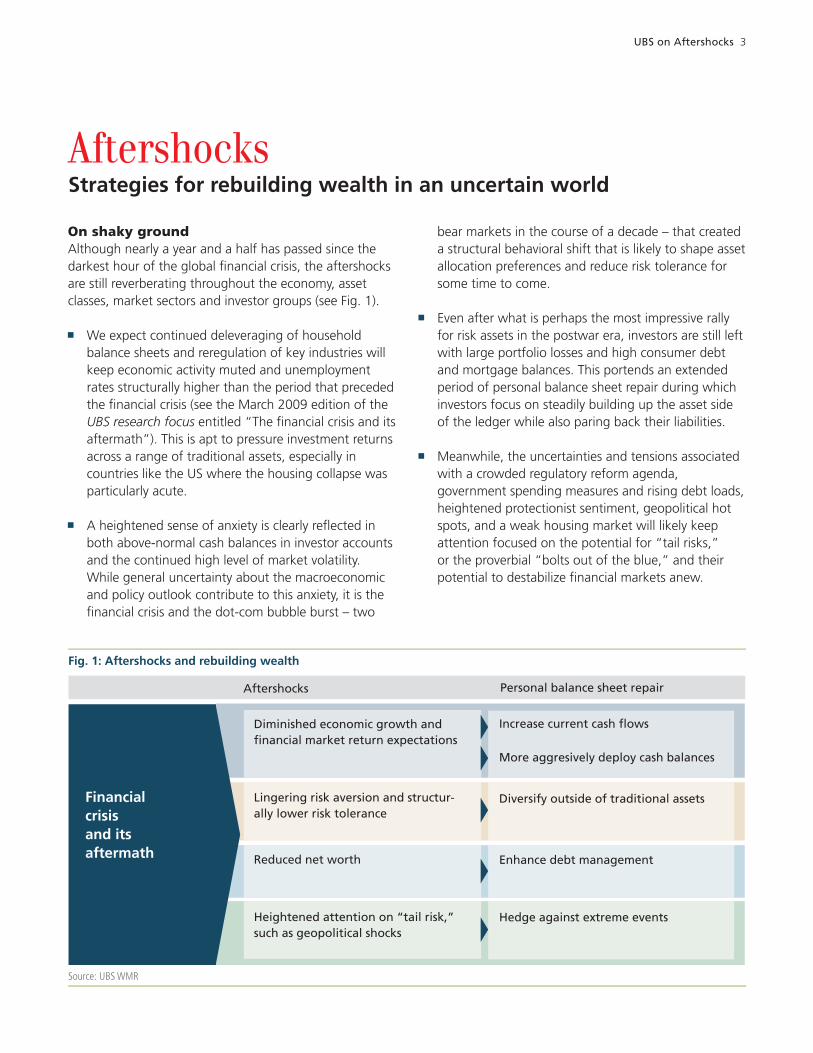
On shaky ground Although nearly a year and a half has passed since the darkest hour of the global fi nancial crisis, the a ershocks are still reverberating throughout the economy, asset classes, market sectors and investor groups (see Fig. 1).
We expect continued deleveraging of household balance sheets and reregulation of key industries will keep economic activity muted and unemployment rates structurally higher than the period that preceded the fi nancial crisis (see the March 2009 edition of the UBS research focus entitled “The fi nancial crisis and its a ermath”). This is apt to pressure investment returns across a range of traditional assets, especially in countries like the US where the housing collapse was particularly acute.
A heightened sense of anxiety is clearly refl ected in both above-normal cash balances in investor accounts and the continued high level of market volatility. While general uncertainty about the macroeconomic and policy outlook contribute to this anxiety, it is the fi nancial crisis and the dot-com bubble burst – two
bear markets in the course of a decade – that created a structural behavioral shi that is likely to shape asset allocation preferences and reduce risk tolerance for some time to come.
Even a er what is perhaps the most impressive rally for risk assets in the postwar era, investors are still le with large portfolio losses and high consumer debt and mortgage balances. This portends an extended period of personal balance sheet repair during which investors focus on steadily building up the asset side of the ledger while also paring back their liabilities.
Meanwhile, the uncertainties and tensions associated with a crowded regulatory reform agenda, government spending measures and rising debt loads, heightened protectionist sentiment, geopolitical hot spots, and a weak housing market will likely keep attention focused on the potential for “tail risks,” or the proverbial “bolts out of the blue,” and their potential to destabilize fi nancial markets anew.
Fig. 1: A ershocks and rebuilding wealth
Source: UBS WMR
Financial crisis and its a ermath
A ershocks Personal balance sheet repair
Diminished economic growth and fi nancial market return expectations
Lingering risk aversion and structur-ally lower risk tolerance
Reduced net worth
Heightened attention on “tail risk,” such as geopolitical shocks
Increase current cash fl ows
More aggresively deploy cash balances
Diversify outside of traditional assets
Enhance debt management
Hedge against extreme events
UBS on A ershocks 4
Investors are still le with large portfolio losses and high consumer debt and mortgage balances.
Personal balance sheet repairIndividuals are just now beginning the process of repairing personal balance sheets in the a ermath of the crisis – but they need to do so in a way that doesn’t require massive re-risking of portfolios, drastic increases in leverage or material depletions in liquidity. While traditional assets will continue to play a critical role in this process, it has become increasingly clear that investors will also need to consider a few less traditional approaches as well. In our view, this “rebuilding process” includes two essential elements that relate directly to the challenges we highlighted above: 1) repositioning of assets in a manner so that the success of the eff ort is not entirely reliant on market performance; and 2) incorporating the liability side of the balance sheet as a more eff ective way of rebuilding wealth.
There are, of course, any number of ways for individuals to engage in this balance sheet repair process. However, in this report we focus on fi ve critical action steps that need to be taken to eff ectively address the challenges related to both asset and liability realignment in the current less certain environment:
1) Increase current cash fl ows2) Deploy cash balances more aggressively3) Diversify outside of traditional assets4) Hedge against extreme events5) Employ enhanced debt management
Consider how each of these steps can enhance the process of reducing downside risk exposure, increasing cash fl ows, lowering funding costs and rebuilding wealth.
1) Increase current cash fl owsWith policymakers unlikely to li the target federal funds rate anytime soon, both money market and bond yields are likely to remain low for an extended period. At the same time, sluggish growth prospects suggest that the capital gains opportunities within the equity markets will also remain limited over the near term. Given more limited return prospects across the traditional mix of fi nancial assets, investors need to consider strategies aimed at shi ing the return profi le of portfolios by exploiting income-generating strategies. These would include focusing upon dividend growth stocks, options-based strategies, Master Limited Partnerships (MLPs), more novel fi xed-income alternatives (such as “step-up” bonds) and annuities. Consider the advantages of each of these income-enhancing strategies:
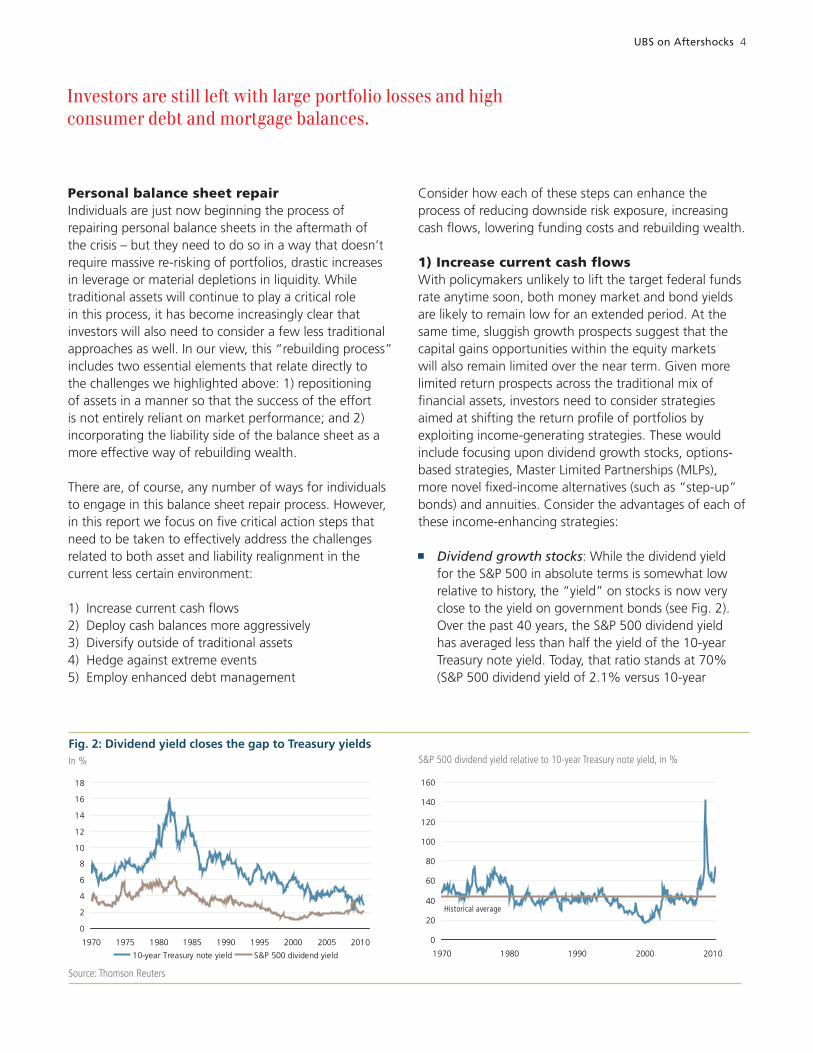
Dividend growth stocks: While the dividend yield for the S&P 500 in absolute terms is somewhat low relative to history, the “yield” on stocks is now very close to the yield on government bonds (see Fig. 2). Over the past 40 years, the S&P 500 dividend yield has averaged less than half the yield of the 10-year Treasury note yield. Today, that ratio stands at 70% (S&P 500 dividend yield of 2.1% versus 10-year
Fig. 2: Dividend yield closes the gap to Treasury yieldsIn %
Source: Thomson Reuters
0
2
4
6
8
10
12
14
16
18
1970 1975 1980 1985 1990 1995 2000 2005 2010
10-year Treasury note yield S&P 500 dividend yield
0
20
40
60
80
100
120
140
160
1970 1980 1990 2000 2010
Historical average
S&P 500 dividend yield relative to 10-year Treasury note yield, in %
UBS on A ershocks 5
Treasury note yield of 2.9%) or nearly two standard deviations above its historical average. Stocks on our WMR Dividend Ruler Stock List (stocks which have historically have increased dividend payments to shareholders “as straight as a ruler”), appear particularly well positioned in the current market environment for three reasons. First, the average yield of 3.6% is even more attractive than alternatives. Second, the majority of the stocks on the list are in the less cyclical economic sectors (e.g. Consumer Staples, Utilities, Healthcare and Telecom). And third, the strong historical and prospective dividend growth for these stocks provides investors with an added layer of yield enhancement over time.
Covered call writing: Covered call writing is one of the most basic and frequently used of all options strategies. With a buy-write strategy, the investor simultaneously buys the underlying shares and writes a call option with a strike price that is typically higher than the current stock price – in options terminology, “out-of-the money.” The call writer receives cash today for selling the calls in exchange for the obligation to deliver the shares at the strike or exercise price in the future. The stock owner also remains entitled to any dividend payments from the underlying shares as long as the shares are held. Those investors who currently own stocks – but believe the market has limited short-term upside potential – may want
to consider this strategy. In a volatile market when options premiums are high, such as the current environment, the strategy can be thought of as a yield enhancement vehicle to supplement dividend income.
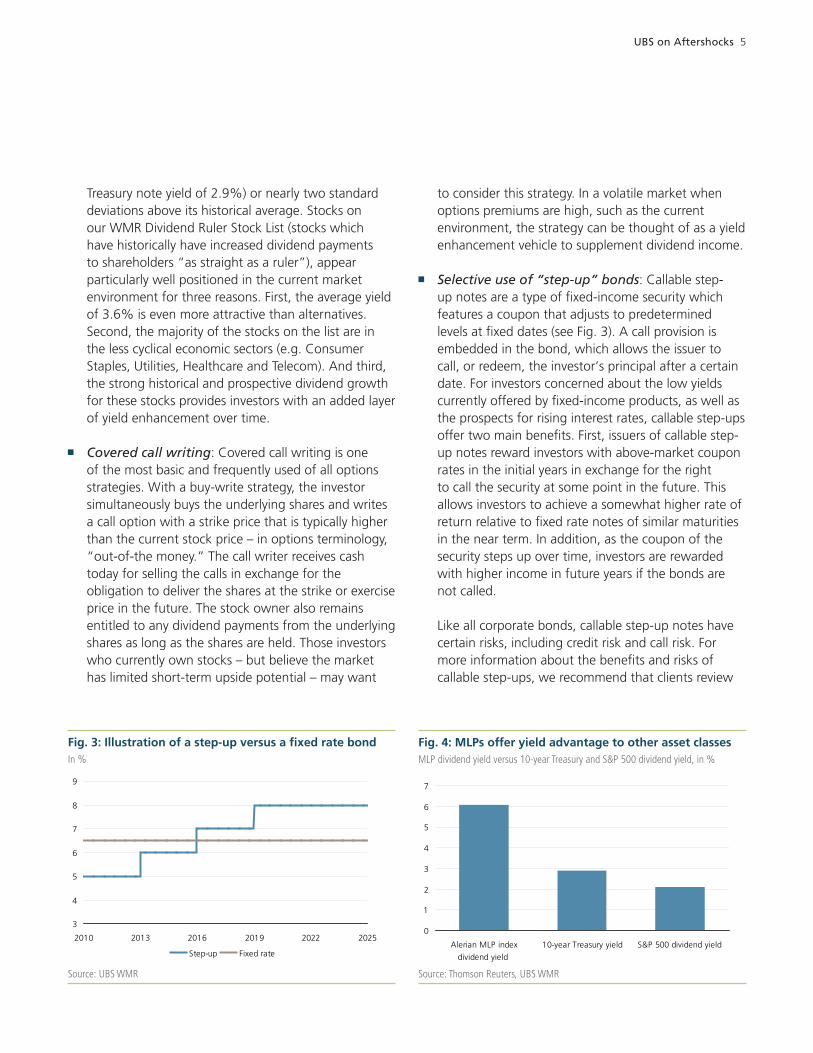
Selective use of “step-up” bonds: Callable step-up notes are a type of fi xed-income security which features a coupon that adjusts to predetermined levels at fi xed dates (see Fig. 3). A call provision is embedded in the bond, which allows the issuer to call, or redeem, the investor’s principal a er a certain date. For investors concerned about the low yields currently off ered by fi xed-income products, as well as the prospects for rising interest rates, callable step-ups off er two main benefi ts. First, issuers of callable step-up notes reward investors with above-market coupon rates in the initial years in exchange for the right to call the security at some point in the future. This allows investors to achieve a somewhat higher rate of return relative to fi xed rate notes of similar maturities in the near term. In addition, as the coupon of the security steps up over time, investors are rewarded with higher income in future years if the bonds are not called.
Like all corporate bonds, callable step-up notes have certain risks, including credit risk and call risk. For more information about the benefi ts and risks of callable step-ups, we recommend that clients review
Fig. 3: Illustration of a step-up versus a fi xed rate bondIn %
Source: UBS WMR
Fig. 4: MLPs off er yield advantage to other asset classesMLP dividend yield versus 10-year Treasury and S&P 500 dividend yield, in %
Source: Thomson Reuters, UBS WMR
3
4
5
6
7
8
9
2010 2013 2016 2019 2022 2025
Step-up Fixed rate
0
1
2
3
4
5
6
7
Alerian MLP index
dividend yield
10-year Treasury yield S&P 500 dividend yield
UBS on A ershocks 6
the recent Wealth Management Research report entitled “Understanding Callable Step-Up Notes,” from July 21, 2010.
Incorporating annuities. For investors with a longer
time horizon – or those looking to repair retirement assets – an allocation of a portion of savings into a deferred variable annuity with a living benefi t feature can help ensure future income. A variable annuity provides the ability to remain invested in the markets by choosing among available underlying investments while, under certain living benefi t features, the insurance company promises a minimum future income stream. If the value of the underlying investments rises, the amount of the future income stream may also rise. For those investors more concerned with current income, immediate annuities can off er a stream of income for as long as they and/or their spouses live. An allocation of a portion of savings to an immediate annuity (enough to cover basic expenses) with the balance in a well-diversifi ed portfolio of more traditional assets may provide an optional balance between protection and growth potential. (See the WMR report entitled “Retirement Investing and Spending,” from April 28, 2010.)
Master Limited Partnerships (MLPs): MLPs are limited partnerships that issue investment units which are listed on public exchanges. As a group, MLPs can
off er investors signifi cant income, capital appreciation potential and tax-deferral advantages. In addition, MLPs typically feature compelling cash distribution yields to investors, most commonly ranging between 6% and 8%. In order to enjoy the tax benefi ts of a limited partnership, MLPs may only engage in certain types of business; most are in energy-related fi elds. Midstream energy transportation, o en pipelines carrying natural resources such as oil and gas, are highly regulated industries that dominate the MLP space. Since MLPs typically engage in activities that generate signifi cant cash fl ow and are structured as partnerships, they generally pay a large portion of their returns in the form of quarterly distributions. Taxation of MLPs is unique – as a rule of thumb, more than 70% of distributions are tax-deferred until the sale of the partnership units, though all distributions are taxed as ordinary income regardless of when that income is realized. Investors who are willing to accept equity-like volatility should consider selective exposure to MLPs in order to enhance their portfolios with tax-advantaged income.
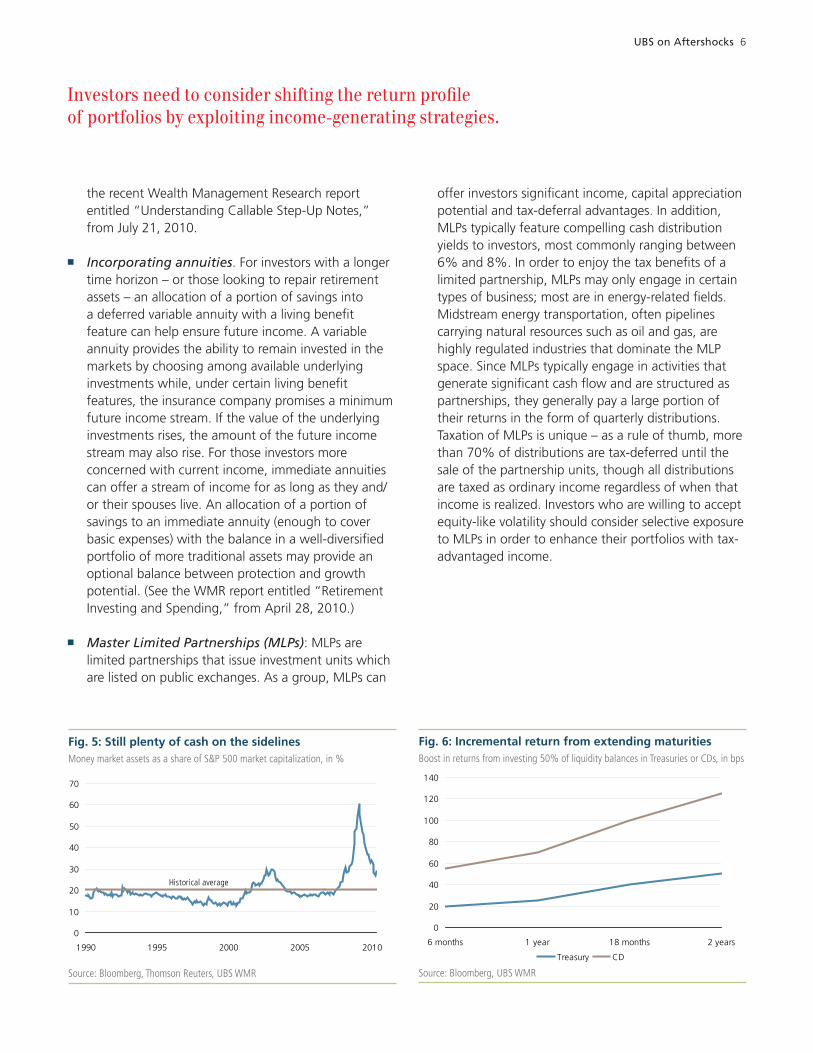
Fig. 5: Still plenty of cash on the sidelinesMoney market assets as a share of S&P 500 market capitalization, in %
Source: Bloomberg, Thomson Reuters, UBS WMR
0
10
20
30
40
50
60
70
1990 1995 2000 2005 2010
Historical average
Fig. 6: Incremental return from extending maturitiesBoost in returns from investing 50% of liquidity balances in Treasuries or CDs, in bps
Source: Bloomberg, UBS WMR
Investors need to consider shi ing the return profi le of portfolios by exploiting income-generating strategies.
0
20
40
60
80
100
120
140
6 months 1 year 18 months 2 years
Treasury CD

UBS on A ershocks 7
2) Deploy cash balances more activelyWhile the need for liquidity has become more apparent following the crisis, the response of investors may have been too extreme. As Fig. 5 illustrates, cash balances are currently running well above their long-term historical average. But this may actually understate total cash holdings, since this excludes short-term certifi cates of deposit. With the yield on cash instruments at historically low levels – which are likely to remain that way for the near term – the opportunity cost of maintaining large liquidity balances remains high. The use of high-quality short-term marketable debt and deposit instruments presents an opportunity to signifi cantly improve the returns on liquid assets without substantial changes in liquidity and safety.
Perhaps the most straightforward way to redeploy liquid-ity balances without materially altering the risk profi le of the portfolio would entail laddering some portion of the cash holdings into high-quality instruments over some predefi ned investment horizon. This strikes a balance between maintaining a high level of liquidity and safety, while allowing for higher returns. A simple approach entails dividing a portfolio into a portion composed of a liquidity pool and a portion in marketable, high-quality debt. Fig. 6 illustrates the potential impact on portfolio returns of retaining 50% of the liquidity pool in a money market fund and redeploying the balance into a laddered portfolio of Treasury debt instruments with maturities ranging from 6 months to 2 years. Although the absolute
yield levels are admittedly low, the “pick up” of approxi-mately 30 basis points on the portion invested in the ladder is still signifi cant. With money market funds yield-ing approximately 10 to 15 basis points, the incremental pick up is two to three times higher on the laddered portfolio of Treasury securities. If an investor were willing to sacrifi ce some marketability by purchasing insured certifi cates of deposit instead of Treasury instruments, the yield on the laddered portion of the portfolio increases by approximately 70 to 75 basis points.
A more complex approach would apportion cash balances among three baskets. Investors with well- defi ned liquidity needs or those who only require immediate liquidity and are willing to tolerate some degree of volatility in net asset value (NAV) may consider this approach. The fi rst basket (Level I) comprises cash or cash equivalents off ering immediate liquidity and a stable USD 1 per share NAV. The second basket (Level II) comprises “beyond cash” investments that off er high liquidity, minimal price (NAV) volatility and high credit quality. In exchange for the somewhat greater degree of risk, investments in this basket off er slightly higher yields. Finally, the third basket (Level III) consists of investments off ering liquidity, price (NAV) volatility and investment-grade credit quality. This basket contains investment strategies that cover a broad range of securities, and while off ering more competitive yields, typically introduce the greatest degree of price volatility and potential for price depreciation relative to other levels.
Fig. 7: High correlations across asset classes is not newCorrelation of S&P 500 total return index to hedge fund returns, 12 month rolling
Note: Calculated using Hedge Fund Research Fund of Funds Composite Index (HFRI).Source: Bloomberg, HFR, UBS WMR
-0.2
0.0
0.2
0.4
0.6
0.8
1.0
1997 1999 2001 2003 2005 2007 2009 2010
Fig. 8: Little correlation between commodities and equitiesCorrelation of the S&P 500 index with Reuters/Jeff eries CRB Index, 12-month rolling
Source: Bloomberg and UBS WMR
-1.0
-0.8
-0.6
-0.4
-0.2
0.0
0.2
0.4
0.6
0.8
1.0
1973 1978 1983 1988 1993 1998 2003 2008 2013

UBS on A ershocks 8
3) Diversify into alternative investmentsThe tendency for diff erent risk assets to move in tandem during the fi nancial crisis has served to undermine one of the core principles of modern portfolio theory – diversifi cation. But as Fig. 7 illustrates, this trend toward higher return correlations across diff erent market sectors and asset classes is nothing new. The ability of capital to move seamlessly across both geographic borders and asset class categories has been helping to drive a convergence in performance across markets. Investors are therefore le scrambling for new ways to position portfolios in order to mitigate this risk. While alternative investments (AI) also suff ered losses during the global fi nancial crisis, the tendency for hedge funds to perform better than the overall market suggests there are still diversifi cation benefi ts that can be gained from positioning within AI. What’s more, with individuals increasingly focused on absolute rather than relative returns, certain hedge fund strategies appear to be a better fi t in the post-crisis world.
Keep in mind, of course, that AI is not a homogeneous asset class – in fact there isn’t even agreement over exactly what constitutes an “alternative investment.” The performance characteristics therefore diff er markedly across the diff erent vehicles, as does the secondary market liquidity. While investments such as hedge funds and private equity may not be appropriate for all investors, their performance profi le and low historical correlations to more traditional asset classes make them appealing diversifi cation candidates. Consider the advantages of using diff erent AI strategies to supplement a more traditional asset mix:
Commodities: Most assets in the traditional portfolio are fi nancial assets, which are claims on real assets. Commodities on the other hand are real assets which are consumed in the production process and have tangible qualities. Financial assets are driven largely by long-run expectations of cash fl ows, whereas commodity prices are impacted more by short-term supply and demand imbalances. While the absolute volatility of commodities is high, commodities can benefi t the overall asset allocation process by being positively correlated with infl ation while being negatively correlated with the two largest
components of the traditional portfolio – stocks and bonds (see Fig. 8). Investors should keep in mind that commodity returns do not simply arise from changes in spot prices. Financial investments in commodities are usually accomplished through commodity futures contracts, which requires regularly selling contracts that are close to expiration and rolling positions into longer-dated contracts. When, as is o en the case, longer-dated contracts have a higher price than shorter-dated ones (contango situation), rolling these contracts is a negative source of returns (negative roll yield) that can reduce the performance arising from spot price changes.
Hedge funds: There are several key elements that distinguish hedge funds from mutual funds. Hedge funds are private investments that have increased fl exibility in going both long and short securities, allow for derivative strategies, can invest in nonpublic securities and enhance/reduce their fund returns with the use of leverage. On the downside, hedge funds tend to be less liquid and off er less transparency than mutual funds. Overall, however, including hedge funds in portfolios can off er broader diversifi cation, reduced volatility and return enhancements.
Private equity: The private equity world can essentially be boiled down to diff erent types of strategies: buyout funds and venture capital. Buyout funds typically target mature companies with prospects for solid cash fl ow generation and are highly leveraged with debt in order to complete the buyout and magnify their returns. Given the amount of fi nancial leverage needed in a buyout fund strategy, both returns on the upside and downside are magnifi ed. Venture capital on the other hand focuses on companies in their early stage of development and companies with strong product development prospects. Venture capital funds target a high return on investment as dealing with relatively new business concepts means many businesses will not come to fruition.
A mix of both traditional and non-traditional stratgies is required to help rebuild balance sheets and restore wealth.

UBS on A ershocks 9
4) Hedge against extreme eventsIn his groundbreaking book, The Black Swan, Nassim Taleb explored the extreme impact that seemingly rare and diffi cult-to-predict events can have on the world at large (see Fig. 9). The tendency for markets to experience extreme outcomes – and at a rate that is far in excess of what modern portfolio theory would have projected – poses one of the most signifi cant challenges for investors. This is especially true in the a ermath of the fi nancial crisis, given the heightened risk of geopolitical shocks, which, by defi nition, are rarely identifi able with any sort of foresight (see the June 2010 edition of the UBS research focus, entitled “Geopolitics: the blind side”). This combination – higher incidence of tail risk, material impact upon fi nancial assets and the inability to forecast events beforehand – suggests that more robust hedging strategies are critical. While more traditional approaches such as straight put options can help hedge portfolio holdings to some degree, structured solutions o en off er strategies that align more closely with the underlying risks of the assets within the portfolio – and therefore off er greater protection.
Structured solutions are designed to be alternatives to traditional investment classes and have developed means of dealing with “Black Swan” events. For example, a principal guarantee can be created to ensure return of an investor’s principal as long as it is held to maturity. Structured solutions can also reduce the overall volatility
within a portfolio as well as enhance total returns. Structured off erings can be linked to an array of diff erent assets including equity indexes, commodities, foreign currencies and interest rate indexes.
5) Employ enhanced debt managementAs Fig. 10 illustrates, debt burdens within the private sector surged during the period of 2000 to 2007. Stagnant personal income growth, a near complete collapse in lending standards and historically low interest rates contributed to the greatest “leveraging up” of personal balance sheets in history. With these burdens having now reached levels that most consider to be unsustainable, the process of unwinding this debt has begun in earnest. While deleveraging of balance sheets may seem fairly straightforward, there are several critical steps that individuals need to take to ensure that debt consolidation is accomplished in an effi cient and comprehensive manner.
The fi rst step in this process is to identify the current capacity for debt reduction. This entails an assessment of the resources available for paying down or reducing outstanding debt balances. This debt consolidation must not be approached in a way that negatively impacts either investment performance or minimum required liquidity levels.
The second step is to prioritize debt consolidation according to funding costs rather than the nature
Fig. 10: Debt levels rose sharply heading into the crisisTotal debt as a share of US GDP, in %
Source: Thomson Reuters, UBS WMR
0
50
100
150
200
250
300
350
400
1960 1970 1980 1990 2000 2010
Households Domestic nonfinancial business
Government Domestic financial business
Foreign
Fig. 9: Tail risk illustratedFrequency versus outcome
Source: UBS WMR
q y
Freq
uenc
y
Outcome
Tail of the distribution
high
lowpositivenegative
The tendency for markets to experience extreme outcomes poses one of the most signifi cant challenges for investors.
UBS on Aft ershocks 10
of the funding. Highest-cost debt should typically be reduced � rst – although the aft er-tax impact of debt reduction also needs to be incorporated into the process.
The � nal step is to reduce funding costs for the remaining debt balance through a combination of opportunistic re� nancing and use of assets to lower borrowing rates. This can include refinancing of existing mortgage balances or corporate loans for small business owners, as well as using securities holdings to reduce funding costs on outstanding credit card or other high-interest obligations. Leveraging securities holdings can also improve cash n ow as these lines are typically not amortizing and interest may be capitalized.
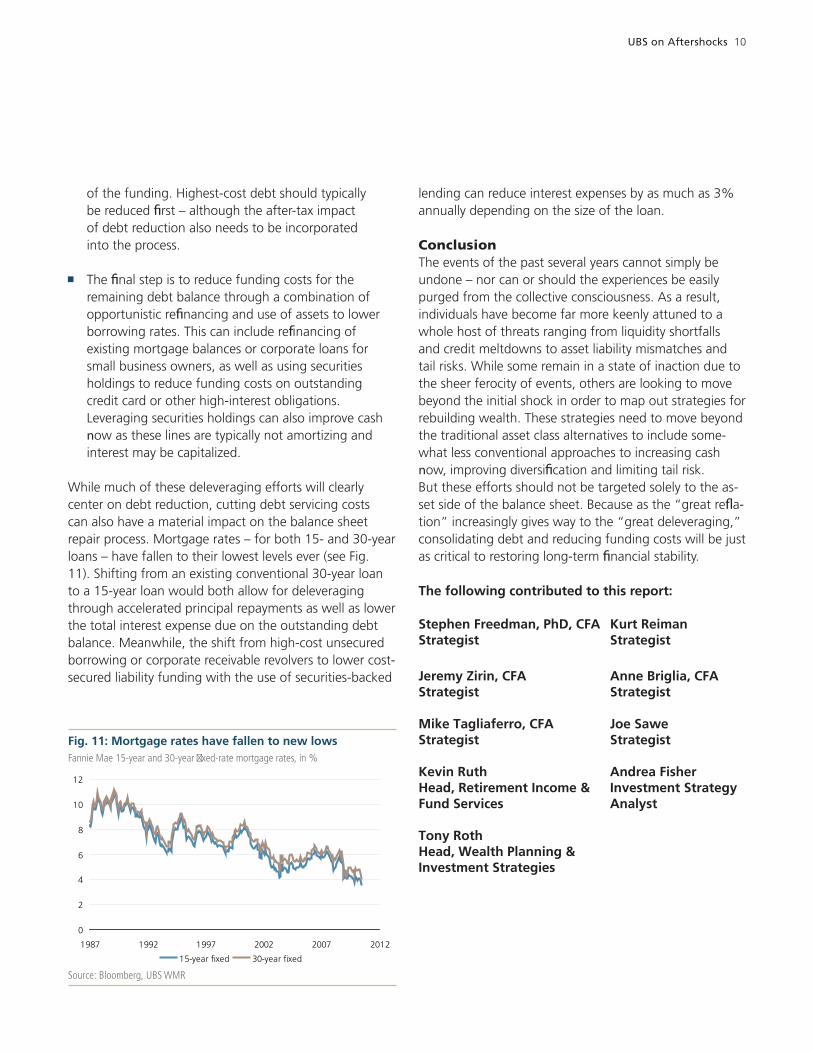
While much of these deleveraging eff orts will clearly center on debt reduction, cutting debt servicing costs can also have a material impact on the balance sheet repair process. Mortgage rates – for both 15- and 30-year loans – have fallen to their lowest levels ever (see Fig. 11). Shift ing from an existing conventional 30-year loan to a 15-year loan would both allow for deleveraging through accelerated principal repayments as well as lower the total interest expense due on the outstanding debt balance. Meanwhile, the shift from high-cost unsecured borrowing or corporate receivable revolvers to lower cost-secured liability funding with the use of securities-backed
lending can reduce interest expenses by as much as 3% annually depending on the size of the loan.
ConclusionThe events of the past several years cannot simply be undone – nor can or should the experiences be easily purged from the collective consciousness. As a result, individuals have become far more keenly attuned to a whole host of threats ranging from liquidity shortfalls and credit meltdowns to asset liability mismatches and tail risks. While some remain in a state of inaction due to the sheer ferocity of events, others are looking to move beyond the initial shock in order to map out strategies for rebuilding wealth. These strategies need to move beyond the traditional asset class alternatives to include some-what less conventional approaches to increasing cash n ow, improving diversi� cation and limiting tail risk. But these eff orts should not be targeted solely to the as-set side of the balance sheet. Because as the “great re� a-tion” increasingly gives way to the “great deleveraging,” consolidating debt and reducing funding costs will be just as critical to restoring long-term � nancial stability.
The following contributed to this report:
Stephen Freedman, PhD, CFA Kurt ReimanStrategist Strategist
Jeremy Zirin, CFA Anne Briglia, CFAStrategist Strategist
Mike Tagliaferro, CFA Joe SaweStrategist Strategist
Kevin Ruth Andrea Fisher Head, Retirement Income & Investment StrategyFund Services Analyst Tony RothHead, Wealth Planning &Investment Strategies
Fig. 11: Mortgage rates have fallen to new lowsFannie Mae 15-year and 30-year � xed-rate mortgage rates, in %
Source: Bloomberg, UBS WMR
0
2
4
6
8
10
12
1987 1992 1997 2002 2007 2012
UBS on A ershocks 11
About this publication. This report is published by Wealth Management Research – Americas (WMR) in collaboration with others within and outside UBS Wealth Management.
Wealth Management Research is published by Wealth Management & Swiss Bank and Wealth Management Americas, Business Divisions of UBS AG (UBS) or an affi liate thereof. In certain countries UBS AG is referred to as UBS SA. This publication is for your information only and is not intended as an off er, or a solicitation of an off er, to buy or sell any investment or other specifi c product. The analysis contained herein is based on numerous assumptions. Diff erent assumptions could result in materially diff erent results. Certain services and products are subject to legal restrictions and cannot be off ered worldwide on an unrestricted basis and/or may not be eligible for sale to all investors. All information and opinions expressed in this document were obtained from sources believed to be reliable and in good faith, but no representation or warranty, express or implied, is made as to its accuracy or completeness (other than disclosures relating to UBS and its affi liates). All information and opinions as well as any prices indicated are currently only as of the date of this report, and are subject to change without notice. Opinions expressed herein may diff er or be contrary to those expressed by other business areas or divisions of UBS as a result of using diff erent assumptions and/or criteria. At any time UBS AG and other companies in the UBS group (or employees thereof) may have a long or short position, or deal as principal or agent, in relevant securities or provide advisory or other services to the issuer of relevant securities or to a company connected with an issuer. Some investments may not be readily realisable since the market in the securities is illiquid and therefore valuing the investment and identifying the risk to which you are exposed may be diffi cult to quantify. UBS relies on information barriers to control the fl ow of information contained in one or more areas within UBS, into other areas, units, divisions or affi liates of UBS. Futures and options trading is considered risky. Past performance of an investment is no guarantee for its future performance. Some investments may be subject to sudden and large falls in value and on realisation you may receive back less than you invested or may be required to pay more. Changes in FX rates may have an adverse eff ect on the price, value or income of an investment. We are of necessity unable to take into account the particular investment objectives, fi nancial situation and needs of our individual clients and we would recommend that you take fi nancial and/or tax advice as to the implications (including tax) of investing in any of the products mentioned herein. This document may not be reproduced or copies circulated without prior authority of UBS or a subsidiary of UBS. UBS expressly prohibits the distribution and transfer of this document to third parties for any reason. UBS will not be liable for any claims or lawsuits from any third parties arising from the use or distribution of this document. This report is for distribution only under such circumstances as may be permitted by applicable law.
Australia: Distributed by UBS Wealth Management Australia Ltd (Holder of Australian Financial Services License No. 231127), Chifl ey Tower, 2 Chifl ey Square, Sydney, New South Wales, NSW 2000. Bahamas: This publication is distributed to private clients of UBS (Bahamas) Ltd and is not intended for distribution to persons designated as a Bahamian citizen or resident under the Bahamas Exchange Control Regulations. Canada: In Canada, this publication is distributed to clients of UBS Wealth Management Canada by UBS Investment Management Canada Inc.. Dubai: Research is issued by UBS AG Dubai Branch within the DIFC, is intended for professional clients only and is not for onward distribution within the United Arab Emirates. France: This publication is distributed by UBS (France) S.A., French “société anonyme” with share capital of € 125.726.944, 69, boulevard Haussmann F-75008 Paris, R.C.S. Paris B 421 255 670, to its clients and prospects. UBS (France) S.A. is a provider of investment services duly authorized according to the terms of the “Code Monétaire et Financier,” regulated by French banking and fi nancial authorities as the “Banque de France” and the “Autorité des Marchés Financiers.” Germany: The issuer under German Law is UBS Deutschland AG, Stephanstrasse 14-16, 60313 Frankfurt am Main. UBS Deutschland AG is authorized and regulated by the “Bundesanstalt für Finanzdienstleistungsaufsicht.“ Hong Kong: This publication is distributed to clients of UBS AG Hong Kong Branch by UBS AG Hong Kong Branch, a licensed bank under the Hong Kong Banking Ordinance and a registered institution under the Securities and Futures Ordinance. Indonesia: This research or publication is not intended and not prepared for purposes of public off ering of securities under the Indonesian Capital Market Law and its implementing regulations. Securities mentioned in this material have not been, and will not be, registered under the Indonesian Capital Market Law and regulations. Italy: This publication is distributed to the clients of UBS (Italia) S.p.A., via del vecchio politecnico 3 - Milano, an Italian bank duly authorized by Bank of Italy to the provision of fi nancial services and supervised by “Consob” and Bank of Italy. Jersey: UBS AG, Jersey Branch is regulated by the Jersey Financial Services Commission to carry on investment business and trust company business under the Financial Services (Jersey) Law 1998 (as amended) and to carry on banking business under the Banking Business (Jersey) Law 1991 (as amended). Luxembourg/Austria: This publication is not intended to constitute a public off er under Luxembourg/Austrian law, but might be made available for information purposes to clients of UBS (Luxembourg) S.A./UBS (Luxembourg) S.A. Niederlassung Österreich, a regulated bank under the supervision of the “Commission de Surveillance du Secteur Financier” (CSSF), to which this publication has not been submitted for approval. Singapore: Please contact UBS AG Singapore branch, an exempt fi nancial adviser under the Singapore Financial Advisers Act (Cap. 110) and a wholesale bank licensed under the Singapore Banking Act (Cap. 19) regulated by the Monetary Authority of Singapore, in respect of any matters arising from, or in connection with, the analysis or report. Spain: This publication is distributed to clients of UBS Bank, S.A. by UBS Bank, S.A., a bank registered with the Bank of Spain. UAE: This research report is not intended to constitute an off er, sale or delivery of shares or other securities under the laws of the United Arab Emirates (UAE). The contents of this report have not been and will not be approved by any authority in the United Arab Emirates including the UAE Central Bank or Dubai Financial Authorities, the Emirates Securities and Commodities Authority, the Dubai Financial Market, the Abu Dhabi Securities market or any other UAE exchange. UK: Approved by UBS AG, authorised and regulated in the UK by the Financial Services Authority. A member of the London Stock Exchange. This publication is distributed to private clients of UBS London in the UK. Where products or services are provided from outside the UK they will not be covered by the UK regulatory regime or the Financial Services Compensation Scheme. USA: Distributed to US persons by UBS Financial Services Inc., a subsidiary of UBS AG. UBS Securities LLC is a subsidiary of UBS AG and an affi liate of UBS Financial Services Inc. UBS Financial Services Inc. accepts responsibility for the content of a report prepared by a non-US affi liate when it distributes reports to US persons. All transactions by a US person in the securities mentioned in this report should be eff ected through a US-registered broker dealer affi liated with UBS, and not through a non-US affi liate.
Version as per July 2010.
© UBS 2010. The key symbol and UBS are among the registered and unregistered trademarks of UBS. All rights reserved.