MINING. Example: Coal Example: Gold Ore Example: Iron Ore (steel!)
1
UBS Coal & Iron Ore Seminar
MGX
Sydney 28 November 2013
Disclaimer
2
This Document is Confidential and may not be reproduced, redistributed or passed on, directly or indirectly, to
any other person, or published, in whole or in part, for any purpose without prior written approval from Mount
Gibson Iron Limited.
This Document is not a Prospectus nor an Offer to Subscribe for Shares.
Mount Gibson Iron Limited and its subsidiaries (ASX:MGX, “MGX”) makes no representations or warranty
(express or implied) as to the accuracy, reliability or completeness of this document. MGX and its respective
directors, employees, agents and consultants shall have no liability (including liability to any person by reason
of negligence or negligent misstatement) for any statements, opinions, information or matters (expressed or
implied) arising out of, or contained in or derived from, or for any omissions from this document, except liability
under statute that cannot be excluded.
This document contains reference to certain forecasts, projections, intentions, expectations and plans of MGX,
which may or may not be achieved. They are based on certain assumptions which may not be met or on
which views may differ.
The performance and operations of MGX may be influenced by a number of factors, uncertainties and
contingencies many of which are outside the control of MGX and its directors.
No representation or warranty (expressed or implied) is made by MGX or any of its respective directors,
officers, employees, advisers or agents that any forecasts, projections, intentions, expectations or plans set
out in this document will be achieved, either totally or partially, or that any particular rate of return will be
achieved.
Investments in shares in MGX is considered highly speculative.
3
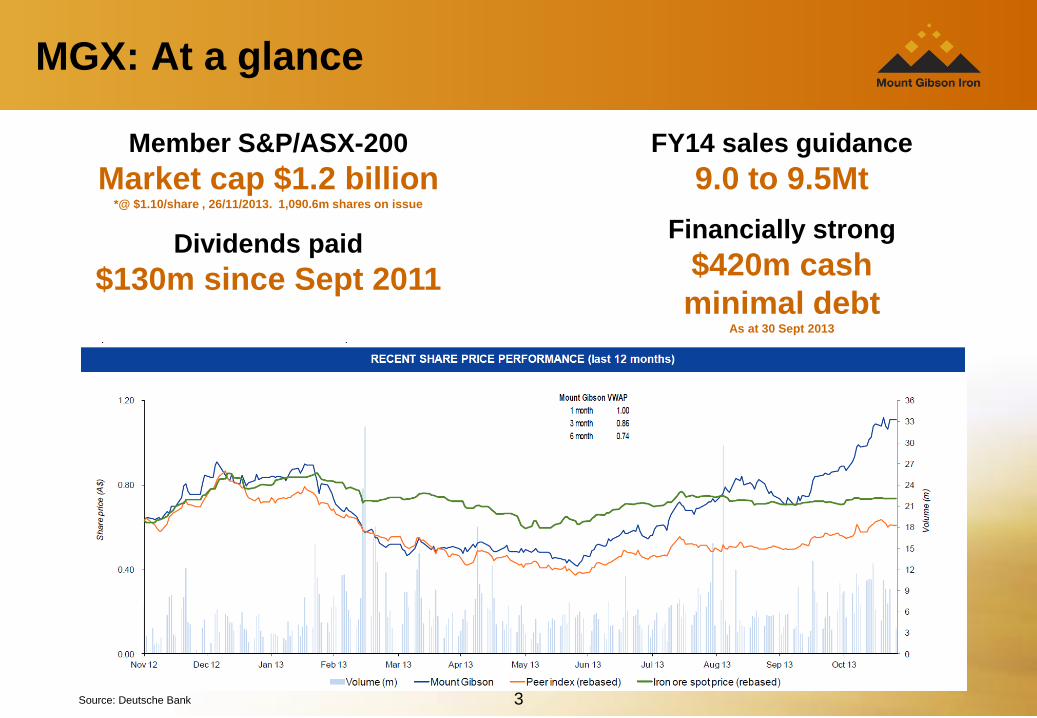
MGX: At a glance
Member S&P/ASX-200
Market cap $1.2 billion *@ $1.10/share , 26/11/2013. 1,090.6m shares on issue
Dividends paid
$130m since Sept 2011
FY14 sales guidance
9.0 to 9.5Mt
Financially strong
$420m cash
minimal debt As at 30 Sept 2013
Source: Deutsche Bank
4
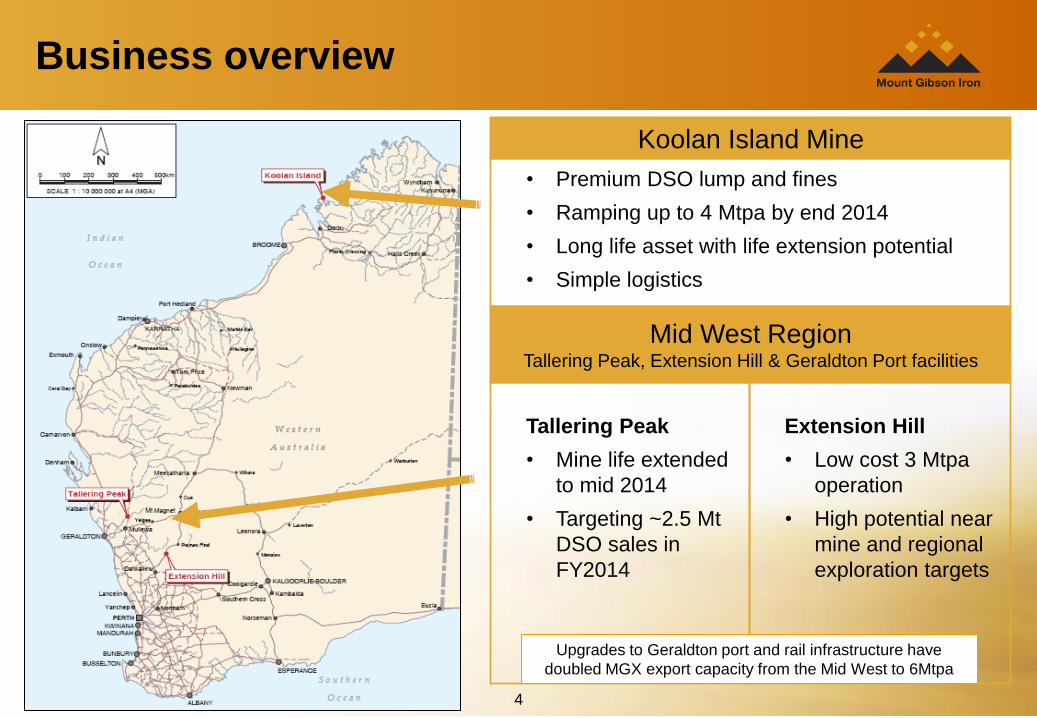
Koolan Island Mine
Mid West Region Tallering Peak, Extension Hill & Geraldton Port facilities
• Premium DSO lump and fines
• Ramping up to 4 Mtpa by end 2014
• Long life asset with life extension potential
• Simple logistics
Tallering Peak
• Mine life extended
to mid 2014
• Targeting ~2.5 Mt
DSO sales in
FY2014
Extension Hill
• Low cost 3 Mtpa
operation
• High potential near
mine and regional
exploration targets
Upgrades to Geraldton port and rail infrastructure have
doubled MGX export capacity from the Mid West to 6Mtpa
Business overview
5
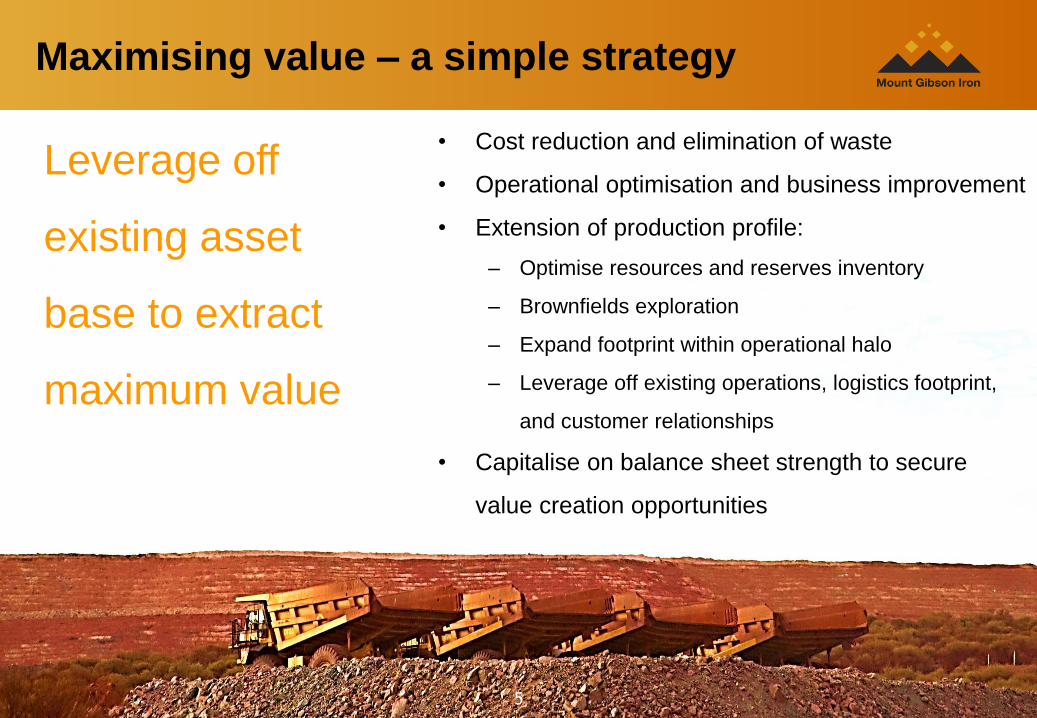
Maximising value – a simple strategy
• Cost reduction and elimination of waste
• Operational optimisation and business improvement
• Extension of production profile:
– Optimise resources and reserves inventory
– Brownfields exploration
– Expand footprint within operational halo
– Leverage off existing operations, logistics footprint,
and customer relationships
• Capitalise on balance sheet strength to secure
value creation opportunities
Leverage off
existing asset
base to extract
maximum value
6
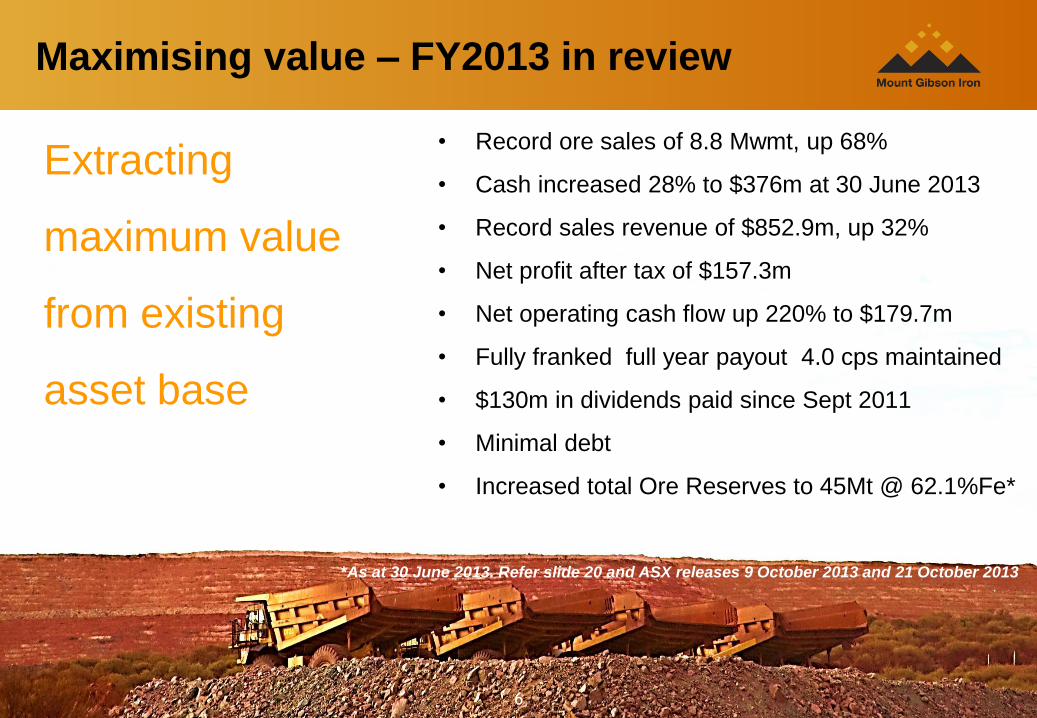
Maximising value – FY2013 in review
• Record ore sales of 8.8 Mwmt, up 68%
• Cash increased 28% to $376m at 30 June 2013
• Record sales revenue of $852.9m, up 32%
• Net profit after tax of $157.3m
• Net operating cash flow up 220% to $179.7m
• Fully franked full year payout 4.0 cps maintained
• $130m in dividends paid since Sept 2011
• Minimal debt
• Increased total Ore Reserves to 45Mt @ 62.1%Fe*
Extracting
maximum value
from existing
asset base
*As at 30 June 2013. Refer slide 20 and ASX releases 9 October 2013 and 21 October 2013
7
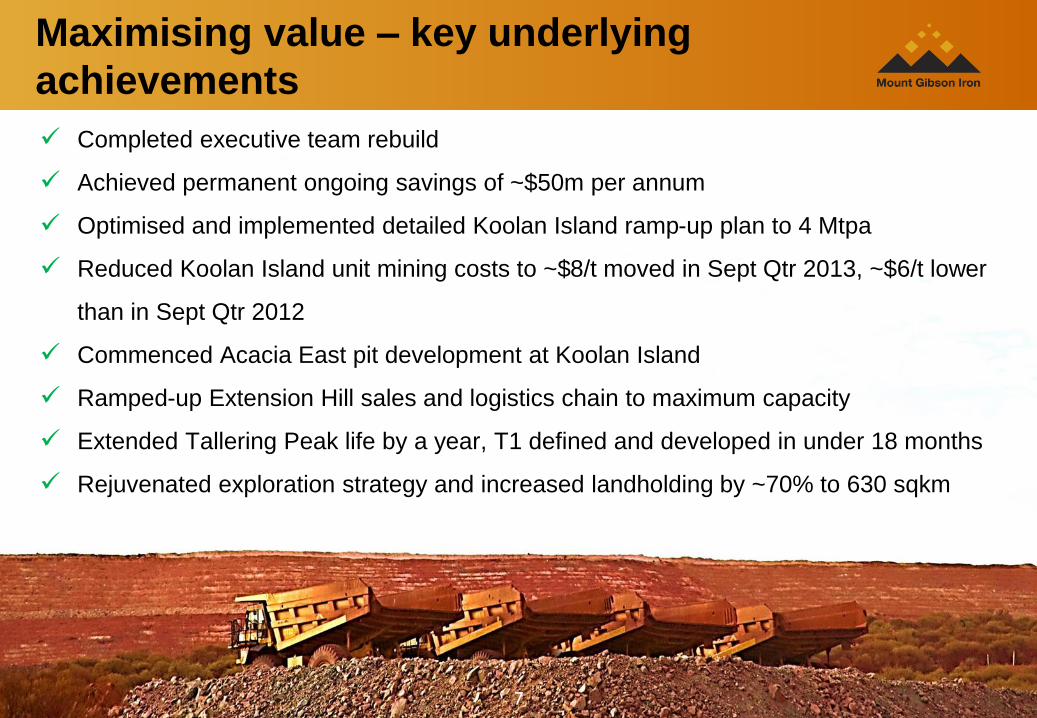
Maximising value – key underlying
achievements
Completed executive team rebuild
Achieved permanent ongoing savings of ~$50m per annum
Optimised and implemented detailed Koolan Island ramp-up plan to 4 Mtpa
Reduced Koolan Island unit mining costs to ~$8/t moved in Sept Qtr 2013, ~$6/t lower
than in Sept Qtr 2012
Commenced Acacia East pit development at Koolan Island
Ramped-up Extension Hill sales and logistics chain to maximum capacity
Extended Tallering Peak life by a year, T1 defined and developed in under 18 months
Rejuvenated exploration strategy and increased landholding by ~70% to 630 sqkm
8
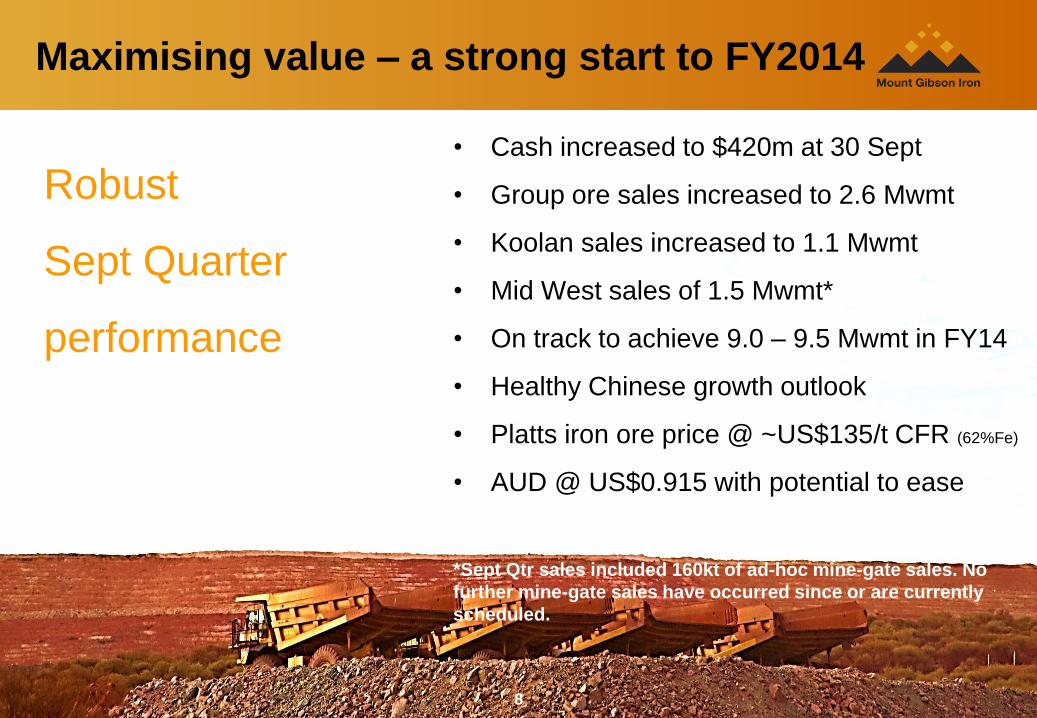
Maximising value – a strong start to FY2014
Robust
Sept Quarter
performance
• Cash increased to $420m at 30 Sept
• Group ore sales increased to 2.6 Mwmt
• Koolan sales increased to 1.1 Mwmt
• Mid West sales of 1.5 Mwmt*
• On track to achieve 9.0 – 9.5 Mwmt in FY14
• Healthy Chinese growth outlook
• Platts iron ore price @ ~US$135/t CFR (62%Fe)
• AUD @ US$0.915 with potential to ease
*Sept Qtr sales included 160kt of ad-hoc mine-gate sales. No
further mine-gate sales have occurred since or are currently
scheduled.
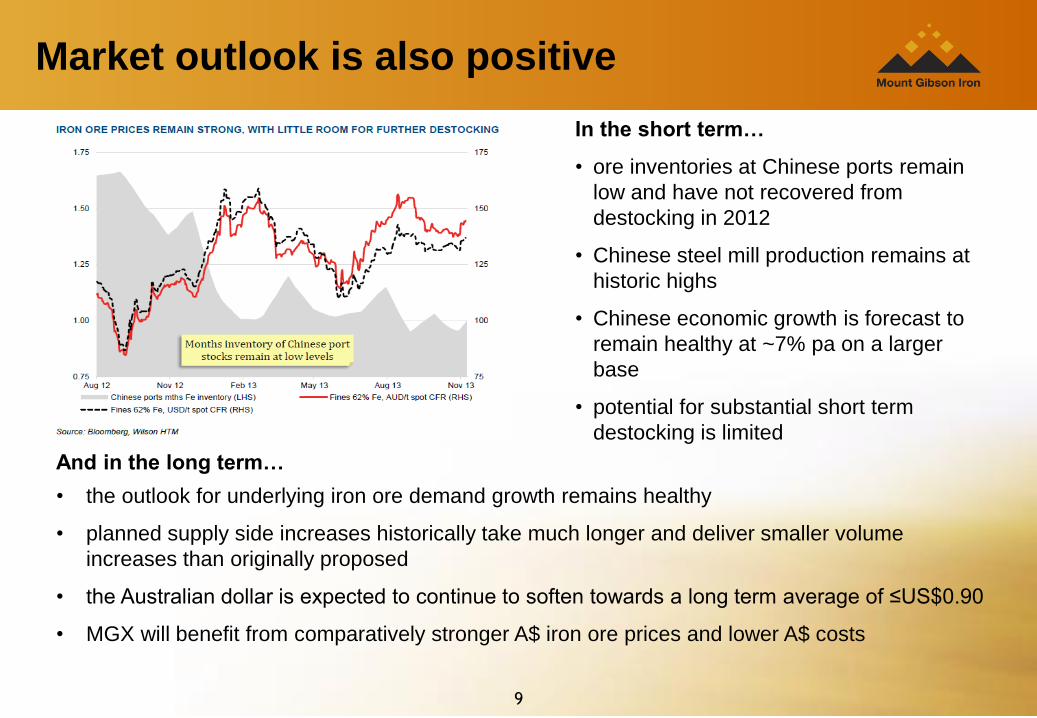
Market outlook is also positive
In the short term…
• ore inventories at Chinese ports remain
low and have not recovered from
destocking in 2012
• Chinese steel mill production remains at
historic highs
• Chinese economic growth is forecast to
remain healthy at ~7% pa on a larger
base
• potential for substantial short term
destocking is limited
9
And in the long term…
• the outlook for underlying iron ore demand growth remains healthy
• planned supply side increases historically take much longer and deliver smaller volume
increases than originally proposed
• the Australian dollar is expected to continue to soften towards a long term average of ≤US$0.90
• MGX will benefit from comparatively stronger A$ iron ore prices and lower A$ costs
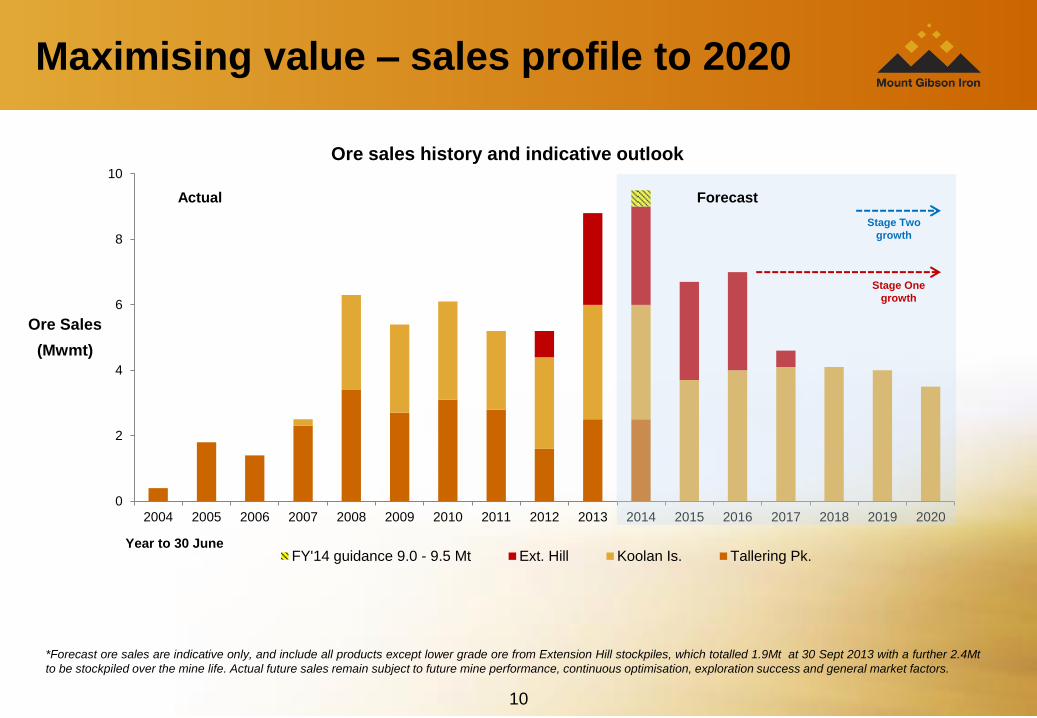
0
2
4
6
8
10
2004 2005 2006 2007 2008 2009 2010 2011 2012 2013 2014 2015 2016 2017 2018 2019 2020
Ore Sales
(Mwmt)
Year to 30 June
Ore sales history and indicative outlook
FY'14 guidance 9.0 - 9.5 Mt Ext. Hill Koolan Is. Tallering Pk.
10
*Forecast ore sales are indicative only, and include all products except lower grade ore from Extension Hill stockpiles, which totalled 1.9Mt at 30 Sept 2013 with a further 2.4Mt
to be stockpiled over the mine life. Actual future sales remain subject to future mine performance, continuous optimisation, exploration success and general market factors.
Forecast Actual
Stage One
growth
Maximising value – sales profile to 2020
Stage Two
growth
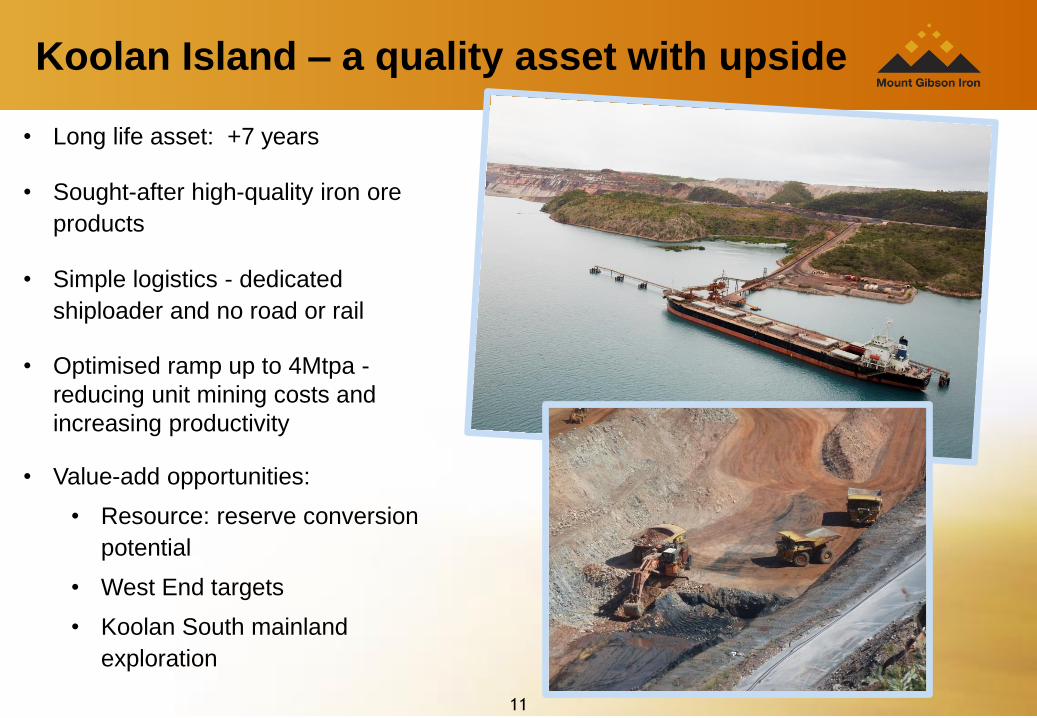
Koolan Island – a quality asset with upside
• Long life asset: +7 years
• Sought-after high-quality iron ore
products
• Simple logistics - dedicated
shiploader and no road or rail
• Optimised ramp up to 4Mtpa -
reducing unit mining costs and
increasing productivity
• Value-add opportunities:
• Resource: reserve conversion
potential
• West End targets
• Koolan South mainland
exploration
11
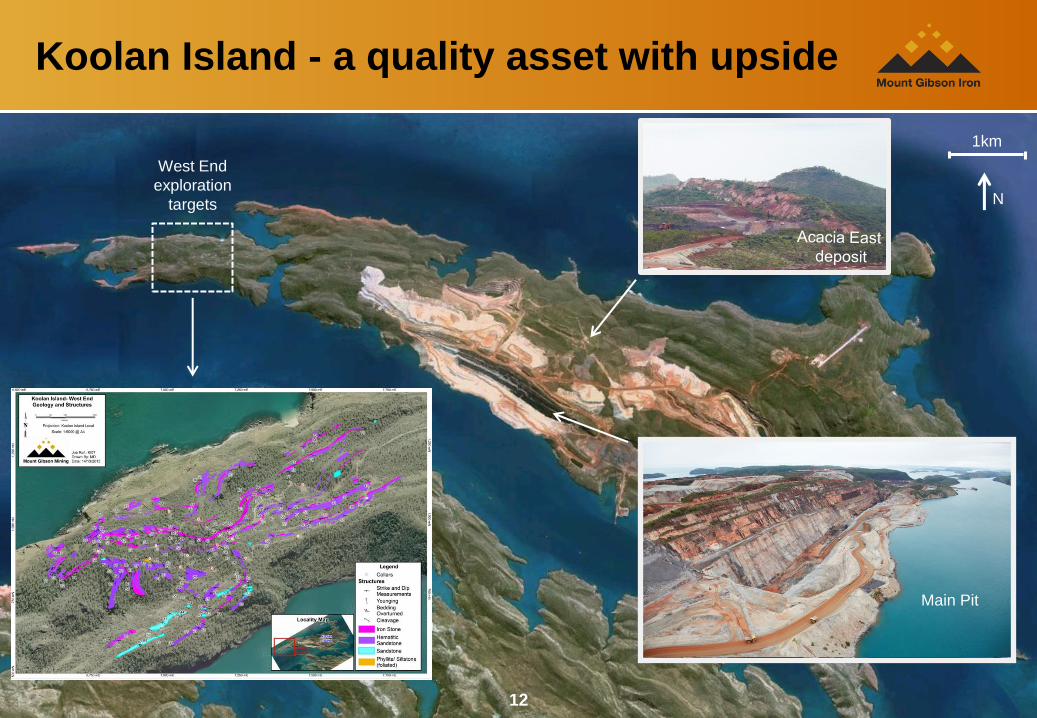
Koolan Island - a quality asset with upside
1km
N
12
West End
exploration
targets
Main Pit
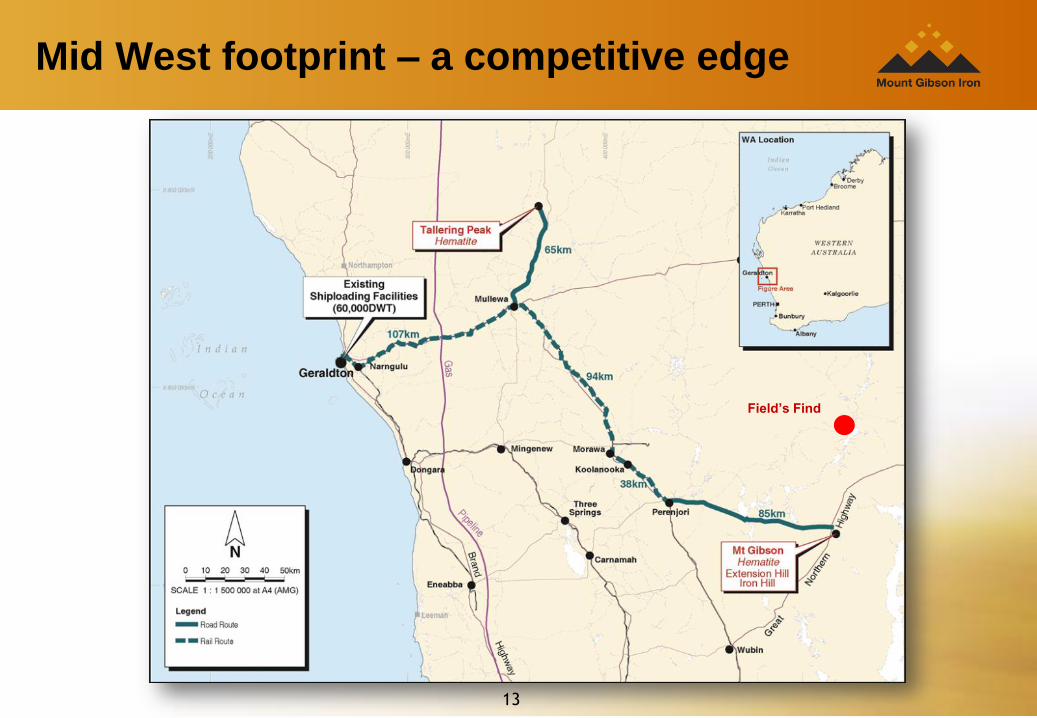
Mid West footprint – a competitive edge
Field’s Find
13
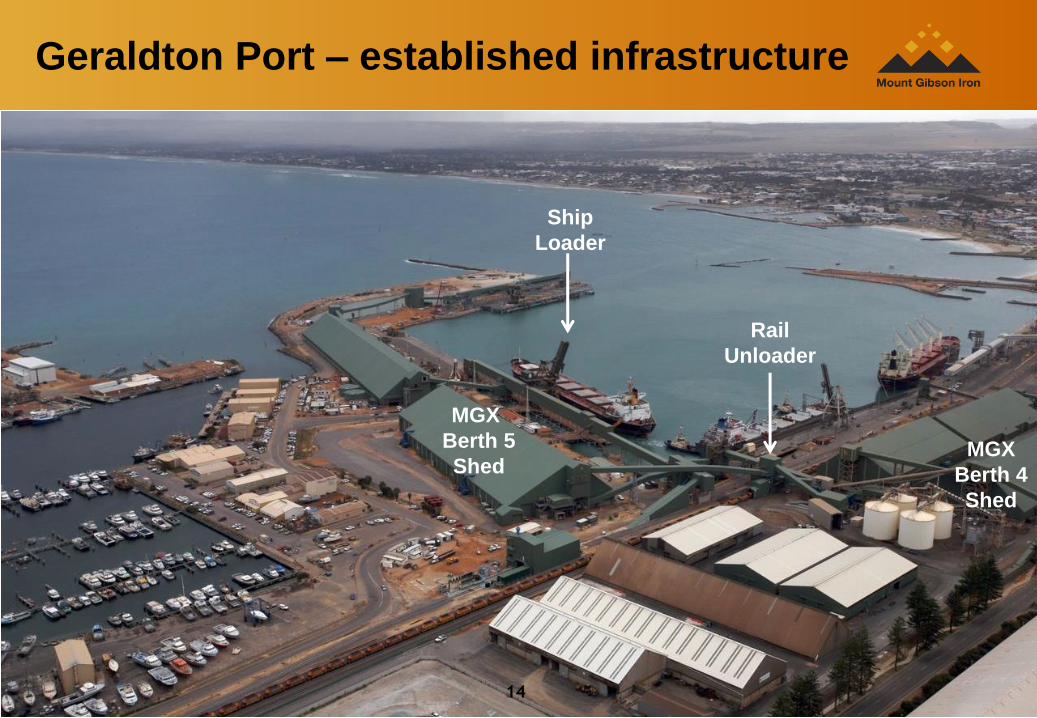
Geraldton Port – established infrastructure
14
MGX
Berth 5
Shed MGX
Berth 4
Shed
Rail
Unloader
Ship
Loader
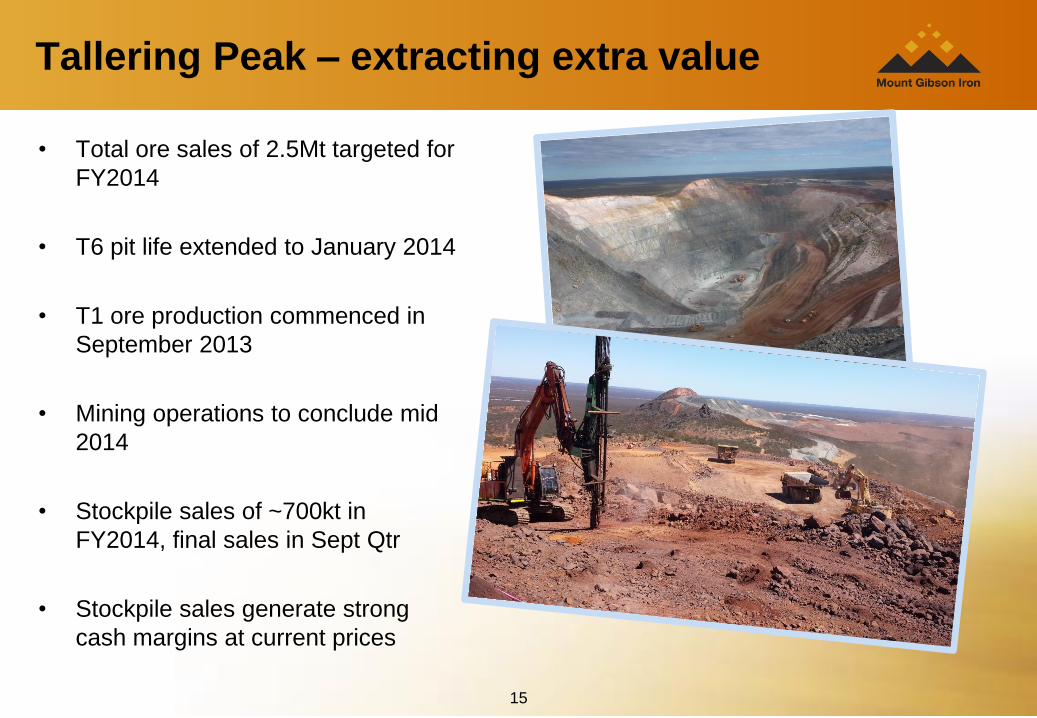
• Total ore sales of 2.5Mt targeted for
FY2014
• T6 pit life extended to January 2014
• T1 ore production commenced in
September 2013
• Mining operations to conclude mid
2014
• Stockpile sales of ~700kt in
FY2014, final sales in Sept Qtr
• Stockpile sales generate strong
cash margins at current prices
15
Tallering Peak – extracting extra value
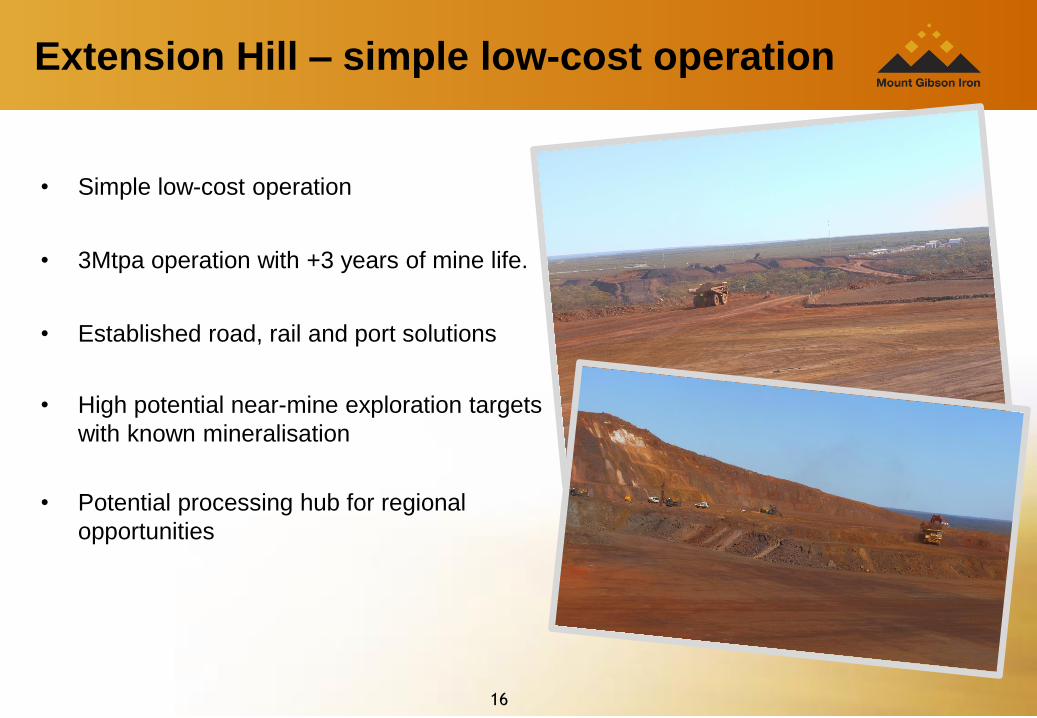
• Simple low-cost operation
• 3Mtpa operation with +3 years of mine life.
• Established road, rail and port solutions
• High potential near-mine exploration targets
with known mineralisation
• Potential processing hub for regional
opportunities
4
Extension Hill – simple low-cost operation
16
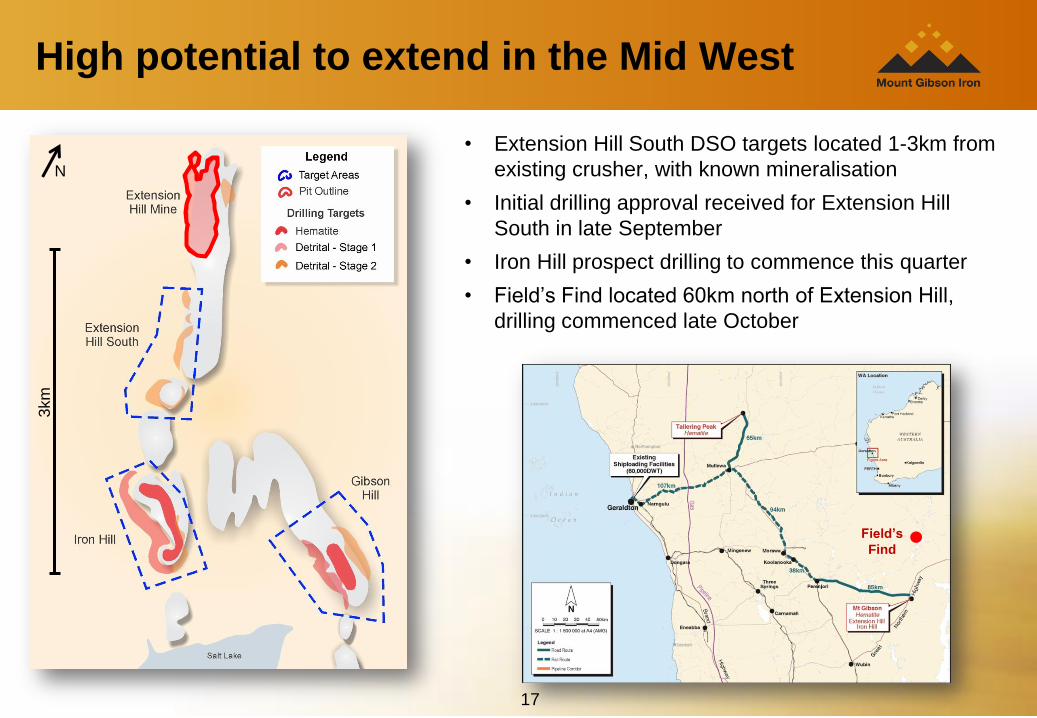
• Extension Hill South DSO targets located 1-3km from
existing crusher, with known mineralisation
• Initial drilling approval received for Extension Hill
South in late September
• Iron Hill prospect drilling to commence this quarter
• Field’s Find located 60km north of Extension Hill,
drilling commenced late October
High potential to extend in the Mid West
Field’s
Find
3km
N
17
18
Summary
• An established mid-cap iron ore producer, on track to sell 9.0 - 9.5 million
tonnes in FY2014
• Strong operating cashflows and balance sheet
• Supportive major shareholders
• Established transport infrastructure and long term customer contracts
• Exploration upside and disciplined value-focused growth strategy
• Experienced management team with demonstrated capacity to:
– Optimise and drive operations to extract maximum value
– Reduce costs and eliminate inefficiencies
– Bring on new deposits in quick time
Thank You
19
For more information: Phone: +618 9426 7500
Email: [email protected]
Web: www.mtgibsoniron.com.au
Thank you
Appendix – Reserves and Resources
20
Attributions
The information in this report that relates to Exploration Results is based on information compiled by Gregory Hudson,
who is a member of the Australian Institute of Geoscientists. Gregory Hudson is an employee of Mount Gibson Iron
Limited group, and has sufficient experience relevant to the styles of mineralisation and type of deposit under
consideration and to the activity he is undertaking, to qualify as a Competent Person as defined in the December 2012
Edition of the “Australasian Code for Reporting of Exploration Results, Mineral Resources and Ore Reserves”. Gregory
Hudson has consented to the inclusion of the matters in this report based on his information in the form and context in
which it appears.
The information in this report relating to Mineral Resources is based on information compiled by Elizabeth Haren, who is a
member and Chartered Professional of the Australasian Institute of Mining and Metallurgy. Elizabeth Haren has sufficient
experience that is relevant to the style of mineralisation and type of deposit under consideration and to the activity being
undertaken to qualify as a Competent Person as defined in the 2012 Edition of the ‘Australasian Code for Reporting of
Exploration Results, Mineral Resources and Ore Reserves’. Elizabeth Haren consents to the inclusion in the report of the
matters based on her information in the form and context in which it appears. Elizabeth Haren was a full-time employee
of, and is a consultant to Mount Gibson Mining Limited. The Mineral Resource estimate complies with recommendations
in the Australian Code for Reporting of Mineral Resources and Ore Reserves (2012) by the Joint Ore Reserves
Committee (JORC). Therefore it is suitable for public reporting.
The information in this report relating to Ore Reserves is based on information compiled by Weifeng Li, who is a member
of the Australasian Institute of Mining and Metallurgy. Weifeng Li has sufficient experience that is relevant to the style of
mineralisation and type of deposit under consideration and to the activity being undertaken to qualify as a Competent
Person as defined in the 2012 Edition of the ‘Australasian Code for Reporting of Exploration Results, Mineral Resources
and Ore Reserves’. Weifeng Li consents to the inclusion in the report of the matters based on his information in the form
and context in which it appears. Weifeng Li is a consultant to Mount Gibson Mining Limited.
Refer ASX release 21 October 2013 for full details of Mineral Resources and Ore Reserves.
Supplementary information
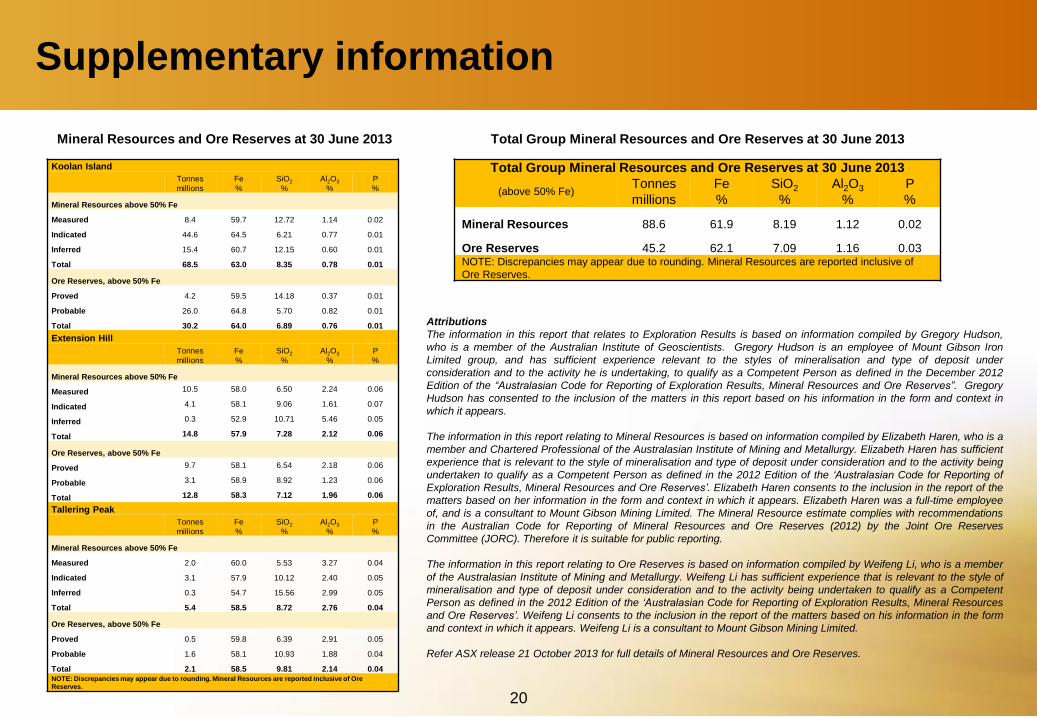
Total Group Mineral Resources and Ore Reserves at 30 June 2013 Mineral Resources and Ore Reserves at 30 June 2013
Koolan Island
Tonnes
millions
Fe
%
SiO2
%
Al2O3
%
P
%
Mineral Resources above 50% Fe
Measured 8.4 59.7 12.72 1.14 0.02
Indicated 44.6 64.5 6.21 0.77 0.01
Inferred 15.4 60.7 12.15 0.60 0.01
Total 68.5 63.0 8.35 0.78 0.01
Ore Reserves, above 50% Fe
Proved 4.2 59.5 14.18 0.37 0.01
Probable 26.0 64.8 5.70 0.82 0.01
Total 30.2 64.0 6.89 0.76 0.01
Extension Hill
Tonnes
millions
Fe
%
SiO2
%
Al2O3
%
P
%
Mineral Resources above 50% Fe
Measured 10.5 58.0 6.50 2.24 0.06
Indicated 4.1 58.1 9.06 1.61 0.07
Inferred 0.3 52.9 10.71 5.46 0.05
Total 14.8 57.9 7.28 2.12 0.06
Ore Reserves, above 50% Fe
Proved 9.7 58.1 6.54 2.18 0.06
Probable 3.1 58.9 8.92 1.23 0.06
Total 12.8 58.3 7.12 1.96 0.06
Tallering Peak
Tonnes
millions
Fe
%
SiO2
%
Al2O3
%
P
%
Mineral Resources above 50% Fe
Measured 2.0 60.0 5.53 3.27 0.04
Indicated 3.1 57.9 10.12 2.40 0.05
Inferred 0.3 54.7 15.56 2.99 0.05
Total 5.4 58.5 8.72 2.76 0.04
Ore Reserves, above 50% Fe
Proved 0.5 59.8 6.39 2.91 0.05
Probable 1.6 58.1 10.93 1.88 0.04
Total 2.1 58.5 9.81 2.14 0.04 NOTE: Discrepancies may appear due to rounding. Mineral Resources are reported inclusive of Ore
Reserves.
Total Group Mineral Resources and Ore Reserves at 30 June 2013
(above 50% Fe) Tonnes
millions
Fe
%
SiO2
%
Al2O3
%
P
%
Mineral Resources 88.6 61.9 8.19 1.12 0.02
Ore Reserves 45.2 62.1 7.09 1.16 0.03 NOTE: Discrepancies may appear due to rounding. Mineral Resources are reported inclusive of
Ore Reserves.