UBS AUSTRALASIA CONFERENCE PRESENTATION · 179 franchises at 105 dealerships Sale of new and used...
13
Automotive Holdings Group Limited 21 Old Aberdeen Place West Perth, WA 6005 www.ahgir.com.au ABN 35 111 470 038 UBS AUSTRALASIA CONFERENCE PRESENTATION 16 November 2015 AHG is today making the attached presentation in Sydney to the UBS Australasia Conference. ENDS About AHG Automotive Holdings Group Limited (ASX: AHG) is a diversified automotive retailing and logistics group with operations in every Australian mainland state and in New Zealand. The Company is Australia's largest automotive retailer, with dealerships in Western Australia, New South Wales, Queensland and Victoria. AHG’s logistics businesses operate throughout Australia via subsidiaries Rand Transport, Harris Refrigerated Transport, Scott’s Refrigerated Freightways and JAT Refrigerated Road Services (transport and cold storage), AMCAP and Covs (motor parts and industrial supplies distribution), VSE (vehicle storage and engineering), Genuine Truck Bodies (body building services to the truck industry), WMC (bus and truck importation and distribution), and KTM Sportmotorcycles and HQVA (KTM and Husqvarna motorcycle importation and distribution in Australia and New Zealand). Corporate: Media: David Rowland David Christison Company Secretary Group Executive Corporate Communications Mobile: 0421 661 613 Mobile: 0418 959 817 Email: [email protected] Email: [email protected] For personal use only
Transcript of UBS AUSTRALASIA CONFERENCE PRESENTATION · 179 franchises at 105 dealerships Sale of new and used...
Automotive Holdings Group Limited 21 Old Aberdeen Place
West Perth, WA 6005 www.ahgir.com.au
ABN 35 111 470 038
UBS AUSTRALASIA CONFERENCE PRESENTATION 16 November 2015 AHG is today making the attached presentation in Sydney to the UBS Australasia Conference. ENDS About AHG Automotive Holdings Group Limited (ASX: AHG) is a diversified automotive retailing and logistics group with operations in every Australian mainland state and in New Zealand. The Company is Australia's largest automotive retailer, with dealerships in Western Australia, New South Wales, Queensland and Victoria. AHG’s logistics businesses operate throughout Australia via subsidiaries Rand Transport, Harris Refrigerated Transport, Scott’s Refrigerated Freightways and JAT Refrigerated Road Services (transport and cold storage), AMCAP and Covs (motor parts and industrial supplies distribution), VSE (vehicle storage and engineering), Genuine Truck Bodies (body building services to the truck industry), WMC (bus and truck importation and distribution), and KTM Sportmotorcycles and HQVA (KTM and Husqvarna motorcycle importation and distribution in Australia and New Zealand). Corporate: Media: David Rowland David Christison Company Secretary Group Executive Corporate Communications Mobile: 0421 661 613 Mobile: 0418 959 817 Email: [email protected] Email: [email protected]
For
per
sona
l use
onl
y

11/13/2015
1
UBS Conference PresentationNovember 2015 | Bronte Howson | Managing Director
Company Overview
Australia's largest provider of temperature controlled logistics solutions
Refrigerated Logistics Other Logistics
ASX 200 Company with a market capitalisation of ~$1.27 billionIn excess of $5 billion in revenue
More than 7,700 employees across Australia and New Zealand
AUTOMOTIVE
Australia’s largest automotive retailer 179 franchises at 105 dealerships Sale of new and used cars and trucks Vehicle servicing Aftercare (parts and accessories) Finance and Insurance
LOGISTICS
Wholesale distribution of automotive parts, mining supplies, KTM and Husqvarna motorcycles, truck body building services and vehicle storage, bus importation and distribution
2
For
per
sona
l use
onl
y

11/13/2015
2
Automotive3
772,681
824,309
909,811
955,229
988,26
9
962,666
1,049,982
1,012,165
937,328
1,035,574
1,008,437
1,112,032
1,136,227
1,113,224
1,155,000
0
200,000
400,000
600,000
800,000
1,000,000
1,200,000
National Sales of New Vehicles
*VFACTS October 2015
• Private sector represents more than 53% of the market
• AHG presence in strong growth markets in NSW, Vic and Qld
• WA market tougher but AHG performing well
• Acquisitions contributing to AHG’s increased market share
• New vehicle sales tracking towards new record of 1.15 million
ANNUAL SALES 2.54% CAGR
4
2001 2002 2003 2004 2005 2006 2007 2008 2009 2010 2011 2012 2013 2014 2015
ForecastVFACTS*
YTD Sales by State
NEW VEHICLE Oct Oct Oct '15SALES UNITS CY14 CY15 v Oct '14
NSW 295,498 314,942 6.6%VIC 249,657 260,183 4.2%QLD 185,852 196,714 5.8%
WA 97,324 88,495 ‐9.1%SA/TAS/ACT/NT 95,852 96,819 1.0%
Total 924,183 957,153 3.6%
YTD Sales by Buyer Type
NEW VEHICLE Oct Oct Oct '15
SALES UNITS CY14 CY15 v Oct '14
Private 488,778 508,305 4.0%Business 328,766 341,992 4.0%
Government 35,581 34,573 ‐2.8%Rental 45,211 46,022 1.8%
Heavy Commercial 25,847 26,261 1.6%
Total 924,183 957,153 3.6%
For
per
sona
l use
onl
y

11/13/2015
3
Dealership Revenue Streams
New Cars
Used Cars
PartsFinance & Insurance
Service
• Strict measurement and reporting processes
• Industry benchmarking across departments
• High penetration rates across Finance & Insurance (F&I)
• Strong CRM programs drive service retention
• Service department revenue opportunities
5
Distinctive Position in a Changing Market
• Already operating in a disrupted world
• Capable of change with (or ahead of) the market
• High performance retail culture
• Own the relationship with the manufacturer
• Retail more than 100,000 vehicles a year
• Hold the inventory
• Originates ~$1 billion p.a. auto finance
• Service database (~859,000 ROs in FY 2015)
• Customer lifecycle (service, tyres, batteries... next sale)
• Strong focus on training, development and retention
• Industry leading operating systems and processes
• Highly structured reporting
6
For
per
sona
l use
onl
y

11/13/2015
4
Addressing the Changing Market in Traditional Dealerships
7EY
• Work with manufacturers to deliver best customer experience
• Traditional commerce ande‐commerce converging
• Target omni‐channel prospects in dealership, on‐line, tablet, mobile
• Optimise lead generation (Gumtree, Carsales/Stratton, Carsguide, etc.)
• Maximise database and analytics
• Manage customer experience across multiple touch points*
• *e.g: Drive Chat on dealership websites
*
8
Expansion of Used Car Operations
• Target sellers and buyers
• Unlimited opportunity
• AHG holds 6.6% of Australian new car market*
• AHG holds 1.6% of Australian used car market*
• Currently 1:1 ratio (AHG private new/AHG used)
• Broader market ratio is 1:4 (private new/used)
• Same share potential = extra 150,000 used car sales pa
• Strategy avoids cannibalising existing AHG operations
• Leverage finance, insurance, service opportunities
*Approximate value based on VFACTS, Company reports and Deloitte industry estimates
AHG VEHICLE SALES FY 201575,678 New vehicles (~40k private)
37,856 Used vehicles (private)
For
per
sona
l use
onl
y

11/13/2015
5
9
Expansion of Used Car Operations
AUCTION
HOUSE
P2P MARKET
USED WAREHOUSE
MODEL
• Northern Perth• Ex‐Bunnings Warehouse• ~500 used cars• Fixed pricing• Optimised processes• Omni channel focus• “Hassle free”• Finance and Insurance• Tyres and Service• Buying service
• UAA part of Bradstreet operation• Established regional auction house• Retail and Wholesale• Simulcast bidding• >400 cars
• $15bn market opportunity• Fastest growing sector• Digital disruption play• Mobile‐first big data platform• Targets sellers and buyers• Link to online finance
10
Expansion of Used Car Operations
• $15bn market opportunity• Fastest growing sector• Digital disruption play• Mobile‐first big data platform• Targets sellers and buyers• Link to online finance
• P2P auto intermediaries are gaining traction
• US models growing (Beepi, Carvana and Shift)
• AHG model driven by world‐class big data analytics
• Distinctive offer – a world first
• Delivers what customers want
• No others have got it right – yet!
BUY FINANCESELL
For
per
sona
l use
onl
y
11/13/2015
6
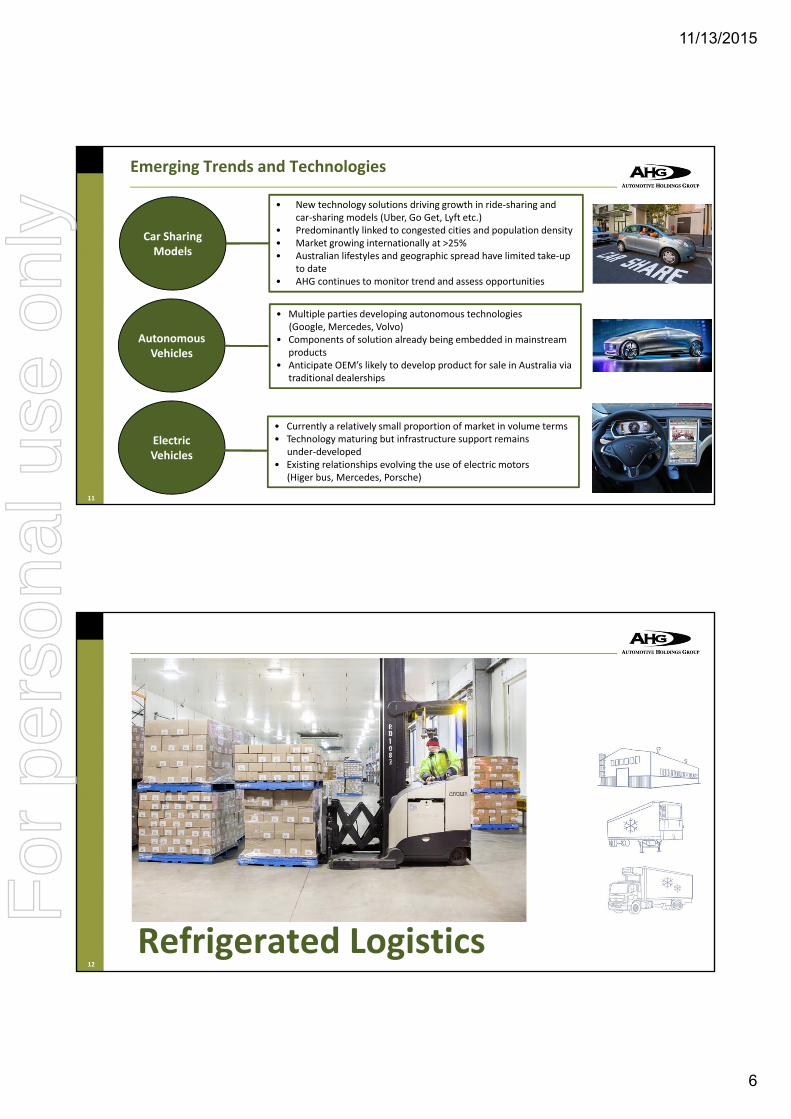
• New technology solutions driving growth in ride‐sharing and • car‐sharing models (Uber, Go Get, Lyft etc.)• Predominantly linked to congested cities and population density• Market growing internationally at >25%• Australian lifestyles and geographic spread have limited take‐up
to date• AHG continues to monitor trend and assess opportunities
Emerging Trends and Technologies
11
Car Sharing Models
Autonomous Vehicles
Electric Vehicles
• Multiple parties developing autonomous technologies(Google, Mercedes, Volvo)
• Components of solution already being embedded in mainstream products
• Anticipate OEM’s likely to develop product for sale in Australia via traditional dealerships
• Currently a relatively small proportion of market in volume terms• Technology maturing but infrastructure support remains
under‐developed• Existing relationships evolving the use of electric motors
(Higer bus, Mercedes, Porsche)
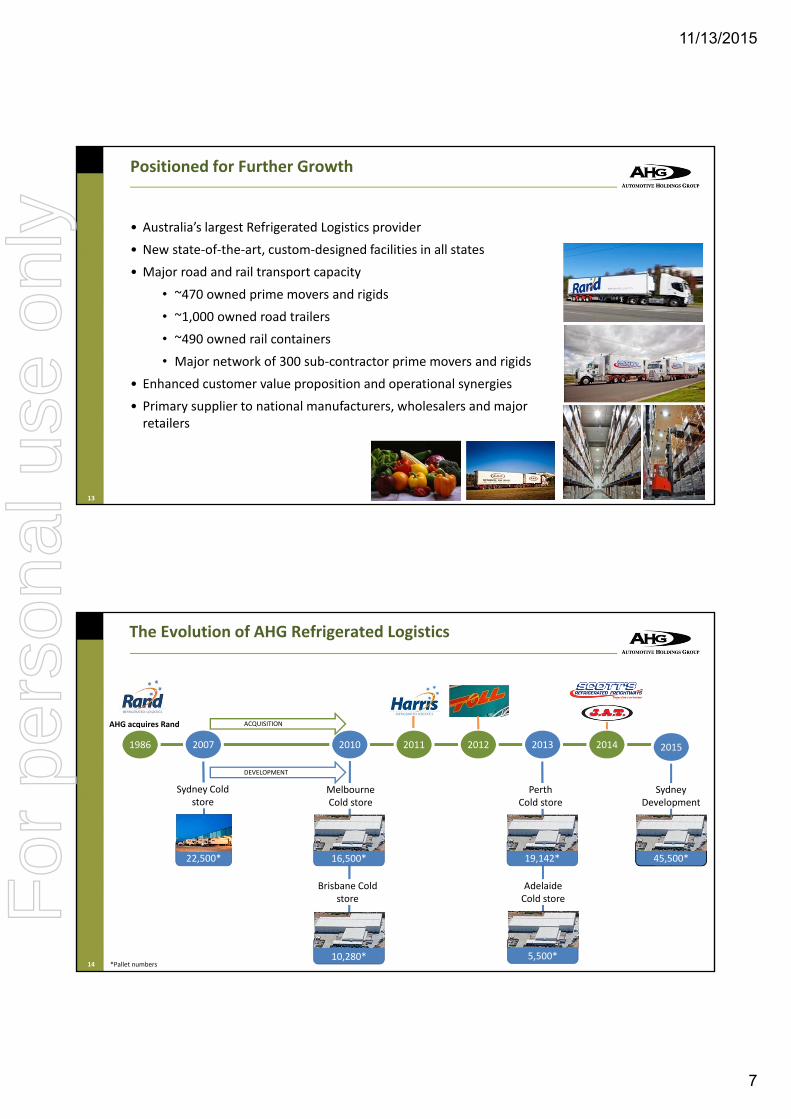
Refrigerated Logistics12
For
per
sona
l use
onl
y
11/13/2015
7
Positioned for Further Growth
13
• Australia’s largest Refrigerated Logistics provider
• New state‐of‐the‐art, custom‐designed facilities in all states
• Major road and rail transport capacity
• ~470 owned prime movers and rigids
• ~1,000 owned road trailers
• ~490 owned rail containers
• Major network of 300 sub‐contractor prime movers and rigids
• Enhanced customer value proposition and operational synergies
• Primary supplier to national manufacturers, wholesalers and major retailers
AHG acquires Rand
The Evolution of AHG Refrigerated Logistics
10,280*
16,500*22,500*
2007 2012 201420111986 2010 2013
Sydney Cold store
Melbourne Cold store
Brisbane Cold store
PerthCold store
5,500*
Adelaide Cold store
19,142*
Sydney Development
45,500*
ACQUISITION
DEVELOPMENT
*Pallet numbers
2015
14
For
per
sona
l use
onl
y
11/13/2015
8
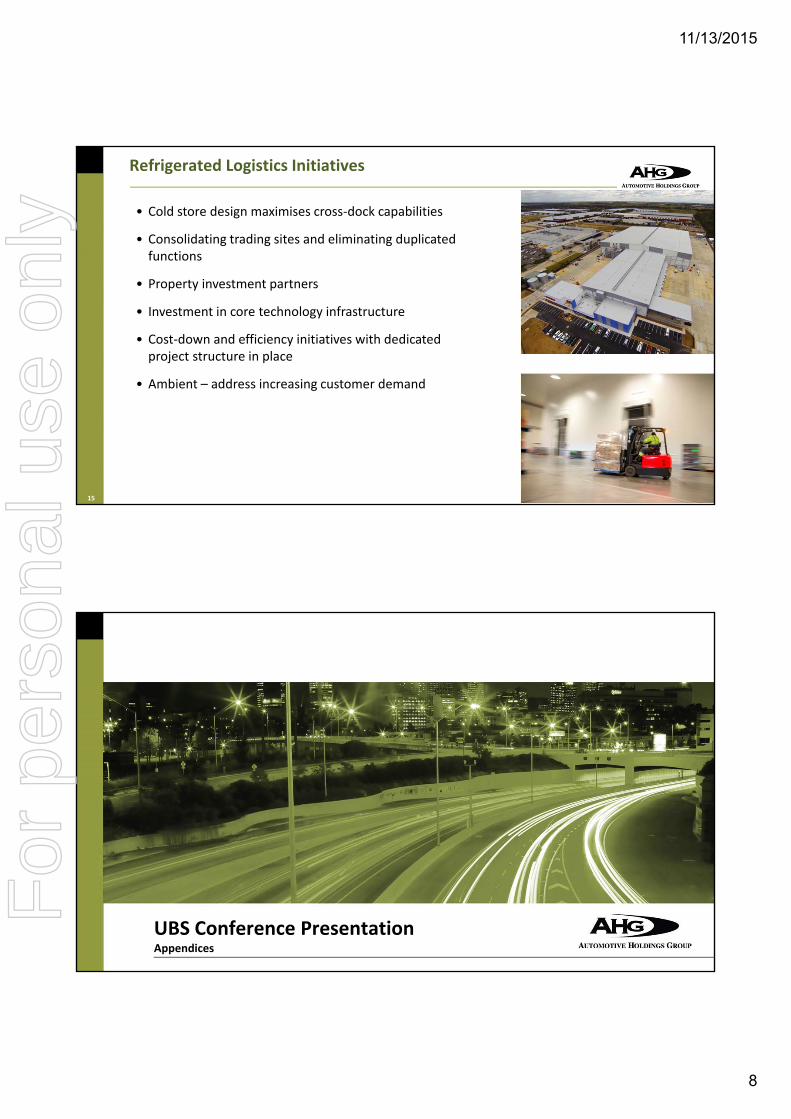
Refrigerated Logistics Initiatives
• Cold store design maximises cross‐dock capabilities
• Consolidating trading sites and eliminating duplicated functions
• Property investment partners
• Investment in core technology infrastructure
• Cost‐down and efficiency initiatives with dedicated project structure in place
• Ambient – address increasing customer demand
15
UBS Conference PresentationAppendices
For
per
sona
l use
onl
y
11/13/2015
9
Understand why the auto marketplace is changing
Build an incumbent and challenger portfolio
Determine the right play
Dominate the market
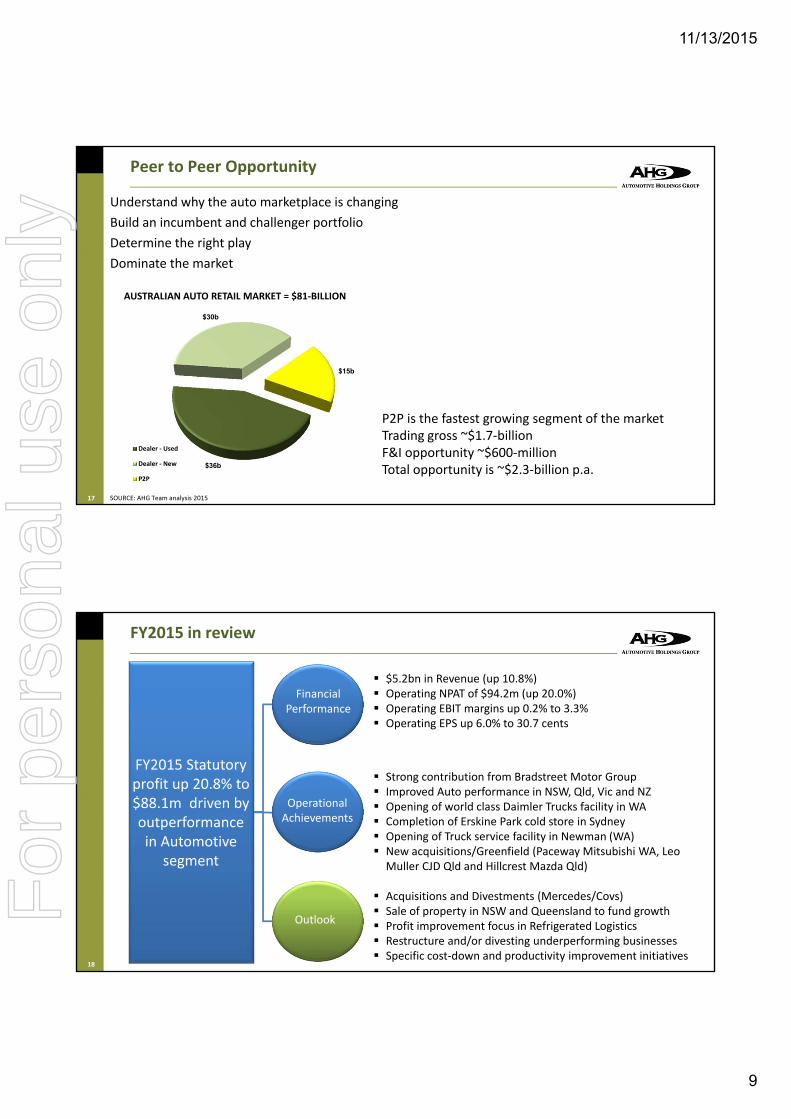
SOURCE: AHG Team analysis 2015
Peer to Peer Opportunity
17
$36b
$30b
$15b
Dealer ‐ Used
Dealer ‐ New
P2P
AUSTRALIAN AUTO RETAIL MARKET = $81‐BILLION
P2P is the fastest growing segment of the marketTrading gross ~$1.7‐billionF&I opportunity ~$600‐millionTotal opportunity is ~$2.3‐billion p.a.
FY2015 in review
FY2015 Statutory profit up 20.8% to $88.1m driven by outperformance in Automotive
segment
$5.2bn in Revenue (up 10.8%) Operating NPAT of $94.2m (up 20.0%) Operating EBIT margins up 0.2% to 3.3% Operating EPS up 6.0% to 30.7 cents
Strong contribution from Bradstreet Motor Group Improved Auto performance in NSW, Qld, Vic and NZ Opening of world class Daimler Trucks facility in WA Completion of Erskine Park cold store in Sydney Opening of Truck service facility in Newman (WA) New acquisitions/Greenfield (Paceway Mitsubishi WA, Leo Muller CJD Qld and Hillcrest Mazda Qld)
Acquisitions and Divestments (Mercedes/Covs) Sale of property in NSW and Queensland to fund growth Profit improvement focus in Refrigerated Logistics Restructure and/or divesting underperforming businesses Specific cost‐down and productivity improvement initiatives
Operational Achievements
Financial Performance
Outlook
18
For
per
sona
l use
onl
y

11/13/2015
10
21.7
24.4
22.7
24.6
27.1
29.0
30.7
0
5
10
15
20
25
30
35
FY09 FY10 FY11 FY12 FY13 FY14 FY15
14
17
17
18
20
21
22
0
5
10
15
20
25
FY09 FY10 FY11 FY12 FY13 FY14 FY15
101.1
116.0
123.7
153.5
165.3
178.6
215.8
0.0
20.0
40.0
60.0
80.0
100.0
120.0
140.0
160.0
180.0
200.0
220.0
FY09 FY10 FY11 FY12 FY13 FY14 FY15
History of sustained growth
Revenue $m
Operating1 EBITDA $m
Operating1 NPAT $m
Operating1 EPS (cps)
Statutory NPAT $m
Dividends (cps)
Operating1 – excludes costs and fees in relation to integration and acquisition‐related activities, impairment of assets and benefits applicable to GST refunds (Son of Holdback)
3,073
3,240
3,337
3,920
4,278
4,735
5,246
0
1,000
2,000
3,000
4,000
5,000
6,000
FY09 FY10 FY11 FY12 FY13 FY14 FY15
24.9
62.0
33.1
50.6
66.8
72.9
88.1
0.0
20.0
40.0
60.0
80.0
100.0
FY09 FY10 FY11 FY12 FY13 FY14 FY15
42.2
55.1
52.4
64.1
72.7
78.5
94.2
0
20
40
60
80
100
FY09 FY10 FY11 FY12 FY13 FY14 FY15
CR CR
CRCR = capital raising in the FY
19
AHG – Consolidated financial performance FY2015
• $5.2 billion in Revenues up 10.8% on FY2014
• Record Operating1 NPAT of $94.2 million
• Statutory IFRS profit of $88.1 million
• Operating1 EBIT and EBITDA margins improved
• Increased Operating1 EPS (up 6.0%)
• Strong interest cover
Consolidated Financial Performance
FY2014 ($m)
FY2015 ($m)
% change
Operating1 Performance
Revenue 4,734.8 5,245.8 10.8%
EBITDA 178.6 215.8 20.8%
EBITDA % 3.8% 4.1%
EBIT 148.3 175.2 18.2%
EBIT % 3.1% 3.3%
Operating Net Profit after Tax 78.5 94.2 20.0%
Earnings Per Share (cps) 29.0 30.7 6.0%
Interest Cover (times) 4.8 5.2
Statutory IFRS Profit after Tax
Net Integration and Acquisition, Asset Divestment and Sale of Properties
(5.6) (6.1)
Statutory Net Profit after Tax 72.9 88.1 20.8%
Earnings Per Share (cps) 26.9 28.7 6.7%
20 Operating1 – excludes costs and fees in relation to integration and acquisition‐related activities, impairment of assets and benefits applicable to GST refunds (Son of Holdback)
For
per
sona
l use
onl
y
11/13/2015
11
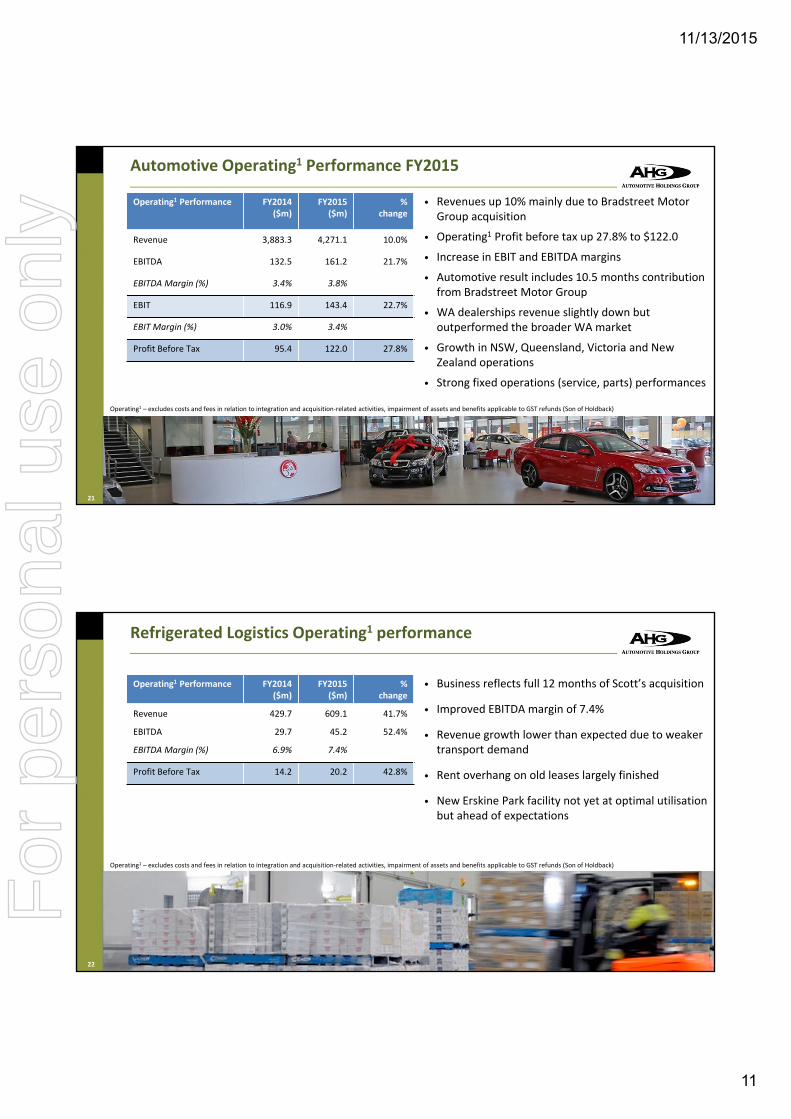
Automotive Operating1 Performance FY2015
Operating1 Performance FY2014($m)
FY2015($m)
%change
Revenue 3,883.3 4,271.1 10.0%
EBITDA 132.5 161.2 21.7%
EBITDA Margin (%) 3.4% 3.8%
EBIT 116.9 143.4 22.7%
EBIT Margin (%) 3.0% 3.4%
Profit Before Tax 95.4 122.0 27.8%
• Revenues up 10% mainly due to Bradstreet Motor Group acquisition
• Operating1 Profit before tax up 27.8% to $122.0
• Increase in EBIT and EBITDA margins
• Automotive result includes 10.5 months contribution from Bradstreet Motor Group
• WA dealerships revenue slightly down but outperformed the broader WA market
• Growth in NSW, Queensland, Victoria and New Zealand operations
• Strong fixed operations (service, parts) performances
21
Operating1 – excludes costs and fees in relation to integration and acquisition‐related activities, impairment of assets and benefits applicable to GST refunds (Son of Holdback)
Refrigerated Logistics Operating1 performance
Operating1 Performance FY2014($m)
FY2015($m)
%change
Revenue 429.7 609.1 41.7%
EBITDA 29.7 45.2 52.4%
EBITDA Margin (%) 6.9% 7.4%
Profit Before Tax 14.2 20.2 42.8%
• Business reflects full 12 months of Scott’s acquisition
• Improved EBITDA margin of 7.4%
• Revenue growth lower than expected due to weaker transport demand
• Rent overhang on old leases largely finished
• New Erskine Park facility not yet at optimal utilisation but ahead of expectations
22
Operating1 – excludes costs and fees in relation to integration and acquisition‐related activities, impairment of assets and benefits applicable to GST refunds (Son of Holdback)
For
per
sona
l use
onl
y

11/13/2015
12
Other Logistics Operating1 performance
Operating1 Performance FY2014($m)
FY2015($m)
%change
Revenue 421.4 365.2 (13.3%)
EBITDA 17.1 10.5 (38.5%)
EBITDA Margin (%) 4.1% 2.9%
Profit Before Tax 13.9 5.3 (62.1%)
• Contributions from KTM and AMCAP down compared to FY2014 for structural reasons (Lower AUD/EUR rates and change in Mitsubishi distribution model)
• Losses experienced in GTB/VSE and Higer businesses due to weak truck and bus market
• Sale of Covs agreed but no impact on FY2015 financial contribution
• Restructure of GTB/VSE underway to eliminate future losses
23
Operating1 – excludes costs and fees in relation to integration and acquisition‐related activities, impairment of assets and benefits applicable to GST refunds (Son of Holdback)
UBS Conference PresentationNovember 2015
For
per
sona
l use
onl
y