UB NASA TM X-2335 · Reynolds number increased from 7.0 X 10⁶ to 51.5 X 10⁶ per meter (2.1 X 10⁶ to...
30
C7 1 131.7 CO CO NASA TECHNICAL ,< MEMORANDUM UB NASA TM X-2335 oa X71-10973 (NASA-TH-X-2335) ANALYSIS OF FREE F L I G H T N LAMINAR, TRANSITIONAL, AND TURBULENT HEAT-TRANSFER RESULTS AT FREE-STREAH MACH Conf • NUMBERS, NEAR 20 = (REENTRY F) (U) E.V.< Zoby, 70005 et al (NASA) ^ Sep.,1971 27 p CSCL 20ME1/33 ^ ^•^''^'^^Mi^&'^ • ',W- i rt^ : t!B", :»V.-^ ; '.-^ '"" •*7?^^%JW I ' F J- G ^?. SF ...pa/^GS-T'? J V^.:' V/v-.1 .,TO V *-;' ;^;u^ag5|ix?;;x. f; v^,..i.".. ; ' ANALYSIS OF FREE-FLIGHT LAMINAR, TRANSITIONAL, AND TURBULENT HEAT-TRANSFER RESULTS AT FREE-STREAM * MACH NUMBERS NEAR 20 (REENTRY F) Ernest V. Zoby and Charles B. Rumsey Langley Research Center Hampton, Va. 23365 NATIONAL AERONAUTICS AND SPACE ADMINISTRATION • WASHINGTON, D. C. • SEPTEMBER 1971 https://ntrs.nasa.gov/search.jsp?R=19710072408 2018-12-04T10:25:43+00:00Z
Transcript of UB NASA TM X-2335 · Reynolds number increased from 7.0 X 10⁶ to 51.5 X 10⁶ per meter (2.1 X 10⁶ to...
C7 1 131.7
COCO
N A S A TECHNICAL ,<
M E M O R A N D U M
UB
NASA TM X-2335
oaX71-10973 (NASA-TH-X-2335) ANALYSIS O F FREE F L I G H T N
L A M I N A R , TRANSITIONAL, AND TURBULENTHEAT-TRANSFER RESULTS AT FREE-STREAH MACH
Conf • N U M B E R S , N E A R 20 = (REENTRY F) (U) E . V . < Zoby,70005 et al ( N A S A ) ^ Sep.,1971 27 p CSCL 20M E1/33
^^• '̂'̂ '̂ ^Mi^&'̂ • ',W-irt̂ :t!B", :»V.-̂ ; '.-^'"" •*7?^^%JWI'FJ-G^?.SF...pa/^GS-T'?JV^.:' V/v-.1
.,TOV*-;' ;̂ ;u^ag5|ix?;;x.f;v ,̂..i."..;'
ANALYSIS OF FREE-FLIGHT LAMINAR,
TRANSITIONAL, AND TURBULENT
HEAT-TRANSFER RESULTS AT FREE-STREAM*
MACH NUMBERS NEAR 20 (REENTRY F)
Ernest V. Zoby and Charles B. Rumsey
Langley Research Center
Hampton, Va. 23365
NATIONAL AERONAUTICS AND SPACE ADMINISTRATION • WASHINGTON, D. C. • SEPTEMBER 1971
https://ntrs.nasa.gov/search.jsp?R=19710072408 2018-12-04T10:25:43+00:00Z

ANALYSIS OF FREE-FLIGHT LAMINAR, TRANSITIONAL,
AND TURBULENT HE AT-TRANSFER RESULTS AT FREE-STREAM
MACH NUMBERS NEAR 20 (REENTRY F)*
By Ernest V. Zoby and Charles B. RumseyLangley Research Center
SUMMARY
Laminar, transitional, and turbulent heat-transfer data were measured during areentry flight at a Mach number of 20 on a 5° half-angle cone 3.962 m (13 ft) long withan initial nose tip radius of 0.254 cm (0.1 in.). The free-stream Reynolds numberincreased during the prime data period from 7.0 X 10⁶ to 51.5 X 10⁶ per meter (2.1 X 10⁶
to 15.7 X 10^ per foot) and the ratio of wall to total temperature varied from 0.053 to0.12. The angle of attack was less than 1° for the prime data period. The experimentallaminar and turbulent heating rates are compared with results from existing flat-plateprediction methods. At conditions of minimal tip blunting and angle of attack (above26.8 km (88 000 ft)), values from a flat-plate laminar method agreed within 20 percentwith the laminar data. The Schultz-Grunow skin-friction equation with reference enthalpy
;
conditions, with the Reynolds number based on distance from the transition location, andwith the Colburn Reynolds analogy agreed within 10 percent with the experimental turbu-leiit heating data. The Van Driest n skin-friction equation with Reynolds number greaterthan 10^ based on distance from the peak heating point and the Colburn Reynolds analogywas also within approximately 10 percent of the experimental turbulent heating data. Adata correlation jbf the extent of transition and a simple empirical transition-zone heatingcorrelation were also presented.
INTRODUCTION
The design of advanced hypersonic vehicles requires reliable predictions of turbu-lent heat transfer. Existing prediction methods are based on correlations of data fromground and flight experiments which fall significantly short of simultaneously duplicatingthe important parameters at the operating regimes of advanced vehicles. The Reentry Fflight experiment extends the experimental data to the needed regimes of simultaneoushigh Mach number, high Reynolds number, high total enthalpy, and low ratio of wall tototal temperature. Accurate measurements of heating rates were obtained during areentry trajectory at a Mach number of 20 on a 5° half-angle conical spacecraft 3.962 m
*Title, Unclassified.

(13 ft) long with an initial nose tip radius of 0.254 cm (0.1 in.). The free-streamReynolds number increased from 7.0 X 10⁶ to 51.5 X 10⁶ per meter (2.1 X 10⁶ to1577 X 10° per foot) ahcTthe raticTcJf w^irt^t^tal~t¥mpefature^ varied fronr07053™tcr0712as the altitude decreased from 30.48 to 18.29 km (100 000 to 60 000 ft), the altitude rangeof the prime data period.
Initial turbulent-heating and boundary-layer-transition results from the experimentare reported in reference 1. The body motions and angle of attack are analyzed in ref-erence 2, thermal bending of the spacecraft is analyzed in reference 3, and a history ofnose tip blunting deduced from surface pressure measurements is presented in refer-ence 4. The basic heating rates are reported in reference 5, which presents a thermalanalysis of the wall temperature measurements.
In the present paper the data of reference 1 are updated on the basis of final resultspresented in references 2 to 5, and additional turbulent data from intermediate altitudesare presented. Also, the laminar and transitional data are discussed. A data correlationof the extent of the transition region on sharp and slightly blunted cones is presented, aswell as a simple correlation for heating in the transition region.
In this paper, the experimental laminar and turbulent heating data are comparedwith results of methods employing solutions of the boundary-layer equations or of theintegral momentum equation in conjunction with mass-flow balancing procedures (refs. 6and 7) and also with results of several correlation methods (refs. 8 to 12). While thecorrelation methods are not as generally applicable as detailed solutions includingpressure-gradient and variable-entropy effects, they involve simpler computations andare utilized for large portions of slender bodies (regions of small pressure gradient).The Reentry F data provide an assessment of the reliability of these correlated methodsas design tools for advanced hypersonic vehicles, an assessment which has not previouslybeen possible because of the lack of accurate experimental data at appropriate conditions.
SYMBOLS
Values are given in both SI and U.S. Customary Units. The measurements andcalculations were made in U.S. Customary Units.
Cf skin-friction coefficient
-i-2
PR,x = FI

H enthalpy
L reference length, 3.962 m (13 ft)
M Mach number
Np Prandtl number
NJJ Reynolds number based on x
ANjj Reynolds number change from beginning to end of transition
Np ,„ Reynolds number based on free-stream conditions
Ngt Stanton number
n defined in equation (7)
p^ free-stream static pressure
q heating rate
qref reference heating rate, 1.135 W/cm2 (1.0 Btu/ft^-sec)
RN nose radius
T temperature
u velocity
x axial distance from virtual tip of cone
a angle of attack (see fig. 1)
Y ratio of specific heats (1.4 for air)
fj. viscosity
p density
p ]u reference density-viscosity product
$ circumferential angle (see fig. 1)
w exponent in viscosity-temperature relation
Subscripts:
00 free stream
aw adiabatic wall
beg beginning of transition
e local condition at edge of boundary layer
end end of transition
1 incompressible
lam laminar
reference state in PrMr method
S-C Spalding-Chi
S-G Schultz-Grunow
s stagnation point
tr transition
turb turbulent
VD Van Driest

w wall condition
PrMr Pr^r method
4> circumferential angle
Superscript:
* reference enthalpy (Eckert) condition
SPACECRAFT
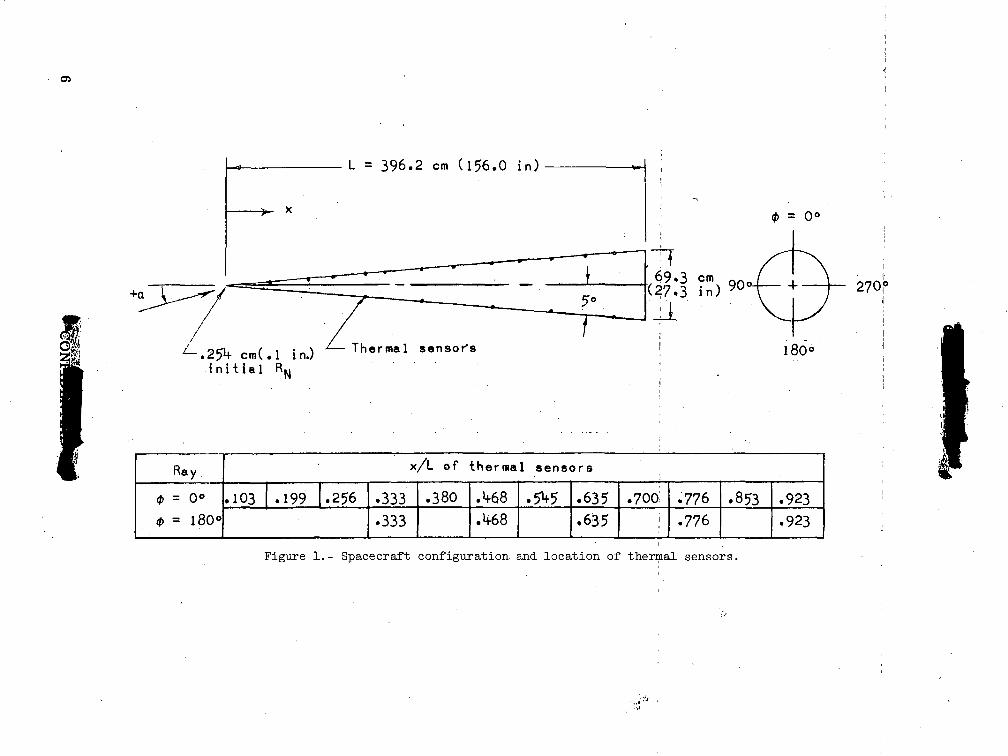
The spacecraft was a 5° half-angle cone 3.962 m (13 ft) long with an initial nosetip radius of 0.254 cm (0.1 in.). It was composed of an ATJ graphite nose tip forwardof station 21.84 cm (8.6 in.) and a beryllium cone with skin thickness of 1.524 cm (0.6 in.)aft of this station. Figure 1 shows the configuration of the spacecraft and the locationsof the thermal sensors. Further details of the design and construction of the spacecraftand the instrumentation are given in references 1 and 13.
EXPERIMENT AND MEASUREMENTS
The spacecraft was launched into a precise ballistic trajectory along the NASAWallops Station test range by a three-stage Scout launch vehicle which separated fromthe spacecraft before reentry. The spacecraft reentered near Bermuda at a flight-path
lOangle of about -21i with reference to the horizon. Basic trajectory data were obtained
by radar tracking> and atmospheric data were measured with sonde payloads carried byhigh-altitude sonde balloons and Areas rockets. For the data presented in this paper,the specific altitudes and the corresponding free-stream conditions are listed in table 1.
Body motions during reentry were deduced from the measurements made withseven linear accelerometers and six rate gyros in the spacecraft. The angle^of-attackanalysis (methods and attitude histories) is documented in reference 2. This preferencewas the source of angle-of-attack information for the heating analysis of the presentpaper.
Temperature data were obtained from four thermocouples spaced through theberyllium skin at each of the 20 thermal-sensor locations shown in figure 1. The thermalanalysis and experimental heating rates are presented in reference 5.
Surface pressures were measured at 13 locations on the spacecraft. Measurementsfrom the most-forward locations were used in reference 4 in calculations of the tip radius
L = 396.2 em (l56.0 in)
z^-.251+ c r a C . l in.)i n i t i a l R w
Thermal sensor's
0 = 0 °
tf69.3 cm 0
(27.3 in) 90
180<
Ray
<t> = 0°
0 = 180°
x/L of thermal sensors
.103 .199 .256 .333.333
.380 A68A68
• 5M> .635.635
.700!
.776
.776• 853 .923
.923
Figure 1.- Spacecraft configuration and location of thermal sensors.

TABLE 1.- FREE-STREAM CONDITIONS
Altitude
km
36.5832.9227.4326.8226.2125.6024.9924.3823.7723.1622.8622.5621.9521.3420.7320.1219.8119.5118.9018.29
ft
120 000108 00090 00088 00086 00084 00082 00080 00078 00076 00075 00074 00072 00070 00068 00066 00065 00064 00062 00060 000
M*,
19.2519.6320.0820.0620.0420.0219.9919.9719.9419.9119.8919.9019.9219.9419.9619.9719.9719.9719.9619.95
Uoo
km/sec
6.0306.0266.0015.9955.9895.9825.9745.9655.9555.9445.9385.9325.9185.9035.8865.8685.8575.8465.8235.797
ft/sec
19 78519 76919 68719 67019 64819 62719 59919 57119 53819 502194821946219 41619 36719 31019 25119 21519 17919 10519 019
TOO
K
243234222222222222221221221221221220219217216214213213211209
°R
438421399399399399398398398398398397394391388385384384380377
P=0
N/m2
468790178419572148235725902845312334283592376641374549499855025779606166827370
lb/ft2
9.7716.5037.2640.8844.8749.2354.1059.4265.2371.6075.0278.6686.4195.00104.39114.91120.69126.58139.56153.92
NRe,~
per km
2.598 X 10⁹
4.69111.60412.71313.96315.35116.88918.53620.28222.20423.23424.46127.26330.20633.33337.09939.21941.49945.93151.377
per ft
0.792 X 10⁶
1.4303.5373.8754.2564.6795.1485.6506.1826.7687.0827.4568.3109.20710.16011.30811.95412.64914.00015.660
of the graphite nose during entry. The results, though not definitive, agree best with thelowest (smallest radii) of the three histories of nose tip radius shown in reference 1.This nose tip history was used for the calculation made by the methods of references 6and 7 in the present paper.
ANALYSIS
Heating-Rate Prediction Methods
Laminar flow.- The values which are compared with the laminar heating data arederived from a locally similar boundary-layer solution that includes the effects of equi-librium air and variable entropy (ref. 6) and from two approximate techniques (ref. 8),one based on sharp-cone properties and the other on blunt-body (normal-shock entropy)properties.

Turbulent flow.- The values compared with the experimental turbulent heating data
are derived from a solution based on the integral momentum jequation with ̂ variable _entropy and equilibrium air effects (ref. 7) and from four flat-plate methods based onsharp-cone properties. The skin-friction values from these turbulent methods arerelated to the heating rate by a Reynolds analogy. For the flat-plate methods, severalvirtual origins of the turbulent boundary layer were investigated.
The flat-plate methods which use the skin-friction laws of Van Driest II (ref. 9),Spalding-Chi (ref. 10), Schultz-Grunow with Eckert's reference enthalpy (ref. 11), andthe PrM method (ref. 12) are widely known. However, the calculations by thesemethods for the Reentry F conditions require modification of certain parameters. Inassessing the accuracy of the methods for the Reentry F conditions, the modificationsused herein should be noted.
In reference 9 the exponent w in the viscosity-temperature relation was assumedto be a constant. Since it is a function of the ratio of wall to edge temperature, u> iscomputed in the present paper from
T + 198.6In
3 Tw + 198.6" = 2 + T... (1)
where the temperatures are in °R. The Spalding-Chi method (ref. 10) is evaluatedherein by the curve fit given in reference 14 with equilibrium air effects included inthe FC and FT, Q functions. In the Fc function, the density at any point in the
boundary layer is computed with the local pressure and an enthalpy distribution deter-mined from a Crocco-type profile. The Fc and F^ „ functions are computed hereinfrom
d (u/ue
-2
(2)
FR,0=Ur i-^r <3>-0.702/u \0.772
The adiabatic-wall enthalpy is based on a recovery factor equal to 0.89. The Schultz-Grunow method is related to compressible flow by equations (3), (5), and (9) of refer-ence 11. A detailed discussion of the PrMr method is given in reference 15, and the
8
procedure for computing the flow properties is presented in reference 16. Some of theequations given in the discussion of the individual subroutines (ref. 16) are not correct,and the FORTRAN statements should be used.
Reynolds analogy.- Heating rates for the turbulent-flow cases are computed byrelating the skin friction to the heating rates. Except for the P_M r method, which usesthe relation
- -°'645
the other skin-friction equations are related to the Stanton number through the ColburnReynolds analogy (ref. 17),
N =^N -0-667 (S)WSt 2 Pr W
or the Von Karman Reynolds analogy (ref. 18),
5N +llVl
(6)
where C, . represents the local incompressible skin-friction coefficient. For the
present calculations, Npr equals 0.71. It is recognized that there is published exper-imental information on the Reynolds analogy factor (e.g., ref. 19). However, there isnot a definitive value for the Reynolds analogy factor at Me = 14.6 and Tw/Tg ~ 0.1.Therefore, the factors in equations (4) to (6) were used.
Geometric Correction
With laminar or turbulent flow from the tip of a sharp cone, the transformation ofthe local skin friction (or Stanton number) on the cone to that on a flat plate is well estab-lished. For turbulent flow originating at a point downstream of the tip, the effect of"truncating" the cone is computed from equation (B4) of reference 20, and the effect iscomputed for each virtual origin used. The parameter n which is required in equa-tion (B4) was computed from
n _ (^O^xa - 1-5)(16glONRe.».i " 2'3686) (7)
0.8686 log^N- _ . - 2.435
Equation (7) is the corrected version of equation (21) of reference 21. The incompres-sible plane Reynolds numbers NT,- „ • for thejurbulent flat^plate methods previously
-=-- '- ~^^~ ~^~- ~~ " " X\CmH*l
discussed are-N 2
,-1A BA ' 2 A
B
(NRe,x,i)VDKfcH 1/2
(I*)2 + X12j
/T \ W
y - i „ 2/Tw\2 e T,
NRe,x
where
A2= 2M
Tw/Te
B = -1
FR,xNRe,x (9)
where
R.0R,x
(NRe,x,i) NS-G Re,x (10)
(NRe,x,i), N.2 Re,x(11)
RESULTS AND DISCUSSION
Angle -of -Attack Effects
During the entry period, at altitudes from about 34 km (111 000 ft) to about 27 km(89 000 ft) the trim angle of attack of the spacecraft was small (~ -0.1°) with the primary
10
thermocouple ray, 4> = 0°, on the windward side. As altitude decreased further the0 = 0 ° ray shifted rather abruptly to the leeward side of the body, and the trim angle ofattack increased steadily to a value of +0.7° at an altitude of 21 km (69 000 ft). Thisangle of attack and orientation remained essentially constant to 18 km (60 000 ft), theend of the data period. (See ref. 2 for details of the body motions.)
For the Reentry F cone angle and flight conditions, relations for the effect of angleof attack on the windward and leeward rays were determined from laminar and turbulentheating rates computed by the flat -plate methods used herein, for ±1 angle of attack,sharp -cone conditions, and the tangent cone concept. The relations determined withthese assumptions gave
r-^-= 1 ± 0.175a (12)q«=o
for laminar flow and
— — = l ± 0 . 2 5 a . (13)
for turbulent flow, where a is in degrees.
For laminar heating, experimental values of cu=o°/<l<f>=i «o° were obtained at
altitudes above about 24 km (80 000 ft) and are shown in figure 2. At lower altitudes theheating was no longer laminar at any measurement station on the $ = 180° ray. Thehistory of angle of attack a in the thermal measurement plane of <£ = 0° and 180° isshown in the lower part of figure 2. (Because the angle of sideslip was small throughoutthe reentry, its effects on heating rates were neglected.) As discussed in reference 1,the thermal effect of individual oscillations in or was too small to be detected in theexperimental heating rates. A curve of the mean angle of attack has, therefore, beenfaired through the oscillatory a history obtained from reference 2. Although the meanangle -of -attack values are very small, their effect is apparent in the experimental heating-rate ratios. In figure 2, the experimental ratios are within about 15 percent of the valuespredicted by equation (12). However, at altitudes below about 31 km (102 000 ft) the datafor the forward stations indicate a stronger influence of angle of attack on the heating thanpredicted by equation (12).
The laminar heating data obtained at lower altitudes where angles of attack werelarger is also in disagreement with equation (12). Below about 24 km (80 000 ft),
11

oOCO
H* u
•cr
2-t*.O
oO
«cr1.0
x/L
O -333D A68
O .635 iA .776 jA .923 :!
°A '"'
O
X- Eq. (12)and mean a
O
Qfl<D
.8«-
Ar-
0
-A
-.8
Faired mean
From ref. 2
Time, sec
38 26 2234- 30
Alt i tude, km
Figure 2.- Effect of angle of attack on laminar heating.
laminar heating rates at the forward stations on the primary thermocouple ray (leewardside) decreased much more with increasing angle of attack than could be accounted forby equation (12). Heating calculations based on tangent-cone concepts, including variable-entropy local conditions for various degrees of nose bluntness, and calculations includingthe influence of mass addition from the graphite nose tip indicated that these effectscould not account for the low magnitude of the leeward-side laminar heating. However,a set of unpublished wind-tunnel data obtained by P. Calvin Stainback in the LangleyMach 8 variable-density tunnel for the Reentry F configuration showed that the combined
12

effects of nose bluntness and angle of attack result in substantially greater reductions ofleeward-side laminar heating on a slender cone than are computed by tangent-cone theory.The data were obtained at M^ = 7.8, NRg ^ = 3.2 x 10⁶ per meter (1 X 10⁶ per foot),
and TW/TS = 0.4. For the flight angles of attack and representative normalized wettedlengths x/Rjy, the reductions measured in the ground facility were similar to those indi-cated by the flight data.
Experimental values of ^-(jwardAleeward for turbulent flow were determinedat altitudes below 26.21 km (86 000 ft) and are plotted against local angle of attack infigure 3. Ratios of peak heating on the secondary ray to peak heating on the primary rayare shown, and at altitudes where peak heating was sufficiently far forward, ratios of theheating on the opposite rays at locations 0.064L, 0.140L, and 0.192L aft of peak heatingare also shown. The location of peak heating and the pertinent heating rates were deter-mined from fairings of the heating distributions along the primary and secondary thermo-couple rays for each altitude. Typical fairings are shown in figure 4. It should be notedthat the ratios of figure 3 do not relate to diametrically opposite points on the body sincethe beginning of transition and the location of peak heating were always farther forwardon the windward side of the body. Because of thermal distortion the local angle of attackvaried along the body, and the local angle of attack at which each ratio is plotted in
2.0-1—
1.5
0)
0)0)(-H
•o-
a*
•O"
1.0
.5
fflSyfto-tP**
O Peak heating location
D ,06k L aft of peak heating
O .1^-OL aft of peak heating
A .192L aft of peak heating
I I
.2 .6 .8 l.O
Local ang le of a t t ack , deg
Figure Effect of angle of attack on turbulent heating at altitudesfrom 26.21 to 19-81 km (86 000 to 65 000 f t ) .
13

xlO'
•cr
0.2 .6 .8
xA(a) 0 = 0 ° ray.
A l t i t u d e ,k m ( f t )
19.81 (65 000)
21.3^ (70 000)
22.86 (75 000)
2»f.38 (80000)
1.0 .2I.6
x/L
Al t i tude,km ( f t )
19.81 (65 ooo)
(70 000)
0 22.86 (75 000)
2M-.38 (80 000)
(b)
.8 1.0
= l80 ray.
Figure k.- Typical faired heating distributions.

figure 3 is the mean value for the two body stations involved. Since the two body stationswere always within 0.140L of each other, the local angles of the two stations were onlyslightly different.
The experimental ratios in figure 3 show a smaller influence of angle of attack onheating rates than predicted by use of equation (13) and indicate that a relation
—— =l±0 .15a (14)
would represent the mean of the flight results better than equation (13). It may be notedthat unpublished turbulent data obtained in the previously mentioned Mach 8 tunnel testsshowed an angle-of-attack effect similar to equation (14). In this paper, however, equa-tion (13) has been used to adjust the measured turbulent heating rates to values at zeroangle of attack for comparison with results of the turbulent methods. Since the purposeof this paper is to develop reliable prediction methods for the design of advanced vehicles,it would be reasonable to establish the applicability of the tangent-cone correction.Certainly at small angles of attack and for parametric or preliminary design studies,this approach would be more useful. For final design calculations or large angles ofattack, a wind-tunnel investigation should be conducted to obtain a more reliable correc-tion value. If equation (14) had been used, the turbulent Stanton numbers presented laterwould have been slightly lower, the greatest change being 7.5 percent and occurring at thelowest altitudes (i.e., the largest angles of attack).
Laminar Heating Data
The experimental laminar heat-transfer data at altitudes of 36.57,. 32.92, 27.43,and 21.34 km (120 000, 108 000, 90 000, and 70 000 ft) are compared in figure 5 withresults from the sharp-cone method of reference 8. In addition, representative 0° angle-of-attack results obtained by the method of reference 6 are shown in figures 5(a), 5(c),and 5(d), and results obtained by the blunt-body (normal-shock entropy) method of refer-ence 8 are shown in figure 5(c).
As previously noted, the angle of attack was very small at altitudes down to 27 km(89 000 ft). Consequently, no angle-of-attack corrections are included for the resultsshown in figures 5(a) to 5(c). The laminar data from the diametrically opposite locationson the primary and secondary rays indicate the small magnitude of the angle-of-attackeffect. At the lower altitude of 21.34 km (70 000 ft), figure 5(d), the trim angle of attackat the center-of-gravity station was 0.68° (ref. 2), and including the thermal distortion(ref. 3) the local angle of attack at the most forward measuring station was 0.92°. Thepreviously mentioned unpublished experimental results at Mach 8 provide an angle-of-
15

ioo r
50
•25
0
250
200
150
100
50
o
(a) 36.57km (120 000ft).I i
O
Ref .8 - Blunt cone
(c) 27.43 km (90 000 ft).
0.2 0.8 1.0
O
(b) 32.92 km (108 000 ft) .1 I
O * = 0°n $ = 180° '0 0 = 0 ° (corrected to 0" angle of attack)
Ref. 8 - Sharp cone
Ref.6 - , -Var iab le entropy
(d) 21.3,4 km (70 000 ft).
0.2 O.»t 0.6OA 0.6
x/L x/L
Figure 5.- .Comparisons of laminar data with results of prediction methods.
0.8 1.0

attack correction for laminar heating. Using those results yields the "effective" 0° angle-of-attack heating rates shown by the filled circles in figure 5(d).
In figure 5 the sharp-cone results (ref. 8) are approximately 20 percent lower thanthe laminar data. (In fig. 5(d) the calculations are compared with the filled circles.) Thevariable-entropy technique (ref. 6) yields results 10 to 15 percent lower than the data andabout 10 percent higher than the sharp-cone calculations. The approximate blunt-conesolution of reference 8 is computed only at 27.43 km (90 000 ft), figure 5(c). Above thisaltitude the flow over the vehicle is mainly sharp cone (ref. 1), and below this altitude theangle of attack diverges as previously noted. The blunt-cone calculations underpredictthe measured data by approximately 30 percent for the body stations which are approxi-mately 100 or more nose radii downstream of the nose tip.
Turbulent Heating Data
In figures 6(a) to 6(e) the turbulent experimental heating data at 24.38, 22.86,21.34, 19.81, and 18.29 km (80 000, 75 000, 70 000, 65 000, and 60 000 ft) are comparedwith the representative 0° angle-of-attack results of reference 7 and results of the flat-plate methods discussed herein. The data are modified to an equivalent 0° angle-of-attack condition by use of equation (13), with the negative sign because the primary rayheating data are measured on the leeward side in this altitude range.
The results of the integral momentum method are given with the Reynolds numberbased on the local momentum thickness and with a Reynolds analogy factor of 1.0 as com-puted in reference 7. The flat-plate methods related to cone conditions by equation (B4)of reference 20 are based on the wetted distance from the transition location and on theColburn Reynolds analogy. The results of the integral method are approximately 10 to15 percent lower than the experimental data. The integral method agrees the best withthe Van Driest n method. The best comparison with the experimental data shown in fig-ure 6 was obtained with the Schultz-Grunow method, while the poorest comparison withthe data was obtained with the Pr/^r method.
In figure 6 the wetted distance from the experimentally determined transition point(ref. 22) was the effective length of the turbulent boundary layer. In reference 20 thelength from the peak heating point gave the best correlation of a large amount of turbulentheating data, and in reference 11 the distance from the sharp tip was used as the effectivelength to correlate representative flight data. However, it should be noted that for mostof the data utilized in reference 11, the boundary layer was turbulent along most of themodel.
For a comparison of effective lengths using the Reentry F data, the experimentalturbulent heating data from 24.38 to 18.29 km (80 000 to 60 000 ft) at 0.61-km (2000-ft)
17

600 r
200 -(b) 22.86 km (75 000 ft).
1 : _J L. J I
600
200 -
O o.2 O
, (c) 21.34 km (70 000 ft).L_N;—i 1 1
o o
(d) 19.81 km (65000ft).I I 1
0.6 0.7 0.8 0.9 1.0
x/L
800
«= 600
IfOO
(e) 18.29 km (60 000 ft).
Q O O OExperimental data referred to0° angle of attack by eq. (13)
Ref. 7 (Reynolds analogy = 1.0)
Schultz-Grunow (reference enthalpy)
Van Driest II
Spalding-Chi
Reyno1ds
analogy =
_L0.6 0.9 1.00.7 0.8
x/L . .
Figure 6.- Comparisons of turbulent data with results of prediction methods.
intervals are plotted in terras of the Stanton number as a function of the Reynolds numberin figure 7. The effective Reynolds number length is the distance from the peak heatingpoint, the transition location, and the sharp tip in figures 7(a) to 7(c), respectively. Allthe properties are sharp-cone conditions, and the experimental Stanton numbers arereduced to equivalent flat-plate, 0° angle-of-attack data by equation (B4) of reference 20and equation (13) of the present paper. Local flow conditions presented in reference 1,which were computed for 0° angle-of-attack conditions by the variable-entropy methodsof references 6 and 7, indicated that local conditions at all turbulent measurement stationswere essentially sharp-cone values even for nose radii much larger than those deduced inreference 4 from the experimental surf ace-pressure data.
18

"St
r10-3
Schu1tz-Grunow
Van Driest ITi
Spalding-Chi;
10-If
10s"
J I
x/L
o 0.925D 0.851+
A 0.776
O 0.7
A 0.635Reynolds analogy
Col burn
Von Karraan
10CI I
10"
10-3
'St
10-if
(a) NT, based on distance from peak heating location.
Schu1tz-Grunow
Van Driest IISpalding-Chi
P M-*r r
10
(b)
l^nRe,x
based on distance from transition location.
Figure 7.- Effect of virtual origin on comparison of turbulentexperimental data and correlation methods.
J I
10X
19

I f X l O "
St 2
10'
Schultz-GrunowVan Driest IXSpal d i ng-Ch i
icr 10'
Re,x
(c) NT. based on distance from sharp tip.
Figure 7.- Concluded.
In figure 7, a least-squares curve fit was computed for each set of data. Based onthese calculations, the root-mean-square errors for the data in figures 7(a) to 7(c) were3.93, 2.79, and 2.58 percent, respectively. It is noted that while the root-mean-squareerror for each data set is small, the least spread of the data about their mean line wascomputed for the Reynolds number based on the distance from the sharp tip. However,for this condition all the flat-plate methods used herein underpredict the experimentalStanton numbers (fig. 7(c)). If the Reynolds number is based on the distance from thetransition location (fig. 7(b)), the Schultz-Grunow skin-friction relation with referenceenthalpy properties and the Colburn Reynolds analogy predicts the experimental data thebest (within ±10 percent). With the Reynolds number based on distance from the peakheating point (fig. 7(a)) and considering only Reynolds numbers greater than 10 ,̂ the bestprediction of the experimental Stanton numbers (within -15 and +5 percent) was obtainedwith the Van Driest II skin-friction law and the Colburn Reynolds analogy. For the sameconditions, the Spalding-Chi skin-friction law underpredicts the data by 10 to 20 percent.Also in figure 7(a), the Spalding-Chi skin-friction law with the Von Karman Reynoldsanalogy is compared with the data. These results are presented because the investigationof reference 20 found this technique to compare best with existing data. Results of the
20
method are shown to be approximately 25 percent lower than the Reentry F data. Forany selection of a virtual origin, the results of the PrMr method gave very poor agree-ment with the data.
For design calculations, the major disadvantage of the correlations of figures 7(a)and 7(b) and figure 6 is that prior knowledge of the peak heating or transition location isrequired. There are presently no satisfactory methods for predicting these locations.
Transition Heating Data
The extent of the transition region and the level of the heating distribution thereinis important since heating in this region could be a critical factor in design of futurelong, slender reentry vehicles. Experimental transition-zone Reynolds numbers^ANjj = NR . - NT, v he ) obtained over a wide range of conditions are plotted
in figure 8 as a function of the Reynolds number at the beginning of transition. In additionto the Reentry F transition results from reference 22, experimental data are alsoobtained from references 23 to 31 for both ground and flight tests on sharp or slightlyblunted cones. If the transition Reynolds number is known, then the Reynolds numberchange over the transition region (and thus the Reynolds number at the end of transition)can be approximated for near sharp-cone conditions from this figure. The Reentry Fdata represented by the circles are for a range of 26.82 to 21.34 km (88 000 to 70 000 ft).The break (to the left and up) in the Reentry F data that occurred at 24.38 km (80 000 ft)is attributed to the increasing influence of tip blunting and angle of attack.
With the beginning and end of transition known, the transition-zone heating can beapproximated, for example, by the method given in reference 32. This technique doesnot lend itself to hand calculations. A simpler equation based on hyperbolic tangentfunctions is given in reference 7. This equation gives a heating distribution in the transi-tion region similar to the characteristic S-shape of flight and ground test data. Thedegree of nonlinearity of the equation in reference 7 is controlled by the tanh i// func-tion, which for 4> = 2.0 gives good agreement with transition-zone heating distributionsobtained in ground tests. The Reentry F heating rates in the transition region (ref. 22),while basically S-shaped, have a different degree of nonlinearity than those reported inthe ground tests of reference 7. Rather than change the degree of nonlinearity of theexpression in reference 7, a new expression was developed.
The new equation based on the form of the equations given in references 7 and 32was derived and is compared in figure 9 with the transition-zone heating data from26.82 to 21.34 km (88 000 to 70 000 ft); The equation is given as
Itr 1 -X - X be g )
:end " xbeg/_(15)
21

CO,
The value of qlam is the predicted laminar heating rate at the beginning of transition/x. \ and q is the predicted heating rate atthe^peak heating point (xen<jV. The value
of q should be predicted with the Reynolds number based on the beginning of transition.
For these calculations, all the quantities were based on experimentally measured values.
Most of the experimental data shown in figure 9 agree within ±25 percent with theresults from equation (15). The data are lower than the predictions for altitudes above24.38 km (80 000 ft) and are higher than the predictions for altitudes below 24.38 km(80 000 ft).
10° —
ANRe,:
10'
icr
Ref.
— O 22 (Reent ry F)
D 23
0 2VA 25
- • ' A 2 6
a 27Q 28
0 290 30
6 31
ooO
Q1 I I I
\
O
8O
OO
0O
A A
4s A
i db . \
i i i i 110' 10C
N R e , x , b e g
Figure 8.- Reynolds number change over transition region as afunction of transition Reynolds number.
22

Data Eq. (15)
O
1+00
300 -
<DI.
•cr200 -
100 ~
A 11 i tude ,
k m ( f t )
26.82 (88 000)
25.60 (8V 000)
2V.99 (82 000)
O 2V.38 (80 000)
ft 23.77 (78 ooo)
DA
O 23.16 (76 000)
22.56 (7V 000)
21.3V (70 000)
_L I
0 0.2 O.V 0.6
xA
0.8 1.0
Figure 9.- ' Comparison of experimental transition heating dataand correlation equation.
CONCLUSIONS
Laminar and turbulent heat -transfer data measured during a reentry flight at aMach number of 20 on a 5° half -angle cone 3.962 m (13 ft) long have been comparedwith existing prediction methods. Particular attention was given to the applicability ofseveral flat -plate turbulent correlations at the high local Mach number, high enthalpy,and low ratio of wall to total temperature of the experiment. The local healing rates inthe transition region were also analyzed.

The major conclusions from the analysis are as follows:
and-angle olaminar sharp -cone predictions are approximately 20 percent lower than the data. Theboundary -layer solutions including variable -entropy edge conditions are 10 to 15 percentlower than the data and about 10 percent higher than the sharp-cone predictions.
2. The experimental values of turbulent Stanton number as a function of the Reynoldsnumber based on sharp -cone conditions have the least spread about a mean line when theReynolds number is based on the distance from the sharp tip.
3. The experimental values of Stanton number as a function of the Reynolds numberbased on the distance from peak heating or transition locations also have a small spread(less than 4 percent) about their respective mean lines.
4. All the flat -plate methods underpredict the experimental Stanton numbers withthe Reynolds number based on distance from the sharp tip. When the Reynolds numberis based on distance from the transition location, the Schultz-Grunow skin -friction equa-tion based on Eckert!s reference enthalpy conditions and with the Colburn Reynoldsanalogy predicts the experimental Stanton numbers the best. The experimental Stantonnumbers are best predicted by the Van Driest II skin-friction equation and the ColburnReynolds analogy when the Reynolds number is based on distance from the peak heatingpoint.
5. The change in Reynolds number over the transition region correlates with thetransition Reynolds number for experimental cone data from flight (including Reentry F)and ground tests.
6. A simple correlation equation based on a comparison of the Reentry F transition-zone heating data has been formulated.
7. The influence of angle of attack on the ratio of windward-ray to leeward-rayheating is greater for laminar flow and less for turbulent flow than is predicted by simpletangent-cone concepts.
Langley Research Center,National Aeronautics and Space Administration,
Hampton, Va., August 31, 1971.
24

REFERENCES
1. Rumsey, Charles B.; Carter, Howard S.; Hastings, Earl C., Jr.; Raper, James L.;and Zoby, Ernest V.: Initial Results From Flight Measurements of TurbulentHeat Transfer and Boundary-Layer Transition at Local Mach Numbers Near 15(Reentry F). NASA TM X-1856, 1969.
2. Woodbury, Gerard E.; and Morris, W. Douglas: Angle-of-Attack Analysis of aSpinning Slender Cone With Slight Aerodynamic and Mass Asymmetries (Reentry F).NASA TN D-5948, 1970.
3. Alley, Vernon L., Jr.; and Guillotte, Robert J.: Postflight Analysis of ThermalDistortions of the Reentry F Spacecraft. NASA TM X-2250, 1971.
4. Dillon, James L.: Analysis of Surface Pressure on a 5° Cone in Free Flight NearMach 20 (Reentry F). NASA TM X-2210, 1971.
5. Howard, Floyd G.: Thermal Analysis Methods and Basic Heat-Transfer Data for aTurbulent Heating Flight Experiment at Mach 20 (Reentry F). NASA TM X-2282,1971.
6. Stainback, P. Calvin (With appendix by P. Calvin Stainback and Kathleen C. Wicker):Effect of Unit Reynolds Number, Nose Bluntness, Angle of Attack, and Roughnesson Transition on a 5° Half-Angle Cone at Mach 8. NASA TN D-4961, 1969.
7. Johnson, Charles B.,; and Boney, Lillian R.: A Simple Integral Method for the Calcu-lation of Real-Gas Turbulent Bpundary Layers With Variable Edge Entropy. NASATN D-6217, 1971.
8. Zoby, Ernest V.: Approximate Relations for Laminar Heat-Transfer and Shear-Stress Functions in Equilibrium Dissociated Air. NASA TN D-4484, 1968.
9. Van Driest, E. R.: The Problem of Aerodynamic Heating. Aeronaut. Eng. Rev.,vol. 15, no. 10, Oct. 1956, pp. 26-41.
10. Spalding, D. B.; and Chi, S. W.: The Drag of a Compressible Turbulent BoundaryLayer on a Smooth Flat Plate With and Without Heat Transfer. J. Fluid Mech.,vol. 18, pt. 1, Jan. 1964, pp. 117-143.
11. Zoby, Ernest V.; and Sullivan, Edward M.: Correlation of Free-Flight TurbulentHeat-Transfer Data From Axisymmetric Bodies With Compressible Flat-PlateRelationships. NASA TN D-3802, 1967.
12. Hanks, R. A.; and Savage, R. T.: Recoverable Launch Vehicle Thermal Design WithConsideration of Arbitrary Wall Temperature. Doc. No. D2-90770-1 (ContractNAS 8-11321), Boeing Co., Aug. 1965. (Also available as NASA CR-74714.)
25
13. Carter, Howard S.; Raper, James L.; Hinson, William F.; and Morris, W. Douglas:— -Basic-Measurements-From-a-Turbulent-Heating-Flight"Experiment;-on-a-5~Half--
Angle Cone at Mach 20 (Reentry F). NASA TM X-2308, 1971.
14. Komar, J. J.: Improved Turbulent Skin-Friction Coefficient Predictions Utilizingthe Spalding-Chi Method. Rep. DAC-59801, Missile & Space Syst. Div., DouglasAircraft Co., Inc., Nov. 1966.
15. Savage, R. T.; and Jaeck, C. L.: Investigation of Turbulent Heat Transfer at Hyper-sonic Speeds - Analytical Methods. AFFDL-TR-67-144, Vol. I, U.S. Air Force,Dec. 1967.
16. Savage, R. T.; Jaeck, C. L.; and Mitchell, J. R.: Investigation of Turbulent HeatTransfer at Hypersonic Speeds - The Laminar-Turbulent PrMr MomentumIntegral and Turbulent Nonsimilar Boundary Layer Computer Programs.AFFDL-TR-67-144, Vol. m, U.S. Air Force, Dec. 1967.
17. Colburn, Allan P.: A Method of Correlating Forced Convection Heat Transfer Dataand a Comparison With Fluid Friction. Trans. Amer. Inst. Chem. Eng.,vol. XXIX, 1933, pp. 174-211.
18. Von Karman, Th.: The Analogy Between Fluid Friction and Heat Transfer. ASMETrans., vol. 61, no. 8, Nov. 1939, pp. 705-710.
19. Gary, Aubrey M., Jr.: Summary of Available Information on Reynolds Analogy forZero-Pressure-Gradient, Compressible, Turbulent-Boundary-Layer Flow. NASATN D-5560, 1970.
20. Bertram, Mitchel H.; and Neal, Luther, Jr.: Recent Experiments in HypersonicTurbulent Boundary Layers. Presented at the AGARD Specialists Meeting onRecent Developments in Boundary-Layer Research (Naples, Italy), May 1965.(Also available as NASA TM X-56335.)
21. Bertram, Mitchel H.: Calculations of Compressible Average Turbulent Skin Friction.NASA TR R-123, 1962.
22. Wright, Robert L.; and Zoby, Ernest V.: Flight Measurements of Boundary-LayerTransition on a 5° Half-Angle Cone at a Free-Stream Mach Number of 20(Reentry F). NASA TM X-2253, 1971.
23. Rumsey, Charles B.; and Lee, Dorothy B.: Measurements of Aerodynamic HeatTransfer and Boundary-Layer Transition on a 15° Cone in Free Flight at Super-sonic Mach Numbers up to 5.2. NASA TN D-888, 1961.
24. Julius, Jerome D.: Measurements of Pressure and Local Heat Transfer on a 20° Coneat Angles of Attack up to 20° for a Mach Number of 4.95. NASA TN D-179, 1959.
26

25. Fischer, Michael C.: An Experimental Investigation of Boundary-Layer Transitionon a 10° Half-Angle Cone at Mach 6.9. NASA TN D-5766, 1970.
26. Merlet, Charles F.; and Rumsey, Charles B.: Supersonic Free-Flight Measurementof Heat Transfer and Transition on a 10° Cone Having a Low Temperature Ratio.NASA TN D-951, 1961.
27. Rumsey, Charles B.; and Lee, Dorothy B.: Measurements of Aerodynamic HeatTransfer and Boundary-Layer Transition on a 10° Cone in Free Flight at Super-sonic Mach Numbers up to 5.9. NASA TN D-745, 1961.
28. Burbank, Paige B.; and Hodge, B. Leon: Distribution of Heat Transfer on a 10° Coneat Angles of Attack From 0° to 15° for Mach Numbers of 2.49 to 4.65 and a Solutionto the Heat-Transfer Equation That Permits Complete Machine Calculations.NASA MEMO 6-4-59L, 1959.
29. Rumsey, Charles B.; and Lee, Dorothy B.: Measurements of Aerodynamic HeatTransfer on a 15° Cone-Cylinder-Flare Configuration in Free Flight at MachNumbers up to 4.7. NASA TN D-824, 1961.
30. Softley, E. J.; Graber, B. C.; and Zempel, R. E.: Transition of the HypersonicBoundary Layer on a Cone: Part I - Experiments at M^ = 12 and 15. Tech.Informa. Ser. No. R67SD39 (Contract AF 04(694)-772), Missile Space Div., Gen.Elec. Co., Nov. 1967. (Available from DDC as AD 824681.)
31. Martellucci, A.; Neff, R. S.; and True, W. H., IE: An Experimental Investigation ofBoundary Layer Transition on a Cone at Angle of Attack. SAMSO TR 69-383,U.S. Air Force, Sept. 1969. (Available from DDC as AD 864 331-L.)
32. Harris, Julius E.: Numerical Solution of the Equations for Compressible Laminar,Transitional, and Turbulent Boundary Layers and Comparisons With ExperimentalData. NASA TR R-368, 1971.
NASA-Langley, 1971 33 L-7803 Jfl^^^^^^^^^^HP 27

"The aeronautical and space activities of the United States shall beconducted so as to contribute . . . to the expansion of human knowl-edge of phenomena in the atmosphere and space. The Administrationshall provide for the widest practicable and appropriate disseminationof information concerning its activities and the results thereof,"
—NATIONAL AERONAUTICS AND SPACE ACT OF 1958
NASA SCIENTIFIC AND TECHNICAL PUBLICATIONS
TECHNICAL REPORTS: Scientific and technical information consideredimportant, complete, and a lasting contribution to existing knowledge.
TECHNICAL NOTES: Information less broad in scope but nevertheless ofimportance as a contribution to existing knowledge.
TECHNICAL MEMORANDUMS: Information receiving limited distribu-tion because of preliminary data, security classification, or other reasons.
CONTRACTOR REPORTS: Scientific and technical information generatedunder a NASA contract or grant and considered an important contribution toexisting knowledge.
TECHNICAL TRANSLATIONS: Information published in a foreignlanguage considered to merit NASA distribution in English.
SPECIAL PUBLICATIONS: Information derived from or of value to NASAactivities. Publications include conference proceedings, monographs, datacompilations, handbooks, sourcebooks, and special bibliographies.
TECHNOLOGY UTILIZATION PUBLICATIONS: Information on tech-nology used by NASA that may be of particular interest in commercial and othernon-aerospace applications. Publications include Tech Briefs, TechnologyUtilization Reports and Notes, and Technology Surveys.
Details on the availability of these publications may be obtained from:
SCIENTIFIC AND TECHNICAL INFORMATION DIVISION
NATIONAL AERONAUTICS AND SPACE ADMINISTRATION
Washington, D.C 20546

CO1. Report'
NASA TM X-23352. Government Accession No. 3. Recipient's Catalog No.
4. Title and Subtitle
ANALYSIS OF FREE-FLIGHT LAMINAR, TRANSITIONAL,AND TURBULENT HE AT-TRANSFER RESULTS AT FREE-STREAM MACH NUMBERS NEAR 20 (REENTRY F) (U)
5. Report Date
September 19716. Performing Organization Code
7. Author(s)
Ernest V. Zoby and Charles B. Rumsey8. Performing Organization Report No.
L-7803
9. Performing Organization Name and Address
NASA Langle'y Research CenterHampton, Va. 23365
10. Work Unit No.
117-07-04-0611. Contract or Grant No.
12. Sponsoring Agency Name and Address
National Aeronautics and Space AdministrationWashington, B.C. 20546
13. Type of Report and Period Covered
Technical Memorandum14. Sponsoring Agency Code
15. Supplementary Notes
16. Abstract
Laminar, transitional, and turbulent heat-transfer data were measured during a reentryflight at a Mach number of 20 on a 5° half-angle cone 3.962 m (13 ft) long with an initial noseradius of 0.254 cm (0.1 in.). The free-stream Reynolds number increased during the primedata period from 7.0 X 10⁶ to 51.5 X 10⁶ per meter (2.1 X 10⁶ to 15.7 X 10⁶ per foot) and theratio of wall to total temperature varied from 0.053 to 0.12. The angle of attack was lessthan 1 for the prime data period. The experimental laminar and turbulent heating ratesare compared with results from existing flat-plate prediction methods. A data correlationof the extent of transition and a simple empirical transition-zone heating correlation arealso presented.
CLASSIFIED m^SUBJECT TO GENERAL DECLASSIFICATIONSCHEDULE OF EXECUTIVE OBDER 11652.AUTOMATICALLY DOWNGRADED ATTWO-YEAR INTERVALS.DECLASSIFIED ON DECEMBER
17. Key Words (Suggested by Author(s))
Free flightMach 20Reentry FLaminar, transitional, and turbulent heating
data and correlations
18. Distribution Statement
fcurity Qassif. (of this report)
il
20. Security Classif. (of this page)
Unclassified21. No. of Pages
27
22. Price
This material contains information affecting the national defense of the United States
within the meaning of the espionage laws. Title 18, U.S.C., Sees. 793 and 794, the trans-
mission or revelation of which in any manner to an unauthorized-person is prohibited by law.
Restriction/Classification Cancelled


![PRIMARY PRODUCTION OFF KUWAIT, AN ARID ZONE …respectively [1]. Nearly 90% of Kuwait's 2.1 x 10⁶ population, projected to increase to 3.8 x 10⁶ by the year 2015, lives within 10-15](https://static.fdocuments.us/doc/165x107/5ed4d5537dccaa7c3b36bb7e/primary-production-off-kuwait-an-arid-zone-respectively-1-nearly-90-of-kuwaits.jpg)