UAE: The Future Is Bright For Home Appliances - Canton Fair€¦ · UAE: The Future Is Bright For...
34
UAE: The Future Is Bright For Home Appliances Trend Setter For The Gulf Countries Trend Setter For The Gulf Countries Canton Fair 16.04.2014 1 GfK Retail and Technology Middle East FZ LLC | Consumer Choices China, Guangzhou April 2014
Transcript of UAE: The Future Is Bright For Home Appliances - Canton Fair€¦ · UAE: The Future Is Bright For...
UAE: The Future Is Bright For Home AppliancesTrend Setter For The Gulf CountriesTrend Setter For The Gulf Countries
Canton Fair 16.04.2014
1
GfK Retail and Technology Middle East FZ LLC | Consumer Choices China, Guangzhou April 2014

Contents
UAE Technical Consumer Goods Performance 20131
From Traditional To Modern Trade2
Key Product Trends3
Think Green; Energy Efficiency In The UAE4
2

3

4
UAE Inside The MENA RegionPopulation / number of households & people per household
5

MENA – Estimate Of 582 MiO Inhabitants & 113 454 HH In 16 Countries Large households provide solid ground for appliances sales to flourish in the years to come
1542820506
25688
1950220000
25000
30000
Number Of Households in Ths
48751578 2183 1099 739 229
5593490 495 325
63252353
6046
0
5000
10000
15000
0TR KSA UAE IR IL JO LB BH IQ KW OM QA PK EG MA TN DZ
# Persons Per HH
46
54 4
6 6 6 6 6 6 67
45 5
6
345678
# e so s e
6
0123
TR KSA UAE IR IL JO LB BH IQ KW OM QA PK EG MA TN DZ
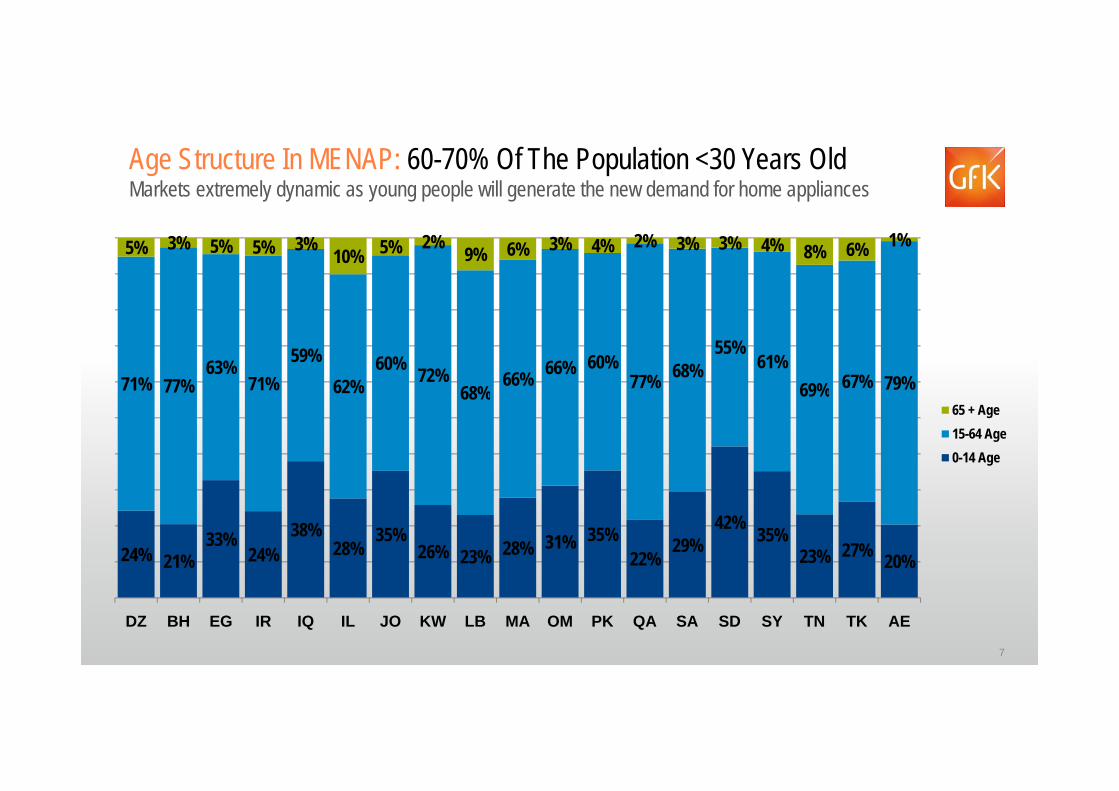
Age Structure In MENAP: 60-70% Of The Population <30 Years OldMarkets extremely dynamic as young people will generate the new demand for home appliances
5% 3% 5% 5% 3% 10% 5% 2% 9% 6% 3% 4% 2% 3% 3% 4% 8% 6% 1%
71% 77%63%
71%59%
62%60% 72%
68%66% 66% 60%
77% 68%55%
61%69% 67% 79%68% 69%
65 + Age15-64 Age0-14 Age
24% 21%33%
24%38%
28%35%
26% 23% 28% 31% 35%22%
29%42% 35%
23% 27% 20%
7
DZ BH EG IR IQ IL JO KW LB MA OM PK QA SA SD SY TN TK AE
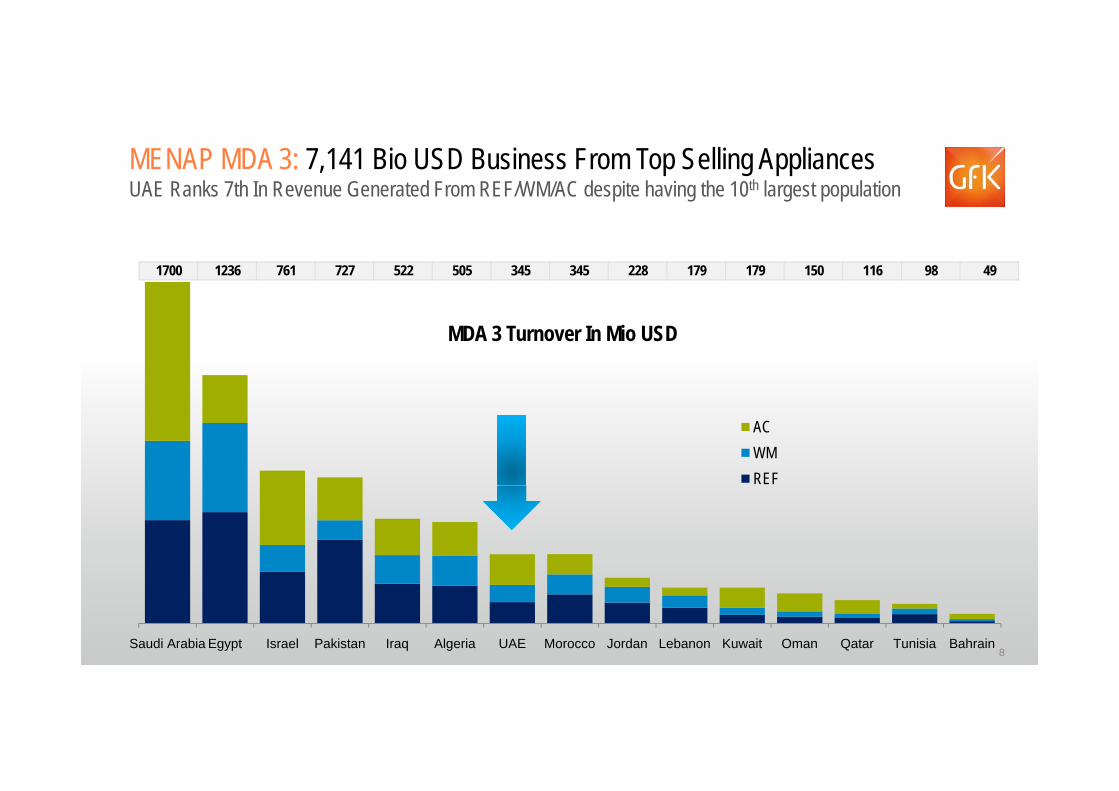
MENAP MDA 3: 7,141 Bio USD Business From Top Selling AppliancesUAE Ranks 7th In Revenue Generated From REF/WM/AC despite having the 10th largest population
1700 1236 761 727 522 505 345 345 228 179 179 150 116 98 49
MDA 3 Turnover In Mio USD
ACWMREF
8Saudi Arabia Egypt Israel Pakistan Iraq Algeria UAE Morocco Jordan Lebanon Kuwait Oman Qatar Tunisia Bahrain

How Did The Durables Market Fair In 2013?UAE Technical Consumer Goods
9

Value Contribution
UAE: Consumer Durables Market Positive In 2013Market growth of 7% reaching 3,838 Million USD!!!
FY 2012 v/s FY 2013 % Growth In ValueFY 2012 v/s FY 2013 % Growth In ValuePM (Market Value)
Jan – Dec 2013PM (Market Value)
Jan – Dec 2013SDA3% MDA
8% ACCE Photo
14%
14%
7%
White Goods
Small Domestic
TotalAC4%
OEMTG1%
CE14%
Photo5%
4%
4%
14%
IT
Air Condition (RAC)
White Goods
IT29%
OE2%
1%
0%
15%
Office Equipement
Telecom
29%Telecom
34%
7%
-6%
Photo
Consumer Electronics

UAE: Top Selling Categories For 2013Value Share by key product in UAE for the year 2013
32%32% 14%14%3%3%
14%14%
4%4%
114%4%11%11% 10%10%
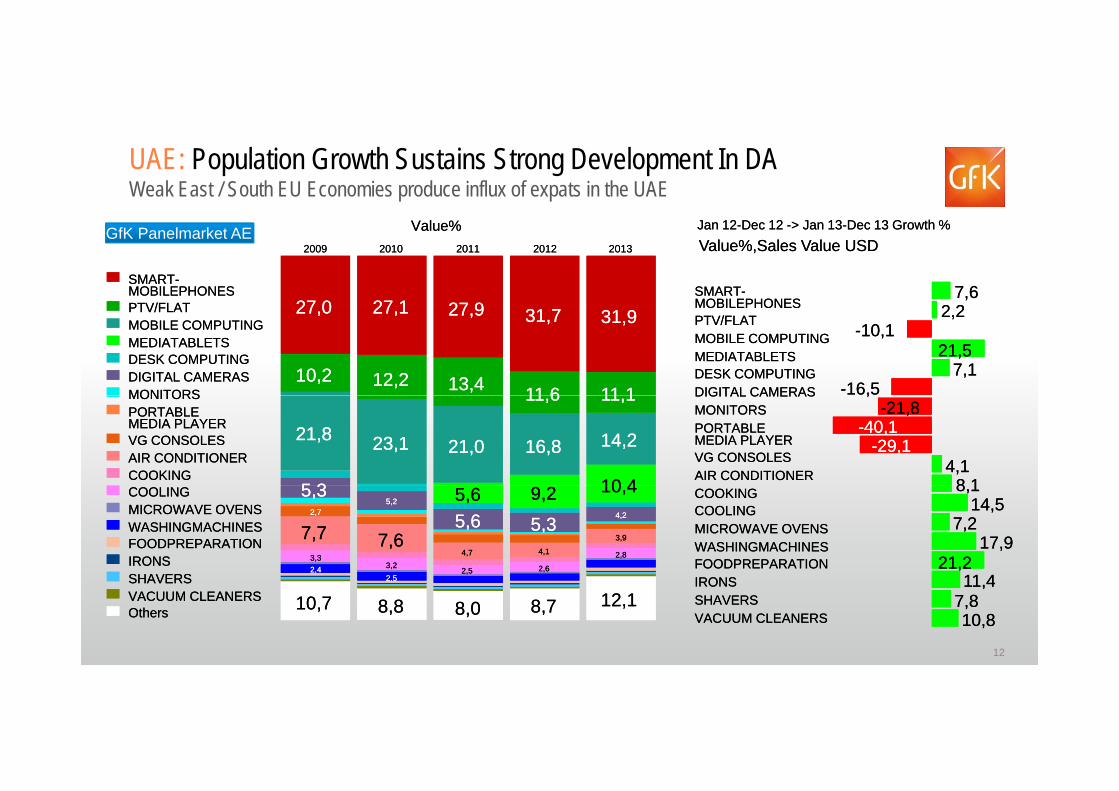
UAE: Population Growth Sustains Strong Development In DAWeak East / South EU Economies produce influx of expats in the UAE
GfK Panelmarket AE
SMART-SMART-MOBILEPHONESMOBILEPHONESPTV/FLATPTV/FLAT
20092009 20102010 20112011 20122012 20132013
Value%Value%
27 027 0 27 127 1 27 927 9
Jan 12-Dec 12 -> Jan 13-Dec 13 Growth %Jan 12-Dec 12 -> Jan 13-Dec 13 Growth %Value%,Sales Value USDValue%,Sales Value USD
7,67,62 22 2
SMART-SMART-MOBILEPHONESMOBILEPHONESPTV/FLATPTV/FLAT
MOBILE COMPUTINGMOBILE COMPUTINGMEDIATABLETSMEDIATABLETSDESK COMPUTINGDESK COMPUTINGDIGITAL CAMERASDIGITAL CAMERASMONITORSMONITORS
10,210,2
27,027,0
12,212,2
27,127,1
13,413,4
27,927,9
11 611 6
31,731,7
11 111 1
31,931,9 2,22,2-10,1-10,1
21,521,57,17,1
-16,5-16,5
MOBILEPHONESMOBILEPHONESPTV/FLATPTV/FLATMOBILE COMPUTINGMOBILE COMPUTINGMEDIATABLETSMEDIATABLETSDESK COMPUTINGDESK COMPUTINGDIGITAL CAMERASDIGITAL CAMERASMONITORSMONITORS
PORTABLEPORTABLEMEDIA PLAYERMEDIA PLAYERVG CONSOLESVG CONSOLESAIR CONDITIONERAIR CONDITIONERCOOKINGCOOKING
5 35 3
21,821,8 23,123,1 21,021,0 16,816,8
11,611,6
10 410 4
14,214,2
11,111,1 ,,-21,8-21,8
-40,1-40,1-29,1-29,1
4,14,18 18 1
DIGITAL CAMERASDIGITAL CAMERASMONITORSMONITORSPORTABLEPORTABLEMEDIA PLAYERMEDIA PLAYERVG CONSOLESVG CONSOLESAIR CONDITIONERAIR CONDITIONER
COOLINGCOOLINGMICROWAVE OVENSMICROWAVE OVENSWASHINGMACHINESWASHINGMACHINESFOODPREPARATIONFOODPREPARATIONIRONSIRONSSHAVERSSHAVERS
2,42,43,33,3
7,77,72,72,7
5,35,3
223,23,2
7,67,6
5,25,2
2,52,5
4,74,7
5,65,65,65,6
2,62,6
4,14,1
5,35,39,29,2
2,82,8
3,93,9
4,24,2
10,410,4 8,18,114,514,5
7,27,217,917,9
21,221,211 411 4
COOKINGCOOKINGCOOLINGCOOLINGMICROWAVE OVENSMICROWAVE OVENSWASHINGMACHINESWASHINGMACHINESFOODPREPARATIONFOODPREPARATION
12
SHAVERSSHAVERSVACUUM CLEANERSVACUUM CLEANERSOthersOthers 10,710,7 8,88,8
2,52,5
8,08,0 8,78,7 12,112,111,411,4
7,87,810,810,8
IRONSIRONSSHAVERSSHAVERSVACUUM CLEANERSVACUUM CLEANERS

Modern Channels Solidify Their Position In UAELocal Market Structure developments Vs GCC Vs MENA
13
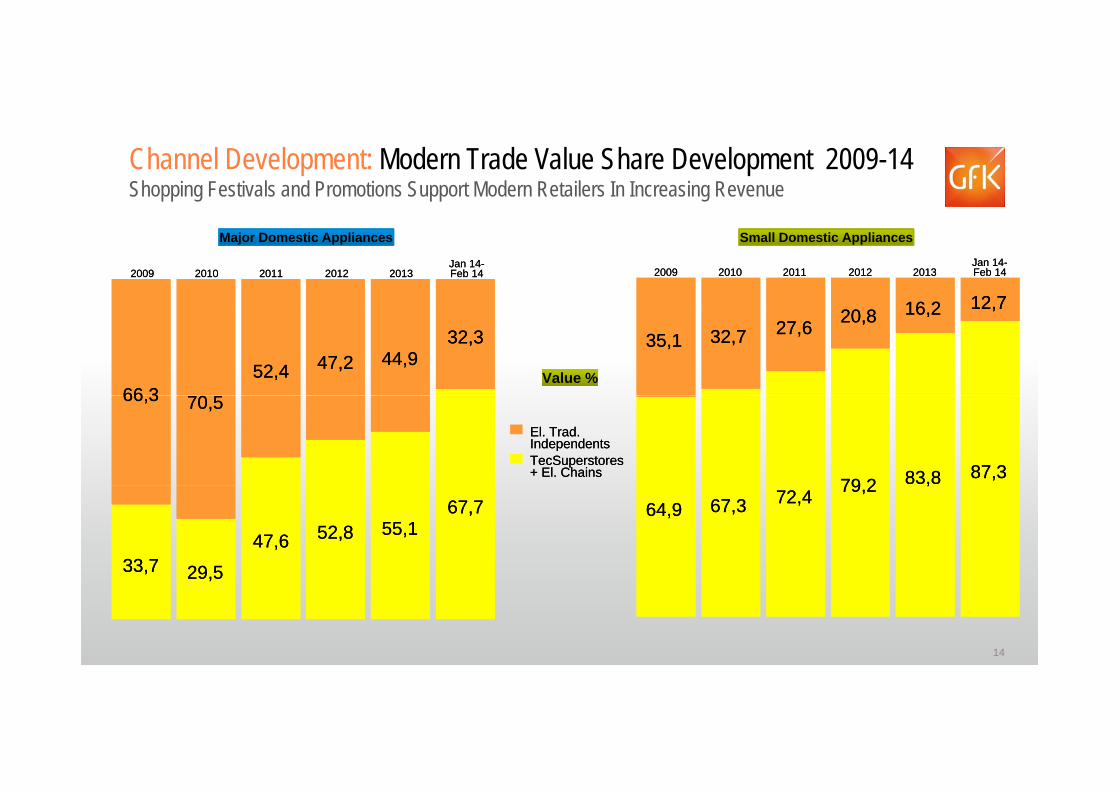
Channel Development: Modern Trade Value Share Development 2009-14 Shopping Festivals and Promotions Support Modern Retailers In Increasing Revenue
20092009 20102010 20112011 20122012 20132013Jan 14-Jan 14-Feb 14Feb 14
16 216 2 12 712 7
Small Domestic Appliances
20092009 20102010 20112011 20122012 20132013Jan 14-Jan 14-Feb 14Feb 14
Major Domestic Appliances
35,135,1 32,732,7 27,627,6 20,820,8 16,216,2 12,712,7
66 366 3 00
52,452,4 47,247,2 44,944,932,332,3
Value %Value %
79 279 2 83,883,8 87,387,3
El. Trad.El. Trad.IndependentsIndependentsTecSuperstoresTecSuperstores+ El. Chains+ El. Chains
66,366,3 70,570,5
64,964,9 67,367,3 72,472,4 79,279,2 ,,
33,733,7 29 529 5
47,647,6 52,852,8 55,155,167,767,7
14
29,529,5
Which Products Witnessed High Growth In 2013Key Feature Trends In Major And Small Domestic Appliances UAE
15

World Of MDA Key Feature Trends In MDA UAE

UAE MDA: 443 Mio USD Generated From White Goods Cooling through SBS sales and large fridges & washing machines from the washdry segment growth
4,1%4,1%
14,5%14,5%
17
8,1%8,1%
17,9%17,9%

UAE Cooling: Bottom Freezer Sales Rise Quickly Because Of EU Expats 2 Door Freezer Top still largest segment with 71% of total refrigerators value
COOLINGGfK Panelmarket AE
THS.USDTHS.USD
REFRIGERATORS WITH >600 NET LTRS+54% GrowthFRZ BOTTOM
+29% Growth
TOTALTOTAL
1DOOR1DOOR
14,514,5
1,11,1
54%54%
2 DR FRZ. TOP2 DR FRZ. TOP
2 DR FRZ. BTM2 DR FRZ. BTM
17,117,1
28,628,6
SIDE BY SIDESIDE BY SIDE 2,92,9
18

UAE Cooling: Multi Door Fridges Increase In Demand French door / 4 Doors reach more consumers as price competition makes them more affordable
COOLINGGfK Panelmarket AE NO OF DOORS
TotalTotal 14,514,5
SALES USDSALES USD
2013 / 2012 Growth %2013 / 2012 Growth %
11 1,11,1
2 TOP2 TOP
2 BTM2 BTM
17,117,1
26,126,1
2 SBS2 SBS
33
2,92,9
66,666,6
19
44 24,924,9

UAE Dishwashers: Niche Segment? Not So Much Anymore…Busy lifestyles push consumers towards DWRs / large families also influence # of place sets
GfK Panelmarket AE FS Dishwashers WITH > 14 Place sets+366% Growth Rate
DISHWASHERS
Jan 12-Dec 12 -> Jan 13-Dec 13 Growth %Jan 12-Dec 12 -> Jan 13-Dec 13 Growth %Sales USDSales USD
TotalTotal 23,823,8
FSFS
BIBUBIBU
23,823,8
22 922 9BIBUBIBU 22,922,9
20

UAE WMs: Front Loading WMs Preferred Prices of Wash Dry and large front loading units declines and spurs demand from consumers
FA FRONT
Higher Loading KGS >10Kgs+44% Growth
FA FRONT +17% Growth
Jan 12-Dec 12 -> Jan 13-Dec 13 Growth %Jan 12-Dec 12 -> Jan 13-Dec 13 Growth %Sales Value USDSales Value USD
TotalTotal 17 917 9 > 10 KG> 10 KG
FA FRONTFA FRONT
FA TOPFA TOP
WASHDRYWASHDRY
17,917,9
16,616,6
16,816,8
24 224 2
43,943,9
21
WASHDRYWASHDRY
SEMI/NASEMI/NA
24,224,2
17,017,0

UAE WMs: Front Loading Preferred Type Of Washing MachinesPrices of Wash Dry and large front loading units declines and spurs demand from consumers
SALES USDSALES USDFA FRONTFA FRONT
> 0 <=> 0 <= 7 47 4
WASHDRYWASHDRY SALES USDSALES USD
TotalTotal 24 224 2
2013 / 2012 Growth %2013 / 2012 Growth %
6 KGs6 KGs
> 6 <=> 6 <=
-7,4-7,4
26 026 0
TotalTotal
> 0 <= 6 KGs> 0 <= 6 KGs
> 6 <= 7 KGs> 6 <= 7 KGs
24,224,2
-36,0-36,0
13,113,1 6 6 7 KGs7 KGs
> 7 <=> 7 <=
26,026,0
> 7 <= 8 KGs> 7 <= 8 KGs
> 8 <= 9 KGS> 8 <= 9 KGS
13,113,1
49,249,2
30,530,5> 7 <=> 7 <=8 KGs8 KGs 31,131,1
> 9 <= 11 KGs> 9 <= 11 KGs
> 11 <= 13 KGs> 11 <= 13 KGs
30,530,5
-65,3-65,3
114,4114,4
22
> 8 KGs> 8 KGs 19,119,1> 13 KGs> 13 KGs
,,
592,0592,0

World Of SDA K F t T d I SDA UAEKey Feature Trends In SDA UAE
23

UAE: 135 Mio USD From Consumer Products In 2013Main Products Driving The Small Domestic Appliances Business
11,411,410,810,8
21,221,27,87,8
24
106,7106,7
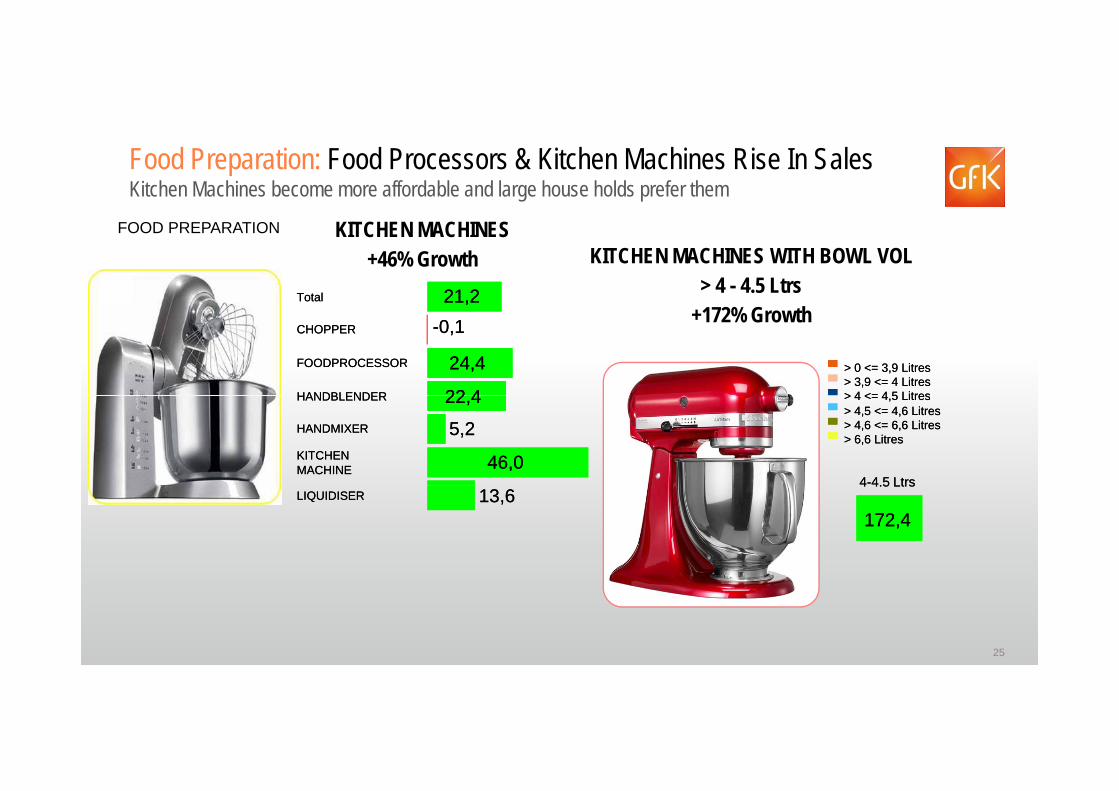
Food Preparation: Food Processors & Kitchen Machines Rise In SalesKitchen Machines become more affordable and large house holds prefer them
FOOD PREPARATION KITCHEN MACHINES+46% Growth KITCHEN MACHINES WITH BOWL VOL
> 4 - 4.5 LtrsTotalTotal 21,221,2
+172% GrowthCHOPPERCHOPPER
FOODPROCESSORFOODPROCESSOR
HANDBLENDERHANDBLENDER
-0,1-0,1
24,424,4
22 422 4
> 0 <= 3,9 Litres> 0 <= 3,9 Litres> 3,9 <= 4 Litres> 3,9 <= 4 Litres> 4 <= 4 5 Litres> 4 <= 4 5 Litres
4-4.5 Ltrs4-4.5 Ltrs
HANDBLENDERHANDBLENDER
HANDMIXERHANDMIXER
KITCHENKITCHENMACHINEMACHINE
22,422,4
5,25,2
46,046,0
> 4 <= 4,5 Litres> 4 <= 4,5 Litres> 4,5 <= 4,6 Litres> 4,5 <= 4,6 Litres> 4,6 <= 6,6 Litres> 4,6 <= 6,6 Litres> 6,6 Litres> 6,6 Litres
4 4.5 Ltrs4 4.5 LtrsLIQUIDISERLIQUIDISER 13,613,6
172,4172,4
25

Deep Fryers: Healthy Eating Heavily Advertised Bringing New TrendsLow Oil Deep Fryers Rise Radically In Sales Over The Last 2 Years
DEEP FRYERSGfK Panelmarket AE LOW OIL
+29% Growth
LOW OILWITH SQUARE SHAPE
+47% GrowthTotalTotal
WITH LOW OILWITH LOW OIL
19,319,3
29,429,4ROUNDROUND
SQUARESQUARE
WITH MUCH OILWITH MUCH OIL -14,9-14,9
46 9%46 9%
SQUARESQUARE
46,9%46,9%
26

VC: Are Robot Vacuum Cleaners The Next Big Thing In UAE?Turnover growth attests to it despite being at the very early stages
VACUUM CLEANERS
ROBOT+107% growth rate
WITH HEPA FILTER+168% Growth Rate
TotalTotal
BARRELBARREL
10,810,8
11,811,8
EL. SWEEPEREL. SWEEPER
HANDHELDHANDHELD
-8,0-8,0
8,08,0
HANDSTICKHANDSTICK
ROBOTROBOT
83,783,7
106,7106,7
168,0168,0
INCLUDEDINCLUDED
27
SLEDGESLEDGE
UPR(BEATUPR(BEAT&BRUSH)&BRUSH)
9,09,0
5,05,0
,,
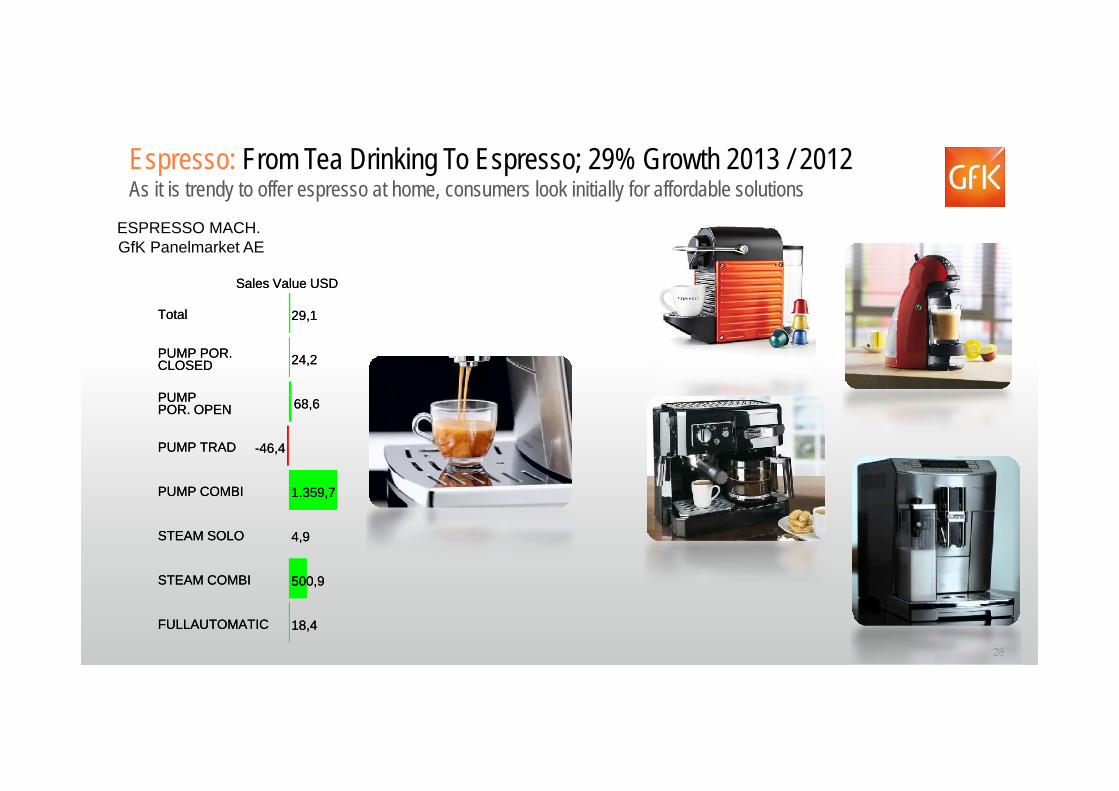
Espresso: From Tea Drinking To Espresso; 29% Growth 2013 / 2012As it is trendy to offer espresso at home, consumers look initially for affordable solutions
ESPRESSO MACH.
Sales Value USDSales Value USD
GfK Panelmarket AE
TotalTotal
PUMP POR.PUMP POR.CLOSEDCLOSED
PUMPPUMP
29,129,1
24,224,2
PUMPPUMPPOR. OPENPOR. OPEN
PUMP TRADPUMP TRAD
68,668,6
-46,4-46,4
PUMP COMBIPUMP COMBI
STEAM SOLOSTEAM SOLO
STEAM COMBISTEAM COMBI
1.359,71.359,7
4,94,9
28
STEAM COMBISTEAM COMBI
FULLAUTOMATICFULLAUTOMATIC
500,9500,9
18,418,4

Energy Efficiencygy yThink Green!!
29
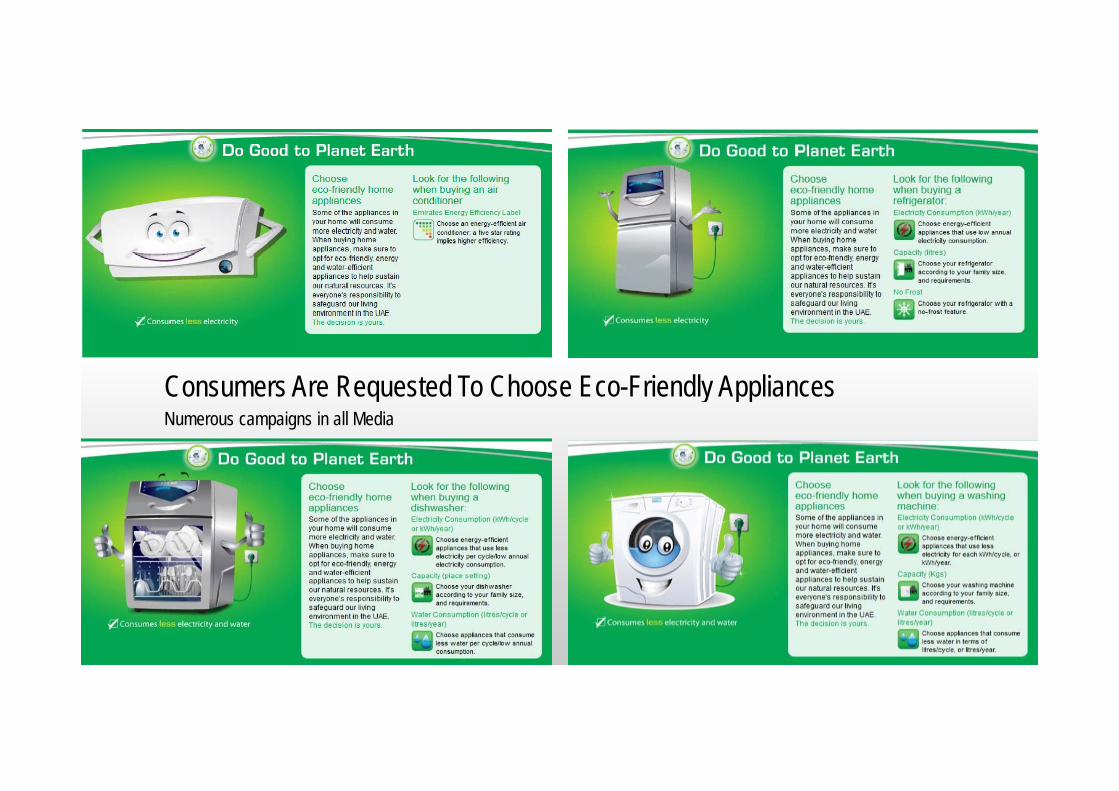
Consumers Are Requested To Choose Eco-Friendly AppliancesConsumers Are Requested To Choose Eco Friendly Appliances Numerous campaigns in all Media
30

ESMA: Manufacturers Advertise & Push Energy Efficient Products Though at the very beginning of this transformation, opportunity is apparent for the industry
GfK Panelmarket AE Value Growth rates to previous year (in %)
TotalTotal
Jan 13-Dec 13Jan 13-Dec 13 Jan 13-Dec 13Jan 13-Dec 13COOLINGCOOLING WASHINGMACHINESWASHINGMACHINES
14 514 5 17 917 9
Jan 13-Dec 13Jan 13-Dec 13AIR CONDITIONERAIR CONDITIONER
TotalTotal 4 14 1TotalTotal
A+++A+++
A++A++
14,514,5 17,917,9
105,7105,7
65,865,8 134,3134,3
A +A +
AA
4,14,1
-32,2-32,2
-12,5-12,5
A+A+
AA
31,431,4 24,624,6
-6,3-6,3 -24,6-24,6
BB
CC
-13,3-13,3
0,10,1
BB
CC
8,58,5 27,927,9
-12,2-12,2 -9,9-9,9
DD
EE
-32,7-32,7
56,956,9
31
DD
OthersOthers
-98,5-98,5 -66,0-66,0
25,625,6 20,920,9
FF
OthersOthers
-31,6-31,6
10,610,6
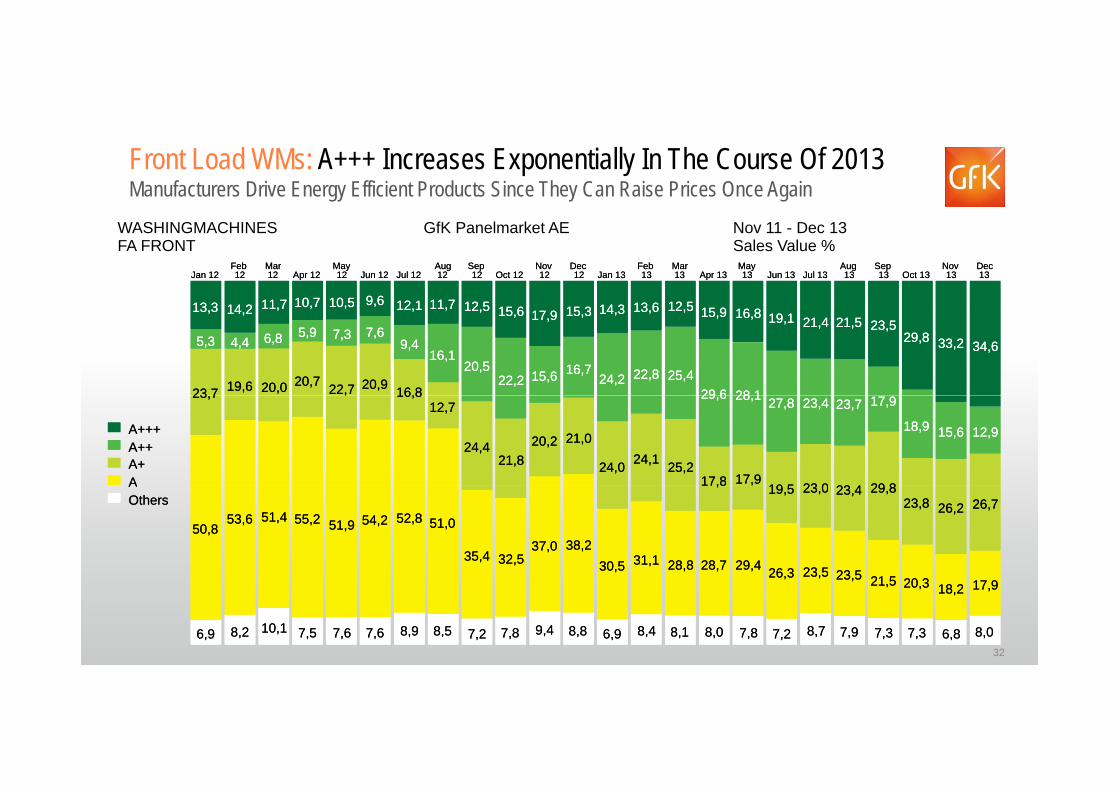
Front Load WMs: A+++ Increases Exponentially In The Course Of 2013Manufacturers Drive Energy Efficient Products Since They Can Raise Prices Once Again
WASHINGMACHINES GfK Panelmarket AE Nov 11 - Dec 13FA FRONT Sales Value %
Jan 12Jan 12FebFeb1212
MarMar1212 Apr 12Apr 12
MayMay1212 Jun 12Jun 12 Jul 12Jul 12
AugAug1212
SepSep1212 Oct 12Oct 12
NovNov1212
DecDec1212 Jan 13Jan 13
FebFeb1313
MarMar1313 Apr 13Apr 13
MayMay1313 Jun 13Jun 13 Jul 13Jul 13
AugAug1313
SepSep1313 Oct 13Oct 13
NovNov1313
DecDec1313
13 313 3 14 214 2 11 711 7 10,710,7 10,510,5 9,69,6 12 112 1 11 711 7 12 512 5 14 314 3 13 613 6 12 512 5
23 723 7
5,35,3
13,313,3
19,619,6
4,44,4
14,214,2
20,020,0
6,86,8
11,711,7
20,720,7
5,95,9
10,710,7
22,722,7
7,37,3
10,510,5
20,920,9
7,67,6
,,
16,816,8
9,49,4
12,112,1
16,116,1
11,711,7
20,520,5
12,512,5
22,222,2
15,615,6
15,615,6
17,917,9
16,716,7
15,315,3
24,224,2
14,314,3
22,822,8
13,613,6
25,425,4
12,512,5
29 629 6
15,915,9
28 128 1
16,816,8 19,119,1 21,421,4 21,521,5 23,523,529,829,8 33,233,2 34,634,6
23,723,7 ,, 16,816,812,712,7
24,424,421,821,8
20,220,2 21,021,0
24,024,0 24,124,1 25,225,217,817,8
29,629,6
17,917,9
28,128,1
19 519 5
27,827,8
23 023 0
23,423,4
23 423 4
23,723,7
29 829 8
17,917,9
18,918,9 15,615,6 12,912,9A+++A+++A++A++A+A+AA
50,850,853,653,6 51,451,4 55,255,2 51,951,9 54,254,2 52,852,8 51,051,0
35,435,4 32,532,537,037,0 38,238,2
30,530,5 31,131,1 28,828,8 28,728,7
17,817,8
29,429,4
,,
26 326 3
19,519,5
23 523 5
23,023,0
23 523 5
23,423,4 29,829,823,823,8 26,226,2 26,726,7
AAOthersOthers
326,96,9 8,28,2 10,110,1 7,57,5 7,67,6 7,67,6 8,98,9 8,58,5 7,27,2 7,87,8 9,49,4 8,88,8 6,96,9 8,48,4 8,18,1 8,08,0 7,87,8 7,27,2
26,326,3
8,78,7
23,523,5
7,97,9
23,523,5
7,37,3
21,521,5
7,37,3
20,320,3
6,86,8
18,218,2
8,08,0
17,917,9

UAE SWOT Analysis
Strengths1. Portal to the Middle East Region2 P f t l tf t t t d t
Action Points1. If not already investing in UAE, need to start
at the earliest it is the window to the Middle2. Perfect platform to test new products3. Modern retail highly developed 4. Frequent shopping festivals support sales
at the earliest, it is the window to the Middle East
2 Focus In Modern Retail to assure high
Challenges1 C d t ti it f
2. Focus In Modern Retail to assure high visibility and exposure
3 Invest in the right product segments1. Consumers used to promotions; wait for discounts
2. Market consolidation around key retailers
3. Invest in the right product segments
4. Focus on energy efficient products to be h d f th d l t t th
33
ahead of the curve and relevant to the market developments

For Further Information:
Ilias KarampoikisIlias KarampoikisCommercial Director HHL | Consumer ChoicesGfK Retail & Technology Middle East FZ LLCT: +971 50 551 7952E: [email protected]