U. S. RESEARCH PAPER RP683 - NIST Page · ASTUDYOFTHEPROPERTIESOFMORTARSANDBRICKS...
36
U. S. Department of Commerce Bureau of Standards RESEARCH PAPER RP683 Part of Bureau of Standards Journal of Research, vol. 12, May 1934 A STUDY OF THE PROPERTIES OF MORTARS AND BRICKS AND THEIR RELATION TO BOND By L. A. Palmer and D. A. Parsons abstract The water retaining capacity, transverse and compressive strengths, sorption, volume changes, and moduli of elasticity of 50 mortars and the absorption rate, moisture expansion, and transverse and compressive strengths of six makes of brick were studied. Also, 15 of the 50 mortars were used with the 6 makes of brick in tests of brick, mortar assemblages. The data indicate that the water retaining capacity of mortars and absorption rate of bricks were of primary importance in obtaining a good bond. The possible effects of brick and mortar properties on strength of bond in tension, bond durability, transverse strength of brick beams, and compressive strength of brick piers are discussed. CONTENTS Page I. Introduction 610 1. Purpose and scope 610 2. Definitions of terms used in this paper 611 3 Materials 611 (a) Sand 511 (b) Cementing materials 611 (c) Bricks 611 II. Test procedure 612 1. Mortars 612 (a) Proportioning 612 (b) Use of flow table and suction apparatus 612 (c) Molding of test specimens 614 (d) Classification of test specimens 614 (e) Curing of specimens 614 (f) Methods of test 614 2. Bricks 615 (a) Preparation for tests 615 (b) Measurements 615 3. Brick mortar specimens 615 (a) Preparation of materials 615 (b) Method of forming test specimens 615 (c) Classification of tests 615 (d) Measurements 615 III. Results ___ 618 1. Mortars 618 (a) Water retaining capacity 618 (b) Shrinkage during early hardening 619 (c) Volume changes subsequent to hardening 620 (d) Compressive and transverse strength 622 (e) Modulus of elasticity and extensibility 626 (f) Sorption 628 2. Bricks 629 (a) Absorption rates 629 (b) Compressive and transverse strength 530 (c) Expansion of bricks on wetting 630 609
Transcript of U. S. RESEARCH PAPER RP683 - NIST Page · ASTUDYOFTHEPROPERTIESOFMORTARSANDBRICKS...

U. S. Department of Commerce Bureau of Standards
RESEARCH PAPER RP683
Part of Bureau of Standards Journal of Research, vol. 12, May 1934
A STUDY OF THE PROPERTIES OF MORTARS AND BRICKSAND THEIR RELATION TO BOND
By L. A. Palmer and D. A. Parsons
abstract
The water retaining capacity, transverse and compressive strengths, sorption,volume changes, and moduli of elasticity of 50 mortars and the absorption rate,moisture expansion, and transverse and compressive strengths of six makes ofbrick were studied. Also, 15 of the 50 mortars were used with the 6 makes ofbrick in tests of brick,mortar assemblages. The data indicate that the waterretaining capacity of mortars and absorption rate of bricks were of primaryimportance in obtaining a good bond. The possible effects of brick and mortarproperties on strength of bond in tension, bond durability, transverse strength ofbrick beams, and compressive strength of brick piers are discussed.
CONTENTSPage
I. Introduction 6101. Purpose and scope 6102. Definitions of terms used in this paper 6113
.
Materials 611(a) Sand 511(b) Cementing materials 611(c) Bricks 611
II. Test procedure 6121. Mortars 612
(a) Proportioning 612(b) Use of flow table and suction apparatus 612(c) Molding of test specimens 614(d) Classification of test specimens 614(e) Curing of specimens 614(f) Methods of test 614
2. Bricks 615(a) Preparation for tests 615(b) Measurements 615
3. Brick mortar specimens 615(a) Preparation of materials 615(b) Method of forming test specimens 615(c) Classification of tests 615(d) Measurements 615
III. Results ___ 6181. Mortars 618
(a) Water retaining capacity 618(b) Shrinkage during early hardening 619(c) Volume changes subsequent to hardening 620(d) Compressive and transverse strength 622(e) Modulus of elasticity and extensibility 626(f) Sorption 628
2. Bricks 629(a) Absorption rates 629(b) Compressive and transverse strength 530(c) Expansion of bricks on wetting 630
609

610 Bureau of Standards Journal of Research [Vol. n
III. Results—'Continued. Page
3. Assemblages 630(a) Strength of bond 630
(1) General considerations 630(2) The effect of brick suction, the water retaining capacity
of mortar and strength of mortar on bond strength
_
632(3) The effect of shrinkage during early hardening of
mortars on bond strength 634(4) The combined effect of shrinkage during early hard-
ening and compacting of mortar on a porous base onbond strength 634
(5) The effect of volume changes in mortar subsequent to
hardening on bond strength 636(6) The increase in bond strength with time 637(7) Statistical treatment of bond strength data 637
(b) Durability of bond 638(c) The transverse strength of brick beams 641(d) Compressive strength of brick piers 642
IV. Summary and conclusions 643
I. INTRODUCTION
1. PURPOSE AND SCOPE
It has been the consensus of opinion among recent writers 1 2 3 4
that the points in brickwork most accessible to the entrance of waterare the junctures of brick and mortar. Laboratory data as well as
field observations have supported this view.Suggestions for improving the bond of mortar to bricks or other
building units are numerous and conflicting. However, there hasbeen a conspicuous lack of data. This is mainly because it is exceed-ingly difficult to carry on an investigation so comprehensive andexhaustive that all classes of the materials involved may be well
represented in the study.Unfortunately, the selection of materials from the standpoint of
their mutual suitability has received too little attention. Obviouslyit will not suffice to consider the physical properties of either of thetwo materials, bricks or mortar, as unrelated to the other. Specifi-
cations for either material should be written with regard for the other.
The purpose of this investigation 5 was, therefore, twofold. First,
it was intended to make a survey, as wide as possible, of the physicalproperties of both mortars and bricks. Second, it was then proposedto find how these data are related to the bond with particular reference
to water tightness of walls, assuming that improving the bond will
improve the watertightness of the masonry.It happened that a rather extensive survey of bricks from various
sections of the United States was being completed 6 at the time this
study was begun. This earlier study made it possible to select, witha minimum of preliminary work, representative types of bricks.
i'P. O. Anderegg. Water-Tight Masonry, The Architectural Record, vol. 70, no. 3, pp. 202-207, 1931.2 L. A. Palmer, Water Penetration through Brick-Mortar Assemblages, Jour. Clay Prod. Inst., vol. 1,
pp. 19-31, Sept. 1931.3 L. B. Lent, Exterior Wall Construction, General Building Contractor, pp. 35-41, Feb. 1932.4 Bulletin of the Boston Society of Architects, no. 3, Dec. 1931.5 In order to save space some of the data are presented in the form of graphs showing average values.
Tables giving the data in more detail may be obtained upon application to the Bureau of Standards, Wash-ington, D.C.
ti McBurney, J. W., and Lovewell, C E., Strength, Water Absorption, and Weather Resistance of Building Bricks Produced in the United States; Proc. Am. Soc. for Testing Mats., vol. 33, part II, p. 636, 1933.

Palmer]
Parsons] Adhesion oj Mortars to Bricks 611
2. DEFINITIONS OF TERMS USED IN THIS PAPER
Bond.—-The attachment of brick to brick through the medium of
an intervening mortar joint.
Bonding area.—The total area, in square inches, of the flat side of
the smaller of two bricks adjacent to an intervening mortar joint.
Brick suction.—The amount of water, in grams, absorbed throughthe flatside of brick immersed }i inch in water for 1 minute.Bond durability.—The resistance of bond to arbitrary weathering
expressed as length of time required to destroy bond or as the lower-ing of bond strength.
Bond strength.—The tensils stress, expressed in pounds per squareinch of bonding area, required to separate an assemblage of twobricks with intervening mortar joint.
Absorption.—A strictly physical process of a body taking up waterand refers to mechanically held water.
Sorption. 7—Refers to moisture added to a body by any or all of
the three processes: Absorption (physical), adsorption (physico-
chemical), and hydration (chemical).
Water retaining capacity.—The resistance of a freshly mixed mortarto the loss of water by filtration.
8 9 In this paper the water-retainingcapacity is expressed by the flow on the 10-inch table after suction
(2 inches of mercury) for 1 minute, on a standard porous base (see
table 2).
3. MATERIALS
(a) SAND
Fairly clean Potomac River mortar sand that had passed a no. 8
sieve was used in all tests. The sieve analysis of this sand was as
follows:
Passedsieve no.
Retainedon sieve
no.Percent
8 14 7.214 28 23.728 48 50.448 100 15.5100 3.2
100.0
(b) CEMENTING MATERIALS
There were used 12 masonry cements, two portland cements, andfour limes, products of manufacturers in various parts of the UnitedStates. These materials are described in table 2. They werereceived in steel drums and remained in them tightly covered through-out the period of the investigation except at the times that sampleswere required.
(c) BRICKS
Six makes of bricks were used and their descriptions are given intable 1.
7 McBain and Ferguson. Jour. Phys. Chem., vol. 31, no. 4, pp. 562-594, 1927.8 L. A Palmer and D. A. Parsons, The Kate of Stiffening of Mortars on a Porous Base, Rock Products,
vol. 35, no. 18, pp. 18-24, 1932.9 J. C. Pearson, ProDerties and Problems of Masonry Cements, Proc. Am. Concrete Inst., vol. 28, p. 349,
1932.

612 Bureau of Standards Journal of Research [Vol. 12
Table 1
Brickno.
Raw materials Molding process Rate of absorption Flat surfaces
1 Surface clayShale.—
Dry-press. . Relatively last. Mechanically smooth.Very rough.
Moderately rough.Smooth but uneven.
Relatively smooth for side-cut bricks, also glassy.
Very smooth for side-cutbricks.
2 Stiff-mud, end-cut.do
Moderate for shalebricks.
3 do4
5
Surface clay
Fire clay
Soft-mud, sandstruck.
Stiff-mud, side-cut.do
Fast, less than no. 1
6 Surface clay . Fast, less than no. 1 andgreater than no. 4.
The rates of absorption of bricks 1 and 5 are generally consideredextreme, whereas those of nos. 2, 3, 4, and 6 were intermediate.(See fig. 9, p. 629.)
II. TEST PROCEDURE1. MORTARS
(a) PROPORTIONING
The method of proportioning the 50 mortars has been presentedin a publication (page 18, vol. 35 (18), Rock Products, Sept. 10,
1932), which contains a table descriptive of these mortars. For con-venience this table, with the addition of water retaining capacity datafrom that paper, is given here as table 2.
(b) USE OF THE FLOW TABLE AND SUCTION APPARATUS
The flow table and its use in making mortar studies has alreadybeen described at length. 10 n The Rogers device, used with theflow table in studying the water-retaining capacities of mortars, is
illustrated and described on pages 19 and 20 of the Sept. 10, 1932,issue of Rock Products.
Table 2.
—
Mortars studied
Proportions (with sand) Waterretainingcapacity
Mortardesig-nation
Cementing materials Description of ce-
(flowafter 1
used menting materials By bulkvolume l
By weight 2
minuteon
standardporousbase)
PercentA I Gray, typical port-
land.1PC:3S. 1PC:3.44S 45
A II White do 1PC:3.49S ... ... 47
B I Masonry cement no. 1 3 . Modified natural ce-
ment.1MC:3S 1MC:4.62S 74
B II Masonry cement no. 2.. Slag and Portlandcement.
do 1MC:4.36S 65
B III.... Masonry cement no. 3.
.
Hydraulic lime do 1MC:6.14S 41
B IV..
„
Masonry cement no. 4.
.
Slag and hydratedlime.
do 1MC:4.48S 48
B V Masonry cement no. 5.
.
Mixture of hydratedlime and Portlandcement.
do 1MC:6.27S 57
B VI.... Masonry cement no. 6 3 . Modified natural ce-
ment.do 1MC:5.09S 61
1 Dry rodded volumes of sand and of the dry cementing materials. For the lime putties the volumesare of the putties as used.
1 The weight proportions are based on the dry weights of sand and of the dry cementing materials. Formortars containing lime putty the weight proportion of the lime is based on the dry weight of the puttyafter drying for 24 hours at 115 C.
3 Contained metallic stearates.
i» See footnote 8.
" Volume changes in brick masonry materials, B.S. Jour. Research, vol. 6 (HP 321), p. 1003, 1931.

Palmer 1
Parsons] Adhesion of Mortars to Bricks
Table 2.
—
Mortars studied—Continued
613
Cementing materialsused
Masonry cement no. 7 3 -
Masonry cement no. 8 3.
Masonry cement no. 10 3
Masonry cement, no. 11 3
Masonry cement no. 12.
Masonry cement no. 13 3
Lime no. 1
Lime no. 2
Lime no. 3
Lime no. 4
Portland cement no. 1
and lime no. 1.
.—do
.do.
.do-
Portland cement no. 1
and lime no. 2.— .do
Portland cement no. 1
and lime no. 3.— .do
Portland cement no. 1
and lime no. 4.
—do.do.
.do.
Portland cement no. 2
and lime no. 1.
.—do
.do_
.do-
Portland cement no. 2and lime no. 2.
—do.—do—doPortland cement no. 2and lime no. 3.
—do
Portland cement no. 2
and lime no. 4.
—do.do-
_do.
Description of ce-
menting materials
Modified natural ce-
ment.Modified portlandcement.
....doModified natural ce-
ment.Natural cementModified natural ce-
ment.High calcium quick-
lime.Dolomitic hydratedlime.
High calcium hy-drated lime.
Dolomitic quicklime.
Proportions (with sand)
By bulkvolume
IMC:3S.
-do..
1L:3S
do
1L:3S
do
lPC:lL:6S-._
1PC:2L:9S_--
1PC:3L:12S—
1PC:0.15L:3S.
1PC:1L:6S—
1PC:2L:9S—1PC:3L:12S__1PC:0.15L:3S.1PC:1L:GS—
1PC:2L:9S__.1PC:3L:12S—1PC:0.15L:3S.1PC:1L:6S—
lPC:2L:9S.-_
1PC:3L:12S—
1PC:0.15L:3S-
1PC:1L:6S-.
lPC:2L:9S--_
1PC:3L:12S_..
1PC:0.15L:3S.
1PC:1L:GS—
.
1PC:2L:9S___lPC:3L:12S-_1PC:0.15L:3S.1PC:1L:6S—
.
1PC:2L:9S—
.
1PC:3L:12S__1PC:0.15L:3S.1PC:1L:6S_._
1PC:2L:9S—
1PC:3L:12S-.
1PC:0.15L:3S.
By weight
Waterretainingcapacity(flowafter 1
minuteon
standardporousbase)
1MC:4.57S.
1MC:5.24S.
1MC:4.20S.1MC:5.18S.
1MC:4.85S.1MC:4.76S_
1 dry hydrate 4
8.12S.1L:10.52S
1L:9.21S.
1 dry hydrate 4
7.26S.
IPC: 0.42 dry hy-drate 4:6.883.
IPC: 0.85 dry hy-drate 4 :10.31S.
IPC: 1.27 dry hy-drate 4 :13.75S.
1PC:0.06 dry hy-drate 4
: 3.44S.1PC:0.33L:6.88S..
1PC:0.65L:10.31S.1PC:0.98L:13.75S.1PC:0.05L:3.44S..1PC:0.37L:6.88S._
1PC:0.75L:10.31S.1PC:1.12L:13.75S.1PC:0.06L:3.44S_.1PC:0.47 dry hy-drate 4 :6.8SS.
1PC:0.95 dry hy-drate *:10.31S.
IPC: 1.42 dry hy-drate 4 :13.75S.
IPC: 0.07 dry hy-drate 4 :3.44S.
IPC: 0.43 dry hy-drate 4 :6.97S.
1PC:0.86 dry hy-drate 4 :10.46S.
IPC: 1.29 dry hy-drate 4 :13.95S.
IPC: 0.06 dry hy-drate 4
: 3.49S.1PC:0.33L:6.97S_.
1PC:0.66L:10.46S.1PC:0.99L:13.95S.1PC:0.05L:3.49S..1PC:0.38L:6.97S._
1PC:0.76L:10.46S.1PC:1.14L:13.95S.1PC:0.06L:3.49S_.IPC: 0.48 dry hy-drate 4 :6.97S.
IPC: 0.96 dry hy-drate 4 :10.46S.
IPC: 1.44 dry hy-drate 4 :13.95S.
IPC: 0.07 dry hy-drate 4
: 3.49S.
Percent
42
3 Contained metallic stearates.4 The amount of dry hydrate per unit weight of freshly slaked lime putty was obtained by drying small
samples of the putty for 24 hours in an oven at about 115 C.
49727—34 7

614 Bureau of Standards Journal of Research [Vol. 12
A mortar of flow between 75 and 85 percent was considered asbeing of dry consistency. A mortar of intermediate consistencyhad a flow between 100 and 110 percent and wet consistency refers
to mortar of flow ranging from 125 to 135 percent.
(c) MOLDING OF TEST SPECIMENS
The compression test specimens were 2-inch cubes. The methodof filling the metal molds was that given in Tentative Specifications
and Tests for Masonry Cements, A.S.T.M., Tentative Standards,part I, vol. 32, 1932, page 695.
The method of molding the 1 by 1 by 10 inch bars in the study of
shrinkage during early hardening and of the 1 by 4 by 12 inch speci-
mens in the study of later volume changes, sorption, and moduli of
rupture and elasticity has already been described. 12
(d) CLASSIFICATION OF TEST SPECIMENS
There were 2 series of strength tests made with the 2-inch cubes.The tests with 1 series were made at the end of 3 months, and thoseof the other series at the end of a year. There were 9 cubes (3 of
each consistency, dry, intermediate, and wet) for each mortar in
each of the 2 series, a total number of 900 cubes for the 50 mortars,450 for each test series.
Tests for sorption and volume changes subsequent to hardeningwere made only with 1 by 4 by 12 inch slab specimens of the series
that were kept for a year and tested for transverse strength andmodulus of elasticity at the end of that time. Tests for transversestrength and modulus of elasticity at 3 months were made with theother (3 months) series. There were 900 slab specimens, 450 for
each series.
For each test for shrinkage during hardening there were three 1 by1 by 10 inch specimens of each mortar of each consistency, a total of
450 specimens for the 50 mortars.
(e) CURING OF SPECIMENS
All specimens were made and kept for 1 week in a constant-tem-perature constant-humidity room (relative humidity, 60 ± 5 percentand temperature 70 ±2° F). All specimens except the 1 by 1 by 10
inch bars were then kept for 3 weeks in a room of high (95 percent or
more) relative humidity, the temperature of which was 70 ±4° F.
They were then dried in the laboratory for 2 months. The specimensof the 3-month series were then tested and those of the other series
were alternately stored for 1 month in the high-humidity room and for
3 months in the laboratory until they were a year old.
The laboratory temperature ranged from 56 to 94 F, the averagebeing about 68 F. The relative humidity varied from 20 to 85 per-
cent, but usually was within the limits, 30 to 50 percent.
(f) METHODS OF TEST
The equipment used for determining transverse strength and mod-ulus of elasticity and the method of computing data are presented in
Bureau of Standards Eesearch Paper 477, pages 384 to 389.
Compression tests were made in accordance with Federal Specifica-
tion SS-C-181. Par. F-3-g-6.12 See footnote 11.

PalmerParsons. Adhesion of Mortars to Bricks 615
The method of measuring linear changes, both those attendingearly hardening and those produced subsequent to hardening byalternate wetting and drying, has already been described. 13 Sorptionduring 15 minutes and 2 hours was obtained by immersing completelyin water the slab specimens of the year series at the ages of 3 and 11
months.2. BRICKS
(a) PREPARATION FOR TESTS
Before being tested, all bricks were dried in an oven (115° to 150° C)to constant weight.
(b) MEASUREMENTS
The method of determining the rate of absorption with 15 repre-
sentative bricks of each make is described fully under " Method of
Procedure" in Bureau of Standards Research Paper 88, p. 118.
The transverse and compressive strengths, obtained with 25 speci-
mens of each make of brick, were determined in accordance withstandard A.S.T.M. specifications. 14
The method of measuring "moisture expansion" produced byprolonged wetting was the same as that used previously. 15
The rates of absorption of bricks nos. 1, 2, 4, and 6 following total
immersion for 15 minutes in water were also determined. Themethod was the same as that used in the case of dry bricks.
3. BRICK-MORTAR SPECIMENS
(a) PREPARATION OF MATERIALS
Bricks 1, 2, 4, and 6 were set under 2 conditions, namely, dry andafter having been totally immersed for 15 minutes in water. Bricks3 and 5 were set dry in all cases.
Only mortars of intermediate consistency (flow of 100 to 110 per-
cent) were used in making the assemblages.
(b) METHOD OF FORMING TEST SPECIMENS
The mortar joints were approximately ){ inch thick. The pro-
cedure followed in bedding the bricks in mortar and in placing % inchbrass lugs when used in the joints has been described. 16
All test specimens were made in the constant temperature-constanthumidity room and, except series 5A remained there for a week after
being made.(c) CLASSIFICATION OF TESTS
A classification of the tests is made on the basis of method of expo-sure, type of specimen, and purpose of the test. There were six
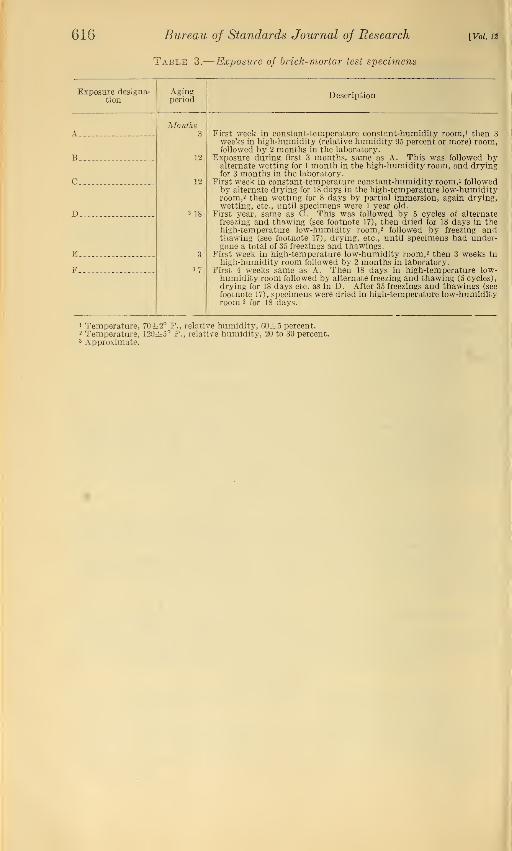
methods of exposure, designated as A, B, C, D, E, and F in table 3.
The test specimens are classified and described in table 4.
(d) MEASUREMENTS
The method of measuring strength of bond is described in detail
in a previous publication. 17
is See footnote 11.11 Standard Method of Testing Brick (Compression, Flexure, and Absorption) (C 67-31), 1933 Book of
A.S.T.M. Standards, pt. II, p. 128.18 See footnote 11.if Durability and Strength of Bond Between Mortar and Brick, B.S. Jour. Research, vol. 6 (RP 290),
p. 473, 1931.w See footnote 16.
616 Bureau of Standards Journal of Research
Table 3.
—
Exposure of brick-mortar test specimens
[Vol. 12
Exposure designa-tion
Agingperiod
Description
AMonths
3
12
12
3 18
3
3 7
First week in constant-temperature constant-humidity room, 1 then 3
B
weeks in high-humidity (relative humidity 95 percent or more) room,followed by 2 months in the laboratory.
Exposure during first 3 months, same as A. This was followed by
C
alternate wetting for 1 month in the high-humidity room, and dryingfor 3 months in the laboratory.
First week in constant-temperature constant-humidity room, 1 followed
D .
by alternate drying for 18 days in the high-temperature low-humidityroom, 2 then wetting for 8 days by partial immersion, again drying,wetting, etc., until specimens were 1 year old.
E
freezing and thawing (see footnote 17), then dried for 18 days in thehigh-temperature low-humidity room, 2 followed by freezing andthawing (see footnote 17), drying, etc., until specimens had under-gone a total of 35 freezings and thawings.
First week in high-temperature low-humidity room, 2 then 3 weeks in
Fhigh-humidity room followed by 2 months in laboratory.
First 4 weeks same as A. Then 18 days in high-temperature low-humidity room followed by alternate freezing and thawing (5 cycles),
drying for 18 days etc. as in D. After 35 freezings and thawings (see
footnote 17), specimens were dried in high-temperature low-humidityroom 2 for 18 days.
1 Temperature, 70±2° F., relative humidity, 60d=5 percent.2 Temperature, 120±5° F., relative humidity, 20 to 30 percent.3 Approximate.

Palmer'
Parsons. Adhesion of Mortars to Bricks 617
® .1
•« ©
fta I"^" © ft rt .
Ph©
© (3 00 ©
O -i-3 w CO
Eh
8* *
2a
CO O
o ©;P fi
f> 3*S o
ۤ9^1
t! S a b 2
.S fl m'O aS3 CO -35 © .C
© M§"S ft
© 9^3 "3 or— ~ >h ;-j X
o oX3 o °3
H Eh
+^> 35© oW-a-2 o © ^3
co CJDO
_.aa°goo©^3© 5—*3^a
. o
4^> CC O
0"0 to
En
^j g C3 g M ^
2'3 ©3^ 3 °
bLCD'
t3 co
»g<§<3 '3S§O £ 2t3 o >-CrQEh Eh
S3««So3S°3M•r1 co co S3
a © g^3
£•-§'§
©33 S Est-
Eh cq
;s°- fa: ca o<© . -s +j
1 « ccm -S«5 £,
' O M ^" OT3rrt
ja «w « ccig co
i'te3jcs£ -SBni*
h-i?H
co>o 52'"" ,£31—I
"" CO .>-• CT
!-£-u>-h -3?^ co © ©
CO
geo
IS
' CO
|o .§«£ft C
co' t^©^
S © J3^ Ot3ato.SSeOg ^ S3 co S3
^gTJ^O^.2,
^a© ©^ CO
B32 M
a-r-e SXJ"
^ o•Ha-Q=3
p FP
1=3 8,<1
as
o
i3 co
co_^ oi
ffl
a g
2'i© a
^m >S -° co
ohShB • ^ 2
® _r s®§a'HClcDH '--^-h ©
SS !-h i_r b ®« °
SXW<ia33 33'3
co .- .
opqX
ffl.2
«3m
•cmm
CO J&
^3^
5'S
Ikftc3°m a ©co ^3 S5
• ca ©co © CO10
fio ,-g ©
sa %-%
a a |§s3 -s^
D.0C © S3
+3 O
S^ om a©
8 a.9 c3
s a©73as a^
•3 B© JH
cog
MS3
© co£ ©
©•33C a
©2© ^"d3.9 8 i
,© S M O „>© ^a'^o^ Is ^am §
!«^'3 -2^ .SS'^7""J ft©cof^
m :

618 Bureau of Standards Journal of Research [Vol. ib
Durability of bond was studied by cyclic wetting, freezing andthawing and drying. Wetting by partial immersion for 48 hourspreceded each group of 5 freezing and thawing cycles. The sat-
urated specimens, partially immersed, remained for 18 hours in a
freezing chamber after which they were kept under water at roomtemperature for 6 hours and thus thawed. The freezing temperaturevaried from about 12° to 30° F., being usually within the limits, 15° to24° F. The specimens were dried for 18 days in the high-temperaturelow-humidity room (see footnote, table 3) after each 5 cycles of freez-
ing and thawing. Specimens were subjected to a total of 35 freezing
and thawing cycles with 6 intervening drying periods and anotherfollowing the completion of the 35 cycles. It was considered that thebond had failed, when on lifting the specimen by the top brick, thelower one dropped off.
The equipment for measuring the transverse strength of brickbeams (series 1C and 2C, table 4) was the same as that used for
determining the transverse strength of brick. 18 The span in this case,
however, was 11 inches, approximately the distance from the mid-points of the edges (faces) of the two bricks at opposite ends of the
5-brick 4-joint beams. The total overhang was thus the weight of 1
brick and this was taken as the mean of 25 separate weighings of
individual bricks (dry) of each make. The load was applied at the
middle of the beam.The modulus of rupture (lb per sq in.) was computed from the
formula:
in which: P is the applied load, pounds, p is the weight of the beam,minus the weight of the overhang, b and d are the width and depth(inches), respectively, of the beam at the section of failure, and x
denotes the distance of this section from the nearer support.Usually failure was at one of the two joints adhering to the middle
brick, and 3-brick piers (2 intervening joints) were taken from thebroken beams for compression tests, performed according to theprocedure followed in testing half bricks. 19
III. RESULTS
1. MORTARS
(a) WATER-RETAINING CAPACITY
As a brief resume of the results of tests for water-retaining capaci-ties of mortars already published 20
it may be said that the slaked limeputty and stearated masonry cement mortars (made from the naturalcements) were found to be the most retentive of water of all of the 50mortars according to the method of test. The partial substitutionof the slaked lime putties for the two portland cements produced aconsiderable increase in water-retaining capacity above that of thestraight portland cement mortars which were among the lowest withrespect to this property. The presoaked hydrated limes had much
18 See footnote 14.18 See footnote 14.20 See footnote 8.

Palmer]
Parsons] Adhesion of Mortars to Bricks 619
the same effect as the slaked lime putties but to a much less extent.
The water-retaining capacity of hydrated lime mortars was improvedby soaking the limes for 24 hours before mixing.
(b) SHRINKAGE DURING EARLY HARDENING
The results are given in table 5. For the portland-cement-limemixtures the averages are of all of the combinations of the 2 port-
land cements and 4 limes for each definite proportion by volume.This averaging of all brands for the portland-cement-lime mixturesexplains the magnitude of the deviations from the mean as shown bythe maximum and minimum values, in comparison with the deviations
for the individual brands of lime and portland cement.
Table 5. -Linear shrinkage during early hardening of 1 by 1 by 10 inch mortarspecimens
[Averages are of 24 specimens in the case of lime-portland-cement mixtures and of 3 specimens for all othermortars. Maximum and minimum values for the lime-portland-cement mixtures are averages of 3
specimens]
Mortar com- Cementing materialsMortardesigna-
tion
Linear shrinkage during initial 48 hours at 3 consistencies
positionDry Intermediate Wet
1PC:1L:6S All combinations of
2 Portland cementsand 4 limes.
do
do
do
PC no. 1
Percentavg 0.28max .35 (YTa)min .23 (XVa)
avg . 40max .45 (YTb)min .34 (XRb)
avg . 4gmax .54 (XRc)min .41 (YSc)
avg . 21
max .25 (XTd)min .14 (XVd)
Avg percent.13.18
.94
.57
.68
.59
.29
.29
.28
.21
.33
.32
.24
.35
.33
.25
.40
.46
Percentavg 0.30max .35 (XTa)min .28 (YVa)
avg . 48max .61 (YTb)min .41 (XRb)
avg . 62max .77 (YRc)min .52 (YSc)
avg . 24max .30 (XTd)min .18 (XVd)
Avg percent.21.24
1.11.66.751.81
.37
.31
.32
.24
.34
.36
.32
.36
.32
.28
.52
.58
Percentavg 0.33
1PC:2L:9S
1PC:3L:12S_„
1PC:0.15L:3S.
1PC:3S AIAll
CICIIcmCIV
BIBIIBinBIVB V
B VIB VIIB VIIIBXBXIBXIIBXIII
max .39 (XRa)min .23 (YVa)
avg . 51max .64 (YRb)min .47 (XRb)
avg . 67max .84 (YRc)min .53 (YTc)
avg . 25max .32 (XTd)min .20 (XVd)
Avg percent.24
Do PC no. 2 .31
1L:3S 1 1.35Do .72Do .83Do 1.94
1MC:3S. MCno. 1 .46Do MC no. 2. . .36Do MC no. 3 .. _ .37Do MC no. 4 .29Do MC no. 5 .39
1MC:3S MC no. 6 .46Do MC no. 7. .42Do MC no. 8 .48Do MC no. 10 .36Do MC no. 11 .36Do MC no. 12 .60Do MC no. 13 .62
Specimens measured when a week old . Too soft to measure at 48 hours
.
The averages of table 5 are highest for the straight lime-sand and1PC:3L:12S mortars and lowest for the straight portland-cement-sand mortars. The magnitude of linear shrinkage during the initial
48 hours of the 1PC:1L:6S and the 1PC:2L:9S mortars ranged froma low average, 0.28 percent (average, dry consistency, all IPC: 1L:6S

620 Bureau oj Standards Journal of Research [Vol.12
mortars) to a high average of 0.51 percent (average all 1PC:2L:9Smortars of wet consistency). These values fall within the range ofthe 12 different masonry cement mortars (0.21 percent, MC no. 4,average for dry consistency, to 0.62 percent, MC no. 13, average forwet consistency).
(c) VOLUME CHANGES SUBSEQUENT TO HARDENING
Typical data are presented in figures 1 and 2. Initial strain-gagereadings were taken when specimens were a week old. Expansion
1"^ 03
i r i
i
Average of//near changes during a/ferna/e wetting anddrying of //me- Por/fandcement- Sane/morfars.These are averages ofa// /Aree cons/s/enc/es (dry,
infermed/a/e and r/ef ) of"each morfar mixture.
(/) o JR. a •• 0. 15L : 35 (3) o IRC. : ZL • 95(2) a /pc. : 1L : 65 (4) + IRC. :3L : 156
Upward /rend'indicates expansion.
Pownward trendindicates strin/rage.
10 l! 12
Figure 1.— Typical linear changes in lime-portland-cement mortar specimenssubsequent to hardening.
and shrinkage during subsequent wetting and drying periods werecomputed with reference to these initial readings. Since only changesin length (not absolute lengths) were measured, the initial points aretaken as the origin (specimens 1 week old).
Each plotted point of figure 1 is an average of all three consistencies(dry, intermediate, and wet) and all brands of the materials (limeand portland cement) are included in each proportion by volume asindicated. Each plotted value is, therefore, the average of 72 measure-ments (3 specimens, 3 consistencies, 8 mortars).Each plotted point of figure 2 is an average of 9 measurements, 3
specimens with each consistency with each mortar. Masonry cement

Palmer 1
Parsons] Adhesion of Mortars to Bricks 621
mortar B III had the lowest, and B XI the highest volume changes of
the 12 masonry cement mortars. The averages of the other 9 masonrycement mortars would, if plotted in figure 2, either coincide with or
fall between the plotted values.
The plotted data indicate the extent of variation in linear changesof mortars of different compositions. The highest linear changeswere obtained with masonry cement mortar B XI and the lowestwith lime mortar C III. Values for the lime mortars were all relatively
very 1owt
, checking previously published results. 21 Linear changes of
the individual 1PC:0.15L:3S mortar mixtures were in all casesslightly higher than corresponding values obtained with the 1PC:3Smortars.The specimens were subjected relatively more to drying than to
wetting, the object being to roughly parallel average climatic condi-tions. Figures 1 and 2 show relatively more shrinkage than expansion
5 6 1Time, mo
Figure 2.— Typical linear changes in masonry and portland cement mortarssubsequent to hardening
.
over the course of a year, possibly due to the preponderance of
drying.
It may be noted (figs. 1 and 2) that the greatest shrinkage for all
mortars occurred during the first drying period. Of the masonry andstraight portland-cement mortars, this shrinkage was greatest for
specimens of wet consistency for all mortars except A I, B II, BVI, B IV, and B V, being greatest with dry consistency with mortarsA I, B VI, and B II, greatest with intermediate consistency in thecase of B V, and there was the same average value with both consis-
tencies, wet and dry, in the case of B IV. The greatest variation withconsistency was had with mortar B XII, the average shrinkage being0.020, 0.034, and 0.041 percent for specimens of dry, intermediate,and wet consistencies, respectively, during the first drying period.
The corresponding values in the case of mortar A I in which shrinkagevaried least with consistency were 0.061, 0.061, and 0.064 percent,respectively. Thus there was a maximum variation of 100 percentand a minimum of 5 percent between the different consistencies in
this group of mortars.
21 See reference, footnote 11.

622 Bureau oj Standards Journal of Research [Vol. It
In the case of straight lime-sand mortars this variation was rela-
tively high (50 to 300 percent) as would be expected since both the
shrinkage and expansion subsequent to hardening in these mortarswas relatively very low. The variation in shrinkage with consistency
among the portland-cement-lime mortar mixtures was usually less
ZIOO
tg" IZOO
\^ 900
§;';* 600
BEH.C.No.Z
BI HM.CHo.1
Proportions, 1 M.C 33 (by dry bulk volume)
Legend: V\ denotes compressive strength at 3mos.
~ % denotes increase in compressive strength ' gjduring the time, 3mos. to 1 year. M.C.I
D. - Dry consistency
I. - Infermediafe consistency
W. - Wet consistency
B2EM.C.Ho.lZ
BI7M.CMi
M.C.No.5 SW BW BUTT1
M.C.No.6 M.C.No.7 M.C.No.8
wmnmBM
11. C. Ho. 11
BSEM.CHo.13
a i. w. d. i. vi. d. i. w. a i. iv. a i. w. a i. w. d.lw. d. i. w. d. i. h d.lw. d. i. w, d.lw.
Figure 3.
—
Average compressive strengths of 2-inch mortar cubes at 3 monthsand 1 year.
than that characteristic of the masonry cement and straight portland-cement mortars, ranging from 3 (mortar XTd) to 53 (mortar YRc)percent. For all but 12 (XKd, XSc, XTb, XRc, XVc, XVd, YSa,YTd, YRa, YRc, YVb, and YVd) of the 32 portland-cement-limemixture mortars, the linear shrinkage during the first drying period
3300
3000
2700
2400
2100
1800
1500
IZOO
900
600
300
Lime - Portland Cemenf Mixtures
1PC.:0.15L:35
1P.C.:1L:6S
!PC.:2L:i1PC.:3bKS
A
I
AEPC. No.!
1P.C.-.3S
PC. No. I1P.C-.3S
Legend:
denotes compressive strength
at 3 moM denotes increase in compress-
' M ive strength during the time,
'
3 mo to Iyr
P- Pry consistency
I- Intermediate consistency~
W- Wet consistency
Proportions on basis ofbulk volume.
CF
CILmeNo.Z1L--3S cm civ
Limetto.1
1L-.3S
nnn BI
LimeHo.3 UmeNo.4
1L--3S 1L-.3S
nn n nnpiD. I.W. D. l.W. D. I. W. D. I. w. a i. w. a i. w. d. i. w. d. i.w. p. i. w. a i. w.
Figure 4.
—
Average compressive strengths of 2-inch mortar cubes at 8 monthsand 1 year.
was greater for wet than for dry consistency. The values for 11 of
these 12 exceptions (excluding YRc) indicate relatively small variationwith consistency.
In the three specimens of any mortar (exclusive of straight lime-sandmortars) of a given consistency, the maximum deviation from themean value ranged from 6 to 24 percent, being greatest in the caseof those mortars undergoing relatively small changes in length.

Palmer'
Parsons. Adhesion of Mortars to Bricks 623
(d) COMPRESSIVE AND TRANSVERSE STRENGTH
Compressive and transverse strengths are plotted in figures 3, 4,
5, and 6. In figures 3 and 5 the heights of the vertical columns for
the portland-cement-lime mixtures are averages for each consistency
of the eight different portland-cement-lime combinations in each of
the four definite proportions (1PC:1L:6S, 1PC:2L:9S, 1PC:3L:12S,and 1PC:0.15L:3S) by volume.
It is not apparent from the graphs that transverse strength couldalways be accurately predicted from compressive strength, or vice
of all
TOO t/jmbinat/ons
60O
JOO
4O0-
<^300-
PCandL. Rx-i-land Cernerrf
No.2
ait
AI
200-
£*"
Fbr-tland Cfrnenr-gnd Lin
fli/eraqes of oil combination uof two pori~/ancl Cement.?and -four* limes
Nol No.2 No.3 No. 4
Legendjranvt/ffr&e <sfr&ngi~h a+ 3moaain in -transi/er-je ^frs-ngth
3mo fo 1yrD dry consistenoy,
I /rrfermedierte consi^-fency.
W ysei- consistency-
DT VV Clr/ D IW D X W DI W D I &1:0.15:3 j:o:3 1:0:3 1:1: e 1:2:9 1:3: is
D X W O X W D r W0:1:3 0:1:3 0:1:0
CoT-hsist&ncy and Fhoporrion>5
Figuee 5.
—
Average transverse strengths of 1 by 4 by 12 inch mortar slabs at
and 1 year.
months
versa. For example, the masonry cement mortars listed in the orderof increasing magnitude of transverse strength at the end of a year(considering all consistencies) are as follows: B XI, B VII, B VI,B V, B IV, B VIII, B XIII, B III, B I, B II (B II same strength at 1
year as at 3 months), B XII, and B X. Listing these same mortarssimilarly on the basis of compressive strength at a year, the order is:
B VI, B VII, B XI, B III, B VIII, B XIII, B V, B I, B IV, B XII,B X, and B II (last two nearly equal). The transverse strength test-
specimens differed materially in size and shape from those used in
determining compressive strength.

624 Bureau oj Standards Journal oj Research [Vol. 12
It is seen, figures 3, 4, 5, and 6, that higher transverse and compres-sive strengths were associated with drier consistencies, two notableexceptions being portland cement mortars A I and A II which werevery low in water retaining capacity. During the first week in theconstant temperature room, from visual inspection, specimens of these
mortars apparently dried more quickly than specimens of mortars of
higher water-retaining capacity. Specimens of mortars of A I andA II of wet consistency retained more moisture during the week'sinitial drying than those of dry consistency, there being more waterinitially present in the former case. Hence, it may be concluded thatthere was a greater degree of early hydration in mortars A I and A II,
of wet consistency than was the case when the initial consistency wasdry. This may have more than compensated for the fact that ordi-
narily in wet storage, portland cement mortar specimens of dryconsistency would naturally have a higher density (less void space)
k 3SO
"^ 300
$> 250
^ ZOO
1501
BE
BI
Leqencfi
BET
\i = Transverse sfreng/h erf"3mo
rr r1
1 1 ii = Oaf/7 in fro/isyerse sfrerrgfh BXfrom 3mo fo 1
'yrP = Dry cons/sfencyI = Intsr/necffafe "
W = WefProportions 6>y bu/A yo/csme,
IMC : 3 Sane/BW
BIT BV BW BW £"""
BM
BM
D 1 W D I W D T W D I W DI W D I V\l D I W D I W DI W D I W D I W D INot No.2 No.3 No4 No.5 No-6 No.7 No.8 No.lO Noll No.lZ No.13
Masonr~Lf C&merrfcs
Figure 6.
—
Average transverse strengths of 1 by 4 by 12 inch mortar slabs at 3months and 1 year.
and hence greater strength on that account than specimens frommortars of wet consistency. In this connection note that the strength,
compressive and transverse, was highest for dry consistency in
portland-cement-lime mortar mixtures. It has already been shown 22
that the substitution of lime for portland cement decreases the waterloss by suction. It is probable that water loss through capillary move-ment and surface evaporation during a few days subsequent to theremoval of the cubes from the molds is similarly reduced.The plotted data of figures 3 to 6, inclusive, show that both the
compressive and transverse strength of the mortars which were richerin portland cement than the 1:1:6 mix, were greater than that of theothers. The average strength, either compressive or transverse, of
the 1 PC:lL:6S mortar mixtures was equal to or greater than thatof the strongest of the 12 masonry cement mortars, B II, B X, andB XII, and that of the IPC : 2L : 9S mortar mixtures compared fa-
vorably with 6 of the masonry cement mortars, B III, B IV, B VII,B VIII, B XI, and B XIII. Moreover, the compressive strengths of
2 2 See footnote i

Palmer]
Parsonsj Adhesion of Mortars to Bricks 625
both 3 months and year old specimens of the straight lime mortar,C II (lime no. 2), compared favorably with corresponding valuesobtained with masonry cement mortars B XI, E VII, B VI, and B III.
The 1 : 3 lime mortars, C I, C III, and C IV, were weaker than any of
the other mortars.The strength of a portland-cement-lime mixture mortar was not
determined by the strength of either of the two mortars containingonly portland cement or only lime, with sand. This is evident fromthe data of table 6 and figure 3. Possibly the density of the portland-cement-lime mixture, as influenced by its grading, was the mostimportant factor.
Table 6.
—
Maximum and minimum compressive and transverse strengths of lime-portland, cement mortar mixtures at 3 months and 1 year
[Values are averages for 3 specimens]
[D denotes dry, I intermediate, and W wet consistency]
Compressive strength
Mortar mixture 3 months 1 3rear
Maximum Minimum Maximum Minimum
1PC:1L:6SLb/in*
888 (XVa-D)459 (XVb-D)455 (XVc-D)
2,833 (XVd-D)
Lb/in .2
410 (XRa-W)189 (XRb-W)134 (XRc-W)
1,081 (XRd-I)
Lb/in .2
1, 136 (XVa-D)750 YSb-W)620 (XVc-D)
3,755 (YSd-D)
Lb/inl448 (XRa-W)302 (XRb-I)1PC:2L:9S
1PC:3L:123 203 (XRc-W)1PC:0.15L:3S 1,216 (XRd-W)
Transverse strength (modulus of rupture)
Mortar mixture 3 months 1 year
Maximum Minimum Maximum Minimum
1PC:1L:6S1PC:2L:9S
Lbfin.'282 (XTa-D)153 (XTb-D)136 (XSc-D)692 (XTd-D)
Lb/ in .2
115 (YSa-I)80 (XVb-W)76 (YSc-W)
187 (XVd-W)
Lb/in.*3?9 (YVa-D)263 (YTD-D)209 (XSc-D)761 (YTd-D)
Lb/in*17a (XRa-W)138 (YVb-W)
1PC:3L:12S1PC:0.15L:3S :
97 (YRc-W)367 (XVd-W)
Of the portland-cement-lime mortar mixtures, the greatest variationin compressive strength with consistency in any mortar was 82 percent(mortar XVc) and the least was 3 percent (mortar YTc) . The densityof specimens of mortar XVc varied with consistency to a much greaterextent than was the case with mortar YTc. With the portland andmasonry cement mortars the corresponding figures are 74 percent(B II) and 11 percent (B XII). In transverse strength measure-ments, the corresponding variations were 70 percent (XVd) and 5
percent (YTb) in the case of portland-cement-lime mortar mixturesand 63 percent (B II) and 2 percent (B XII) among the portland andmasonry cement mortars.The percentage variations in results obtained with individual
mortars of the same consistency were higher generally in the case of
compressive strength test data (2 to 41 percent at 3 months and 2 to
28 percent at 1 year) than was the case in tests for transverse strength

626 Bureau oj Standards Journal of Research [Vol. it
(4 to 32 percent at 3 months and 1 to 24 percent at 1 year). Ex-cluding the straight lime-sand mortars, the weakest masonry cementmortars and the IPC :3L:12S mortar mixtures, the variations amongindividual specimens of a kind seldom exceeded 10 percent in either
transverse or compressive strength tests.
(e) MODULUS OF ELASTICITY AND EXTENSIBILITY
The extensibility of a mortar specimen is the amount per unit of
length that the specimen will elongate before rupturing in tension.
For the present purpose, extensibility is considered as obtained bydividing the modulus of rupture (MR) by the modulus of elasticity
(ME), and the result is expressed as inches per 100,000 inches.
A grouping of the elasticity moduli and extensibilities of all mortarsdetermined both at 3 months and 1 year is given in table 7. Themodulus of elasticity varied both with time and consistency as shownin this table. For example, mortar XTd of intermediate consistencywhen made, had a modulus in the 2,000,000 to 2,250,000 group at 3
months and was in the highest (5,000,000 to 5,500,000) group at 1
year.
Table 7.
—
Moduli of elasticity and extensibility of mortars at 3 months and 1 year
[Each number in the second column is the average of 3 tests]
!d, dry consistencyi, intermediate consistencyw, wet consistency(D, dry consistency
5 Li1-year-old specimens-^, intermediate consistency[W, wet consistency
Moduli of elasticity
group Mortars in group and their extensibilities X 105
Lb./inS5,000,000 to 5,500,000
Inches per 100,000 inchesXTd: I, 14.
4,500,000 to 5,000,000 XTd: D, 14; W, 15.
4,000,000 to 4,500,000
3,500,000 to 4,000,000 XSd: I, 18.
3,000,000 to 3,500,000 A I: I, 25. A II: I, 21. XSd: D, 21; W, 22.
YTd: D, 24.
2,500,000 to 3,000,000 XSd: i, 24. A I: D, 23. A II: D, 21.
YSd: D, 26; I', 25; W, 26. XVd: D, 22.
YTd: I, 25; W, 25. YRd: I, 25; W, 28.
YVd: D, 28; I, 25; W, 24.
2,250,000 to 2,500,000 XTd: d, 28. YSd: i, 20. YTd: d, 26; w, 24.
A I: W, 23. A II: W, 21. XRd: D, 20; W, 20.
2,000,000 to 2,250,000 A II: d, 21; i, 25; w, 26. XSd: d, 27.
XTd: i, 31; w, 32. YSd: d, 20. YTd: i, 27.
YRd: w, 19. XRd: I, 24. XSa: I, 17. XVd: I, 24.
YRd: D, 28.
1,750,000 to 2,000,000 A I: d, 20; i, 26. XSd: w, 27. XVd: d, 25.
YRd: d, 20; i, 21. YVd: i, 24. B X: D, 20.
XSa: D, 16. XTa: I, 19. B XII: I, 17.
1,500,000 to 1,750,000 A I: w, 28. XRd: d, 29; i, 25; w, 25. XSd: i, 31.
XVd: i, 20. YSd: w, 20. YVd: d, 23; w, 22.
B X: I, 25. Xsa: W, 18. B II: D, 26. XTa: D, 20.
B XII: D, 20. XVa: D, 23. XVd: W, 25. YVa: D, 25.
1,250,000 to 1,500,000 B X: d, 20. XVd: w, 20. B X: W, 24.
XTa: W, 18. B XII: W, 21. XVa: W, 21.
YSa: D, 25; I, 25; W, 26. YTa: D, 26; I, 26.
YRa: D, 25. YVa: I, 23.

Palmer'
Parsons^ Adhesion of Mortars to Bricks 627
Table 7.
—
Moduli of elasticity and extensibility of mortars at 3 months and 1 year-
Continued
Moduli of elasticity
groupMortars in group and their extensibili' ies X 105
Lb./inJ1,000,000 to 1,250,000
Inches per 100,000 inchesB X: i, 25; w, 20. XSa: d, 23; i, 23.
B II: d, 35. XTa: d, 26; i, 22. YTa: d, 20.
YRa: d, 21. B III: D, 27; I, 28.
XRa: D, 22; I, 19. B VI: D, 16.
B I: D, 25; I, 28. XSb: D, 22. B II: I, 28.
XSe: D, 20. B XIII: D, 25. B IV: D, 20.
B VIII: D, 23. XTb: D, 19. B V: D, 19.
XVa: I, 25. XVb: D, 22; I, 21. XVc: D, 19.
YSb: D, 25. YTa: W, 28. YTb: D, 23; I, 25.
YRa: I, 28. YVa: W, 29.
900,000 to 1,000,000 B III: w, 19. B I: d, 21; w, 14.
B II: i, 35; w, 31. B XII: d, 24; i, 25.
YTa: w, 19. B III: W, 30. B VII: D, 22.
XRa: W, 20. B II: W, 26. B XIII: I, 23.
B IV: D, 21; I, 22. B VIII: I, 24. B V: W, 22.
XVb: W, 24. Ysb: I, 25. YRa: W, 29.
800,000 to 900,000 B III: d, 17. XSa: w, 25. XTa: w, 28.
YTa: i, 20. YRa: i, 23. B VI: I, 20; W, 21.
B I: W, 30. XRb: D, 22; W, 23. XSb: I, 20.
XSc: I, 22. B XIII: W, 23. B VIII: W, 25.
B V: I, 20. XRc: D, 21. YSb: W, 30. YTb: W, 29.
700,000 to 800,000 B III: i, 20. B VII: d, 27. B XI: d, 21.
B I: i, 22. XSb: d, 25. B IV: i, 26.
B V: d, 24. XVa: d, 26. YRa: w, 23.
YVa: d, 21; i, 22. B VII: I, 22; W, 23.
B XI: D, 21. XRb: I, 24. XSb: W, 25.
XSc: W, 26. XTb: I, 22. XTc: B>, 23.
XRc: I, 21; W, 18. YSc: I, 26. YTc: I, 25.
YTc: D, 24; W, 25. YRb: D, 24. YVb: D, 28.
600,000 to 700,000 B VII: i, 25; w, 21. B VI: d, 22. XRb: w, 24.
XSb: i, 22. B XIII: d, 22. B IV: w, 26.
B VIII: d, 22; i, 20; w, 21. XTb: d, 23; i, 25.
B V: i, 24; w, 24. B XII: w, 28. XVa: i, 25; w, 26.
XVb: d, 21. YSa: i, 18; w, 21. YSb: d, 21.
YTb: d, 18. YVa: w, 20. XTb: W, 24. XTc: I, 25.
YSc: D, 27; W, 26. YRb: I, 26. YVb: I, 25.
500,000 to 600,000 B XI: i, 21. XRa: d, 29; w, 24. B VI: i, 22.
XRb: d, 26. XSb: w, 25. XSc: d, 27.
B IV: d, 29. XTb: w, 25. XVc: d, 22.
YSa: d, 20. YSb: i, 22. YTb: i, 21; w, 21.
YVb: d, 21. YVc: d, 21. B XI: I, 23.
C II: D, 27; W, 25. C III: D, 21; W, 18.
XTc: W, 26. C IV: D, 22; I, 19. YRb: W, 35.
YRc: D, 23; I, 20. YVb: W, 28.
450,000 to 500,000 B XI: w, 20. XRa: i, 28. B VI: w, 22.
C II: d, 28. XRb: i, 30. B XIII: i, 24.
XVb: i, 24. YSb: w, 25. YRb: d, 20.
YVb: i, 21. C II: I, 27. C III: I, 24.
C IV: W, 21. YVc: D, 22.
400,000 to 450,000 C II: i, 28; w, 26. XSc: i, 29.
C III: i, 22; w, 22. XTc: d, 23; i, 24; w, 19.
XRc: i, 25. XVc: i, 24. YSc: d, 20.
YTc: d, 25; i, 24; w, 24. YRb: i, 24; w, 26.
YRc: W, 24. B XI: W, 26. C I: I, 27.
YRc: W, 22.
350,000 to 400,000 XSc: w, 28. B XIII: w, 23. C III: d, 24.
XRc: d, 25; w, 25. XVb: w, 21. XVc: w, 25.
YRc: d, 25; i, 24. YVb: w, 25. YVc: i, 24.
300,000 to 350,000 C I: d, 34; i, 31; w, 27. C IV: i, 25.
YSc: i, 26; w, 22. YVc: w, 24. C I: D, 29.
YVc: I, 32; W, 34.
250,000 to 300,000 C IV: d, 25. C I: W, 27.
200,000 to 250,000 C IV: w, 26.

628 Bureau of Standards Journal of Research [Vol. 12
The extensibilities of all 50 mortars varied from a minimum of 14
inches per 100,000 inches (XTd intermediate consistency, at 3 months)to a maximum of 35 inches per 100,000 inches (B II, dry consistency,
at 3 months). The majority of the values were within the limits,
n16
15
14
<o 7
§ 6
lJ
3
Z
!
JPC.-3LI2S Lime No. I
IPC. :2L:9S-\ IL •• 35—IROIL-65 r"
1-
tpmIL 35
~Lime No. d~
DIW\p£ r1.CNo3
8*
-M.C.No.4
r~^-<? i ,
IZC.:3S-
w P.C.NQ.Z 2.
i—r-J Oh-IPC:35 L
PC. No. I
JHC..-35-
M.C.No.11
M.CNo.2
o - Sorption determinedat 3 mo&- Sorption determineda/ itmoD- Pry consistency
I- Intermediate consistencyW- Wet consistency
Figure 7.
—
Average 'percent sorption of mortar slabs at 3 and 11 months.
20 to 25 inches per 100,000 inches. There was a slight tendency for
the extensibility to increase as the modulus of elasticity decreased andvice versa, but there are many exceptions.
In most cases the moduli of elasticity increased with time. Thisincrease was usually greater than the corresponding increase in
nemo Line no. i
r-----, o T w oitv- E"Loi»
A A
IRC:O.ISL: 33
'.C.NB.W) ffg- if
LIME NO.3 >—-----'.A^..'j D
mM.C.N0.II */nC'3S.
in.c-.3S r wn.cmz
o -Ratio at 3 mas.& - Ratio at II mos.D- Dry consistency
I- Intermediate consistency
W- Wet consistency
Figure 8.
—
Average ratios, sorption during 15 minutes to 2 hours obtained withmortar slabs at 3 and 11 months.
modulus of rupture, hence the extensibility tended usually to decreasewith time.
(f) SORPTION
The sorption data are illustrated in figures 7 and 8. After totalimmersion for 15 minutes, the specimens were weighed and returned towater where they remained for an additional 1 % hours when they wereagain weighed. The ratios, sorption at 15 minutes to that at 2 hours,are plotted in figure 8.

Palmer 1
Parsons! Adhesion of Mortars to Bricks 629
In figure 7 it is seen that in many instances there was an appreciabledecrease in sorption (at the end of 2 hours total immersion) at 11months over that shown at 3 months. Also, the change (increase ordecrease) in percent sorption over this period of time was relativelyvery small in the case of the straight lime-sand mortars. An interest-ing fact in this connection is that any appreciable decrease in percentsorption during this period was attended by an increase in dry weight(drying in the air of the laboratory). White 23 has made similar obser-vations and discussed them at length.Each plotted point (figs. 7 and 8) for each of the 4 lime-portland-
cement mixtures (1PC:1L:6S, 1PC:2L:9S, 1PC:3L:12S and1PC:0.15L:3S) is the average of all of the 8 different mortars of thesame consistency and of thesame mixture. It is impor- au
\
j^ j,
tant to note that the averagesorptions during 2 hours (fig.
7) of the mortar mixtures,1PC:1L:6S, IPC : 2L : 9Sand 1PC:3L:12S, exceededthe average sorptions bothof the individual straightlime-sand mortars and theportland-cement-sand mor-tars. Furthermore, the de-crease in sorption over the pe-riod, 3 to 11 months, of the1PC:0.15L:3S mortar mix-tures was greater than thatof any other mortar. Themortars having lowest sorp-tions were the 1PC : 0.1 5L : 3 S,
1MC:3S (MC no. 13), andthe two straight 1PC:3Smortars.
If the ratio, sorption at15 minutes to sorption at 2hours (fig. 8), is nearly unity,then the amount of sorbedwater increased relativelyslowly with time after the initial 15-minute period of immersion.These ratios decreased with time (3 to 11 months) in practicallyall cases, the decrease being greatest in the 1PC:0.15L:3S mortarmixture and nearly zero in other cases (lime-sand mortars, limes nos.1 and 2 and MC no. 1).
The variations in measurements made with the same mortar andthe same consistency ranged from 2 to 24 percent, usually not exceed-ing 12 percent of the mean value.
2. BRICKS(a) ABSORPTION RATES
Each plotted point of figure 9 is the average number of grams ofwater per brick absorbed through the flat side areas of 15 specimensof any one make of brick during 1, 2, 3, etc., minute intervals. The
23 A. H. White, The use of lime in stuccos, Proc. National Lime Association, 1916, p. 109.
49727—34 8
/ Z 3 4 5 6 78 10 15
Time, rnin (cube roofsca/e)
Figure 9.
—
Average rates of absorption of bricksby partial immersion.

630 Bureau of Standards Journal of Research [Vol. 12
average areas of the exposed flat sides of each of the 6 makes of brickwere all very nearly equal to 30 sq in (193.5 sq cm). It is seen in
figure 9 that with this average amount (grams) of water plottedagainst the cube root of the corresponding time interval, the pointsare on straight lines in all cases throughout a certain interval of time,corresponding to the time required for the particular type of brick to
wet through from bottom to top, the water rising by capillarity. Thislinear relationship between the quantity of water absorbed by partial
immersion and the cube root of the corresponding time interval, is in
agreement with results previously published. 24
The rate of absorption of brick no. 5 was extremely slow (fig. 9).
The values at 1 minute (fig. 9) were used in subsequent calculations.
Total immersion for 15 minutes greatly reduced the absorption bypartial immersion for 1 minute. For bricks 1, 2, 4, and 6 these valueswere 3.2, 2.1, 3.3, and 3.8 grams of water per 30 square inches,
respectively.
(b) COMPRESSIVE AND TRANSVERSE STRENGTH
The average compressive and transverse strengths and the indi-
vidual maximum and minimum values of the 6 bricks are givenin table 8.
(c) EXPANSION OF BRICKS ON WETTING
The 5 specimens with each make of brick (3 bricks each, joined endto end) 25 tended generally to expand slowly during prolonged immer-sion (1 month) in water, but only to a slight extent in any case. Thisis in good agreement with the data of others.26
Table 8.
—
Compressive and transverse strengths of bricks
[Each average value was obtained with 25 specimens]
Compressive strength Modulus of rupture
Brick no.
AverageIndividualmaximum
Individualminimum Average
Individualmaximum
Individualminimum
1 _.
Lb/in.*7,4356,705
14, 7504,330
16, 0254,830
Lb/inJ8,7908,480
18, 6706,080
21, 170
7,230
Lb/in. 2
6,0004,450
11, 1503,00013,2203,650
Zfc/m.2764
2,0901,800
5292,665
609
Lb/in*880
2,8703,310
7403,340886
Lb/in.*575
2 1,0903 1,2104 305
5 1,6706 424
The linear expansions of the brick specimens during one month in
water were 4, 3, 3, 4, 0, and 4 thousandths of a percent for bricks nos.
1 to 6, respectively.
3. ASSEMBLAGES
(a) STRENGTH OF BOND
(1) General Considerations. All of the data obtained with test
series 1A to 6A (table 4), inclusive, are plotted in figures 10 and 11.
The length of the vertical line connecting all of the points for any one
24 L. A. Palmer, Some absorption properties of clay bricks, B.S. Jour. Research, vol. 3 (RP88), p. 105, 1929.
I 25 See reference, footnote 11.
W 28 R. E. Stradling, Department of Scientific and Industrial Research, Building Research Bulletin No. 3,
Effect of moisture changes on building materials.

Palmer 1
Parsons] Adhesion oj Mortars to Bricks 631
mortar, is an indication of the variability in strength of bond obtainedunder different conditions. The mortars with which strength of
Brick No. 1
Brick No.2 BnckNo.o
Legend:
o, Series I'A, brick Set dry,
•, Series Ifl, " " wet;
— a, Series 2A;:— ©, Series 3A;
a, Series 5A, without tags;
s| *, Series 5A, with " ;
I'®, Series 6A, brick set'wet
)
£-&, Series 6fl, dry.~
S-^n
M^_°?^.^
4
S§Idh_
m
-r—isr
Figure 10.
—
Average bond strengths in tension obtained with two brick-mortarspecimens.
bond varied least with the conditions were those which had the least
variation in extent of bond 27 with the types of bricks included in this
Figure 11.
—
Average bond strengths in tension obtained with two brick-mortarspecimens.
study. The important consideration is the minimum value obtainedwith any one mortar and type of brick. For example, the minimumvalue is zero, with brick no. 1 and mortar XTd (fig. 10) and this was
27 The fraction or percent of the total flatside area of a brick to which mortar adehres. Extent of bond maybe considered as the bonded area and in this investigation it was estimated from visual inspection of brokenspecimens.

632 Bureau of Standards Journal oj Research [Vol. 12
not due to total lack of strength in this mortar but to poor 28 extentof bond, and the minimum values (figs. 10 and 11) are indicative of
the poorest extent of bond when the relatively strong mortars areconsidered. It is evident from figures 10 and 11 that the strength ofbond varied over a wider range generally with certain mortars (A I
and XTd, for example) than with other mortars (XVb, XRc, B I andB VI, etc.).
It is also equally evident that the maximum bond strengths ob-tained with all mortars and brick no. 2 tended to be higher than bondstrengths obtained with the same mortars and any of the other five
makes of bricks.
It may, therefore, be said that a type of building unit may be foundthat is relatively adaptable under widely different conditions to
various types of mortars, and conversely, a type of mortar may beselected that is relatively adaptable under varying conditions to
widely different types of building units.
(2) The effect of brick suction, the water retaining capacity of
mortar and strength of mortar on bond strength. The averageamounts of water absorbed during the first minute of partial immer-sion of five of the makes of bricks ranged from 10 to 120 grams per30 square inches of brick surface (fig. 9). That of brick no. 5 was1.5 g. The " suction" (amount absorbed during the first minute)was slightly more than 20 g in the case of brick no. 2. From figures
12 and 13 note that at 3 months, for a brick suction of 20 g, in all
cases, the bond strength is very near the maximum value.
The data, plotted in figures 12 and 13, give curves typical of theother mortars. All of the six makes of bricks set diy and nos. 1, 2,
4, and 6 set wret are represented in figures 12 and 13. The bricks whenset wret (after 15 minutes total immersion) were extremely low in
suction. It is seen that the bond strength increased from very lowbrick suction to the maximum and then decreased, gradually orsharply, depending on the mortar. This steepness of descent of themortar curves depended on the water-retaining capacity of themortars.The descent of the curves for mortars XRc and B I of high water-
retaining capacity is gradual and those for mortars A I and B III
(figures 12 and 13) descend more abruptly as the maximum point is
reached and passed. It is apparent from these curves that themortars of highest strength and lowest water-retaining capacity(A I and B III) actually gave lower bond strength with bricks 1, 4,
and 6 set dry than mortars XRc, XRa, B I, and B XI, w/hich wereweaker in strength but much higher in water-retaining capacitythan mortars A I and B III. The mortars of high water-retainingcapacity were more resistant to the suction of bricks 1, 4, and 6 set
dry and as a consequence produced greater extent of bond with these
bricks than was obtained with the mortars of low water-retainingcapacity, A I and B III. The poor extent of bond with mortars A I
and B III with the porous bricks accounts for their lower bondstrength.
From the standpoint of bond strength, brick no. 2 having a rate of
absorption less than that of no. 4 (intermediate, see fig. 9) was better
28 If the extent of bond was less than 90 percent, it was called poor. Good (practically complete) extent ofbond was from 95 to 100 percent. With but very few exceptions the bond was either good or considerablylias than 90 percent.

Palmer]
Parsons] Adhesion of Mortars to Bricks 633
suited to all of the types of mortars studied than any of the otherbricks.
The initial steep ascents of all of the curves (figs. 12 and 13) is of
interest. Despite the shapes of these curves, there is apparently no
o
1°°
8?3
Relation between Brick"Suction "and strength of
bond in tension
1\ 5haded symbo
OpenIs denoi
le brick set wet" dry
N> 60
3s
#"" >s \\
1 V %k
1-
/f
fi&.
1,
-a £^ es
o
D\^1
Vy ^ *\
a
^
/
A
^ O
t
!20
Brick "Suction" g~ of wafer absorbed in I min
Figure 12.
—
Bond strength as related to brick suction and water-retaining capacity
of mortars.
justification for extrapolation to zero; it is known that mortars adhereto glass bricks of zero absorption. The bond strengths between zeroand about 30 g suction were highest with mortars of high strength.It is evident also from figure 14, in which the maximum bond strengths
60
ftelation between Brick "Suction
'
ana1sfrengfn ofbond in fens/on
Shaded symbols denote brick sefwetOpen " " " " dry
Figure 13.-
Bn'ck "Suction ", g ofwafer absorbed ir? / min
-Bond strength as related to brick suction and water-retaining capacity
of mortars.
of mortars at 3 months are plotted against the logarithm (base 10) ofthe compressive strengths of the mortars at 3 months, that thebond strengths were highest with mortars of high strength, providedthat the extent of bond was good.When the brick suction was 60 g per minute or greater, the highest
strength of bond at 3 months was obtained with mortars of medium

634 Bureau of Standards Journal of Research [Vol. IS
00
130
§100
\ 90
%eo
$ 10
strength and medium or high water-retaining capacity. This is
apparent from inspection of the curves in figures 12 and 3. Forexample, the curve for mortar A I crosses below the curves for XRaand XRc as the brick suction increased beyond 60 g. Moreover, thecurves for mortars XKa and XRc approach one another in this region.
Mortar A I had very much higher compressive strength and muchlower water-retaining capacity than either mortar XRa or XRc.Mortars XRa and XRc differed more in water-retaining capacity(XRc higher) than in strength (XRa higher).
Bond strength was dependent both on the intensity and extent of
adhesion of mortar to bricks. When very low bond strength wasobtained with the strongest mortars, inspection of the broken speci-
mens showed the extent of bond to be small, the bonded area beingoften less than 25 percent of the bonding area. The extent of bondwas practically 100 percent in all tests where the brick suction was
at or less than the opti-
mum (about 20 g). Withthe extent of bond as goodas this, strength of bondwas dependent more on thestrength of mortar than onany other single factor.
This is apparent from fig-
ures 10,11, and 14.
(3) The effect of shrink-
age on bond strength dur-ing early hardening of
mortars. Consider mor-tars A I, XTd, XRa, XVb,XRc, C I, C II, B IV, andB XI, as used with brick
no. 3 (set dry), figure 10,
and with brick no. 5 (set
dry), figure 11. Theshaded triangle designates
the strength of bond in specimens of series 5A (tested at 3 months)that contained metal lugs in the mortar joints which theoretically
would increase any damage to the bond resulting from early shrink-
age. The positions of these points should be compared to those of theopen triangles (no lugs, all other conditions the same). In somecases the strength of bond with lugs was actually greater than thatobtained without them. The vertical distances between the twotriangles are in all cases small and indicate, therefore, that the early
shrinkage had no effect on the bond. The absorptions of bricks 3
and 5 were low, that of 5 being nearly zero, hence the shrinkage duringearly hardening of mortars between these bricks should have beencomparable to that measured with the specimens of the same mortarscast in metal molds.
(4) The combined effect of shrinkage during early hardening, andof compacting of mortar on a porous base, on bond strength. Theprevious section dealt with mortars on a practically nonporous base.
Freshly-made mortar begins at once to lose water when placed on a
porous base, prior to any appreciable hardening of the mortar andwith consequent diminution in volume and this compacting on a por-
Max Bond Strength (id In z) at3mo
= 60 log,o [Comp. strength at3mo(/d in.z)
of 2- in. mortar codes] - IOOs
Xia
/-9
XVa mXRc/y
XVb°
Bvr1 °n
\s BIP
Bill
)81
/ 'O oBSL
1
2.0 Z.5 3.0 3.5
Logio (Compressive strength ofmortar at age 3mo)
Figure 14.
—
Bond strength as related to compres-sive strength of mortars

PaZm] Adhesion of Mortars to Bricks 635
ous base must be distinguished from shrinkage during early hardeningwhich occurs later. Compacting is minimized when the base is a
brick of the types no. 3 or no. 5. However, shrinkage during early
hardening would tend to be greater on a nonporous than on a porousbase, since reducing the amount of water in mortars tends to reducethis type of volume change (see table 5). Compacting on a porousbase is also for the most part unidirectional, i.e., mortar in horizontaljoints is compacted chiefly in the vertical direction. Shrinkageattending hardening or cementing action is essentially omni-directional.
In test series 6A (table 4 and figs. 10 and 11) bricks 1,4, and 6 wereset both wet and dry with mortars A I and B III of low, B I and XRaof medium, and XRc and B XI of high water-retaining capacities,
respectively. In this series metal lugs were embedded in all mortarjoints. Since compacting of mortar on a porous base is a consequenceof water loss to the base, it would be expected that mortars of highestwater-retaining capacities would compact least. At the same timesuch mortars in this case (XRc and B XI) are characterized by rela-
tively high shrinkage during early hardening. The reverse was true
for mortars A I and B III. Porous bases were obtained with bricks
1, 4, and 6 set dry. The strength of bond at 3 months with this con-dition (shaded squares, figs. 10 and 11) should be compared with thatobtained when the same bricks were set wet (square with cross, samefigures). In the first case the conditions were theoretically conduciveto a maximum degree of compacting and a minimum degree of shrink-
age during early hardening. The reverse was the case with the bricks
set wet.For mortar A I, brick 1 set dry and with lugs (shaded square,
figure 10), the strength of bond at 3 months was very low and less thanthe strength obtained without lugs and all other conditions the same(series 1A, open circle). The bond strength with no. 1 brick set wet,series 6A (square with cross), was only slightly less than that obtainedwithout lugs, all other conditions being the same (series 1A, shadedcircle). In this case, the fact that brick no. 1 was wet or dry whenset was of more importance than whether or not lugs were in themortar joints.
From figures 10 and 11 similar comparisons may be made witheach of the mortars A I, B III, B I, XRa, B XI, and XRc and bricks
1, 4, and 6 set both wet and dry, with and without lugs. When thesecomparisons are made, the following will be evident: no damagingeffect on bond strength produced either by compacting on a porousbase or by shrinkage during early hardening or by both occurrenceswas noticeable when metal lugs, designed to increase such an effect
by restraining movement (in the vertical direction) of the bricks,
were embedded in the joints. A much lower strength of bond wasobtained with mortars A I and B III (low water-retaining capacity)with the dry than with the wet bricks whether lugs were or were notpresent. On the other hand with mortars XRc and B XI (high waterretaining capacity), higher bond strengths at 3 months were usuallyobtained with bricks 1,4, and 6 set dry with lugs than when thesebricks were set wet either with or without lugs. In the case of mor-tar XRa (medium water-retaining capacity) the bond strength washighest with bricks 1 and 6 set wet and brick 4 set dry. Bricks 1
and 6 each had a higher absorption rate than brick 4.

636 Bureau oj Standards Journal of Research [Vol. 12
It is indicated by the process of elimination, that the rapid stiffen-
ing of mortars of low water-retaining capacity on a porous base, anoccurrence always very noticeable with this combination of brick andmortar types, is the main cause of a poor initial bond. The compact-ing of the mortar in this case is relatively, at least, of far less impor-tance in its effect on bond strength than rapid stiffening, which ren-
ders unlikely a desirable intimacy of contact between the mortar andthe unit. It is further indicated that with such desirable contact,
there is no significant change in the early bond strength producedby even a relatively high degree of shrinkage during early hardening(characteristic of mortars XRc and B XI).
(5) The effect on bond strength of volume changes in mortar sub-sequent to hardening. The brick-mortar specimens of series 2A weresubjected to only 3 cycles of alternate wetting for 1 month in thehigh-humidity room and drying for 3 months in the laboratory (cur-
ing B, table 3). Those of series 3A were subjected to cycles of dry-ing for 18 days in the high-temperature low-humidity room and thenwetting by partial immersion (curing C, table 3). Aside from differ-
ences in the number of cycles, the degree of wetting and drying andthe temperatures during these exposures all conditions were the samein these two test series. The values in table 9, prepared from thedata of figures 10 and 11, show that, of the 15 mortars and 6 brickcombinations (total of 90), the bond strengths at 1 year were higher57 times for series 3A and 31 times for series 2A.
It is seen from table 9 that with all bricks except no. 2, the bondstrength at 1 year was usually higher in series 3A. The reverse wastrue with brick no. 2. Therefore, the strengths were not damaged bythe amount of volume change of the mortars subsequent to hardening.
Table 9.
—
A comparison of bond strengths obtained with test series 2A and 3A
[Six tests were made with each brick and mortar combination]
Volume changes subsequent tohardening
Test series with which highest bond strength wasobtained
MortarBrick no.
1 2 3 4 5 6
AI High 3A
2A3A3A3A3A
3A3A3A3A
tie
3A3A3A3A
2A
2A2A2A2A2A
3A2A
3Atie
2A2A2A2A2A
3A
3A3A3A3A3A
2A2A2A
3A
3A2A2A
3A3A
2A
3A3A3A3A
2A
2A2A
3A3A
2A3A
2A3A3A
3A
3A3A3A3A3A
3A2A
3A3A
3A3A3A3A3A
2A
XTd ._. do 3AXRa ._ do 3AXVa - do 3AXVbXRc
Intermediatedo
3A3A
CI 2ACII do 2Acm do 3ACIV do 3A
BI 3ABin 2ABIV 3ABVI do 3ABXI High 2A
It must not be concluded though that with different sands andcements or with mortars richer in cements than those herein de-scribed, there could be no damage to the bond through volumechanges in the hardened mortars. 29
29 See reference, footnote 2.

Palmer "1
Parsons] Adhesion of Mortars to Bricks 637
25
^~Relation Between Standard Deviation
and BondStrength
Standard deviation -Y^tj ;20
d= deviation frorr
n=6-o Age 3 i
A « /j
mean ofn ;
*lb
noA
10
/ru-
i
u a-Tf"
"i
5U>> j-"<Jo o
ZJt?r^?
30 40 50 60 10 60
;rage Bond Strength, Ib/in2
Inspection of the broken specimens, series 3A and 2A, showed goodextent of bond in all cases. Unbonded areas were altogether lacking,
a condition not always realized in walls of buildings. There weremore surface cracks on mor-tar joints with mortars AI, XTd, XRa, XVa, and BIV, series 3A, than werenoted with these mortarsin series 2A. Such cracks,
however, which developedduring drying, tended to
heal during wetting.
(6) The increase instrength of bond with time.
That bond strength inc-
reased with time is evidentfrom figures 10 and 1 1 whena part of series 1A is com-pared with all of series 2A.All specimens of series 1Awere tested at 3 months andthose of 2A at 1 year. Notefirst the relative positions of the shaded circles and the open squareswith bricks 1, 2, 4, and 6 (set wet), then those of the open circles andopen squares with bricks 3 and 5 (set dry). The vertical distances
between the points as in-
dicated varied with themortar, being generally pro-
portional to the correspond-ing increase in compressivestrength of mortar cubesfrom 3 months to 1 year(figs. 3 and 4). In a veryfew instances (mortars BVI and B I with brickno. 1) the bond strengthat 3 months was appreci-ably greater than at 1 year.
(7) Statistical treatmentof bond strength data.Figures 15 and 16 show a
Figure 15.
—
Average standard deviations com-puted from test series 1A and 2A as related to
average bond strength obtained with 15 mortarsand 6 makes of bricks.
100
00
80
70
"C 60
50
40
50
20
1 1 1 1 1 1 1 I 1 1 ! 1
COEFFICIENT OF VARIATION
Where coefficient oF variation = (average standard
—c
A Note-- (a) Each plottedpoint represents
the ratio of the averages obtained for
one morhar at one age with six kinds
1- \\(b) Standard dei/iaf/on = \\^- ;
\ \ n-2
\\n = 6 ; d= deviation from mean of
7 va/ues.
o , Aqe 3 mo\A
v \ *, - iyr
V
5i.
A
c >
il"-O A A.
i
c o A Ao £-*
10 20 30 40
Average Bond Strength
80
between bondand standard de-In obtaining theseonly those speei-
whicli the extent
Figure 16.
—
Coefficients of variation computedWJL
^yiiVJL
\
from the data plotted in figure 15 spection.of tJie broken
specimens) was good andfor which all conditions including exposure and method of making thespecimens were the same have been considered. The results includedin the computations, therefore, were those obtained with bricks1, 2, 4, and 6 set wet with all mortars and bricks 3 and 5 (relativelyimpervious) set dry with all mortars. This included a part of series1A (3-month tests) and all of series 2A (1-year tests).
relation
strengthviation.
relations
mens in
of bondspection

638 Bureau of Standards Journal of Research [Vol. 12
LortarA value was obtained for the standard deviation for each mortarand brick combination and for each of the two test ages (3 monthsand a year) with the formula: 30
Standard deviation-v.
2d2
multiplied by 100.
In this formula, Hd2is the sum of the squares of the 6 deviations
from the mean of n (equal to 6) tests, the number of tests made with1 brick and mortar combination and at a definite age, 3 months or
a year. In figure 15 the average of 6 standard deviations as computedabove, all for the same mortar and age but with all 6 makes of brick,
is plotted against the average of the 6 corresponding bond strengthaverages. Each plotted point, therefore, represents the results of
tests of 36 test specimens (1 age, 1 mortar, 6 makes of brick).
The coefficients of variation, figure 16 (representing coefficient of
variation as related to average bond strength) are the ratios,
average standard deviation,
average bond strengthIt is seen in figure 16 that the coefficient of variation increases most
rapidly with decreasing bond strength for average bond strengths less
than 20 lb/in. 2 For strength above this value, the change in coefficient
of variation is less marked. By selecting materials and conditions
such that a bond strength of 20 pounds or more per square inch mayreasonably be expected, fairly reproducible and representative bondstrength values could be obtained with a fewer number of specimensthan would be required when working with materials and conditionslikely to yield bond strengths below this value.
(b) DURABILITY OF BOND
Test series 4A, 7A, 8A, and IB (table 4) were made for the purposeof studying bond durability. Of series 7A, including all bricks andall of the 15 mortars, there were only two cases of bond failure duringa year of alternate wetting and drying that preceded the freezing andthawing tests. These failures occurred with mortar B XI used withbrick no. 1 and C I with brick no. 6, set wet. Both mortars were of
low strength.
The results obtained with test series 7A are summarized in table 10.
Table 10.
—
Bond durabiHty of 2 brick-mortar specimens (series 7A) .
Total number of freezing and thawing cycles endured without bond failure by 3 specimens
MortarBrick number Average
1 2 3 4 5 6
A I 10510558651514305014
688
105105105
105105708327232685322873
105
1051051051051057613
482012
105
10510554
10510
11267
105
105105105105105472
999
3610510510535
105
10583842117
77
7105105105105
6
105XTd 105XRa... -_ 79XVa 91XVb 47XRc 31
C I 12
C II 34C III 15
C IV 10B I 85B III 105
|105 105
B IV 105 105J
105 105B VI 105
57
105 1 105105 105
105B XI 51
Average .. . . ._ _ 58 69 81 G2 66 57 65
3° Biometrika, vol. 10, p. 525.

Palmer 1
Parsons\ Adhesion of Mortars to Bricks 639
The number of cycles of freezing and thawing endured withoutfailure given in table 10 is computed by adding the total number of
cycles endured by the three like specimens. If one specimen should
survive only 13 and the other two 35 cycles, the total number of cycles
endured would be 83 as in the case of mortar XVa and brick no. 2.
The number, 105, is, therefore, a perfect record and a diminution in
total number of cycles endured shows a lessened bond durability
under the conditions of test.
Bond durability decreased as more and more lime was substituted
for portland cement, the record of XRC, a IPC : 3L :12S mortar beingabout the same as that of C II, a straight lime-sand mortar. On the
basis of approximate strength equality, mortars XRa, XVa and XVbshould have been as resistant to freezing and thawing as masonrycement mortars B III, B IV, and B VI which was not the case. Thereis also another factor to be considered. It is observed (fig. 7) that thesorption of these portland-cement-lime mortar mixtures exceeded that
of mortars of masonry cements nos. 3, 4, and 6. The data indicate,
therefore, that the two properties, strength and sorption of mortars,were of primary importance in getting bond durability.
Excepting brick no. 3, the average number of bond failures did notvary appreciable with the make of brick. Brick no. 5 set dry had a
lower absorption rate than bricks 1, 2, 4, and 6 set wet. Brick 3, also
set dry, had an absorption rate somewhat greater than that of thebricks set wet. As indicated in figures 12 and 13, a certain degree of
absorption is, within limits, a factor that improves the strength of
bond, possibly by increasing the mortar strength (by increasing thecement-water ratio), yet without removing too much of the waterfrom the mortar. This condition was more closely approached bybrick 3 set dry in series 7A than by any of the other bricks of that series.
This again indicates that an increase in strength of mortar is attendedby an increase in bond durability, all other conditions being the same.The fact that the averages in table 10 of bricks 1 and 6 were lower
than those of bricks 2, 4, and 5 may possibly be explained by the fact
that the bonding areas of bricks 2, 4, and 5 were more rough anduneven than those of bricks 1 and 6.
The percentage failures of specimens of test series 8A (mortarsA I, B I, B IV, B XI, XRa, and XRc with bricks 2, 3, and 4) whichwere a month old when first subjected to freezing and thawing is
compared in table 11 with the corresponding percentage failures of
specimens of the same mortar and brick combinations (included in
test series 7A) that had aged a year when freezing and thawing wasbegun.
Table 11.
—
Percentage of specimen failures
Percentage failures during 35 cycles of freezing and thawing
Mortar Brick no. 2, aged Brick no. 3, aged Brick no. 4, aged
1 month 1 year 1 month j 1 year 1 month 1 year
A I .
Percent
17
Percent
33
Percent
17
3317
1100
Percent
33
Percent
50
83
Percent
B IB IV oBXI 33
i 100
6733
2 100
XRa 33XRc . 2 100
Average _. 25 39 28 6 22 28
1 No failures during first 10 cycles of freezing and thawing.2 At least 1 specimen survived first 10 cycles of freezing and thawing.

640 Bureau of Standards Journal of Research [Vol. It
The results (table 11) do not indicate an increase in resistance to
freezing and thawing with aging specimens except in the case of brickno. 3.
The results obtained with test series 4A are presented in table 12,
In this instance brick suction was controlled by partially immersing5 groups each of 24 bricks for 0, 1/4, 1,3,5, and 15 minutes, respective-ly. The average suction (g of water per minute per 30 sq in.) was58 g for bricks set dry and 40, 26, 16, 12, and 3.3 g after partial
immersion for 1/4, 1, 3, 5, and 15 minutes, respectively.
Table 12.
—
The strength of bond of specimens of test series 4
A
[Each average value was obtained with 12 specimens]
Mortar XRa and brick no. 4
Group Brick suc-tion
Averagebond
strengthIndividualmaximum
Individualminimum
Total areaof section offailure rep-resented byfailure ofbrick
No. 1
958402616
12
3.3
Lb/in*49.248.650.950.855.945.2
Lb/in*75.569.468.378.481.567.1
Lb/in.i
30.832.423.122.237.8i.O
Arg per-centage
25No. 2 19No. 3 35No. 4 40No. 5... 10No. 6—
1 Failed during freezing and thawing.
After 35 freezing and thawing cj^cles (with intermittent drying after
each 5 cycles) the specimens of test series 4A were tested for strengthof bond in tension. The bricks were apparently weakened by freezing
and thawing to a degree such that their strength in tension was notmuch greater than that of the mortar. The percentage failure in thebrick when the specimen broke in tension was estimated as carefully
as possible for each of the 12 specimens of a group and the averages of
these percentages are recorded in column 6 of table 12. In specimensmade with brick no. 4, not subjected to freezing and thawing andtested for bond strength, the bricks were almost invariably strongeiin tension than mortar XRa.The data (table 12) show that best results were obtained with bricks
having a suction from 12 to 40 g per minute. The average bondstrength values do not differ to the extent characteristic of the 3
months strength of bond data (fig. 12) and this fact may indicate thatfactors other than early bond strength affect the bond durability.
The individual variations (maximum and minimum values, table 12)were somewhat greater than would be predicted from the plotted dataof figure 16 where specimens not subjected to durability tests are
considered. This indicates partial or complete destruction of bondby alternate freezing and thawing.No bond failures occurred in test series IB (table 4). The presence
of vertical joints in these specimens did not render them less resistant
to freezing and thawing than the specimens without vertical joints.
It is difficult to devise a freezing and thawing test that may begenerally considered as paralleling exposures of walls. The tests
described herein were probably unduly severe insofar as those mortars

Palmer i
Parsons} Adhesion of Mortars to Bricks 641
which gain strength relatively slowly are concerned and fair to the
mortars of outstanding hydraulic properties. It is a well-known fact
that mortars of many of the natural cements require many years for
the development of any large percentage of their ultimate strength.
The same is true for lime and rich in lime mortars. In buildings,
many cycles of freezing and thawing of the water within the masonryare completed far more slowly than is the case in such laboratorytests and hence in practice, there is far less likelihood of damage to the
mortar prior to its attainment of higher strength with consequentincreased resistance to weathering than obtains in the laboratorytests. Furthermore, the procedure, thawing specimens under water,has no parallel in conditions obtaining in walls generally, and is likely
only indicative of what may be expected of masonry below grade andin a severe climate. A satisfactory weathering test is at the best a
moot subject and this fact should be borne in mind in reviewing thedata here presented.
(c) THE TRANSVERSE STRENGTH OF BRICK BEAMS
The results of the flexure tests with specimens of test series 1 C and2C (table 4) are presented in table 13.
Table 13.
—
Transverse tests of brick beams (5 bricks, single tier, 4 intervening mortarjoints)
[Values are averages of 3 tests]
Modulus of rupture, brick number—
Mortar1 (set wet) 2 (set wet) 3 (set dry) 4 (set wet) 5 (set dry) 6 (set wet)
3
months1
year3
months1
year3
months]
year3
months1
year3
months1
year3
months1
year
AIXTdXRaXVaXVbXRcCICIIcmCIVBIBinBIVBVIBXIAverage-
Lb/in*152.0U9.756.642.945.129.8
2.028.52.0
2.0
18.1
U9.9i.O
40.812.9
23.1
Lb/in*1115.2130.693.995.582.045.020.643.927.729.359.865.5i.O
60.517.8
59.2
Lb/in?208.
1 132. 3
86.847.642.024.22.0
32.22.0
2.0
39.542.166.836.211.9
50.0
Lb/in. 2
1119.8171.149.570.046.921.226.663.228.031.336.883.4110.260.218.6
62.5
Lb/in .2
139.4138.873.568.239.930.42.0
39.32.0
2.0
13.5133.2136.668.514.8
33.1
Lb/in.*166.4215.4158.5179.2157.957.22.0
19.611.210.220.3
136.597.6129.1
19.1
84.7
Lb/inJ100.7126.090.588.883.435.02.0
26.82.0
2.0
47.134.417.1
61.916.1
47.9
Lb/in. 2
144.81 128. 2
92.981.2106.035.513.07.4
14.413.577.647.0U.982.230.5
58.4
Lb/in .2
1 18.21 4.1
15.86.810.415.22.0
13.02.0
2.0
12.113.213.2
21.11.6
7.4
Lb/in*189.1166.7147.038.848.643.920.235.29.02.0
23.320.980.781.518.2
54.9
Lb/in .-
10.01 149. 2
104.7122.988.742.12.0
32.92.0
2.0
il.O
U8.2il.O
68.418.3
43.2
Lb/in*1 123.
7
1 155. 3
150.3148.395.046.86.4
51.219.520.340.648.81.8
129.116.7
70.2
1 Poor extent of bond obtained with at least one of the test specimens.2 All 3 beams failed prior to the time of testing, extent of bond good, failure in the mortar.
The most concordant results (table 13) were obtained with mortarsXRa, XVa, XVb, XRc, B III, and B VI and with bricks 1, 2, 3, 4,
and 6. These mortars were of low (B III), intermediate (XRa andXVa), and high (XVb, XRc, and B VI) water retaining capacities.
Where low values were obtained with mortars A I, XTd, and B IV(high strength and low water-retaining capacity), 1 or more of the3 beams failed prior to the time of test. Mortars A I, XTd, andB IV had low shrinkage during early hardening, and high volumechanges subsequent to hardening. Failure in such cases was at thejuncture of brick and mortar joint and on inspection it was seen thatonly portions of the bonding areas of the bricks had been bonded

642 Bureau of Standards Journal of Research [Vol is
initially. When there is such a poor extent of bond it may be possible
that volume changes in the mortar may break it. It is difficult to
account for such instances of failure on any other basis.
The poor extent of bond was likely caused by the fact that themortars of low water-retaining capacity tend to lose water on standing.
This was not due to suction, as in making the beams all bricks havingany appreciable suction were first wetted. The water in the mortarsof low water-retaining capacities tended to separate out from thesolid material while it remained on a brick and prior to pressing downthe next higher brick of the test specimen. The time taken to putbricks in place was longer in the case of the 5-brick beams than it
was in making the 2-brick mortar specimen. In the latter case there
was not time for the mortars to lose water before the top brick wasplaced.
Inspection of broken specimens showed clean areas on the bottomsof upper bricks corresponding to depressed areas on the mortar bedswhere water had collected when the beam was made. In this con-nection " water-carrying capacity'' has been discussed in a previouspublication 31 and it was observed that the mortars of low water-retaining capacity had also usually low water-carrying capacity.
Failure was for the most part in the mortar itself in the case of
mortars XRa, XVa, XVb, XRc, and B VI. In these instances
separation of water from solid on standing did not occur and thebond between brick and mortar was stronger than the mortar, bothat 3 months and a year. This was true also for the straight lime-sandmortars, but in this case it was impossible to move the specimensfrom one storage to another during the early aging period withoutcausing failures in the mortar.Mortar B III was to some extent unique in that it exhibited low
water-retaining capacity on a porous base and yet had relatively less
tendency to lose water by segregation when on an impervious basethan the other mortars of low water-retaining capacity. Mortar B III
was characterized by low-volume changes subsequent to hardening(see fig. 2). Failure with this mortar was usually at the juncture of
brick and mortar, as was also the case with mortars B I and B XI,both highly stearated and of high water-retaining capacity. It is
believed that the quantities of water-repellent materials in mortarsB I and B XI may have been excessive and that at the time of makingthe specimens, this prevented the desirable degree of contact betweenthe cementing material and the brick surface.
Brick no. 5 was semivitrified and smoother than most side-cut
bricks, and there were more failures at the juncture of brick and mortarwith this brick than with any of the other five.
(d) COMPRESSIVE STRENGTH OF BRICK PIERS
Those 3-brick portions of the beams that remained intact when thebeams were broken were tested for compressive strength. Typicalresults are given in figure 17 where the compressive strengths of piers
a year old are plotted against the compressive strengths of the six
makes of brick. Mortars B XI, XRa, and A I were representative of
the mortars of low, intermediate, and high compressive strengths,
respectively. The data for the other mortars fall on curves of
approximately the shape of those shown and lie for the most partbetween the curves for mortars B XI and A I.
3i See footnote 8.

Palmer 1
Parsons] Adhesion of Mortars to Bricks 643
The plotted data, figure 17, show that the compressive strength ofthe piers increased relatively more with increased compressivestrength of brick where mortar of high compressive strength (AI)was used than was the case when the mortars were of low (BXI) orintermediate (XKa) compressive strength. To get the fullest effectof brick strength on pier strength it would be necessary to use amortar of relatively high compressive strength. At the same time theresults obtained with relatively weak mortars, such as BXI, were notmarkedly different from mortars of intermediate strength (XRa).The terms low, intermediate, and high as here used are merely relativeand refer only to the mortars described herein.
In testing the three brick piers in compression it was observed thatall mortars except AI and XTd crumbled prior to failure of the piers.The approximate loads to which the mortar cracked and fell away
£ 4500
&> 4000
B. 3000
%> Z500
^ 2000
r^ 1
fa fJO
J
//
/4- rforfcr
rBgz—!
/ Mo -ta_ D
/ /% ^/ / h/
t / // /
1, 71 h /
i/J
"/1
4000 5000 6000 1000 8000 90C0 10000 11000 IcOOO 13000 14000 15000 . 16000 17000
Average compressive strength ofbrick, /b/in.z
Figure 17.—Compressive strength of brick piers as related to the compressive strengthof bricks.
at the edges of the joints were recorded. The ration of the load atwhich mortar apparently failed to the load at which the pier failedvaried from approximately one-third with the weakest mortars(straight lime-sand mortars) to unity with mortars AI and XTdWith mortars of intermediate strength (XRa, XVa, BIV, etc.) theratio often closely approximated unity, but was usually betweenthree-fourths and four-fifths.
IV. SUMMARY AND CONCLUSIONSIt must not be considered that the results of this study are final and
the following conclusions are applicable only to the conditions, mate-rials, proportions, and types of specimens described.
1
.
The extent of bond was affected by the properties of both mortarsand bricks, but chiefly by the water-retaining capacities of the mortarsand the absorption rates of the bricks.
2. With bricks of high rates of absorption set dry, the extent and inmost cases the strength of bond was best with mortars of high water-retaining capacity.

644 Bureau of Standards Journal of Research [Vol. 12
3. Although the extent of bond was good (practically complete), thestrength of bond obtained with very impervious bricks (no. 5) havingsmooth, glassy, bonding surfaces was generally lower than thatobtained with the other makes of bricks.
4. Rough surfaced bricks with low rates of absorption, and mechan-ically smooth and porous bricks made practically nonabsorptive bysoaking in water gave good extent of bond when time in brick layingwas not permitted for the water in mortars of low water-retainingcapacity to separate out. When such time was allowed, the extent of
bond was poor 32 with the mortars of low water-retaining capacity.
5. The maximum bond strength at 3 months was obtained in thecase of all mortars with bricks having a rate of absorption of approxi-mately 20 g of water per 30 sq in. of brick surface per minute whenpartially immersed (natside down) to a depth of one-eighth inch in
water. This does not imply that the maximum extent of bond wasobtained with this rate of absorption.
6. When the extent of bond is practically complete, the results donot indicate an appreciable weakening of the bond through shrinkageof the mortar during early hardening.
7. There is no evidence that volume changes in mortar subsequentto hardening destroyed or weakened the bond either in vertical or
horizontal joints, when the extent of bond is good. When the extentof bond is poor, there is some indication that volume changes sub-sequent to hardening were destructive to the bond.
8. The bond with mortars of low sorption and high strength wasmost resistant to alternate freezing and thawing. In the study of
bond durability only impervious bricks and bricks made nonabsorp-tive by wetting were used.
9. From the standpoint of bond durability and considering all of
the mortars included in this study, it is indicated that best results
may be generally obtained by keeping the rate of absorption of bricks
below the value, 40 g of water, as obtained by partial immersion(natside down) for 1 minute in water.
10. The maximum bond strength at 3 months with the 15 different
mortars increased with the compressive strength of the mortars as
determined at 3 months, the conditions of curing the brick mortarspecimens and the mortar cubes being the same, provided that theextent of bond was good.
1 1
.
With bricks of low rates of absorption and porous bricks madepractically nonabsorptive by wetting, the highest bond strength wasobtained with mortars of highest strength, when the extent of bondwas good.
12. The data indicate that mortars of widely different compositionsmay have similar properties.
13. The data further indicate that a poor extent of bond may beobtained with certain combinations of bricks and mortars simplybecause the two materials are not well suited to one another and notbecause of any defect that would be apparent from tests accordingto present-day specifications.
Washington, March 14, 1934.
32 Less tban 90 percent of the bonding area.