U. S. Department of the Interior - Bureau of Reclamation · U. S. Department of the Interior ......
73
I REC-ERC-8424 December 1984 Engineering and Research Center U. S. Department of the Interior Bureau of Reclamation
Transcript of U. S. Department of the Interior - Bureau of Reclamation · U. S. Department of the Interior ......

I REC-ERC-8424
December 1984 Engineering and Research Center
U. S. Department of the Interior Bureau of Reclamation

7-2090 (4-81) Bureau of Reclamation
High Recovery Desalting of Brackish Water by Electrodialysis Field Tests at Yuma Desalting Test Facility & at La Verkin Springs
‘. AUTHOR(S)
John W. Kaakinen
6. PERFORMING ORGANIZATION REPORT NO.
b. PERFORMING ORGANIZATION NAME AND ADDRESS
Bureau of Reclamation Engineering & Research Center Denver, Colorado 80225
10. WORK UNIT NO.
11. CONTRACTORGRANT NO.
13. TYPE OF REPORT AND PERIOD COVERED
2. SPONSORING AGENCY NAME AND ADDRESS
Same
14. SPONSORING AGENCY CODE
DIBR
5. SUPPLEMENTARY NOTES
Microfiche and/or hard copy available at E&R Center, Denver, Colorado
Ed: RNW
6. ABSTRACT
An ED (electrodialysis) pilot plant achieved high desalting recoveries of nearly 95 percent at the YDTF (Yuma Desalting Test Facility, Arizona) and 92 percent at LVS (La Verkin Springs, Utah) during over 4000 hours of operation. Brine TDS (total dissolved solids) concentrations of nearly 100 000 g/m3 were obtained at LVS, which is a greater brine concentration than is possible using RO (reverse os- mosis). The LVS required ED energy (while producing a product TDS concentration of about 1000 g/m”) is estimated to be about one-third the energy requirements of a commercially available distillation brine concentrator. Lowering product TDS concentration by ED requires increased equipment size and energy consumption. Special modifications of a standard ED design by its manufacturer were required for the pilot plant to achieve the high brine concentrations through a minimization of both the wastage of water and the dilution of brine that usually occurs with polarity reversal. During initial ED operation (at the YDTF) about 60 000 g/m3 brine TDS concentration caused the bronze brine-recirculation pump to erode and lose its required capacity and contributed to electrical shorting at the stack electrodes in nonflow areas. Subsequent replacement of the pump by one of plastic and the electrodes by ones specially encapsulated with plastic for higher electrical insulation allowed the pilot plant to operate for over 2000 hours producing high brine concentrations without additional equipment problems. The ED process has been shown to be highly feasible technically for achieving very high brine concentrations and desalting recoveries, which are particularly important to inland-desalting applications where brine- disposal volumes need to be minimized because of the high brine-disposal costs.
7. KEY WORDS AND DOCUMENT ANALYSIS
I. DESCRIPTORS-- / desalination/ *desalting/ pretreatment/ *water softening/ electro- dialysis/ reverse osmosis/ *ion exchange/ water purification/ scaling/ *calcium sulfate/ *gypsum/ water treatment/ demineralization/ cation exchange/ Yuma Desalting Plant/ adsorption/
‘. IDENTIFIERS-- / Yuma Desalting Test Facility, AZ/ LaVerkin Desalting Plant, UT
:. COSATI Field/Group 13B COWRR: 1302.5 SRIM:
6. DISTRIBUTION STATEMENT 19. SECURITY CLASS 21. NO. OF PAGE
4voilable from the National Technical Information Service. Operations (THIS REPORT) 61
3ivision. 5285 Port Royal Road, Springfield. Virginia 22161.
UNCLASSIFIED
20. SECURITY CLASS 22. PRICE (THIS PAGE)
UNCLASSIFIED

REC-ERC-84-24
HIGH RECOVERY DESALTING OF BRACKISH WATER BY ELECTRODIALYSIS
FIELD TESTS AT YUMA DESALTING TEST FACILITY AND LA VERKIN SPRINGS
by
John W. Kaakinen
December 1984
Chemistry, Petrography, and Chemical Engineering Section Applied Sciences Branch Division of Research and Laboratory Services Engineering and Research Center Denver, Colorado
SI METRIC
United States Department of the Interior * BUREAU OF RECLAMATION

ACKNOWLEDGMENTS
The author wishes to acknowledge the following individuals for their valuable assistance:
Roy Eisenhauer of the Bureau of Reclamation was project engineer of the La Verkin Springs test program,
Dr. Charles Moody and Lorentz Haugseth of the Bureau provided technical review of the ED report,
David Elyanow of lonics, Inc., designed the two high re- covery ED stack configurations, performed troubleshoot- ing, and suggested improvements in the ED data analysis.
The following were employed by PRC (Planning Research Cor- poration, the site contractor at YDTF and LVS which conducted the experiments according to Bureau directions:
Paul Laverty was the contractor’s engineer in charge of operating the IX-ED system at the YDTF,
Ron Hudson, formerly of PRC, was the chief IX-ED oper- ator at YDTF and LVS,
Rick Amalfi, formerly of PRC, was primarily responsible for the chemical analyses at YDTF, and
Cindy Hoeft and Shirley McAdams of PRC did the original data reduction.
As the Nation’s principal conservation agency, the Department of the Interior has responsibility for most of our nationally owned public lands and natural resources. This includes fostering the wisest use of our land and water resources, protecting our fish and wildlife, preserv- ing the environmental and cultural values of our national parks and historical places, and providing for the enjoyment of life through out- door recreation. The Department assesses our energy and mineral resources and works to assure that their development is in the best interests of all our people. The Department also has a major respon- sibility for American Indian reservation communities and for people who live in Island Territories under U.S. Administration.
The information contained in this report regarding commercial prod- ucts or firms may not be used for advertising or promotional purposes and is not to be construed as an endorsement of any product or firm by the Bureau of Reclamation.
ii

Frontispiece. -Yuma Desalting Test Facility. Author standing in front of electrodialysis pilot plant as installed in early 1979.PBO1-D-BOB27
iii

CONTENTS
Page Glossary ..................................................................................................................................... vi Letter symbols and quantities ....................................................................................................... vii
Introduction.. ............................................................................................................................... 1
Summary and conclusions.. .......................................................................................................... 1
Background.. .............................................................................................................................. 2 High recovery membrane desalting processes.. ......................................................................... 2 Field test sites.. ...................................................................................................................... 3
Experimental methodology ........................................................................................................... Equipment ...............................................................................................................................
z
Procedures., ............................................................................................................................ 8 ED performance calculations ..................................................................................................... 9
Results and discussion.. ............................................................................................................... 12 Cell pair resistance ................................................................................................................... 13 Current efficiency., ................................................................................................................... 15 Energy consumption ................................................................................................................ 16 Exergy .................................................................................................................................... 16 Product concentration energy effects ........................................................................................ 17 Comparison of ED with other desalting processes.. .................................................................... 17
Bibliography ................................................................................................................................ 18
Appendix A - Electrodialysis operational data ............................................................................... 21 Appendix B - Electrodialysis stream chemical compositions ........................................................... 25 Appendix C - Computer output of statistical analyses.. .................................................................. 33 Appendix D - Membrane specifications ........................................................................................ 49
TABLES Table
1 Typical raw and pretreated water compositions at YDTF and LVS.. .................................... 4 2 Operating conditions of the LVS ED pilot plant .................................................................. 9 3 Typical ED performance at YDTF and LVS ........................................................................ 13 4 Typical electrodialysis water compositions ....................................................................... 14
FIGURES Figure
1 2 3 4 5 6 7 8
Pilot plant flow diagram ................................................................................................. Flow diagram of ED unit. ................................................................................................ High plugging factors in ED feed water at the YDTF ......................................................... Stage 1 cell pair resistance (25 “C) ohm. mm* versus g/L brine TDS concentration ............. Stage 1 cell pair resistance (25 “C) ohm.mm* versus hours operating time.. ...................... Current efficiency versus brine TDS concentration ........................................................... Direct-current energy consumption (25 “C) versus brine TDS concentration ....................... Projected energy consumption at two brine concentrations versus product ionic
concentration at LVS ..................................................................................................
5 7
12 15 15 15 16
17
V
GLOSSARY
Anion exchange membrane -
Cation exchange membrane -
Cell pair -
Concentrate stream -
Current density -
Current efficiency -
Dilute stream -
ED- Effective membrane
area - Electrode -
Electrode rinse -
Faraday’s law -
Ion exchange membrane -
LVS - MOV - Ohm’s law -
Osmotic pressure -
Plugging factor -
Polarity reversal -
Polarization -
Reverse osmosis -
YDTF -
Anion exchange material in the shape of a sheet having positively charged fixed functional groups capable of exchanging and passing anions. Cation exchange material in the shape of a sheet having negatively charged fixed functional groups capable of exchanging and passing cations. A set consisting of an anion membrane, a cation membrane, and two spacers to contain a dilute and a concentrate stream. The flow stream through an ED stack into which ions are concentrated to exit as the reject brine. Current passing through an ion-exchange membrane pair divided by the effective membrane area. The number of chemical equivalents of ions effectively transferred divided by the number of electrical equivalents passed through membrane pairs. The flow stream through an ED stack where feed water is desalted and exits as product. Electrodialysis, electrodialyzer. The net area of an ion-exchange membrane through which ions are transferred by passage of electrical current. Inert metal sheets at each end of an electrical stage whiih deliver electrical po- tential and direct current to cell pairs to drive cations toward one electrode and anions toward the opposite electrode. Water fed to an electrode compartment to remove products of chemical reactions at the electrodes. Defines the relation between the rate of transfer of electrolyte through the mem- branes and the magnitude of the direct current flowing through the membranes. Either a cation or anion exchange membrane.
La Verkin Springs test site in Utah. Motor-operated valve. Energy consumption related to any two of the following: voltage, current, and resistance. The differential pressure resulting from the ionic concentration difference (more precisely the chemical potential difference) between two solutions separated by a semipermeable membrane. A measurement of the purity of water according to the rate of decrease in flow of the test water passed through a membrane filter under fixed applied pressure. The change in sign of applied voltage across the stack and change in identity of the dilute and concentrate streams, which are done to prevent an accumulation of scale on membrane surfaces or to eliminate the need for addition of acid to remove calcium carbonate scale. A characteristic of ED operation where there is a sharp rise in electrical resistance in the dilute compartment as current density is increased to where the transfer of hydrogen and hydroxyl ions is appreciable due to dissociation of water. This occurs as electrodialysis separation is limited by the diffusion rate of ions to the membrane surfaces. RO: A desalting process where water is forced by a net applied pressure greater than the net osmotic pressure through a semipermeable membrane with rejection of salt. Bureau of Reclamation’s Yuma Desalting Test Facility near Yuma, Arizona.
vi

LETTER SYMBOLS AND QUANTITIES
Symbol
A c c E
n
Q R’ R
% R,
T To V
Subscript
a
b
i dave
e f
P
: 2
Quantity
effective membrane area ionic concentration total dissolved solids concentration stack energy consumption per
volume of product water current efficiency faraday’s constant, 96,500 temperature correction factor to
25 “C electrical current number of cell pairs per electrical
stage flow of solution desalting recovery cell-pair resistance gas law constant cell-pair resistance of first electrical
stage temperature absolute temperature operating time voltage
average average reject brine concentrate dilute average dilute electrode compartment feed product thermodynamic first stage second stage
Units
m2 w/m3 g/m3 kWh/m3
dimensionless coulombs/eq
dimensionless amperes
- m3/s dimensionless ohm. m2 kWh/(mole “C) ohm. m2
degrees Celcius degrees Kelvin hours volts
vii


INTRODUCTION
Recovery of a maximum volume of desalted product water from a saline feed water source is a goal in desalting where there is a scarcity of feed water or where the disposal of the reject brine volume is dif- ficult. In many instances of inland desalting of brack- ish water [i.e.; less than 10 g/L of TDS (total dissolved solids)], brine disposal by such methods as deep well injection or evaporation in ponds are a dominant cost. Thus, by minimizing the brine dis- posal volume and maximizing the product water vol- ume, high recovery can make desalting more economically feasible. In addition, a minimum brine volume lowers the environmental impacts of brine disposal.
The Bureau of Reclamation has been investigating high recovery desalting for possible application in the arid southwestern United States. Besides being a source of freshwater, desalting brackish water and properly disposing of the reject can decrease the to- tal flow of dissolved solids entering a river system. Natural and anthropogenic salinity sources to the Col- orado River are causing detrimental effects on irri- gation and other uses of Colorado River water [l].”
This report describes ED (electrodialysis) pilot-plant experiments for high recovery desalination of pre- treated brackish waters at two field test sites. At the first site, the YDTF (Yuma Desalting Test Facility) near Yuma, Arizona, the ED test unit desalted irrigation return flow having a TDS concentration of about 3300 g/m3 at recoveries up to 94 percent. At the second site, the ED desalted well water from LVS (LaVerkin Springs) in Utah having a TDS concentra- tion of about 9200 g/m3 at recoveries up to 92 per- cent, which required the reject brine concentrations of nearly 100 000 g/m3 of TDS.
This report contains a description and discussion of the ED equipment and performance at YDTF and LVS. These data and results of further calculations dem- onstrate the technical feasibility and some advan- tages of high recovery desalination using the ED process.
The primary purpose for the high recovery experi- mentation at the YDTF and LVS was to study a ca- tion-exchange pretreatment process for removing calcium from the desalting feed to prevent gypsum scale from forming in the desalting equipment. The ED was used to produce reject brine of fixed con- centrations to regenerate the cation exchanger. De- tails of the cation exchange experiments are in the final reports from the work at the YDTF [2] and LVS
l Numbers in brackets refer to the Bibliography.
[3]. The present report contains a unified presenta- tion and discussion of the ED portion of the testing. In the preparation of this report, the author assumed that the reader would have a basic understanding of the ED process [4, 51.
SUMMARY AND CONCLUSIONS
The field experiments at the YDTF and LVS sub- stantiate that ED is applicable for achieving high prod- uct water recoveries above 90 percent and brine concentrations of up to at least 100 000 g/m3 of TDS. Such high brine concentrations are not possible with the competing membrane-desalting process of RO. While such high recoveries and brine concentra- tions are possible with distillation brine concentra- tors, commercially available distillation units incur much more energy to operate than an ED - three times more in a process comparison assuming LVS feed-water composition - and generally are more ex- pensive to purchase initially. The ED also has the ad- vantage of usually not requiring pretreatment silica removal because ED does not concentrate un-ionized silica in the feed water as do RO and distillation processes.
Because raw saline waters usually contain sulfate and divalent cations such as calcium, strontium, and bar- ium, pretreatment removal of some constituents are necessary to prevent scaling by sparingly soluble salts in the highly concentrated reject brine. Cation exchange provides an ideal process for removing cal- cium, strontium, and barium because the waste re- ject from the ED can be used as the regenerant for the cation exchanger. However, cation exchange does not remove silica, which may be required for RO. Thus, cation exchange and ED provide an ideal pretreatment-desalting process combination for many inland saline water compositions where high product-water recovery is required.
Success of ED in the present work shows that ED could help at inland saline water sites as:
1. To achieve 90 percent or greater product- water-recovery desalting rates while providing as a biproduct a concentrated reject brine useable to regenerate an ion-exchange pretreatment step prior to the ED.
2. To minimize the sizes and costs of the waste brine streams from desalting and the evaporation ponds needed for brine disposal.
3. To reduce pretreatment costs for silica removal relative to other desalting processes that concen- trate silica.
4. To facilitate the operation of solar salt-gradient ponds by creating high concentration brines at rates much faster than natural evaporation.
Depending upon the desalting application, a disad- vantage of ED is that it requires increasingly more equipment and/or operating energy to achieve rela- tively low product salinities, therefore ED is increas- ingly more costly, as required product salinity is lowered, particularly if high brine concentrations and recoveries are achieved simultaneously.
An attractive possibility for more optimum high re- covery desalting overall is to couple ED and RO such that ED is used to achieve the high concentration brines - but moderate product salinities - plus RO to desalt the ED product to a lower final salinity. This combination could make the best uses of both the RO and ED process by operating each process over a salinity range determined by the overall optimum of the coupled process.
Estimation of the purely theoretical thermodynamic energy requirements of the ED process (at YDTF and at LVS) yield values that are less than 10 percent of the experimentally measured stack energy consump- tion. This fact illustrates how ED units are designed presently to operate at sufficiently high current dens- ities where overcoming the ohmic resistances of the stack membranes, concentrate streams, and espe- cially the dilute streams are the greatest usages of energy in desalting with ED. While equipment mod- ifications such as much larger ED membrane area can result in significantly lower energy consumption, the increased amortized equipment cost may exceed the savings in energy costs, particularly if the ED design has been optimized to balance incremental equip- ment and energy costs. The ED energy efficiency is unlikely to improve dramatically in the future as equip- ment costs will probably keep pace with or may even exceed rises in energy costs.
Three equipment modifications were included by the ED manufacturer in the ED pilot-plant as delivered to the YDTF, which helped achieve the very high re- coveries and brine concentrations:
1. Timer relays to delay activation of the motor- operated valves at the stack outlet following ac- tivation of the inlet motor-operated valves such that the mixing of dilute and concentrate streams were minimized as a result of polarity reversal.
2. An inline conductivity electrode and monitor with set-point controller to divert by motor-oper- ated valve the reject brine that had a TDS concen- tration below the set point from flowing to the brine storage tank. (Recycling this intermittent lower conductivity brine stream to the ED feed raises the overall water recovery of the system.)
3. At LVS, ion-exchange membranes having rel- atively high ionic selectivities were required to reach brine concentrations up to 100 000 g/m3 of TDS. At the YDTF, standard selectivity mem- branes were adequate to achieve brine concentra- tions of 60 000 g/m3 of TDS, but current and energy efficiencies would have been higher with more selective membranes.
ED equipment failures occurred during operation at very high brine concentrations and required two ad- ditional equipment modifications of the YDTF.
1. The brine-recirculation-pump bronze impeller eroded and failed to produce rated flow capacity. It required replacement of the pump by one with an impeller and pump casing of plastic.
2. The standard stack electrodes were replaced with ones having special plastic encapsulation at nonflow areas to prevent the shorting and stack damage that occurred with the standard electrode insulation in contact with the very low resistivity brine.
After these required modifications were made the ED unit operated with minimal equipment problems for over 2000 hours at YDTF and LVS. The detection and solution of such equipment problems are a jus- tification for field testing beyond the collection of per- formance data. The success of ED operation at high brine concentrations also indicates how a standard ED unit - designed originally to operate at moderate brine concentrations and recoveries - can be mod- ified successfully to achieve very high brine concen- trations and recoveries.
BACKGROUND
High Recovery Membrane Desalting Processes
The two membrane processes (ED and RO) are the most economical commercial processes for desalting brackish water [6]. Distillation processes have been used for desalting seawater and as brine concentra- tors to achieve zero brine discharge in inland desalt- ing of brackish water, but distillation is not used often for desalting brackish water because of its greater cost and energy consumption relative to RO and ED. Although RO has become more popular than ED in recent years, there are at least two specific process advantages for ED compared to RO which make ED technically preferable in some situations.
One of the advantages of ED over RO for high re- covery desalting is that the pretreatment removal of silica can be avoided generally with ED but not with RO. When the RO process concentrates silica above
2
its solubility (about 100 mg/L of SiO, at 20 “C, de- pending on the amorphous or crystalline form [7]) silica can scale the RO membranes. This results in a severe loss in desalting capacity that cannot be re- versed generally by membrane cleaning, which means that the membranes must be replaced. Re- moval of silica from the RO feed water in a chemical pretreatment step may be necessary to avoid silica scaling of RO membranes. However, because silica is generally un-ionized in neutral and acidic solutions and because the ED process acts only on ions, the un-ionized silica is not concentrated in the reject stream of an ED unit. (Neither is un-ionized silica re- moved from the ED dilute stream, which also can be a disadvantage if a low silica product is required, for example, for steam boiler makeup water.) For many product water uses such as for drinking and irrigation, silica removal may be unnecessary. Thus, the com- plication and expense of a pretreatment step, for ex- ample, a solids-contact reactor in which lime is added to achieve a pH above 11 to remove silica from the desalting feed water, can be avoided in most cases when ED is used as the desalting process.
The other advantage of ED over RO stems from the greater limitation of RO to achieve very high brine concentrations. The net driving force for RO desali- nation is the pressure applied to the feed side of the RO membrane minus the gauge pressure on the prod- uct side minus the difference in osmotic pressure across the membrane [8]. Depending on the water temperature and type of RO element, the maximum allowable feed pressure without materials failure in existing seawater-type commercial RO elements is 5.5 to 6.9 MPa. The RO materials failure can cause excessive loss in product water capacity due to membrane compaction and collapse of product- water channels. The osmotic pressure is approxi- mately proportioned to TDS concentration. At 25 “C solutions of 1 .O, 3.45, and lo-mass-percent con- centration of sea salt (mostly NaCI) have osmotic pressures of 0.72, 2.5, and 8.5 MPa, respectively [8]. Moreover, the osmotic pressure of a sea-salt so- lution exceeds the maximum applied pressure of 5.5 MPa when the sea-salt concentration exceeds about 7 percent or 73 500 mg/L of TDS. The practical maximum reject TDS concentration - when a prac- tical amount of permeate flow is driven through the RO membrane at the maximum allowable feed pres- sure - is presently between 5 and 6 percent at most. Thus, RO has limited applicability when used as the sole brakish water desalting process for very high recovery applications. Sometimes RO is used as an economical first stage for desalting where the reject is fed to a different brine concentration process such as ED or distillation to achieve high recovery.
Proper design allows very high brine concentrations using ED. The general principles and design of ED are
available in the literature [4, 51. Some basic design equations are included in this report. Under contracts with the Office of Saline Water (U.S. Department of the Interior) Dow Chemical Company did a specific study on design and pilot plant testing of ED for brine concentrations above 20 percent of TDS [9]. Dow’s work applied existing technology, namely Asahi Chemical Company ED equipment developed for the Japanese salt-production industry, which uses ED to concentrate seawater to over 20 percent of TDS in the commercial production of NaCl. Such equipment is not like more common ED equipment because this NaCl concentrating equipment was not designed to produce a usable low salinity product. Dow’s report recommended coupling ED to produce a concen- trated brine with RO to produce a low salinity product from the relatively high salinity ED product. Coupling ED and RO would not be necessary because of tech- nical limitations of ED, but was recommended by Dow to lower overall costs by taking advantage of the different optimum feed salinity ranges of ED and RO. In the present tests, ED alone achieved brine TDS concentrations at LVS of nearly 10 percent while pro- ducing water at a salinity of about 1200 g/m3 of TDS.
Field Test Sites
The first Bureau test site was the Yuma Desalting Test Facility near Yuma, Arizona. The U.S. Govern- ment developed the YDTF for the purposes of eval- uating pretreatment and desalting processes for obtaining design data for the prototype YDP (Yuma Desalting Plant) [lo]. Presently, the YDP is under con- struction. It will be the world’s largest membrane desalination plant with a design capacity of 3.2 cubic meters per second of product water. The design product-water recovery of the YDP is 70 percent of the feed flow. An 82-km-long canal conveys the waste reject brine to the Gulf of California. In a com- petitive bidding procedure that gave equal weight to cost and technical design, two manufacturers of spi- ral wound RO equipment were selected over other manufacturers of RO and ED equipment to provide the desalting units for the YDP. Part of the congres- sional authorization for the YDP provided for studying various means of replacing the reject brine system (30 percent of the YDP feed flow) which is lost for beneficial use [ 111. One of the methods studied was to increase the recovery of the YDP through charges in pretreatment and desalting equipment [ 12, 131. Ion exchange pretreatment and ED desalting were tested in a pilot plant at the YDTF to obtain feasibility design data for achieving higher water recoveries. The ED tests are the main subject of this report.
Raw feed water (for the YDTF and YDP) is irrigation return flow pumped from wells in the Wellton-Mo- hawk Irrigation District where 30 000 hectares are irrigated with Colorado River water containing 860
3

mg/L of TDS. The return flow contains 3000 mg/L of TDS (table 1). The increase in TDS during irrigation is because of evapotranspiration during irrigation and leaching of solutes from the irrigated soils. Convey- ance of the irrigation return flow in an open canal results in windblown dust, aquatic weeds, and algae in the raw saline water [ 141. Lime pretreatment in a solids-contact reactor followed by filtration partially softened and clarified the raw water by removing suspended particulates such as clays and diatoms prior to membrane desalting. Partial lime treatment in the present YDP design at a pH of about 9.5 is adequate to avoid membrane scaling by calcium salts and silica at 70 percent recovery [IO].
To avoid membrane scaring in the YDP with recov- eries much greater than 70 percent would require additional removal of calcium for RO and ED and greater removal of silica for RO [ 121. Calculations us- ing methods developed by Marshall and Slusher [ 151 indicate that calcium concentrations need to be re- duced to less than about 35 mg/L at 90 percent recovery and 17 mg/L at 95 percent recovery to avoid gypsum precipitation in the reject for the YDTF feed-water composition. Given in table 1 is a typical ED feed water composition at the YDTF after lime- treated water was passed through cation exchange. An alternative pretreatment possibility to avoid gyp- sum precipitation would be to remove sulfate with anion exchange, but this approach was judged less feasible than cation exchange removal of calcium with the Yuma water compositions. Some more re- cent ED experiments have shown that accumulation of gypsum scale in the membrane stack by super- saturated calcium sulfate can be avoided with polarity reversal, but precipitation in the concentrate recir- culation pump - which is in constant contact with the supersaturated solution - occurred unless SHMP (sodium hexametaphosphate) scale inhibitor was
Table 1. - Typrcal raw water compositions at YDTF and LVS.
Component g/m3
pH units
Silrca Calcium Magnesium Sodrum Potassium Iron Strontium Bicarbonate Sulfate Chloride Free carbon
droxide TDS
YDTF
Raw ED canal feed
7.8 7.0
2:: 4.0
10
97: 20
1180 9 11 0.3 0 3.7 0.6
417 18 904 960
1160 1200 0 0
3750 3404
LVS
Raw ED well feed
6.0 7.6
30 14 790 43 160 53
2300 3110 210 176
0.09 0 12.0 1.5
1270 47 1980 2040 3480 3660
800 0
9430 9145
added to the concentrate [ 161. Lime softening at a pH of 10.4 or more results in substantial silica re- moval necessary for high recovery using RO, but such silica removal is unnecessary for ED. Lime treatment at a pH of 10.4 was used in the IX-ED experiments of the YDTF because the IX experimental results were to apply to a single pretreated water compo- sition range, which would be suitable for RO as well as ED. A feasibility study by the Bureau’s Division of Design concluded that installing additional RO equip- ment for desalting recoveries up to 90 percent in the YDP would be more economical than tail-end ED in the case where only RO would be used in the YDP 1121. However, recoveries above 90 percent by RO would not be technically feasible. The final IX report [2] and a previous paper [17] describe the YDTF IX experiments in detail.
The other site where the IX and ED pilot plants were tested was the La Verkin Springs (located in south- western Utah) adjacent to the Virgin River which flows into the Colorado River. The typical raw and ED feed water compositions at LVS are given in table 1. The springs have a water temperature of about 40 “C. As carbon dioxide effervesces from the spring water at ambient pressure, calcite precipitates nat- urally. Tests at LVS were for the purpose of obtaining pretreatment and desalting data for feasibility esti- mates. The Bureau has been studying alternative methods for preventing the LVS dissolved solids from increasing the salinity of the Colorado River. High desalting recovery would be important at LVS because onsite reject brine disposal would probably be part of any desalting project there. In addition to ED, ion exchange, partial lime softening, lime-soda softening, dual media filtration, and RO also were tested at LVS [ 181. The ion exchange experiments done at LVS are detailed in another report [3]. Only the YDTF and LVS ED experiments are described here.
EXPERIMENTAL METHODOLOGY
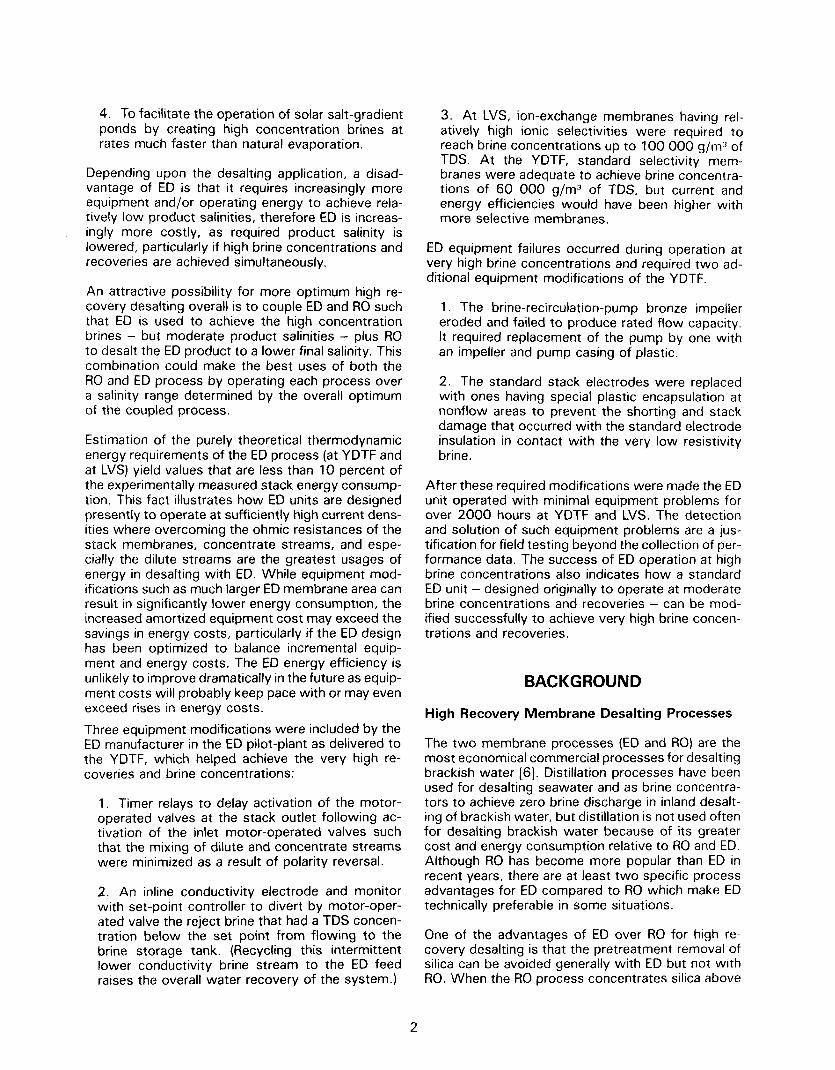
Equipment
A simplified process flow diagram of the ion-ex- change pretreatment and ED equipment used for the high recovery experiments at YDTF is shown on fig- ure 1. A grit basin removed large suspended particles from the canal water at the YDTF. A basin was not needed at LVS because the well water was relatively particle free. At LVS, the raw water was aerated to remove effervescent carbon dioxide gas and some calcium carbonate. High lime-softened (up to about a pH of 10.4) clarified water was provided to the ion exchanger by a solids-contact internal-solids-recir- culation reactor-clarifier at the YDTF [17] and by an inline reactor, flocculator, clarifier system with ex- ternal solids recycle at LVS [ 181. The clarifier effluent
4

Line-softened wter j -13
3 (ri930) -
? IX feed
-== --
T-9 --+ (11 9COL)
IX
ED feed
v 7 -- -
T-33 ED
ED product L. ED electrwle r-inse
Fresh regenerar;t
Recycled regenerant
hJii1ps Processes
P-l IPqenerant IX Ion eitcii?rigcr P-3 IX feed ED Electrodialyzer P-4 Pec.vcled regenerant XT Solids contact tank (T-6)
transfer (Calcium sulfate P-5 Fresh regenerant precipi tdtor for
transfer recycling regenerant)
T-i
T-2
T-5 T-9 T-l@ T-28 T-32
T-33
Tdnks
Recycled regenerant (metering)
Fresh regenera::t (metering)
Recycled regencrant IX feed IX feed ED brine Sodium chloride
solutioning IX pr@duct/ED feed
Figure 1. - Pilot plant flow diagram.
5

at each site was filtered through dual media beds of granular anthracite coal over silica sand. Sulfuric acid was added to the filter influent to maintain a pH of about 7 in the filter effluent to prevent calcium car- bonate precipitation. Gaseous chlorine at the YDTF and sodium hypochiorite solution at LVS were added to the raw water to maintain a chlorine residual of over 1.0 g/m3 through the lime treatment and filtra- tion. Dechlorination with sodium sulfite solution was applied just prior to the ion-exchange pretreatment step to protect the cation-exchange resin beads and subsequently the ion-exchange ED membranes from chlorine attack. Further chlorination of the IX product and dechlorination of the ED feed was practiced at LVS but not at the YDTF. The ion exchanger removed additional calcium not removed by the partial lime treatment. Once cyclical operation was established the ion exchange resin was regenerated solely by reject brine from the ED [2, 31.
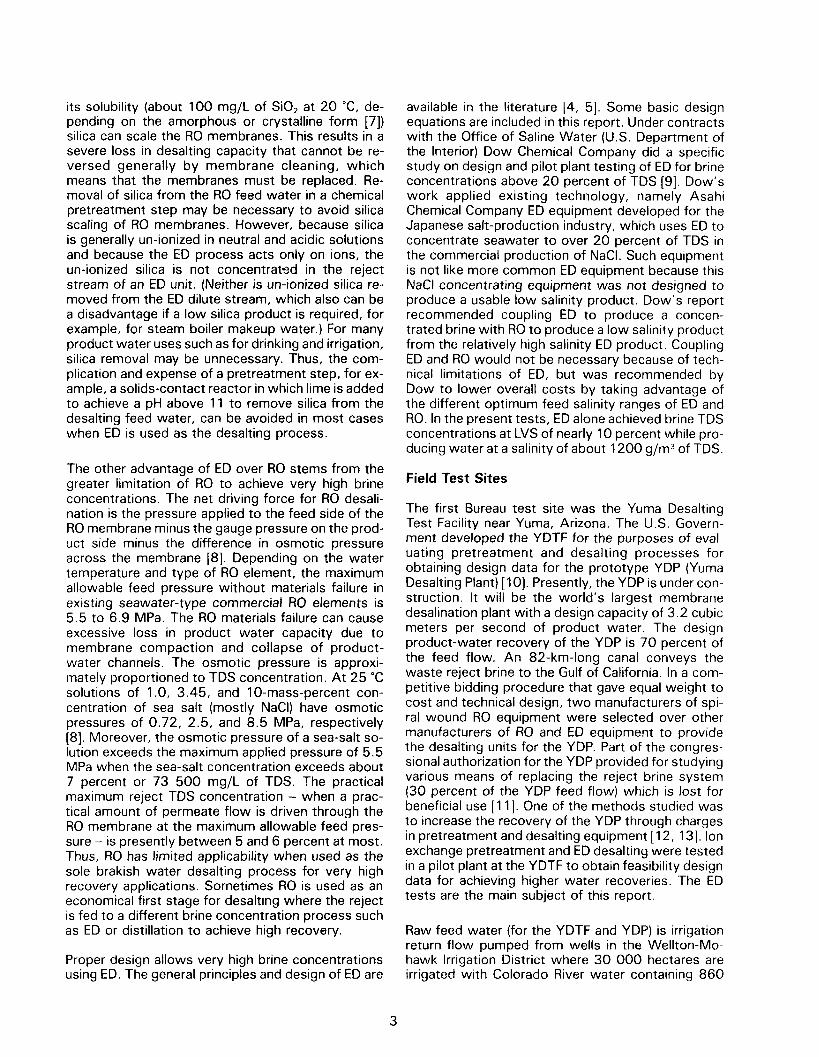
The ED pilot plant was an lonics, Inc. Aquamite V model with a single Mark II stack (fig. 2). The Aqua- mite V skid contained the pumps, flow control de- vices, variable voltage transformer, rectifier, and as- sociated monitoring and control devices. The stack contained the following components at each site.
YDTF LVS
ElectrIcal stages 2 2
No. of electrodes 4 4
Total hydraulic stages 4 6
Cell pairs per stage 75-50-50-75 45-45-40-40-45-45
Total celi pairs
Cation membrane model No.
Anton membrane model No.
250 260
CR61 AZL183 CR61 CZL183
AR103 PZL183 AR204 SXZL183
Each cell pair in the ED stack consisted of one anion membrane, one cation membrane, and a tortuous path spacer between each membrane. Each stack component measured 508 by 457 mm, overall. Tak- ing into account the portions of a membrane in con- tact with spacers and flow path the effective area of each membrane was 0.144 m2. Electrodes were made of platinum-coated titanium. The product TDS concentration at LVS was allowed to be relatively high at about 1 g/L to simplify the design. Lower product TDS at LVS would have required additional ED stages.
The ED membranes used at the YDTF were lonics, Inc.‘s standard brackish water types, also their most common type. The membrane types used at LVS
were specially selected for higher current efficien- cies, which is important for demineralizing high brine concentrations. Both membrane types at the YDTF and the cation membrane at LVS were comprised of cross-linked coplymers of vinyl monomers. The anion membrane type used at LVS was made from acrylic material. Appendix D contains copies of lonics, Inc. data sheets of the membranes used.
Water flowed through the ED unit as shown on figure 2. Feed water was split between the dilute stream (diiuate), which flowed once through the stack, and the makeup to the concentrate stream. The concen- trate was recirculated to equalize the flow rates and pressure drop in the tortuous flow paths on each side of a membrane. Desalting recovery and brine con- centration were easily set by adjusting the makeup flow of feed water to the recirculating concentrate stream. The portion of concentrate not recirculated became the reject brine at the outlet of the stack. Part of the feed water provided the electrode rinse at the YDTF. At LVS, lime-softening water provides the electrode rinse as shown on figure 2, which was done to avoid wasting IX-softened product for the electrode rinse and to maintain the correct ratio of reject brine regenerant volume to IX product volume as required for the IX experiments.
Timers in the ED unit reversed the polarity of the electrode once every 15 minutes at the YDTF and every 30 minutes at LVS. When polarity reversal oc- curs, the dilute and concentrate streams exchange identity in the stack such that the dilute stream be- comes the concentrate stream and the concentrate stream becomes the dilute stream. Four MOV’s (mo- tor-operated valves) at the inlets (MOV-2 and MOV- 3) and outlets (MOV-4 and MOV-5) of the stack shown on figure 2 caused the X and Y streams to be alternately concentrate or diluate according to the valve positions corresponding to electrode polarities. To minimize the mixing of the diluate and concentrate in the stack following polarity reversal, the ED unit had special timer relays controlling the two outlet MOV’s, not a standard lonics, Inc. feature, which de- layed the outlet valve activations relative to the inlet valve activations by a duration approximately equal to the residence time of the diluate and concentrate in the stack. immediately following polarity reversal, because the new dilute stream contains concentrate from the previous polarity, the diluate leaving the stack is initially diverted by MOV-6 to waste. Then when the inline measured conductivity of the new dilute stream effluent decreases to a set-point value specified for the product, MOV-6 is activated to send the diluate flow to the product-water storage tank. Similarly, to maximize brine concentrations for the purpose of the IX pretreatment experiments the ED system contained a special modiflication to divert the initially low TDS concentrate flow to waste following
6

ED FEED FRnM IY
CARTRIDGE
CONCENTRATE MAKE UP 1
ml y
c CONCENTRATEdTREAMj P-;- \I,
. , “ . . . . , .
PRODUCT
STORAGE
ELECTRODE
AT LVS ONLY I I I
----
ED STACK -----
---J I 1 I
VENT
<L -1 I J I I
r-----i
I\
<
/ CONCENTRATE RECYCLE
I 1 ELECTRODE)
TO WASTE
TO WASTE
(--ELECTRODE RINSE TO WASTE
LEGEND
M
t% -MOTOR OPERATED 2-WAY VALVE -SOLENOID OPERATED VALVE
-MOTOR OPERATED 3-WAY VALVE - MANUAL BALL VALVE
-MANUAL DIAPHRAGM VALVE -FLOW METER
-PRESSURE REGULATING VALVE CONDUCTIVITY PROBE
Figure 2. - Flow diagram of ED unit.
7

polarity reversal until a set-point brine conductivity was reached, which then automatically caused MOV- 7 to divert the brine to the IX fresh regenerant stor- age tank (T-28 on fig. 1). Although unimportant for normal ED operation, such a modification should be considered in applications where very high recover- ies are desired, because the concentrate of lower- than-set-point conductivity could be recycled to the ED feed to avoid its loss - which loss would lower overall desalting recovery.
Procedures
Operators on duty 24-hours per day measured and set flow rates; measured tank volumes; did chemical analyses as necessary for operational control; made numerous other measurements, process adjust- ments, readings, and observations, which were re- corded on data sheets and in a log; and collected samples for analysis in a chemical laboratory. Chem- ical analyses of samples collected for ED process calculations were made using atomic absorption spectroscopy and other standard analytical techniques.
During ED unit operation, ED performance data were collected at least daily after steady state had been achieved or at least 10 minutes following polarity reversal as indicated by the relative constancy of di- lute and concentrate conductivities measured inline. Data collection included:
Accumulated operating time, Feed temperature, Flow rates of dilute inlet, brine makeup, product, and reject brine, Brine pH, Conductivities of the feed, product, and brine, Currents of electrical stages 1 and 2, and Voltages of electrical stages 1 and 2.
The voltage drop across each electrode compart- ment was measured using a voltmeter attached to two probes inserted into the sides of the stack at the top and bottom of the electrode compartment. This method also was used occasionally along the entire stack profile to check the performance of in- dividual sections of cell pairs. For example, during initial start up at the YDTF, it was found that the order of installation of a cation and an anion membrane were mistakenly reversed resulting in a high voltage drop at that location, which was remedied easily by correctly reinstalling the two membranes.
Operators collected samples for chemical analyses of ions in the ED feed, product, and brine at selected operating times during the test program. Special runs at LVS also Included sampling of the dilute and con- centrate flows between the two electrical stages. Chemical analyses of samples were by standard
chemical methods in the Bureau chemical laborato- ries at the YDTF, the Lower Colorado Region office in Boulder City, Nev., and the E&R Center in Denver. The chemical analyses, as judged by comparisons and a summation of ions TDS concentrations, evap- orative TDS concentrations, and conductivities, and between summations of anions and cations, were consistently of high quality for the YDTF and regional laboratories. All chemical analyses contained in this report were judged accurate by the preceding criteria.
Desalting recoveries were calculated from the TDS concentrations of the inlet and outlet streams by:
R =
C’, - C’, (1)
where R = desalting recovery as a dimensionless
fraction, c’b = TDS concentration of the ED reject brine
(concentrate outlet) g/m3, C’, = TDS concentration of the ED feed (diluate
inlet) g/m3, and C’, = TDS concentration of the ED product
(diluate outlet) g/m”.
Equation (1) is derived from mass balances of water, TDS, and the normal definition of recovery (product flow divided by feed flow). Recoveries were calcu- lated from salinity measurements alone using equa- tion (1) - not from flow rate measurements - because flow rates generally are subject to greater experimental error than TDS concentrations and be- cause the ED electrode rinse caused a loss of feed water at the YDTF. At the YDTF, brine TDS concen- trations were determined operationally by evapora- tion at 103 “C in the chemistry laboratory, usually daily because more than a week was required to ob- tain summation-of-ions data for TDS. The TDS meas- ured by both methods were in agreement. Using this procedure [including equation ( I)], reject-brine TDS concentrations of 20, 35, and 50 g/L correspond to calculated recoveries of 85.5, 91.8, and 94.3 per- cent, respectively, when the feed TDS concentration is 3.3 g/L and the product TDS concentration is 0.427 g/L, the approximate values at YDTF. At LVS, the TDS concentrations of the ED reject were 40 g/L and 92 g/L corresponding to 80 and 92 percent recoveries for an ED feed TDS concentration of 8.7 g/L and a product concentration of 1 .O g/L of TDS.
The ED was operated on IX softened water primarily to supply reject brine regenerant for the IX experi- ments. Thus, the recoveries and brine concentrations were determined by the IX experimental design [2], and the ED unit was operated intermittently as
8

needed to provide brine for IX regenerant to conduct the IX experiments. The ED was operated such that the product TDS concentration was kept nearly con- stant at each site. Thus, the brine concentration or desalting recovery was the primary parameter varied.
Operational criteria for the ED as operated at LVS are given in table 2 to illustrate how the ED unit was adjusted. Operating criteria used at the YDTF were similar. Note that pressure differentials were adjusted such that concentrate stream pressure was slightly higher than the dilute stream pressure in order that any stack leakage of water between the streams would be from the concentrate to the diluate. This was done because a converse leakage from the dilute to the concentrate would lower the brine TDS con- centration and maximizing the brine concentration was a primary objective during ED operation. Note that the brine makeup flow was approaching zero during highest recovery operation because most of the outlet brine flow resulted from electro-osmotic water (water associated with hydrated ions) trans- ported through the membranes and other leakage from the dilute stream to the concentrate stream. Voltages applied to the stack were adjusted to the values given in table 2 which resulted in the currents listed in table 2 according to the stack resistance and Ohm’s law. Stage 1 voltage settings were kept low enough to avoid shorting of electrical current along concentrate manifold channels, which would occur at higher voltage settings and cause severe damage to the stack due to heat generation. This voltage limitation was a reason that the LVS product TDS
Table 2. - Operating conditions of the LVS ED pilot plant
Parameter Units Value
Diluate flow Brine makeup flow
‘Stack pressure drop *Stack differential
pressure Outlet Stage 1 potential Stage 2 potential Stage 1 current
Stage 2 current
L/s L/s
kPa
kPa kPa
Volts Volts
Amperes
Amperes
0.37 0.067 at 80%
recovery 0.006 x lo6 at 92%
recovery 300
0.98 to 2.94 0 to 1.96 109 104 23.4 at 80% recovery 27.7 at 92% recovery 15.3 at 80% recovery 17.6 at 92% recovery
Product conductivity Electrode rinse
@/cm 2200 to 3000
Pressure kPa 275 Flow L/s 0.047
‘Stack inlet pressure minus stack outlet pressure approximately equal for both dilute and concentrate streams. Wet concentrate pressure muus inlet diluate pressure. Torrent increased when feed-water temperature and brine-stream concen- tration Increased.
concentration was not lower for the required capacity and the given configuration of the stack.
ED Performance Calculations
The ED performance is described by: Current efficiency, Cell pair resistance, and Energy consumption. A theoretical energy consumption estimate called
exergy is calculated also for comparison.
Current efficiency of an ED stack is a measure of the ability of the membranes to transfer ions but not water, and includes effects of water transport by os- mosis and electro-osmosis, and ion transport by dif- fusion in the direction opposite to current flow. Current efficiency is defined empirically for a single electrical stage as the follovJrng ratio [5]:
number of chemical equwalents of jons effectwely transferred e-
number of e!ectncal equwalents passed through membrane pairs
e= Q(C,- q (2)
nl
where -- feed ionic concentration, eq/L
2p - = product ionic concentration, eq/L
F = current efficiency = Faraday’s constant, 96 500 coulombs
per equivalent I = electrical current passing through each
cell pair, ampere n = cell pairs number, 0, = inlet dilute flow, L/s
Generally, the inlet dilute flow does not match the outlet dilute (product) flow exactly because of water transport through the membranes and some leakage between the concentrate and dilute streams in the manifold. The concentrate stream was adjusted to a l- to 3-kPa higher pressure than the dilute stream to prevent diluate leakage from lowering the brine TDS concentration. Because the dilute outlet had about 5 percent less flow than the dilute inlet, the error caused by assuming these two flows equal was less than 1 percent in equation (2), which is negligible. For the present case of two serial electrical stages, 1 and 2, with n cell pairs per stage (n = 125 at the YDTF and n = 130 at LVS) a composite current ef- ficiency for both electrical stages of the stack was calculated from:
FQ, (C, ~~ Cp) e zz
n (4 + M (3)
9

The cell-pair resistance of stage 1 corrected to 25 “C was calculated using
R = Af(V, ~ Ve) 1
1” (4) where
A = effective area of a membrane (0.144 m* in the present experiments)
ve = voltage drop across both first stage electrode compartments (about 10 V in the present experiments),
f = (0.605)( 1.020)‘, an empirical temperature- correction factor to 25 “C suppliec by lonics, Inc., (t is temperature, “C)
1, I= current passing through the electrical stage, amperes
ii = cell pairs, number = first stage specific cell pair resistance,
ohm. m2 VI = voltage drop across the first electrical
stage, V
Note that R, - by equation (4) - changes with vari- ations in feed salinity, product salinity, diluate flow, and recovery. Because the diluate flow, feed salinity, and product salinity were relatively fixed during the YDTF and LVS experiments, differences in R, at each site should be primarily a function of desalting re- covery or brine concentration, although membrane fouling probably increased R, with time gradually at the YDTF (see Results and Discussion sec.). The cell pair resistance of the second electrical stage was not calculated in the present work because it is not in- dependent but directly follows from the fractional de- mineralization achieved by the first electrical stage, which determines the resistivity of the dilute stream, the largest component of stack resistance in the sec- ond stage.
The energy consumption per volume of product water (corrected to 25 “C) used by the rectifier to supply direct current to the stack for demineralization was calculated from the ED pilot-plant performance data using
E= f (VII, + V24!)
0, (0.94) 0.90 (5)
where E = direct current energy consumption of the
stack supplied by the rectifier per volume of product kWh/m3
f = see equation (4) 1, = current passing through the 1st electrical
stage, A I2 = current passing through the 2nd electrical
stage, A QP = product-water flow, m3/s
VI = voltage drop across the first electrical stage, V
V2 = voltage drop across the second electrical stage, V
0.94 = estimated rectifier energy efficiency 0.90 = fraction of time producing product water
following from the approximately IO- percent loss of operating time during off- specification (high salinity) product water which is initially recycled following polarity reversal
Note that because V, and V, include V,, the voltage drops of the electrode compartments, equation (5) is total energy consumption of the stack including that at the electrodes.
Although equation (5) was used to calculate stack energy consumption from the ED performance, equa- tion (5) does not indicate clearly how changes in ED operating conditions affect energy consumption. Thus, equation (6) is introduced to show how op- erating variables (flow rate and concentrations of the feed and product), equipment size (membrane area), and performance parameters (current efficiency and cell pair resistance) affect energy requirements (20, 211.
E= F’QP n A (G - C,) In (6)
where A = effective membrane area, m2 C d.3”e = average dilute stream (i.e., feed and
product) ionic concentration, eq/m3 G = feed ionic concentration, eq/m3 CP = product ionic concentration, eq/m3
E = current efficiency = stack energy consumption per volume of
product water, J/m3 F = Faraday’s constant, 96 500 coulombs per
equivalent n = cell pairs, number QP = product water flow rate, m3/s R = electricai resistance of the dilute stream of
1 m2 area of one cell pair, ohmem
Because the electrical resistance of an ionic solution is approximately inversely proportional to its ionic concentration, R C,,,, is nearly constant along he path length of the dilute compartment in the stack. The term RC,,,,/ e2 is a unit operation parameter, which is a function of water composition and mem- brane type. Assurrr-rions [20] used in deriving equa- tion (6) include:
1. Polarization potential (membrane potential plus concentration potentials arising from concentra- tion gradients in the solutions between the mem- branes) is negligible compared to the ohmic loss.
IO

2. Resistances of the membranes are negligible compared to the resistance of the dilute stream.
3. Resistance of the concentrate stream is negli- gible compared to the resistance of the dilute stream.
4. Water transfer across the membrane is negli- gible.
Note that an equation essentially the same as equa- tion (6) could be derived by rearranging equation (4) in terms of voltage and equation (2) in terms of cur- rent and by substituting these rearranged expres- sions for the voltages and currents in equation (5).
While equation (5) is more usable for calculating en- ergy consumption from the ED performance data, equation (6) clarifies which are the most important variables affecting ED energy consumption. Accord- ing to equation (6), stack energy consumption in- creases as:
1. Equipment size decreased (A decreases for the same Q,)
2. Feed ionic concentration, C,, increases 3. Product ionic concentration, C,, decreases 4. Brine ionic concentration increases, (causing e
to decrease)
Although more equipment results in a lower energy consumption, it also results in greater amortized equipment cost. Thus, the incremental amortized equipment cost should match incremental energy costs with respect to plant capacity at the optimum plant size assuming that other costs change negli- gibly with plant size.
There are other uses of electrical energy by ED be- sides stack energy consumption. These include en- ergy to pump water through the stack and piping, intermittent energy to the motor-operated valves, and energy to operate the measurement and control instrumentation. Neither the pumping nor the total ED energy consumption was measured in these tests, which could have been done by a kilowatt-hour meter in the electrical lines powering the ED unit and pumps. As a point of comparison, about 2 kW per stack are needed for fluid pumping in a small ED plant [4] which usually amounts to 20 percent of the total ED energy consumption. Electrical energy the ED used for instrumentation and electrically operated valves would be negligible comparatively.
The thermodynamically minimum amount of energy required for a process is called its exergy [ 191. Exergy values compared to actual energy consumption in- dicate the departure of the process energy con- sumption from ideality, which is also the maximum
potential for lowering energy consumption. The ac- tual energy consumption of desalting processes is generally several times the exergy for practical re- quirements such as the need to recirculate water and for economic reasons to lower equipment size and amortized equipment cost. That is, it is less expen- sive overall to speed the process rate somewhat at further departure from thermodynamic equilibrium, which increases energy consumption, than it is to provide the additional equipment capacity needed to operate at a slower rate closer to equilibrium con- ditions.
For ED, the exergy is the minimum possible work requirement by a hypothetical completely reversible process which would begin with a volume of water of feed composition in one reservoir and end with that volume separated into two separate reservoirs, one having the product composition and the other having the reject brine composition. All three reser- voirs are assumed here to be at 25 “C. For such a process, Spiegler [20] gives the equation:
E, = ZR,T (C, - Cp) In(WGJ WCdC,) (7) (G/C,) - 1 (G/C,) 1
where Cb = ionic concentration of the brine, eq/m3 c, = ionic concentration of the feed, eq/ml CP = ionic concentration of the product, eq/m” E, = thermodynamic minimum energy
requirement or exergy, kWh/m3 RST = universal gas law constant times absolute
temperature = 0.689 x 10 3 kWh/mole at 25 “C
Equation (7) is subject to the following assumptrons [20]:
1. Salt is a soluble completely dissociated elec- trolyte consisting of monovalent cations and an- ions. In the present calculations, solutions of NaCl with the same total normality as the actual, mul- ticomponent solutions were assumed.
2. Activity of each solution is approximated by the equivalent fraction of water in that solution, which implies ideality and complete validity only for infi- nitely dilute solutions.
3. There is no water transfer across the mem- branes.
Although the conditions of these assumptions were only approximated in the YDTF and LVS tests, the values calculated using equation (7) were such a small fraction of the actual energy consumption, that more accurate, rigorous calculations of exergy would be unimportant for purposes here.
11

RESULTS AND DISCUSSION
Two major ED equipment problems had to be re- solved at the YDTF before the ED operated suc- cessfully. Both problems can be attributed to effects of the unusually high brine concentrations on the standard lonics, Inc., ED design. This design had sel- dom, if ever, been used previously to make such high concentration brine. This is in contrast to the ex- perience of Japanese companies who make NaCl concentrators. Fortunately, both ED problems were solved by equipment modifications.
1. The first was rapid erosion of the bronze im- peller of the brine recirculation pump during highest recovery operation, when the brine concentration reached about 60 g/L of TDS and the pH dropped. Substitution of the brine pump supplied by lonics, Inc., with one having a CPVC (chlorinated polyvinyl chloride) impeller and case and a Hastelloy shaft completely solved the pump failure problem.
2. The second problem was electrical shorting through insulation on the stack electrodes. lonics, Inc., replaced the standard electrodes originally supplied with ones specially encapsulated with plastic for better electrical insulation in critical stag- nant flow areas where the shorting had occurred.
Following these two equipment modifications, there were minimal ED operational and maintenance prob- lems during the remainder of testing at the YDTF and LVS.
High plugging factors (similar to silt density index used primarily as a predictor of reverse-osmosis membrane fouling), including many values of over 90 percent, were measured in the IX product water at the YDTF and are shown on figure 3. Simultaneously,
the IX feed water had consistently very low plugging factors. Steps were not taken to lower the high plug- ging factors in the IX product because the high plug- ging factors had no immediately apparent effect on ED performance. Later analysis of ED data did reveal a gradual increase in cellpair resistance at the YDTF, as presented in the following section. Scanning elec- tron microscopy and chemical analyses of amino acids and polysaccharides indicated the presence of microbiological growth [22] on surfaces of the cation exchange resin of the pretreatment and in the ED feed water but not in the IX feed water. These findings are consistent with the plugging factor measure- ments. This microbiological growth was attributed to dechlorination of the IX feed water that was nec- essary to prevent gradual oxidation and deterioration by chlorine of the cation exchange resin and the ED membranes. In response to these YDTF findings, at LVS the ED feed water (IX product) was rechlorinated prior to its storage and dechlorinated again just prior to entrance into the ED. Apparently, as a result of this rechlorination, ED feed water plugging factors were consistently low at LVS, and other microbiol- ogical growth affecting ED at LVS were not evident.
Typical ED performance levels for each different con- trol brine concentration tested are given in table 3. The values are means of data collected during pos- itive and negative polarities. Chemical analyses re- sults of corresponding feed, product, and brine samples are listed in table 4. Complete tabulations of raw and the reduced data for all observations are contained in appendixes A and B. Statistical analyses (including curve fitting of ED performance data) were by multiple regression using the partial F test with 95 percent confidence limits [23]. Computer print- outs document these statistical analyses in appendix C. Results of those statistical analyses are discussed in the following sections.
100 I I I I I I I I I I I z w 0 ; a 80 L
i!i 5 60 i?
(3 z
yJ I-;-tt:
---- -_----- __-- ______ ____ __ _________ --___-___- ____ -__--_--_--_-
3 40 45- PERCENT CRITERION
: ii!
SHUTDOWN
z 20
[L w z 0.
I I I I I I I I I I I
OCT NOV DEC JAN fEB MAR APR MAY JUN JUL AUG SEP
1978 1979
Figure 3. - High plugging factors in ED feed water at the YDTF
12

Table 3. - Typical Ed performance with different recoveries at C)b = dissolved solids concentration in the brine, YDTF and LVS kg/m3
Site date YDTF - 1979 LVS - 1980
May 7 June 4 June 18 Feb. 11 March 10
Operating time, hours 7902.8
Brine concentra- tion g/m3 51 680
Feed temperature, ‘C 25.0
Dilute flow rate, L/min 34.0
Brine makeup flow rate, L/min 0
Product flow rate, L/min 32.7
Brine flow rate, Ljmin 1.65
Brine pH, units 4.54 Electrical stage 1
Current, amperes 23.6 Voltage, volts 153
Specific cell pair resistance, ohm. mm2 6980
Electrical stage 2 Current, amperes 9.6 Voltage, volts 122
Specific cell pair resistance, ohm. mm* 13 440
Feed cationic concentration, eqlm’ 51.3
Product cationic concentration, eq/m3 7.73
Current efficiency. percent 57.4
Rectifier Energy consump-
tion, kWh/m3 2.88 Exergy, kWh/m3 0.158 Exergy/energy
consumption, percent 5.5
8219.3
33 361
29.5
34.0
1.35
33.0
3.2 5.24
24.0 154
7570
8.6 7.4 15.6 18.1 123 124 104 98
16 570
55.3
6.06
66.1
3.11 0.152
4.9
8376.8 9786.5
19 406 41 600
27.0 23.8
34.0 22.0
4.4 3.7
32.0 20.0
5.88 4.3 6.45 6.3
21.6 26.2 155 109
8050 4090
18 470 6520
55.1 147.2
6.25 18.2
73.7 84.0
2.73 4.31 0.123 0.292
4.5 6.8
10 210.7
96 500
25.1
21.9
0.2
20.7
1.6 5.5
31.9 104
3270
5400
148.9
20.5
69.5
4.86 0.402
8.3
Cell Pair Resistance The importance of cell pair resistance is that its in- crease causes an increase in voltage drop to maintain a given current needed for demineralization, and thus, an increase in power consumption according to equa- tion (5). Cell pair resistance R, for the first stage cor- rected to 25 “C was calculated using equation (4). Note that 10 V was subtracted from each value of the stage voltage to account for electrode compart- ment voltage drop measured by a voltage probe of the ED stack.
Multiple regression analysis of the data yielded for the ED first stage cell pair resistance at the YDTF:
R, = 0.812 TO - 25.3 flYb + 6734 where
4 = first stage cell pair resistance, ohm.m2 TO = operating time, hours
For the LVS data the regression analysis yielded
R, = 4560 - 12.6 C’, (9)
Statistically, there was insignificant relation between R, and C’, at either site and between RI and TO at LVS. The R, should increase with lower C’,, but it was not observed in the data from YDTF or LVS because C’, was not varied sufficiently at either site to indicate a relationship between R, and c’,.
Figure 4 shows R, decreasing with brine concentra- tion; it is expected because solution and membrane electrical resistances each decrease with increasing ionic concentration. Figure 4 curves were plotted by using equation (8) with TO = 2342 hours (the mean) for YDTF and equation (9) for LVS.
The R, at LVS was less than R, at YDTF because of the higher feed-water and product-water (dilute stream) TDS concentrations at LVS, which had less resistivity. The scatter (fig. 4) of the YDTF R, data at a 35-g/L TDS brine concentration results from the variation of R1 with another independent variable - operating time - as in equation (8).
Figure 5 indicates the observed increase in R, with the operating time at the YDTF, but which did not occur at LVS. Much of the scatter of the YDTF data is because the data for all three brine concentrations are included, which affects R, according to the mul- tiple regression equation (8). As mentioned earlier in this section, slime-producing microbiological growth occurred at YDTF in the IX resin and IX product water tank when the IX feed was dechlorinated and there was no further disinfection downstream. It is gen- erally known that membrane fouling will cause cell pair resistance to increase. However, upon disman- tling the stack for inspection, touch and sight did not indicate any slime on the membrane surfaces of the present ED unit as had been observed during pre- vious YDTF testing of an Ionic’s Inc. ED operating at about 70 percent recovery.
Although the rechlorination of the IX product-ED feed at LVS could be the sole reason that R, did not in- crease at LVS, as it did at the YDTF, two other factors were different and possibly important in the ED tests at LVS compared to operation at the YDTF. First, the surface water source at the YDTF is rich in biological growth including algae and bacteria prior to pretreat- ment. Measurements by the U.S. Geological Survey at the YDTF showed that suspended organic material such as algae were removed effectively, but most of the dissolved organic matter in the canal (4 g/m3 of organic carbon) penetrated the chlorination and lime
13
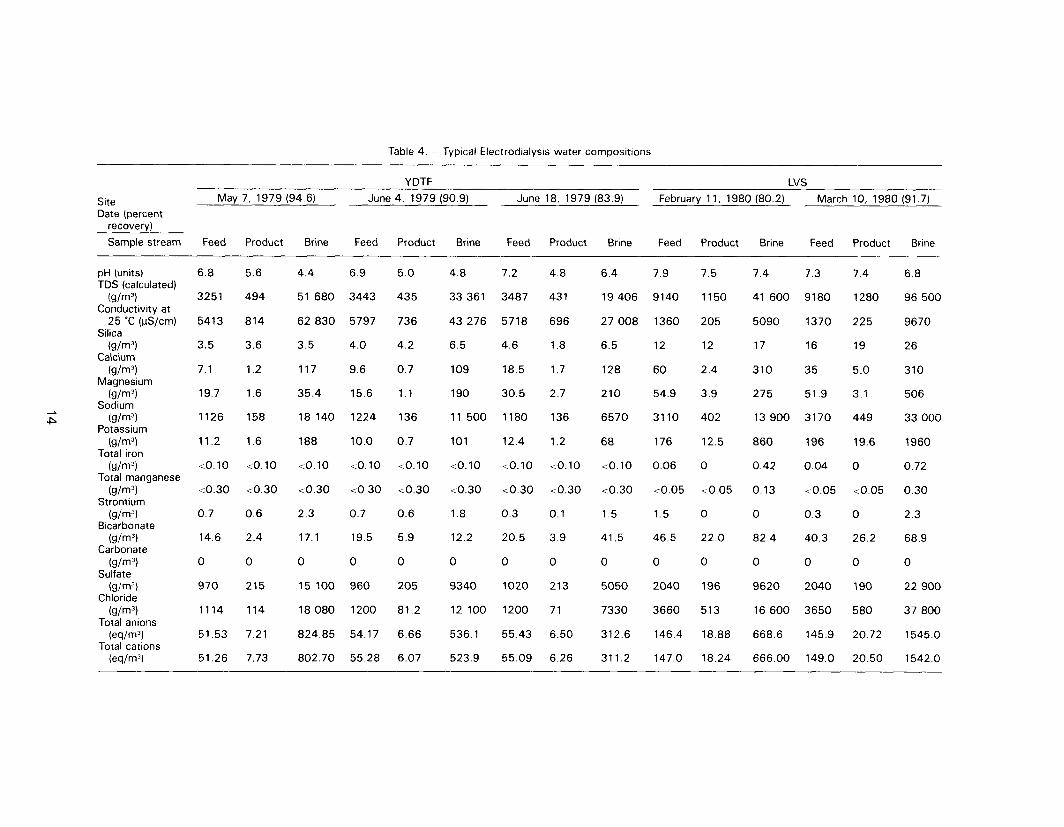
Table 4. - Typical Electrodialysis water compositions
Site Date (percent
recovery)
Sample stream
YDTF LVS
May 7, 1979 (94.6) June 4, 1979 (90.9) June 18, 1979 (83.9) February 11, 1980 (80.2) March 10, 1980 (91.7)
Feed Product Brine Feed Product Brine Feed Product Brine Feed Product Brine Feed Product Brine
pH (units) TDS (calculated)
(g/m? Conductrvrty at
25 ‘C (us/cm) Silica
(g/m? Calcium
(9/m3) Magnesium
(g/m? Sodium
z (9/m? Potassium
(s/W Total iron
WW Total manganese
(s/f-W Strontium
W-W Bicarbonate
W-N Carbonate
(s/m? Sulfate
(9/m? Chloride
(g/W Total anions
(eq/fW Total cations
(w/m”)
6.8 5.6 4.4 6.9 5.0 4.8 7.2 4.8 6.4 7.9 7.5 7.4 7.3 7.4 6.8
3251 494 51 680 3443 435 33 361 3487 431 19 406 9140 1150 41 600 9180 1280 96 500
5413 814 62 830 5797 736 43 276 5718 696 27 008 1360 205 5090 1370 225 9670
3.5 3.6 3.5 4.0 4.2 6.5 4.6 1.8 6.5 12 12 17 16 19 26
7.1 1.2 117 9.6 0.7 109 18.5 1.7 128 60 2.4 310 35 5.0 310
19.7 1.6 35.4 15.6 1.1 190 30.5 2.7 210 54.9 3.9 275 51.9 3.1 506
1126 158 18 140 1224 136 11 500 1180 136 6570 3110 402 13 900 3170 449 33 000
11.2 1.6 188 10.0 0.7 101 12.4 1.2 68 176 12.5 860 196 19.6 1960
40.10 <O.lO 10.10 <O.lO <O.lO <O.lO <O.lO <O.lO <O.lO 0.06 0 0.42 0.04 0 0.72
<0.30 to.30 <0.30 <0.30 10.30 co.30 co.30 10.30 <0.30 co.05 co.05 0.13 c 0.05 <0.05 0.30
0.7 0.6 2.3 0.7 0.6 1.8 0.3 0.1 1.5 1.5 0 0 0.3 0 2.3
14.6 2.4 17.1 19.5 5.9 12.2 20.5 3.9 41.5 46.5 22.0 82.4 40.3 26.2 68.9
0 0 0 0 0 0 0 0 0 0 0 0 0 0 0
970 215 15 100 960 205 9340 1020 213 5050 2040 196 9620 2040 190 22 900
1114 114 18 080 1200 81.2 12 100 1200 71 7330 3660 513 16 600 3650 580 37 800
51.53 7.21 824.85 54.17 6.66 536.1 55.43 6.50 312.6 146.4 18.88 668.6 145.9 20.72 1545.0
51.26 7.73 802.70 55.28 6.07 523.9 55.09 6.26 311.2 147.0 18.24 666.00 149.0 20.50 1542.0

1oow r
6000
w a a -
La Verkin Springs, Utah (Eo.9)
BRINE TDS CONCENTRATION,‘dL
Figure 4. - Stage 1 cell pair resistance 5 “C, ohm. mm* versus g/L brine TDS concentration.
pretreatment system [14]. In contrast, LVS water - ground water from a well - is lower in dissolved or- ganic material (about 2 g/m3 of organic carbon), and contains no measurable particulate organic material. Second, there is reason to presume that the aliphatic anion membranes used at LVS may be less sensitive to organic material relative to the more standard an- ion type used at the YDTF. This presumption is based on the relative insensitivity of aliphatic anion ex- change resins to certain anionic organic electrolytes relative to that of more common anion-exchange res- ins made of aminated styrene-divinyl benzene, which are quite sensitive to many organic anions [24]. Only further experimentation could identify conclusively the variables that caused the increase in R, at the YDTF and the relative constancy of R, at LVS.
Current Efficiency
Current efficiencies are shown decreasing with brine concentration on figure 6. The curves represent the regression equations for current efficiency e:
at the YDTF
e = 0.830 - 0.00505 c’, (10)
and at LVS
e = 0.893 - 0.000192 C’, (11)
The decrease of e with C’, is expected because cur- rent efficiency of an ED membrane is largely a func- tion of the ionic concentration difference across a membrane [4]. The higher current efficiency of the
IO 000
Lo Verkln Sprlngs.Utoh LL
4000-- 2 Brine TDS==41 I Q/L -t
3
t :
Brine TDS-96.9p/L +-C-
-
zooa- s
2 In
OPERATING TIME, hours
0 I I 1 I 1 I 1 I I I 0 1000 EOOO 3000 4m 5000 6000
Figure 5. - Stage 1 cell pair resistance 25 “C, ohm. mm2 versus hours operating time.
relatively more permselective membranes used at LVS is apparent on figure 6. Because required current is inversely proportional to current efficiency, the cur- rent efficiency is important as is cell pair resistance (cell pair voltage divided by current) in determining power consumption according to equation (5). Note that the organic fouling, which presumably caused R, to increase at the YDTF, had no statistically signifi- cant effect on current efficiency according to the mul- tiple regression analysis of the data when operating time was included as an independent variable.
A comparison of current efficiencies of the individual electrical stages further shows the effect of brine
100 7 La Vorkin Springr,
Utoh (Eq. II)
3\\
IL Yumo Desalting
:: Test Focility,Arirano
4o l- (Eq.10)
z w
- a
5 20 -
”
BRINE TDS CONCENTRATION,g/L
OL I I L I I I I I I I 0 20 40 60 80 loo
Figure 6. - Current efficiency versus brine TDS concentration.
15
concentration upon current efficiencies. Interstage water samples for chemical analyses were collected during selected observations at LVS only. Results for three observations follow.
1980 Brine concentration, Current efficiency, percent Date g/m3 Stage 1 Stage 2 - -
April 21 40 700 77 73 March 26 98 300 71 55 March 28 94 900 71 62
These data show how current efficiencies were less in the second electrical stage as compared to the first. In stage 2, the brine TDS concentration is higher, the product TDS concentration is less, and thus, the differential TDS concentration and driving force across the membrane is greater - apparently causing the lower current efficiency of stage 2 rel- ative to stage 1. Another cause for lower current efficiencies with higher solution concentrations is the loss in permselectivity that occurs because the quan- tity of mobile ions in the ion-exchange resin of the membrane with sign opposite to that of the exchange ion increases due to diffusion of ions from the so- lution into the resin [4].
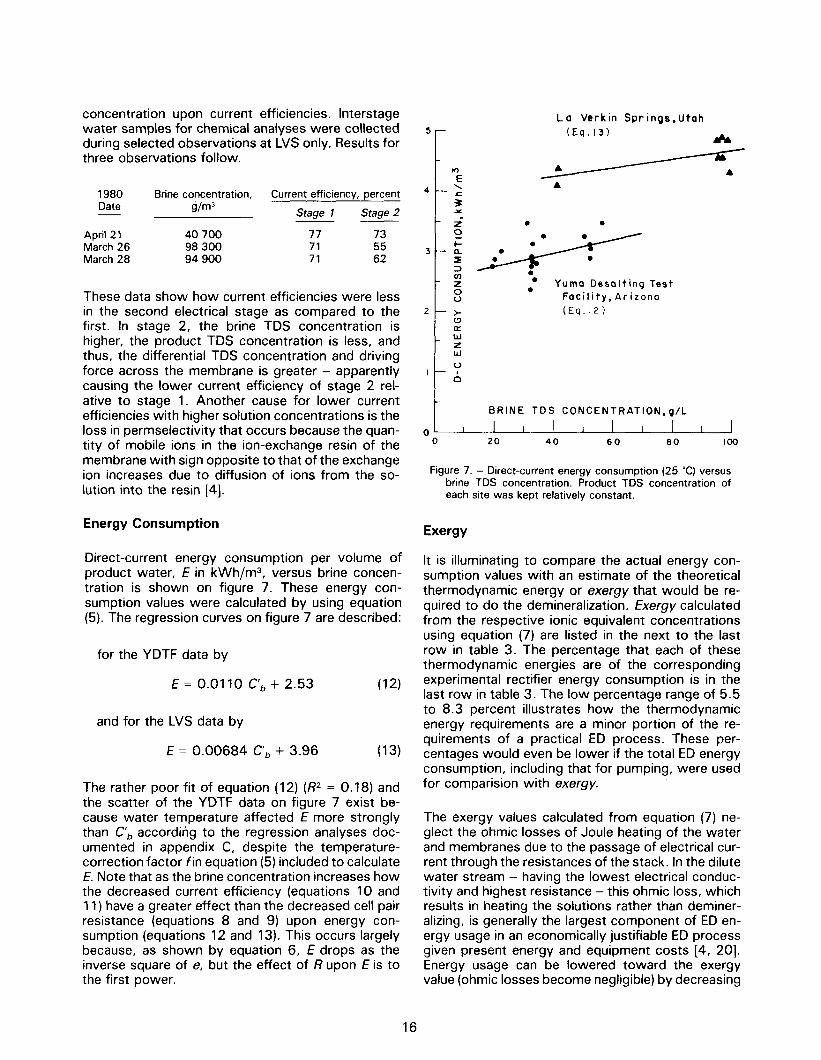
Energy Consumption
Direct-current energy consumption per volume of product water, E in kWh/m3, versus brine concen- tration is shown on figure 7. These energy con- sumption values were calculated by using equation (5). The regression curves on figure 7 are described:
for the YDTF data by
E = 0.0110 C’, + 2.53
and for the LVS data by
E = 0.00684 C’, + 3.96
12)
13)
The rather poor fit of equation (12) (R2 = 0.18) and the scatter of the YDTF data on figure 7 exist be- cause water temperature affected E more strongly than C’, according to the regression analyses doc- umented in appendix C, despite the temperature- correction factor fin equation (5) included to calculate E. Note that as the brine concentration increases how the decreased current efficiency (equations 10 and 11) have a greater effect than the decreased cell pair resistance (equations 8 and 9) upon energy con- sumption (equations 12 and 13). This occurs largely because, as shown by equation 6, E drops as the inverse square of e, but the effect of R upon E is to the first power.
La Verkin Springs,Ufah (Eq. 13)
-0 . Yuma Desalting Test
Facility, Arizona (Eq. 12)
BRINE TDS CONCENTRATION, g/L
a I I I I I 0 20 40 60 80 la0
Figure 7. - Direct-current energy consumption (25 “C) versus brine TDS concentration. Product TDS concentration of each site was kept relatively constant.
Exergy
It is illuminating to compare the actual energy con- sumption values with an estimate of the theoretical thermodynamic energy or exergy that would be re- quired to do the demineralization. Exergy calculated from the respective ionic equivalent concentrations using equation (7) are listed in the next to the last row in table 3. The percentage that each of these thermodynamic energies are of the corresponding experimental rectifier energy consumption is in the last row in table 3. The low percentage range of 5.5 to 8.3 percent illustrates how the thermodynamic energy requirements are a minor portion of the re- quirements of a practical ED process. These per- centages would even be lower if the total ED energy consumption, including that for pumping, were used for comparision with exergy.
The exergy values calculated from equation (7) ne- glect the ohmic losses of Joule heating of the water and membranes due to the passage of electrical cur- rent through the resistances of the stack. In the dilute water stream - having the lowest electrical conduc- tivity and highest resistance -this ohmic loss, which results in heating the solutions rather than deminer- alizing, is generally the largest component of ED en- ergy usage in an economically justifiable ED process given present energy and equipment costs [4, 201. Energy usage can be lowered toward the exergy value (ohmic losses become negligible) by decreasing
16
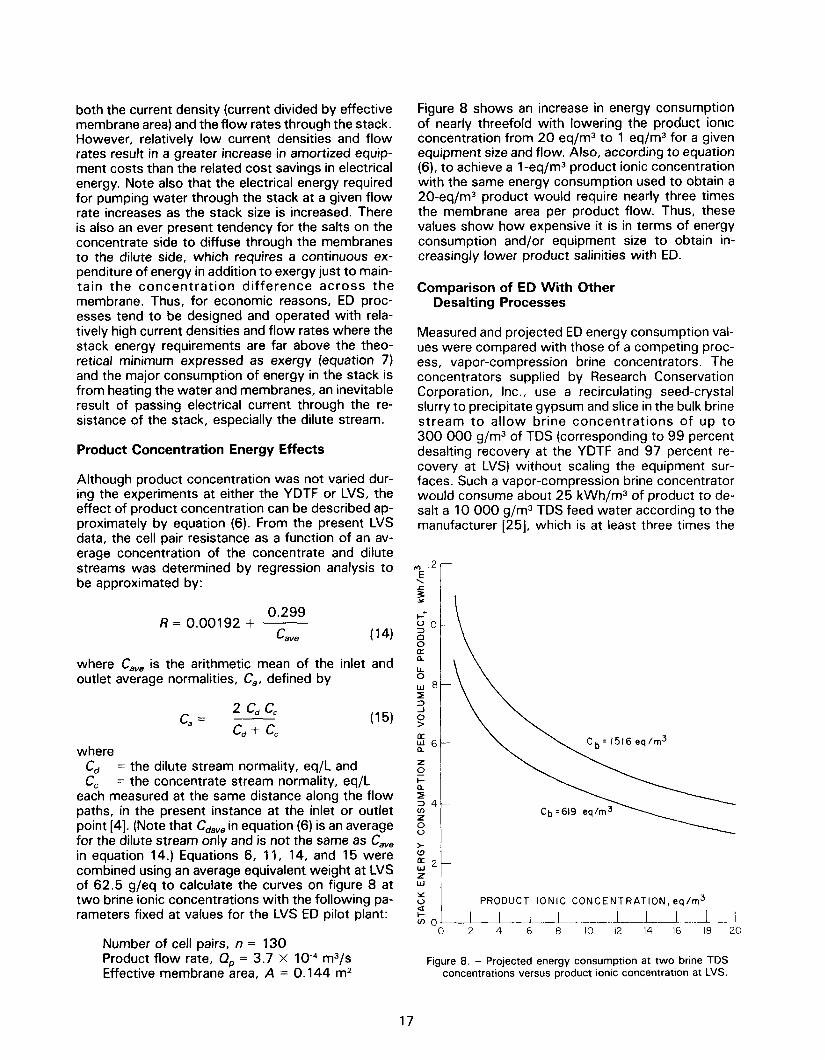
both the current density (current divided by effective membrane area) and the flow rates through the stack. However, relatively low current densities and flow rates result in a greater increase in amortized equip- ment costs than the related cost savings in electrical energy. Note also that the electrical energy required for pumping water through the stack at a given flow rate increases as the stack size is increased. There is also an ever present tendency for the salts on the concentrate side to diffuse through the membranes to the dilute side, which requires a continuous ex- penditure of energy in addition to exergy just to main- tain the concentration difference across the membrane. Thus, for economic reasons, ED proc- esses tend to be designed and operated with rela- tively high current densities and flow rates where the stack energy requirements are far above the theo- retical minimum expressed as exergy (equation 7) and the major consumption of energy in the stack is from heating the water and membranes, an inevitable result of passing electrical current through the re- sistance of the stack, especially the dilute stream.
Product Concentration Energy Effects
Although product concentration was not varied dur- ing the experiments at either the YDTF or LVS, the effect of product concentration can be described ap- proximately by equation (6). From the present LVS data, the cell pair resistance as a function of an av- erage concentration of the concentrate and dilute streams was determined by regression analysis to be approximated by:
Figure 8 shows an increase in energy consumption of nearly threefold with lowering the product ionic concentration from 20 eq/m3 to 1 eq/m3 for a given equipment size and flow. Also, according to equation (6), to achieve a 1 -eq/m3 product ionic concentration with the same energy consumption used to obtain a 20-eq/m3 product would require nearly three times the membrane area per product flow. Thus, these values show how expensive it is in terms of energy consumption and/or equipment size to obtain in- creasingly lower product salinities with ED.
Comparison of ED With Other Desalting Processes
Measured and projected ED energy consumption val- ues were compared with those of a competing proc- ess, vapor-compression brine concentrators. The concentrators supplied by Research Conservation Corporation, Inc., use a recirculating seed-crystal slurry to precipitate gypsum and slice in the bulk brine stream to allow brine concentrations of up to 300 000 g/m3 of TDS (corresponding to 99 percent desalting recovery at the YDTF and 97 percent re- covery at LVS) without scaling the equipment sur- faces. Such a vapor-compression brine concentrator would consume about 25 kWh/m3 of product to de- salt a 10 000 g/m3 TDS feed water according to the manufacturer [25], which is at least three times the
0.299 R = 0.00192 + ~ b IO
c aYe (14) g
where C,, is the arithmetic mean of the inlet and outlet average normalities, C,, defined by
Ld Lc c,= ___
cd + cc
(15)
where Cd = the dilute stream normality, eq/L and CC = the concentrate stream normality, eq/L
each measured at the same distance along the flow paths, in the present instance at the inlet or outlet point [4]. (Note that C,,, in equation (6) is an average for the dilute stream only and is not the same as C,, in equation 14.) Equations 6, 11, 14, and 15 were combined using an average equivalent weight at LVS of 62.5 g/eq to calculate the curves on figure 8 at two brine ionic concentrations with the following pa- rameters fixed at values for the LVS ED pilot plant:
Number of cell pairs, n = 130 Product flow rate, Q,, = 3.7 x 1O-4 m3/s Effective membrane area, A = 0.144 m2
I
;6 t-
PRODUCT IONIC CONCENTRATION,eq/m
0 2 4 6 8 IO 12 14 16 I8 20
Figure 8. - Projected energy consumption at two brine TDS concentrations versus product ionic concentration at LVS.
17

total energy consumption of the ED measured in the present experiments (table 3). It is noted that there are certain potential advantages of a vapor compres- sion unit over an ED brine concentrator including a lower TDS-containing product (particularly lower sil- ica), higher possible desalting recovery, and less pre- treatment. But in situations where such advantages are not overriding considerations, coupling of ED with an ion exchange pretreatment as demonstrated at the YDTF and LVS should have significantly lower energy consumption as well as less initial cost as compared to vapor compression [6].
Because RO alone cannot generate as high brine con- centrations as ED or vapor compression distillation, RO cannot be considered competitive as a concen- trator for brines above about 50 000 mg/L of TDS. In some cases, a combination of processes may be optimum. For example, ED could produce high brine concentrations, thus high recovery, and the ED prod- uct could be desalted further to a lower TDS most economically by RO; the RO reject would be recycled to the ED feed [9]. Moreover, the advantages and disadvantages of each desalting, pretreatment, and brine concentration application should be considered individually, and in combination, and the optimum process or combination of processes should be se- lected according to specific requirements and lowest overall costs. This report describes how ED can be used advantageously for high recovery desalting purposes.
BIBLIOGRAPHY
[ 1 ] Saline Water Use and Disposal Opportunities, Colorado River Water Quality Improvement Pro- gram, Bureau of Reclamation, U.S. Department of the Interior, Denver, Colorado, September 1981.
[2] Kaakinen, John W., and Paul E. Laverty, Cation Exchange Pretreatment Studies for High Recov- ery - Yuma Desalting Plant, Rep. REC-ERC-82- 11, Bureau of Reclamation, Denver, Colorado, 1983.
[3] Kaakinen, John W., Cation Exchange Pretreat- ment Studies for High Recovery Desalting - LaVerkin Springs, REC-ERC-84-12, in press, Bu- reau of Reclamation, Denver, Colorado.
[4] Mason, E. A., and T. A. Kirkham, “Design of Electrodialysis Equipment,” Absorption, Di- alysis, and Ion Exchange, (Chemical Engineering Progress Symposium Series) No. 24, vol. 55, pp. 173-189, 1959.
[5] Mintz, M. S., “Electrodialysis Principles of Proc- ess Design,” Industrial and Engineering Chem- istry, 55:18-28. June 1963.
[6] Reed, S. A., Desalting Seawater and Brackish Waters: 1981 Cost Update, ORNL/TM-8191, Oak Ridge National Laboratory, Oak Ridge, Ten- nessee, August 1982.
[7] Morey, G. W., R. 0. Fournier, and J. J. Rave, “The Solubility of Amorphous Silica at 25 “C,” Journal of Geophysical Research 69 (lo), 1995- 2002, 1964.
[8] Dresner, Lawrence, and James S. Johnson, Jr., “Hyperfiltration (Reverse Osmosis),” In: Princi- pies of Desalination, ch. 8, pt. B, 2d ed., by K. S. Spiegler, and A.D.K. Laird. Academic Press, New York, 1980.
[9] Jordan, D. R., T. Miyake, and W. F. Mcllhenny, “Brine Concentration by Electrodialysis, Phases I and II,” Office of Saline Water Research and Development Progress Report No. 74-930 and 74-93 1, PB-229-628 and -629. March 1974.
[IO] Taylor, lvyl G., and Lorentz A. Haugseth, “Yuma Desalting Plant Design,” Desalination, vol. 19, pp. 505-523, 1976.
[I l] Public Law 93-320, Colorado River Basin Sal- inity Control Act, June 24, 1974.
[ 121 Colorado River Basin Salinity Control Project, Reject Stream Replacement Study, Yuma De- salting Plant High Recovery, draft report submit- ted by the Chief Design Engineer to the Chief, Division of Planning Technical Services, Bureau of Reclamation, April 9, 1980.
[ 131 Kaakinen, John W., Roy J. Eisenhauer, and Cor- nelius Van Hoek, “High Recovery in the Yuma Desalting Plant,” Desalination, vol. 23, pp. 357- 366, 1977.
[ 141 Malcolm, R. L., R. L. Wershaw, E. M. Thurman, G. R. Aiken, D. J. Pickney, and J. Kaakinen, “Re- connaissance Samplings and Characterization of Aquatic Humic Substances at the Yuma Desalting Test Facility, Arizona,” U.S. Geological Survey Water-Resource Investigations 81-42. Denver, Colorado, 198 1.
[15] Marshall, William L., and Ruth Slusher, “Aqueous Systems at High Temperature,” Jour- nal of Chemical and Engineering Data, vol. 13, pp. 83-93, 1968.
18

[ 161 Elyanow, David; Ernest Sieveka, and James Ma- honey, The Determination of Supersaturation Limits in an EDR Unit With Aliphatic Anion Mem- branes, presented at the Ninth Annual Confer- ence, National Water Supply Improvement Association, Washington, D.C., May 3I-June 4, 1981.
[17] Kaakinen, John W. and Paul E. Laverty, Cation Exchange Following Lime Softening as Pretreat- ment for High Recovery in the Yuma Desalting Plant, presented at Water Reuse Symposium II, Washington, D.C., August 23-28, 1981.
[ 181 Eisenhauer, Roy, LaVerkin Springs Utah On-Site Pretreatment and Desalting Process Evaluations, REC-ERC 83-5, Bureau of Reclamation, Denver, Colorado, 1984.
[I91 Spiegler, K. S., “Thermodynamic Analysis.” Desalination, 44:3-l 6, 1983.
[20] Spiegler, K. S., “Electrochemical Operations.” /on Exchange Technology, edited by F. C. Nachod and Jack Schubert. Academic Press, New York, 1956.
[21] Rosenberg, N. W., T. A. Kirkham, C. E. Tirrell, and N. E. Saliba, “Results of Selected Laboratory Tests of an lonics Demineralizer,” Saline Water Research and Development Progress Report No. 1, U.S. Department of the Interior, April 1954.
[22] Winters, Harvey, “In-plant Microfouling in De- salination,” Proceedings of International Con- gress on Desalination and Water Reuse, Nice, France, October 1979, Elsevier Scientific Pub- lishing Company, Amsterdam, The Netherlands.
[23] Draper, N. R., and H. Smith, Applied Regression Analysis, 2d ed. John Wiley and Sons, New York, 1981.
[24] Amber-hi-lites, No. 769, “The Role of Organics in Water Treatment, pt. 3,” Rohm and Haas Com- pany, Philadelphia, Pennsylvania, 1982.
[25] Personal communication with Brian Heimbigner of Resources Conservation Corporation, Everett, Washington, 1983.
I9

APPENDIX A
ELECTRODIALYSIS OPERATIONAL DATA
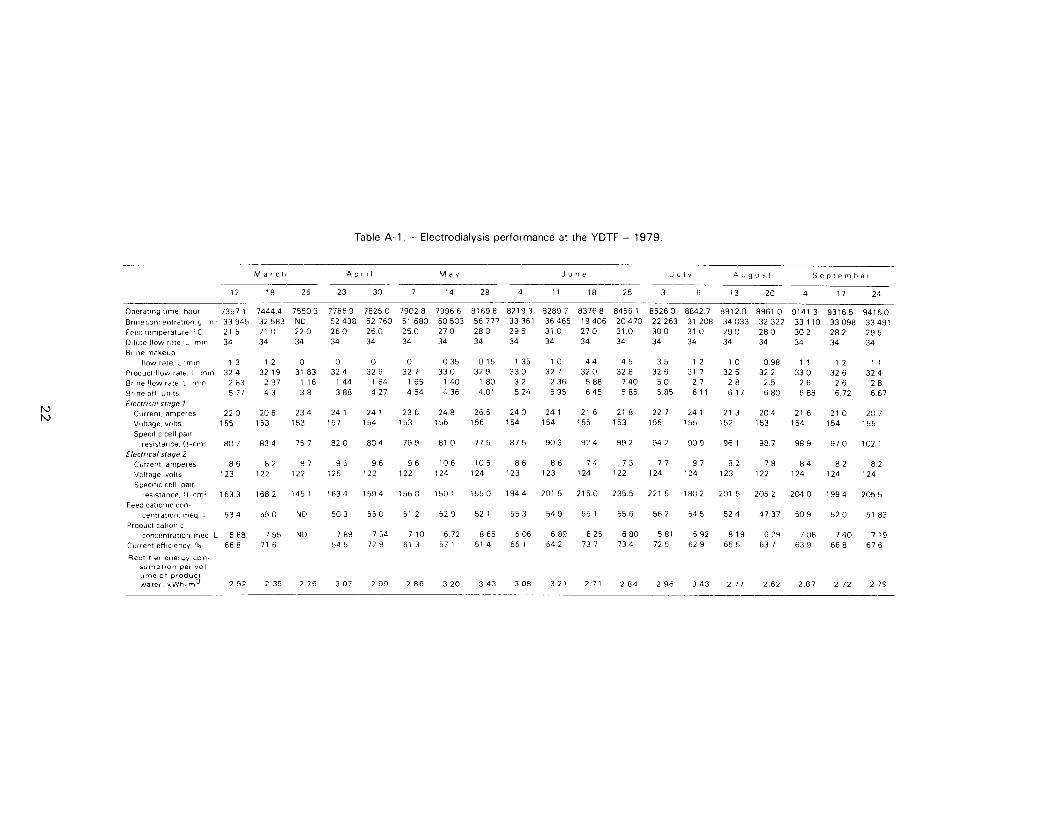
Table A-l. - Electrodialysls performance at the YDTF - 1979.
- March April May June JUI" August September
~___ 12 19 26 23 30 7 14 29 4 11 18 25 3 6 13 zo- 4 17 24
ODerarlnQ ume hO”l 7357 1 74444 75503 77869 78250 79028 79966 81698 82193 82897 83768 84561 85260 88427 89120 89610 91413 93165 94160 52438 52760 51 680 50503 56777 33361 36465 19406 20470 22 263 31 208 I 34033 32 322 33110 33098 3349,
_ Br~ne~oncentrdtton m' g 33 945 32 583 ND Feed temperature c 21 5 21 0 220 D,,u,e flow rate L ml" 34 34 34 Brinemakeup
flow rdfe. L ml" 13 12 0 Product flow rate L rmn 32 4 32 19 31 83 Bilne flow rate L rr!" 2 83 237 116 Brine pH ""its 577 43 38 E/ectr,cal stage 1
Current. amperes 220 208 234 Voltage VOkS 155 153 153 Speclllc cell pair
leSI*ldnCe. II-cm. 807 834 757 Elecrr,calsrage 2
Current amperes 86 62 97 Voltage "OllS 123 122 122 Speclflc cell par
‘eslstance !I-cm' 1633 1682 145 1
Feed CailOmC CO" Centram" meq L 534 550 ND
Product cat,onic CO"CentrailOn meq L 668 755 ND
Current effIc!ency 0% 668 71 6
Rectltler ene:gy con sun~ptlo" per "01 "me cl‘ P'Od"CI water, kWh ml3 2 52 2 35 2 76
260 34
260 34
250 34
270 34
280 34
295 34
310 34
270 34
31 0 34
300 34
31 0 34
29 0 280 302 34 34 34
0 0 0 035 015 135 10 44 45 35 12 324 326 327 330 323 330 32 7 320 328 32 6 31 7
144 1 64 165 140 1 80 32 236 5 88 740 50 27 388 427 4 54 436 401 5 24 595 645 5 85 585 611
241 241 236 248 265 240 241 21 6 21 8 22 7 24 1 157 154 153 156 156 154 154 155 153 155 155
820 804 79 3 81 0 775 a75 903 924 99 2 942 90 9
96 96 96 106 105 86 86 74 73 77 37 125 122 122 124 124 123 123 124 122 124 124
1634 1594 1560 1501 1550 1944 201 5 2150 2355 1802
503
789 54 5
550 51 2 521 553 543 551 556
7 54 710 6 72 865 606 683 625 680 729 61 3 57 1 51 4 66 1 64 2 73 7 734
221 5
56 2
581 72 5
54 5
592 629
10 0 98 11 325 322 330
28 25 26 617 680 688
21 3 204 21 6 152 153 154
961 98 7 38 9
82 78 84 123 122 124
201 5 2052 2040
524 4737 509
819 629 708 656 63 7 639
282 295 34 34
12 11 32 6 324
26 28 6 72 667
21 0 207 154 155
97 0 1021
82 82 124 124
1994 2055
520 51 83
740 719 66 a 676
307 2 99 2 86 3 20 343 3 08 321 2.71 284 2 96 3 43 2 77 2 62 2 87 2 72 2 79

Table A-2. - Electrodialysis performance at LaVerkin Springs - 1980.
Date units Jan. 28 Feb. 11 Feb. lga March 3 March 10 March 17 March 26 March 28 April 21 ______ --__________ __--
Operating time hour 9693.0 9786.5 9907.4 96.0 210.7 351.5 546.1 587.0 1061.8 Brine concentration g/m3 41 100 41 600 96 800 96 500 96 500 95 940 98300 94900 40700 Recovery using equa- tion (I) percent 79.6 80.2 91.3 91.6 91.7 91.3 Feed temperature “C 23.8 23.8 22.0 26 25.1 23.1 24.8 24.1 30.9 Dilute flow rate L/s 0.367 0.367 0.367 0.367 0.365 0.367 0.367 0.367 0.367 Brine make-up flow rate L/s 0.0633 0.0617 0.0033 0.0023 0.0033 0.0023 0.0033 0.0017 0.0567 Product flow rate L/S 0.333 0.333 0.343 0.348 0.345 0.350 0.342 0.338 0.350 Brine flow rate L/s 0.0800 0.0717 0.0250 0.0267 0.0267 0.0200 0.0233 0.0250 0.0825 Brine pH units 6.0 6.3 -b 5.7 5.5 6.2 5.8 5.8 6.2 Electrical stage 1
Current amp 26.6 26.2 29.7 29.9 31.9 30.4 31.0 30.7 26.3 Voltage volts 109 109 109 97 104 105 105 : 104 95 Specific cell parr resistance R.m* 0.00402 0.00409 0.00348 0.00329 0.00327 0.00333 0.00338 0.00333 0.00403
Electrical stage 2 Current amp 15.5 15.6 17.7 17.9 18.1 18.3 18.0 17.5 15.4 Voltage volts 104 104 104 92 98 100 99 98 88 Specific cell pair
resistance R.m2 0.00656 0.00652 0.00554 0.00518 0.00540 0.00524 0.00546 0.00547 0.00632 Feed cationic
concentration eq/m3 142.6 147.2 145.2 150.8 148.9 140.5 142.4 143.2 139.7 Product cationic
concentration eq/m3 14.7 18.2 12.4 23.1 20.5 18.5 19.6 17.6 20.7 Current efficiency percent 82.6 84.0 76.3 72.7 69.5 68.1 68.2 70.9 77.6 Rectifier energy con-
sumption per volume kWh/ of product water m3 4.31 4.28 4.55 4.34 4.82 4 50 4.78 4.65 4.03
a Because of operator error, ED conditions were not recorded at the time samples were collected. Data from conditions taken on February 20, 1980, are presented, as being representative of the conditions which existed when the samples were collected on February 19, 1980.
b Brine pH was not recorded when unit conditions were taken,
23


APPENDIX B
ELECTRODIALYSIS STREAM CHEMICAL COMPOSITIONS

Table B-l. - Chemical analysis - lonics Aquamite V electrodialysis at the YDTF - 1979
March 12 March 19 March 26
Sample stream Feed Product Brine Feed Product Brine Feed Product Brine pH units TDS, g/m3 Conductivity at
25 T, pS/cm E. F. Silica, g/m3 Calcium, g/m3 Magnesium, g/m3 Sodium, g/m3 Potassium, g/m3 Total iron, g/m3 Total manganese, g/m3 Strontium, g/m3 Bicarbonate, g/m3 Carbonate, g/m3 Sulfate, g/m3 Chloride, g/m3 T-alkalinity
as CaC03, g/m3 T-acidity
as CaC03, g/m3 T-phosphorus
as P04, g/m3 Hydroxide, g/m3 Z anions, meq/L C cations, meq/L Control value, meq/L
7.0 6.4 5.8 6.9 6.0 5.8 3418 502 33 945 3483 517 32 583
7.3 5.2 3.8
5938
7.0 3.2 7.0
921 63 583
7.1 8.0 1.7 75 1.6 257
17.1 6.3 N/D N/D N/D N/D
14.0
-
5.2 N/D
-
N/D N/D - - - - - -
N/D
- -
5802 810 45 644 5824 866 43 505 0.62 0.74 0.60 0.60 0.75 5.8 5.5 10.7 10.4 10.0 1.3 154 6.1 1.6 86 2.8 350 20.5 2.3 203 146 11 430 1215 167 11 580 1.2 135 6.8 0.8 59 <O.lO <O.lO <O.lO <O.lO <O.lO <0.30 <0.30 <0.30 <0.30 <0.30 0.2 2.1 0.8 0.7 1.9 7.3 43.9 25.4 8.3 32.7 N/D N/D N/D N/D N/D 214 9420 1004 227 8370 129 12410 1204 109 12 250
0.59 12.2 12.7 30.6 1148 12.1 <O.lO <0.30 0.3 24.4 N/D 994 1196
20.0 6.0 36.0 20.8 6.8 26.8
-
<O.Ol <O.Ol -co.01 <O.Ol <O.Ol <O.Ol N/D N/D N/D N/D N/D N/D 54.8 8.22 547.0 55.3 7.94 520.5 53.4 6.68 537.2 55.0 7.57 526.3 +1.50 t6.56 t1.14 to.27 t1.61 -0.71
Table B-1. - Chemical analysis - lonics Aquamite V electrodialysis at the YDTF - 1979 - Continued.
April 23 April 30 May 7 Sample stream Feed Product Brine Feed Product Brine Feed Product Brine
pH, units 6.6 5.1 3.8 7.0 5.4 4.8 6.8 5.6 4.4 TDS, g/m3 3162 509 52 438 3498 520 52 760 3251 494 51 680 Conductivity at
25 T, $S/cm 5122 746 62 670 5829 876 63 622 5413 814 62 830 E. F. 0.62 0.68 0.84 0.60 0.59 0.83 0.60 0.61 0.82 Silica, g/m3 4.6 4.6 4.0 4.5 4.5 3.0 3.5 3.6 3.5 Calcium, g/m3 ?l82 0.6 107 6.5 0.9 128 7.1 1.2 117 Magnesium, g/m3 2.3 395 16.9 1.4 354 19.7 1.6 35.4 Sodium, g/m3 1103 175 18090 1218 169 18760 1126 158 18 140 Potassium, g/m3 11.0 2.2 184 10.6 1.2 148 11.2 1.6 188 Total iron, g/m3 <O.lO <O.lO 0.28 <O.lO <O.lO <O.lO <O.lO <O.lO <O.lO Total manganese, g/m3 <0.30 <0.30 <0.30 N/D N/D N/D <0.30 <0.30 <0.30 Strontium, g/m3 0.5 0.5 1.9 0.7 0.6 3.2 0.7 0.6 2.3 Bicarbonate, g/m3 10.2 4.9 N/D 17.1 7.3 26.8 14.6 2.4 17.1 Carbonate, g/m3 N/D N/D N/D N/D N/D N/D N/D N/D N/D Sulfate, g/m3 910 195 15360 1010 218 15 140 970 215 15 100 Chloride, g/m3 1100 128 18300 1218 122 18200 1114 114 18080 T-alkalinity
as CaC03, g/m3 8.4 4.0 N/D 14.0 6.0 22.0 12.0 2.0 14.0 T-acidity
as CaC03, g/m3 - - - - - - - - T-phosphorus
as P04, g/m3 <O.Ol <O.Ol <O.Ol <O.Ol <O.Ol <O.Ol <O.Ol <O.Ol <O.Ol Hydroxide, g/m3 N/D N/D N/D N/D N/D N/D N/D N/D N/D Z: anions, meq/L 50.15 7.75 836.19 55.68 8.10 829.23 51.53 7.21 824.85 C cations, meq/L 50.31 7.90 829.50 54.98 7.55 855.42 51.26 7.73 802.70 Control value, meq/L -0.18 -0.66 0.51 to.72 t2.37 -2.02 to.30 -0.74 -1.72
26

Table B-l. - Chemical analysis - lonics Aquamite V electrodialysis at the YDTF - 1979 - Continued.
May 14 May 29 June 4
Sample stream Feed Product Brine Feed Product Brine Feed Product Brine
pH, units 7.0 5.4 4.5 6.5 5.1 3.5 6.9 5.0 4.8 TDS, g/m3 3353 476 50 503 3368 708 56 777 3443 435 33 361 Conductivity at
25 OC, pS/cm 5443 767 60 782 5423 985 65 645 5797 736 43 176 E. F. 0.62 0.62 0.83 0.62 0.72 0.86 0.60 0.59 0.77 Silica, g/m3 4.9 5.0 5.0 3.7 1.6 Ia.5 4.0 4.2 6.5 Calcium, g/m3 5.3 0.5 79 a.3 0.7 174 9.6 0.7 109 Magnesium, g/m3 22.4 1.7 360 14.0 1.6 289 15.6 1.1 190 Sodium, g/m3 1164 150.0 17620 1157 194 19800 1224 136 11 500 Potassium, g/m3 7.4 1 .o 110 9.8 I.8 171 10.0 0.7 101 Total iron, g/m3 <O.lO <O.lO 0.12 <O.lO <O.IO <0.32 <O.lO <O.lO <O.IO Total manganese, g/m3 <0.30 <0.30 <0.30 <0.30 <0.30 <0.30 <0.30 <0.30 <0.30 Strontium, g/m3 0.1 <O.lO 0.6 0.9 0.8 3.1 0.7 0.6 I.8 Bicarbonate, g/m3 19.5 4.9 13.7 9.8 2.4 N/D 19.5 5.9 12.2 Carbonate, g/m3 N/D N/D N/D N/D N/D N/D N/D N/D N/D Sulfate, g/m3 984 220 14620 1038 359 17 740 960 205 9340 Chloride, g/m3 1150 98 17700 1130 146 18600 1200 81.2 I2 100 T-alkalinity
as CaCG, g/m3 16.0 4.0 11.2 8.0 2.0 N/D 16.0 4.8 10.0 T-acidity
as CaC03, g/m3 - - - - - 70.0 - - - T-phosphorus
as P04, g/m3 0.49 0.10 1.25 <O.Ol <O.Ol <O.Ol 0.01 0.02 0.01 Hydroxide, g/m3 N/D N/D N/D N/D N/D N/D N/D N/D N/D C anions, meq/L 53.26 7.42 804.1 53.66 8.96 894.23 54.17 6.66 536.1 C cations, meq/L 52.93 6.71 802.9 52.17 8.67 898.20 55.28 6.07 523.9 Control value, meq/L to.35 +3.21 +0.10 +I .49 t1.13 -0.28 -1.17 t2.79 +I .44
Table B-l. - Chemical analysis - lonics Aquamite V electrodialysis at the YDTF - 1979 - Continued
June 11 June 18 June 25
Sample stream Feed Product Brine Feed Product Brine Feed Product Brine
pH, units 7.1 5.4 6.2 %37
4.8 6.4 6.9 5.0 6.0 TDS, g/m3 3436 481 36465 431 19406 3510 461 20 470 Conductivity at
25 T, fiS/cm 5482 756 44 625 5718 696 27 008 5624 687 27 853 E. F. 0.63 0.64 0.82 0.61 0.62 0.72 0.62 0.67 0.73 Silica, g/m3 5.3 z::: 5.5 4.6 1.8 6.5 4.0 4.0 3.5 Calcium, g/m3 10.0 137 la.5 1.7 I28 22.4 2.3 159 Magnesium, g/m3 22.0 1.90 280 30.5 2.7 210 31.1 2.2 206 Sodium, g/m3 1203 153 12560 1180 136 6570 1203 I48 6900 Potassium, g/m3 11.3 1.4 129 12.4 1.2 68 11.6 0.6 73 Total iron, g/m3 0.18 <O.lO <O.lO <O.lO (0.10 <O.lO <O.lO <O.lO <O.lO Total manganese, g/m3 <0.30 <0.30 <0.30 <0.30 <0.30 <0.30 0.03 <O.Ol 0.04 Strontium, g/m3 0.8 0.7 2.6 0.3 0.1 1.5 0.4 0.1 I.6 Bicarbonate, g/m3 23.4 4.9 51.2 20.5 3.9 41.5 17.1 2.9 26.8 Carbonate, g/m3 N/D N/D N/D N/D N/D N/D N/D N/D N/D Sulfate, g/m3 I 000 230 10100 1020 213 5050 990 235 5750
) Chloride,g/m3 T-alkalinity
as CaC03, g/m3 T-acidity
as CaC03, g/m3 T-phosphorus
as P04, g/m3 Hydroxide, g/m3
1160 a4 13200 1200 71 7330 1230 66 735c
19.2 4.0 42.0 16.8 3.2 34.0 14.0 2.4 22.0
- - - - - - - - -
0.02 0.01 0.30 0.02 0.02 0.03 0.01 <O.OI <o.o 1 N/D N/D N/D N/D N/D N/D N/D N/D N/D
C anions, meq/L 53.94 7.24 583.6 55.43 6.50 312.6 55.60 6.80 327.6 C cations, meq/L 54.95 6.91 579.6 55.09 6.26 311.2 56.31 6.75 326.9 Control value, meq/L -1.07 +I .52 to.44 to.36 t1.19 +0.29 -0.74 to.25 +0.13
27
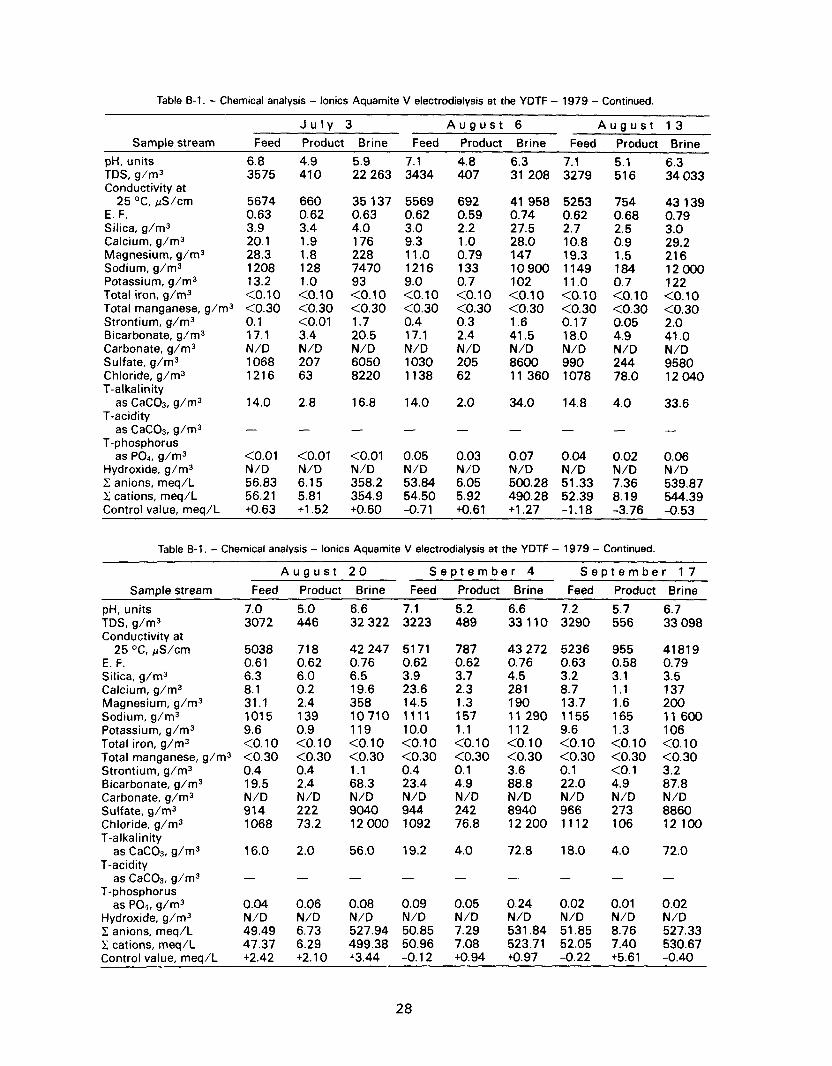
Table B-1. - Chemical analysis - lonics Aquamite V electrodialysis at the YDTF - 1979 - Continued.
July 3 August 6 August 13 Sample stream Feed Product Brine Feed Product Brine Feed Product Brine
pH, units 6.8 4.9 5.9 7.1 4.8 6.3 7.1 5.1 6.3 TDS, g/m3 3575 410 22 263 3434 407 31 208 3279 516 34 033 Conductivity at
25 OC, pS/cm 5674 660 35 137 5569 692 41 958 5253 754 43 139 E. F. 0.63 0.62 0.63 0.62 0.59 0.74 0.62 0.68 0.79
Silica, g/m3 3.9 3.4 4.0 3.0 2.2 27.5 2.7 2.5 Calcium, g/m3 20.1 1.9 176 9.3 1.0 28.0 10.8 0.9 ;:2 Magnesium, g/m3 28.3 1.8 228 11.0 0.79 147 19.3 1.5 216 Sodium, g/m3 1208 128 7470 1216 133 10900 1149 184 12000 Potassium, g/m3 13.2 1.0 93 9.0 0.7 102 11.0 0.7 122 Total iron, g/m3 <O.lO <O.lO <O.lO <O.lO <O.lO <O.lO <O.lO <O.lO <O.lO Total manganese, g/m3 <0.30 <0.30 <0.30 <0.30 <0.30 <0.30 <0.30 <0.30 <0.30 Strontium, g/m3 0.1 <O.Ol 1.7 0.4 0.3 1.6 0.17 0.05 2.0 Bicarbonate, g/m3 17.1 3.4 20.5 17.1 2.4 41.5 18.0 41 .o Carbonate, g/m3 N/D N/D N/D N/D N/D N/D N/D ?D N/D Sulfate, g/m3 1068 207 6050 1030 205 8600 990 244 9580 Chloride, g/m3 1216 63 8220 1138 62 11 360 1078 78.0 12040 T-alkalinity
as CaC03, g/m3 14.0 2.8 16.8 14.0 2.0 34.0 14.8 4.0 33.6 T-acidity
asCaC03, g/m3 - - - - - - - - - T-phosphorus
as P04, g/m3 <O.Ol <O.Ol <O.Ol 0.05 0.03 0.07 0.04 0.02 0.06 Hydroxide, g/m3 N/D N/D N/D N/D N/D N/D N/D N/D N/D C anions, meq/L 56.83 6.15 358.2 53.84 6.05 500.28 51.33 7.36 539.87 Z: cations, meq/L 56.21 5.81 354.9 54.50 5.92 490.28 52.39 8.19 544.39 Control value, meq/L to.63 t1.52 to.60 -0.71 a.61 t1.27 -1.18 -3.76 -0.53
Table B-l. - Chemical analysis - lonics Aquamite V electrodialysis at the YDTF - 1979 - Continued.
Sample stream
August 20 September 4 September 17
Feed Product Brine Feed Product Brine Feed Product Brine
7.0 5.0 6.6 3072 446 32 322
5.2 489 KlO
7.2 5.7 6.7 3290 556 33 098
pH, units TDS, g/m3 Conductivity at
25 OC, @/cm E. F. Silica, g/m3 Calcium, g/m3 Magnesium, g/m3 Sodium, g/m3 Potassium, g/m3 Total iron, g/m3 Total manganese, g/m3 Strontium, g/m3 Bicarbonate, g/m3 Carbonate, g/m3 Sulfate, g/m3 Chloride, g/m3 T-alkalinity
as CaC03, g/m3 T-acidity
as CaC03, g/m3 T-phosphorus
as POI, g/m3 Hydroxide, g/m3 C anions, meq/L C cations, meq/L Control value, meq/L
5038 0.61 6.3 8.1 31.1 1015 9.6 <o. 10 <0.30 0.4 19.5 N/D 914 1068
718 0.62 6.0 0.2 2.4 139 0.9 <O.lO <0.30 0.4 2.4 N/D 222 73.2
42 247 5171 787 0.76 0.62 0.62 6.5 3.9 3.7 19.6 23.6 2.3 358 14.5 1.3 10710 1111 157 119 10.0 1.1 <O.lO <O.lO <O.lO <0.30 <0.30 <0.30 1.1 0.4 0.1 68.3 23.4 4.9 N/D N/D N/D 9040 944 242 12000 1092 76.8
43 272 0.76 4.5 281 190 11 290 112 <O.lO <0.30 3.6 88.8 N/D
5236 0.63 3.2 8.7 13.7 1155 9.6 <O.lO <0.30 0.1 22.0 N/D 966 1112
955 0.58 3.1 1.1 1.6 165 1.3 <O.lO <0.30 <O.l 4.9 N/D 273 106
41819 0.79 3.5 137 200 11 600 106 <O.lO <o. 30 3.2 87.8 N/D 8860 12 100
8940 12 200
16.0 2.0 56.0 19.2 4.0 72.8 18.0 4.0 72.0
- - - - - - -
0.06 0.08 0.09 N/D N/D N/D 6.73 527.94 50.85 6.29 499.38 50.96
0.05 N/D 7.29 7.08 to. 94
0.24 N/D 531.84 523.71
0.02 N/D 51.85 52.05 -0.22
0.01 N/D 8.76 7.40 t5.61
0.02 N/D 527.33 530.67 -0.40
0.04 N/D 49.49 47.37 t2.42 to.97 t3.44 -0.12 t2.10
28

Table 8-1. - Chemical analysis - lonics Aquamite V elec- trodialysis at the YDTF - 1979 - Continued.
Sample stream
September 24
Feed Product Brine
pti, units 7.1 TDS, g/m3 3262 Conductivity at
25 OC, @/cm 5205 E. F. 0.63 Silica, g/m3 2.2 Calcium, g/m3 13.1 Magnesium, g/m3 15.1 Sodium, g/m3 1142 Potassium, g/m3 9.8 Total iron, g/m3 <O.lO Total manganese, g/m3 <0.30 Strontium, g/m3 0.3 Bicarbonate, g/m3 19.5 Carbonate, g/m3 N/D Sulfate, g/m3 960 Chloride, g/m3 1100 T-alkalinity
as CaC03, g/m3 16.0 T-acidity
as CaC03, g/m3 N/D T-phosphorus
as P04, g/m3 0.46 Hydroxide, g/m3 N/D C anions, meq/L 51.35 C cations, meq/L 51.83 Control value, meq/L -0.54
5.1 513
907 43860 0.56 0.76 2.0 3.5 0.6 179 1.5 216 161 11 690 1.3 104 <O.lO <O.lO <0.30 <0.30 0.1 3.2 2.4 75.6 N/D N/D 248 8900 96 12 320
2.0 62.0
N/D N/D
0.32 1.80 N/D N/D 7.91 534.17 7.19 537.95 +3.15 -0.45
6.6 33 491
29
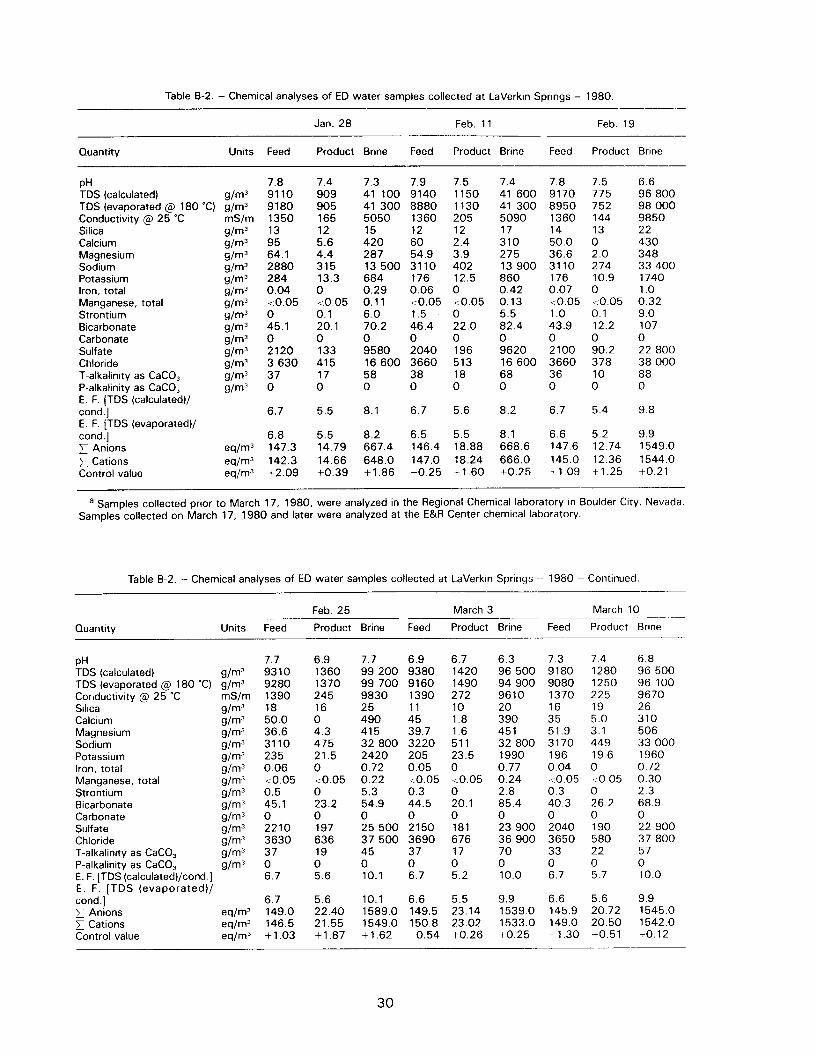
Table B-2. - Chemical analyses of ED water samples collected at LaVerkin Springs - 1980
Quantity Units Feed
Jan. 28 Feb. 11
Product Brine Feed Product Brine
PH TDS (calculated) TDS (evaporated @ 180 “C) Conductivity @ 25 ‘C Silica Calcium Magnesium Sodium Potassium Iron, total Manganese, total Strontium Bicarbonate Carbonate Sulfate Chloride T-alkalinity as CaCO, P-alkalinity as CaCO, E. F. [TDS (calculated)/ cond.] E. F. [TDS (evaporated)/ cond.] x Anions 27 Cations Control value
7.8 9110 9180 1350 13 95 64.1 2880 284 0.04 <0.05 0 45.1 0 2120 3 630 37 0
7.4 909 905 165 12 5.6 4.4 315 13.3 0 <0.05 0.1 20.1 0 133 415 17 0
6.7 5.5
6.8 5.5 147.3 14.79 142.3 14.66 +2.09 +0.39
7.3 7.9 7.5 7.4 41 100 9140 1150 41 600 41 300 8880 1130 41 300 5050 1360 205 5090 15 12 12 17 420 60 2.4 310 287 54.9 3.9 275 13 500 3110 402 13 900 684 176 12.5 860 0.29 0.06 0 0.42 0.11 <0.05 10.05 0.13 6.0 1.5 0 5.5 70.2 46.4 22.0 82.4 0 0 0 0 9580 2040 196 9620 16 600 3660 513 16 600 58 38 18 68 0 0 0 0
8.1 6.7
8.2 6.5 667.4 146.4 648.0 147.0 +1.86 -0.25
5.6 8.2
7.8 7.5 6.6 9170 775 96 800 8950 752 98 000 1360 144 9850 14 13 22 50.0 0 430 36.6 2.0 348 3110 274 33 400 176 10.9 1740 0.07 0 1.0 co.05 ~0.05 0.32 1.0 0.1 9.0 43.9 12.2 107 0 0 0 2100 90.2 22 800 3660 378 38 000 36 10 88 0 0 0
6.7 5.4 9.8
5.5 8.1 6.6 5.2 9.9 18.88 668.6 147.6 12.74 1549.0 18.24 666.0 145.0 12.36 1544.0 +1.60 +0.25 -11 09 +1.25 +0.21
Feb. 19
Feed Product Brine
a Samples collected prior to March 17, 1980, were analyzed in the Regional Chemical laboratory in Boulder City, Nevada. Samples collected on March 17, 1980 and later were analyzed at the E&R Center chemical laboratory.
Table B-2. - Chemical analyses of ED water samples collected at LaVerkin Springs - 1980 - Continued.
Quantity
Feb. 25 March 3 March 10
Units Feed Product Brine Feed Product Brine Feed Product Brine
PH TDS (calculated) TDS (evaporated @ 180 “C) Corlductivity @ 25 “C Silica Calcium Magnesium Sodium Potassium Iron, total Manganese, total Strontium Bicarbonate Carbonate Sulfate Chloride T-alkalinity as CaCO, P-alkalinity as CaCO, E. F. [TDS (calculated)/cond.] E. F. [TDS (evaporated)/ cond.] x Anions x Cations Control value
g/m3 s/m” mS/m g/m3 s/m” g/m3 s/m’ g/m3 g/m3 g/m3 s/m’ g/m3 s/m’ g/m3 g/m3 g/m3 g/m3
7.7 9310 9280 1390 18 50.0 36.6 3110 235 0.06 <0.05 0.5 45.1 0 2210 3630 37 0 6.7
6.9 1360 1370 245 16 0 4.3 475 21.5 0 to.05 0 23.2 0 197 636 19 0 5.6
54.9 0 25 500 37 500 45 0 10.1
6.9 9380 9160 1390 11 45 39.7 3220 205 0.05 .:0.05 0.3 44.5 0 2150 3690 37 0 6.7
6.7 5.6 10.1 6.6 149.0 22.40 1589.0 149.5 146.5 21.55 1549.0 150.8 +1.03 +1.87 +1.62 -0.54
7.7 99 200 99 700 9830 25 490 415 32 800 2420 0.72 0.22 5.3
6.7 1420 1490 272 10 1.8 1.6 511 23.5 0 co.05 0 20.1 0 181 676 17 0 5.2
5.5 23.14 23.02 +0.26
6.3 96 500 94 900 9610 20 390 451 32 800 1990 0.77 0.24 2.8 85.4 0 23 900 36 900 70 0 10.0
7.3 9180 9080 1370 16 35 51.9 3170 196 0.04 .:0.05 0.3 40.3 0 2040 3650 33 0 6.7
7.4 1280 1250 225 19 5.0 3.1 449 19.6 0 i 0.05 0 26.2 0 190 580 22 0 5.7
6.8 96 500 96 100 9670 26 310 506 33 000 1960 0.72 0.30 2.3 68.9 0 22 900 37 800 57 0 10.0
9.9 6.6 5.6 9.9 1539.0 145.9 20.72 1545.0 1533.0 149.0 20.50 1542.0 +0.25 -1.30 +0.51 to.12
30

Table B-2. - Chemical analyses of ED water samples collected at LaVerkin Springs - 1980 - Continued.
Quantity
March 17 March 26
Positive Negative Positive mid-stage Positive
Negative concen-
Units Feed Negative mid-stage
Product Brine dilute dilute concentrate Feed dilute concentrate trate
PH 7.5 7.1 TDS (calculated) s/m’ 9330 1110 TDS (evaporated @ 180 ‘C) g/m3 9060 1150 Conductivity @ 25 ‘C mS/m 1350 282 Silica g/m3 8.0 8.0 Calcium g/m3 32.0 3.20 Magnesium g/m3 48.8 1.95 Sodium g/m3 2940 406 Potassium g/m3 275 21.9 Iron, total g/m3 0.04 0.02 Manganese, total g/m3 0.02 0.01 Strontium g/m3 0.07 ND Bicarbonate g/m3 44.5 15.9 Carbonate g/m3 0 0 Sulfate g/m3 2100 76.8 Chloride g/m3 3590 575 T-alkalinity as CaCO, g/m3 42 20 P-alkalinity as CaCO, g/m3 0 0 E. F. [TDS (calculated)/cond.] 6.9 3.9 E. F. [TDS (evaporated)/cond.] 6.7 4.1 z Anions eq/m3 146.73 18.06 z Cations eq/m’ 140.63 18.58 Control value eq/m3 +2.56 -1.35
7.0 7.4 7.4 95 940 1220 3800 95 600 I 160 3740 8450 220 660 7.5 10.1 9.8 192 1.60 5.40 78.1 2.20 12.3 34 000 430 1270 2970 23.5 94.2 0.35 0.05 0.09 0.09 ND ND I.75 ND ND 93.9 17.7 29.3
:3 000 Y97 0 850 35 600 540 1530 90 14.5 24.0 0 ND ND 11.4 5.5 5.8 II.3 5.3 5.7 1480.5 19.60 61.38 1571.9 19.56 58.79 -3.96 +O.IO +2.45
7.5 7.7 7.4 7.2 7.0 98 660 8740 1150 90 070 90 410 98 300 8840 1080 95 200 95 100 9600 1 320 189 9600 8120 12.1 10.4 9.1 15.1 14.7 416 32.0 1.20 240 320 869 68.3 2.32 744 683 33 200 2940 406 29 400 29 400 3170 286 21.5 3150 3110 2.00 0.18 0.60 1.90 1.90 0.28 0.01 0.03 0.26 0.27 I .70 0.30 ND 1.70 1.60 93.9 42.7 17.7 18.9 87.2 0 0 0 0 0 23 600 2090 176 22 300 22 600 37 300 3270 518 34 200 34 200 77.0 35.0 14.5 15.5 71.5 ND ND ND ND ND 10.3 6.6 6.1 9.4 11.1 10.2 6.7 5.7 9.9 II.7 1543.54 136.20 18.55 1429.31 1434.43 1613.00 142.51 18.50 1433.50 1431.60 -2.89 -2.85 +0.13 -0.19 +0.13
Table B-2. - Chemical analyses of ED water samples collected at LaVerkin Springs - 1980 - Continued
March 28
Quantitv
Negative Negative Positive Positive Negative mid-stage concen- Positive mid-stage concen-
Units Feed dilute concentrate trate dilute dilute trate
PH TDS (calculated) TDS (evaporated @ 180 ‘C) Conductivity @ 25 “C Silica Calcium Magnesium Sodium ’ Potassium’ Iron, total Manganese, total Strontium Bicarbonate Carbonate Sulfate Chloride T-alkalinity as CaCO, P-alkalinity as CaCO, E. F. [TDS (calculated)/cond.] E. F. [TDS (evaporated)/ cond.] x Anions x Cations Control value
7.7 7.1 7.8 9350 1140 86 100 8660 1060 93 900 1340 206 8800 10.1 8.9 14.6 32.0 1.60 320 78.1 I .95 615 2940 406 27 600 286 16.4 2350 0.16 0.04 2.0 0.01 ND 0.28 0.2 ND 1.0 43.3 14.0 105 0 0 0 1520 197 22 400 4440 490 32 700 35.5 11.5 86.1 ND ND ND 7.0 5.5 9.8
6.9 92 850 93 800 7540 14.0 320 439 32 400 2480 2.10 0.27 I.1 96.4 0 21 900 35 200 79.1 ND 12.3
7.5 7.6 7.2 1100 3860 91 540 1100 4000 94 900 200 580 8800 9.5 8.9 9.5 I .60 4.80 240 I.46 9.52 493 389 1330 32 100 17.2 70.4 2500 0.41 0.07 2.5 ND ND 0.28 ND ND 1.0 18.9 31.1 88.5 0 0 0 123 872 2110 540 1530 54 000 15.5 25.5 72.6 ND ND ND 5.5 6.7 10.4
6.5 5.1 10.7 12.4 5.5 6.9 10.8 157.41 18.14 1389.72 1449.58 18.08 61.91 1565.40 143.31 18.36 1326.60 1525.40 17.54 60.52 1516.30 i5.54 -0.57 +2.92 -3.36 +1.40 +1.30 +2.01
31

Table B-2. - Chemical analyses of ED water samples collected at LaVerkin Springs - 1980 - Continued.
April 21
Quantity Units Feed
Positive Negative Positive mid-stage Positive Negative mid-stage Negative dilute dilute concentrate concentrate concentrate dilute
Pf-f TDS (calculated) 9/m” TDS (evaporated @ 180 ‘C) g/m3 Conductivity @ 25 ‘C mS/m Silica g/m3 Calcium g/m3 Magnesium 9/m” Sodium g/m3 Potassium 9/mJ Iron, total s/m’ Manganese, total 9/m’ Strontium g/m3 Bicarbonate g/m3 Carbonate g/m3 Sulfate 9/f+ Chloride 9/m” T-alkalinity as CaCO, g/m3 P-alkalinity as CaCO, 9W E. F. [TDS (calculated)/cond.] E. F. [TDS (evaporated)/ cond.] r Anions eq/m3 r Cations eq/mJ Control value eqlm3
7.9 8610 8820 1350 9.5 48.0 58.6 2940 181 ND
ON: 36.0 0 1 960 3380 29.5 ND 6.4
7.4 7.7 1240 3990 1130 3940 195 614 9.6 9.4 1.20 16.0 18.8 39.0 433 1340 10.2 54.3 ND ND ND ND ND ND 15.3 26.8 0 0 211 847 540 1660 12.6 22.0 ND ND 6.4 6.5
if380 40 700 3170 6.9 240 224 13 000 843 ND ND 1.2 37.8 0 9630 14 400 31.0 ND 12.1
7.5 38 440 39 900 4830 9.6 224 283 12 900 796
Ii:: 1.3 32.9 0 9600 14 600 27.0
7.8 36 940 38 200 4610 6.8 224 254 12 600 796 ND ND 1.2 45.8 0 9110 13 900 37.6
El
7.4 1130 1080 253 9.6 16.0 24.4 369 10.2 ND ND ND 15.3 0 214 469 12.6 ND 4.5
6.5 5.8 6.4 12.8 8.3 8.3 4.3 136.59 19.85 64.94 607.62 612.54 582.75 17.91 139.83 20.66 63.79 619.00 614.80 602.40 19.06 -1.46 -1.96 +1.03 -1.19 -0.24 -2.15 -2.99
32

APPENDIX C
COMPUTER OUTPUT OF STATISTICAL ANALYSES
33
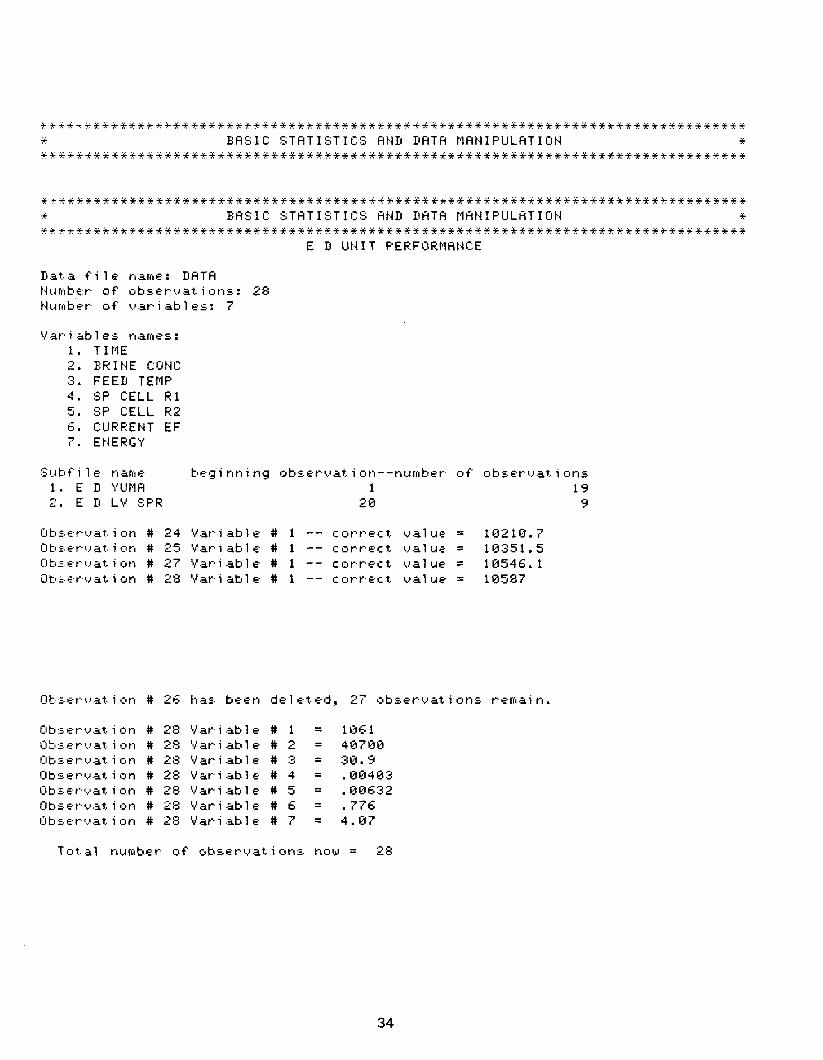
V.ar i .& 1 ~5 names: 1. TIME .-, L. B R I N E C 0 t.1 C 3. FEEIJ TEMP 4. SP CELL Rl 5. SP CELL RZ 6. CURRENT EF 7. E N E R 1; ‘I’
34

35

. 13 r3 8 5 8
.00853
. 00842
. 00482
. 013403
. 0 0 :s 4 8
.00326
. 00327
.00:333
. 00403
. 01757
.017:26
. 01708
. 01753
. 00554
. 00493
. 06540
. 00524
. 00546
. 00547
. 00632
36
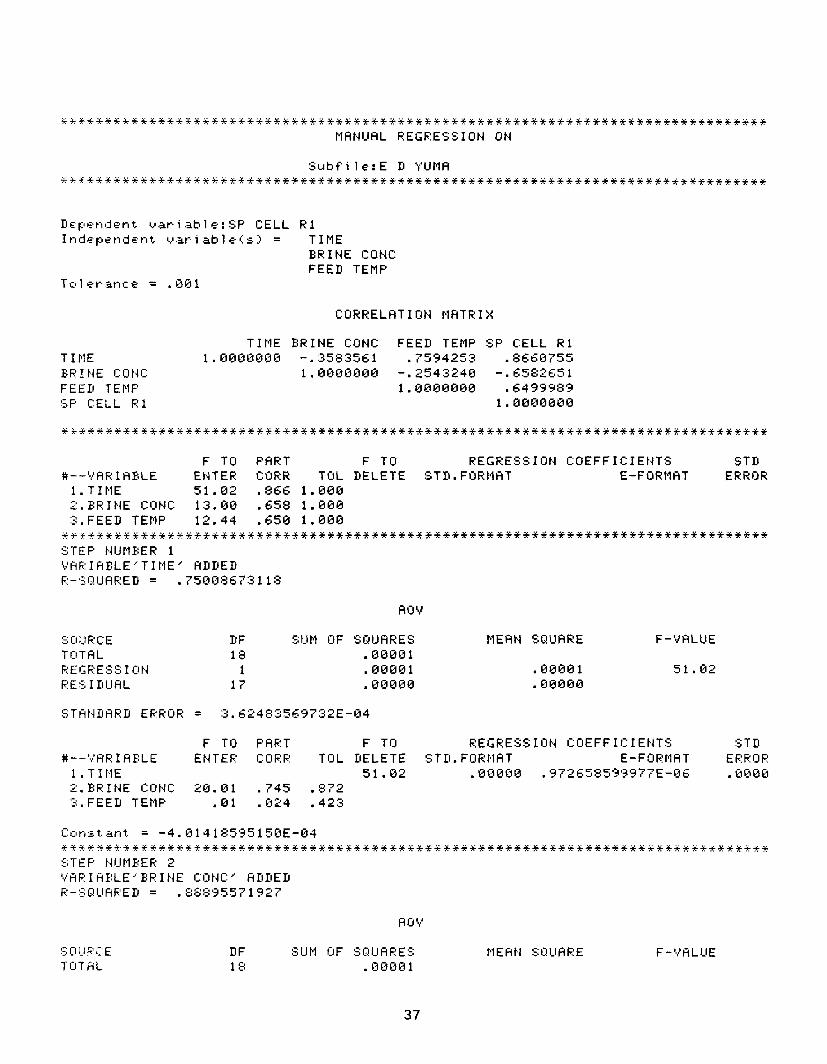
*+*;***+*+ **W*QX*+****W+*f*f*** **********3?+********~* Y*%****%********************
HHNUHL REGRESSION ON
Subfile:E D ‘fUMH ********** ************* *******%***********~**********~**:~ t***********************
CORRELHT I ON MHTR I X
TIME B R 1 1.1 E c: tj f4 12 FEED TErilP 5s P 1: EL L R 1
TIME BRINE CONr; FEED TEMP SP CELL Rl 1.0000000 -. 3583561 .759425? , _ .8CC0755
1.0000000 -. 2543240 -. 6582651 1.0000000 .6499989
1.0000000
.I . . . . *****+*******Y%*,* *~*****~*Y**~**************s*****~***** ************************
F TO PHRT F TO REGRESSION COEFFICIENTS STD # - - 1,) HRIHBLE ENTER CORR TUL DELETE STD. FORMHT E-FURMHT ERROR
l.TIME 51.02 , 866 1.000 2. BRINE i:ijNC 13.00 . 658 1.000 3. FEED TEMP 12.44 . 650 1.000
*c,~%**~f******%**%**********~******* **~***~**%***s***i%************************* ST E P t.4 U M E: E R 1 PFiF.~IAELE’TItlE’ HDDED R-‘:I;!IJHRED = .750QS673118
$; I:I ;-I R I: E DF SlJfq [IF SQIJHRES MEHN SQURRE T 0 T A L 18 . 00001 R E I; R E !$; S 1 I:I 14 1 00001 . 00001 R E !s I 11 IJ 13 L 17 : 00000 . 00000
F-VHLUE
51.02
!S T A td D A R D E R R 0 R = :3,624835&9732E-04
F TO PFtRT F TO REGRESSION COEFFICIENTS ST 11 #--‘v’HRIIHBLE E t.1 T E R I: lj RR TrJL DELETE STD. FORHAT E-FORMAT ERROR
l.TIHE 51.02 . 00000 .97d65853’3977 r E-06 .0000 2 . B R I td E C 0 NC 20.01 .745 ,872 3. FEED TEMP .01 .024 .423
I:: 0 t-, 5 t. ,317 t. = -4.01418595150E-04 ****“*******~**************** ****~****%****%*************************~~~~*******
DF S U tl 0 F S l:r l-1 A R E S tl E H td S Q U ii R E 1 8 . 00001
F - ‘$’ fi L l-1 E
37
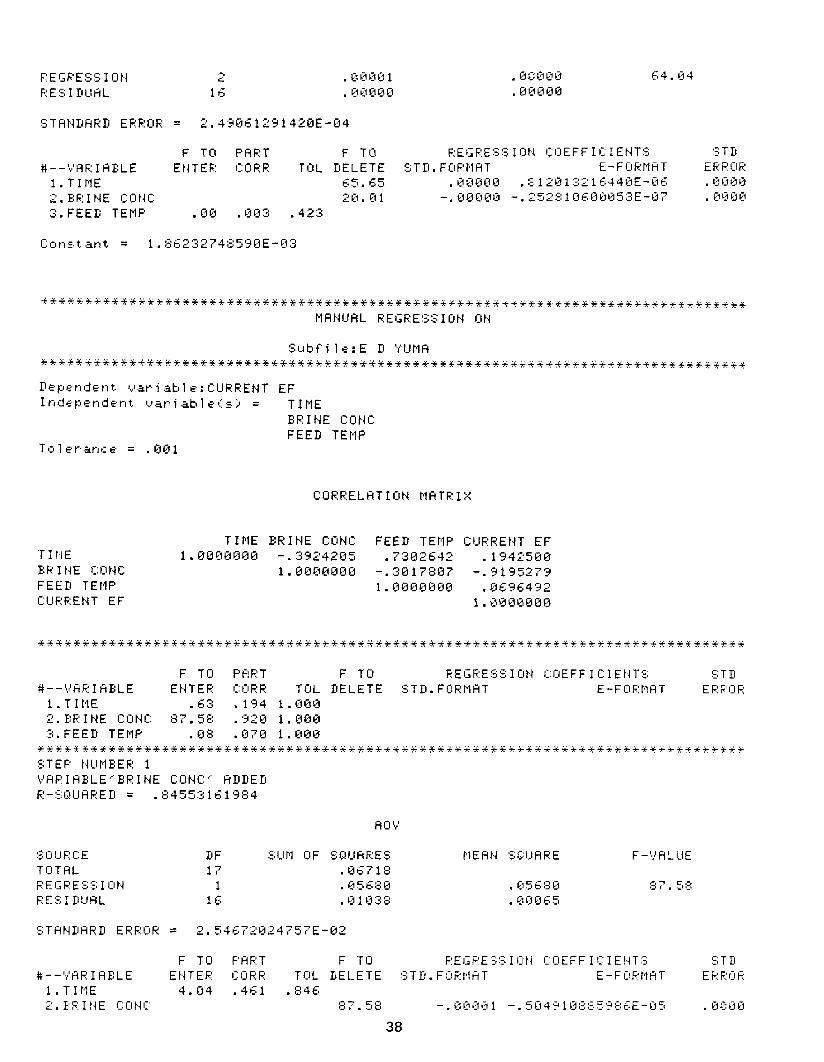
CI~REELHTIUN HHTHIX
F - ‘8,s’ A L i-l E

3. FEED TEMP 6.67 ,555 . 989
HOV
5, I:I l-1 F: I:: E DF SUM OF SBIJHRES T 111 T H L 17 . 86718 R E I; F: E !s 15 1 1 j N 2 . 85981 R E S I D IJ H L 15 . 00817
M E H N SQIJHRE F-VHLUE
54.15
S T H td 11 A R II E R R 0 R = 2. 3343QQ43691 E-82
F TO PHRT F TO REGRESSION COEFFICIENTS ST11 # - - ‘$ R F: 1 n B L E E N T E R CrJRR TOL DELETE STD. FORMHT E-FORMfiT ERROR
l.TIPlE 4.04 -. 88802 -. 1’31728878121E-84 .8088 2 . E; R 1 t,j E I:: III 1.4 I: 163.64 -.008Ell -. 54734 1 E;6868G1E-85 .8888 2. FEED TEPlP 2.18 , ;jl37 -- .4cc
39

CORRELHT I Ot.4 HHTR I X
TIME Ei R I td E C 0 N C FEED TEMP E N E R G ‘f
TIME BRINE C:ONC FEED TEMP E N E R G ‘1’ 1.8888880 -. :35e:355 1 .7594253 . 1064374
1. aaaaaaa -. 2543240 .4208943 1.8888000 .5604344
1.0888988
!z Q l-1 R C E DF SUM OF SQUHRES M E H N !J Q IJ A F; E T 0 T H L 18 1.51464 H E I; I? E !$i 5 1 Q 1.4 1 .26832 .2C832 R E ‘2 I D U H L 17 1.24632 . 07331
F-VALUE
3.66
STHNDF1RIS ERROR = .278753566341
F TO PART F TO R E I; R E S S I 0 N C 0 E F F I C I E N T S !2 T 11
#--‘v’HR IHBLE E N T E R C 15 R R TOL DELETE STD. FORMHT E-FORMHT E R R 0 R l.TIME 1.63 .304 .#72 2 . B R I 14 E I: Q 1.4 I: 3 6 6 . . 88881 . 1 W3738aQ@33@E-$34 . FJ~QO
<: FEEIS TEtlP .- . 21.99 .761 . g 3 5
STHbjDHRD ERROR = . 191 114566123
MEfit SG!ClHRE F - ‘y’ H L l-1 E
F T 0 PART

#---‘y’ARI HBLE ENTER CORK TOL DELETE STD. FORHHT E-FORMHT 1. TINE
E R R 0 R 8.19 .534 .394
2. B R I t.1 E I:: 13 t.4 C 15.67 . 88882 . 1571358333878E-~c$ . 8808 3. FEED TEMP 21 . ‘33 . 86526 . 652557234084E-61 .@139
C:a:,r,s.t af-,t = * 56342631675
CORRELHTION MATRIX
TINE B F: I N E c: rJ t4 C FEED TEI4P !sP CELL Rl
TINE BRINE CONC FEED TEMP SP CELL Rl 1. r3OG18OWW . 5 5 5 6 ,g g 8 -* 3143767 -.5372481
1. r3888888 -.4676151 -. 9822855 1.0868088 .3390248
1.0088BBO
F TO PHRT F TO REGRESSION COEFFICIENTS STIS #--VHRIHBLE E N T E R I: [I R R TOL DELETE STD. FORMHT E-FORMAT ERROR
l.TItIE 2.84 .537 1.888 ‘2 BRINE CONC 192.34 .982 1.880 h. :3. FEED TEMP 1.33 . 393 l.c?86t
;c**++++** . ~,~**+s*~~~~~*~*8%%+ssss +++++++*g ,, ~,~i%*33~~WY%%~~W%**~*~~~~~~~~~~~ssss*
STEP HUH EER 1
!:; T fi 1.4 11 fl R 11 E F: R [I R = 7. 1867479 1 185E-05
F TO PHRT F TO R E I; R E 5 t5 1 0 1.4 C: ij E F F 1 C 1 E 1.4 T !s 8 T 11 # - - ‘y’ fi F: 1 A B L E E t4 T E R C 0 R R TOL DELETE STIl. FORHAT E-FORMAT E R R 0 R
1. TINE . 63 .11’S .68~3 2 , 1: F: I 1.4 E I:: III 1.4 I:: 1 ‘3 2 , :> 4 -* Olj808 -. 12616163131 l’?E-bjF . 8 13 lj 8 3. FEED TEHP . 92 . .db “4 .781
41
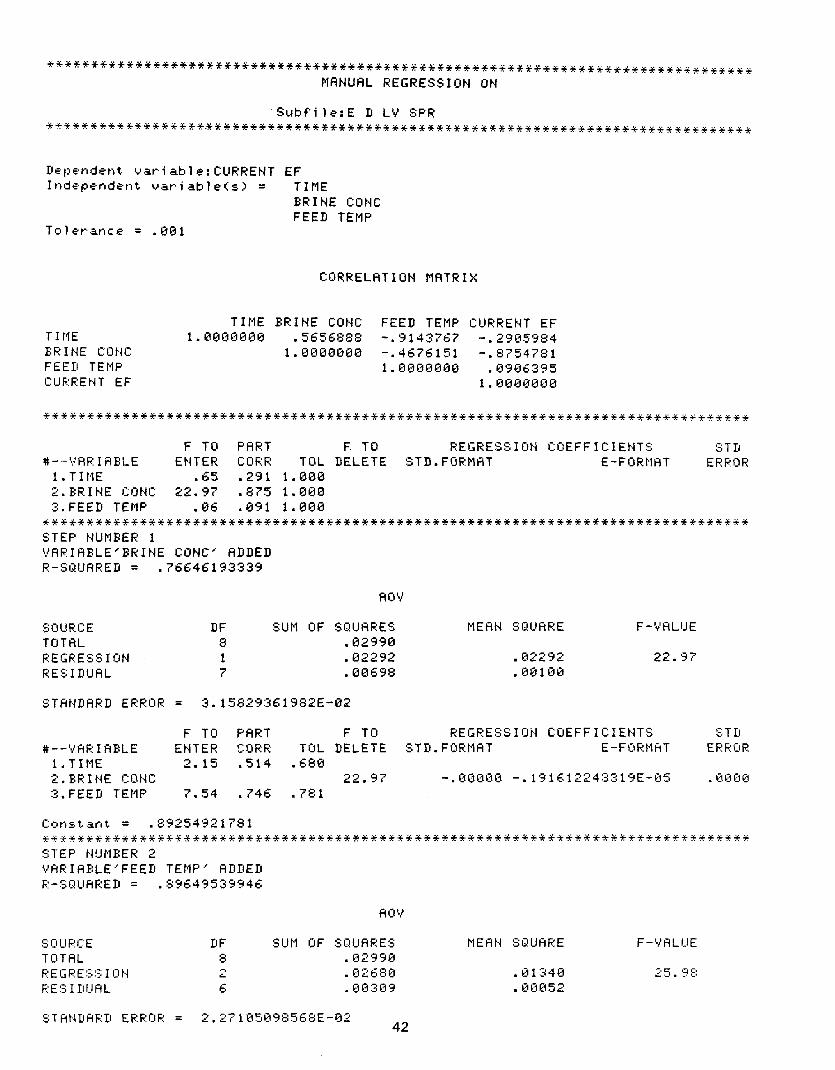
‘t********~****~**************~**********~~*****~**~************~~** ************ MHNUAL REGRESS1 ON IIN
Subfilc:E II LV SPR *+******* *******~*.*%**~*************************~*~**************** *%***~*~++**y*
D E’ p e n d e t-t t v a r i a b 1 I? : C U R R E N T E F Indcpsndent uariableCs.> = TIME
BRINE CONE FEED TEMP
Tolerance = .001
CORRELAT I ON MATR IX
TIME B R I N E C 0 N C FEED TEMP C U R R E t.4 T E F
TIME BRINE CONC FEED TEMP CURRENT EF 1.0000000 .5656888 -. 9143767 -. 290c;SS4 a .- d
1.0000000 -.4676151 -. 8754781 1.0000000 .090c395
1.0008000
F TO PHRT F. T# REGRESS I ON COEFFICIENTS STII #- -VAR I t3BLE ENTER CORR TOL DELETE STD.FrJRMfiT E-FORtlHT ERROR
l.TIPlE . 65 . 291 1.000 2. BRINE CONC 22.97 . 875 1.000 3. FEED TEMP .06 .091 1.000
*****~******~***************s*****************************************~******~~* STEP NIJMBER 1 VHRIHELE’BRINE CUNC’ ADDED R- SQClHREIS = .76646193339
ROV
SOURCE ISF SUM OF SQUHRES MEHN SQUHRE TUTHL 8 . 02990 REGRESS I ON 1 . 02292 . 0 2 2 4 -I- 3 R E 5: I 11 IJ H L 7 . 00698 . 00100
F-VHLUE
22.97
STAt.iDflRD ERROR = 3.1582936 1982E-02
F TO PRRT F TO REGRESS1Ut.I CUEFFICIEtITS STD # --VAR I FiSLE ENTER s 0 R R TOL DELETE STD. FORMHT E - F 13 R M Fi T E R R 0 R
l.TItlE 2.15 ‘514 .C80 2 , B p. 1 t4 E 1: Ij 1.4 1: 22.97 -.00000 -. 191&1224:3319E-05 .0000
3. FEED TEMP 7.54 ,746 ,781
C:ot-bstartt = . 8925492 178 I ~***********************.~***, ************* *********************~~~*~~~~~~~~*~*~*~ STEP HUtlEER 2 VAR I HBLE ‘FEED TEMP ’ ADDED I?: - S Q IJ H F; E II = .89&49539946
MEHtJ SBUHRE
. 01340
. b3bjo52
F - V H L U E

F TO PHRT F TO #--‘:‘HR I FtELE
RECRESSIOH COEFFICIENTS E t.1 T E R
STD C 0 R R TOL DELETE STD. FORMAT 1. TINE E-FORMHT 1.63 ERROR .5613
.148 2. E: R I t.4 E C 11 N C 51.44 -. QO~~~ ” FEED TEMP
-. 23:3364@:33:327E-05 .~QB@ .-. * 7.5 4 - . 0 ij ‘fJ 8 6 -. 98620237-?825E-@2 .00:3,5
Cunst .at-,t = 1*16i8&;24:;242
CORRELHT I ON llHTR1 X
TIME E R I t.I E 1: 0 td C FEED TEPlP E t.1 E R 1; ‘1.’
F TO PHRT F TO R E G R E !5 S I 0 N C 0 E F F I C I E t.1 T S !; T 11
#--‘y’AF: I HELE E t.1 T E R I: ~j R R T 0 L D E L E T E STD. FORMAT E-FORMHT ERROR
l.TItlE 5.661 .667 1.F388 2.BRItdE C:OtdC 7.71 .724 l.Oc?O ‘=’ ._a . F E E 13 T E tl P 1.67 . 433 1.6188
~~f~f~3~*ss*ff~Q~*~~~ ***+,*+*++*+ **+*ys++**++$++s+** *ssrss*+**ssssys**ssssssssss~ 15; T E P td U II E E R 1 ‘b’ A R I H E L E (’ T I H E .” H D D E 11 R-“;nlJRRED = . 44439:3’s It524

F-VALUE
4.92
:;TRtIDHRJj ERROR = . 187447522538
F TU PHRT F TO REGRESSIrJN COEFFICIENTS STD # --VAR I HBLE E N T E R c lj R R TOL DELETE STD. FORMAT E-FORMHT E R R 0 R
l.TIPlE 1 .3 ‘4 . 8@883 . :3279639’3@691 E-04 . ~~1~~ 2 . B R I td E C 0 N C 2.80 . L-JO@@@ . 48 1783~3294~,7E-@5 . 61088 3. FEED TEMP 2.67 .548 .lC8
5 III 1-l R I:: E DF SUM OF SQUFtRES TOTHL 0 Y .55676 PEGRESSION 3 . 41938 KES I DllHL 5 . 13738
tl E H N SC! U H R E
. 13979
. 02748
F-VHLUE
5.89
STHWISfiRIS ERROR = .165757818844
F TO PHRT F TO KEr,RESSION COEFFICIENTS STD #--Vt-iRIABLE ENTER CrJRR TOL DELETE STD. FORMHT E-FORtlHT ERROR
l.TIME 4.38 .88011 . 1880181 189558E-8:3 . rI1881 2. BRINE I:I]NC 2.66 . OQ@O@ . 419241685408E-05 .CIEIEIO 3. FEED TEMP 2.67 .0’3463 . 346343477184E-01 .a579
Cun5tant = . 85575334859
44

c: 0 R R E L H T I 0 t.1 M H T R I >:
F TO PHRT F T 0 R E G R E S !s 1 lj t.4 I: ij E F F 1 C 1 E t.4 T !: !s T Jj
#--‘y’fiR I AELE EHTER I:: Ij F: R T 0 L D E L E T E S T D . F 0 R M H T E-FORMAT E R R 0 R l.TIME 5.cG1 ,667 1.688 ‘2 h. B R 1 1.4 E C ~j t.4 1: 7.‘71 * 724 l.QB8 3. FEED TEPlF 1.67 . 439 1.0138
*+ ii-u++&.’ *+*++++++***+++ ~~~*S9*~~Y8r*Y*Ws~9~~*,, . . . . “r**w~~***~***)*~s*~~.. ..u.+*+.. +r*+***+*Y* 15 T E P t.4 1-I 11 E: E R 1 V A R I H B L E ’ E: R I id E C: 0 td C ..’ A D D E D /G: - ::i I;! I J H R E D = .5241471g!l539
STfitjIJfiRD ERRljF: = . 1945447’3 1469
F TO PHRT F T 0 F: E I; F: E 5 5 1 0 t4 I: ~j E F F 1 I:. 1 E t.4 T 5 5; T 11
#--?8RIi=iBLE E t.4 T E R c: lj R R T 0 L D E L E T E :; T 11 . ,= 0 F.: PI R T E - F 0 R 11 A T E R R 0 R 1. TIME 1 .54 .452 .6:30 ‘7 L. E R 1 1.1 E I:: 1 j N I:: 7 .7 1 bj8ElCll ,- - :j c - v .- . , tn j j. ,” ta 4 8 5 :3 ‘3 b3 E - b-i 5 -- , objnbj 3.FEED TEPlP . 17 a 164 .781

- - I.,) I-, Q I” e : 11 e p E n cl e n t. 1.1 ar i ah 1 e = E t.1 E R G Y Independent. sari abl eis) = TIME
B R I t4 E 12 0 t.1 C FEED TEllP
CORRELHT I Ot.1 tlHTR I X
T 0 T R L F: E I; P E !S ::; I ICI 1.4
TIME E 61 1 1.4 E C: 0 1.4 C: FEED TEPlF
R E :J I II I-l H L
11 F !3 IJ Pi I:I I= 5 12 IJ 17 F: E !:
‘3 ‘2 z.2 2 C: 10 H F I II E H 1:: E I t-4 T E R ? H L
C: 0 E F F I C: I E t,i T L 11; ld E R L I td I T UF’F’EF: L I tl I T
46

******************************************************************************** * BASIC STATISTICS FIND DHTA MANIPULHTION * ~++*****************************************************************************
HIGH RECOVERY ELECTRODIALYSIS AT LA VERKIN SPRINGS--RCau VERSUS Cau
Dat.a tfi 1 e name: Number of oboaruat ions: 6 Number of variables.: 2
Vari abl es names: 1. Cau E&‘&3 2. RCav X10E6
HIGH RECOVERY ELECTRODIALYSIS AT LA VERKIN SPRINGS--RCav VERSUS Cau
Variable # 1 Variable # 2 OBS#
1 188.90000 . 63850
L
76.50000 . 41780 :3
190.20000 .C3360 4
76.00000 . qlS80 5
171.20000 . 68990 6
78.90000 .49880
******************************************************************************** POLYNOMI RL REGRESS I ON ON DATA SET:
HIGH RECOVERY ELECTRODIRLYSIS HT LH VERKI N SPRI NGS--RCav VERSUS Cau I . .
- - I,., p, * p e * - * Dependent uar i abl e = RCav X10E6 Independent uari able = Cau EQ/b3
STHNDHRD COEFFICIEHT DEVIATION 0 F V H R I H T I 0 N
SS.BlC84 44 --‘1g2 , ‘j ‘j . 12041 =I.‘33041
MEAN SQUARE F - V H L U E

K iEGRESS I ON 1 . 06318 . 06318 27.14 8. .s ,A, .’ 1 1 06318 . 06318 27.14
RES I DUHL 4 . id931 .00233
REGRESSION COEFFICIENTS STHNDFIRD ERROR VAR I HBLE STD. FORMHT E-FORMHT REG. COEFFICIENT T-VHLUE .” I: 0 1.4 S T fi t-4 T ’ . 29921 . 249213167231E+00 . 05185 5.77 i’ A 1 8 I . 00192 . 191777024002E-02 . 00037 5.21
- C: 0 N S T H N T ’ x*1
COEFFICIENT .29321 . 00192
95 ;: CONFIDENCE INTERVRL LOWER LIMIT UPPER LIMIT
. 15526 . 44317
.00090 . 00294
HIGH RECOVERY ELECTRODIALYSIS AT LA VERKIN SPRINGS--RCav VERSUS Cav
.a r
Cav EWBI’
48

APPENDIX D
MEMBRANE SPECIFICATIONS
49
IONICS, INCORPORATED 65 Grove Street, Watertown, Massachusetts 02172 U S A Telephone: (617) 926-2500 Telex: 922473
,
Bulletin No. CR 61.0-D 0 Ionics, Incorporated - Feb. 1982 Printed in USA -
TYPE CR 61 CATION-TRANSFER
MEMBRANES
GENERAL INFORMATION I I
Ionics' CR 61 membranes are cation-selective membranes comprising cross-linked sulfonated copolymers of vinyl compounds. The membranes are homogeneous films, cast in sheet form on synthetic reinforcing fabrics.
Ionics' cation-transfer membranes have a combination of properties and character- istics which is unique. This includes:
. Low electrical resistance
. High permselectivity (ability to exclude anions)
. High burst strength
. Rugged reinforced construction
. Very high dimensional stability in solutions of different compositions
. Excellent long-term stability at temperatures up to 65OC. May be used for brief periods at temperatures up to 850 C.
. Long-term resistance to aqueous acid, alkaline and mild oxidizing solutions l Extensive use in more than 1000 electrodialysis installations . Ability to withstand harsh chemical and physical treatments to remove sur-
face and interior deposits. Ionics' membranes may be sandpapered, steel- wooled, wire-brushed or contacted with 5-10% acids, bases, salts or stabilized chlorine dioxide when the cleaning requirements warrant same. Ionics' mem- branes have been produced for more-than 25 years. Ionics can custom-make membranes of various electrochemical and mechanical properties having re- inforcing fabrics which are resistant to oxidative and other corrosive media. These are briefly described in Bulletin CR 61.4-D.
. All membranes produced at Ionics are required to pass rigorous quality control examinations.
REINFORCING FABRICS
Modacrylic Polymer (copolymer of vinyl chloride and acrylonitrile) is the fabric most commonly used. Other fabrics are used for applications where modacrylic exhibits insufficient chemical stability. These can be furnished on special order.
50

Bulletin No. CR 61.0-D Page 2
Some fabrics can be furnished in various thicknesses or weights. The lower the weight of the fabric, the lower in general will be the electrical resistance of the membrane. On the other hand, membranes with heavy-weight fabrics may exhibit a longer life than membranes with lighter fabrics, especially in applications where erosion may become a factor.
POROSITY
The.formulation of CR61 membranes can be varied to impart various total pore volumes and average pore sizes to the membrane. The lower the average pore size of a mem- brane, the lower will be the transfer of non-electrolytes accompanying ion transfer, but the higher will be the electrical resistance of the membrane.
Ionics offers two different standard total pore volumes in production membranes. A variety of total pore volumes can be made to custom order.
CHEMICAL STABILITY
The ion exchange resin of CR 61 membranes is not attacked by non-oxidizing solutions below pH 11 and has fair stability up to pH 14. It has fair resistance to mild oxidants and is not attacked by reducing agents. It may be used at temperatures up to 650C and sometimes up to 85oC, depending on conditions and the nature of the media with which it is contacted.
PHYSICAL STABILITY
If kept wet, physical stability is excellent. Membranes shrink upon extensive drying ad, therefore, cracking may occur.
HANDLING/MOUNTING
Membranes can be mounted between gum rubber, neoprene, SBR, polyethylene, silicone, plasticized PVC, or other soft, insulating gaskets. Moderate gasket pressure will seal a membrane satisfactorily for most uses. Membranes (except the 389 series) may be bent around curves of large radius, but caution should be observed. Membranes may be cemented together or to other applicable substrates by the use of fast curing epoxy cements.
PATENTS
Ionics, Incorporated, owns many U.S. and foreign patents covering the manufacture and/or certain uses of ion-transfer membranes, and the sale of these membranes shall not be construed as a license for their use in conflict with existing patents or patent applications owned by Ionics or others.
STORAGE
If long-term (many months) storage of any CR 61 membrane is contemplated, the water of storage should be made up by first dissolving 1 gram of benzoic acid in 10 ml of ethyl alcohol and pouring this into each liter of storage water. This 0.1% solution will inhibit the growth of microorganisms during storage.
***
51

IONICS, INCORPORATED 65 Grove Street, Watertown, Massachusetts 02172 U S A Telephone: (617) 926-2500 Telex. 922473
Bulletin No. CR 61.1-E @ Ionics, Incorporated - March 1982 Printed in USA
CATION-TRANSFER TYPE 61 AZL 386 MEMRRANES PROPERTIES AND CHARACTERISTICS
Many standard Ionics electrodialysis reversal ("EDR") plants are furnished with 61-AZL-386 Modacrvlic fiber-backed cation-transfer membranes for the transport of cations while retarding anions. The property data are typical values only and no warranty as to such prope-ties is given.
Reinforcing Fabric: Modacrylic (copolymer of vinyl chloride and acrylonitrile)
Weight: 4 oz/yd2 Specific Weight: 13.7 mq/cm2
Membrane Thickness: 20 mils (0.5 mm)
(Mullen): 75 psi (5.25 kg/cm') Burst Strength
Water Content:
Capacity:
46% of wet resin only
2.44 meq/dry gram resin (minimum)
VARIOUS ELECTROCHEMICAL PROPERTIES
Concentration 0.01 N NaCl 0.1 N NaCl 1.0 N NaCl 3.0 N NaCl
Area Specific Resist. (ohm-cm21 16.7 11 4 2
Spec. Conductance mho/cm 3 x 10 -3 4.5 x lo-3 12.5 x lO-3 25 x 10 -3
Current Efficiency T+ (Fraction of current carried by iition
0.98 0.92 0.86 -
only)
OTHER PROPERTIES
Water Transport:
Sucrose Transport:
0.200 liters per Faraday in 0.6N NaCl @ 16 ma/cm2
30 grams per Faraday from 30% sucrose in 0.2N KC1 into 0.2N KC1 @ 16 ma/cm2
NOTICE: For patent and license notice, see Bulletin CR 61.0-D.
52

BULLETIN No. CR61.4-C
PROPERTIES AND CHARACTERISTICS
Ionics’ Dynel-backed cation-transfer membrane 6lcZLl83 has a tighter matrix than membrane 61AZL183. Therefore, it is suggested for use in
61C ZL183
elcctrodialysis as a means for transporting cations while excluding anions in applications where loss of solvent and of non-ionized product must be reduced below that obtainable with membrane 6lAZLl83.
Backing - Type: Dyne1 4 oz/yd2
Specific Weight: 14 mg/cm2 Weight: Content: 34 wt% (dry)
Membrane Thickness : 24 mils (0.6 mm)
Burst Strength (Mullen): 115 psi (8 kg/cm2)
Water Content: 40% of wet resin only
Capacity: 2.7 mcq/dry gram resin
O.OlN NaCl O.lN NaCl l.ON NaCl 3.ON NaCl Area Specific Resist.
(ohm-cm’) 13 11 8 5
Spec. Conductance (mho/cm) 5 x 10⁻³ 6 x lo-3 8 x 1O-3 12 x 10-3
Sucrose Transport @ 16 ma/cm2, 30% sucrose in 0.2N KCl/O.OZN KC1 (g/Faraday)
-- 6
NOTICE:
1. The property data are typical values only and no warranty as to such properties is given. 2. Ionics, Incorporated, will be pleased to advise on procedures for measurement of membrane characteristics, including resistance, ion-exchange capacity, burst strength, moisture content, density, water transport, transport number, and/or leakage (pinholes), Alternatively, Ionics will be pleased to measure pertinent properties on membranes after use by the customer to check for possible dcgra- dation. 3. For patent and license clause, see Bulletin CR61.
IONICS INCORPORATED l 65 GROVE STREET, WATERTOWN, MASS. 02172, U.S.A. Telephone: Area Code 617. 926-2500 l Cable: IONICS
53
IONICS, INCORPORATED 65 Grove Street, Watertown, Massachusetts 02172 U.S.A. Telephone: (617) 926-2500 Telex: 922473
Bulletin No. AR 103.0-E I 0 Ionics, Incorporated - March 1982 Printed in USA
TYPE AR 103
ANION-TRANSFER MEMBRANES
GENERAL INFORMATION 1
Ionics' AR 103 membranes are anion-selective membranes comprising cross-linked copolymers of vinyl monomers and containing quaternary ammonium anion exchange groups. The membranes are homogeneous films, cast in sheet form on reinforcing synthetic fabrics.
Ionics' anion-transfer membranes have a combination of properties and character- istics which is unique. This includes:
0 Low electrical resistance
0 High permselectivity (ability to exclude cations)
l High burst strength
0 Rugged reinforced construction
0 Except in hydroxide ion form, excellent long-term stability at temperatures up to 65OC and in solutions having pH's < 9. May be used for brief periods at temperatures up to 95OC
@ Long-term resistance to aqueous acid solutions
0 Very high dimensional stability in solutions of different compositions
l Ability to withstand harsh chemical and physical treatments to remove surface and interior deposits. (Ionics membranes may be sandpapered, steel wooled or wire-brushed, contacted with 5-10% acids or salts and stabilized chlorine dioxide when the cleaning requirements warrant same.)
0 Extensive use in more than 1000 electrodialysis installations. Ionics mem- branes have been produced for more than 25 years.
0 All membranes produced at Ionics are required to pass rigorous quality control examinations.
Ionics can custom maKe membranes for special applications, varying mechanical and electrochemical properties or using reinforcing fabrics which are resistant to oxidation, caustic or other corrosive media.
54

REINFORCING FABRICS
Modacrylic Polymer is the fabric most commonly used in Type AR 103. Other fabrics can be furnished for applications where a modacrylic would exhibit insufficient chemical stability. Fabrics can be furnished in various thicknesses or weights. The lower the weight of the fabric, the lower in general will be the electrical resistance of the membrane. On the other hand, membranes with heavy weight fabrics may exhibit a longer life than membranes with lighter fabrics, especially in appli- cations where erosion may become a factor.
POROSITY
The formulation of AR 103 membranes can be varied to impart various average pore sizes or total pore volumes to the membrane. The smaller the average pore size of a membrane, the lower will be the transfer of non-electrolytes which accompany ion transfer, but the higher will be the electrical resistance of the membrane. The larger the total pore volume, the less efficient a membrane will be.
Ionics offers two different standard total pore volumes in production membranes. A variety of total pore volumes and average pore sizes can be made to custom order.
CHEMICAL STABILITY
At room temperature, the AR 103 anion membranes are stable to non-oxidizing solutions between pH 0 and 9 and exhibit fair stability to solutions outside of this range, e.g. 4-5 N HCl and H2SO4. They may be used at temperatures up to 65OC (except in the hydroxide ion form) on a continuous operation in this pH range and for brief periods up to 95oc. At operating temperatures in the 65-95OC region slow losses in ion exchange capacity can be expected.
Contact with oxidizing agents (chlorine, hypochilorites) and strong bases, e.g. 0.5 N sodium hydroxide should be avoided as should contact with low molecular weight organic polyelectrolytes such as salts of humic acid, lignates, branched chain alkyl or aryl sulfonates, tannins, etc., the anions of which tend to be irreversibly absorbed on the surface of anion selective membranes if present at appreciable concentrations.
PHYSICAL STABILITY
If kept wet, physical stability is excellent. Membranes shrink upon drying and crack upon excessive drying.
Swelling of membranes in water as the temperature is increased is minimal for all types of Ionics membranes and rarely exceeds 5% in any dimension when heated from room temperature to 1OOOC.
HANDLING/MOUNTING
Membranes can be mounted between gum rubber, neoprene, SBR, polyethylene, plasticized PVC, silicone and other soft, insulating elastomeric or thermoplastic materials.
Moderate pressure will seal a membrane against such materials satisfactorily for most uses. Membrane sheets may be bent around curves of large radius but caution should be observed.
AR 103-Z
55
NOTE
Anion membranes intended to be stored for long periods may sometimes contain small amounts of hydrochloric acid added during manufacture. Before use, such membranes should be flushed in water, preferably containing ions present in the solution to be processed.
STORAGE
If long term (many months) storage of any AR 103 membrane is contemplated, the water of storage should be made up by first dissolving 1 gram of benzoic acid in 10 ml of ethyl alcohol and pouring this into each liter of storage water. This 0.1% solution will inhibit the growth of various micro-organisms during storage.
PATENTS
Ionics, Incorporated, owns many U.S. and foreign patents pertaining to the manufacture and/or use of ion transfer membranes and the sale of these membranes shall not be construed as a license for their use in conflict with existing patents or patent applications owned by Ionics or others.
AR 103..3
56

IONICS, INCORPORATED 65 Grove Street, Watertown, Massachusetts 02172 U S.A. Telephone: (617) 926-2500 Telex: 922473
Bulletin No. AR 103.1-E 0 Ionics, Incorporated - March 1982 Printed in USA
TYPE 103-PZL-386 ANION-TRANSFER
MEMRRANES PROPERTIES AND CHARACTERISTICS I Many standard Ionics electrodialysis reversal ("EDR") plants are furnished with 103-PZL-386 Modacrylic fiber-backed anion transfer membranes for the transport of anions while retarding cations. The property data are typical values only and no warranty as to such properties is given.
Reinforcing Fabric: Modacrylic (copolymer of vinyl chloride and acrylonitrile)
Weight: 4 oz/yd2 Specific Weight: 13.7 mg/cm2
Membrane Thickness: 20 mils (0.5 mm)
Burst Strength (Mullen): 100 psi (7.0 kg/cm')
Water Content: 46% of wet resin only
Capacity: 1.72 meq/dry gram resin (minimum)
VARIOUS ELECTROCHEMICAL PROPERTIES
Concentration 0.01 N NaCl 0.1 N NaCl 1.0 N NaCl 3.0 N NaCl
Area Specific Resist. (ohm-cm21 18.5 12 5 2
Specific Conductance mho/cm 2.7 x 10 -3 4.2 x lO-3 10 x lo-3 25 x 10 -3
Current Efficiency T- (Fraction of current carried by anions
0.99 0.95 0.81. -
only)
OTHER PROPERTIES
Water Transport: 0.152 liters per Faraday in 0.6 NaCl @ 16 ma/cm'
Sucrose Transport: 13.5 grams per Farada 0.02 N KCL @ 16 ma/cm s
from 30% sucrose in 0.2 N KC1 into
NOTICE: 1) The property data are typical values only and no warranty as to such properties is given.
2) For patent and license notice, see Bulletin AR 103.0-E
57

IONICS, INCORPORATED 65 Grove Street, Watertown, Massachusetts 02172 U.S A. Telephone: (617) 926-2500 Telex: 922473
Bulletin No. AR 204.0-A 0 Ionics, Incorporated - March 1982 Printed in USA
ANION-TRANSFER MEMBRANES
TYPE AR 204
GENERAL INFORMATION
Ionics' AR 204 membranes are anion-selective membranes comprising cross-linked copolymers of vinyl monomers and containing quaternary ammonium anion exchange groups. The membranes are homogeneous films, cast in sheet form on reinforcing synthetic fabrics.
Ionics' anion-transfer membranes have a combination of properties and character- istics which is unique. This includes:
. Low electrical resistance
. High permselectivity (ability to exclude cations)
. High burst strength
. Rugged reinforced construction
. Except in hydroxide ion form, excellent long-term stability at temperatures up to 65OC and in solutions having pH's < 9. May be used for brief periods at temperatures up to 95OC.
. Long-term resistance to aqueous acid solutions
. Very high dimensional stability in solutions of different compositions
. Ability to withstand harsh chemical and physical treatments to remove surface and interior deposits. (Ionics membranes may be sandpapered, steel wooled or wire-brushed, contacted with 5-10% acids, or salts and stabilized chlorine dioxide when the cleaning requirements warrant same.)
. Extensive use in electrodialysis installations.
. All membranes produced at Ionics are required to pass rigorous quality control examinations. Ionics membranes have been produced for more than 25 years.
Ionics can custom make membranes for special applications, varying mechanical and electrochemical properties or using reinforcing fabrics which are resistant to oxidation, caustic or other corrosive media.
58
REINFORCING FABRICS
Modacrylic Polymer is the fabric most commonly used in Type AR 204. Other fabrics can be furnished for applications where a modacrylic would exhibit insufficient chemical stability. Fabrics can be furnished in various thicknesses or weights. The lower the weight of the fabric, the lower in general will be the electrical resistance of the membrane. On the other hand, membranes with heavy weight fabrics may exhibit a longer life than membranes with lighter fabrics, especially in appli- cations where erosion may become a factor.
POROSITY
The formulation of AR LO4 membranes can be varied to impart various average pore sizes or total pore volumes to the membrane. The smaller the average pore size of a membrane, the lower will be the transfer of non-electrolytes which accompany ion transfer, but the higher will be the electrical resistance of the membrane. The larger the total pore volume, the less efficient a membrane will be.
Ionics offers two different standard total pore volumes in production membranes. A variety of total pore volumes and average pore sizes can be made to custom order.
CHEMICAL STABILITY
At room temperature, the AR 204 anion membranes are stable to non-oxidizing solutions between pH 0 and 9 and exhibit fair stability to solutions outside of this range, e.g. 4-5 N HCl and H2SO4. They may be used at temperatures up to 65OC (except in the hydroxide ion form) on a continuous operation in this pH range and for brief periods up to 950C. At operating temperatures in the 65-95OC region slow losses in ion exchange capacity can be expected.
Contact with oxidizing agents (chlorine, hypochlorites) and strong bases, e.g. 0.5 N sodium hydroxide should be avoided as should contact with low molecular weight organic polyelectrolytes such as salts of humic acid, lignates, branched chain alkyl or aryl sulfonates, tannins, etc., the anions of which tend to be irreversibly absorbed on the surface of anion selective membranes if present at appreciable concentrations.
PHYSICAL STABILITY
If kept wet, physical stability is excellent. Membranes shrink upon drying and crack upon excessive drying.
Swelling of membranes in water as the temperature is increased is minimal for all types of Ionics membranes and rarely exceeds 5% in any dimension when heated from room temperature to 1OOOC.
HANDLING/MOUNTING
Membranes can be mounted between gum rubber, neoprene, SBR, polyethylene, plasticized PVC, silicone and other soft, insulating elastomeric or thermoplastic materials.
Moderate pressure will seal a memorane against such materials satisfactorily for most uses. Membrane sheets may be bent around curves of large radius but caution should be observed.
AR 204-2
59

NOTE
Anion membranes intended to be stored for long periods may sor..etimes contain small amounts of hydrochloric acid added during manufacture. Before use, such membranes should be flushed in water, preferably containing ions present in the solution to be processed.
STORAGE
If long term (many months) storage of any AR 204 membrane is contemplated, the water of storage should be made up by first dissolving 1 gram of benzoic a
P id in 10 ml of
ethyl alcohol and pouring this into each liter of storage water. This 0.1% solution will inhibit the growth of various micro-organisms during storage.
PATENTS
Ionics, Incorporated, owns many U.S. and foreign patents pertaining to the manufacture and/or use of ion transfer membranes and the sale of these membranes shall not be construed as a license for their use in conflict with existing patents or patent applications owned by Ionics or others.
AR 204-3
60

IONICS, INCORPORATED 65 Grove Street, Watertown, Massachusetts 02172 U.S.A. Teleohone: (617) 926-2500 Telex: 922473
Bulletin No. AR 204.1-A 0 Ionics, Incorporated - March 1982 Printed in USA
ANION-TRANSFER TYPE 204-SXZL-386 MEMBRANES PROPERTIES AND CHARACTERISTICS
Many standard Ionics electrodialysis reversal ("EDR") plants are furnished with 204-SXZL-386 Modacrylic fiber-backed anion transfer membranes for the transport of anions while retarding cations. The property data are typical values only and no warranty as to such properties is given.
Reinforcing Fabric: Modacrylic (copolymer of vinyl chloride and acrylonitrile)
Weight: 4 oz/yd2 Specific Weight: 13.7 mg/cm2
Membrane Thickness: 20 mils (0.5 mm)
Burst Strength (Mullen): 100 psi (7.0 kg/cm2)
Water Content:
Capacity:
46% of wet resin only
2.20 meq/dry gram resin (minimum)
VARIOUS ELECTROCHEMICAL PROPERTIES
Concentration 0.01 N NaCl 0.1 N NaCl 1.0 N NaCl 3.0 N NaCl
Area Specific Resist. (ohm-cm2) 14.0 11 5 2
specific Conductance mho/cm 3.6 x 10 -3 4.5 x 10 -3 10 x 10 -3 25 x 10
-3
Current Efficiency ^c (Fraction of current- carried by anions only)
- 0.99 0.96 0.88
OTHER PROPERTIES
Water Transport: 0.120 liters per Faraday in 0.6 NaCl @ 16 ma/cm2
Sucrose Transport: 11.5 grams per Faraday from 30% sucrose in 0.2 N KC1 into 0.02 N KCL @ 16 ma/cm2
NOTICE: 1) The property data are typical values only and no warranty as to such properties is given.
2) For patent and license notice, see Bulletin AR 204.0-A.
61 GPO 846-085


Mission of the Bureau of Reclamation
The Bureau of Reclamation of the U.S. Department of the Interior is responsible for the development and conservation of the Nation’s water resources in the Western United States.
The Bureau‘s original purpose ‘to prorke for the reclamation of arid and semiarid lands in the West” today covers a wide range of interre- lated functions. These include providing municipal and industrial water supplies; hydroelectric power generation; irriga tion water for agricul- ture; water quality improvement; flood control; river navigation; river regulation and control; fish and wildlife enhancement; outdoor recrea- tion; and research on water-related design, construe tion, materials, atmospheric management, and wind and solar power.
Bureau programs most frequently are the result of close cooperation with the U.S. Congress, other Federal agencies, Stares, local govern- men ts, academic ins&u tions, water-user organizations, and other concerned groups.
“ It describes some of the technical publications currently
obtained upon request from the Bureau of Reclamation, Attn D-922, P 0 Box 25007, Denver Federal Center, Denver CO 80225-0007.