TYRE INDUSTRY OF JAPAN - · PDF file5 History of the Japanese Tyre Industry 2. Changes in...
32
w w w . j a t m a . o r . j p 2017 TYRE INDUSTRY OF JAPAN
Transcript of TYRE INDUSTRY OF JAPAN - · PDF file5 History of the Japanese Tyre Industry 2. Changes in...
www. ja tma.or . jp
2017
TYRE INDUSTRYOF JAPAN
Contents
The Japan Automobile Tyre Manufacturers Association, Inc. .................................... 2
JATMA Member Firms ................................................................................................................... 3
I. History of the Japanese Tyre Industry 1. Brief History of the Japanese Tyre Industry .................................................................................. 4
2. Changes in Production Volume of Tyres and Automobiles ........................................................... 5
II. The Japanese Tyre Industry Today 1. Overview ........................................................................................................................................ 6
2. Trends in Production by Tyre Category ......................................................................................... 7
3. Trends in Sales of Original Equipment Tyres ................................................................................ 7
4. Trends in Sales of Replacement Tyres ......................................................................................... 8
Trends in Sales of Summer Tyres and Winter Tyres for Replacement (for Four-Wheeled Vehicles) .... 8
5. Trends in Sales of Export Tyres .................................................................................................... 9
6. Exports by Region of Destination ................................................................................................ 10
7. Imports by Region of Origin ......................................................................................................... 10
III. Measures for Tyre Safety 1. Safety Standards for Automobile Tyres ....................................................................................... 11
2. Tyre Standards ............................................................................................................................ 11
3. Legal Limits on Tread Wear ........................................................................................................ 12
4. Product Inspection ....................................................................................................................... 12
IV. Consideration for Environment 1. Tyre Labeling System ................................................................................................................... 13
2. Approach to Reduce CO2 Emissions ........................................................................................... 13
3. Effort to “Reduce” ........................................................................................................................ 14
4. Current Status on Scrap Tyre (Used Tyre) Recycling .................................................................. 15
5. Situation in Illegal Piling & Dumping of Scrap Tyres ..................................................................... 16
6. Support Program for Dumping Site Restoration by JATMA .......................................................... 16
V. References 1. Automobiles and Tyres ................................................................................................................ 17
2. Distribution Channels .................................................................................................................. 18
3. Raw Materials .............................................................................................................................. 19
4. Tyre Production Worldwide ......................................................................................................... 20
Distribution of Member Firms’ (Full Member) Automobile Tyre Plants................. 21
TYRE INDUSTRY OF JAPAN 2017
2
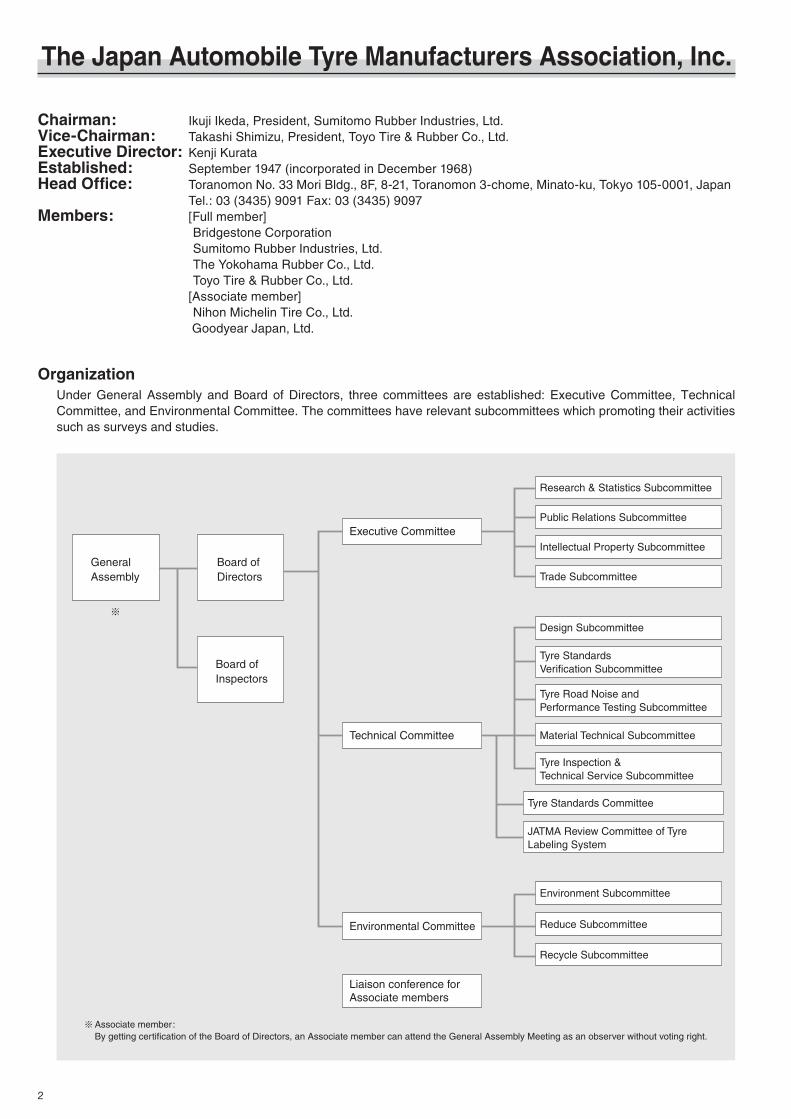
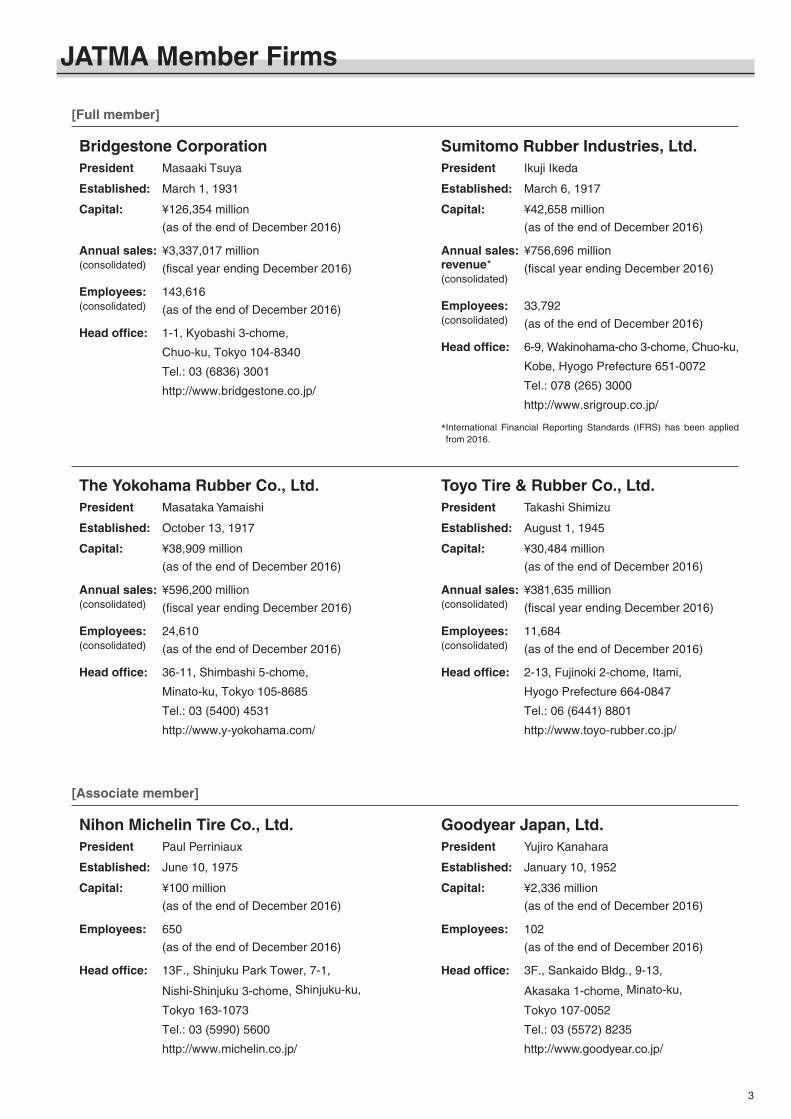
Chairman: Ikuji Ikeda, President, Sumitomo Rubber Industries, Ltd.Vice-Chairman: Takashi Shimizu, President, Toyo Tire & Rubber Co., Ltd.Executive Director: Kenji KurataEstablished: September 1947 (incorporated in December 1968)Head Office: Toranomon No. 33 Mori Bldg., 8F, 8-21, Toranomon 3-chome, Minato-ku, Tokyo 105-0001, Japan Tel.: 03 (3435) 9091 Fax: 03 (3435) 9097Members: [Full member] Bridgestone Corporation Sumitomo Rubber Industries, Ltd. The Yokohama Rubber Co., Ltd. Toyo Tire & Rubber Co., Ltd. [Associate member] Nihon Michelin Tire Co., Ltd. Goodyear Japan, Ltd.
OrganizationUnder General Assembly and Board of Directors, three committees are established: Executive Committee, Technical Committee, and Environmental Committee. The committees have relevant subcommittees which promoting their activities such as surveys and studies.
The Japan Automobile Tyre Manufacturers Association, Inc.
GeneralAssembly
Associate member:By getting certification of the Board of Directors, an Associate member can attend the General Assembly Meeting as an observer without voting right.
Board ofDirectors
Board ofInspectors
Executive Committee
Technical Committee
Environmental Committee
Liaison conference forAssociate members
Research & Statistics Subcommittee
Public Relations Subcommittee
Intellectual Property Subcommittee
Trade Subcommittee
Design Subcommittee
Tyre Standards Verification Subcommittee
Tyre Road Noise andPerformance Testing Subcommittee
Material Technical Subcommittee
Tyre Inspection &Technical Service Subcommittee
Tyre Standards Committee
JATMA Review Committee of Tyre Labeling System
Environment Subcommittee
Reduce Subcommittee
Recycle Subcommittee
3
Bridgestone CorporationPresident Masaaki Tsuya
Established: March 1, 1931
Capital: ¥126,354 million
(as of the end of December 2016)
Annual sales: ¥3,337,017 million(consolidated) (fiscal year ending December 2016)
Employees: 143,616(consolidated) (as of the end of December 2016)
Head office: 1-1, Kyobashi 3-chome,
Chuo-ku, Tokyo 104-8340
Tel.: 03 (6836) 3001
http://www.bridgestone.co.jp/
Toyo Tire & Rubber Co., Ltd.President Takashi Shimizu
Established: August 1, 1945
Capital: ¥30,484 million
(as of the end of December 2016)
Annual sales: ¥381,635 million(consolidated) (fiscal year ending December 2016)
Employees: 11,684(consolidated) (as of the end of December 2016)
Head office: 2-13, Fujinoki 2-chome, Itami,
Hyogo Prefecture 664-0847
Tel.: 06 (6441) 8801
http://www.toyo-rubber.co.jp/
Sumitomo Rubber Industries, Ltd.President Ikuji Ikeda
Established: March 6, 1917
Capital: ¥42,658 million
(as of the end of December 2016)
Annual sales: ¥756,696 millionrevenue* (fiscal year ending December 2016)(consolidated)
Employees: 33,792(consolidated) (as of the end of December 2016)
Head office: 6-9, Wakinohama-cho 3-chome, Chuo-ku,
Kobe, Hyogo Prefecture 651-0072
Tel.: 078 (265) 3000
http://www.srigroup.co.jp/
* International Financial Reporting Standards (IFRS) has been applied from 2016.
Nihon Michelin Tire Co., Ltd.President Paul Perriniaux
Established: June 10, 1975
Capital: ¥100 million
(as of the end of December 2016)
Employees: 650
(as of the end of December 2016)
Head office: 13F., Shinjuku Park Tower, 7-1,
Nishi-Shinjuku 3-chome, Shinjuku-ku,
Tokyo 163-1073
Tel.: 03 (5990) 5600
http://www.michelin.co.jp/
Goodyear Japan, Ltd.President Yujiro Kanahara
Established: January 10, 1952
Capital: ¥2,336 million
(as of the end of December 2016)
Employees: 102
(as of the end of December 2016)
Head office: 3F., Sankaido Bldg., 9-13,
Akasaka 1-chome, Minato-ku,
Tokyo 107-0052
Tel.: 03 (5572) 8235
http://www.goodyear.co.jp/
The Yokohama Rubber Co., Ltd.President Masataka Yamaishi
Established: October 13, 1917
Capital: ¥38,909 million
(as of the end of December 2016)
Annual sales: ¥596,200 million(consolidated) (fiscal year ending December 2016)
Employees: 24,610(consolidated) (as of the end of December 2016)
Head office: 36-11, Shimbashi 5-chome,
Minato-ku, Tokyo 105-8685
Tel.: 03 (5400) 4531
http://www.y-yokohama.com/
JATMA Member Firms
[Full member]
[Associate member]
4
(1) 1940s-1950sThe industry restructured after World War II, following the destruction of facilities and equipment. In the early 1950s, after the long-term government regulation and during the Korean War, the industry enjoyed special procurement and improved tyre demand. However, after the Korean War, deflationary pressures affected the Japanese economy. Demand for tyres decreased sharply, and the tyre market experienced considerable difficulty.
(2) 1960sAround 1960, full-fledged motorization, including increased automobiles on the road and the advent of expressways, spurred the industry toward a technological revolution, including expansion and automation of equipment, as well as changes in the raw materials for tyres, and enjoyed a high-growth phase.
(3) 1970sFrom 1970, the industry suffered demand downturns temporarily as a result of the first oil crisis. However, exports led the growing Japanese economy. Tyre production expanded, as a result of an increase in the number of vehicles produced and registered, and product diversification spurred demand.
(4) 1980sLow economic growth under the worldwide recession following the second oil crisis (1979) combined with the progress of radial tyres, which caused demand downturns, forcing the Japanese tyre industry into a period of extreme difficulty. In 1983, however, a turnaround was seen owing to economic recovery in Japan and in principal nations worldwide. In September 1985, however, tyre demand dropped, influenced by the strong yen. Then in December 1986, the Japanese economy started to grow steadily, backed by solid consumer spending and capital investment. As a result, the volume of rubber consumption reached the 1-million-ton mark in 1989.
(5) 1990sWith the collapse of Japan’s “bubble economy,” the stock market crashed, corporate profits declined, the job environment became uncertain, consumer spending and capital investment slowed, and the yen appreciated causing further deepening of economic stagnation. Signs of recovery were seen in 1995, but in 1997 Japan entered a recession. In 1998 and 1999, large-scale restructuring in the financial sector and the introduction of foreign capital into the automotive industry arose as serious concerns. On the other hand, the global economy in general remained steady despite economic difficulties in Southeast Asia, supported by the robust U.S. economy. In this environment, the Japanese tyre industry grew overall, although rubber consumption fell below the 1-million-ton mark in 1993. Supported by brisk exports, Japanese tyre production volume increased to 1.13 million tons in 1999, a record high.
(6) 2000sThe Japanese economy was on a trend of gentle recovering, and although it was still suffering from such problems as continuing high prices of raw materials, it continued the biggest economic growth after the Second World War owing to improved corporate earnings and increased capital investments. Global economy continued strong as a whole until 2007 owing to supports by the robust economy of the United States, Europe, Middle East and BRICs countries, and tyre rubber production volume marked a record high every year from 2002 and it reached 1.36 million tons in 2007.However, tyre production volume took a downward turn in 2008 after seven years due to the serious worldwide economic crisis from September 2008 and decreased by 360,000 tons, then declined to 990,000 tons under 1 million tons after fifteen years.
(7) 2010-2016Japanese economy seemed recovered once supported by the government’s economic policies etc.; however it turned in negative growth in 2011 due to the Great East Japan Earthquake and the record appreciation of the yen. Although the need for reconstruction after the earthquake boosted Japan’s economy and resulted in positive growth again 2012 and it has continued its steady increase since 2013 by the effect of high stock prices and depreciation of the yen, there was also the rise of consumption tax in April 2014 and the growth has been weakened. The world economy was gradually recovering from the after effect of the financial crisis, however, since 2012, in developing countries and resource-rich countries it has decelerated and the growth has remained low. In this demand environment, tyre production amount in Japan has decreased for 5 consecutive years to 1.02 million tons in rubber consumption in 2016.
History of the Japanese Tyre Industry
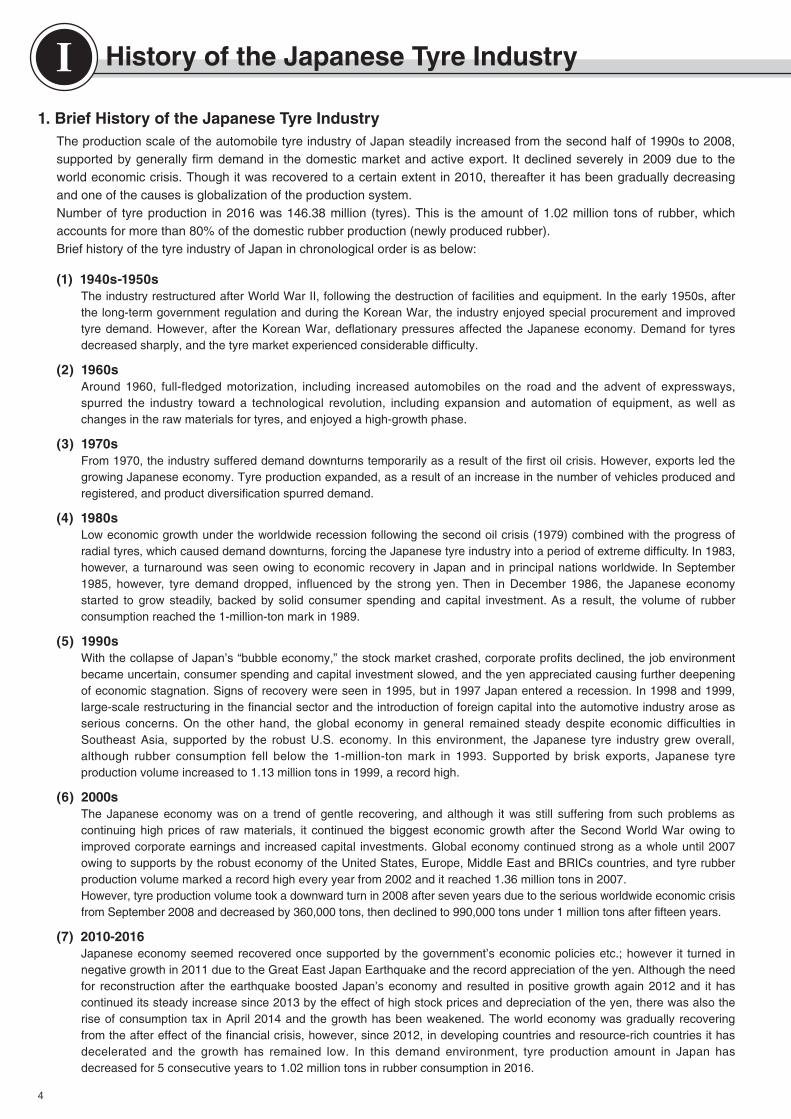
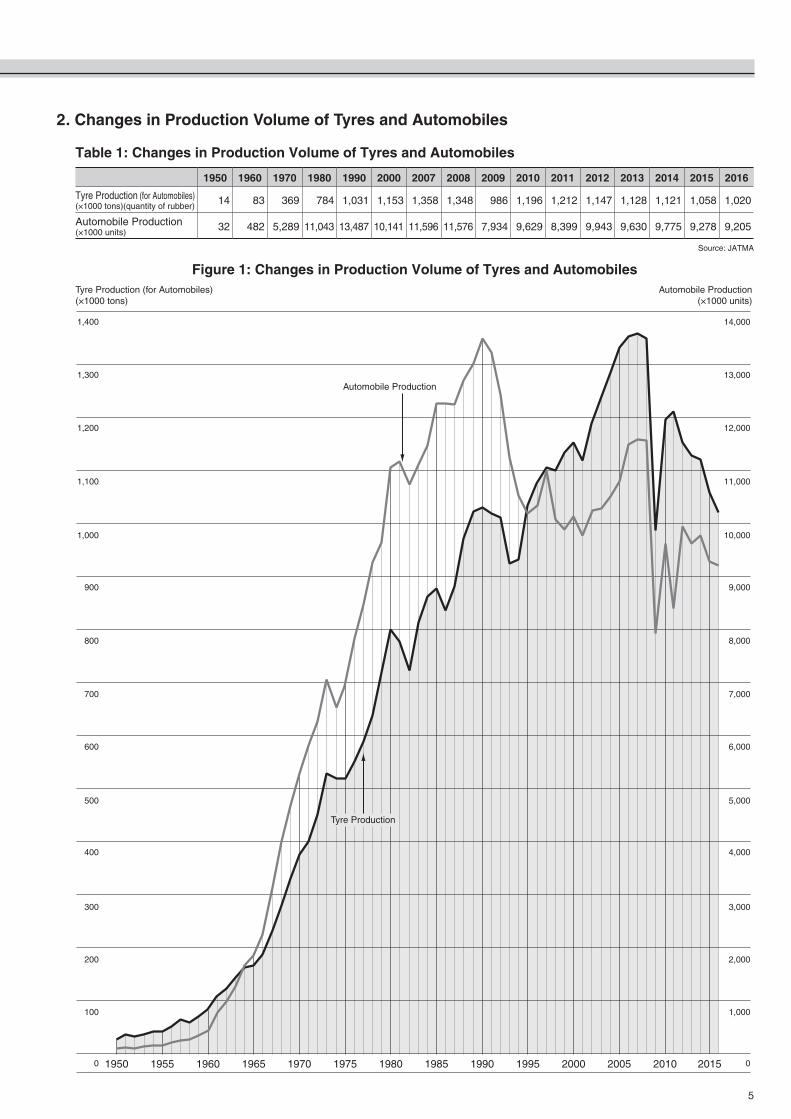
1. Brief History of the Japanese Tyre IndustryThe production scale of the automobile tyre industry of Japan steadily increased from the second half of 1990s to 2008, supported by generally firm demand in the domestic market and active export. It declined severely in 2009 due to the world economic crisis. Though it was recovered to a certain extent in 2010, thereafter it has been gradually decreasing and one of the causes is globalization of the production system.Number of tyre production in 2016 was 146.38 million (tyres). This is the amount of 1.02 million tons of rubber, which accounts for more than 80% of the domestic rubber production (newly produced rubber).Brief history of the tyre industry of Japan in chronological order is as below:
Ⅰ
5
History of the Japanese Tyre Industry
2. Changes in Production Volume of Tyres and Automobiles
Table 1: Changes in Production Volume of Tyres and Automobiles
Figure 1: Changes in Production Volume of Tyres and Automobiles
1950 1960 1970 1980 1990 2000 2007 2008 2009 2010 2011 2012 2013 2014 2015 2016
Tyre Production (for Automobiles)(×1000 tons)(quantity of rubber) 14 83 369 784 1,031 1,153 1,358 1,348 986 1,196 1,212 1,147 1,128 1,121 1,058 1,020
Automobile Production(×1000 units) 32 482 5,289 11,043 13,487 10,141 11,596 11,576 7,934 9,629 8,399 9,943 9,630 9,775 9,278 9,205
Source: JATMA
100
0
200
300
400
500
600
700
800
900
1,000
1,200
1,100
1,000
0
2,000
3,000
4,000
5,000
6,000
7,000
8,000
9,000
10,000
11,000
12,000
13,000
14,000
Automobile Production1,300
1,400
Tyre Production (for Automobiles)(×1000 tons)
Automobile Production (×1000 units)
Tyre Production
1950 1955 1960 1965 1970 1975 1980 1985 1990 1995 2000 2005 2010 2015
6
Ⅱ1. Overview
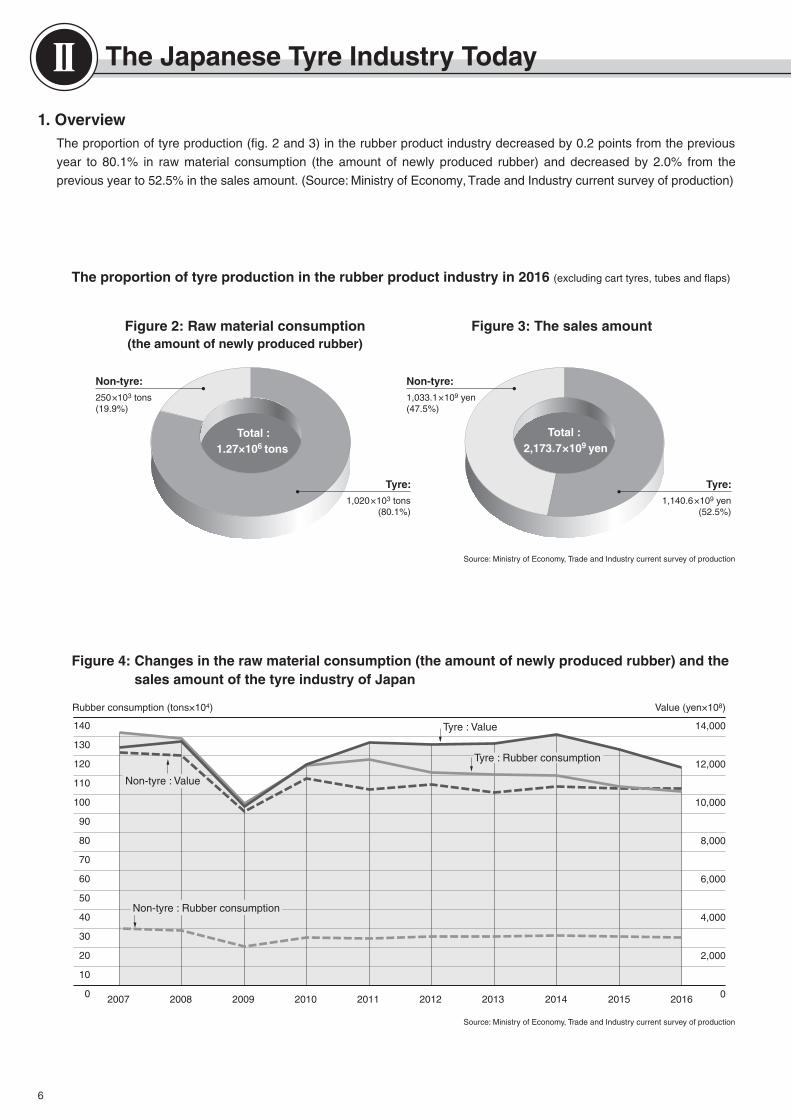
The proportion of tyre production (fig. 2 and 3) in the rubber product industry decreased by 0.2 points from the previous
year to 80.1% in raw material consumption (the amount of newly produced rubber) and decreased by 2.0% from the
previous year to 52.5% in the sales amount. (Source: Ministry of Economy, Trade and Industry current survey of production)
Figure 2: Raw material consumption(the amount of newly produced rubber)
Figure 3: The sales amount
Figure 4: Changes in the raw material consumption (the amount of newly produced rubber) and the sales amount of the tyre industry of Japan
250×103 tons(19.9%)
Non-tyre:
1,020×103 tons(80.1%)
Tyre:
1,033.1×109 yen(47.5%)
Non-tyre:
1,140.6×109 yen(52.5%)
Tyre:
Total : 2,173.7×109 yen
Total :1.27×10⁶ tons
The Japanese Tyre Industry Today
Source: Ministry of Economy, Trade and Industry current survey of production
Source: Ministry of Economy, Trade and Industry current survey of production
The proportion of tyre production in the rubber product industry in 2016 (excluding cart tyres, tubes and flaps)
140
130
120
110
100
90
80
70
60
50
40
30
20
10
0
14,000
12,000
10,000
8,000
6,000
4,000
2,000
0
Rubber consumption (tons×104) Value (yen×108)
Tyre : Value
2010 2011 2015 2016201420132012200920082007
Non-tyre : Rubber consumption
Non-tyre : Value
Tyre : Rubber consumption
7
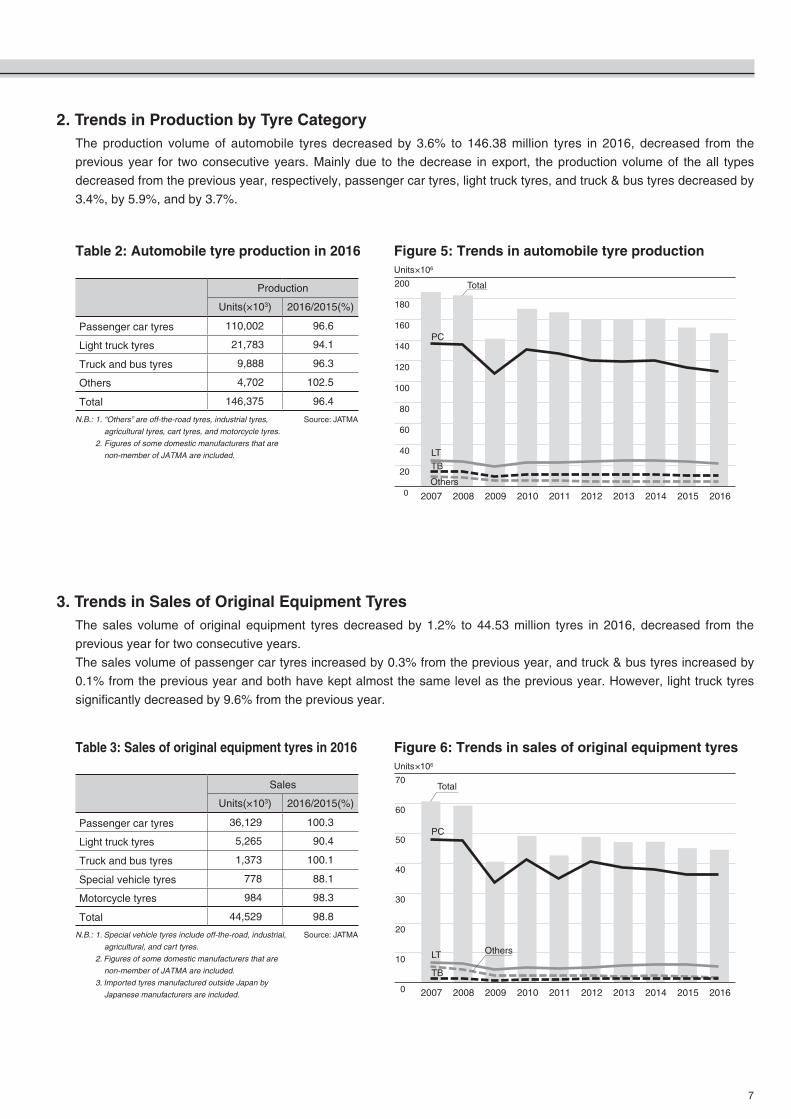
2. Trends in Production by Tyre CategoryThe production volume of automobile tyres decreased by 3.6% to 146.38 million tyres in 2016, decreased from the
previous year for two consecutive years. Mainly due to the decrease in export, the production volume of the all types
decreased from the previous year, respectively, passenger car tyres, light truck tyres, and truck & bus tyres decreased by
3.4%, by 5.9%, and by 3.7%.
3. Trends in Sales of Original Equipment TyresThe sales volume of original equipment tyres decreased by 1.2% to 44.53 million tyres in 2016, decreased from the
previous year for two consecutive years.
The sales volume of passenger car tyres increased by 0.3% from the previous year, and truck & bus tyres increased by
0.1% from the previous year and both have kept almost the same level as the previous year. However, light truck tyres
significantly decreased by 9.6% from the previous year.
Table 2: Automobile tyre production in 2016 Figure 5: Trends in automobile tyre production
Table 3: Sales of original equipment tyres in 2016 Figure 6: Trends in sales of original equipment tyres
Production
Units(×103) 2016/2015(%)
Passenger car tyres 110,002 96.6
Light truck tyres 21,783 94.1
Truck and bus tyres 9,888 96.3
Others 4,702 102.5
Total 146,375 96.4
N.B.: 1. “Others” are off-the-road tyres, industrial tyres, Source: JATMA
agricultural tyres, cart tyres, and motorcycle tyres.
2. Figures of some domestic manufacturers that are
non-member of JATMA are included.
Sales
Units(×103) 2016/2015(%)
Passenger car tyres 36,129 100.3
Light truck tyres 5,265 90.4
Truck and bus tyres 1,373 100.1
Special vehicle tyres 778 88.1
Motorcycle tyres 984 98.3
Total 44,529 98.8
N.B.: 1. Special vehicle tyres include off-the-road, industrial, Source: JATMA
agricultural, and cart tyres.
2. Figures of some domestic manufacturers that are
non-member of JATMA are included.
3. Imported tyres manufactured outside Japan by
Japanese manufacturers are included.
0
20
40
60
80
100
120
140
160
180
200
Units×106
2010 2011 2015 2016201420132012200920082007
Total
PC
LTTB
Others
Units×106
0
10
20
30
40
50
60
70
2007 201020092008 2011 2015 2016201420132012
Total
PC
LT
TB
Others
8
II. The Japanese Tyre Industry Today
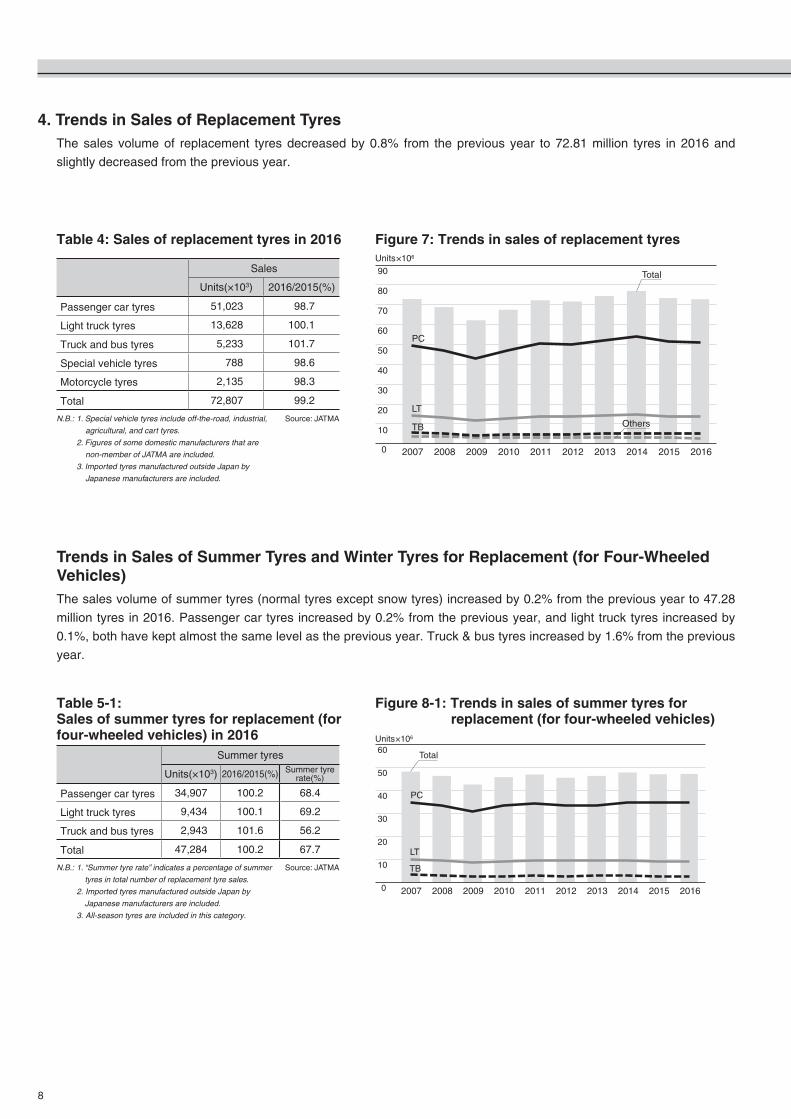
4. Trends in Sales of Replacement TyresThe sales volume of replacement tyres decreased by 0.8% from the previous year to 72.81 million tyres in 2016 and
slightly decreased from the previous year.
Trends in Sales of Summer Tyres and Winter Tyres for Replacement (for Four-Wheeled Vehicles)The sales volume of summer tyres (normal tyres except snow tyres) increased by 0.2% from the previous year to 47.28
million tyres in 2016. Passenger car tyres increased by 0.2% from the previous year, and light truck tyres increased by
0.1%, both have kept almost the same level as the previous year. Truck & bus tyres increased by 1.6% from the previous
year.
Table 4: Sales of replacement tyres in 2016
Table 5-1:Sales of summer tyres for replacement (for four-wheeled vehicles) in 2016
Figure 7: Trends in sales of replacement tyres
Figure 8-1: Trends in sales of summer tyres for replacement (for four-wheeled vehicles)
Sales
Units(×103) 2016/2015(%)
Passenger car tyres 51,023 98.7
Light truck tyres 13,628 100.1
Truck and bus tyres 5,233 101.7
Special vehicle tyres 788 98.6
Motorcycle tyres 2,135 98.3
Total 72,807 99.2
N.B.: 1. Special vehicle tyres include off-the-road, industrial, Source: JATMA
agricultural, and cart tyres.
2. Figures of some domestic manufacturers that are
non-member of JATMA are included.
3. Imported tyres manufactured outside Japan by
Japanese manufacturers are included.
Summer tyres
Units(×103) 2016/2015(%) Summer tyre rate(%)
Passenger car tyres 34,907 100.2 68.4
Light truck tyres 9,434 100.1 69.2
Truck and bus tyres 2,943 101.6 56.2
Total 47,284 100.2 67.7
N.B.: 1. “Summer tyre rate” indicates a percentage of summer
tyres in total number of replacement tyre sales.
2. Imported tyres manufactured outside Japan by
Japanese manufacturers are included.
3. All-season tyres are included in this category.
Source: JATMA
0
10
20
30
40
50
60
70
80
90Units×106
2010200920082007 2011 2015 2016201420132012
Total
PC
LT
TB Others
0
10
20
30
40
50
60Units×106
20082007 2011 2014 2015 20162013201220102009
Total
PC
LT
TB
9
II. The Japanese Tyre Industry Today
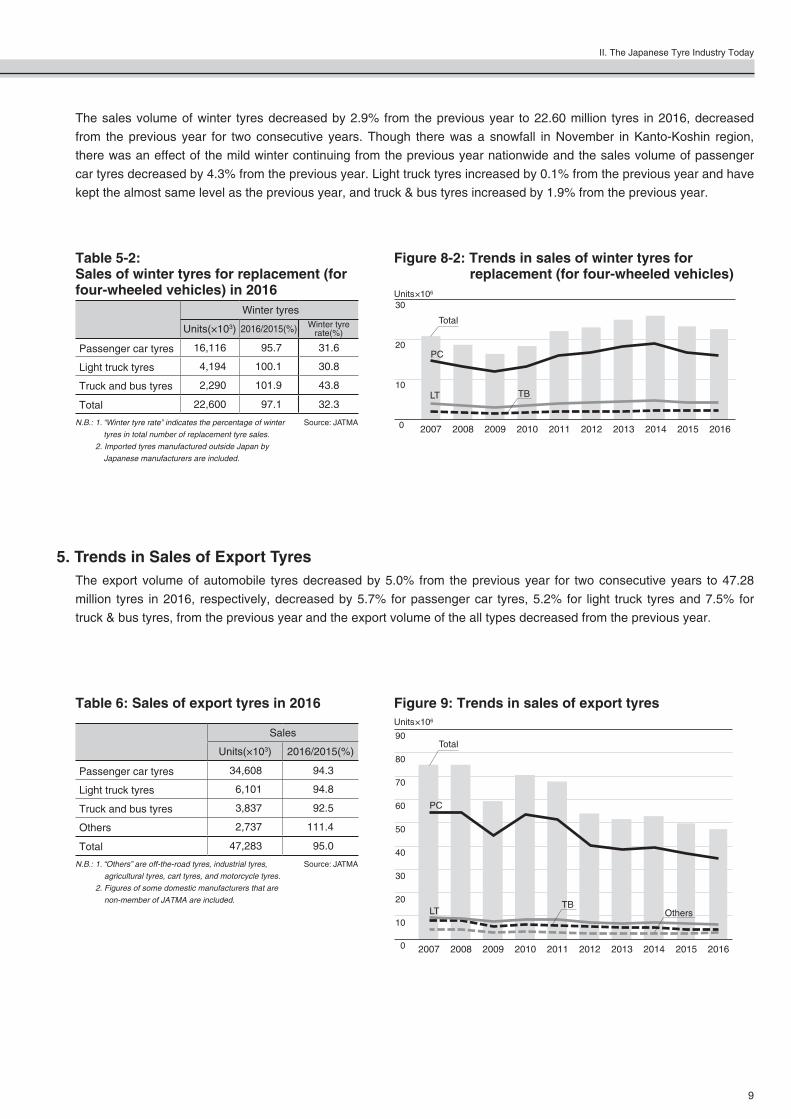
The sales volume of winter tyres decreased by 2.9% from the previous year to 22.60 million tyres in 2016, decreased
from the previous year for two consecutive years. Though there was a snowfall in November in Kanto-Koshin region,
there was an effect of the mild winter continuing from the previous year nationwide and the sales volume of passenger
car tyres decreased by 4.3% from the previous year. Light truck tyres increased by 0.1% from the previous year and have
kept the almost same level as the previous year, and truck & bus tyres increased by 1.9% from the previous year.
5. Trends in Sales of Export TyresThe export volume of automobile tyres decreased by 5.0% from the previous year for two consecutive years to 47.28
million tyres in 2016, respectively, decreased by 5.7% for passenger car tyres, 5.2% for light truck tyres and 7.5% for
truck & bus tyres, from the previous year and the export volume of the all types decreased from the previous year.
Table 6: Sales of export tyres in 2016 Figure 9: Trends in sales of export tyres
Sales
Units(×103) 2016/2015(%)
Passenger car tyres 34,608 94.3
Light truck tyres 6,101 94.8
Truck and bus tyres 3,837 92.5
Others 2,737 111.4
Total 47,283 95.0
N.B.: 1. “Others” are off-the-road tyres, industrial tyres, Source: JATMA
agricultural tyres, cart tyres, and motorcycle tyres.
2. Figures of some domestic manufacturers that are
non-member of JATMA are included.
Table 5-2:Sales of winter tyres for replacement (for four-wheeled vehicles) in 2016
Figure 8-2: Trends in sales of winter tyres for replacement (for four-wheeled vehicles)
Winter tyres
Units(×103) 2016/2015(%) Winter tyre rate(%)
Passenger car tyres 16,116 95.7 31.6
Light truck tyres 4,194 100.1 30.8
Truck and bus tyres 2,290 101.9 43.8
Total 22,600 97.1 32.3
N.B.: 1. “Winter tyre rate” indicates the percentage of winter
tyres in total number of replacement tyre sales.
2. Imported tyres manufactured outside Japan by
Japanese manufacturers are included.
Source: JATMA 0
10
20
30Units×106
20082007 20102009 2011 2014 2015 201620132012
Total
PC
LT TB
0
90
80
70
60
50
40
30
20
10
Units×106
2011 2012 2015 2016201420132010200920082007
Total
PC
LTTB
Others
10
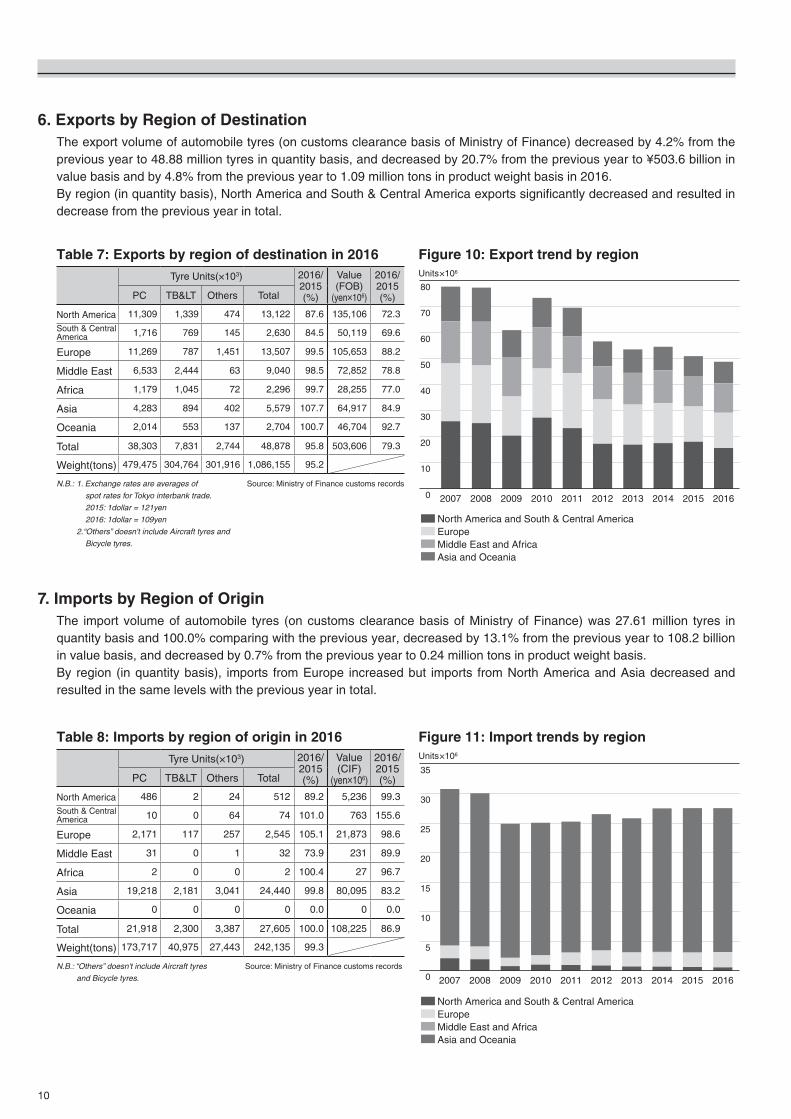
6. Exports by Region of DestinationThe export volume of automobile tyres (on customs clearance basis of Ministry of Finance) decreased by 4.2% from the previous year to 48.88 million tyres in quantity basis, and decreased by 20.7% from the previous year to ¥503.6 billion in value basis and by 4.8% from the previous year to 1.09 million tons in product weight basis in 2016.By region (in quantity basis), North America and South & Central America exports significantly decreased and resulted in decrease from the previous year in total.
Table 7: Exports by region of destination in 2016 Figure 10: Export trend by region
7. Imports by Region of OriginThe import volume of automobile tyres (on customs clearance basis of Ministry of Finance) was 27.61 million tyres in quantity basis and 100.0% comparing with the previous year, decreased by 13.1% from the previous year to 108.2 billion in value basis, and decreased by 0.7% from the previous year to 0.24 million tons in product weight basis.By region (in quantity basis), imports from Europe increased but imports from North America and Asia decreased and resulted in the same levels with the previous year in total.
Table 8: Imports by region of origin in 2016 Figure 11: Import trends by region
Tyre Units(×103) 2016/2015(%)
Value(FOB)
(yen×106)
2016/2015(%)PC TB< Others Total
North America 11,309 1,339 474 13,122 87.6 135,106 72.3
South & CentralAmerica 1,716 769 145 2,630 84.5 50,119 69.6
Europe 11,269 787 1,451 13,507 99.5 105,653 88.2
Middle East 6,533 2,444 63 9,040 98.5 72,852 78.8
Africa 1,179 1,045 72 2,296 99.7 28,255 77.0
Asia 4,283 894 402 5,579 107.7 64,917 84.9
Oceania 2,014 553 137 2,704 100.7 46,704 92.7
Total 38,303 7,831 2,744 48,878 95.8 503,606 79.3
Weight(tons) 479,475 304,764 301,916 1,086,155 95.2
N.B.: 1. Exchange rates are averages of
spot rates for Tokyo interbank trade.
2015: 1dollar = 121yen
2016: 1dollar = 109yen
2.“Others” doesn't include Aircraft tyres and
Bicycle tyres.
Source: Ministry of Finance customs records
Tyre Units(×103) 2016/2015(%)
Value(CIF)
(yen×106)
2016/2015(%)PC TB< Others Total
North America 486 2 24 512 89.2 5,236 99.3South & CentralAmerica 10 0 64 74 101.0 763 155.6
Europe 2,171 117 257 2,545 105.1 21,873 98.6
Middle East 31 0 1 32 73.9 231 89.9
Africa 2 0 0 2 100.4 27 96.7
Asia 19,218 2,181 3,041 24,440 99.8 80,095 83.2
Oceania 0 0 0 0 0.0 0 0.0
Total 21,918 2,300 3,387 27,605 100.0 108,225 86.9
Weight(tons) 173,717 40,975 27,443 242,135 99.3
N.B.: “Others” doesn't include Aircraft tyres
and Bicycle tyres.
Source: Ministry of Finance customs records
0
80
70
60
50
40
30
20
10
Units×106
North America and South & Central AmericaEuropeMiddle East and AfricaAsia and Oceania
2010 201320122011200920082007 2015 20162014
0
35
30
25
20
15
10
5
Units×106
North America and South & Central AmericaEuropeMiddle East and AfricaAsia and Oceania
2007 2010 2011 2012 2015 2016201420132008 2009

11
Ⅲ Measures for Tyre Safety
1. Safety Standards for Automobile TyresVarious standards have been specified regarding tyres from the viewpoint of automobile safety because tyres are
automobile’s important parts.
Each Individual state has its own legislation specifying the standards and the tyres are requested to satisfy the standards
of the state where the tyres are to be used. In Japan we have the Safety Regulations for Road Vehicles and their detailed
items, enacted by the Ministry of Land, Infrastructure, Transport and Tourism.
In addition to these regulations, the guidelines for the items to be complied in usage and maintenance of automobile tyres
are specified in “Standards for Selection, Usage and Maintenance of Automobile Tyres” by JATMA to ensure and
enlighten the tyre safety.
2. Tyre StandardsBesides the safety standards, standards for specifications of automobile tyres, rims and valves are set by the Tyre
Standards Committee which comprises representatives from tyre manufacturers and vehicle manufacturers, and
government ministries concerned and published in book form as JATMA YEAR BOOK annually by JATMA. JATMA YEAR
BOOK is designed to promote standardization, simplification, and unification of tyre use within Japan, and is contributing
to rationalization of production and use of fair tyres while ensuring the interchangeability.
The JATMA standards are quoted in the Federal Motor Vehicle Safety Standards and Regulations of U.S., applied to
tyres exporting to Canada, Australia and so on; and recognized as one of authoritative guidelines such as the ETRTO
standards of Europe and TRA standards of US.
The JATMA standards cover the following tyre categories:
- passenger car tyres,
- light truck tyres,
- truck and bus tyres,
- off-road vehicle tyres,
- agricultural equipment tyres,
- industrial vehicle tyres, and
- motorcycle tyres.
12
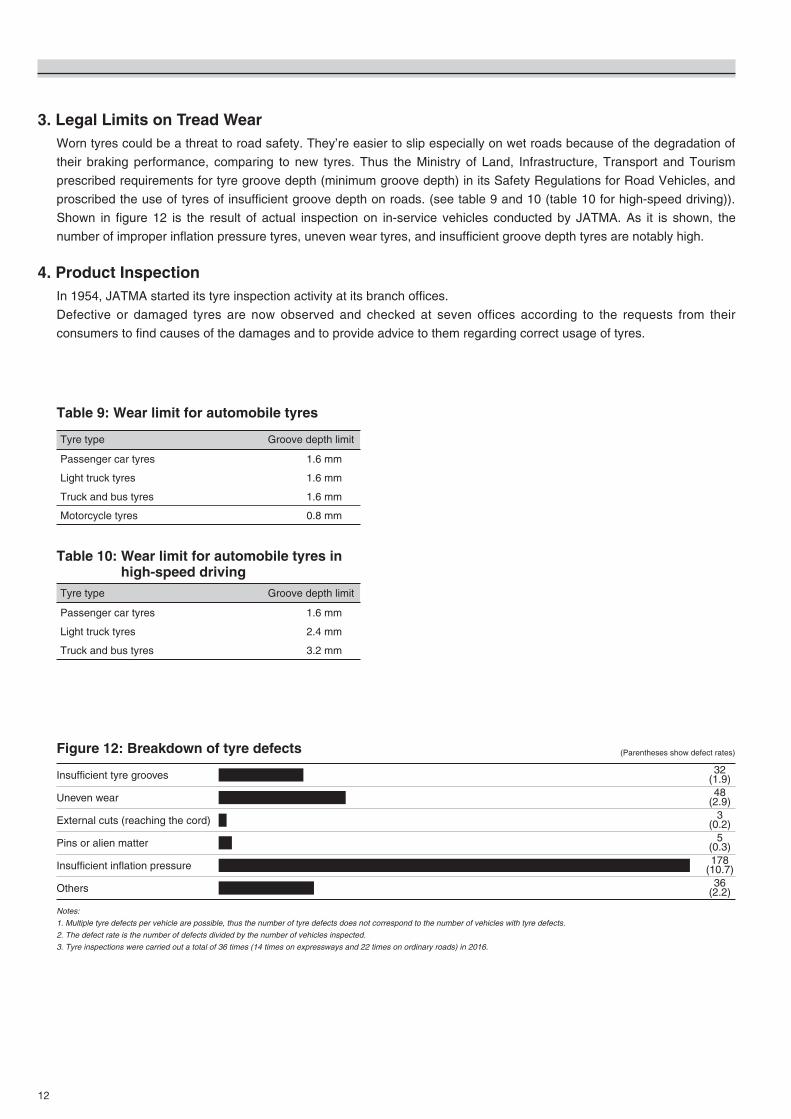
3. Legal Limits on Tread WearWorn tyres could be a threat to road safety. They’re easier to slip especially on wet roads because of the degradation of
their braking performance, comparing to new tyres. Thus the Ministry of Land, Infrastructure, Transport and Tourism
prescribed requirements for tyre groove depth (minimum groove depth) in its Safety Regulations for Road Vehicles, and
proscribed the use of tyres of insufficient groove depth on roads. (see table 9 and 10 (table 10 for high-speed driving)).
Shown in figure 12 is the result of actual inspection on in-service vehicles conducted by JATMA. As it is shown, the
number of improper inflation pressure tyres, uneven wear tyres, and insufficient groove depth tyres are notably high.
4. Product InspectionIn 1954, JATMA started its tyre inspection activity at its branch offices.
Defective or damaged tyres are now observed and checked at seven offices according to the requests from their
consumers to find causes of the damages and to provide advice to them regarding correct usage of tyres.
Table 9: Wear limit for automobile tyres
Tyre type Groove depth limit
Passenger car tyres 1.6 mm
Light truck tyres 1.6 mm
Truck and bus tyres 1.6 mm
Motorcycle tyres 0.8 mm
Table 10: Wear limit for automobile tyres in high-speed driving
Tyre type Groove depth limit
Passenger car tyres 1.6 mm
Light truck tyres 2.4 mm
Truck and bus tyres 3.2 mm
Figure 12: Breakdown of tyre defects (Parentheses show defect rates)
Notes:
1. Multiple tyre defects per vehicle are possible, thus the number of tyre defects does not correspond to the number of vehicles with tyre defects.
2. The defect rate is the number of defects divided by the number of vehicles inspected.
3. Tyre inspections were carried out a total of 36 times (14 times on expressways and 22 times on ordinary roads) in 2016.
Insufficient tyre grooves
Uneven wear
External cuts (reaching the cord)
Pins or alien matter
Insufficient inflation pressure
Others
32(1.9)48
(2.9)3
(0.2)5
(0.3)178
(10.7)36
(2.2)
13
Ⅳ Consideration for Environment
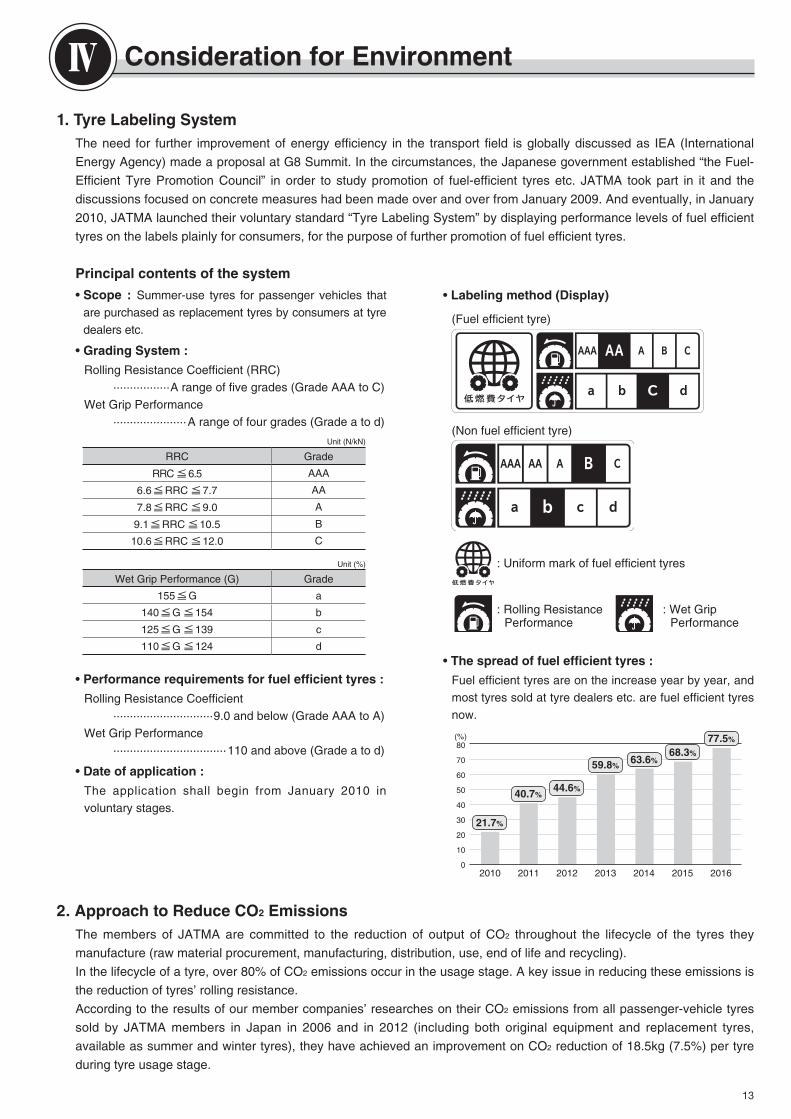
1. Tyre Labeling SystemThe need for further improvement of energy efficiency in the transport field is globally discussed as IEA (International
Energy Agency) made a proposal at G8 Summit. In the circumstances, the Japanese government established “the Fuel-
Efficient Tyre Promotion Council” in order to study promotion of fuel-efficient tyres etc. JATMA took part in it and the
discussions focused on concrete measures had been made over and over from January 2009. And eventually, in January
2010, JATMA launched their voluntary standard “Tyre Labeling System” by displaying performance levels of fuel efficient
tyres on the labels plainly for consumers, for the purpose of further promotion of fuel efficient tyres.
2. Approach to Reduce CO2 EmissionsThe members of JATMA are committed to the reduction of output of CO2 throughout the lifecycle of the tyres they
manufacture (raw material procurement, manufacturing, distribution, use, end of life and recycling).
In the lifecycle of a tyre, over 80% of CO2 emissions occur in the usage stage. A key issue in reducing these emissions is
the reduction of tyres’ rolling resistance.
According to the results of our member companies’ researches on their CO2 emissions from all passenger-vehicle tyres
sold by JATMA members in Japan in 2006 and in 2012 (including both original equipment and replacement tyres,
available as summer and winter tyres), they have achieved an improvement on CO2 reduction of 18.5kg (7.5%) per tyre
during tyre usage stage.
Principal contents of the system
• Scope : Summer-use tyres for passenger vehicles that are purchased as replacement tyres by consumers at tyre dealers etc.
• Grading System :
Rolling Resistance Coefficient (RRC) .................A range of five grades (Grade AAA to C)Wet Grip Performance ......................A range of four grades (Grade a to d)
Unit (N/kN)
RRC Grade
RRC≦6.5 AAA
6.6≦RRC≦7.7 AA
7.8≦RRC≦9.0 A
9.1≦RRC≦10.5 B
10.6≦RRC≦12.0 C
Unit (%)
Wet Grip Performance (G) Grade
155≦G a
140≦G≦154 b
125≦G≦139 c
110≦G≦124 d
• Performance requirements for fuel efficient tyres :
Rolling Resistance Coefficient ..............................9.0 and below (Grade AAA to A)Wet Grip Performance ..................................110 and above (Grade a to d)
• Date of application :
The application shall begin from January 2010 in voluntary stages.
• Labeling method (Display)
(Fuel efficient tyre)
(Non fuel efficient tyre)
: Uniform mark of fuel efficient tyres
: Rolling ResistancePerformance
: Wet GripPerformance
• The spread of fuel efficient tyres :
Fuel efficient tyres are on the increase year by year, and most tyres sold at tyre dealers etc. are fuel efficient tyres now.
80
70
60
50
40
30
20
10
02010 2011 2012 2013 2014 2015 2016
(%)
21.7%
40.7%44.6%
59.8%63.6%
68.3%
77.5%
14
IV. Consideration for Environment
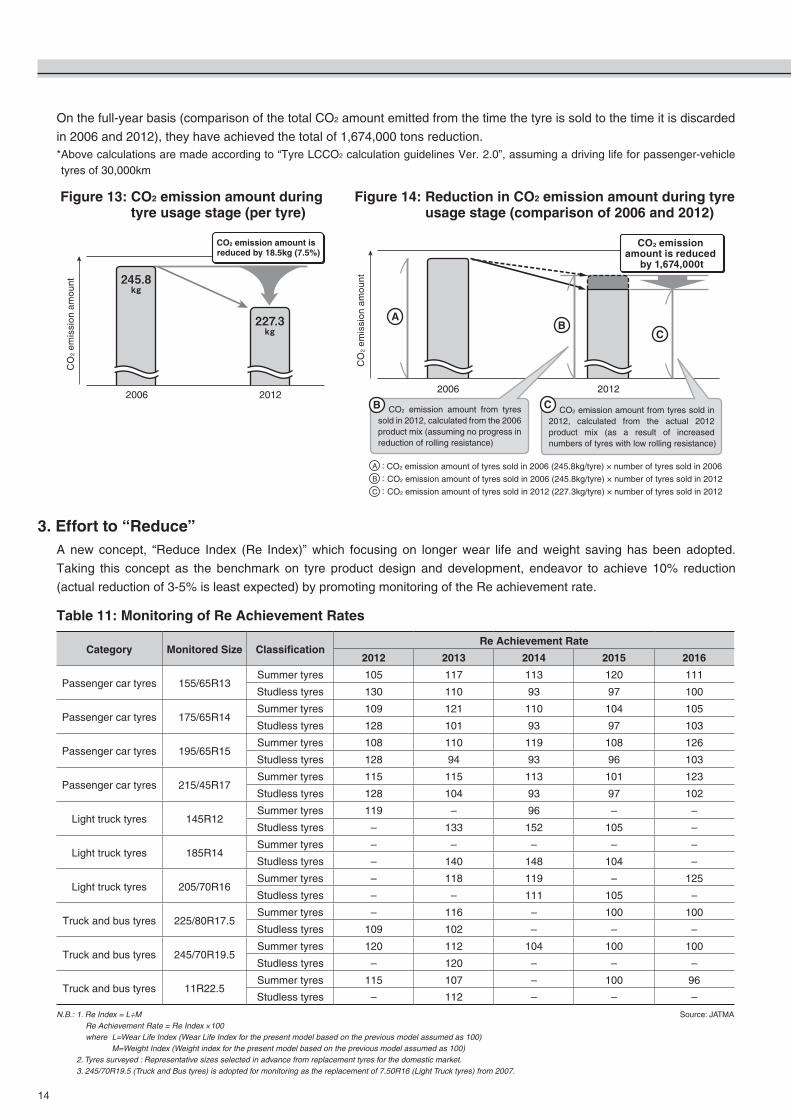
3. Effort to “Reduce”A new concept, “Reduce Index (Re Index)” which focusing on longer wear life and weight saving has been adopted.
Taking this concept as the benchmark on tyre product design and development, endeavor to achieve 10% reduction
(actual reduction of 3-5% is least expected) by promoting monitoring of the Re achievement rate.
Table 11: Monitoring of Re Achievement Rates
Category Monitored Size ClassificationRe Achievement Rate
2012 2013 2014 2015 2016
Passenger car tyres 155/65R13Summer tyres 105 117 113 120 111
Studless tyres 130 110 93 97 100
Passenger car tyres 175/65R14Summer tyres 109 121 110 104 105
Studless tyres 128 101 93 97 103
Passenger car tyres 195/65R15Summer tyres 108 110 119 108 126
Studless tyres 128 94 93 96 103
Passenger car tyres 215/45R17Summer tyres 115 115 113 101 123
Studless tyres 128 104 93 97 102
Light truck tyres 145R12Summer tyres 119 – 96 – –
Studless tyres – 133 152 105 –
Light truck tyres 185R14Summer tyres – – – – –
Studless tyres – 140 148 104 –
Light truck tyres 205/70R16Summer tyres – 118 119 – 125
Studless tyres – – 111 105 –
Truck and bus tyres 225/80R17.5Summer tyres – 116 – 100 100
Studless tyres 109 102 – – –
Truck and bus tyres 245/70R19.5Summer tyres 120 112 104 100 100
Studless tyres – 120 – – –
Truck and bus tyres 11R22.5Summer tyres 115 107 – 100 96
Studless tyres – 112 – – –
N.B.: 1. Re Index = L÷M Re Achievement Rate = Re Index ×100 where L=Wear Life Index (Wear Life Index for the present model based on the previous model assumed as 100) M=Weight Index (Weight index for the present model based on the previous model assumed as 100) 2. Tyres surveyed : Representative sizes selected in advance from replacement tyres for the domestic market. 3. 245/70R19.5 (Truck and Bus tyres) is adopted for monitoring as the replacement of 7.50R16 (Light Truck tyres) from 2007.
Source: JATMA
2006 2012
CO
2 em
issi
on a
mou
nt
227.3kg
CO2 emission amount is reduced by 18.5kg (7.5%)
245.8kg
2006 2012
CO
2 em
issi
on a
mou
nt
A
CB
: CO2 emission amount of tyres sold in 2006 (245.8kg/tyre) × number of tyres sold in 2006
: CO2 emission amount of tyres sold in 2006 (245.8kg/tyre) × number of tyres sold in 2012
: CO2 emission amount of tyres sold in 2012 (227.3kg/tyre) × number of tyres sold in 2012
A
B
C
CO2 emission amount is reduced
by 1,674,000t
CO2 emission amount from tyres sold in 2012, calculated from the actual 2012 product mix (as a result of increased numbers of tyres with low rolling resistance)
CCO2 emission amount from tyres sold in 2012, calculated from the 2006 product mix (assuming no progress in reduction of rolling resistance)
B
On the full-year basis (comparison of the total CO2 amount emitted from the time the tyre is sold to the time it is discarded
in 2006 and 2012), they have achieved the total of 1,674,000 tons reduction.* Above calculations are made according to “Tyre LCCO2 calculation guidelines Ver. 2.0”, assuming a driving life for passenger-vehicle tyres of 30,000km
Figure 13: CO2 emission amount during tyre usage stage (per tyre)
Figure 14: Reduction in CO2 emission amount during tyre usage stage (comparison of 2006 and 2012)
15
IV. Consideration for Environment
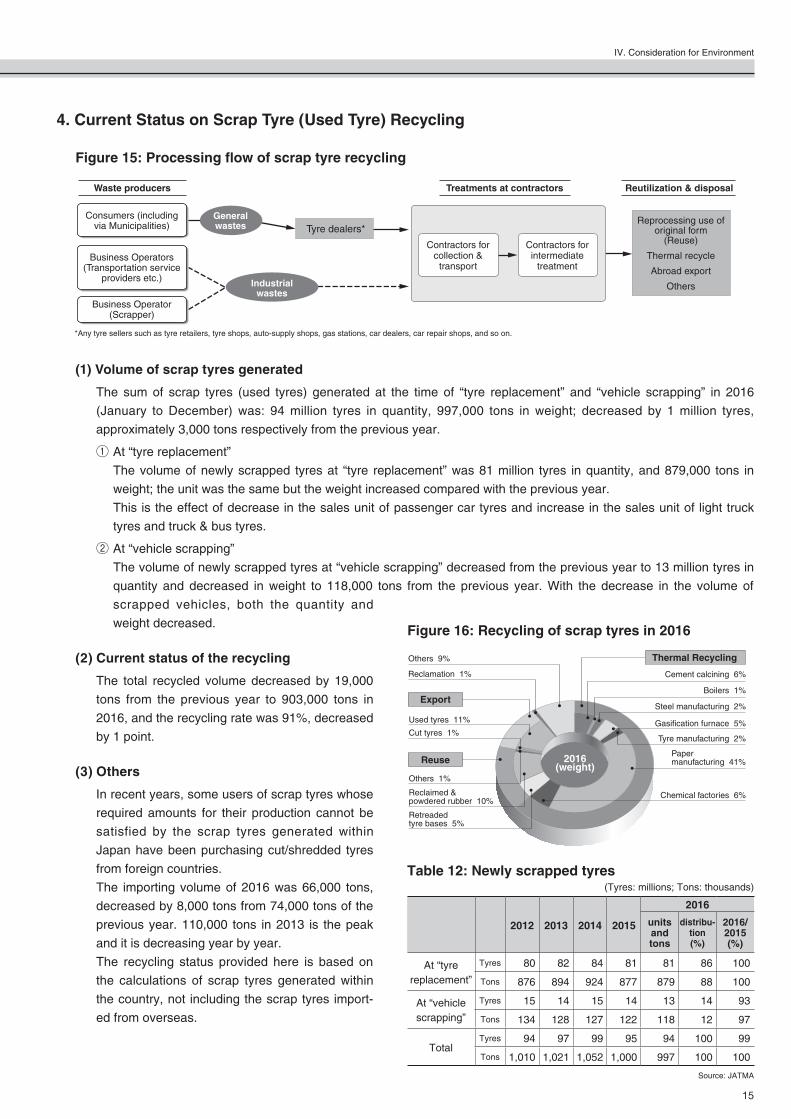
(1) Volume of scrap tyres generated
The sum of scrap tyres (used tyres) generated at the time of “tyre replacement” and “vehicle scrapping” in 2016
(January to December) was: 94 million tyres in quantity, 997,000 tons in weight; decreased by 1 million tyres,
approximately 3,000 tons respectively from the previous year.
① At “tyre replacement”
The volume of newly scrapped tyres at “tyre replacement” was 81 million tyres in quantity, and 879,000 tons in
weight; the unit was the same but the weight increased compared with the previous year.
This is the effect of decrease in the sales unit of passenger car tyres and increase in the sales unit of light truck
tyres and truck & bus tyres.
② At “vehicle scrapping”
The volume of newly scrapped tyres at “vehicle scrapping” decreased from the previous year to 13 million tyres in
quantity and decreased in weight to 118,000 tons from the previous year. With the decrease in the volume of
scrapped vehicles, both the quantity and
weight decreased.
(2) Current status of the recycling
The total recycled volume decreased by 19,000
tons from the previous year to 903,000 tons in
2016, and the recycling rate was 91%, decreased
by 1 point.
(3) Others
In recent years, some users of scrap tyres whose
required amounts for their production cannot be
satisfied by the scrap tyres generated within
Japan have been purchasing cut/shredded tyres
from foreign countries.
The importing volume of 2016 was 66,000 tons,
decreased by 8,000 tons from 74,000 tons of the
previous year. 110,000 tons in 2013 is the peak
and it is decreasing year by year.
The recycling status provided here is based on
the calculations of scrap tyres generated within
the country, not including the scrap tyres import-
ed from overseas.
Figure 16: Recycling of scrap tyres in 2016
Table 12: Newly scrapped tyres (Tyres: millions; Tons: thousands)
2012 2013 2014 2015
2016
unitsand tons
distribu-tion(%)
2016/2015(%)
At “tyre replacement”
Tyres 80 82 84 81 81 86 100
Tons 876 894 924 877 879 88 100
At “vehicle scrapping”
Tyres 15 14 15 14 13 14 93
Tons 134 128 127 122 118 12 97
TotalTyres 94 97 99 95 94 100 99
Tons 1,010 1,021 1,052 1,000 997 100 100
Source: JATMA
4. Current Status on Scrap Tyre (Used Tyre) Recycling
Figure 15: Processing flow of scrap tyre recycling
2016(weight)
Reclamation 1%
Chemical factories 6%Reclaimed & powdered rubber 10%
Reuse
Retreaded tyre bases 5%
Others 1%
Thermal Recycling
Boilers 1%
Cement calcining 6%
Gasification furnace 5%
Steel manufacturing 2%
Tyre manufacturing 2%
Papermanufacturing 41%
Export
Used tyres 11%
Cut tyres 1%
Others 9%
Tyre dealers*
Waste producers Treatments at contractors Reutilization & disposal
Consumers (including via Municipalities)
Business Operators (Transportation service
providers etc.)
Business Operator (Scrapper)
General wastes
Contractors for collection &
transport
Contractors for intermediate
treatment
Reprocessing use of original form
(Reuse)
Thermal recycle
Abroad export
OthersIndustrial wastes
*Any tyre sellers such as tyre retailers, tyre shops, auto-supply shops, gas stations, car dealers, car repair shops, and so on.

16
(Tons: thousands)
2012 2013 2014 2015 2016tons tons tons tons tons distribution(%) 2016/2015(%)
Kin
d of
rec
yclin
g
Dom
estic
Reu
se
Retreaded tyre bases 57 59 59 56 53 5 95Reclaimed & powdered rubber 91 100 106 105 104 10 99
Others 2 2 3 3 5 1 167
Subtotal (A) 150 161 168 164 162 16 99
The
rmal
Rec
yclin
g
Paper manufacturing 363 372 415 439 407 41 93
Chemical factories 37 40 46 51 58 6 114
Cement calcining 66 62 53 59 63 6 107
Steel manufacturing 30 27 27 20 19 2 95
Gasification furnace 45 44 50 49 51 5 104
Tyre manufacturing 27 27 22 23 23 2 100
Boilers 6 6 2 2 5 1 250
Subtotal (B) 574 578 615 643 626 63 97
Abr
oad
Exp
ort Used tyres 151 153 130 108 108 11 100
Cut tyres 8 7 8 7 7 1 100
Subtotal (C) 158 160 138 115 115 12 100
Total recycling (A+B+C) 882 899 921 922 903 91 98
Reclamation 2 2 1 1 1 1 100
Others 126 120 130 77 93 9 121
Subtotal (D) 128 122 131 78 94 9 121Total scrap tyres (A+B+C+D) 1,010 1,021 1,052 1,000 997 100 100
N.B.: There can be some cases that distribution’s subtotals and the sums of their constituent items don’t match due to the handling of decimals. Source: JATMA
Table 13: Recycled tyres
5. Situation in Illegal Piling & Dumping of Scrap TyresAs of February 2017 the total number of cases of illegal piling & dumping of scrap tyres was 91, and the total weight of
scrap tyres was 35,741 tons. Comparing to the statistical research of February last year, the number of cases decreased
by 1 and the total weight increased by 13 tons.
“Newly found cases” are cases additionally reported from municipalities and so on, not newly occurred cases.
The demand for scrap tyre as an alternative fuel is still high, thus illegal piling & dumping tends to be decreasing.
The total of 4 removal operations have been carried out last year. Among them, 1 removal operation has used the
support program for dumping site restoration of JATMA.
6. Support Program for Dumping Site Restoration by JATMAThe tyre industry established the support program for dumping site restoration in 2005 and has been operating it in order
to reduce illegal piling and dumping of scrap tyres.
In the total of twelve years, from 2005 to 2016, for 22 cases, JATMA supported 362.13 million yen and removed
2,966,396 units/29,867 tons of scrap tyres.
In 2017, this support is continued.
Note: Please refer to the following Uniform Resource Locator for details.
http://www.jatma.or.jp/english/tyrerecycling/report03.html
17
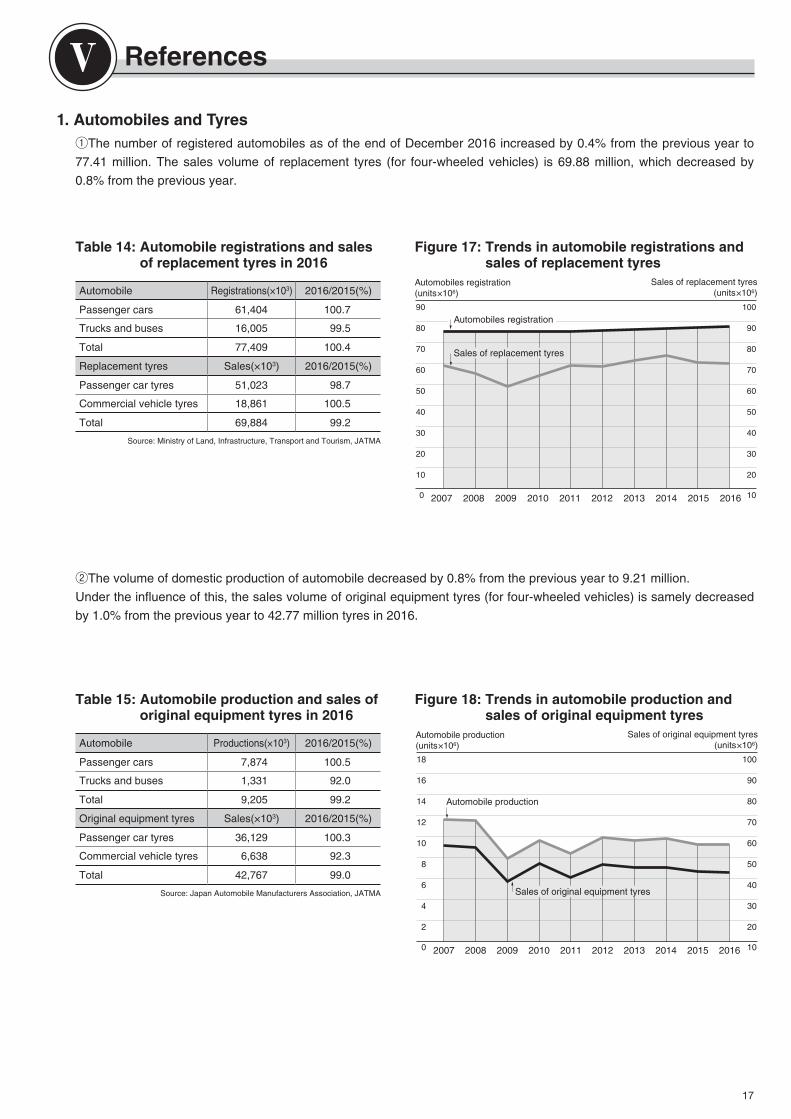
1. Automobiles and Tyres①The number of registered automobiles as of the end of December 2016 increased by 0.4% from the previous year to
77.41 million. The sales volume of replacement tyres (for four-wheeled vehicles) is 69.88 million, which decreased by
0.8% from the previous year.
②The volume of domestic production of automobile decreased by 0.8% from the previous year to 9.21 million.
Under the influence of this, the sales volume of original equipment tyres (for four-wheeled vehicles) is samely decreased
by 1.0% from the previous year to 42.77 million tyres in 2016.
Table 14: Automobile registrations and sales of replacement tyres in 2016
Figure 17: Trends in automobile registrations and sales of replacement tyres
Table 15: Automobile production and sales of original equipment tyres in 2016
Figure 18: Trends in automobile production and sales of original equipment tyres
Ⅴ References
Automobile Registrations(×103) 2016/2015(%)
Passenger cars 61,404 100.7
Trucks and buses 16,005 99.5
Total 77,409 100.4
Replacement tyres Sales(×103) 2016/2015(%)
Passenger car tyres 51,023 98.7
Commercial vehicle tyres 18,861 100.5
Total 69,884 99.2
Source: Ministry of Land, Infrastructure, Transport and Tourism, JATMA
Automobile Productions(×103) 2016/2015(%)
Passenger cars 7,874 100.5
Trucks and buses 1,331 92.0
Total 9,205 99.2
Original equipment tyres Sales(×103) 2016/2015(%)
Passenger car tyres 36,129 100.3
Commercial vehicle tyres 6,638 92.3
Total 42,767 99.0
Source: Japan Automobile Manufacturers Association, JATMA
0 10
10
20
30
40
50
60
70
80
90
2007 201620152014201320122011201020092008
20
30
40
50
60
70
80
90
100
Automobiles registration(units×106)
Sales of replacement tyres(units×106)
Sales of replacement tyres
Automobiles registration
Automobile production(units×106)
Sales of original equipment tyres(units×106)
0 2007 2010 2015 2016201420132012201120092008 10
20
30
40
50
60
70
80
90
100
2
4
6
8
10
12
14
16
18
Sales of original equipment tyres
Automobile production

18
2. Distribution ChannelsThe distribution of automobile tyres is divided into three channels: original equipment, replacement and exports. The
channel for replacement is particularly wide-ranging with distributors as key stations as shown in Figure 19. The routes
for the channels are roughly divided into two types: direct sales and indirect sales. Direct sales are those under which
distributors sell tyres directly to some large users, such as transport, bus and taxi companies, and government and
municipal users. Indirect sales are those under which tyre dealers supply tyres to end users. About 90 distributors and
approximately about 110,000 tyre dealers supply replacement tyres. In addition, the component ratio (quantity) of sales
for each channel in 2016 is 27.1% for original equipment, 44.2% for replacements and 28.7% for exports.
Figure 19: Distribution channels
V. References
Tyre Manufacturers
Original Equipment
Replacement Distributors
Export Direct Export
Trading Companies
Tyre Specialty Shops
Car Dealers
Service Stations
Car Repair Shops
Automobile Parts Retailers
Others
Large Users
Business Users
Private UsersTyre
Dea
lers
Aut
omob
ileM
anuf
actu
rers
Cars for Export
Cars forDomestic Use
approx. 90 distributors
approx. 110,000 dealers
Figure 20: Trends in sales share of automobile tyres (based on unit)
2013201220112010200920082007
20
0
40
60
80
100%
29.1%
34.9%
29.2%
33.9%
Originalequipment
Export
Replace-ment
25.0%
38.4%
36.6%36.0% 36.9%
26.3%
36.0%
37.7%
27.9%
41.1%
31.0%
27.2%
42.9%
29.9%
23.3%
39.6%
37.1%
2014 2015 2016
26.6%
43.4%
30.0%
26.8%
43.6%
29.6%
27.1%
44.2%
28.7%
19
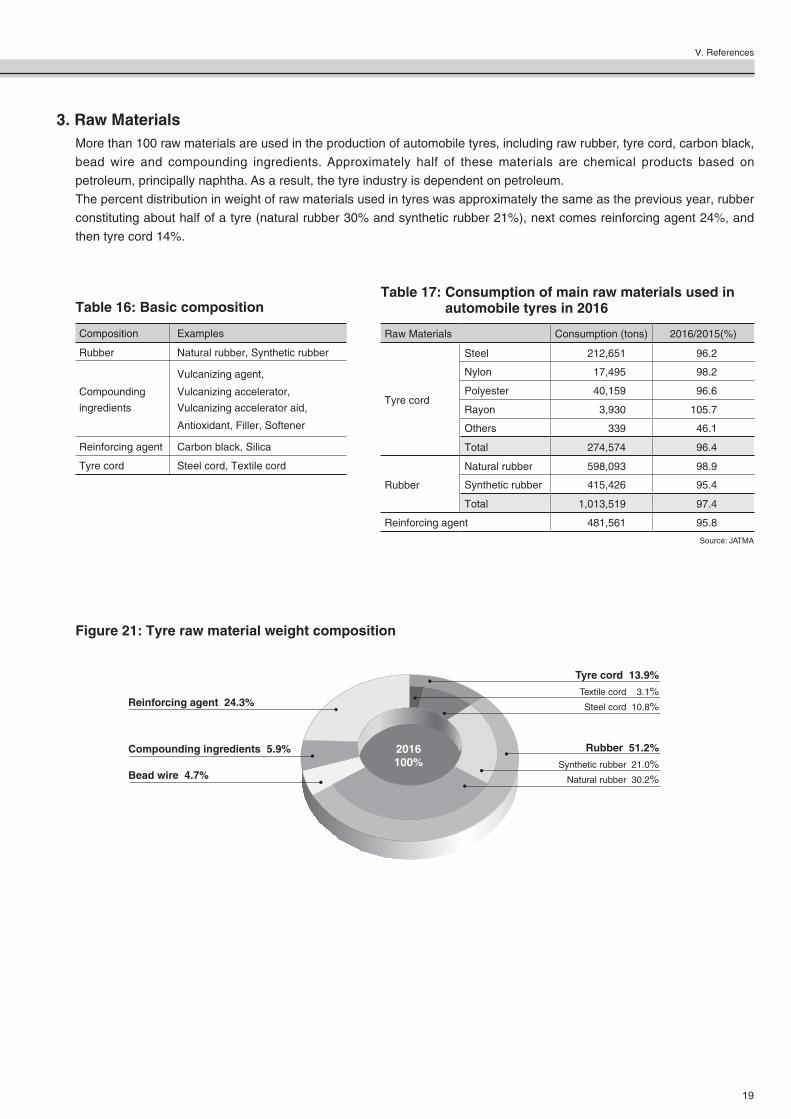
3. Raw MaterialsMore than 100 raw materials are used in the production of automobile tyres, including raw rubber, tyre cord, carbon black,
bead wire and compounding ingredients. Approximately half of these materials are chemical products based on
petroleum, principally naphtha. As a result, the tyre industry is dependent on petroleum.
The percent distribution in weight of raw materials used in tyres was approximately the same as the previous year, rubber
constituting about half of a tyre (natural rubber 30% and synthetic rubber 21%), next comes reinforcing agent 24%, and
then tyre cord 14%.
Table 16: Basic composition
Figure 21: Tyre raw material weight composition
Composition Examples
Rubber Natural rubber, Synthetic rubber
Vulcanizing agent,
Compounding Vulcanizing accelerator,
ingredients Vulcanizing accelerator aid,
Antioxidant, Filler, Softener
Reinforcing agent Carbon black, Silica
Tyre cord Steel cord, Textile cord
Table 17: Consumption of main raw materials used in automobile tyres in 2016
V. References
Raw Materials Consumption (tons) 2016/2015(%)
Tyre cord
Steel 212,651 96.2
Nylon 17,495 98.2
Polyester 40,159 96.6
Rayon 3,930 105.7
Others 339 46.1
Total 274,574 96.4
Rubber
Natural rubber 598,093 98.9
Synthetic rubber 415,426 95.4
Total 1,013,519 97.4
Reinforcing agent 481,561 95.8
Source: JATMA
Tyre cord 13.9%
Steel cord 10.8%Textile cord 3.1%
Rubber 51.2%
Natural rubber 30.2%Synthetic rubber 21.0%
Compounding ingredients 5.9%
Reinforcing agent 24.3%
Bead wire 4.7%
2016100%
20
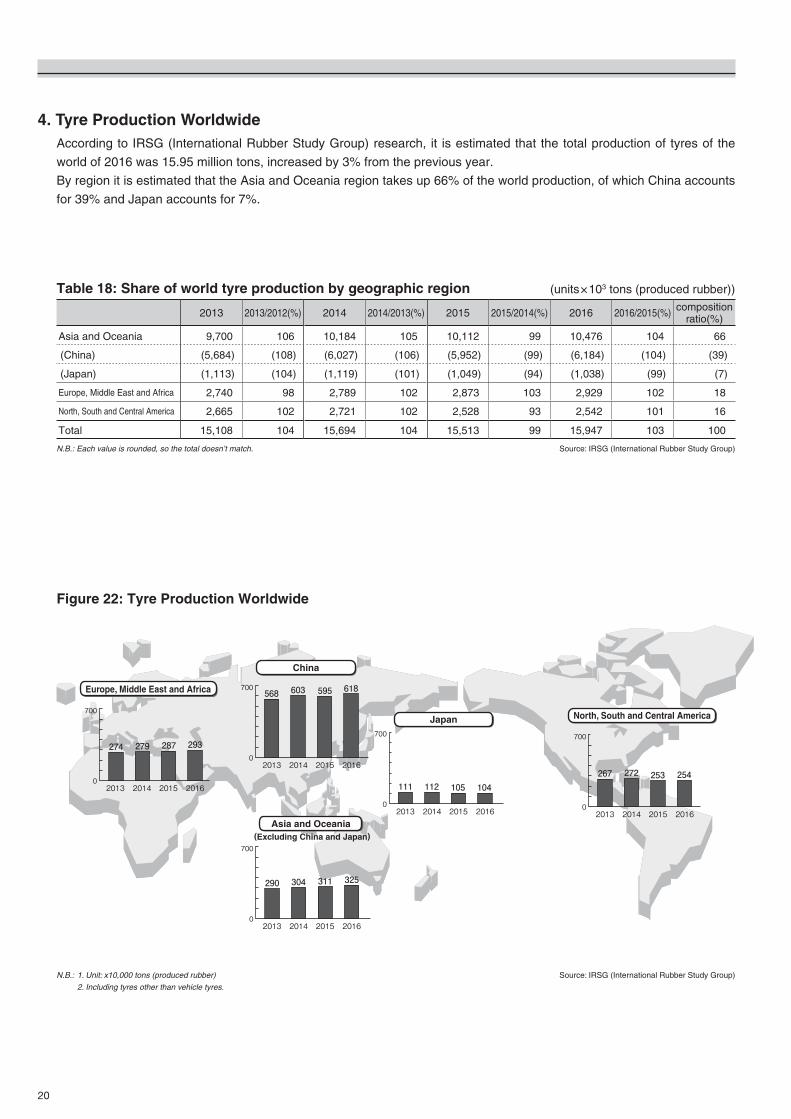
4. Tyre Production WorldwideAccording to IRSG (International Rubber Study Group) research, it is estimated that the total production of tyres of the
world of 2016 was 15.95 million tons, increased by 3% from the previous year.
By region it is estimated that the Asia and Oceania region takes up 66% of the world production, of which China accounts
for 39% and Japan accounts for 7%.
Figure 22: Tyre Production Worldwide
(units×103 tons (produced rubber))
2013 2013/2012(%) 2014 2014/2013(%) 2015 2015/2014(%) 2016 2016/2015(%) composition ratio(%)
Asia and Oceania 9,700 106 10,184 105 10,112 99 10,476 104 66
(China) (5,684) (108) (6,027) (106) (5,952) (99) (6,184) (104) (39)
(Japan) (1,113) (104) (1,119) (101) (1,049) (94) (1,038) (99) (7)
Europe, Middle East and Africa 2,740 98 2,789 102 2,873 103 2,929 102 18
North, South and Central America 2,665 102 2,721 102 2,528 93 2,542 101 16
Total 15,108 104 15,694 104 15,513 99 15,947 103 100
N.B.: Each value is rounded, so the total doesn’t match. Source: IRSG (International Rubber Study Group)
Table 18: Share of world tyre production by geographic region
Source: IRSG (International Rubber Study Group)N.B.: 1. Unit: x10,000 tons (produced rubber)
2. Including tyres other than vehicle tyres.
Europe, Middle East and Africa
North, South and Central AmericaJapan
China
Asia and Oceania (Excluding China and Japan)
700
0 2013 2014 2015 2016
274 279 287 293
700
0 2013 2014 2015 2016
568 603
700
0 2013 2014 2015 2016
700
0 2013 2014 2015 2016
700
0 2013 2014 2015 2016
290 304 311 325
267111 112 105 104
272 253 254
595 618
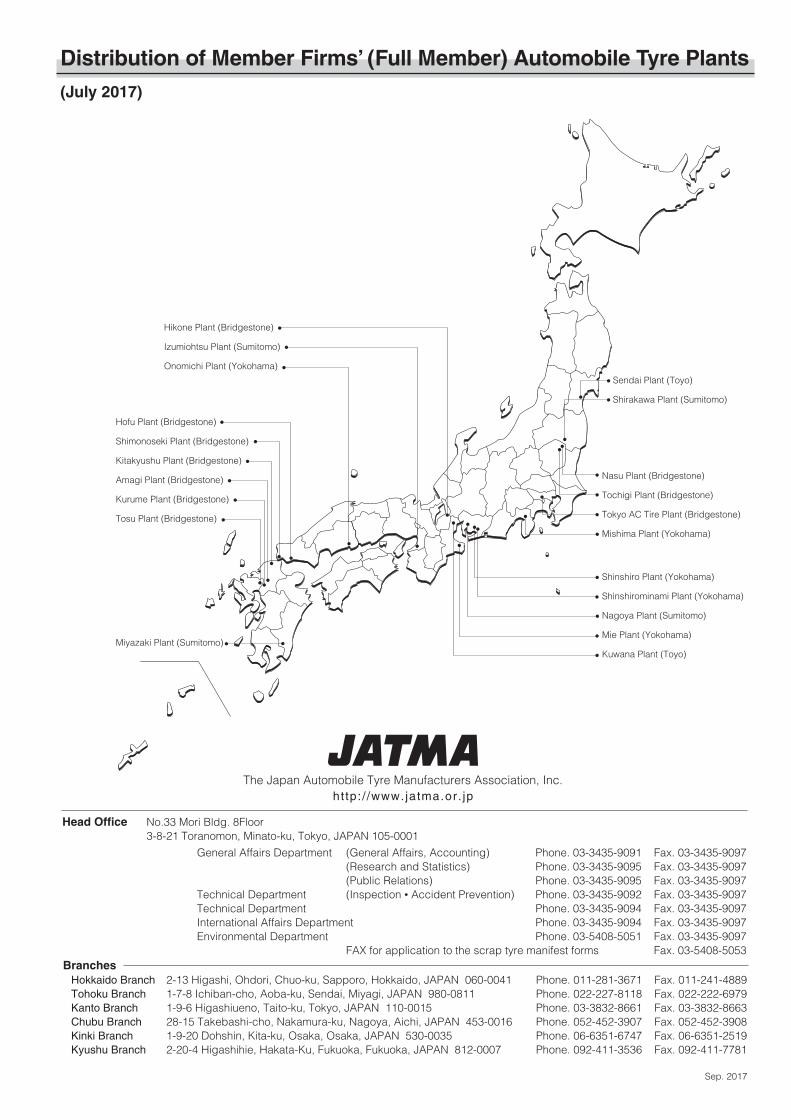
Distribution of Member Firms’ (Full Member) Automobile Tyre Plants(July 2017)
Shinshiro Plant (Yokohama)
Shinshirominami Plant (Yokohama)
Nagoya Plant (Sumitomo)
Mie Plant (Yokohama)
Kuwana Plant (Toyo)
Hikone Plant (Bridgestone)
Izumiohtsu Plant (Sumitomo)
Onomichi Plant (Yokohama)
Hofu Plant (Bridgestone)
Shimonoseki Plant (Bridgestone)
Kitakyushu Plant (Bridgestone)
Amagi Plant (Bridgestone)
Kurume Plant (Bridgestone)
Tosu Plant (Bridgestone)
Sendai Plant (Toyo)
Shirakawa Plant (Sumitomo)
Nasu Plant (Bridgestone)
Tochigi Plant (Bridgestone)
Tokyo AC Tire Plant (Bridgestone)
Mishima Plant (Yokohama)
Miyazaki Plant (Sumitomo)
Sep. 2017
2-13 Higashi, Ohdori, Chuo-ku, Sapporo, Hokkaido, JAPAN 060-0041 1-7-8 Ichiban-cho, Aoba-ku, Sendai, Miyagi, JAPAN 980-08111-9-6 Higashiueno, Taito-ku, Tokyo, JAPAN 110-001528-15 Takebashi-cho, Nakamura-ku, Nagoya, Aichi, JAPAN 453-0016 1-9-20 Dohshin, Kita-ku, Osaka, Osaka, JAPAN 530-00352-20-4 Higashihie, Hakata-Ku, Fukuoka, Fukuoka, JAPAN 812-0007
Hokkaido BranchTohoku BranchKanto BranchChubu BranchKinki BranchKyushu Branch
BranchesPhone. 011-281-3671 Fax. 011-241-4889Phone. 022-227-8118 Fax. 022-222-6979Phone. 03-3832-8661 Fax. 03-3832-8663Phone. 052-452-3907 Fax. 052-452-3908Phone. 06-6351-6747 Fax. 06-6351-2519Phone. 092-411-3536 Fax. 092-411-7781
The Japan Automobile Tyre Manufacturers Association, Inc.http: / /www.jatma.or. jp
Head Office No.33 Mori Bldg. 8Floor 3-8-21 Toranomon, Minato-ku, Tokyo, JAPAN 105-0001
General Affairs Department (General Affairs, Accounting) Phone. 03-3435-9091 Fax. 03-3435-9097 (Research and Statistics) Phone. 03-3435-9095 Fax. 03-3435-9097 (Public Relations) Phone. 03-3435-9095 Fax. 03-3435-9097 Technical Department (Inspection • Accident Prevention) Phone. 03-3435-9092 Fax. 03-3435-9097 Technical Department Phone. 03-3435-9094 Fax. 03-3435-9097 International Affairs Department Phone. 03-3435-9094 Fax. 03-3435-9097 Environmental Department Phone. 03-5408-5051 Fax. 03-3435-9097 FAX for application to the scrap tyre manifest forms Fax. 03-5408-5053

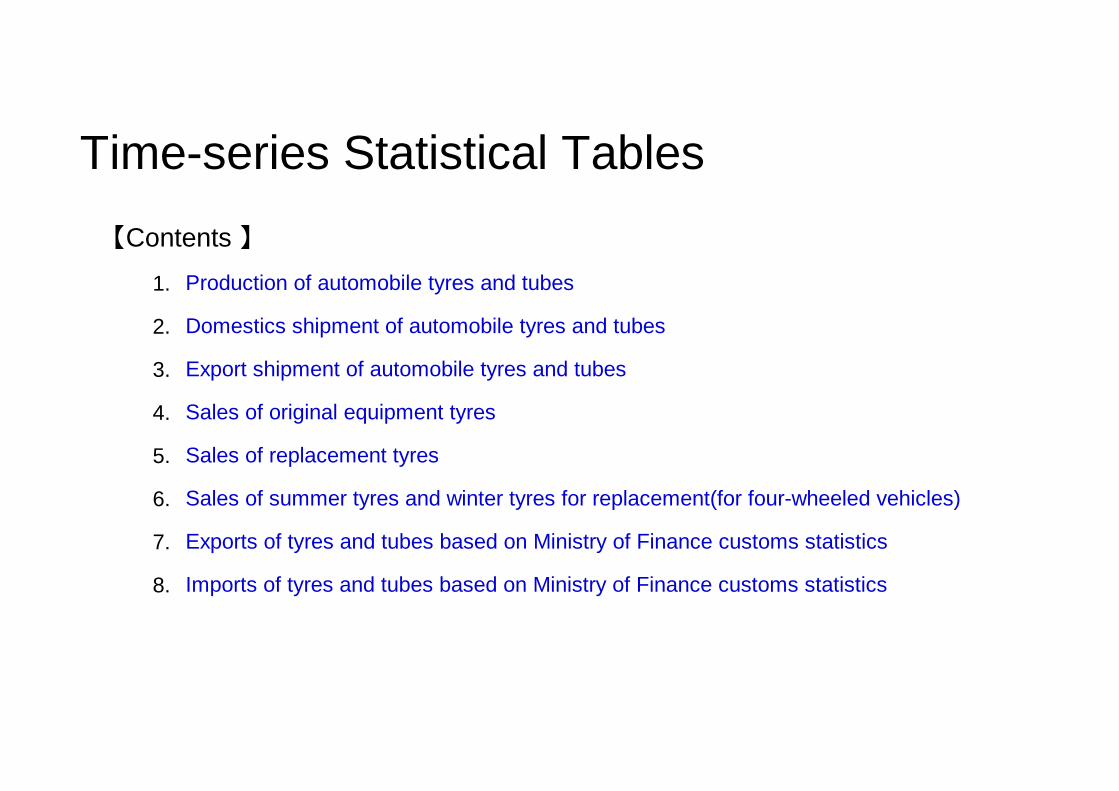
Time-series Statistical Tables
【Contents 】
1.
2.
3.
4.
5.
6.
7.
8.
Production of automobile tyres and tubes
Export shipment of automobile tyres and tubes
Sales of summer tyres and winter tyres for replacement(for four-wheeled vehicles)
Imports of tyres and tubes based on Ministry of Finance customs statistics
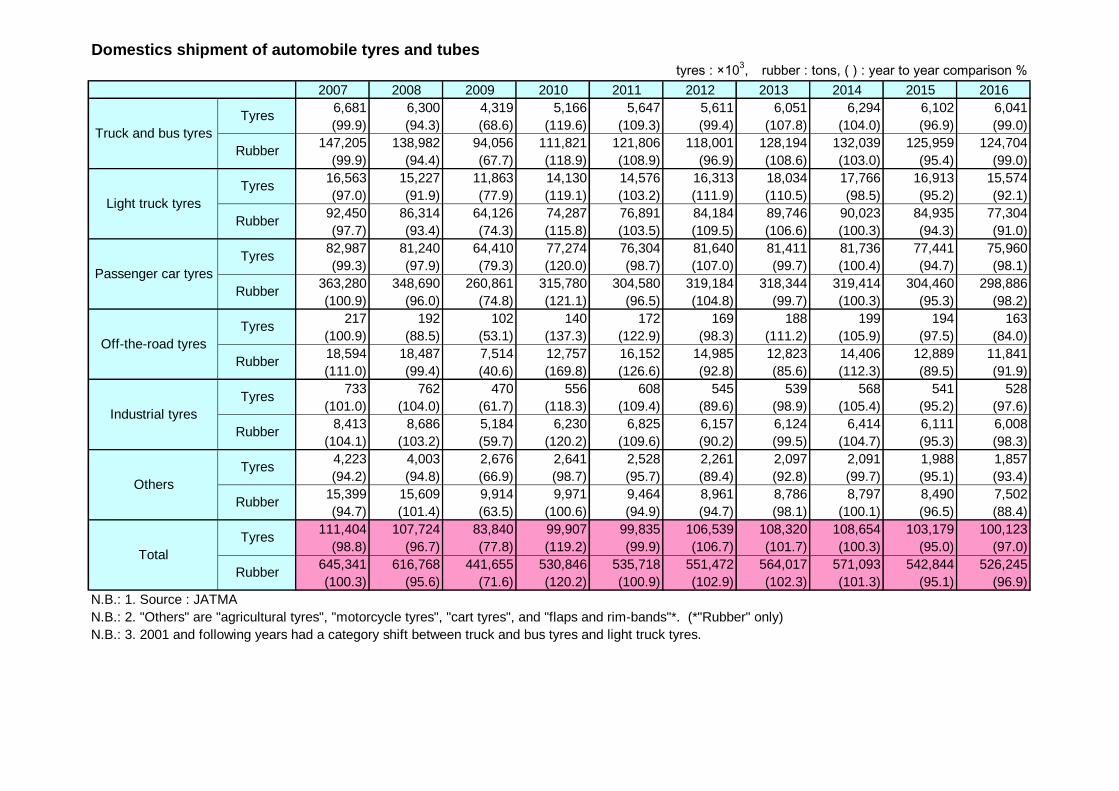
Domestics shipment of automobile tyres and tubes
Sales of original equipment tyres
Sales of replacement tyres
Exports of tyres and tubes based on Ministry of Finance customs statistics
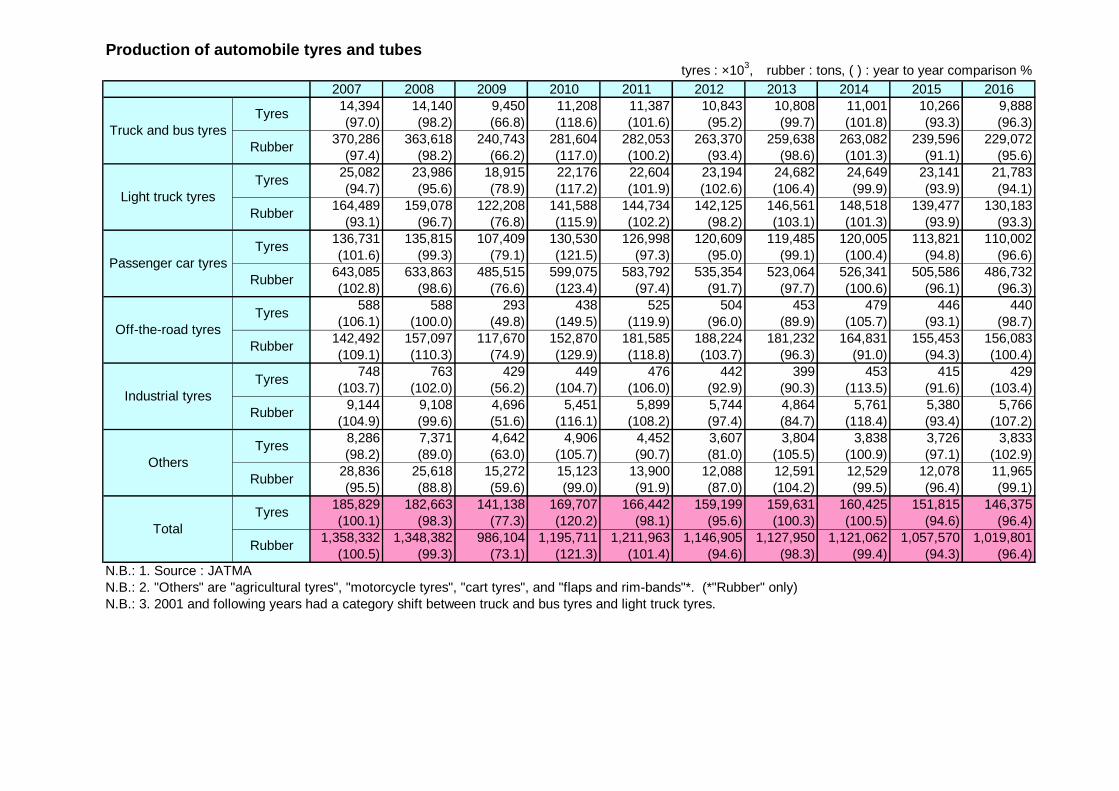
Production of automobile tyres and tubes
tyres : ×103, rubber : tons, ( ) : year to year comparison %
2007 2008 2009 2010 2011 2012 2013 2014 2015 2016
14,394 14,140 9,450 11,208 11,387 10,843 10,808 11,001 10,266 9,888
(97.0) (98.2) (66.8) (118.6) (101.6) (95.2) (99.7) (101.8) (93.3) (96.3)
370,286 363,618 240,743 281,604 282,053 263,370 259,638 263,082 239,596 229,072
(97.4) (98.2) (66.2) (117.0) (100.2) (93.4) (98.6) (101.3) (91.1) (95.6)
25,082 23,986 18,915 22,176 22,604 23,194 24,682 24,649 23,141 21,783
(94.7) (95.6) (78.9) (117.2) (101.9) (102.6) (106.4) (99.9) (93.9) (94.1)
164,489 159,078 122,208 141,588 144,734 142,125 146,561 148,518 139,477 130,183
(93.1) (96.7) (76.8) (115.9) (102.2) (98.2) (103.1) (101.3) (93.9) (93.3)
136,731 135,815 107,409 130,530 126,998 120,609 119,485 120,005 113,821 110,002
(101.6) (99.3) (79.1) (121.5) (97.3) (95.0) (99.1) (100.4) (94.8) (96.6)
643,085 633,863 485,515 599,075 583,792 535,354 523,064 526,341 505,586 486,732
(102.8) (98.6) (76.6) (123.4) (97.4) (91.7) (97.7) (100.6) (96.1) (96.3)
588 588 293 438 525 504 453 479 446 440
(106.1) (100.0) (49.8) (149.5) (119.9) (96.0) (89.9) (105.7) (93.1) (98.7)
142,492 157,097 117,670 152,870 181,585 188,224 181,232 164,831 155,453 156,083
(109.1) (110.3) (74.9) (129.9) (118.8) (103.7) (96.3) (91.0) (94.3) (100.4)
748 763 429 449 476 442 399 453 415 429
(103.7) (102.0) (56.2) (104.7) (106.0) (92.9) (90.3) (113.5) (91.6) (103.4)
9,144 9,108 4,696 5,451 5,899 5,744 4,864 5,761 5,380 5,766
(104.9) (99.6) (51.6) (116.1) (108.2) (97.4) (84.7) (118.4) (93.4) (107.2)
8,286 7,371 4,642 4,906 4,452 3,607 3,804 3,838 3,726 3,833
(98.2) (89.0) (63.0) (105.7) (90.7) (81.0) (105.5) (100.9) (97.1) (102.9)
28,836 25,618 15,272 15,123 13,900 12,088 12,591 12,529 12,078 11,965
(95.5) (88.8) (59.6) (99.0) (91.9) (87.0) (104.2) (99.5) (96.4) (99.1)
185,829 182,663 141,138 169,707 166,442 159,199 159,631 160,425 151,815 146,375
(100.1) (98.3) (77.3) (120.2) (98.1) (95.6) (100.3) (100.5) (94.6) (96.4)
1,358,332 1,348,382 986,104 1,195,711 1,211,963 1,146,905 1,127,950 1,121,062 1,057,570 1,019,801
(100.5) (99.3) (73.1) (121.3) (101.4) (94.6) (98.3) (99.4) (94.3) (96.4)
N.B.: 1. Source : JATMA
N.B.: 2. "Others" are "agricultural tyres", "motorcycle tyres", "cart tyres", and "flaps and rim-bands"*. (*"Rubber" only)
N.B.: 3. 2001 and following years had a category shift between truck and bus tyres and light truck tyres.
Truck and bus tyres
Light truck tyres
Passenger car tyres
Off-the-road tyres
Rubber
Tyres
Rubber
Tyres
Tyres
Rubber
Tyres
Rubber
Rubber
Tyres
Tyres
Tyres
Rubber
Total
Industrial tyres
Others
Rubber
Domestics shipment of automobile tyres and tubes
tyres : ×103, rubber : tons, ( ) : year to year comparison %
2007 2008 2009 2010 2011 2012 2013 2014 2015 2016
6,681 6,300 4,319 5,166 5,647 5,611 6,051 6,294 6,102 6,041
(99.9) (94.3) (68.6) (119.6) (109.3) (99.4) (107.8) (104.0) (96.9) (99.0)
147,205 138,982 94,056 111,821 121,806 118,001 128,194 132,039 125,959 124,704
(99.9) (94.4) (67.7) (118.9) (108.9) (96.9) (108.6) (103.0) (95.4) (99.0)
16,563 15,227 11,863 14,130 14,576 16,313 18,034 17,766 16,913 15,574
(97.0) (91.9) (77.9) (119.1) (103.2) (111.9) (110.5) (98.5) (95.2) (92.1)
92,450 86,314 64,126 74,287 76,891 84,184 89,746 90,023 84,935 77,304
(97.7) (93.4) (74.3) (115.8) (103.5) (109.5) (106.6) (100.3) (94.3) (91.0)
82,987 81,240 64,410 77,274 76,304 81,640 81,411 81,736 77,441 75,960
(99.3) (97.9) (79.3) (120.0) (98.7) (107.0) (99.7) (100.4) (94.7) (98.1)
363,280 348,690 260,861 315,780 304,580 319,184 318,344 319,414 304,460 298,886
(100.9) (96.0) (74.8) (121.1) (96.5) (104.8) (99.7) (100.3) (95.3) (98.2)
217 192 102 140 172 169 188 199 194 163
(100.9) (88.5) (53.1) (137.3) (122.9) (98.3) (111.2) (105.9) (97.5) (84.0)
18,594 18,487 7,514 12,757 16,152 14,985 12,823 14,406 12,889 11,841
(111.0) (99.4) (40.6) (169.8) (126.6) (92.8) (85.6) (112.3) (89.5) (91.9)
733 762 470 556 608 545 539 568 541 528
(101.0) (104.0) (61.7) (118.3) (109.4) (89.6) (98.9) (105.4) (95.2) (97.6)
8,413 8,686 5,184 6,230 6,825 6,157 6,124 6,414 6,111 6,008
(104.1) (103.2) (59.7) (120.2) (109.6) (90.2) (99.5) (104.7) (95.3) (98.3)
4,223 4,003 2,676 2,641 2,528 2,261 2,097 2,091 1,988 1,857
(94.2) (94.8) (66.9) (98.7) (95.7) (89.4) (92.8) (99.7) (95.1) (93.4)
15,399 15,609 9,914 9,971 9,464 8,961 8,786 8,797 8,490 7,502
(94.7) (101.4) (63.5) (100.6) (94.9) (94.7) (98.1) (100.1) (96.5) (88.4)
111,404 107,724 83,840 99,907 99,835 106,539 108,320 108,654 103,179 100,123
(98.8) (96.7) (77.8) (119.2) (99.9) (106.7) (101.7) (100.3) (95.0) (97.0)
645,341 616,768 441,655 530,846 535,718 551,472 564,017 571,093 542,844 526,245
(100.3) (95.6) (71.6) (120.2) (100.9) (102.9) (102.3) (101.3) (95.1) (96.9)
N.B.: 1. Source : JATMA
N.B.: 2. "Others" are "agricultural tyres", "motorcycle tyres", "cart tyres", and "flaps and rim-bands"*. (*"Rubber" only)
N.B.: 3. 2001 and following years had a category shift between truck and bus tyres and light truck tyres.
Tyres
Others
Truck and bus tyres
Rubber
Tyres
Tyres
Industrial tyres
Off-the-road tyres
Passenger car tyres
Light truck tyres
Tyres
Rubber
Rubber
Tyres
Rubber
Rubber
Total
Rubber
Tyres
Tyres
Rubber
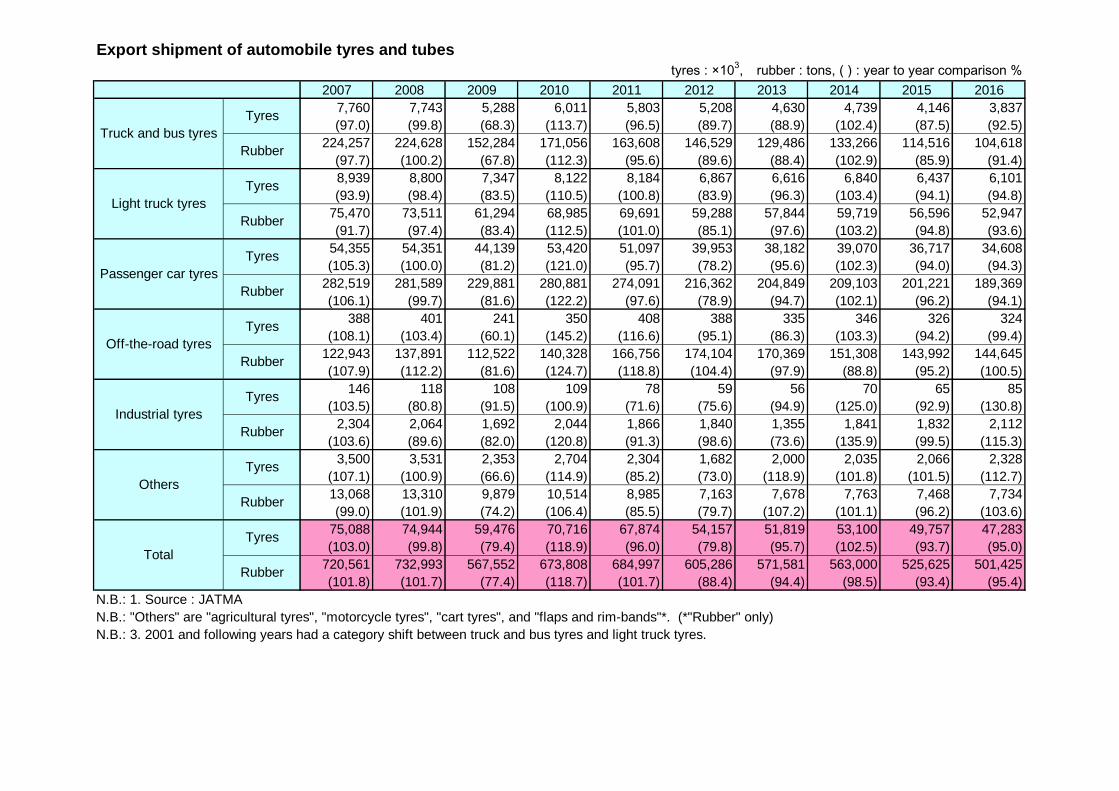
Export shipment of automobile tyres and tubes
tyres : ×103, rubber : tons, ( ) : year to year comparison %
2007 2008 2009 2010 2011 2012 2013 2014 2015 2016
7,760 7,743 5,288 6,011 5,803 5,208 4,630 4,739 4,146 3,837
(97.0) (99.8) (68.3) (113.7) (96.5) (89.7) (88.9) (102.4) (87.5) (92.5)
224,257 224,628 152,284 171,056 163,608 146,529 129,486 133,266 114,516 104,618
(97.7) (100.2) (67.8) (112.3) (95.6) (89.6) (88.4) (102.9) (85.9) (91.4)
8,939 8,800 7,347 8,122 8,184 6,867 6,616 6,840 6,437 6,101
(93.9) (98.4) (83.5) (110.5) (100.8) (83.9) (96.3) (103.4) (94.1) (94.8)
75,470 73,511 61,294 68,985 69,691 59,288 57,844 59,719 56,596 52,947
(91.7) (97.4) (83.4) (112.5) (101.0) (85.1) (97.6) (103.2) (94.8) (93.6)
54,355 54,351 44,139 53,420 51,097 39,953 38,182 39,070 36,717 34,608
(105.3) (100.0) (81.2) (121.0) (95.7) (78.2) (95.6) (102.3) (94.0) (94.3)
282,519 281,589 229,881 280,881 274,091 216,362 204,849 209,103 201,221 189,369
(106.1) (99.7) (81.6) (122.2) (97.6) (78.9) (94.7) (102.1) (96.2) (94.1)
388 401 241 350 408 388 335 346 326 324
(108.1) (103.4) (60.1) (145.2) (116.6) (95.1) (86.3) (103.3) (94.2) (99.4)
122,943 137,891 112,522 140,328 166,756 174,104 170,369 151,308 143,992 144,645
(107.9) (112.2) (81.6) (124.7) (118.8) (104.4) (97.9) (88.8) (95.2) (100.5)
146 118 108 109 78 59 56 70 65 85
(103.5) (80.8) (91.5) (100.9) (71.6) (75.6) (94.9) (125.0) (92.9) (130.8)
2,304 2,064 1,692 2,044 1,866 1,840 1,355 1,841 1,832 2,112
(103.6) (89.6) (82.0) (120.8) (91.3) (98.6) (73.6) (135.9) (99.5) (115.3)
3,500 3,531 2,353 2,704 2,304 1,682 2,000 2,035 2,066 2,328
(107.1) (100.9) (66.6) (114.9) (85.2) (73.0) (118.9) (101.8) (101.5) (112.7)
13,068 13,310 9,879 10,514 8,985 7,163 7,678 7,763 7,468 7,734
(99.0) (101.9) (74.2) (106.4) (85.5) (79.7) (107.2) (101.1) (96.2) (103.6)
75,088 74,944 59,476 70,716 67,874 54,157 51,819 53,100 49,757 47,283
(103.0) (99.8) (79.4) (118.9) (96.0) (79.8) (95.7) (102.5) (93.7) (95.0)
720,561 732,993 567,552 673,808 684,997 605,286 571,581 563,000 525,625 501,425
(101.8) (101.7) (77.4) (118.7) (101.7) (88.4) (94.4) (98.5) (93.4) (95.4)
N.B.: 1. Source : JATMA
N.B.: "Others" are "agricultural tyres", "motorcycle tyres", "cart tyres", and "flaps and rim-bands"*. (*"Rubber" only)
N.B.: 3. 2001 and following years had a category shift between truck and bus tyres and light truck tyres.
Rubber
Rubber
Passenger car tyres
Rubber
Light truck tyres
Truck and bus tyres
Tyres
Rubber
Tyres
Rubber
Tyres
Rubber
Tyres
Others
Industrial tyres
Tyres
Total
Off-the-road tyres
Rubber
Tyres
Tyres
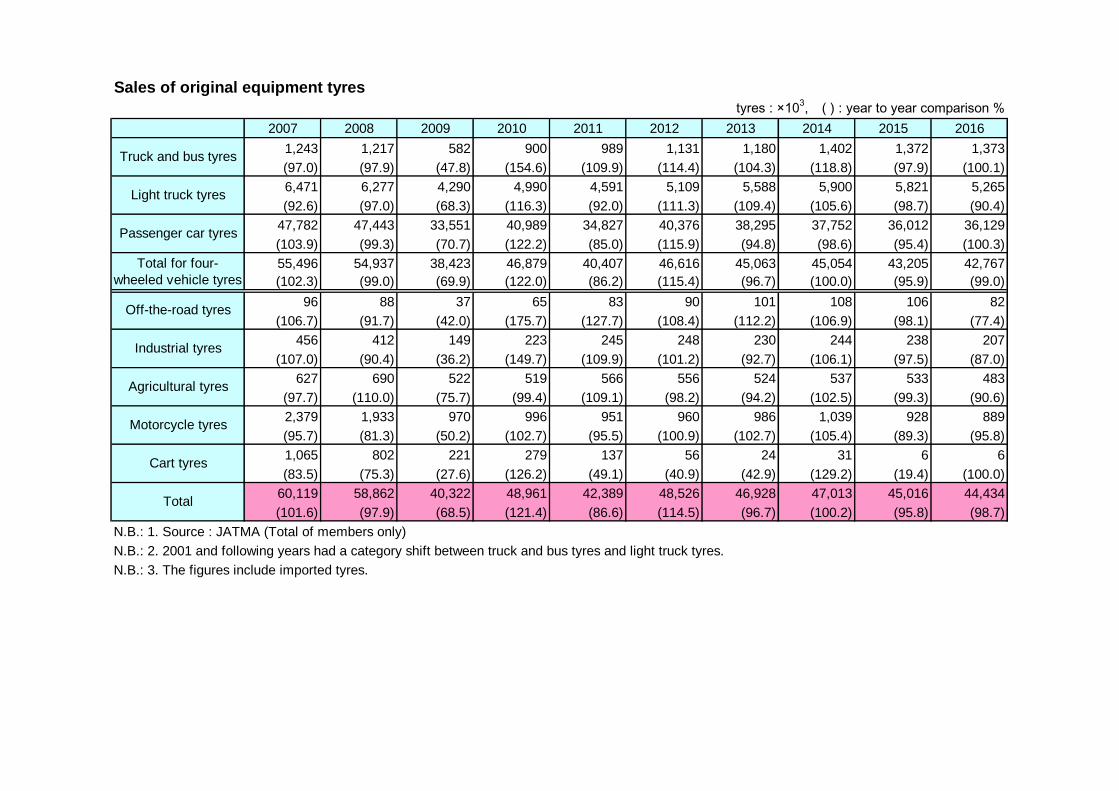
Sales of original equipment tyres
tyres : ×103, ( ) : year to year comparison %
2007 2008 2009 2010 2011 2012 2013 2014 2015 2016
1,243 1,217 582 900 989 1,131 1,180 1,402 1,372 1,373
(97.0) (97.9) (47.8) (154.6) (109.9) (114.4) (104.3) (118.8) (97.9) (100.1)
6,471 6,277 4,290 4,990 4,591 5,109 5,588 5,900 5,821 5,265
(92.6) (97.0) (68.3) (116.3) (92.0) (111.3) (109.4) (105.6) (98.7) (90.4)
47,782 47,443 33,551 40,989 34,827 40,376 38,295 37,752 36,012 36,129
(103.9) (99.3) (70.7) (122.2) (85.0) (115.9) (94.8) (98.6) (95.4) (100.3)
55,496 54,937 38,423 46,879 40,407 46,616 45,063 45,054 43,205 42,767
(102.3) (99.0) (69.9) (122.0) (86.2) (115.4) (96.7) (100.0) (95.9) (99.0)
96 88 37 65 83 90 101 108 106 82
(106.7) (91.7) (42.0) (175.7) (127.7) (108.4) (112.2) (106.9) (98.1) (77.4)
456 412 149 223 245 248 230 244 238 207
(107.0) (90.4) (36.2) (149.7) (109.9) (101.2) (92.7) (106.1) (97.5) (87.0)
627 690 522 519 566 556 524 537 533 483
(97.7) (110.0) (75.7) (99.4) (109.1) (98.2) (94.2) (102.5) (99.3) (90.6)
2,379 1,933 970 996 951 960 986 1,039 928 889
(95.7) (81.3) (50.2) (102.7) (95.5) (100.9) (102.7) (105.4) (89.3) (95.8)
1,065 802 221 279 137 56 24 31 6 6
(83.5) (75.3) (27.6) (126.2) (49.1) (40.9) (42.9) (129.2) (19.4) (100.0)
60,119 58,862 40,322 48,961 42,389 48,526 46,928 47,013 45,016 44,434
(101.6) (97.9) (68.5) (121.4) (86.6) (114.5) (96.7) (100.2) (95.8) (98.7)
N.B.: 1. Source : JATMA (Total of members only)
N.B.: 2. 2001 and following years had a category shift between truck and bus tyres and light truck tyres.
N.B.: 3. The figures include imported tyres.
Total
Cart tyres
Motorcycle tyres
Agricultural tyres
Truck and bus tyres
Passenger car tyres
Light truck tyres
Industrial tyres
Off-the-road tyres
Total for four-
wheeled vehicle tyres
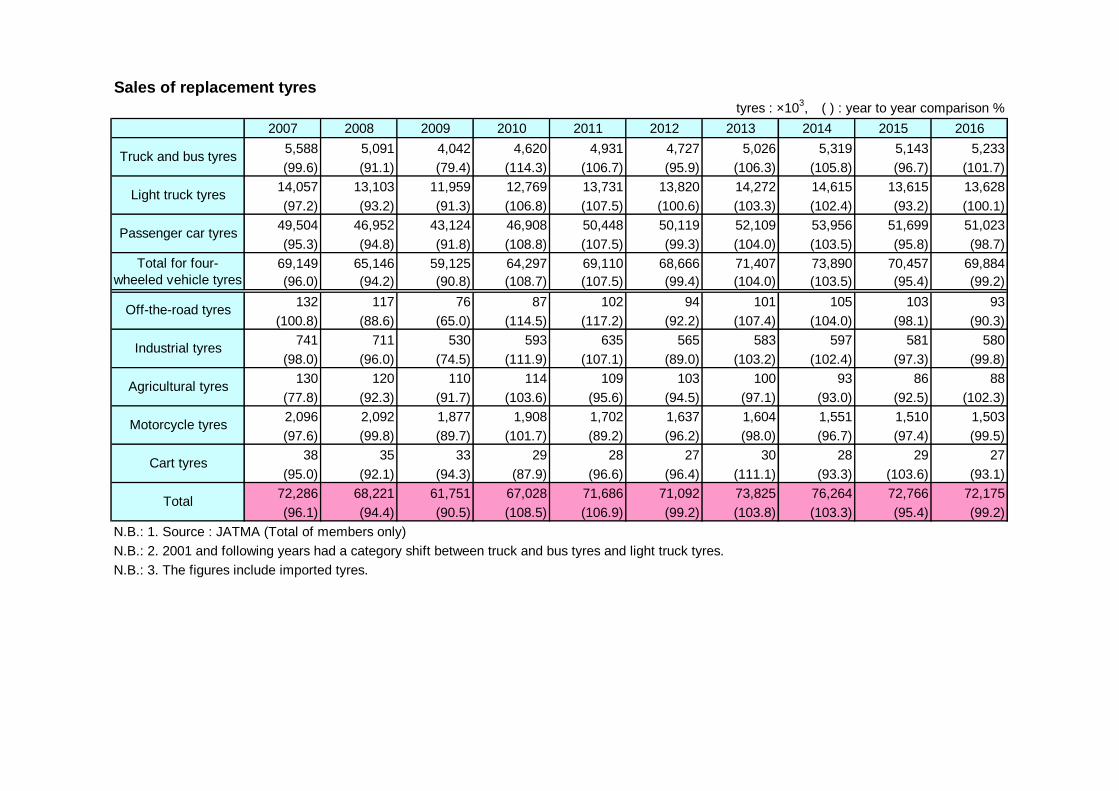
Sales of replacement tyres
tyres : ×103, ( ) : year to year comparison %
2007 2008 2009 2010 2011 2012 2013 2014 2015 2016
5,588 5,091 4,042 4,620 4,931 4,727 5,026 5,319 5,143 5,233
(99.6) (91.1) (79.4) (114.3) (106.7) (95.9) (106.3) (105.8) (96.7) (101.7)
14,057 13,103 11,959 12,769 13,731 13,820 14,272 14,615 13,615 13,628
(97.2) (93.2) (91.3) (106.8) (107.5) (100.6) (103.3) (102.4) (93.2) (100.1)
49,504 46,952 43,124 46,908 50,448 50,119 52,109 53,956 51,699 51,023
(95.3) (94.8) (91.8) (108.8) (107.5) (99.3) (104.0) (103.5) (95.8) (98.7)
69,149 65,146 59,125 64,297 69,110 68,666 71,407 73,890 70,457 69,884
(96.0) (94.2) (90.8) (108.7) (107.5) (99.4) (104.0) (103.5) (95.4) (99.2)
132 117 76 87 102 94 101 105 103 93
(100.8) (88.6) (65.0) (114.5) (117.2) (92.2) (107.4) (104.0) (98.1) (90.3)
741 711 530 593 635 565 583 597 581 580
(98.0) (96.0) (74.5) (111.9) (107.1) (89.0) (103.2) (102.4) (97.3) (99.8)
130 120 110 114 109 103 100 93 86 88
(77.8) (92.3) (91.7) (103.6) (95.6) (94.5) (97.1) (93.0) (92.5) (102.3)
2,096 2,092 1,877 1,908 1,702 1,637 1,604 1,551 1,510 1,503
(97.6) (99.8) (89.7) (101.7) (89.2) (96.2) (98.0) (96.7) (97.4) (99.5)
38 35 33 29 28 27 30 28 29 27
(95.0) (92.1) (94.3) (87.9) (96.6) (96.4) (111.1) (93.3) (103.6) (93.1)
72,286 68,221 61,751 67,028 71,686 71,092 73,825 76,264 72,766 72,175
(96.1) (94.4) (90.5) (108.5) (106.9) (99.2) (103.8) (103.3) (95.4) (99.2)
N.B.: 1. Source : JATMA (Total of members only)
N.B.: 2. 2001 and following years had a category shift between truck and bus tyres and light truck tyres.
N.B.: 3. The figures include imported tyres.
Total
Cart tyres
Motorcycle tyres
Agricultural tyres
Light truck tyres
Truck and bus tyres
Industrial tyres
Off-the-road tyres
Total for four-
wheeled vehicle tyres
Passenger car tyres
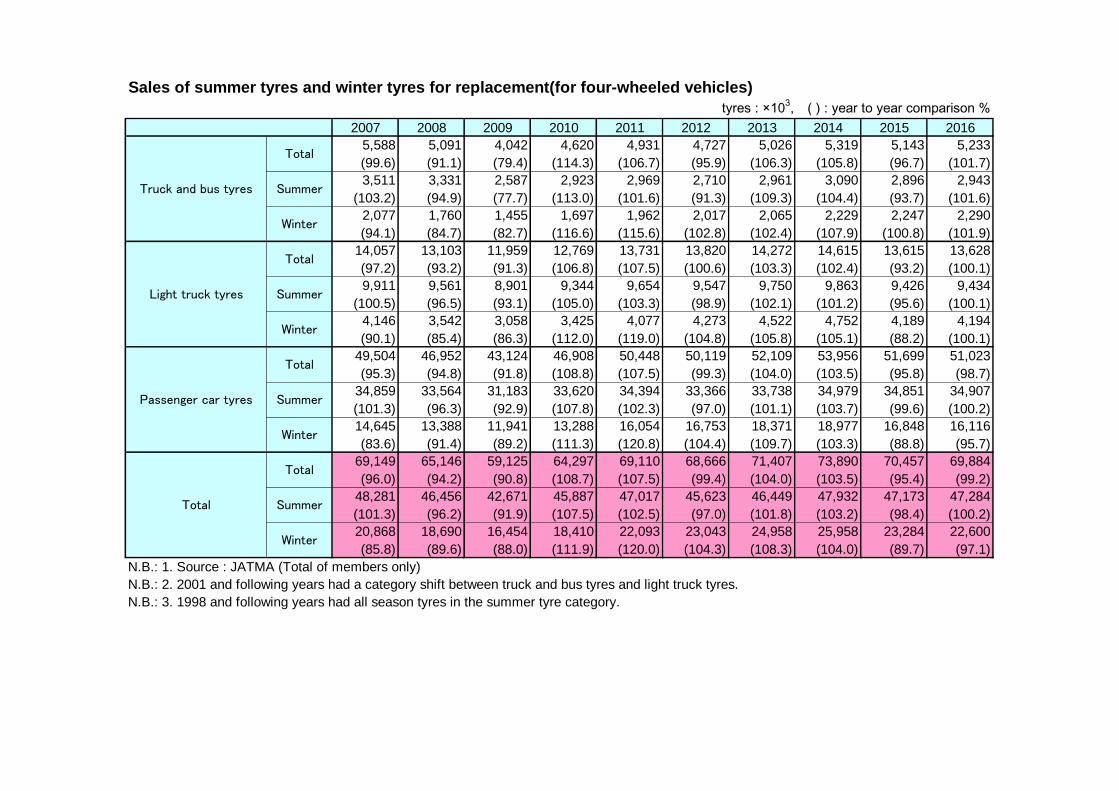
Sales of summer tyres and winter tyres for replacement(for four-wheeled vehicles)
tyres : ×103, ( ) : year to year comparison %
2007 2008 2009 2010 2011 2012 2013 2014 2015 2016
5,588 5,091 4,042 4,620 4,931 4,727 5,026 5,319 5,143 5,233
(99.6) (91.1) (79.4) (114.3) (106.7) (95.9) (106.3) (105.8) (96.7) (101.7)
3,511 3,331 2,587 2,923 2,969 2,710 2,961 3,090 2,896 2,943
(103.2) (94.9) (77.7) (113.0) (101.6) (91.3) (109.3) (104.4) (93.7) (101.6)
2,077 1,760 1,455 1,697 1,962 2,017 2,065 2,229 2,247 2,290
(94.1) (84.7) (82.7) (116.6) (115.6) (102.8) (102.4) (107.9) (100.8) (101.9)
14,057 13,103 11,959 12,769 13,731 13,820 14,272 14,615 13,615 13,628
(97.2) (93.2) (91.3) (106.8) (107.5) (100.6) (103.3) (102.4) (93.2) (100.1)
9,911 9,561 8,901 9,344 9,654 9,547 9,750 9,863 9,426 9,434
(100.5) (96.5) (93.1) (105.0) (103.3) (98.9) (102.1) (101.2) (95.6) (100.1)
4,146 3,542 3,058 3,425 4,077 4,273 4,522 4,752 4,189 4,194
(90.1) (85.4) (86.3) (112.0) (119.0) (104.8) (105.8) (105.1) (88.2) (100.1)
49,504 46,952 43,124 46,908 50,448 50,119 52,109 53,956 51,699 51,023
(95.3) (94.8) (91.8) (108.8) (107.5) (99.3) (104.0) (103.5) (95.8) (98.7)
34,859 33,564 31,183 33,620 34,394 33,366 33,738 34,979 34,851 34,907
(101.3) (96.3) (92.9) (107.8) (102.3) (97.0) (101.1) (103.7) (99.6) (100.2)
14,645 13,388 11,941 13,288 16,054 16,753 18,371 18,977 16,848 16,116
(83.6) (91.4) (89.2) (111.3) (120.8) (104.4) (109.7) (103.3) (88.8) (95.7)
69,149 65,146 59,125 64,297 69,110 68,666 71,407 73,890 70,457 69,884
(96.0) (94.2) (90.8) (108.7) (107.5) (99.4) (104.0) (103.5) (95.4) (99.2)
48,281 46,456 42,671 45,887 47,017 45,623 46,449 47,932 47,173 47,284
(101.3) (96.2) (91.9) (107.5) (102.5) (97.0) (101.8) (103.2) (98.4) (100.2)
20,868 18,690 16,454 18,410 22,093 23,043 24,958 25,958 23,284 22,600
(85.8) (89.6) (88.0) (111.9) (120.0) (104.3) (108.3) (104.0) (89.7) (97.1)
N.B.: 1. Source : JATMA (Total of members only)
N.B.: 2. 2001 and following years had a category shift between truck and bus tyres and light truck tyres.
N.B.: 3. 1998 and following years had all season tyres in the summer tyre category.
Summer
Total
Summer
Total
Winter
SummerLight truck tyres
Truck and bus tyres
Winter
Summer
Total
Winter
Total
Passenger car tyres
Total
Winter
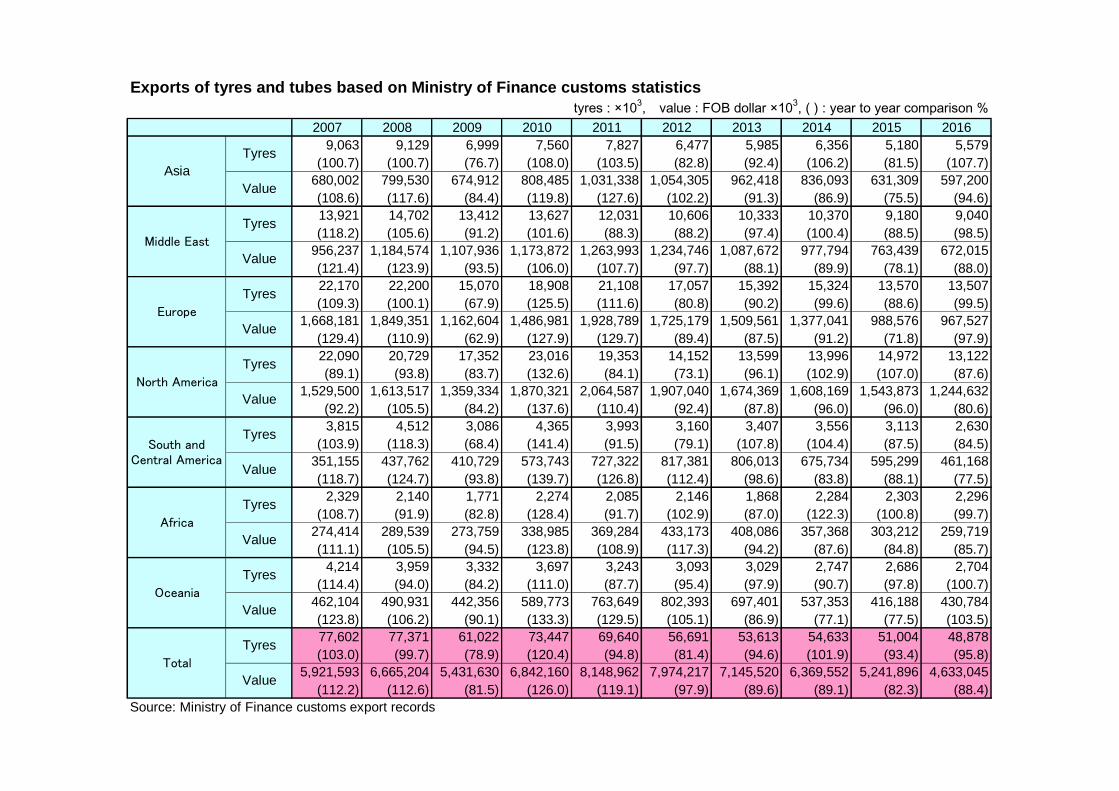
Exports of tyres and tubes based on Ministry of Finance customs statistics
tyres : ×103, value : FOB dollar ×10
3, ( ) : year to year comparison %
2007 2008 2009 2010 2011 2012 2013 2014 2015 2016
9,063 9,129 6,999 7,560 7,827 6,477 5,985 6,356 5,180 5,579
(100.7) (100.7) (76.7) (108.0) (103.5) (82.8) (92.4) (106.2) (81.5) (107.7)
680,002 799,530 674,912 808,485 1,031,338 1,054,305 962,418 836,093 631,309 597,200
(108.6) (117.6) (84.4) (119.8) (127.6) (102.2) (91.3) (86.9) (75.5) (94.6)
13,921 14,702 13,412 13,627 12,031 10,606 10,333 10,370 9,180 9,040
(118.2) (105.6) (91.2) (101.6) (88.3) (88.2) (97.4) (100.4) (88.5) (98.5)
956,237 1,184,574 1,107,936 1,173,872 1,263,993 1,234,746 1,087,672 977,794 763,439 672,015
(121.4) (123.9) (93.5) (106.0) (107.7) (97.7) (88.1) (89.9) (78.1) (88.0)
22,170 22,200 15,070 18,908 21,108 17,057 15,392 15,324 13,570 13,507
(109.3) (100.1) (67.9) (125.5) (111.6) (80.8) (90.2) (99.6) (88.6) (99.5)
1,668,181 1,849,351 1,162,604 1,486,981 1,928,789 1,725,179 1,509,561 1,377,041 988,576 967,527
(129.4) (110.9) (62.9) (127.9) (129.7) (89.4) (87.5) (91.2) (71.8) (97.9)
22,090 20,729 17,352 23,016 19,353 14,152 13,599 13,996 14,972 13,122
(89.1) (93.8) (83.7) (132.6) (84.1) (73.1) (96.1) (102.9) (107.0) (87.6)
1,529,500 1,613,517 1,359,334 1,870,321 2,064,587 1,907,040 1,674,369 1,608,169 1,543,873 1,244,632
(92.2) (105.5) (84.2) (137.6) (110.4) (92.4) (87.8) (96.0) (96.0) (80.6)
3,815 4,512 3,086 4,365 3,993 3,160 3,407 3,556 3,113 2,630
(103.9) (118.3) (68.4) (141.4) (91.5) (79.1) (107.8) (104.4) (87.5) (84.5)
351,155 437,762 410,729 573,743 727,322 817,381 806,013 675,734 595,299 461,168
(118.7) (124.7) (93.8) (139.7) (126.8) (112.4) (98.6) (83.8) (88.1) (77.5)
2,329 2,140 1,771 2,274 2,085 2,146 1,868 2,284 2,303 2,296
(108.7) (91.9) (82.8) (128.4) (91.7) (102.9) (87.0) (122.3) (100.8) (99.7)
274,414 289,539 273,759 338,985 369,284 433,173 408,086 357,368 303,212 259,719
(111.1) (105.5) (94.5) (123.8) (108.9) (117.3) (94.2) (87.6) (84.8) (85.7)
4,214 3,959 3,332 3,697 3,243 3,093 3,029 2,747 2,686 2,704
(114.4) (94.0) (84.2) (111.0) (87.7) (95.4) (97.9) (90.7) (97.8) (100.7)
462,104 490,931 442,356 589,773 763,649 802,393 697,401 537,353 416,188 430,784
(123.8) (106.2) (90.1) (133.3) (129.5) (105.1) (86.9) (77.1) (77.5) (103.5)
77,602 77,371 61,022 73,447 69,640 56,691 53,613 54,633 51,004 48,878
(103.0) (99.7) (78.9) (120.4) (94.8) (81.4) (94.6) (101.9) (93.4) (95.8)
5,921,593 6,665,204 5,431,630 6,842,160 8,148,962 7,974,217 7,145,520 6,369,552 5,241,896 4,633,045
(112.2) (112.6) (81.5) (126.0) (119.1) (97.9) (89.6) (89.1) (82.3) (88.4)
Source: Ministry of Finance customs export records
Tyres
Value
Tyres
Value
Tyres
Value
Tyres
Value
Tyres
Value
Tyres
Value
Tyres
Value
Tyres
Value
Middle East
Asia
Total
Oceania
Africa
South andCentral America
North America
Europe
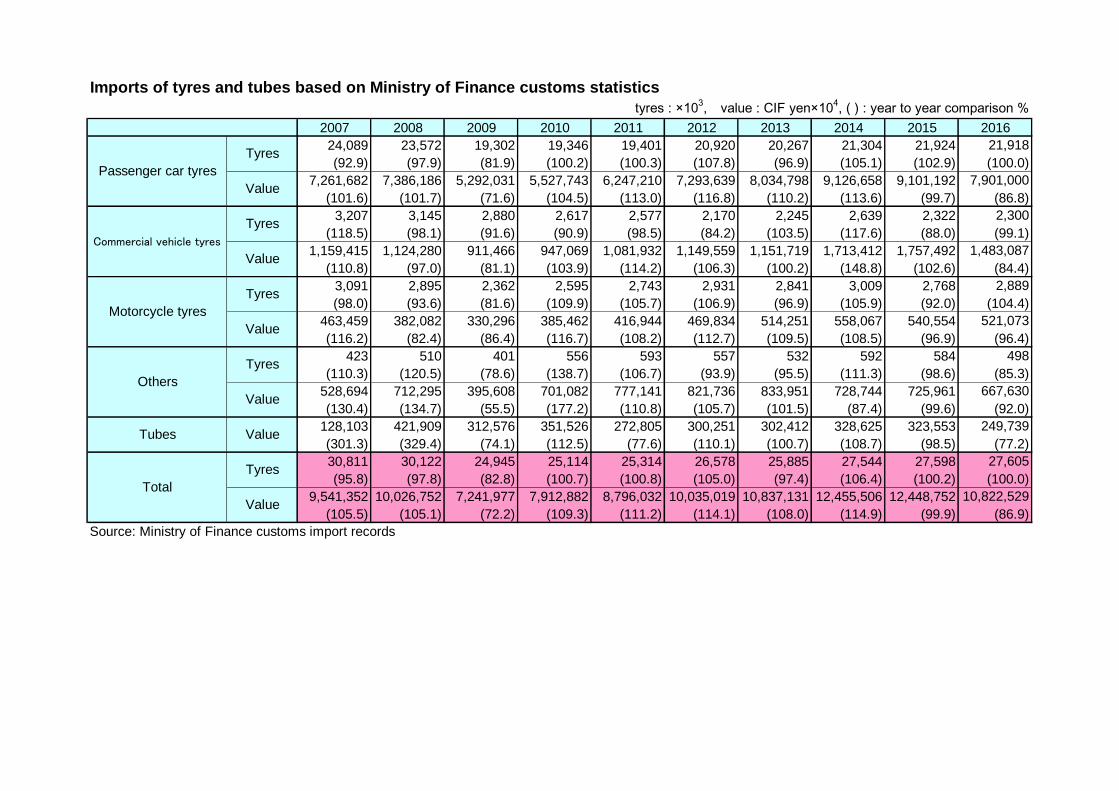
Imports of tyres and tubes based on Ministry of Finance customs statistics
tyres : ×103, value : CIF yen×10
4, ( ) : year to year comparison %
2007 2008 2009 2010 2011 2012 2013 2014 2015 2016
24,089 23,572 19,302 19,346 19,401 20,920 20,267 21,304 21,924 21,918
(92.9) (97.9) (81.9) (100.2) (100.3) (107.8) (96.9) (105.1) (102.9) (100.0)
7,261,682 7,386,186 5,292,031 5,527,743 6,247,210 7,293,639 8,034,798 9,126,658 9,101,192 7,901,000
(101.6) (101.7) (71.6) (104.5) (113.0) (116.8) (110.2) (113.6) (99.7) (86.8)
3,207 3,145 2,880 2,617 2,577 2,170 2,245 2,639 2,322 2,300
(118.5) (98.1) (91.6) (90.9) (98.5) (84.2) (103.5) (117.6) (88.0) (99.1)
1,159,415 1,124,280 911,466 947,069 1,081,932 1,149,559 1,151,719 1,713,412 1,757,492 1,483,087
(110.8) (97.0) (81.1) (103.9) (114.2) (106.3) (100.2) (148.8) (102.6) (84.4)
3,091 2,895 2,362 2,595 2,743 2,931 2,841 3,009 2,768 2,889
(98.0) (93.6) (81.6) (109.9) (105.7) (106.9) (96.9) (105.9) (92.0) (104.4)
463,459 382,082 330,296 385,462 416,944 469,834 514,251 558,067 540,554 521,073
(116.2) (82.4) (86.4) (116.7) (108.2) (112.7) (109.5) (108.5) (96.9) (96.4)
423 510 401 556 593 557 532 592 584 498
(110.3) (120.5) (78.6) (138.7) (106.7) (93.9) (95.5) (111.3) (98.6) (85.3)
528,694 712,295 395,608 701,082 777,141 821,736 833,951 728,744 725,961 667,630
(130.4) (134.7) (55.5) (177.2) (110.8) (105.7) (101.5) (87.4) (99.6) (92.0)
128,103 421,909 312,576 351,526 272,805 300,251 302,412 328,625 323,553 249,739
(301.3) (329.4) (74.1) (112.5) (77.6) (110.1) (100.7) (108.7) (98.5) (77.2)
30,811 30,122 24,945 25,114 25,314 26,578 25,885 27,544 27,598 27,605
(95.8) (97.8) (82.8) (100.7) (100.8) (105.0) (97.4) (106.4) (100.2) (100.0)
9,541,352 10,026,752 7,241,977 7,912,882 8,796,032 10,035,019 10,837,131 12,455,506 12,448,752 10,822,529
(105.5) (105.1) (72.2) (109.3) (111.2) (114.1) (108.0) (114.9) (99.9) (86.9)
Source: Ministry of Finance customs import records
Value
Tyres
Passenger car tyres
Value
Tyres
Value
Value
Tyres
Value
Tyres
Value
Tyres
Total
Tubes
Others
Motorcycle tyres
Commercial vehicle tyres