Type the document titleturbo30.qnop.net/~humidtro/wp-content/u… · Web view · 2014-05-12MoFA....
59
Technical Report Sustainable intensification of cereal-based farming systems in the Guinea-Sudano-Savanna of West Africa 01 October 2013 to 31 March 2014 Submitted to: United States Agency for International Development (USAID) April 2014 Contact Person: Dr Irmgard Hoeschle-Zeledon Project Coordinator [email protected]
Transcript of Type the document titleturbo30.qnop.net/~humidtro/wp-content/u… · Web view · 2014-05-12MoFA....

Technical Report
Sustainable intensification of cereal-based farming systems in the Guinea-Sudano-Savanna of West Africa
01 October 2013 to 31 March 2014
Submitted to:United States Agency for International Development (USAID)
April 2014
Contact Person:Dr Irmgard Hoeschle-Zeledon
Project [email protected]
www.africa-rising.net

The Africa Research In Sustainable Intensification for the Next Generation (Africa RISING) program comprises three research-for-development projects supported by the United States Agency for International Development as part of the U.S. government’s Feed the Future initiative.
Through action research and development partnerships, Africa RISING will create opportunities for smallholder farm households to move out of hunger and poverty through sustainably intensified farming systems that improve food, nutrition, and income security, particularly for women and children, and conserve or enhance the natural resource base.
The three projects are led by the International Institute of Tropical Agriculture (in West Africa and East and Southern Africa) and the International Livestock Research Institute (in the Ethiopian Highlands). The International Food Policy Research Institute leads an associated project on monitoring, evaluation and impact assessment.
This document is licensed for use under a Creative Commons Attribution-Noncommercial-Share Alike 3.0 Unported License
This document was made possible with support from the American people delivered through the United States Agency for International Development (USAID) as part of the US Government’s Feed the Future Initiative. The contents are the responsibility of the producing organization and do not necessarily reflect the opinion of USAID or the U.S. Government.

Contents
Partners
Summary
1 Introduction1.1 Africa RISING Program1.2 Africa RISING in West Africa1.2.1 Implementation strategy
2 Achievements during the reporting period2.1 Situation Analysis (Research Output 1)2.1.1 Community mobilization2.1.2 Farming systems analysis2.1.3 Baseline surveys2.1.3.1 Household nutrition2.1.3.2 Nutritional status of children2.1.3.3 Ruminant feed resources2.1.3.4 Rural pig and poultry production2.1.3.5 Pearl millet production systems
2.2 Integrated Systems Improvement (Research Output 2)2.2.1 Livestock systems2.2.1.1 Improved poultry housing
2.2.2 Ecological intensification of cereal-legume systems2.2.2.1 Maize: maturity type and nitrogen fertilizer rates2.2.2.2 Cowpea: variety and integrated soil fertility and pest management2.2.2.3 Soybean: variety and integrated soil fertility management
2.2.3 Genetic intensification of cereal-legume-vegetable systems2.2.3.1 Medium-maturing and dual-purpose cowpea2.2.3.2 Early- and late-maturing soybean 2.2.3.3 Aflatoxin resistant groundnuts 2.2.3.4 Sorghum hybrids2.2.3.5 Vegetables
2.2.4 Seed production
2.3 Scaling and delivery (Research Output 3)
2.4 Capacity building and knowledge exchange
3 Project implementation issues
4 Presentations and publications
Appendices

Partners
AMASSA Afrique Verte, MaliAMEDD Association Malienne d’Eveil et de Developpement Durable, Mali ARI Animal Research Institute, GhanaAVRDC The World Vegetable CenterCBOs Community-based Organizations, GhanaCIAT International Center for Tropical AgricultureCMDT Compagnie Malienne de Developpement des Textiles, Mali
Summary
Implemented work and achievements for the period October 2013 to March 2014 for the Africa RISING project in Ghana and Mali are reported. Surveys to collect baseline data for farming systems analysis, household nutrition, nutritional status of children, pig and poultry production, and pearl millet cropping systems were completed. Data were analyzed and reported. Farmer-participatory livestock and crop trials initiated during the first or second year of the project ended during the period. Data were analyzed and reports written. The field trials identified improved housing for backyard poultry, and agronomic management practices and cereal (maize and sorghum, and millet), legume (soybean and cowpea) and vegetable varieties for intensive crop production. Modeling and Geographic Information Systems and remote sensing technologies will be used to extrapolate results from the field/plot level activities to wider recommendation domains and larger scales using modeling and GIS and remote sensing techniques. Quality seeds of cereals, legumes and vegetables were produced for multiplication and dissemination to farmers and future project activities. Group and individual training were conducted to strengthen the capacity of farmers and researchers and development partners. Project outputs were disseminated through farmers’ field days, and farmer field schools, exchange visits and video shows. Meetings of stakeholders, Project Steering Committee and Program Coordination Team meetings were organized during the period.
1 Introduction
1.1 Africa RISING ProgramAs part of the Feed the Future Initiative, the United States Agency for International Development (USAID) is supporting an innovative multi-stakeholder agricultural research program, the Africa Research in Sustainable Intensification for the Next Generation (Africa RISING). The program’s main objective is to identify and validate scalable options for sustainable intensification of key African farming systems to increase food production and improve livelihoods of smallholder farmers and at the same time conserve or improve the natural resource base.Africa RISING is a three-in-one, five-year research program launched in 2011. It brings together a wide range of research and development partners from the CGIAR and the national agricultural research and extension systems (NARES), farmers, input and output dealers, and policy makers to develop management practices and technology combinations that use the farming systems research and extension approaches to better integrate crops (cereals, legumes and vegetables), livestock (including poultry), and trees and shrubs in mixed-farming systems with the aim of improving whole-farm productivity, improve nutrition, incomes of small-farm families without degrading the environment. It will also develop innovations that effectively link farmers to markets and input suppliers.
The three projects are: Sustainable intensification of crop-livestock mixed farming systems in the Guinea-Sudan-
Savanna Zone of West Africa – led by the International Institute of Tropical Agriculture (IITA), Sustainable intensification of crop-livestock integrated farming systems in the Ethiopian
highlands – led by the International Livestock Research Institute (ILRI), and Sustainable intensification of cereal-legume-livestock integrated farming systems in East and
Southern Africa – led by IITA.The International Food Policy Research Institute (IFPRI) is responsible for monitoring, evaluation, and impact assessment across all three projects.
The program is organized around four research outputs that are logically linked in time and space, namely:1. Situation Analysis and Program-wide Synthesis2. Integrated Systems Improvement3. Scaling and Delivery of Integrated Innovation4. Integrated Monitoring and Evaluation
The first research output covers the activities that are necessary to ensure that project activities are able to characterize and stratify target communities effectively so that promising interventions are identified and inappropriate interventions rejected. The second is delivered via a broad approach of participatory technology development and/or identification. This requires projects to allow for the identification of existing sound practices within communities that might be more widely propagated, the adaptation of these and other exogenous innovations, and the more effective combination of innovations from multiple sources. The first two outputs will generate integrated technology combinations that are more effectively targeted on farmer’s real development needs. This third output recognizes that, even where such technology combinations can be identified, the approaches used for scaling them out may not always be effective and seeks to redress this shortcoming. The fourth output, which relates to monitoring adoption, farmer preferences, and assessing economic and environmental impact of the project activities, is the responsibility of IFPRI.
1.2 Africa RISING in West AfricaAfrica RISING is being implemented in 25 intervention communities in the three northern regions of Ghana (Fig. 1), and 10 villages in the Bougouni-Yanfolila and Koutiala districts of the Sikasso Region in southern Mali (Fig. 2). It is intended to result in spillover effects to other similar agro-ecological zones.The farming systems in the region are dominated by small-scale, resource-poor farmers whose livelihoods depend on rain-fed crop, livestock, and croplivestock farming systems. Main staple crops are cereals (maize, rice, sorghum, pearl millet), legumes (groundnut, cowpea, soybean, Bambara nut, pigeon pea), and vegetables (roselle, okra, pepper onion, garden egg, tomato, amaranths, pumpkin). The cereals are either grown in pure stands or intercropped/rotated with the legumes and a variety of vegetables. Crops yields on farmers’ fields are generally poor due to low and variable rainfall, drought, low and declining soil fertility, use of low yielding varieties, lack of quality seed of improved crop varieties and land preparation equipment, high cost of inputs and postharvest losses, labour constraints that lead to poor growing conditions (late sowing, sub-optimal plant populations, inadequate control of weeds, Striga, pests and diseases), and low use of organic or mineral fertilizers.Cattle, sheep, goats, pigs, chicken, guinea fowl, turkeys, and ducks are reared for meat, milk, land preparation, transport, manure, and cash. The animals are mostly managed under extensive and semi-

intensive systems with limited feed, shelter, health care, and breeding management. Productivity of the animals is low due to inappropriate husbandry (feeding, health care, housing, and breeding) practices that result in high mortality rates. Farmers have limited access to veterinary services, and improved livestock breeds. In general, the crop and livestock enterprises are weakly integrated.Diets of most rural poor farm-families are often dominated by the intake of basic staple foods (e.g., maize, rice, millet, and sorghum) which are usually deficient in micronutrients such as vitamin A, iron, and zinc needed to prevent malnutrition. The nutritional status of most farm households, especially pregnant women, breastfeeding mothers, and children below 24 months of age, is therefore poor, leading to chronic malnutrition linked to low income, unsuitable food processing and feeding practices, and iron deficiency. Farmers have limited access to input and output markets. Enabling institutions and policies are also lacking. Ddue to inadequacies of traditional promotional and scaling-up/out pathways, there is a large, unmet demand for information and technology, especially by women. This has led to low adoption of improved technologies and best practices by farmers to reduce food insecurity, poverty, and natural resource degradation.
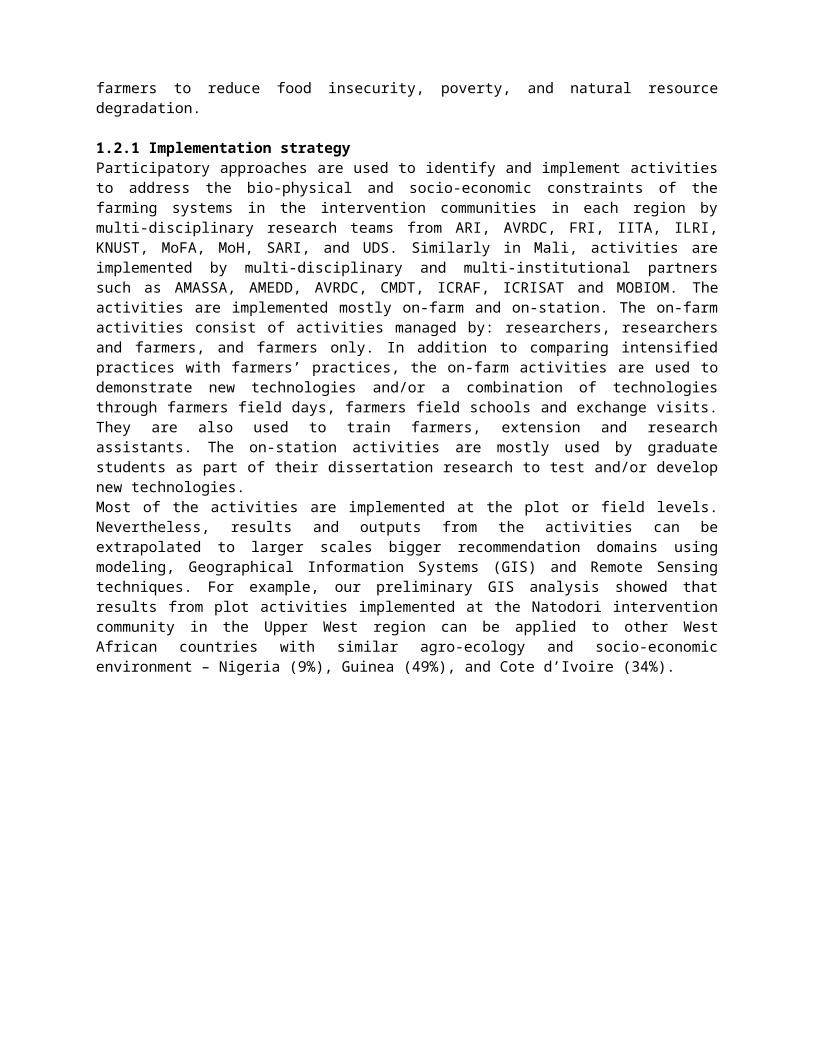
1.2.1 Implementation strategyParticipatory approaches are used to identify and implement activities to address the bio-physical and socio-economic constraints of the farming systems in the intervention communities in each region by multi-disciplinary research teams from ARI, AVRDC, FRI, IITA, ILRI, KNUST, MoFA, MoH, SARI, and UDS. Similarly in Mali, activities are implemented by multi-disciplinary and multi-institutional partners such as AMASSA, AMEDD, AVRDC, CMDT, ICRAF, ICRISAT and MOBIOM. The activities are implemented mostly on-farm and on-station. The on-farm activities consist of activities managed by: researchers, researchers and farmers, and farmers only. In addition to comparing intensified practices with farmers’ practices, the on-farm activities are used to demonstrate new technologies and/or a combination of technologies through farmers field days, farmers field schools and exchange visits. They are also used to train farmers, extension and research assistants. The on-station activities are mostly used by graduate students as part of their dissertation research to test and/or develop new technologies.Most of the activities are implemented at the plot or field levels. Nevertheless, results and outputs from the activities can be extrapolated to larger scales bigger recommendation domains using modeling, Geographical Information Systems (GIS) and Remote Sensing techniques. For example, our preliminary GIS analysis showed that results from plot activities implemented at the Natodori intervention community in the Upper West region can be applied to other West African countries with similar agro-ecology and socio-economic environment – Nigeria (9%), Guinea (49%), and Cote d’Ivoire (34%).

Figure 1. Africa RISING intervention communities in Ghana.
Figure 2. Africa RISING intervention villages in Mali.
2 Achievements
2.1 Situation Analysis (Research Output 1)

The baseline surveys in Mali and Ghana to be conducted by IFPRI are yet to be implemented. Therefore, the interdisciplinary research teams initiated own surveys to collect baseline data necessary for their research.
2.1.1 Community mobilization in GhanaCommunity mobilization and sensitization continued during the reporting period. The list of farmers or households interested in the project activities was revised in each community. A total of 1783 farmers were interested, 41% of whom are females (Tab. 1).
Table 1. Revised list of interested farmers in Africa RISING intervention communities in Ghana, March 2013Region Communities Female Male TotalNorthern 10 220 396 616Upper East 5 219 328 547Upper West 10 295 325 620Grand Total 25 734 1049 1783
2.1.2 Farming systems analysisThe first phase of a farming systems analysis in Ghana (Northern, Upper West and Upper East regions) and Mali (Bougouni and Koutiala areas) was completed by the Department of Plant Sciences of Wageningen University and Research Centre (The Netherlands) during the period. The objective of this first phase was to characterize farming systems in project intervention areas, to make farm typologies, and to find constraints and entry points for sustainable intensification and innovation at the farm level. It comprised four steps:
1. Rapid characterization of farming systems by a survey.2. Detailed diagnosis of a representative subset of farms through a detailed survey.3. Model-based exploration of trade-offs and synergies within the farms, which results in
set of alternative farm configurations that perform different in productive, economic and environmental performance indicators, and
4. Selection of a desirable farm configuration, as identified by the farmer and other relevant stakeholders on the basis of the performance indicators, for fine-tuning and redesigning the case study farm.
The steps 2, 3 and 4 can yield suggestions and entry points for farming systems adjustments. Steps 3 and 4 were performed for Ghana case study. The detail results have been reported (Timler et al., 2014). (https://dl.dropboxusercontent.com/u/17758665/AR/Report/2014_03_Report_WUR.doc).
The results showed a large variation in farm size and endowment in both countries. Farms were grouped into farm types on the basis of structural and functional farm characteristics that reflect their size (surface area and livestock density), production orientation (subsistence or market) and income sources (on and/or off farm).In most regions the farmers cultivated 2-4 crops. Cereals (maize, sorghum and millet) and legumes (groundnut, cowpea and soybean) were the most important crops In the Koutiala district in Mali also cotton, sorghum and millet occupied large areas. The crop yields reported by the farmers were extremely variable and often very low.

Livestock numbers per farm differed greatly between the intervention communities with each country. Key livestock species kept were cattle, sheep, goats, domestic chicken and guinea fowls. Generally, livestock management was sub-optimal.The stated labour inputs per unit of area were variable but tended to decline with farm size. The percentage of female-headed households differed strongly between regions and was as low as 1-2% in the Northern region of Ghana, while in the Upper West and Upper East regions in Ghana on average 40-50% of the households were female-headed.
The main constraints and critical points to sustainable intensification and innovation that were identified:
● Household level farm productivity and on-farm income generation and returns to labor are low; in various cases food availability is insufficient during parts of the year.
● Women representation in decision making and ownership is often limited, although large differences between regions exist. Women indicated that the limited availability of food, clean water, options for sanitation and possibilities for education are important constraining factors. Moreover, limitations in opportunities for post-harvest storage and processing of farm products were reported.
● Limited or untimely availability of resources like seeds and fertilizers. Lack of improved crop varieties and animal breeds that are more productive or better adapted (e.g. early maturing and drought-tolerant).
● Crop yields were low. Combined with the small farm areas and seasonality this resulted in food shortages in parts of the year. On the other hand, for cash crops the low productivity led to small volumes of produce for sales and income generation. Moreover, post-harvest storage losses are large in some cases.
● Problems with pest and weed control, in particular Striga is an important issue.● The management, storage and conservation of crop residues and animal manures were
generally poor. As a consequence, the losses of organic matter and nutrients were probably large and availability of these organic resources for soil improvement was limited, which was reflected in low soil organic matter contents and soil fertility.
● The feeding of livestock was sub-optimal. Larger animals graze crop stubbles and rely on open and common areas for grazing. The management of grazing areas is often inadequate and availability of watering points can be limiting. Diseases are reported to affect animal performance negatively. As a result, the productivity levels of all types of animals kept on the farms (mainly cattle, goats, sheep, chickens and doves) was low.
● The access to training and advice on land preparation, crop cultivation, animal husbandry and farm management is often limited. In particular women indicated that possibilities for education were lacking.
● Farmers often reported to be challenged by climatic conditions. These issues ranged from overall unfavorable conditions for agriculture, to variability and unpredictability, and trends of changes in climate.
The following entry points for sustainable intensification and innovation at farm level identified and analyzed included:
● Encourage seed saving and selection, possibly as a joint effort within the community, focusing on collecting the best seeds. This could serve as a backup if no seeds are available in the market before planting, or when prices are high.
● Improved water management, for instance through water harvesting to enhance the availability of clean water for human consumption and irrigation of (vegetable) crops.
● Diversifying cropping, for instance by growing more vegetables, where collected water (see above) could be used. Increase the productivity and integration of legumes in rotations and by intercropping and double-up legume cultivation, which contributes to nitrogen availability. This could contribute to improved nutrition and possibly health, or generate an alternative income source and spread risks of crop failure and price volatility.
● Fencing of fields to allow better livestock and crop residue management. This can be implemented with artificial or natural fences. .
● Developing new strategies for pest and weed management, and Striga control.● Improved management of collected organic resources like manure and crop residues.
Manure can be stored anaerobically by covering with an impermeable sheet to reduce organic matter degradation, to avoid wash-out of nutrients in case of heavy rains, and to avoid exposure to air so that ammonia volatilization is prevented. Crop residues could be harvested in a less mature stage of development and stored (conserved) in an appropriate way to preserve their feeding quality.
● The role of livestock on farms could be strengthened. This could contribute to nutrient cycling, and the production of high-quality and high-value products.
● There is a strong need for education and training, and for the development of institutional arrangements and community-based organizations. These could support the development and implementation of many of the entry points mentioned above.
2.1.3 Baseline surveys2.1.3.1 Household nutrition A team of researchers from FRI, MoH and UDS led a survey on household nutrition. Five hundred and twenty two households from six intervention communities in the Northern (Cheyoli and Tibali), Upper West (Guo and Zuko) and Upper East (Bonia and Sabulungu) regions were interviewed. Data was collected on food consumption pattern, food frequency, dietary diversity, existing foods/food groups and their seasonal availability between October and November 2013. Green leaves of local vegetables were sampled from markets and farms in the Wa municipality and analyzed for micro-mineral (iron, copper, manganese and zinc) concentrations. Figure 3 shows food groups consumed by the households in the three regions. Consumption of milk, eggs and meat and meat products were very low. One reason for this is that, households preferred to sell their livestock and livestock products for cash to meet family needs, e.g., to pay health and education bills. Similarly, fruit consumption was below 20% in all the regions. Legume consumption was highest in Upper East region and was around 60%, but the frequency of consumption is important to ensure adequacy.

CerealsRoots & Tubers
VegetablesFruitsMeatEggs
Fish & SeafoodsLegumes
MilkOils
SweetsSpices
0 25 50 75 100 125
Upper West Upper East Northern
Percent of households consuming food type
Figure 3. Food groups and percent of households consuming food group
The micro-mineral concentrations in leaves of the traditional leafy vegetables varied among species (Tab. 2). The micro-mineral concentrations in some species were above the minimum requirements for humans, suggesting that promoting the consumption of the local leafy vegetables could improve dietary micro-mineral status in the communities. Research is warranted on integrated soil fertility management strategies to increase micro-mineral concentrations in the traditional leafy vegetables.
The food frequency results showed that 91.2% (Northern Region), 94% (Upper East Region) and 91% (Upper West Region) consumed soybeans less than 3 times a week, whilst more than 60% (64.4%-88.9%) of households also consumed cowpea less than 3 times a week. The mean dietary diversity score of 4.6 out of 12 food groups differed significantly across the three regions. A higher score will indicate adequate food diversification, and hence a higher tendency to meet nutrient requirements. The results suggest the need for nutritional interventions to promote the consumption of protein source foods, green leafy vegetables and fruits.
Table 2. Micro-mineral concentration (mg/kg) in fresh leaves of local leafy vegetables in Wa, 2013 Species Copper1 Iron Manganese ZincAmaranths 1.93±0.16de 54.02±6.34m 5.71±0.39st 5.87±0.88jz
Sorrel 2.29±0.01fg 23.47±2.54i 5.32±0.21st 0.69±0.09x
Bean 1.81±0.09cde 50.61±0.93m 12.03±0.62v 4.48±0.28jyz
Bitter 1.59±0.04abc 34.94±0.13k 13.33±0.97v 9.58±0.57b
Cassava 2.01±0.26ef 34.71±6.64k 20.31±1.01w 2.40±0.25c
Tossa 1.46±0.17ab 71.83±4.33p 5.61±0.06st 4.26±0.89yz
Pumpkin 1.64±0.78bcd 70.63±1.51p 9.00±0.09u 9.38±1.31b

1Means in a column followed by different letter(s) differ (P<0.05)
At present, most families take legumes in the form of dawadawa which is a condiment, and in isolated cases as gable, tubani and khebab. The farm-families were willing to take the needed protein from legumes, particularly soybeans if they are taught to utilize it and are given the necessary processing equipment. This observation stresses the need for a value-chain approach for implementing project activities.
2.1.3.2 Nutritional status of childrenAnthropometric data was collected on children up to 5 years in each household surveyed. The children were weighed and their heights were taken for the determination of their nutritional status. The World Health Organization (WHO) Anthro software was used to convert weight, height and age of child (months) into weight for age z score (WAZ), weight for height z score (WHZ) and height for age z score (HAZ). As per the agreed global standards, the following categories were used for the z-scores: Normal(Well nourished) = -1 to <0; Marginally under-weight/wasted/stunted or mildly malnourished =-2< to < -1; Moderately under-weight/ wasted/stunted (Moderately Malnourished) =-3 < to < -2; Severely under-weight/wasted/stunted (Severely Malnourished)= < -3.
About 64% of children of 0-60 months were nourished in the three regions (Tab. 3). More than 30% were marginally malnourished, whilst about 5% were moderately malnourished. The extent of mal-nutrition varied among the intervention communities (Fig. 4). It was relatively higher in the communities in the Northern Region than those in the Upper West and Upper East Regions. The results suggest that rigorous nutrition communication and promotion should accompany interventions aimed at improving household food security and incomes.
Table 3. Nutritional status of children aged 0-60 months at six Africa RISING intervention communities in Ghana, 2013
Moderately malnourished Marginally malnourished NourishedRegion N (%) N (%) N (%)Northern (n=198) 21 (10.6) 80 (40.4) 97 (49.0)Upper West (n=148) 2 (1.4) 31 (20.9) 115 (77.7)Upper East (n=146) 2 (1.4) 40 (27.4) 104 (71.2)Total (n=492) 25 (5.1) 151 (30.7) 316 (64.2)

Chayoli Tibali Zanko Goli Bonia Sambulgu0
20
40
60
80
Malnourished Nourished
Intervention community
Perce
ntage
(%)
Figure 4. Nutritional status of children aged 0-60 months at intervention communities in the Northern (Chayoli, Tibali), Upper West (Zanko, Goli) and Upper East (Bonia, Sambulgu) Regions in Ghana, 2013
Table 4 presents the levels of wasting, stunting and underweight among the children in the three regions. Averaged across regions, 72%, 43% and 45% of children aged 0-60 months were not wasted, stunted and under-weight, respectively.
2.1.3.3 Ruminant feed resourcesThe International Livestock Research Institute (ILRI) led a team of researchers from ARI, UDS, MOFA and KNUST in Ghana, and from ICRISAT, IER and AMEED in Mali to document existing and potential feed resources, current use and cost, and assessed gaps with respect to demands for ruminant (cattle, sheep and goats) production using the Feed Assessment Tool (FEAST).
Table 5 presents constraints and opportunities for ruminant production in Ghana. Grazing and crop residues were identified as the key feed resources (Fig. 5).
A similar study in six villages at Koutiala and Bougouni/Yanfolila in Mali showed that the key constraints to ruminant production were feed shortage, disease, increasing restricted livestock mobility which hinders access to natural pasture, and housing. Therefore, livestock-related interventions should be multi-faceted including feed, animal health and housing. Grazing natural pasture accounted for 40-55% of the diet of ruminants (Fig. 6). Crop residues accounted for 20-35%, and naturally occurring and collected fodder accounted for 10-15% of the ruminants’ diet.

Table 4.Classification of children at the Africa RISING intervention communities in the Northern (NR), Upper West (UWR) and Upper East (UER) Regions of Ghana using weight by height (WHZ, wasted), height by age (HAZ, stunted) and weight by age (WAZ, under-weight) z-scores, 2013
ClassificationSeverely Moderately Marginally Normal
Region N (%) N (%) N (%) N (%)
Wasted NR (n=202) 12 (5.9) 15 (7.4) 46 (22.8) 129 (63.9)
(WHZ) UWR (n=150) 0 (0.0) 7 (4.7) 20 (13.3) 123 (82.0)UER (n=147) 1 (0.7) 6 (4.1) 31 (21.1) 109 (74.1)Total (n=499) 13 (2.6) 28 (5.6) 97 (19.4) 361 (72.3)
Stunted NR (n=201) 19 (9.5) 63 (31.3) 56 (27.9) 63 (31.3)
(HAZ) UWR (n=149) 3 (2.0) 19 (12.8) 46 (30.9) 81 (54.4)UER (n=146) 5 (3.4) 23 (15.8) 48 (32.9) 70 (47.9)Total (N=496) 27 (5.4) 105 (21.2) 150 (30.2) 214 (43.1)
Underweight NR (n=199) 18 (9.0) 35 (17.6) 77 (38.7) 69 (34.7)
(WAZ) UWR (n=148) 1 (0.7) 14 (9.5) 45 (30.4) 88 (59.5)UER (n=146) 1 (0.7) 18 (12.3) 61 (41.8) 66 (45.2)
Total (N=493) 20 (4.1) 67 (13.6) 183 (37.1) 223 (45.2)
Table 5. Sheep and goat production constraints and suggested solutions in GhanaMain problems Suggested solutions1. Poor housing Support in cash for housing construction or housing package2. High disease and mortality Confinement of animals to reduce exposure and better access to
veterinary services3. Lack of improved breeds Better management of the local breeds, buying the improved
breeds and the supply of these breeds in the form of support.4. Conflict with crops farmers Confinement and herding of the flock5. Inadequate feed Collection and conservation of crops residue; subsidized
concentrate feeds and training in better feeding practices 6 Low prices offered by marketing agents and processors for animals
Formation of farmer groups to negotiate good prices for members; and weighing of animals and sell according to animals’ weight.
8. Lack water in the dry season Construction of dug-outs and small reservoirs and supply of materials for rain water harvesting.
9. Access to credit Formation of farmers groups and cooperative to facilitate access to credit and external support.
10. High cost of veterinary drags Government subsidy and support from NGOs in form animal health service package.
Common crop residues in the study sites included cereal (maize, sorghum, millet) straw, legume (groundnut and cowpea) hay, cereal (maize, sorghum, millet and rice) bran, and cotton residues/byproducts (cotton grain residue, cotton seed cake). Availability and quality of these crop residues varied with seasons. The large part of the crop residues are normally fed to the household

animals and or sold, particularly groundnut haulm, while a small proportion was left on the field and burnt to improve soil fertility according to the respondents.
Based on area of land cultivated, majority of the farmers were in small to medium categories (Tab. 6). Nearly all the households interviewed owned at least one draught animal or oxen which could be attributed to need for animal power for cotton production (Tab. 7). In view of the importance of draught animal to the crop-livestock systems in Koutiala and Bougouni/Yanfolila, livestock interventions should address feeding strategies to improve the body condition of oxen in the late dry season/early wet season for field preparation. All households interviewed owned 5-25 small ruminants (sheep and goat) per household. The small ruminants are ready source of cash to meet emergency household need. Therefore, interventions to improve small ruminant production will be popular in the study sites.
Table 6. Classification of farmers based on land ownership in Africa RISING districts in Mali, 2013Bougouni -Yanfolila Koutiala
Category of farmers Land size (ha) % households Land size (ha) % householdsLandless 0 0 0 0Small <8 44.44 <12 41.67Medium 8-13 30.56 12-27 36.11Large >13 25 >27 22.22
Table 7. Livestock ownership in Africa RISING communities in Mali, 2013 Animal species Category Bougouni-Yanfolila Koutiala
Cattle
Lactating cow 2.59±0.69a 1.26±0.33b
Non lactating cow 3.91±1.21 a 2.78±1.38 a
Bulls 0.89±0.27 a 1.17±0.60 b
Draught oxen 1.81±0.31 a 2.35±0.29 a
Calves 1.26±0.68 a 1.08±0.33 b
Sheep Sheep 0.27±0.06 a 0.72±0.16 b
Goat Goat 0.67±0.15 a 0.84±0.13 a
Donkey Donkey 0.50±0.08 a 1.36±0.16 b
Poultry Poultry 0.13±0.02 a 0.22±0.03 b
Pig Pig 0.01±0.01 a 0.21±0.13 b
aMeans in a column followed by different letter differ (P<0.05).

a) Bonia, Upper East Region
Crop residues13%
Grazing67%
Naturally occuring & collected forage
11%
Purchased10%
b) Tibali, Northern Region
Crop residues22%
Cultivated fodder5%
Grazing50%
Naturally occuring & collected forage
18%
Purchased5%
Figure 5. Sources of ruminant feed resources in intervention communities in the Upper East (a) and Northern (b)Regions of Ghana, 2013
January
February
Marc
h April May Ju
neJuly
August
Septem
ber
October
November
December
0102030405060708090
100
0
1
2
3
4
5
6
Available Feed Resources: Bougouni-Yanfolila
Concentrates Crop residues Grazing Green forage Legume residues Others Cereal residues Rainfall Pattern
Avail
ablit
y

Figure 6. Feed resources availability in Bougouni-Yanfolila and Koutiala, Mali, 2013
2.1.3.4 Rural pig and poultry production
0102030405060708090
100
0
1
2
3
4
5
6
Available Feed Resources: Bougouni-Yanfolila
Concentrates Crop residues Grazing Green forage Legume residues Others Cereal residues Rainfall Pattern
Avai
labl
ity
January
February
Marc
h April May Ju
neJuly
August
Septem
ber
October
November
December
0102030405060708090
100
0
1
2
3
4
5
6
Available Feed Resources: Koutiala
Concentrates Grazing Green forage Legume residuesOthers Cereal residues Rainfall Pattern
Avail
ablit
y

Two separate surveys were conducted by the University for Development Studies and the Kwame Nkrumah University of Science and Technology, respectively, to collect baseline information on the rural pig and poultry enterprise in selected Africa RISING intervention communities in Ghana. The objective was to determine major factors that affect production of rural pigs and poultry and find prospects for intensification and integration.
Table 8 presents a summary of the results from the pig survey involving 114 households. Farmers had their starter stock from their neighbors. The major source of finance for farmers was from the sale of pigs. Farmers largely described housing, health and inadequate feed as major challenges. Mainly mud houses roofed with thatch are provided for pigs. According to respondents, there was a ready market for pigs. They sold mostly bigger/older pigs as and when the need arose. Middlemen, pito brewers and butchers were the main buyers.
Generally, respondents were not trained in pig production and records were not kept. There is need to develop affordable housing, formulate adequate but cheap diets, put in place good preventive health regimes, and empower farmers with adequate knowledge and skills to facilitate integration of more intensive pig production with the other aspects of the farmers’ agricultural enterprises.
The baseline survey of 180 households showed that domestic chickens and guinea fowls kept under semi-intensive management are the dominant species (Tab. 9). Most farmers provided mud-houses for their birds. Mating is uncontrolled, and brooding is mostly by the hens. Live birds are sold to generate cash for food, school fees or health bills. Key constraints to intensification of the poultry production system were: pests and diseases, high keet/chick mortality, predation, lack of technical knowhow and feed shortages.
Ashanti Black Pig tethered. Photo: A. Larbi
2.1.3.5 Pearl millet cropping systemsAs part of understanding the cereal-legume cropping systems at the Africa RISING intervention communities, focused group discussions were organized in five communities (Nyangua, Samboligo, Gia, Bonia and Tekuru) in the Upper East Region by ICRISAT and SARI research teams. A total of 85 respondents (26 women and 59 men) participated.
The discussions revealed various cereal-cereal and cereal-legume intercropping systems practiced by farmers in the Upper East Region (Tab. 10). The general practice is to interplant the component crops on the same row. Millet (especially early millet) is often planted first with the early rains before the other

crops are planted later in a relay cropping system. Very little is known about improved and quality seed as a factor for yield increases. Therefore, no conscious effort is made at acquiring and using them. Productivity of the cereal-cereal systems has not been documented, meaning that farming systems research is required to intensify the millet-sorghum-legume cropping systems.
Table 8. Characteristics of the rural pig farming in the Africa RISING intervention communities in Ghana, 2013 Region (% of respondents)
Breeds Upper East Upper West Northern MeanExotic 14.6 8.8 22.2 15Local 78.2 82.5 77.8 80Crosses 6.2 1.8 0 3
Production systemIntensive 27.1 7 88.9 41Semi-intensive 64.6 77.2 11.1 51Extensive 8.3 8.8 0 6
HousingEnclosed structures 97.9 68.4 100 89Confinement 22.9 5.3 100 43Partial confinement 64.6 70.2 0 45
Feeding systemsComplete feed only 23 24.6 100 49Scavenging+Supplement 35.4 64.9 0 33Scavenging only 8.3 1.8 0 3
Breeding systemUncontrolled mating 100 100 0 67Controlled mating 0 0 100 33
Main health constraintsInternal parasites 72.9 36.8 100 70External parasites 2.1 1.8 0 1African Swine Fever 2.1 5.3 11.1 6Diarrhoea 2.1 0 0 1
MarketingSale 66.5 70.1 88.9 75No sale 33.5 29.9 11.1 25
Market channelsMiddlemen 47.9 35.1 77.8 54Pito brewers 4.2 3.5 0 3Butchers 35.6 35.2 66.7 46
ProfitabilityProfitable 87.5 73.7 100 87Not profitable 12.5 26.3 0 13
Table 9. Characteristics of the rural poultry farming in the Africa RISING intervention communities in

Ghana, 2013 Region (% of respondents)
Item UER UWR NR MeanSpeciesGuinea fowls 100 76.3 64.3 80.2Chickens 100 96.6 91.4 96.1Turkeys 0 6.8 0 2.3Ducks 19.6 15.3 4.3 13.1
Production systemSemi-intensive 100 94.9 97.1 97.3Free Range 0 5.1 2.9 2.7
HousingMud 78.4 96.6 87.2 87.4Wooden 13.7 0 11.4 8.4Others 7.8 0 1.4 3.1
Feeding systemsGrains + scavenging 98 100 82.9 93.6Feed + scavenging 0 0 14.3 4.8Scavenging only 2 0 2.9 1.6
Breeding systemUncontrolled mating 100 100 100 100Incub. & brood. by hen 100 100 100 100
Production constraintPests and diseases 100 91.5 85.7 92.4High keet mortality 78.4 69.5 68.6 72.2Predation 82.4 69.5 61.4 71.1Lack of knowledge 60.8 62.7 30 51.2Feed shortage 56.9 62.7 25.7 48.4
MarketingSale 94.1 89.8 97.1 93.7No sale 5.9 10.2 2.9 6.3
Income sourceIncome (birds) 96.1 84.7 50 76.9Income (eggs) 3.9 5.1 44.3 17.8
Use of cash from saleBuying of food 86.3 79.7 78.6 81.5Paying of schools fees 72.5 54.2 70 65.6Health-care 35.3 49.2 24.3 36.3
Table 10. Main cereal-legume and cereal-cereal cropping systems in the Upper East Region in Ghana, 2013Community First Crop Second CropNyangua Maize SorghumNyangua Millet CowpeaGia Sorghum MaizeGia Early millet Sorghum

Gia Early millet Late milletGia Maize Late milletGia Groundnut SorghumTekuru Groundnut Late milletTekuru Late millet CowpeaTekuru Maize Late milletSamboligo Early millet Sorghum (cowpea)Samboligo Early millet Late millet/sorghumSamboligo Late millet GroundnutBonia Early millet Late milletBonia Maize Late milletBonia Maize GroundnutBonia Groundnut Late millet (beans)
2.2 Integrated systems improvement (Research Output 2)2.2.1 Livestock systems2.2.2.1 Improved poultry housingThe University for Development Studies conducted a study in Bongo District of the Upper East Region of Ghana to assess effects of improved housing on performance of chickens. Ten farmers (7 men and 3 women) were purposively sampled for the study. Three hundred male chicks (i.e. non-commercial strain) at 4 weeks of age were randomly allotted into 20 groups of 15 birds per group and assigned to two treatments using a randomized complete block design; with a farmer serving as a block. Treatment 1 or control was the traditional housing (i.e. partial confinement) and birds managed under the free-range system. Treatment 2 was the improved housing (i.e. confinement) and birds managed under the intensive system. Growth and mortality data were collected.
The housed birds were 43.5% heavier than their free-range counterparts at 15 weeks of age (Tab. 11). This is because the housed birds had access to balanced diet ad libitum unlike their free-range counterparts. The latter group had to scavenge for poor quality feed on the range with occasional handful of grains supplied by the farmers. Mortality of housed birds was 19.5% lower than the control group. This could be due to better protection of the birds housed from adverse environmental conditions such as predation, accidents and contact with other diseased birds in the community. Economic evaluation showed that it was 46.2% more profitable to confine birds. Intensive rearing of poultry has been recognized as the surest way to improve productivity and profitability at the village. However, this may require high initial capital outlay, which is often beyond the reach of most rural farmers. Thus any intervention in that respect must be combined with facilitation of access to financial support to farmers.
Table 11. Effect of housing on growth performance of male chickens (4-15 weeks of age) in Ghana, 2013Parameter Housed birds
Mean (±sd)Free-range birdsMean (±sd)
P-value
Initial live weight (g/bird) 230 (0.0) 230(0.0) -Final live weight at 15 weeks of age (g/bird) 865 (124) 489 (96) <0.001

Feed intake (kg/bird) 2.2 Not determined -Mortality (%) 6.6 (4.81) 8.2 (4.78) 0.465Feed cost (GhS/bird) 1.80 Not determined -
2.2.2 Ecological intensification of cereal legume systems2.2.2.1 Maize: maturity type and nitrogen fertilizer ratesResponses of extra-early (80-85 days), early (85-100 days) and medium (100-110 days) maturing maize varieties to different nitrogen levels were evaluated in a multi-locational trial for the second year. The trials were established on station at Manga (UER), Wa and Tumu (UWR), and Damongo and Nyankpala (NR). For each maturity group, a split-plot design with four replications was used. Main-plots were five maize varieties and sub-plots were five nitrogen fertilizer rates (0, 40, 80, 120 and 160kg/ha N). Each 6-row sub-plot measured 5.0m x 4.5m. Nitrogen was applied as urea in two equal doses. All plots received, 60kg/ha P2O5 as Triple Super Phosphate (TSP) and 60kg/ha K2O as Muriate of Potash (MOP) at planting. Days to tasseling, plant height and grain yield and 1000-grain weight were recorded. In all locations, the maize variety by N rate interaction was not significant for all the parameters recorded for all the maturity types. Maize variety significantly influenced grain yield at Manga and Damongo, and nitrogen use efficiency (NUE) at Wa and Manga (Tab. 12). For each maturity group and at each location, maize had highest NUE at 40kg/ha N and the least at 160kg/ha N. Varietal differences in grain yield could be due partly to differences in days to anthesis and tasseling, plant height, 1000-grain weight, NUE.
Grain yield of the three maize maturity types generally increased non-linearly in response to increasing nitrogen rates in all the locations (Fig. 7). The quadratic responses may be partly due to the observed reduction in nitrogen use efficiency and water productivity as the rate of nitrogen fertilizer increased from 0 to 160kg/ha N. Overall, increase in N rates beyond 80kg/ha did not result in significant increases in grain yield in most sites. Nitrogen fertilizer rates between 80 to 120kg/ha may therefore be ideal to optimize maize grain yields.
Table 12. Grain yield and nitrogen use efficiency of extra-early maturing maize varieties at Wa and Manga during the 2013 cropping season (values are means of 3 replications summed over 5 fertilizer rates)Region Site Variety Grain yield (kg/ha) NUE (kg/kg N)Upper West Wa 99 TZEE Y STR 1147 8.4
TZEE W POP STR QPM C0 1492 13.7

2000 Syn EE W CO STR 1199 10.42004 TZEE W POP STR C4 1045 9.8Abontem 1278 11.5LSD (0.05) NS NS
Upper East Manga 99 TZEE Y STR 1180 11.9TZEE W POP STR QPM C0 1996 29.22000 Syn EE W CO STR 1756 26.22004 TZEE W POP STR C4 2349 33.9Abontem 2133 32.5LSD (0.05) 788 8.2
Northern Damongo 99 TZEE Y STR 2629 -TZEE W POP STR QPM 2304 -2000 Syn EE W C0 STR 3077 -TZEE W POP STR C4 2176 -Farmer’s Variety 2388 -LSD (0.05) 592 -
0 40 80 120 1600
1000
2000
3000
4000
f(x) = − 202.214285714286 x² + 1891.88571428571 x − 664.899999999999R² = 0.948671119334665
b. Extra-early maize:Nyankpala
Nitrogen fertilizer (kg/ha)
0 40 80 120 1600
600
1200
1800
f(x) = − 91.2857142857142 x² + 780.914285714285 x − 106.4R² = 0.925064290724368
a. Extra-early maize: Wa
Nitrogen fertilizer (kg/ha)
Grain
yield
(kg/h
a)

Figure 7. Responses of extra-early, early and medium-maturing maize varieties to nitrogen fertilizer rates, 2013
2.2.2.2 Cowpea: variety and integrated soil fertility and pest managementCowpea grain yield on farmers’ field is below 500kg/ha due to lack of improved cultivars, high incidence of diseases and pests, and inappropriate agronomic practices. Applying insecticides can control pests and increase grain and fodder yields. However, few farmers use insecticides because it is costly and excessive use of insecticides can harm the environment. Quantitative data on integrated soil fertility management effects on productivity of maize-cowpea rotations is limited.Planting date, insecticide and cowpea variety effects on grain yieldTrial 1 evaluated the effects of planting date, insecticide application and cowpea variety on grain yield using a split-split plot design with three replicates. Main-plots were two insecticide treatments (Fig. 8a, b), sub-plots were four planting dates (see legend in Fig. 8), and sub-sub plots were six cowpea cultivars
0 40 80 120 1600
1000
2000
3000
4000
5000f(x) = − 290.6536 x² + 2424.946 x − 411.21R² = 0.97303723267279
f. Medium maize: Nyankpala
Nitrogen fertilizer (kg/ha)
0 40 80 120 1600
1000
2000
3000
4000
f(x) = − 110.57143 x² + 1135.4286 x + 313.8R² = 0.896967385381535
e. Medium maize: Wa
Nitrogen fertilizer (kg/ha)
Grai
n yi
eld
(kg/
ha)
0 40 80 120 1600
500
1000
1500
2000
f(x) = − 129.5 x² + 1081.5 x − 530.6R² = 0.926064421068873
d. Early maize: Manga
Nitrogen fertilizer (kg/ha)
0 40 80 120 1600
1000
2000
3000
f(x) = − 156.107142857143 x² + 1210.59285714286 x − 154.6R² = 0.945180288304698
c. Early maize: Wa and Tumu
Nitrogen fertilizer (kg/ha)
Grain y
ield (kg
/ha)
0 40 80 120 1600
1000
2000
3000
4000
f(x) = − 202.214285714286 x² + 1891.88571428571 x − 664.899999999999R² = 0.948671119334665
b. Extra-early maize:Nyankpala
Nitrogen fertilizer (kg/ha)
0 40 80 120 1600
600
1200
1800
f(x) = − 91.2857142857142 x² + 780.914285714285 x − 106.4R² = 0.925064290724368
a. Extra-early maize: Wa
Nitrogen fertilizer (kg/ha)
Grai
n yi
eld
(kg/
ha)

(Fig. 8). The sub-sub-plots consisted of four rows; 5m long spaced 0.60m between rows and 0.20m between plants in a row.
In Trial 2, the effects of four insecticide regimes on grain yield of six cowpea varieties were compared using a split-plot design with three replications. Main-plots were four insecticide spraying regimes listed in Table 13. Sub-plots were cowpea varieties used in Trial 1. The sub-plots consisted of 4 rows 5m long spaced 0.60m between rows and 0.20m between plants in a row.
In both trials, agronomic (days to 50% flowering and maturity, number of pods per plant, number of seeds per pod, haulm and seed yields) and insect population data were collected from the two middle rows in each plot. Populations of thrips and Maruca vitrata were estimated from flower bud formation till 50% podding by picking 20 flowers in alcohol to the laboratory to count the insects. Populations of pod-sucking bugs were estimated by counting nymphs and adults. Pod damage by pod-sucking bugs and Maruca were estimated from a sub-sample of 100 pods after harvest.
Application of insecticide to control insect pest (Fig. 9b) resulted in significantly higher grain yields than no insecticide application (Fig. 9a). Grain yields were reduced significantly as planting was delayed from July to late August with crop either sprayed or not sprayed. Spraying cowpea with insecticide once, twice or trice during the growing season to control insect pests significantly increased grain yield in all cultivars (Fig. 9). It also reduced the population of insect pests and pod damage (Tab. 13).
The results suggest that cowpea farmers in the NR and UER should plant their crops between mid-July and early-August for better grain yields. Judicious and timely application of insecticide at flowering and full podding can provide adequate control of key pests. Varieties IT99K-573-1-1 and IT99K-573-3-2-1 have high potential for grain production in northern Ghana due to their resistance to Striga gesnerioides.
Table 13. Spraying regime effects on insect population and pod damage in cowpea, Ghana Insecticide spraying regime 4Pod %
sucking podbugs 4Thrips damage
No spraying 12.3 22.2 701One spray 15.1 20.1 442Two sprays 4.6 12.5 433Three sprays 1.5 6.7 38SED 1.93 3.92 6.9150% flowering (FPF)2Flower bud initiation (FBI) and early podding (EP)3FBI, FPF and FPF4Population of pod-sucking insects and thrips on 20 flowersSED: Standard error of difference

IT 99K-573-1-1
IT99K-573-2-1
Songotra
Padi Tuya
Bawutawuta
Farm Variety
0 200 400 600 800 1000 1200
a. no insecticide sprayLate-August Mid-August Late-July Mid-July
Grain yield (kg/ha)
IT 99K-573-1-1
IT99K-573-2-1
Songotra
Padi Tuya
Bawutawuta
Farm Variety
0 200 400 600 800 1000 1200
b. insecticide spray
Grain yield (kg/ha)
Figure 8. Grain yield of cowpea varieties as affected by planting date, and control of insect pest by spraying (b) or no spraying (a) of insecticides, 2013

IT 99K-573-1-1
IT99K-573-2-1
Songotra
Padi Tuya
Bawutawuta
Farm Variety
0 200 400 600 800 1000 1200 1400 1600 1800
3-Insecticide sprays 2-Insecticide sprays1-Insecticide sprayNo-Insecticide spray
Grain yield (kg/ha)
Figure 9. Insecticide spraying regime and variety effects on cowpea grain yield, Nyankpala, Ghana, 2013
Integrated soil fertility management effects on productivity of maize-cowpea rotations An Integrated Soil Fertility Management (ISFM) study was initiated in 2013 to evaluate the response of maize-cowpea cropping system to organic (fertisoil) and inorganic fertilizers, and Rhizobium inoculants. The 2013 cropping season was the set-up year and therefore it was not possible to measure rotation effect of maize following soybean that received different fertilizer treatments.
The trials were conducted jointly conducted by SARI, IITA and KNUST researchers at Goriyiri (Nadowli district, UWR) and Bonia (Kassena-Nankan district, UER). The experimental design was randomized complete block design with four replications and seven treatment combinations listed in Table 14. Rhizobium inoculants (5g/1kg of seed) and 1.5t/ha of fertisoil (organic fertilizer) were applied at planting. Recommended fertilizer rate was 25-60-30kg/ha as N, P2O5 and K2O. The 60kg/ha P2O5 as Triple Super Phosphate (TSP) and 30kg/ha K2O as Muriate of Potash (MOP) were applied at planting to plots that received P and K fertilizer. Plot size for each treatment was 4.5m x 5m. Plant height, days to 50% flowering, nodule number and weight, grain and stover yields, harvest index and 1000-grain weight was recorded. Farmers were actively involved in the planning, implementation, monitoring, and evaluation processes.
Cowpea pod and nodule numbers and yields of grain and haulm were significantly affected by soil amendment treatment at Goriyiri (Tab. 14). Grain yield was highest for the treatment that received a combination of inoculants, PK and fertisoil, and lowest for the treatment with inoculants and fertisoil only. This result seems to suggest some synergy between Rhizobium inoculation and PK fertilization. Grain yield was positively correlated with nodule weight (r=0.66), nodule number (r=085), pod number (r=0.84) seed number (r=0.63) as well as biomass production (r=0.98).

Table 14. Soil amendment effects on agronomic traits of cowpea at Goriyiri, Upper West Region, 2013 seasonSoil amendment Pod number Nodule
numberGrain yield (kg/ha)
Stover yield (kg/ha)
No soil amendment (control) 41 84 800 1134
Rhizobium inoculants only 33 90 800 1233
Inoculants + PK1 48 99 1067 2600
Inoculants + Fertisoil2 51 86 967 2066
Inoculants + PK + Fertisoil 58 86 1467 33003Recommended fertilizer rate 51 92 1000 2300
LSD (0.05) 11 11 239 10181P and K were applied at the rate of 60kg/ha P2O5 and 30kg/ha K2O, respectively.2Fertisoil was applied at the rate of 1.5t/ha.3Recommended fertilizer rate was 25-60-30kg/ha as N, P2O5 and K2O.
2.2.2.3 Soybean variety and integrated soil fertility managementA series of trials were conducted to evaluate options to intensify soybean production. Specific objectives were to demonstrate new soybean varieties to farmers, evaluate integrated soil fertility management effects on performance of soybean varieties in different environments, and determine farmer preferences for soybean varieties and ISFM technologies.
Soybean variety, inorganic fertilizer and Rhizobium inoculants effects on grain yieldTwo trials were conducted using early-maturing (90-100 days) and late-maturing (100-115 days) soybean varieties. A split-plot design with four replications was used in both trials. Main plots were three early-maturing varieties listed in Table 15 in Trial 1, and five medium-maturing varieties listed in Table 15 in Trial 2. Sub-plots for both trials were five fertilizer treatments listed in Tables 14 and 15 . The N, P and K rates were 25, 60 and 30kg/ha as N, P 2O5 and K2O, respectively. Nitrogen was applied as urea (46%N). Phosphorus was applied as Triple Super Phosphate (46%P2O5) and K as Muriate of Potash (60%K2O). All fertilizers were applied in a subsurface band about 0.05m to the side of the soybean row. Plants were sown in July 2013. The early-maturing varieties were sown in six rows of 5m in length and 0.6m apart, while the medium-maturing varieties were sown in six rows of 5m in length and 0.75m apart. Distance between plants in a row was 5cm in all experiments with one seedling per stand. Weeds were controlled manually using a hand held hoe. Days to 50% flowering, plant height and grain yield were recorded. The two centre rows of each sub-plot were harvested at physiological maturity to determine grain and stover yields.
The soybean variety and fertilizer treatments interaction was not statistically significant for any traits measured or calculated at Wa. Variety significantly affected days to flowering and stover yield of the early-maturing soybean varieties at Wa (Tab. 15). Stover yield of Anidaso was significantly higher than of Suong-Pungu. Rhizobium inoculation and NPK application had no significant effect on any of the variables.Anidaso had significantly more days to flowering, and higher grain and stover yields than Suong-Pungu at Bamahu (Tab. 16). Application of P and K fertilizer resulted in significantly higher stover yield compared to no fertilizer application. Suong-Pungu and TGX 1805-8F will be particularly useful in the drier areas in Upper East and Upper West Regions because they flower early. They could be used as relay crop to early millet in Upper East Region. This will enable farmers benefit from both millet and soybean cultivation in one season, particularly in Striga hermonthica endemic and drought-prone areas.

Results for the medium maturing soybean varieties are presented in Tables 17 and 18. At Wa, days to 50% flowering and grain yield varied significantly among the medium-maturing soybean varieties. Grain yield was highest for variety TGX 1834-5E or Afayak and lowest for variety TGX-1445-3E or Songda (Tab. 17), possibly due to the varietal differences in days to 50% flowering. Fertilizer and inoculation treatment significantly affected nodule weight and grain and stover yields. Grain and stover yields were highest with the combination of Rhizobium inoculation plus NPK fertilization and lowest when the seeds were neither inoculated nor fertilized. At Bamahu, variety had a significant effect on all the variables measured (Tab. 18). In contrast, Rhizobium inoculation and fertilizer application had no significant effect on any variable. Jenguma gave the highest grain and stover yields, while Songda gave the lowest.
In conclusion, soybean early-maturing genotypes TGX 1805-8F and Suong-Pungu were found to have potential for grain production in drier areas due to their early flowering nature. Medium-maturing genotypes with potential for higher grain production were TGX-1904-6F and Afayak. Inoculation of seeds with Rhizobium in combination with NPK fertilizer would increase grain yields.
Soybean grain yield responses to a combination of variety, organic and inorganic foliar fertilizersIn 2013, trials were carried out in 12 communities to evaluate a combination of variety, and application of organic and inorganic fertilizers, including foliar fertilizers on soybean grain yield. The experimental design was a split-plot design arranged in randomized complete block with two improved varieties of soybean as the main-plots and five integrated soil practices as sub-plots factor. Each community represented a replication. Each plot measured 5mx4m with 2m alley separating main plots and 1m alley between sub-plots. Inoculated seeds of the two soybean varieties with Rhizobium at 5g of inoculants per 1kg seed were sown at 75cm by drilling except farmers’ practice where no inoculation was done. Seedlings were later thinned to 5cm between plants in a row or 20 seedlings per meter square with one plant per stand.
Table 15. Inorganic fertilizer and Rhizobium inoculation effects on performance of early-maturing soybean varieties at Wa, Upper West Region, 2013
Days to 50%
flowering
Nodule weight1
(g)
Nodule number1
Grain yield(kg/ha)
Stover yield(kg/ha)
VarietyTGX 1799-8F (Suong-Pungu) 47 6.6 21 1911 1884TGX 1805-8F 49 6.5 16 1902 2640Anidaso 54 6.7 23 1956 2880LSD (0.05) 2 NS NS NS 454
Fertilizer treatmentNo fertilizer 50 6.6 20 1926 2356Rhizobium inoculation (R) 50 6.7 22 1867 2356PK (60 kg P2O5+30 kg K2O /ha) 50 6.6 16 1926 2474NPK (2kg/ha N+60kg/ha P2O5+30kg/ha K2O)
51 6.5 19 1970 2637
R +60kg/ha P2O5+30kg/ha K2O 50 6.6 25 1926 2519LSD (0.05) NS NS NS NS NS1Nodule number and nodule weight are for 10 plants/plot

The soybean variety by fertilizer treatment interaction had no significant effect on grain yield in all the regions. They main effect of variety was significant only in the Upper East where the genotype TGX-1904-6F produced more grain than the released variety Jenguma (Tab. 17). In general, grain yield tended to increase with a combination of TSP, fertisoil and the foliar fertilizer. Further studies are needed to confirm the results.
Table 16. Inorganic fertilizer and Rhizobium inoculation effects on performance of early-maturing soybean varieties at Bamahu, Upper West Region, Ghana, 2013
Days to 50% flowering
Plant height(cm)
Grain yield(kg/ha)
Stover yield(kg/ha)
VarietyTGX 1799-8F (Suong-Pungu) 44 49 996 693TGX 1805-8F 44 59 1564 1493Anidaso 49 57 1553 1493LSD (0.05) 1 NS 379 339
Fertilizer treatmentNo fertilizer 44 56 1126 919Rhizobium inoculation (R) 46 63 1284 1022PK (60kg/ha P2O5+30kg/ha K2O 46 65 1482 1422NPK (25kg/ha N+60kg/ha P2O5+30kg K2O) 45 71 1521 1393R +60kg/ha P2O5+30kg/ha K2O 46 78 1442 1378LSD (0.05) 1 NS NS 437
Table 17. Inorganic fertilizer and Rhizobium inoculation effects on performance of medium-maturing soybean varieties at Wa, Upper West Region, Ghana, 2013
Days to 50%
flowering
Nodule1
weight(g)
Nodule1
numberGrain yield
(kg/ha)Stover yield
(kg/ha)
VarietyTGX 1834-5E (Afayak) 51 9.1 68 2465 2744TGX 1445-3E (Songda) 56 8.6 27 1849 2676TGX 1448-2E 49 8.7 45 2276 253TGX 1904-6F 48 8.4 31 2406 2782Jenguma 52 8.1 23 2145 2764LSD (0.05) ‡ 1 NS NS 316 NS
Fertilizer treatmentNo fertilizer 51 8.7 29 1898 1864Rhizobium inoculation (R) 52 9.0 55 2169 2444PK (60kg/ha P2O5+30kg/ha K2O) 51 8.6 46 2382 2862NPK (25kg/ha N+60kg/ha P2O5+30kg/ha K2O)
51 8.6 41 2394 2960
R+60kg/ha P2O5+30kg/ha K2O 51 8.8 43 2381 2880LSD (0.05) NS 0.21 NS 316 3831Nodule number and nodule weight are for 10 plants/plot

Table 18. Inorganic fertilizer and Rhizobium inoculation effects on performance of medium-maturing soybean varieties at Bamahu, Upper West Region, Ghana, 2013
Days to flowering
Plant height (cm)
Pods per plant
Grain yield(kg/ha)
Stover yield(kg/ha)
VarietyTGX 1834-5E (Afayak) 48 60 63 1520 1716TGX 1445-3E (Songda) 53 47 71 871 1005TGX 1448-2E 47 58 49 1244 1778TGX 1904-6F 46 59 49 1316 1662Jenguma 47 60 41 1511 2143LSD (0.05) 1 5 12 308 354
Fertilizer treatmentNo fertilizer 48 57 49 1164 1591Rhizobium inoculation (R) 48 55 49 1244 1564PK(60kg/ha P2O5+30kg/ha K2O) 48 57 58 1431 1511 NPK (25kg/ha N+60kg/ha K2O5+30kg/ha K2O)
47 58 56 1449 1849
R+ PK (60kg/ha P2O5+30kg/ha K2O) 48 56 60 1173 1787LSD (0.05) NS NS NS NS NS
Table 19. Soybean grain yield (kg) as influenced by inorganic and organic fertilizer and liquid foliar fertilizer
TreatmentNorthern Region Upper East Upper West
JengumaTGX-1904-6F
Mean
JengumaTGX-1904-6F
Mean
JengumaTGX-1904-6F
Mean
Farmer practice1 2000 1333 1667 444 667 556 800 844 822TSP2 1778 1333 1556 533 756 645 711 578 645Fertisol (F)3 1778 1778 1778 622 844 733 667 489 578TSP+F 2000 2000 2000 533 931 732 978 533 756TSP+F+BoostXtra4 2222 2000 2111 400 978 689 489 844 667Mean 1689 1689 1689 507 835 671 729 658 694S.E 241.4 163.9 176.2Probability of F-valueTreatment(T) 0.3441 0.9667 0.8474Variety(V) 0.3908 0.0099 0.5375TxV 0.1561 0.7566 0.2993 1Farmer practice = no Rhizobium inoculation, TSP, F and BoosXtra2TSP = Triple Super Phosphate at 60kg/ha P2O53Fertisoil = organic fertilizer applied at 4t/ha4BoostXtra = liquid foliar fertilizer applied 4l/ha
Integrated soil fertility management effects on productivity of maize-soybean rotationsAn ISFM study was initiated in 2013 to evaluate the response of maize-soybean rotations to organic (fertisoil) and inorganic fertilizers, and Rhizobium inoculants. The 2013 cropping season was the set-up year and therefore it was not possible to measure rotation effect of maize following soybean that received different fertilizer treatments.

The trial was conducted at Goriyiri (Nadowli district, UWR) and Bonia (Kassena-Nankan district, UER) using the same procedure outlined in section 2.3.2. The experimental design was randomized complete block design with four replications and seven treatment combinations listed in Table 17. Rhizobium inoculants (5g/1kg of seed) and 1.5t/ha of fertisoil (organic fertilizer) were applied at planting. Recommended fertilizer rate was 25-60-30kg/ha as N, P2O5 and K2O. The 60kg/ha P2O5 as Triple Super Phosphate (TSP) and 30kg/ha K2O as Muriate of Potash (MOP) were applied at planting to plots that received P and K fertilizer. Plot size for each treatment was 4.5mx5m. Plant height, days to 50% flowering, nodule number and weight, grain and stover yields, harvest index and 1000-grain weight was recorded. Farmers were actively involved in the planning, implementation, monitoring, and evaluation processes.
Soybean plant height, nodule numbers, and yields of grain and stover were significantly affected by soil amendment treatment in Goriyiri (Table 20). Grain and stover yields were highest when inoculants, PK and fertisoil were applied and lowest when no soil amendment was applied. At Bonia, the soil amendments had similar significant effect on the agronomic traits of soybean. Grain yield was highest with inoculation plus PK suggesting some synergy between Rhizobium inoculation and PK fertilization, and lowest when only Rhizobium inoculation was applied (Table 20). Soybean grain yield was positively correlated with plant height (r=0.60) and biomass production (r=0.82).
Table 20. Soil amendment effects on agronomic traits of soybean at two location in northern Ghana, 2013 seasonIntervention community Soil amendment Plant
height (cm)
Nodule number
Grain yield (kg/ha)
Stover yield (kg/ha)
Goriyiri (Upper West) No soil amendment (control) 41 84 800 1134Rhizobium inoculants only 33 90 800 1233Inoculants+ PK1 48 99 1067 2600Inoculants+ Fertisoil2 51 86 967 2066Inoculants+ PK +Fertisoil 58 86 1467 33003Recommended fertilizer rate 51 92 1000 2300LSD(0.05) 11 11 239 1018
Bonia (Upper East) No soil amendment (control) 32 - 901 1900Rhizobium inoculants only 37 - 880 1917Inoculants+PK 41 - 1361 2167Inoculants Fertisoil 41 - 1758 3217Inoculants + PK+Fertisoil 40 - 1582 2867Recommended fertilizer rate 39 - 1304 2217LSD (0.05) 9.8 - 254 932
1P and K were applied at the rate of 60kg/ha P2O5 and 30kg/ha K2O, respectively2Fertisoil was applied at the rate of 1.5t/ha3Recommended fertilizer rate was 25-60-30 kg/ha as N, P2O5 and K2O

2.2.3 Genetic intensification of cereal-legume-vegetable systems2.2.3.1 Medium-maturing and dual-purpose cowpeaTwelve lines of each of the medium-maturing and dual-purpose cowpea types were evaluated in separate trials using a randomized complete block design with three replications. Each plot measured 4mx4m with 1m alleys between plots and 2m alleys between replicates. Seeds were sown at 75cm x 20cm apart and within rows respectively. Two seeds were sown per stand. Pre-emergence herbicide was applied immediately after sowing to control weeds. Weeding was done at 4 and 7 WAP. Cymetox Super (30g of Cypermethrin and 250g of Dimethoate of active ingredient per litre), a systemic and contact insecticide for the control of insect pest on a range of field crops and vegetables was applied at the rate of 1.5l/ha for insect pest control. Cymetox Super was replaced with Lambda Super 2.5E.C (25g of Lambda-Cyhalothrin) in the three spraying regime during the third spray to prevent insect getting immune to the first chemical. Grain yield of the medium-maturing (Fig. 10a) and dual-purpose (Fig. 10b) cowpea types varied significantly among the genotypes in all regions. Yields in the drier Upper East region were generally higher than the Northern and Upper West regions, possibly due to lower insect pest damage. Averaged across regions, medium-maturing genotypes IT07K-318-2, IT08K-150-2 and IT08K-180-7; and dual-purpose genotypes IT09K-321-21, IT09K-456 and IT08K-126-19 were identified to have potential for grain production in northern Ghana.
2.2.3.2 Early- and late-maturing soybean Sixteen early-maturing soybean genotypes were evaluated at Botingli, Siriyiri and Samboligo in the NR, UWR and UER, respectively. The same number of medium-maturing genotypes was established in separate trials at Duko, Passe and Bonia in the NR, UWR and UER, respectively. In both trials, a randomized complete block design with three replications was used. Each plot measured 4mx4m with 1m alleys between plots and 2m alleys between replicates. Seeds were drilled at 75cm apart which were later thinned to 20 seedlings per meter. Pre-emergence herbicide (Lumax 537.5 SE) was used at 4l/ha to control weeds whiles hand weeding was done 5-6 weeks after sowing. Days to 50% flowering, nodulation, pest and diseases, plant height at harvest, days to maturity, dry pod weight and grain yield were recorded. Grain yield varied significantly among the early-maturing (Fig. 11a) and medium-maturing (Fig. 11b) soybean genotypes in all the regions. Grain yield of the early-maturing genotypes was higher than the late-maturing in all regions, possibly because the rains started late and planting was delayed. Grain yield in the Upper East Region was generally lower than in the other regions probably due to the differences in the length of the growing season. Averaged across regions, soybean genotypes with potential for grain production were the early-maturing genotypes TGX-1990-55F, TGX-1990-57F and TGX-1990-37F, and the late-maturing genotypes TGX-1990-80F, TGX-1990-47F and TGX-1989-42.

Figure 10. Grain yield of medium-maturing and dual-purpose cowpea varieties in intervention communities in the Northern, Upper West and Upper East Regions, Ghana, 2013
IT08K-150-24IT08K-150-12
IT08K-180-7IT07K-187-24IT07K-188-49
IT07K-211-1-8IT07K-292-10IT07K-291-92
IT07K-304-9IT08K-149-3IT07K-318-2Local check
0 200 400 600 800 1000 1200 1400 1600
a. medium-maturingUpper West Upper East Northern
Grain yield (kg/ha)
IT07K-274-2-9IT09K-456
IT08K-126-19IT09K-269-1IT04K-332-1
ITO7K-297-13IT08K-180-11IT08K-193-15
IT04K-339-1IT08K-180-5IT09K-321-1Local check
0 200 400 600 800 1000 1200 1400 1600
b. dual-purposeUpper West Upper East Northern
Grain yield (kg/ha)

Figure 11. Grain yield of early- and medium-maturing soybean varieties in intervention communities in the Northern, Upper West and Upper East Regions, Ghana, 2013
TGX 1987-10FTGX 1989-19FTGX 1989-40FTGX 1990-21FTGX 1990-37FTGX 1990-38F
TGX 1990-3FTGX 1990-40FTGX 1990-46FTGX 1990-52FTGX 1990-55FTGX 1990-57F
TGX 1987-10F CheckTGX 1987-62F CheckTGX 1835-10E Check
Local Check
0 500 1000 1500 2000 2500 3000 3500 4000
a. early-maturing Upper East Northern Upper West
Grain yield (kg/ha)
TGX 1987-10FTGX 1989-11FTGX 1989-42FTGX 1989-45F
TGX 1990-101FTGX 1990-47FTGX 1990-70FTGX 1990-73FTGX 1990-78FTGX 1990-80FTGX 1990-95FTGX 1990-10F
TGX 1987-10F- CheckTGX 1987-62F Check
TGX 1904-6F CheckLocal Check
0 1000 2000 3000 4000
b. medium-maturing
Upper East Upper West Northern
Grain yield (kg/ha)

2.2.3.4 Aflatoxin resistant groundnuts A team from ICRISAT and SARI established field trials at Tingoli, Sabulungo and Nyagli in the NR, UER and UWR, respectively to evaluate the performance of 10 groundnut genotypes (consisting of eight aflatoxin resistant lines from ICRISAT-Mali), one improved variety (Nkate-SARI) and a popular local variety (Chinese). Grain and haulm yields varied significantly among the groundnut genotypes (Fig. 12). The preliminary results showed that the farmer variety and the aflatoxin resistant genotypes ICGV-94379 and ICGV-91317 have potential for grain and fodder production, whilst the aflatoxin resistant genotype ICVG-91315 and the released variety (NKATESARI) have potential for fodder production.
NKATESARI
ICGV-91315
ICGV-91324
ICGV-91279
ICGV-93305
ICGV-91278
ICGV-91284
ICGV-91317
ICGV-94379
Farmer var.
0 500 1000 1500 2000 2500 3000 3500 4000
Grain yield Haulm yield
Yield (kg/ha)
Figure 12. Grain and haulm yield of aflatoxin resistant groundnut genotypes at Sabulungo, Upper East Region, Ghana, 2013
2.2.3.5 Sorghum hybridsEleven hybrids were compared with the commonly cultivated local sorghum in the area using an Alpha design at Manga in the UER. The hybrids were sown on ridges in six rows of 5m in length and 0.75m apart. Three seeds per hill were planted at 0.30m apart and later thinned to two plants per hill. Basal fertilizer (15:15:15) was applied at the rate of 38-38-38kg/ha as N, P205 and K2O. Top-dressing was done 4 weeks after planting at the rate of 26kg/ha N using sulphate of ammonia. Data were collected from the two centre rows.Genotypic differences were detected for plant height, grain yield, and harvest index (Tab. 21) . The shortest hybrid was IPSA1527530 while the tallest was Sewa. Mean grain yield was lowest for Soumalemba and highest for IPSA Golofing. Mean grain yields of Fadda, Yamassa and IPSAGolofing were 37-57% higher than the local variety Kadaga. Grain yield was positively correlated (r=0.94) with the harvest index (grain yield*100/total biomass). Grinkan Yerewolo and the local variety were the most preferred by farmers whilst IPSA156731 was the least preferred. Kadaga was preferred for its brown grain that is ideal for brewing the local beer called Pito.

Table 21. Performance of sorghum hybrids at Wa, Upper West Region, Ghana, 2013Genotype Plant height (cm) Grain yield (kg/ha) Harvest index (%)Caufa 283 2233 41Fadda 313 2567 43Grinkan Yerewolo 346 2133 40IPSA156731 325 2200 40IPSAGolofing 255 2900 46IPSA1527530 166 1933 36Kadaga (local variety) 310 1867 37Mona 297 2233 42Pablo 306 2567 44Sewa 382 1767 35Soumalemba 277 1633 34Yamassa 218 2800 45LSD (0.05) 96 764 7
2.2.3.6 VegetablesSARI and AVRDC scientists evaluated okra, roselle and tomato genotypes on-farm (Sabulungo, Tekuru and Bonia) and on-station (Manga) in the UER. Farmer Field Schools and Participatory Variety Selection were conducted for both male and female farmers from nine communities. The okra genotypes were planted at a spacing of 30cm between plants in rows 75cm apart, replicated two times with a plot size of 4mx8m. Plant counts at two weeks after planting and at harvesting, plant height, days to 50% flowering and 50% fruiting, and number and weight of fruits were recorded.
Fruit yield varied significantly among the okra genotypes (Fig. 13). Genotypes NOKH 1002, NB-55-Srivan, NOKH 1003, NOKH 1004, AAK, EX-makutopora and FV-Unn-manna were found to be early-maturing (50% flowering 40-50 days after planting); Sasilon, ML-OK-16, ML-OK-37, TZ-SMN-86, Kpora-napon and Kpora-nasong were of the medium-maturity type (attained 50% flowering after 50 days of planting); while genotypes ML-OK-16, ML-OK-10, P1496946, FV-Unn and FV-Kpazeya were late-maturing, i.e., attained 50% flowering after 60 days of planting.
High yield, early-maturing, multiple harvest frequency and drying quality were identified by farmers as the most important selection criteria, especially under irrigated dry season production. Other criteria included prolonged tenderness, fruit size, price, taste, fruit texture and tolerance to field stress. Based on farmer preference and performance, genotypes NOKH 1004, NB-55-SRIVAN, Sasilon and NOKH 1002 were selected for further evaluation on farmers’ fields.

ML-OK-35FV (Kpora-Nasong)
Ex-MakutoporaFV (Kpora-Napong)
P1496946 ML-OK-16ML-OK-37
FV (Unn)AAK
FV (Kpazeya)Sasilon
NB-55-SrivanTZ-SMN-86
NOKH 1002NOKH1003
FV (Unn Manna)NOKH 1004
0 2000 4000 6000 8000 10000 12000
Fruit yield (kg/ha)
Figure 13. Fruit yield of okra genotypes at Manga, Upper East Region, Ghana, 2013 season
Six tomato genotypes (Duluti, LBR7, LBR 16, LBR17, Tengeru and Kénéyé) were evaluated on-station at Manga in the Upper East Region under rainfed condition using a randomized complete block design with three replications. Seeds were planted in June 2013 in rows 0.75m apart and 0.30m between plants within a row. Plant counts (2 weeks after planting and at harvesting), plant height (at 4, 8 and 12 weeks), days to flower initiation, days to 50% flowering and 50% fruiting, number of fruits (70, 80, 90 and 100 days after planting) and fruit size were recorded.
Fruit yield varied significantly among genotypes (Fig. 14). Genotypes LBR 17, LBR 7, LBR 16 and Kénéyé were found to have potential for production under rain-fed conditions.

Duluti
Tengeru
Kénéyé
LBR 17
LBR 16
LBR 7
0 20 40 60 80 100 120 140 160
Fruit yield (t/ha)
Figure 14. Fruit yield of tomato genotypes at Manga, Upper East Region, Ghana, 2013 season
2.2.4 Seed productionLimited access to quality seed of improved varieties was listed by farmers as a major constraint to crop production during the community analysis in Ghana and Mali. Therefore, linkages were established with public and private sector partners to produce and/or multiply seeds – breeder, foundation and certified seeds. The objective was to increase the accessibility of farmers to quality seeds of improved varieties. The seed multiplication plots were also used to demonstrate new crop varieties and to train farmers on good practices for vegetable production. In Ghana, IITA scientists partnered with CRI to produce breeders’ seeds, GLDB to produce foundation seeds; and with the Seed Producers Association of Ghana, SARI and community-based seed producers to produce certified seeds of cereals and legumes (Appendix 1). In Mali, a team consisting of AVRDC and AMEED staff produced seeds of three vegetable species (Appendix 2). The breeder seeds will be used for production of foundation seeds, whilst the certified seeds will be used for participatory research with farmers in the intervention communities.
2.3 Scaling-up and delivery (Research Output 3)As stated in Section 1.3, participatory approaches are used to implement the project activities, disseminate new technologies and promote knowledge exchange. For example, the “Mother and baby” approach was used to disseminate several technologies and combinations of technologies in Ghana and Mali. In Ghana for example, the following combinations of technologies were demonstrated to more than 700 farmers: (i) maize varieties and fertilizer application, (ii) soybean varieties and integrated soil fertility management, and (iii) cowpea varieties and insecticide spraying regimes. Similarly, in Mali the approach was used to reach out to more than 500 farmers.Farmers Field Days and Farmers Field Schools were jointly organized by SARI and AVRDC on vegetable production for farmers from Azum-sapielga, Badu, Boku, Tekuru, Bonia, Tampezua, Mognori, Nyorigu, Manga and Nayorko communities in the UER in Ghana. More than 250 farmers participated (Tab. 22). The Ministry of Food and Agriculture organized six field days for over 1000 farmers to demonstrate several technologies in mother trials in NR, UER and UWR of Ghana.

Farmers field day in UWR, Ghana, and Striga infested sorghum crop in UER, Ghana. Photos: A. Larbi
In Mali, ICRISAT in partnership with AMEED and Access Agriculture, an international non-governmental organization, distributed the “Fighting Striga” DVDs to Africa RISING action villages. They studied the early impacts of the distribution and use of the DVDs and videos on partner dynamics, farmer knowledge and experimentation in Mali, including in several Africa RISING villages. A contract was signed with the Cinema Ambulante Numerique for the evening large-screen viewing of five “Fighting Striga” videos in all Africa RISING villages. In Ghana, ICRISAT partnered with MoFA and Access Agriculture to produce 5000 DVDs on “ Fighting Striga” in Kusaal, Frafra, Dagbaari, and English languages. The video was launched in Tamale on 17 th July. Three videos – “Striga biology”, “Grow row by row”, and “Let’s talk money” – were shown in five Africa RISING intervention communities (Nyangua, Bonia, Tekuru, Samboligo, Gia) in UWR.
Table 22. Number of farmers attending the Farmer Field Schools and Participatory Variety Selection, Ghana
Districts CommunitiesAttendance Male Female Total
Binduri Nayorko 5 20 25Binduri Boku 5 20 25Binduri Azum-Sapielga 5 20 25Bawku-East Nyorigu 5 20 25Bawku-East Mognori 10 20 30Bawku-East Tampizua 10 20 30Bawku-East Bado 6 10 16Kassina-East Tekuru 15 30 45Massena-East Bonia 10 25 35Total 9 71 185 256
2.4 Capacity building and knowledge exchangeIndividual and group trainings were integral part of the project activities during the reporting period. Thirteen graduate students jointly supervised by staff of Africa RISING and national universities were attached to the project for their dissertation research (Tab. 23). Group training in the form of short-term courses, hands-on training and exchange visits were also organized. A team of scientists working on the project in Ghana visited Mali in October 2013 to learn and exchange knowledge.

Table 23. Graduate students attached to Africa RISING West Africa Student Sex Country University DegreeMary Awuni Female Ghana University for Development Studies MScRichard Amponsah Male Ghana Kwame Nkrumah University of Science and Technology MScRaphael Azayiga Male Ghana Kwame Nkrumah University of Science and Technology PhDAbdul R Nurudeen Male Ghana Kwame Nkrumah University of Science and Technology PhDSarfo K Goodman Male Ghana Kwame Nkrumah University of Science and Technology PhDFatouma Traore Female Mali University of Ghana MScMartha Agyri Female Ghana Kwame Nkrumah University of Science and Technology MScSolomon Konlan Male Ghana University for Development Studies PhDClarisse Umutoni Female Mali Cheik Anta Diop University, Dakar, Senegal PhDPeter Agbetiameh Male Ghana Kwame Nkrumah University of Science and Technology PhDJoseph Clottey Male Ghana University of Ghana MScEmmanuel Gyakah Male Ghana University of Ghana MScMohammed Shaibu Male Ghana University of Ghana MSc
Fruit tree establishing plot set up by ICRAF and visited during researchers exchange visit to Mali in October 2013. Photo: I. Hoeschle-Zeledon

3 Project implementation issuesA review and planning meeting was held in Tamale, Ghana, on 11 December, 2013. From 3-5 February2014, the annual review and planning meeting for Ghana and Mali was held in Bamako, Mali. Monthly partner meetings in the three regions of Ghana have been initiated to better coordinate and oversee the activities. An agricultural economist for the two IITA led regional Africa RISING projects has been recruited as an inter5natioinal staff and will start work out of the Tamale, Ghana, office in April 2014. The Project Administrator resigned in November 2013. This position was merged with the Project Accountants’ position. The communications specialist hired in November 2013 for the two regional projects resigned and will leave in April 2014. The position will be upgraded to allow recruitment of a highly qualified international staff able to address the growing communication needs.A Memorandum of Understanding was signed with Heifer International, a non-governmental organization dealing with livestock related issues in November 2013. The MoU with ACDI-VOCA expired in December 2013 due to the ending of the ADVANCE project. There is interest by both parties to renew the MoU should the project be extended for another phase.The Africa RISING West Africa project is hosting the Country Coordinators and staff of the N2 Africa and SARD-SC projects at its premises in Tamale. The activity coordinator in Mali resigned from the partner institution, ICRISAT, early 2014. He has been replaced by a new staff. This has been the second change in leadership of the Mali activities within 14 months with the associated implications on institutional knowledge and continuity of activities and relationships.The USAID ban on supporting government institutions in Mali has been lifted in October 2013. Therefore, the project can partner again with IER, a key national research partners.In the absence of data from the baseline surveys to be carried out by IFPRI, the different teams had to carry out a number of smaller surveys to inform their research activities. IFPRI has now made preparations to carry out the baseline surveys in April/May 2014 in both countries. The regional M&E officer, a consultant hired by IFPRI, has resigned in January 2014 leaving the position again vacant and disrupting the collaboration with Africa RISING implementation partners in both countries. The USAID Mali Mission is investing approx US$9,000,000 in large-scale technology dissemination to boost the sorghum and millet value chains in Sikasso and Mopti Regions of Mali. The Mission has asked ICRISAT to prepare a proposal for 36 months. Though funds will be channeled directly to ICRISAT, this project will become a component of Africa RISING with reporting to USAID through the Africa RISING Coordinator for West Africa. The Africa RISING regional management will be represented on the Management Committee of this new component. Start of activities is expected immediately.
4 Presentations and publicationsBuah, SS., Larbi, A., Hoeschle-Zeledon, I. (2013). Grain yield responses of maize to nitrogen fertilizer in the West Africa Guinea savannah. 6th International Nitrogen Conference, Kampala, Uganda, 18-22 November 2013.Denwa, N., Buah, SS., Larbi, A., Hoeschle-Zeledon, I. (2013). Soybean grain yield responses to NPK fertilizer and rhizobium inoculation. 6th International Nitrogen Conference, Kampala, Uganda, 18-22 November 2013.Kanton, RAL., Larbi, A., Buah, SS., Kombiok, JM., Ansoba, E., Aungre, PA., Lamin, S., Prasad, PV. (2013). Effect of nitrogen fertilizer on growth and yield of maize varieties with different maturities in a dry agro-ecology of northern Ghana. Annual General Meeting of the Crop Science Society of America (CSSA)/ Soil

Science Society of America (SSSA) and the American Society of Agronomy (ASA), Tampa, Florida, 3–7 November 2013.Hoeschle-Zeledon I. and Larbi A., 2014. Sustainable Intensification of CropLivestock Farming Systems in the Guinea and Sudan Savanna Zones of West Africa. Africa RISING Brochure. IITA, Ibadan, Nigeria.
in preparation:Katja Kuivanen, Mirja Michalscheck, Sahib u Mellon, Samuel Adjei-Nsiah, Stephanie Alvarez, Asamoah Larbi, Ken Giller, Katrien Descheemaeker, Jeroen Groot. Exploration of farm type specific options for sustainable intensification of smallholder farming systems in the West-African Savannah zone: Whole farm model application in northern Ghana. Agricultural Systems.

Appendix 1
Breeder, foundation and certified seed produced in Ghana, 2013Type Crop Variety Seed produced (kg)Breeder seed Maize Obatanpa 750
Nangbaar 200Total 950
Soybean Anidaso 300Asomdwee 250Total 550
Cowpea Videza 250Oboshie 350Hewale 250Total 850
Groundnut Obolo 350
Foundation seed Maize Omankwa 1000Abontem 300Obatanpa 50Sub-total 1,350
Cowpea Asontem 300
Certified seed Maize Abontem 2745Abrohemaa 1215Omankwa 630DTXR-WCoF2 675Sub-total 5,265
Rice Gbewaa rice 16, 465
Soybean Jenguma 2565TGX-1940-6F 450Sub-total 3,015
Cowpea Songotra 1530Padi-Tuya 180Apagbuala 270Zaayura 585Sub-total 2,565

Appendix 2
Vegetable seed produced in 2013.Species Country Varieties Seed produced (kg)Jute Mallow Ghana 6 2.2Amaranthus Ghana 7 4.2Pumpkin Ghana 10 8.2African Nightshade Ghana 9 7.7Roselle Ghana 9 13.8Okra Ghana 15 17.5Sub-total 53.6
Tomato (ICRIXINA) Mali 1 4.2Okra Mali 2 78Roselle (Koor) Mali 1 10.3Hot pepper (Natama) Mali 1 0.9Sub-total 93.4
Grand-total 147


![ALL RIGHTS RESERVED - Ministry of Healthjknj.moh.gov.my/farmasi/garispanduan/[2012] MOH Extemporaneous... · Phuar Hsiao Ling- Pharmaceutical Services Division, MOH Sarah binti Abdullah-](https://static.fdocuments.us/doc/165x107/5b54db787f8b9ae30b8dc3cf/all-rights-reserved-ministry-of-2012-moh-extemporaneous-phuar-hsiao-ling-.jpg)