Type 1 diabetes & nieuwe mogelijkheden in 2016
58
Type 1 diabetes & nieuwe mogelijkheden in 2016 Christophe De Block, Diabetologie & Endocrinologie, UA & UZA Voorzitter Diabetes Liga
Transcript of Type 1 diabetes & nieuwe mogelijkheden in 2016

Type 1 diabetes &
nieuwe mogelijkheden in 2016
Christophe De Block, Diabetologie & Endocrinologie, UA & UZA
Voorzitter Diabetes Liga

Inhoud
• Nieuwigheden in de behandeling anno 2016
– Farmaca
• GLP1-RA
• SGLT2-i
• Nieuwe insulines
– Technologie:
• CGM & SAP
• Flash glucose monitoring
• Artificial pancreas

Adapted from Brubaker PL, Drucker DJ Endocrinology 2004;145:2653–2659; Zander M et al Lancet 2002;359:824–830; Ahrén B Curr Diab Rep 2003;3:365–
372; Buse JB et al. In Williams Textbook of Endocrinology. 10th ed. Philadelphia, Saunders, 2003:1427–1483.
Incretins Regulate Glucose Homeostasis Through Effects
on Islet Cell Function

glycaemic
effects
non-glycaemic effects
Reduced
FPG & PPG
1.0 to 1.5 %
HbA1C
2 to 3 kg
weight Loss
Satiety, fullness,
gastric motlity
↑ natriuresis 3 to 5 mm Hg
BP
GLP1 receptor agonisten bij type 2 DM
↑ heart rate (2-5
bpm)
low risk of
hypoglycaemia
Improved lipid
profile

GLP1-RA + Basal Insulin: HbA1c
Balena et al, Diabetes, Obesity and Metabolism 15: 485–502, 2013.

GLP1-RA + Basal Insulin: weight
Balena et al, Diabetes, Obesity and Metabolism 15: 485–502, 2013.

GLP1-RA + Basal Insulin: insulin dose
Balena et al, Diabetes, Obesity and Metabolism 15: 485–502, 2013.

LEADER: Primary outcome CV death, non-fatal myocardial infarction, or non-fatal stroke
The primary composite outcome in the time-to-event analysis was the first occurrence of death from cardiovascular causes, non-fatal
myocardial infarction, or non-fatal stroke. The cumulative incidences were estimated with the use of the Kaplan–Meier method, and the
hazard ratios with the use of the Cox proportional-hazard regression model. The data analyses are truncated at 54 months, because less
than 10% of the patients had an observation time beyond 54 months. CI: confidence interval; CV: cardiovascular; HR: hazard ratio.
Presented at the American Diabetes Association 76th Scientific Sessions, Session 3-CT-SY24. June 13 2016, New Orleans, LA, USA.

GLP1-receptor agonists in T1DM
Frandsen et al. Lancet Diabetes Endocrinol 2016; 4: 766–80
x3
x10

GLP1-receptor agonists in T1DM: ADJUNCT-ONE
OBJECTIVE
• To investigate whether liraglutide added to treat-to-target insulin
improves glycemic control and reduces insulin requirements and
body weight in subjects with type 1 diabetes
RESEARCH DESIGN AND METHODS
• A 52-week, double-blind, treat-to-target trial involving 1,398
adults randomized 3:1 to receive once-daily subcutaneous
injections of liraglutide (1.8, 1.2, or 0.6 mg) or placebo added to
insulin.
Mathieu C et al. Diabetes Care 2016;39:1702–1710

GLP1-receptor agonists in T1DM: ADJUNCT-ONE
Mathieu C et al. Diabetes Care 2016;39:1702–1710

GLP1-receptor agonists in T1DM: ADJUNCT-ONE
Mathieu C et al. Diabetes Care 2016;39:1702–1710

GLP1-receptor agonists in T1DM: ADJUNCT-ONE
Mathieu C et al. Diabetes Care 2016;39:1702–1710

GLP1-receptor agonists in T1DM: ADJUNCT-ONE
Mathieu C et al. Diabetes Care 2016;39:1702–1710

GLP1-receptor agonists in T1DM: ADJUNCT-ONE
CONCLUSIONS:
• Liraglutide added to insulin therapy reduced
– HbA1c levels,
– total insulin dose, and
– body weight
• but increased rates of
– symptomatic hypoglycemia and
– hyperglycemia with ketosis,
thereby limiting clinical use in this group
Mathieu C et al. Diabetes Care 2016;39:1702–1710

SGLT-2 inhibitor bij type 1 DM
• Potential:
– hemoglobin A1c reduction
– weight loss
– potential to reduce insulin doses
– and lower hypoglycemia risk

Glomerulus Proximal tubule
S1 S2
S3
Collecting duct
Adapted from Bays H. Curr Med Res Opin 2009;25(3):671–681.
GLUCOSE REABSORPTION
GLUCOSE FILTRATION
The kidneys filter and reabsorb 180 g of glucose per day
Minimal glucose excetion
SGLT2 ~90%
SGLT1 ~10%
Special transporters in the kidneys are responsible for the reabsorption of glucose
(180-200 L/day) (900 mg/L) =162-180 g/day

SGLT2 Reduced glucose
reabsorption
Increased urinary
excretion of excess
glucose
(~70 g/day,
corresponding to 280
kcal/day)
Proximal tubule
Glucose
filtration
Gliflozins: A novel insulin-independent approach to
remove excess glucose1–3
1. Wright EM. Am J Physiol Renal Physiol 2001;280:F10–18.
2. Lee YJ, et al. Kidney Int Suppl 2007;106:S27–35.
3. Hummel CS, et al. Am J Physiol Cell Physiol 2011;300:C14–21.
SGLT2
Glucose
Gliflozin
Gliflozin
Gliflozins selectively inhibit SGLT2 in the renal proximal tubule


Clinical Effects of SGLT2 Inhibition Based on the Mode
of Action in T2DM
Increased Glucose
Excretion
Increased Sodium Excretion
Reduced
FPG & PPG
0.6 to 1 % HbA1C
2 to 3 kg
Weight Loss Loss of Energy
Calories
Reduced
Sodium Load 3 to 5 mmHg
BP
no hypoglycemia

Zinman B, NEJM 2015

Zinman B, NEJM 2015

SGLT2-inhibitors in T1DM: dapagliflozin
Henry et al. Diabetes Care 2015;38:412–419

SGLT2-inhibitors in T1DM: dapagliflozin
Henry et al. Diabetes Care 2015;38:412–419

SGLT2-inhibitors in T1DM: EASE-1 study
Pieber et al Diabetes, Obesity and Metabolism 17: 928–935, 2015
HbA1c insulin dose

Cascade of clinical events and metabolic changes that contribute sequentially to euDKA.

New Insulins

Less than 50% of insulin-treated patients are at their glycemic target1,2 due to
key unmet needs and challenges
Remaining unmet needs and challenges with
current basal insulin therapy
1. Davis KL et al. Curr Med Res Opin. 2013;29:1083-91; 2. Baser O et al. Clinicoecon Outcomes Res 2013;5:497-505;
3. Maiorino MI et al. Expert Opin Biol Ther. 2014;14:799-808; 4. Ahrén B. Vasc Health Risk Man. 2013;9:155-163; 5. Wei W et al. Endocr Pract.
2014;20:52-61
Sub-optimal doses
and early treatment
discontinuation4,5
Fear of
hypoglycemia and
insulin-associated
weight gain4
Hypoglycemia
has important
short- and
long-term
consequences4
Intra-patient
glucose variability3
Behavioral challenges PK/PD Incidence of
hypoglycemia
28

Insulin glargine U300

More constant and stable PK/PD profile with
Gla-300 vs Gla-100
Becker RH et al. Diabetes Care. 2014
3
2
1
0
20
10
0
0 6 12 18 24 30 36
0 6 12 18 24 30 36
Insu
lin c
on
ce
ntr
atio
n,
µU
/mL
Glu
co
se
in
fusio
n r
ate
,
mg
/kg
/min
25
15
5 LLOQ
30 LLOQ, lower limit of quantification
Time, hours
Gla-300 0.4 U/kg, n=16
Gla-100 0.4 U/kg, n=17

Primary endpoint was successfully achieved
in all EDITION trials
LS
M H
bA
1c
ch
an
ge
fro
m b
as
eli
ne
, %
Gla-100
Gla-300
31 Primary endpoint: non-inferiority in HbA1c change with Gla-300 vs Gla-100 at Month 6

RR 1.00
(0.95 to 1.04) RR 0.98
(0.92 to 1.04) RR 0.98
(0.91 to 1.06)
EDITION 4 EDITION JP 1
Data on file, saf_hypo_ph2_3, pg 219, 273; Home PD et al. Poster presentation at ADA 2014; Abstract 80-LB;
Data on file, JP1-efc12449_15_3_1_ae_data, pg 7, 9; Matsuhisa M et al. Poster presentation at EASD 2014; Abstract 975
Part
icip
an
ts w
ith
≥1 c
on
firm
ed
(≤70 m
g/d
L [
3.9
mm
ol/L
])
an
d/o
r sev
ere
hyp
og
lycem
ia (
%)
Gla-100 Gla-300
At any time (24 h) Nocturnal (00:00–05:59 h) At any time (24 h) Nocturnal (00:00–05:59 h)
RR 0.98
(0.88 to 1.09)
RR 0.82
(0.70 to 0.96)
RR 1.06
(0.92 to 1.23)
RR 0.99
(0.95 to 1.04) RR 0.91
(0.84 to 0.99) RR 1.01
(0.95 to 1.08)
RR 0.85
(0.73 to 0.99)
RR 0.71
(0.56 to 0.91)
RR 0.84
(0.70 to 1.00)
Relative risk (95% CI)
32
Incidence of confirmed (≤70 mg/dL [3.9 mmol/L]) or severe
hypoglycemia in T1DM studies
Neither study was designed and powered to test the difference in hypoglycemia risk
between Gla-300 and Gla-100 as pre-specified endpoint

Weight changes with Gla-300 vs Gla-100 at Month 6
33

Basal insulin doses at Month 6
Data on file, E19_Insulin dose_Absolute and Relative differences_M12_2014-09-03.doc, pg 6, 12, 14, 22, 38, 44 1US Prescribing Information, 27 Feb 2015
Basal insulin dose at Month 6, U/kg
T1DM studies
EDITION 4 EDITION JP 1
Gla-300 0.47 0.36
Gla-100 0.40 0.29
Relative
difference for
Gla-300 vs
Gla-100, %
+17.51 +22.47
34
T1

ABASAGLAR® PK profile is similar to that of EU Lantus®
ABASAGLAR®
EU Lantus®
Time (hours)
Mean
C-p
ep
tid
e-c
orr
ecte
d
ins
uli
n c
on
ce
ntr
ati
on
± S
D (
pm
ol/
L)
For the key PK and PD parameters, the criteria for bioequivalence were met.
The 90% CI for AUC and Cmax were completely contained in the pre-specified limit of 0.8 to
1.25
36
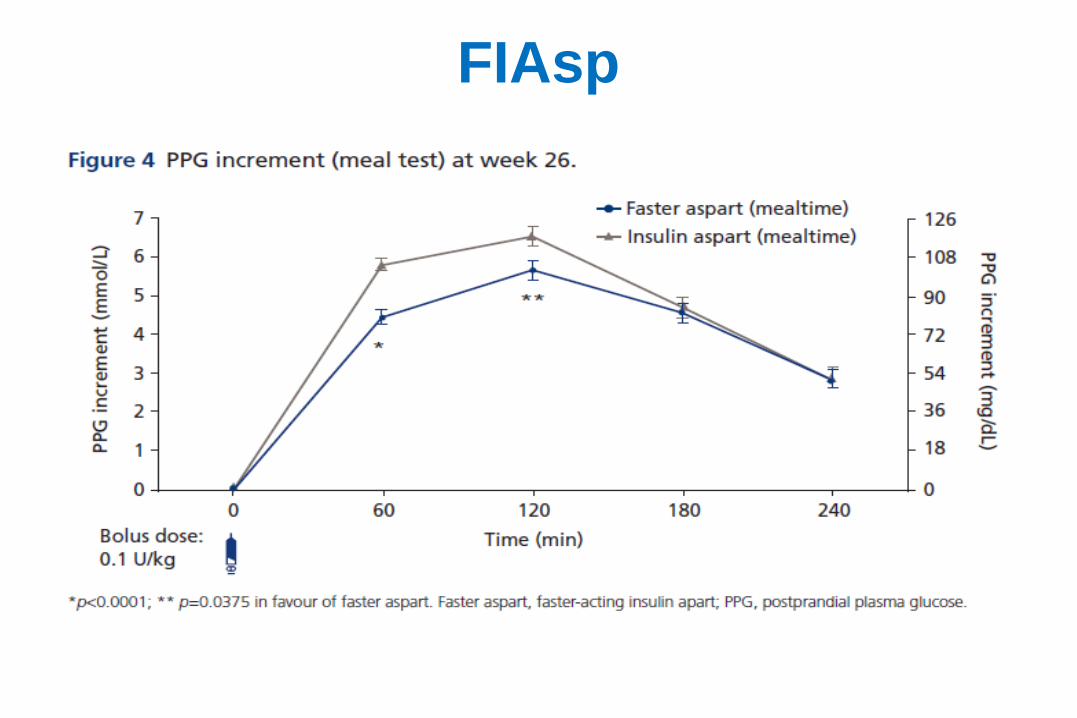
FIAsp

Freestyle Libre
& AGP
Christophe De Block

Hoe glucose wordt gemeten en bewaard
Na het scannen, verschijnen 3 belangrijke data
1. Heden
Huidige glucosemeting
2. Verleden
8-uur geschiedenis
3. Toekomst
Trendpijl
De trendindicatoren geven de richting
van uw glucose aan.

AGP (Ambulatory Glucose Profile) AGP is een visueel rapport dat alle glucose metingen van verschillende dagen of weken samenvat
alsof ze voorvielen in een enkele 24-u periode, wat het makkelijker maakt glycemie patronen* te
visualizeren
* Mazze RS. Making sense of glucose monitoring technologies from SMBG to CGM. Diabetes Technology and Therapeutics 2005;7(5):784-7
AGP grafiek is gebaseerd op glucose metingen, idealiter over een periode van 14 dagen.
Mediaan
25e en 75e Percentiel
Curves 10e en 90e Percentiel
Curves

AGP
• Offers standardized reporting and analysis to create a universal
template in which data are represented in a predictable, easy-to-
view format
– Target range
– Glucose variability
– Hypoglycemia
– Hyperglycemia
• Enhances quality of care through pattern recognitions, improves
practice efficiency with minimal disruption of workflow, and
engages patients

Estimated A1c
(Gemidd glyc + 50) / 30 = HbA1c

Casus 1
Rather wide 25-75 percentile range, particularly in the evening – irregular life style (meetings, time
of dinner, type of dinner, …)
What would you propose as therapeutic changes?

Casus 1 real time total period
Combination of AGP (educational aspects, pattern recognition, areas of importance)
and real-time offers help
AGP shows much narrower 25-75 percentile ranges

Bolinder et al. Lancet 2016

Bolinder et al. Lancet 2016

Bolinder et al. Lancet 2016

Steineck et al. BMJ 2015;350:h3234
pump therapy: why ?


Pickup J et al. BMJ 2011

Pickup J et al. BMJ 2011
Fig 4 Individual patient data two step meta-analysis of difference in ln area under the curve of
hypoglycaemia during continuous glucose monitoring compared with self monitoring of blood glucose

Threshold-Based Insulin-Pump Interruption for
Reduction of Hypoglycemia
Bergenstal et al. NEJM 2013;369:224-32.

Threshold-Based Insulin-Pump Interruption for
Reduction of Hypoglycemia
Bergenstal et al. NEJM 2013;369:224-32.

Impact on clinical outcomes of a Belgian
reimbursement system for real-time
continuous glucose monitoring:
the RESCUE trial

Evolution of Haemoglobin A1c
4 Results – Impact on glycaemic control
No at risk 545 485 355 282
*** p < 0.001

Evolution of hypoglycaemia
4 Results – Impact on glycaemic control
No at risk 359 389 389 274 200
*** p < 0.001

The future:
closed loop


no more excuses