TWO-VARIABLE DATA SETS
11
LG: I can distinguish between one- and two-variable data sets
-
Upload
avonaco-williams -
Category
Documents
-
view
101 -
download
2
description
TWO-VARIABLE DATA SETS. LG: I can distinguish between one- and two-variable data sets. TWO-VARIABLE DATA SETS. KEY CONCEPTS For one-variable data sets, you know one attribute about each subject (ie. Height) Can be graphed by dot plot or bar graph - PowerPoint PPT Presentation
Transcript of TWO-VARIABLE DATA SETS

LG: I can distinguish between one- and two-variable data sets

KEY CONCEPTS For one-variable data sets, you know one attribute about each subject (ie. Height)
Can be graphed by dot plot or bar graph
For two-variable data sets, you know two attributes about each subject (ie. Height and Age) Can be identified by ordered pairs and two-column tables of values
Can be graphed using a scatter plot
Some two-variable data sets have a relationship between the variables

EXAMPLE 1 Part-Time Job Survey A survey of Grade 12 students included a question asking whether they had part-time jobs. This shows a tally of the results by home form (1st period class). (a) Identify the variable(s)
There is only one variable for each class, I only know
the total number of people with jobs
(b) Complete the given table by showing the frequency of each home form
4
6
2
8
7
6
3
5

EXAMPLE 1 Part-Time Job Survey A survey of Grade 12 students included a question asking whether they had part-time jobs. The shows a tally of the results by home form. (c) Why would constructing a bar graph or dot plot be the most appropriate way to display this data?
There is only one variable being dealt with
Bar graphs are commonly used to display frequency
4
6
2
8
7
6
3
5

EXAMPLE 1 Part-Time Job Survey (d) Using the grid below, construct a bar graph
4
6
2
8
7
6
3
5

EXAMPLE 1 Part-Time Job Survey (d) Using the grid below, construct a bar graph
(e) Give two descriptive statements about this data set
(i)
(ii)
Class 12D has the most students with part-time jobs
Class 12C has the least number of students with part-time jobs
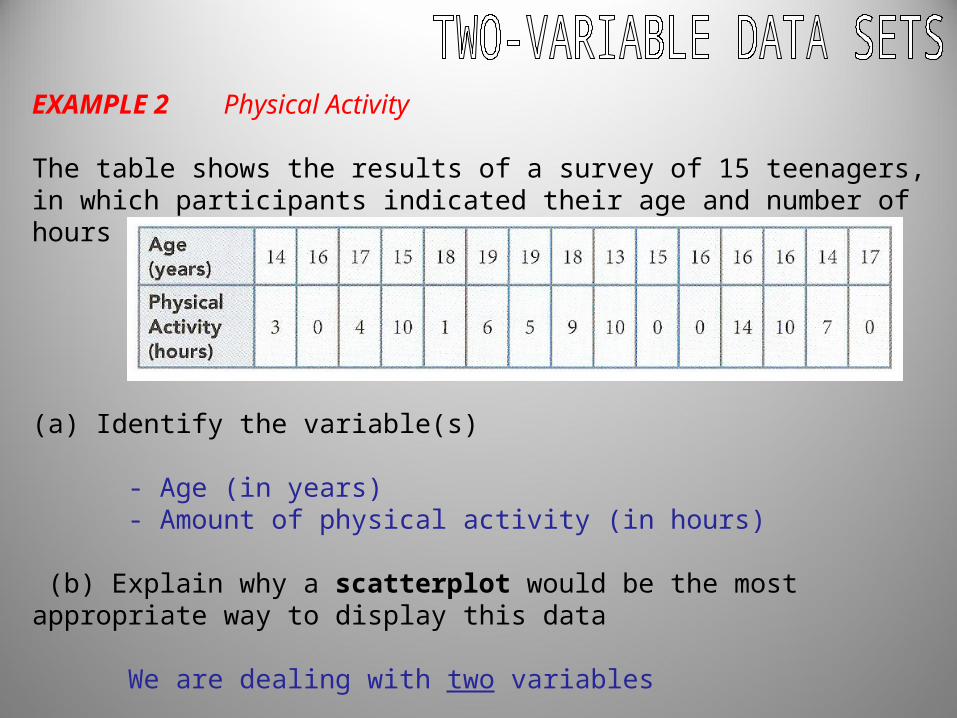
EXAMPLE 2 Physical Activity The table shows the results of a survey of 15 teenagers, in which participants indicated their age and number of hours of physical activity per week. (a) Identify the variable(s)
- Age (in years)- Amount of physical activity (in hours)
(b) Explain why a scatterplot would be the most appropriate way to display this data
We are dealing with two variables

EXAMPLE 2 Physical Activity
(c) Create a scatterplot for this data
Age (in years)
Amount of physical activity (in hours)
Age vs. Physical Activity

EXAMPLE 2 Physical Activity
(d) Pose a question that would:
(i) Require one-variable analysis
- What is the average age of the students?- What is the average number of hours of physical activity?- Any others?
(ii)Require two-variable analysis
- Is there a relationship between age and amount of physical activity?
- Any others?

Exit Card
• Identify whether these situations use one-variable or two-variable sets of data– 1) Noah researches annual hours of sunshine in
Canadian cities– 2) A study compared the length time children
spent playing video games and the time they spent reading
– 3) Kurt looked up stats on baseball players to decide whether arm length influenced how far the pitchers could throw.

Homework:
• Pg. 133-137 # 1-4, 8, 10