
Two-phase flow visualization and pressure drop measurements of HFO-1234yf and R-134a refrigerants in...
14
Two-phase flow visualization and pressure drop measurements of HFO-1234yf and R-134a refrigerants in horizontal return bends Miguel Padilla, Rémi Revellin ⇑ , Jocelyn Bonjour Université de Lyon INSA-Lyon, CETHIL, CNRS, UMR5008, F-69621, Villeurbanne, France Université Lyon 1, F-69622, France article info Article history: Received 16 May 2011 Received in revised form 9 January 2012 Accepted 10 January 2012 Available online 26 January 2012 Keywords: Two-phase flow Pressure drop Refrigerant Return bend abstract Two-phase flow regimes of HFO-1234yf and R-134a in a horizontal 6.7 mm inner diameter return bend are investigated. The different flow regimes observed are: slug, intermittent and annular flows. The perturba- tion lengths up- and downstream of the singularity are experimental investigated and their contribution to the pressure drop is identified. It is shown that the upstream perturbation length is less than 10D and that the downstream perturbation length is less than 20D for the conditions tested in this study. In addition, this paper presents 574 pressure drop data points measured for two-phase flow of HFO-1234yf and R-134a in horizontal return bends of inner diameters (D) from 7.90 to 10.85 mm and curvature ratios (2R/D) from 3.68 to 4.05. The experimental pressure drop data in return bends is compared to four well-known prediction methods available in the literature. The whole present pressure drop in return bends experimental database for the next generation HFO-1234yf and for the R-134a refrigerants is presented in the appendix. Ó 2012 Elsevier Inc. All rights reserved. 1. Introduction Return bends are extensively used in compact refrigeration sys- tems such as air conditioners or heat pumps. Their effect on the hydrodynamic performance become more important due to the fact that nowadays, there is a growing interest in refrigerant charge reduction. The change in the design of evaporator and condenser coils is necessary in order to obtain more compact heat exchangers. Two-phase pressure drops in return bends in refrigeration sys- tems have been experimentally investigated by several authors in the open literature. These studies highlight the impact of the large number of independent parameters governing the flow among which geometric configuration of the tube such as the curvature ratio, mass and volume fractions of the individual phases, pressure, fluid properties, mass velocity, orientation of the return bend (i.e horizontal, vertical or inclined) and flow patterns. To cater to the needs of diverse engineering applications, such as refrigeration, two-phase pressure drops in return bends have also been experi- mentally investigated by several authors. Since the 1960s, several refrigerants have been studied, among which CFCs, HCFCs and HFCs [12,15,5]. Most recent researches have been carried out for R-134a and R-410A [2,14,11]. Some of the most representative cor- relations for frictional pressure drop prediction in return bends have been presented by Chisholm [3] and Idelshik [6], Chen et al. [1], Domanski and Hermes [4] and Padilla et al. [9]. The latter presented 325 pressure drop data points measured in return bends for R-12, R-134a and R-410A, which were collected from the liter- ature. These methods are presented in Tables 1 and 2. In order to extend the existing database available in the litera- ture towards different tube diameters and curvature ratios for two- phase flow in horizontal return bends, Padilla et al. [11] presented 238 pressure drop data points measured for two-phase flow of R-410A in horizontal return bends of diameter (D) from 7.9 to 10.85 mm and curvature ratios (2R/D) from 3.68 to 4.05. This study showed the influence of mass velocity, saturation temperature and inner diameter on the return bend pressure drop. In addition, there is a growing interest in refrigeration, heat pump and air condition- ing industries to protect the environment from refrigerants with high Global Warming Potential (GWP). This has led to a demand for new environmentally friendly refrigerants. In this sense, the HydroFluoroOlefin (HFO) 1234yf, with a GWP of 4, is presented as a solution able to provide efficient and effective cooling with a near drop-in replacement for the current refrigerant R-134a. Among its interesting characteristics, HFO-1234yf has an atmo- spheric lifetime of only 11 days, compared to 13 years for R-134a. The aim of this article is to present original experimental two-phase flow regime visualizations and two-phase pressure drop data points in horizontal return bends for the next generation HFO- 1234yf refrigerant. This permits to extend the existing database available in the literature and also to better understand the physical phenomena involved. In addition, this article aims at discussing the perturbation length encountered up- and downstream of the return bend. 0894-1777/$ - see front matter Ó 2012 Elsevier Inc. All rights reserved. doi:10.1016/j.expthermflusci.2012.01.013 ⇑ Corresponding author. Tel.: +33 4 72 43 72 31; fax: +33 4 72 43 88 10. E-mail address: [email protected] (R. Revellin). Experimental Thermal and Fluid Science 39 (2012) 98–111 Contents lists available at SciVerse ScienceDirect Experimental Thermal and Fluid Science journal homepage: www.elsevier.com/locate/etfs
-
Upload
miguel-padilla -
Category
Documents
-
view
217 -
download
2
Transcript of Two-phase flow visualization and pressure drop measurements of HFO-1234yf and R-134a refrigerants in...

Experimental Thermal and Fluid Science 39 (2012) 98–111
Contents lists available at SciVerse ScienceDirect
Experimental Thermal and Fluid Science
journal homepage: www.elsevier .com/locate /et fs
Two-phase flow visualization and pressure drop measurements of HFO-1234yfand R-134a refrigerants in horizontal return bends
Miguel Padilla, Rémi Revellin ⇑, Jocelyn BonjourUniversité de LyonINSA-Lyon, CETHIL, CNRS, UMR5008, F-69621, Villeurbanne, FranceUniversité Lyon 1, F-69622, France
a r t i c l e i n f o
Article history:Received 16 May 2011Received in revised form 9 January 2012Accepted 10 January 2012Available online 26 January 2012
Keywords:Two-phase flowPressure dropRefrigerantReturn bend
0894-1777/$ - see front matter � 2012 Elsevier Inc. Adoi:10.1016/j.expthermflusci.2012.01.013
⇑ Corresponding author. Tel.: +33 4 72 43 72 31; faE-mail address: [email protected] (R. Reve
a b s t r a c t
Two-phase flow regimes of HFO-1234yf and R-134a in a horizontal 6.7 mm inner diameter return bend areinvestigated. The different flow regimes observed are: slug, intermittent and annular flows. The perturba-tion lengths up- and downstream of the singularity are experimental investigated and their contribution tothe pressure drop is identified. It is shown that the upstream perturbation length is less than 10D and thatthe downstream perturbation length is less than 20D for the conditions tested in this study. In addition, thispaper presents 574 pressure drop data points measured for two-phase flow of HFO-1234yf and R-134a inhorizontal return bends of inner diameters (D) from 7.90 to 10.85 mm and curvature ratios (2R/D) from 3.68to 4.05. The experimental pressure drop data in return bends is compared to four well-known predictionmethods available in the literature. The whole present pressure drop in return bends experimental databasefor the next generation HFO-1234yf and for the R-134a refrigerants is presented in the appendix.
� 2012 Elsevier Inc. All rights reserved.
1. Introduction
Return bends are extensively used in compact refrigeration sys-tems such as air conditioners or heat pumps. Their effect on thehydrodynamic performance become more important due to thefact that nowadays, there is a growing interest in refrigerant chargereduction. The change in the design of evaporator and condensercoils is necessary in order to obtain more compact heat exchangers.
Two-phase pressure drops in return bends in refrigeration sys-tems have been experimentally investigated by several authors inthe open literature. These studies highlight the impact of the largenumber of independent parameters governing the flow amongwhich geometric configuration of the tube such as the curvatureratio, mass and volume fractions of the individual phases, pressure,fluid properties, mass velocity, orientation of the return bend (i.ehorizontal, vertical or inclined) and flow patterns. To cater to theneeds of diverse engineering applications, such as refrigeration,two-phase pressure drops in return bends have also been experi-mentally investigated by several authors. Since the 1960s, severalrefrigerants have been studied, among which CFCs, HCFCs andHFCs [12,15,5]. Most recent researches have been carried out forR-134a and R-410A [2,14,11]. Some of the most representative cor-relations for frictional pressure drop prediction in return bendshave been presented by Chisholm [3] and Idelshik [6], Chen et al.[1], Domanski and Hermes [4] and Padilla et al. [9]. The latter
ll rights reserved.
x: +33 4 72 43 88 10.llin).
presented 325 pressure drop data points measured in return bendsfor R-12, R-134a and R-410A, which were collected from the liter-ature. These methods are presented in Tables 1 and 2.
In order to extend the existing database available in the litera-ture towards different tube diameters and curvature ratios for two-phase flow in horizontal return bends, Padilla et al. [11] presented238 pressure drop data points measured for two-phase flow ofR-410A in horizontal return bends of diameter (D) from 7.9 to10.85 mm and curvature ratios (2R/D) from 3.68 to 4.05. This studyshowed the influence of mass velocity, saturation temperature andinner diameter on the return bend pressure drop. In addition, thereis a growing interest in refrigeration, heat pump and air condition-ing industries to protect the environment from refrigerants withhigh Global Warming Potential (GWP). This has led to a demandfor new environmentally friendly refrigerants. In this sense, theHydroFluoroOlefin (HFO) 1234yf, with a GWP of 4, is presentedas a solution able to provide efficient and effective cooling with anear drop-in replacement for the current refrigerant R-134a.Among its interesting characteristics, HFO-1234yf has an atmo-spheric lifetime of only 11 days, compared to 13 years for R-134a.
The aim of this article is to present original experimentaltwo-phase flow regime visualizations and two-phase pressure dropdata points in horizontal return bends for the next generation HFO-1234yf refrigerant. This permits to extend the existing databaseavailable in the literature and also to better understand the physicalphenomena involved. In addition, this article aims at discussing theperturbation length encountered up- and downstream of the returnbend.

Nomenclature
a empirical constant (s2/3 m�1/3)b empirical constantD tube diameter (m)f friction factorG mass velocity (kg m�2 s�1)J superficial velocity (m s�1)L length (m)MAE mean absolute error
MAE ¼ 1N
PN1
predictedvalue�experimentalvalueexperimentalvalue
��� ���� 100 (%)
MRE mean relative error
MRE ¼ 1N
PN1
predictedvalue�experimentalvalueexperimentalvalue
� �� 100 (%)
p pressure (Pa)p Wilcoxon p-valueR curvature radius (m)T temperature (�C)Re Reynolds numberWe Weber numberx vapor quality
Greeksl dynamic viscosity (Pa s)q density (kg m�3)r surface tension (N m�1)
Sub and superscriptseq equivalentf frictionall liquido turning of the flowrb return bendsat saturationsing singularsp single-phasest straight tubetp two-phasetot totalv vapor
M. Padilla et al. / Experimental Thermal and Fluid Science 39 (2012) 98–111 99
2. Experimental facility and experimental conditions
2.1. Test facility
Fig. 1 shows a schematic diagram of the experimental facility. Itconsists of two parallel loops: the refrigerant loop and the water-glycol loop. The test facility is designed to make it possible sin-gle-phase and two-phase tests using various refrigerants. Prelimin-ary experiments were carried out to check the quality of themeasurements performed on this experimental facility. Especially,the energy balance was checked to be satisfied to 1% of mean rel-ative error (MRE) [10,11].
The refrigerant flow loop consists of a gear pump which deliverssub-cooled refrigerant to the heater. The refrigerant is preheatedand partially evaporated in the heater to the desired vapor quality.The fluid passes through the test section and is cooled and con-densed in the condenser. Before returning to the pump, the refrig-erant is subcooled to ensure that no vapor flows into the pump.The refrigerant mass flow rate is adjusted by the operator using aby-pass and measured by means of a Coriolis-type flow meter.
Table 1Two-phase pressure drop correlations in return bends.
Chisholm [3] and Idelshik [6] Dprb = UDpsp
Chen et al. [1] dpdz
� �rb¼ f qv J2
v2D
Domanski and Hermes [4] dpdz
� �rb¼ K dp
dz
� �st
Padilla et al. [9] dpdz
� �rb¼ dp
dz
� �stþ dp
dz
� �sing
Validity range of the above methods given in Table 2.All the methods are applied over the return bend only (over the length pR).
All components and tubes are well insulated with foam material.The pressure is controlled in the condenser by means of a water–glycol flow in the water-glycol loop, with a temperature comprisedbetween �5.0 �C and 20.0 �C, that can be chosen by the operator.This water–glycol flow controls the two-phase conditions in the li-quid reservoir.
The complete description of the test facility can be found inPadilla et al. [10,11].
2.2. Test sections for visualization and pressure drop measurements
Two test sections for pressure drop measurements were used inthis experimental study. The first one, depicted in Fig. 2a, was usedto measure the total pressure drop along the return bend with thepressure taps placed at different up- and downstream locations. Inthis sense, to determine the perturbation length downstream ofthe return bend, the total pressure drop is measured from a pres-sure tap positioned 50D upstream of the return bend to differentpressure taps located at 5D, 10D, 20D, 30D and 50D downstreamof the return bend. To determine the upstream perturbation length,
Dpsp ¼ KspG2
2ql
Ksp ¼ flLDþ 0:294 R
D
� �0:5
U ¼ 1þ qlqv� 1
� �x½bð1� xÞ þ x�
b ¼ 1þ 2:2Ksp 2þR
Dð Þf ¼ 10�2 Re0:35
m
We0:12v exp 0:194 2R
Dð Þð Þx1:26
K ¼ 6:5� 10�3 GxDlv
� �0:541x � 1� �0:21 ql
qv
� �0:342RD
� ��0:67
where dpdz
� �st
is calculated with
the Müller-Steinhagen and Heck [8] correlation
and dpdz
� �sing¼ a qv J2
vR
h iJ2lR
h ib
where a = 0.047 s2/3/m1/3 and b = 1/3Jv ¼ Gx
qv
Jl ¼Gð1�xÞ
ql
Note that Dpsing ¼ pR dpdz
� �sing

Table 2Experimental conditions of the prediction methods from the literature.
Correlation Refrigerant D 2R/D G Tsat x
Chen et al. [1] R-410A 3.25–3.30 3.91–8.15 300.00–900.00 25.0 0.10–0.90Domanski and Hermes [4] R-22, R-410A 3.25–11.63 2.32–8.15 300.00–900.00 20.0–25.0 0.10–0.90Padilla et al. [9] R-12, R-134a, R-410A 3.25–8.00 3.18–8.15 150.00–900.00 10.0–39.0 0.01–0.94
Fig. 1. Schematic diagram of the experimental facility.
100 M. Padilla et al. / Experimental Thermal and Fluid Science 39 (2012) 98–111
the total pressure drop is measured from different pressure taps lo-cated at 5D, 10D, 20D, 30D and 50D upstream of the return bend tothe pressure tap located 50D downstream of the return bend.
The second test section for pressure drop measurements(Fig. 2b) is made of copper and includes two straight tubes, two re-turn bends and one sudden contraction. The test tubes are set uphorizontally. The saturation pressure is measured using an abso-lute pressure transducer located at the test section outlet. In addi-tion, two thermocouples are placed at the inlet and the outlet ofthe test section in the center of the flow. The desired vapor qualityat the inlet of the test section is obtained by adjusting the power ofthe electrical heater. In addition, single-phase tests have been car-ried out and compared to conventional prediction methods in or-der to check and validate the pressure drop measurements [10,11].
Based on a 6.70 mm inner diameter glass tube, a specific testsection for visualizing flow regimes was developed (Fig. 2c). Hori-zontal flow pattern observations in return bends are obtained fromimages given by a high speed high resolution camera (Photronmodel Fastcam 1024 PCI).
2.3. Experimental conditions
Table 3 summarizes the experimental conditions of the presentdatabase along with the corresponding uncertainties. The 574experimental tests have been carried out using two different tube
diameters (10.85 and 7.9 mm), saturation temperatures from4.4 �C to 20.2 �C, and over the entire range of the vapor quality.The mass velocity ranges from 196.5 to 1165.1 kg m�2 s�1. Theworking fluid are the next generation HFO-1234yf and the well-known R-134a refrigerants. In the present paper, all refrigerantproperty calculations were based on REFPROP, Lemmon et al. [7].
3. Data reduction
In order to obtain the values of the return bend pressure drop Dprb, the total pressure drop and the straight tube pressure dropshave been measured. A synthesis of the idealized pressure profileof the flow path along a horizontal return bend is shown inFig. 3. Dptot corresponds to the total pressure drop experimentallymeasured over the length L1 + p R1 + L2 = 0.383 m for the first re-turn bend and L3 + pR2 + L4 = 0.335 m for the second return bend.The total pressure drop is expressed as follows:
Dptot ¼ Dpst;in þ Dprb þ Dpst;out ð1Þ
The term Dpst,in + Dpst,out is calculated by:
Dpst;in þ Dpst;out ¼ �dpdz
� �st
Leq ð2Þ
where Leq = L1 + L2 = 0.320 m for the first return bend andLeq = L3 + L4 = 0.285 m for the second return bend.

Fig. 2. Details of test sections for flow visualization and pressure dropmeasurements.
Table 3Experimental conditions and uncertainties of the present database.
Parameters Range Uncertainties
Fluids R-134a and HFO-1234yfD 10.85 and 7.90 mm ±0.6%R 20 and 16 mm ±0.5%G 196.1–1165.1 kg m�2 s�1 ±1.3%Tsat 4.4–20.2 �C ±0.1 K_Q 0–10 kW ±1 W
x 0.04–0.98 ±0.82%p 3.48–14.50 bar ±0.1%Dp 0–33.29 kPa ±0.1%L0 1000 mm ±0.5%L1 110 mm ±0.5%L2 210 mm ±0.5%L3 120 mm ±0.5%L4 165 mm ±0.5%L5 1000 mm ±0.5%
M. Padilla et al. / Experimental Thermal and Fluid Science 39 (2012) 98–111 101
The straight tube pressure gradients are experimentally mea-sured along the length L0 and L5. They are calculated as follows:
�dpdz
� �st¼
Dpst;Li
Lið3Þ
where i = 0 for D = 10.85 mm and i = 5 for D = 7.9 mm(L0 = L5 = 1000 mm).
The term Dprb corresponds to the return bend pressure drop.This term is the sum of the regular pressure drop along the bendof length pR(Dpst(pR)) and the singular pressure drop (Dpsing) whichcan be viewed as the sum of the pressure drops due to the curva-ture effect (Dpcurv) and the perturbations up- and downstream ofthe return bend (Dppert,in,Dppert,out).
Dpsing ¼ Dpcurv þ Dppert;in þ Dppert;out ð4ÞDprb ¼ Dpsing þ DpstðpRÞ ¼ Dptot � Dpst;in � Dpst;out ð5Þ
In the experiments, as explained in Padilla et al. [10], the max-imum pressure drop measured from the outlet of the electricalheater (where the vapor quality is calculated) to the outlet of thetest section can reach up to 0.84 bar. This pressure drop is notnegligible and provokes a so-called flashing (increase of the vaporquality due to vaporisation during expansion) and a temperaturedifference. The flashing effect is taken into account and is calcu-lated using the relation developed by Revellin et al. [13]. The in-duced temperature difference is obtained using the Clapeyronequation (dp/dTsat = hlv/(Tsattlv)).
The maximum vapor quality variation Dx due to the flashing ef-fect from the outlet of the electrical heater to the outlet of the testsection is 0.022. As a consequence, the variation of the vapor qual-ity along the tubes has been taken into account. The vapor qualitiesmentioned in the figures are the inlet vapor qualities of each mea-surement length. However, the variation of the vapor quality dueto the flashing effect along the pressure drop measurement lengthsis small enough to assume the vapor quality to be constant alongeach of these lengths. In addition, the maximum temperature dif-ference due to the pressure drop along the tube is up to 2.3 K. Asa result, the saturation temperature is recalculated at the inlet ofeach straight tube and return bend. The values of the temperaturegiven in Appendix A and B account for this correction.
4. Results and discussion
4.1. HFO-1234yf and R-134a flow regimes at the return bend inlet
The flow regimes of HFO-1234yf and R-134a encountered at theinlet of the return bend for each visualization are presented inFig. 4a and b respectively. The corresponding experimental condi-tions are mapped in the flow pattern map proposed by Wojtanet al. [17] only as information. It is important to note, that this flowpattern map was developed for R-22 and R-410A inside a 13.6 mmhorizontal smooth tube and further validated for R-134a and otherfluids. Therefore, it can not strictly be used to determine the flowpattern in the return bend test section. Nevertheless, it gives anindication of the flow regimes encountered at the inlet of the re-turn bend. For the present visualization dataset, at the return bendinlet, 60.0% (24 points) of the experiments belong to annular flow,whereas 30.0% are for intermittent flow. The rest corresponds toslug flow. Note that the flow pattern map of Wojtan et al. [17]was implemented by setting the heat flux to 0.00 kW m�2, as thepresent experiment is performed in adiabatic conditions. The flowregime visualizations at the inlet of the return bend for both refrig-erants have been compared to the Wojtan et al. [17] flow patternmap. As can be seen, no major difference was found between theexperimental flow regimes (slug, intermittent and annular flows)and their transitions and those predicted by Wojtan et al. [17].

Fig. 3. Idealized pressure profile along a horizontal return bend.
102 M. Padilla et al. / Experimental Thermal and Fluid Science 39 (2012) 98–111
As a result, the flow pattern map proposed by the latter could beused to predict the flow pattern at the inlet of the return bendfor the current experimental database.
4.2. Two-phase flow visualization in horizontal return bends
Flow regimes of HFO-1234yf and R-134a have been observed in a6.7 mm glass horizontal return bend. The range of mass velocitieswas from 300 to 500 kg m�2 s�1, vapor qualities from 5% to 95%and Tsat = 10 �C. As shown in Figs. 5 and 6, the different flow regimesobserved are: slug, intermittent and annular flows. The liquid andvapor phases distribute naturally into several recognizable flowstructures. At the beginning of the curved section of the return bend,one can see that the vapor phase moves toward the inside of thecurve, while the liquid phase moves to the outside due to the effectof the centrifugal force. After a length of about 20D from the returnbend outlet, it appears that the flow pattern recovers the originalshape it had before entering the return bend. During intermittentflow (Fig. 5b, d, e, Fig. 6b, d and e), there is a notable differenceobserved between the flow structure at G = 300 kg m�2 s�1 andG = 500 kg m�2 s�1. Increasing the mass velocity provokes highervapor velocity that distorts the interfacial waves. Large amplitudewaves intermittently wash the top of the tube while smaller ampli-tude waves are also observed in between. Large amplitude wavesoften contain entrained bubbles. Fig. 5 also presents images forannular flow regime at G = 300 kg m�2 s�1 and G = 500 kg m�2 s�1.Annular flow images show that the liquid forms a continuous filmaround the perimeter of the tube. The interface between the liquidannulus and the vapor core is disturbed by small amplitude wavesand droplets are observed to be dispersed in the vapor core.
4.3. Determination of the perturbation lengths up- anddownstream of the horizontal return bend
To determine the perturbation lengths up- and downstream ofthe horizontal return bend (sections a–a0 and b–b0, see Fig. 3), someexperimental tests have been performed using the test sectiondepicted in Fig. 2a. As can be noted, this test section contains 10pressure taps at several locations along the straight tube up- and
downstream of the return bend. Each measurement is made witha pressure transducer connected to a valve manifold which permitsto isolate the pressure drop measurement at each location whilemaintaining the same measurement uncertainty.
The effect of the saturation temperature on the pressure drop instraight tubes and also in return bends was presented in Padillaet al. [10,11] respectively. According to these experimental results,the saturation temperature of 10 �C was selected to perform thetests. As a matter of fact, this temperature corresponds to the con-dition which yielded the highest pressure drop for R-134a in ourexperimental facility. Mass velocities of G = 570 kg m�2 s�1 andG = 950 kg m�2 s�1 correspond to the minimal and maximal massvelocities studied in the present work for an inner diameter of7.90 mm. The pressure drops presented in this section correspondto the return bend pressure drop (Dprb = Dptot � Dpst,in � Dpst,out).Each measurement presented in Figs. 7 and 8 correspond to a meanof 30 data points measured during about 3 min. To compare the re-sults obtained from one to the other, the Wilcoxon matched-pairssigned rank tests for two-related samples [16] were used in allexperiments. This is a well-known non-parametric statistical testfor the relative size of the scores of the same (or matched) subjectsunder two experimental conditions by comparing the distributionsfor positive and negative differences of the ranks of their absolutevalues. The significance criterion for two independent samples wasset at p = 0.05.
Fig. 7 presents the return bend pressure drop (Dprb) as mea-sured at five different pressure tap positions downstream of thereturn bend. For the experimental conditions showed in Fig. 7a,it can be noted that there was no significant difference in the re-turn bend pressure drop between each position from 20D to 50Ddownstream of the return bend (p > 0.05). Nevertheless, a signifi-cant difference in the return bend pressure drop between the pres-sure taps located at 10D and 20D was found (p < 0.05), and thisdifference was noted to increase with the increase of the vaporquality. Fig. 7b show the results for a higher mass velocity(G = 950 kg m�2 s�1). The results obtained show that there wasno significant difference for the return bend pressure dropmeasured at 20D, 30D and 50D downstream of the return bend(p > 0.05). These results are consistent with the previously

Fig. 4. HFO-1234yf and R-134a visualizations at the return bend inlet plotted in theflow pattern map of Wojtan et al. [17] (I: intermittent, A: annular, Slug: slug, SW:stratified-wavy) Padilla et al. [10].
ig. 5. Top view of the HFO-1234yf flow patterns in a horizontal return bend forsat = 10 �C and D = 6.70 mm.
Fig. 6. Top view of the R-134a flow patterns in a horizontal return bend forTsat = 10 �C and D = 6.70 mm.
M. Padilla et al. / Experimental Thermal and Fluid Science 39 (2012) 98–111 103
published results [10,11], which have been obtained using a differ-ent methodology. Note that the perturbation lengths depend onthe vapor quality.
Fig. 8 presents the return bend pressure drop (Dprb) as mea-sured at five different pressure tap positions upstream of the re-turn bend. Fig. 8a shows the results for the R-134a with a massvelocity of G = 570 kg m�2 s�1. For these conditions, there wasno significant difference in the return bend pressure drop be-tween each pressure tap position from 5D to 50D upstream ofthe return bend (p > 0.05) when considering low vapor qualities.From a vapor quality of 20%, there is some evidence of a signifi-cant difference in the values of the return bend pressure dropmeasurements (0.05 < p < 0.2). In Fig. 8b are presented the resultsfor a mass velocity of G = 950 kg m�2 s�1. At these conditions, asignificant difference in the return bend pressure drop was found(p < 0.05) between the pressure taps located at 5D and 10D for allthe vapor qualities tested. However, from measurements at a dis-tance equal to or greater than 10D, there was no significant dif-ferences in the return bend pressure drop (p > 0.05). In Figs. 7and 8, the positions affected by the perturbations are representedby a filled marker.
FT
4.4. Two-phase pressure drop in horizontal return bends
This experimental study was carried out considering the flow ashorizontal and adiabatic. The pressure drops presented hereaftercorrespond to the return bend pressure drop (Dprb = Dptot �Dpst,in � Dpst,out). The pressure drop along the return bend (Dprb), the regular pressure drop along the length pR (Dpst(pR)) andthe singular pressure drop (Dpsing = Dpcurv + Dppert,in + Dppert,out)are presented in Fig. 9 for two different conditions as a functionof the vapor quality.
Fig. 10a presents a comparison between refrigerantsHFO-1234yf and R-134a. Results show that the pressure drop

5D 10D 20D 30D 50D0
1000
2000
3000
4000
5000
6000
7000
8000
Pressure tap position downstream of the return bend [−]
Ret
urn
bend
pre
ssur
e dr
op [P
a]
R−134aD = 7.9 mmG = 570 kg/m2sTsat = 10 °C
Pressure tap position upstream of the return bend: 50D
x=0.05x=0.10x=0.20x=0.30x=0.40x=0.50
5D 10D 20D 30D 50D0
1000
2000
3000
4000
5000
6000
7000
8000
9000
10000
Pressure tap position downstream of the return bend [−]
Ret
urn
bend
pre
ssur
e dr
op [P
a]
R−134aD = 7.9 mmG = 950 kg/m2sTsat = 10 °C
Pressure tap position upstream of the return bend: 50D
x=0.05x=0.10x=0.20
(a) (b)
Fig. 7. Return bend pressure drop measured at five different pressure tap positions downstream of the return bend. Filled markers correspond to measurements affected bythe perturbation.
5D 10D 20D 30D 50D0
1000
2000
3000
4000
5000
6000
7000
Pressure tap position upstream of the return bend [−]
Ret
urn
bend
pre
ssur
e dr
op [P
a]
R−134aD = 7.9 mm
G = 570 kg/m2s
Tsat = 10 °C
Pressure tap position downstream of the return bend: 50D
x=0.05x=0.10x=0.20x=0.30x=0.40x=0.50
5D 10D 20D 30D 50D0
1000
2000
3000
4000
5000
6000
7000
Pressure tap position upstream of the return bend [−]
Ret
urn
bend
pre
ssur
e dr
op [P
a]
R−134aD = 7.9 mm
G = 950 kg/m2s
Tsat = 10 °C
Pressure tap position downstream of the return bend: 50D
x=0.05x=0.10x=0.20
(a) (b)
Fig. 8. Return bend pressure drop measured at five different pressure tap positions upstream of the return bend. Filled markers correspond to measurements affected by theperturbation.
0 0.2 0.4 0.6 0.8 10
100
200
300
400
500
600
700
800
900
1000
Vapor quality [−]
Pres
sure
dro
p [P
a]
HFO−1234yf
D = 10.45 mm
Tsat = 10 °C
G = 300 kg/m2s
Return bendRegular (over the length π R)Singular
0 0.2 0.4 0.6 0.8 10
1000
2000
3000
4000
5000
6000
Vapor quality [−]
Pres
sure
dro
p [P
a]
HFO−1234yf
D = 7.90 mm
Tsat = 20 °C
G = 760 kg/m2s
Return bendRegular (over the length π R)Singular
(a) (b)
Fig. 9. Return bend, regular (over the length pR) and singular pressure drop vs. vapor quality.
104 M. Padilla et al. / Experimental Thermal and Fluid Science 39 (2012) 98–111

0 0.2 0.4 0.6 0.8 10
2000
4000
6000
8000
10000
12000
14000
Vapor quality [−]
Ret
urn
bend
pre
ssur
e dr
op [P
a]
Tsat = 15 °C
R−134a, D=10.85 mm, G = 300 kg/m2sHFO−1234yf, D=10.85 mm, G = 300 kg/m2sR−134a, D=7.90 mm, G = 570 kg/m2sHFO−1234yf, D=7.90 mm, G = 570 kg/m2s
0 0.2 0.4 0.6 0.8 10
2000
4000
6000
8000
10000
12000
Vapor quality [−]
Ret
urn
bend
pre
ssur
e dr
op [P
a] HFO−1234yf
D= 7.90 mm
G = 570 kg/m2s, Tsat = 10 °C
G = 750 kg/m2s, Tsat = 10 °C
G = 570 kg/m2s, Tsat = 20 °C
G = 750 kg/m2s, Tsat = 20 °C
(a) (b)
Fig. 10. Return bend pressure drop vs. vapor quality.
10 100 1000 1000010
100
1000
10000
Experimental return bend pressure drop [Pa/m]
Pred
icte
d re
turn
ben
d pr
essu
re d
rop
[Pa] Chisholm (1983)
44.4 % of the data within ± 30 %
MAE = 63.4 %
MRE = 51.7 %
R−134aHFO−1234yf
10 100 1000 1000010
100
1000
10000
Experimental return bend pressure drop [Pa/m]
Pred
icte
d re
turn
ben
d pr
essu
re d
rop
[Pa] Chen et al.(2004)
44.1 % of the data within ± 30 %
MAE = 74.5 %
MRE = 68.0 %
R−134aHFO−1234yf
10 100 1000 1000010
100
1000
10000
Experimental return bend pressure drop [Pa/m]
Pred
icte
d re
turn
ben
d pr
essu
re d
rop
[Pa] Domanski and Hermes (2008)
35.4 % of the data within ± 30 %
MAE = 80.5 %
MRE = 78.6 %
R−134aHFO−1234yf
10 100 1000 1000010
100
1000
10000
Experimental return bend pressure drop [Pa/m]
Pred
icte
d re
turn
ben
d pr
essu
re d
rop
[Pa] Padilla et al.(2009)
28.6 % of the data within ± 30 %
MAE = 44.0 %
MRE = −43.5 %
R−134aHFO−1234yf
(a) (b)
(c) (d)
Fig. 11. Experimental pressure drop data in return bends (over the length pR) compared to prediction methods (574 points).
M. Padilla et al. / Experimental Thermal and Fluid Science 39 (2012) 98–111 105
of HFO-1234yf is in general lower than the pressure drop of R-134a. This behavior occurs as a consequence of the physicalproperties of the refrigerants. Fig. 10b shows the effects of massvelocities at different saturation temperatures. The maximumpressure drop occurs above 60% of vapor quality. According tothe flow pattern map of Wojtan et al. [17], this maximum occurs
in annular flow regime. The effects of the mass velocity G andsaturation temperature Tsat in the total pressure drop are alsoobserved. As the mass velocity increases, the singular pressuredrop increases by the effect of the centrifugal forces acting onboth phases, which is consistent with the correlation of Padillaet al. [9].
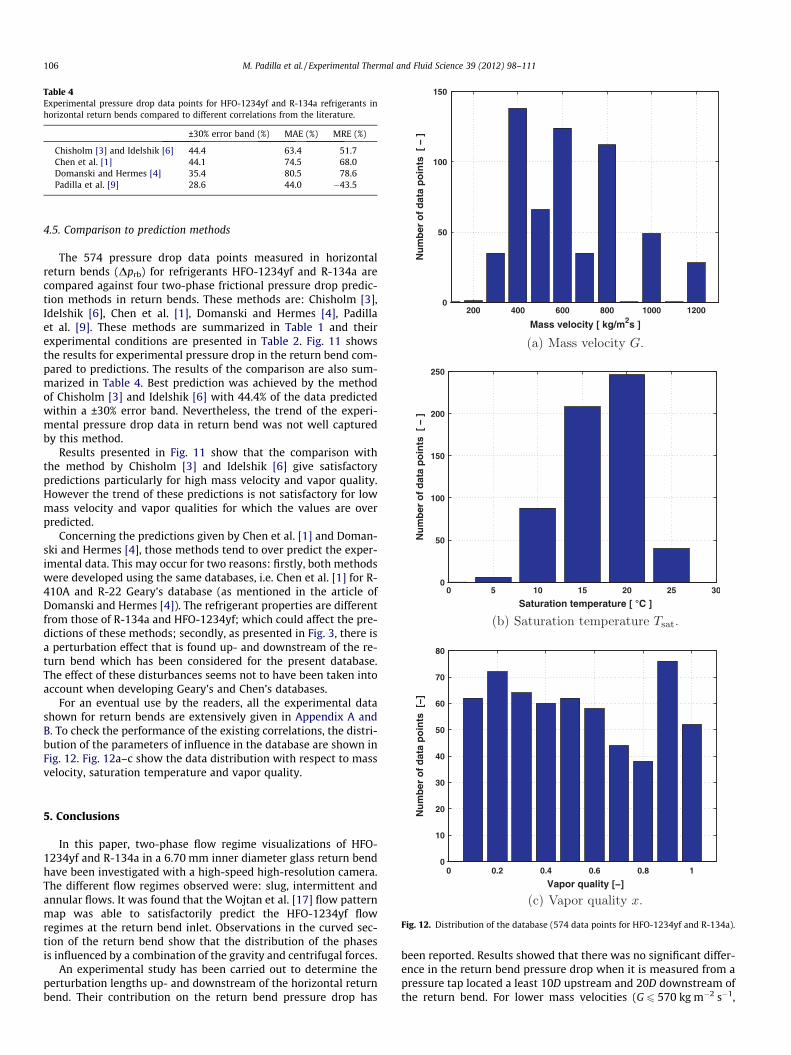
Table 4Experimental pressure drop data points for HFO-1234yf and R-134a refrigerants inhorizontal return bends compared to different correlations from the literature.
±30% error band (%) MAE (%) MRE (%)
Chisholm [3] and Idelshik [6] 44.4 63.4 51.7Chen et al. [1] 44.1 74.5 68.0Domanski and Hermes [4] 35.4 80.5 78.6Padilla et al. [9] 28.6 44.0 �43.5
106 M. Padilla et al. / Experimental Thermal and Fluid Science 39 (2012) 98–111
4.5. Comparison to prediction methods
The 574 pressure drop data points measured in horizontalreturn bends (Dprb) for refrigerants HFO-1234yf and R-134a arecompared against four two-phase frictional pressure drop predic-tion methods in return bends. These methods are: Chisholm [3],Idelshik [6], Chen et al. [1], Domanski and Hermes [4], Padillaet al. [9]. These methods are summarized in Table 1 and theirexperimental conditions are presented in Table 2. Fig. 11 showsthe results for experimental pressure drop in the return bend com-pared to predictions. The results of the comparison are also sum-marized in Table 4. Best prediction was achieved by the methodof Chisholm [3] and Idelshik [6] with 44.4% of the data predictedwithin a ±30% error band. Nevertheless, the trend of the experi-mental pressure drop data in return bend was not well capturedby this method.
Results presented in Fig. 11 show that the comparison withthe method by Chisholm [3] and Idelshik [6] give satisfactorypredictions particularly for high mass velocity and vapor quality.However the trend of these predictions is not satisfactory for lowmass velocity and vapor qualities for which the values are overpredicted.
Concerning the predictions given by Chen et al. [1] and Doman-ski and Hermes [4], those methods tend to over predict the exper-imental data. This may occur for two reasons: firstly, both methodswere developed using the same databases, i.e. Chen et al. [1] for R-410A and R-22 Geary’s database (as mentioned in the article ofDomanski and Hermes [4]). The refrigerant properties are differentfrom those of R-134a and HFO-1234yf; which could affect the pre-dictions of these methods; secondly, as presented in Fig. 3, there isa perturbation effect that is found up- and downstream of the re-turn bend which has been considered for the present database.The effect of these disturbances seems not to have been taken intoaccount when developing Geary’s and Chen’s databases.
For an eventual use by the readers, all the experimental datashown for return bends are extensively given in Appendix A andB. To check the performance of the existing correlations, the distri-bution of the parameters of influence in the database are shown inFig. 12. Fig. 12a–c show the data distribution with respect to massvelocity, saturation temperature and vapor quality.
Fig. 12. Distribution of the database (574 data points for HFO-1234yf and R-134a).
5. Conclusions
In this paper, two-phase flow regime visualizations of HFO-1234yf and R-134a in a 6.70 mm inner diameter glass return bendhave been investigated with a high-speed high-resolution camera.The different flow regimes observed were: slug, intermittent andannular flows. It was found that the Wojtan et al. [17] flow patternmap was able to satisfactorily predict the HFO-1234yf flowregimes at the return bend inlet. Observations in the curved sec-tion of the return bend show that the distribution of the phasesis influenced by a combination of the gravity and centrifugal forces.
An experimental study has been carried out to determine theperturbation lengths up- and downstream of the horizontal returnbend. Their contribution on the return bend pressure drop has
been reported. Results showed that there was no significant differ-ence in the return bend pressure drop when it is measured from apressure tap located a least 10D upstream and 20D downstream ofthe return bend. For lower mass velocities (G 6 570 kg m�2 s�1,
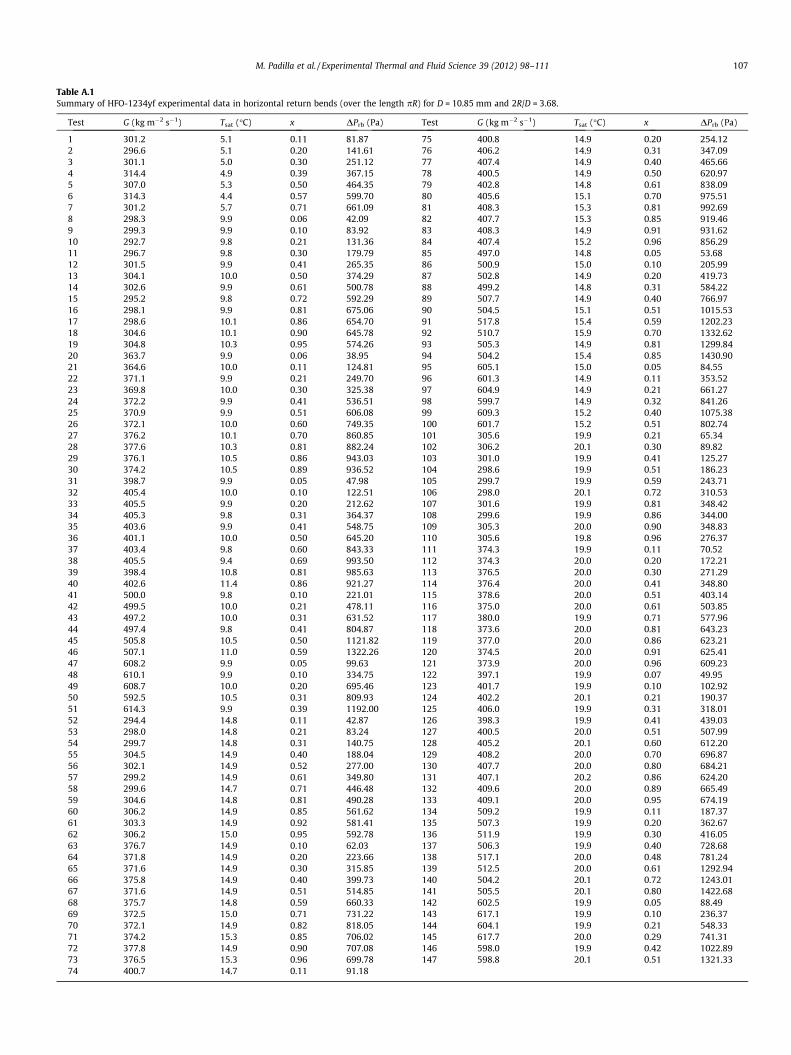
Table A.1Summary of HFO-1234yf experimental data in horizontal return bends (over the length pR) for D = 10.85 mm and 2R/D = 3.68.
Test G (kg m�2 s�1) Tsat (�C) x DPrb (Pa) Test G (kg m�2 s�1) Tsat (�C) x DPrb (Pa)
1 301.2 5.1 0.11 81.87 75 400.8 14.9 0.20 254.122 296.6 5.1 0.20 141.61 76 406.2 14.9 0.31 347.093 301.1 5.0 0.30 251.12 77 407.4 14.9 0.40 465.664 314.4 4.9 0.39 367.15 78 400.5 14.9 0.50 620.975 307.0 5.3 0.50 464.35 79 402.8 14.8 0.61 838.096 314.3 4.4 0.57 599.70 80 405.6 15.1 0.70 975.517 301.2 5.7 0.71 661.09 81 408.3 15.3 0.81 992.698 298.3 9.9 0.06 42.09 82 407.7 15.3 0.85 919.469 299.3 9.9 0.10 83.92 83 408.3 14.9 0.91 931.6210 292.7 9.8 0.21 131.36 84 407.4 15.2 0.96 856.2911 296.7 9.8 0.30 179.79 85 497.0 14.8 0.05 53.6812 301.5 9.9 0.41 265.35 86 500.9 15.0 0.10 205.9913 304.1 10.0 0.50 374.29 87 502.8 14.9 0.20 419.7314 302.6 9.9 0.61 500.78 88 499.2 14.8 0.31 584.2215 295.2 9.8 0.72 592.29 89 507.7 14.9 0.40 766.9716 298.1 9.9 0.81 675.06 90 504.5 15.1 0.51 1015.5317 298.6 10.1 0.86 654.70 91 517.8 15.4 0.59 1202.2318 304.6 10.1 0.90 645.78 92 510.7 15.9 0.70 1332.6219 304.8 10.3 0.95 574.26 93 505.3 14.9 0.81 1299.8420 363.7 9.9 0.06 38.95 94 504.2 15.4 0.85 1430.9021 364.6 10.0 0.11 124.81 95 605.1 15.0 0.05 84.5522 371.1 9.9 0.21 249.70 96 601.3 14.9 0.11 353.5223 369.8 10.0 0.30 325.38 97 604.9 14.9 0.21 661.2724 372.2 9.9 0.41 536.51 98 599.7 14.9 0.32 841.2625 370.9 9.9 0.51 606.08 99 609.3 15.2 0.40 1075.3826 372.1 10.0 0.60 749.35 100 601.7 15.2 0.51 802.7427 376.2 10.1 0.70 860.85 101 305.6 19.9 0.21 65.3428 377.6 10.3 0.81 882.24 102 306.2 20.1 0.30 89.8229 376.1 10.5 0.86 943.03 103 301.0 19.9 0.41 125.2730 374.2 10.5 0.89 936.52 104 298.6 19.9 0.51 186.2331 398.7 9.9 0.05 47.98 105 299.7 19.9 0.59 243.7132 405.4 10.0 0.10 122.51 106 298.0 20.1 0.72 310.5333 405.5 9.9 0.20 212.62 107 301.6 19.9 0.81 348.4234 405.3 9.8 0.31 364.37 108 299.6 19.9 0.86 344.0035 403.6 9.9 0.41 548.75 109 305.3 20.0 0.90 348.8336 401.1 10.0 0.50 645.20 110 305.6 19.8 0.96 276.3737 403.4 9.8 0.60 843.33 111 374.3 19.9 0.11 70.5238 405.5 9.4 0.69 993.50 112 374.3 20.0 0.20 172.2139 398.4 10.8 0.81 985.63 113 376.5 20.0 0.30 271.2940 402.6 11.4 0.86 921.27 114 376.4 20.0 0.41 348.8041 500.0 9.8 0.10 221.01 115 378.6 20.0 0.51 403.1442 499.5 10.0 0.21 478.11 116 375.0 20.0 0.61 503.8543 497.2 10.0 0.31 631.52 117 380.0 19.9 0.71 577.9644 497.4 9.8 0.41 804.87 118 373.6 20.0 0.81 643.2345 505.8 10.5 0.50 1121.82 119 377.0 20.0 0.86 623.2146 507.1 11.0 0.59 1322.26 120 374.5 20.0 0.91 625.4147 608.2 9.9 0.05 99.63 121 373.9 20.0 0.96 609.2348 610.1 9.9 0.10 334.75 122 397.1 19.9 0.07 49.9549 608.7 10.0 0.20 695.46 123 401.7 19.9 0.10 102.9250 592.5 10.5 0.31 809.93 124 402.2 20.1 0.21 190.3751 614.3 9.9 0.39 1192.00 125 406.0 19.9 0.31 318.0152 294.4 14.8 0.11 42.87 126 398.3 19.9 0.41 439.0353 298.0 14.8 0.21 83.24 127 400.5 20.0 0.51 507.9954 299.7 14.8 0.31 140.75 128 405.2 20.1 0.60 612.2055 304.5 14.9 0.40 188.04 129 408.2 20.0 0.70 696.8756 302.1 14.9 0.52 277.00 130 407.7 20.0 0.80 684.2157 299.2 14.9 0.61 349.80 131 407.1 20.2 0.86 624.2058 299.6 14.7 0.71 446.48 132 409.6 20.0 0.89 665.4959 304.6 14.8 0.81 490.28 133 409.1 20.0 0.95 674.1960 306.2 14.9 0.85 561.62 134 509.2 19.9 0.11 187.3761 303.3 14.9 0.92 581.41 135 507.3 19.9 0.20 362.6762 306.2 15.0 0.95 592.78 136 511.9 19.9 0.30 416.0563 376.7 14.9 0.10 62.03 137 506.3 19.9 0.40 728.6864 371.8 14.9 0.20 223.66 138 517.1 20.0 0.48 781.2465 371.6 14.9 0.30 315.85 139 512.5 20.0 0.61 1292.9466 375.8 14.9 0.40 399.73 140 504.2 20.1 0.72 1243.0167 371.6 14.9 0.51 514.85 141 505.5 20.1 0.80 1422.6868 375.7 14.8 0.59 660.33 142 602.5 19.9 0.05 88.4969 372.5 15.0 0.71 731.22 143 617.1 19.9 0.10 236.3770 372.1 14.9 0.82 818.05 144 604.1 19.9 0.21 548.3371 374.2 15.3 0.85 706.02 145 617.7 20.0 0.29 741.3172 377.8 14.9 0.90 707.08 146 598.0 19.9 0.42 1022.8973 376.5 15.3 0.96 699.78 147 598.8 20.1 0.51 1321.3374 400.7 14.7 0.11 91.18
M. Padilla et al. / Experimental Thermal and Fluid Science 39 (2012) 98–111 107

Table A.2Summary of HFO-1234yf experimental data in horizontal return bends (over the length pR) for D = 7.90 mm and 2R/D = 4.05.
Test G (kg m�2 s�1) Tsat (�C) x DPrb (Pa) Test G (kg m�2 s�1) Tsat (�C) x DPrb (Pa)
148 545.4 5.0 0.06 393.97 226 755.9 14.7 0.11 1026.14149 568.1 5.1 0.11 669.19 227 756.0 14.9 0.20 1927.26150 559.5 5.1 0.20 1216.03 228 766.2 14.9 0.31 2891.86151 568.0 5.0 0.30 2077.31 229 768.4 14.9 0.40 4213.55152 593.0 4.9 0.39 3071.65 230 755.5 14.9 0.50 5212.90153 579.2 5.3 0.50 3713.62 231 759.8 14.8 0.61 6078.68154 592.9 4.4 0.57 4672.83 232 765.2 15.1 0.70 5831.59155 568.1 5.7 0.71 5408.01 233 770.1 15.3 0.81 5556.83156 562.7 9.9 0.06 299.38 234 769.0 15.3 0.85 5169.82157 564.5 9.9 0.10 553.04 235 770.1 14.9 0.91 5437.09158 552.0 9.8 0.21 1179.20 236 768.5 15.2 0.96 4627.41159 559.7 9.8 0.30 1675.03 237 937.5 14.8 0.05 723.31160 568.6 9.9 0.41 2589.82 238 944.9 15.0 0.10 1354.39161 573.6 10.0 0.50 3265.77 239 948.3 14.9 0.20 2852.19162 570.8 9.9 0.61 4529.92 240 941.7 14.8 0.31 4778.52163 556.8 9.8 0.72 4866.39 241 957.7 14.9 0.40 6641.28164 562.3 9.9 0.81 4800.70 242 951.6 15.1 0.51 8114.71165 563.3 10.1 0.86 4651.47 243 976.7 15.4 0.59 10617.14166 574.7 10.1 0.90 4184.95 244 963.3 15.9 0.70 10822.83167 574.9 10.3 0.95 3089.45 245 953.2 14.9 0.81 9067.78168 686.0 9.9 0.06 443.49 246 951.0 15.4 0.85 8015.97169 687.8 10.0 0.11 810.78 247 1141.3 15.0 0.05 958.21170 700.1 9.9 0.21 1747.91 248 1134.2 14.9 0.11 2115.64171 697.6 10.0 0.30 2724.96 249 1141.1 14.9 0.21 4433.40172 702.1 9.9 0.41 4182.06 250 1131.3 14.9 0.32 7280.60173 699.6 9.9 0.51 4826.96 251 1149.2 15.2 0.40 9672.69174 701.9 10.0 0.60 5621.15 252 1135.1 15.2 0.51 10796.59175 709.5 10.1 0.70 5951.60 253 581.3 19.9 0.06 295.79176 712.2 10.3 0.81 8158.57 254 583.5 20.0 0.10 325.13177 709.4 10.5 0.86 8551.06 255 576.4 19.9 0.21 843.38178 705.8 10.5 0.89 8078.18 256 577.5 20.1 0.30 1404.30179 752.0 9.9 0.05 491.43 257 567.8 19.9 0.41 1797.80180 764.8 10.0 0.10 979.76 258 563.2 19.9 0.51 2380.83181 764.8 9.9 0.20 2095.30 259 565.3 19.9 0.59 2681.39182 764.4 9.8 0.31 3575.08 260 562.1 20.1 0.72 2810.23183 761.3 9.9 0.41 4994.30 261 569.0 19.9 0.81 2454.40184 756.5 10.0 0.50 5778.53 262 565.2 19.9 0.86 2171.71185 760.9 9.8 0.60 6728.14 263 575.9 20.0 0.90 2422.71186 765.0 9.4 0.69 6700.07 264 576.5 19.8 0.96 2157.66187 751.6 10.8 0.81 5633.50 265 695.7 19.9 0.05 378.09188 759.4 11.4 0.86 5595.45 266 706.1 19.9 0.11 731.54189 947.1 9.8 0.05 784.89 267 706.1 20.0 0.20 1386.18190 943.2 9.8 0.10 1512.92 268 710.2 20.0 0.30 1720.73191 942.2 10.0 0.21 3116.63 269 710.0 20.0 0.41 3211.06192 937.8 10.0 0.31 5462.74 270 714.1 20.0 0.51 3355.06193 938.2 9.8 0.41 7724.08 271 707.4 20.0 0.61 3717.81194 954.1 10.5 0.50 8993.36 272 716.8 19.9 0.71 4021.59195 956.4 11.0 0.59 10070.99 273 704.7 20.0 0.81 3322.54196 1147.2 9.9 0.05 991.83 274 711.0 20.0 0.86 3331.78197 1150.8 9.9 0.10 2159.11 275 706.3 20.0 0.91 3269.67198 1148.3 10.0 0.20 4526.94 276 705.2 20.0 0.96 3040.85199 1117.7 10.5 0.31 7507.85 277 749.0 19.9 0.07 538.73200 1158.8 9.9 0.39 10914.53 278 757.7 19.9 0.10 878.32201 576.3 14.9 0.05 281.19 279 758.6 20.1 0.21 1696.05202 555.3 14.8 0.11 529.57 280 765.8 19.9 0.31 2421.91203 562.1 14.8 0.21 1043.78 281 751.4 19.9 0.41 3594.57204 565.3 14.8 0.31 1564.78 282 755.4 20.0 0.51 4175.04205 574.4 14.9 0.40 2061.62 283 764.3 20.1 0.60 4701.42206 569.9 14.9 0.52 2891.12 284 769.9 20.0 0.70 4808.21207 564.3 14.9 0.61 3221.05 285 768.9 20.0 0.80 4733.05208 565.1 14.7 0.71 3427.58 286 767.9 20.2 0.86 4178.81209 574.6 14.8 0.81 3622.53 287 772.5 20.0 0.89 4130.62210 577.6 14.9 0.85 3869.80 288 771.6 20.0 0.95 3753.28211 572.1 14.9 0.92 3698.99 289 938.9 19.9 0.06 657.14212 577.5 15.0 0.95 3336.31 290 960.6 19.9 0.11 1378.62213 705.6 14.8 0.05 394.26 291 956.9 19.9 0.20 2593.17214 710.5 14.9 0.10 808.74 292 965.6 19.9 0.30 4176.78215 701.2 14.9 0.20 1511.55 293 955.1 19.9 0.40 5943.98216 700.9 14.9 0.30 2489.74 294 975.5 20.0 0.48 7227.29217 708.9 14.9 0.40 3467.13 295 966.7 20.0 0.61 7890.92218 700.9 14.9 0.51 4606.25 296 951.1 20.1 0.72 7756.91219 708.6 14.8 0.59 5205.19 297 953.5 20.1 0.80 7866.34220 702.6 15.0 0.71 5062.11 298 1136.6 19.9 0.05 726.57221 701.9 14.9 0.82 4995.93 299 1164.1 19.9 0.10 1635.90
108 M. Padilla et al. / Experimental Thermal and Fluid Science 39 (2012) 98–111

Table A.2 (continued)
Test G (kg m�2 s�1) Tsat (�C) x DPrb (Pa) Test G (kg m�2 s�1) Tsat (�C) x DPrb (Pa)
222 705.8 15.3 0.85 4650.66 300 1139.4 19.9 0.21 3798.25223 712.6 14.9 0.90 4456.21 301 1165.1 20.0 0.29 6168.15224 710.1 15.3 0.96 4010.25 302 1128.0 19.9 0.42 8537.38225 751.6 14.8 0.05 457.51 303 1129.5 20.1 0.51 9869.74
Table B.1Summary of R-134a experimental data in horizontal return bends (over the length pR) for D = 10.85 mm and 2R/D = 3.68.
Test G (kg m�2 s�1) Tsat (�C) x DPrb(Pa) Test G (kg m�2 s�1) Tsat (�C) x DPrb (Pa)
304 215.1 10.1 0.04 50.82 372 398.2 15.2 0.31 394.35305 196.5 10.2 0.11 66.17 373 398.8 15.1 0.41 557.77306 207.7 10.1 0.19 92.62 374 398.5 15.1 0.49 680.56307 321.9 10.2 0.05 41.23 375 394.0 15.0 0.61 820.71308 309.0 10.1 0.11 63.99 376 402.6 15.1 0.70 955.28309 303.1 10.2 0.21 106.09 377 400.0 15.2 0.81 973.57310 299.6 10.1 0.29 185.77 378 403.6 15.4 0.85 926.51311 305.5 10.1 0.41 320.99 379 405.6 15.3 0.91 857.91312 307.1 10.3 0.50 441.28 380 405.1 15.3 0.96 680.67313 305.5 10.2 0.62 575.23 381 502.2 15.0 0.05 130.42314 306.9 10.2 0.67 645.05 382 496.1 15.0 0.10 120.25315 292.3 9.8 0.80 643.41 383 499.4 15.0 0.21 435.97316 291.8 10.5 0.86 611.66 384 505.3 14.9 0.30 740.05317 291.7 9.8 0.92 536.65 385 499.2 15.0 0.40 1321.89318 310.4 11.0 0.94 483.82 386 502.5 15.1 0.52 2005.61319 371.3 10.1 0.05 81.13 387 505.4 15.1 0.61 2820.69320 369.9 10.3 0.11 106.63 388 499.2 15.5 0.69 3659.24321 369.0 10.2 0.21 282.22 389 592.1 15.0 0.06 239.19322 367.9 10.1 0.31 459.72 390 592.9 15.0 0.11 541.72323 369.7 10.1 0.41 513.52 391 604.7 15.1 0.21 1006.33324 370.3 10.2 0.50 663.00 392 604.4 15.1 0.31 2055.96325 373.6 10.5 0.61 797.00 393 605.0 15.0 0.41 3245.15326 375.7 11.4 0.70 784.54 394 305.0 19.9 0.06 86.45327 377.0 10.2 0.79 793.28 395 313.7 19.9 0.10 134.75328 376.1 10.4 0.86 722.89 396 294.0 19.9 0.22 257.20329 374.8 10.4 0.91 518.35 397 295.3 19.9 0.32 336.80330 398.3 10.2 0.10 178.17 398 304.5 19.9 0.42 451.84331 393.1 10.2 0.21 336.40 399 301.3 19.9 0.53 556.72332 400.8 10.2 0.30 465.14 400 303.8 19.9 0.60 603.13333 398.9 10.3 0.41 633.24 401 296.7 19.8 0.73 667.67334 397.5 10.1 0.49 711.22 402 296.1 19.9 0.81 682.64335 398.8 10.2 0.60 791.34 403 303.5 19.8 0.86 676.37336 397.0 10.1 0.70 997.10 404 304.9 19.9 0.92 621.50337 402.4 10.9 0.80 1031.39 405 306.5 20.0 0.96 551.95338 408.9 11.2 0.85 1084.32 406 406.5 19.9 0.05 85.08339 484.6 10.2 0.06 161.35 407 396.6 19.9 0.11 277.88340 494.4 10.2 0.11 317.07 408 399.5 19.9 0.20 599.87341 503.3 10.1 0.20 550.87 409 392.3 19.8 0.32 847.90342 498.3 10.5 0.33 825.51 410 399.4 19.9 0.40 1039.53343 496.5 10.7 0.40 915.91 411 402.7 19.8 0.50 1208.13344 492.1 10.3 0.50 1199.86 412 402.5 19.9 0.62 1269.65345 301.5 15.0 0.06 53.10 413 392.9 20.0 0.72 1153.30346 298.9 15.1 0.11 54.82 414 391.9 19.9 0.82 1017.43347 300.6 15.1 0.21 103.47 415 397.7 19.9 0.87 866.09348 304.6 15.0 0.30 166.79 416 400.5 19.9 0.91 756.35349 305.9 15.0 0.40 256.45 417 402.9 19.9 0.94 713.22350 303.9 15.1 0.51 332.70 418 496.2 19.8 0.05 54.50351 298.6 15.0 0.61 394.86 419 497.9 19.8 0.11 176.77352 306.4 15.0 0.69 483.30 420 505.7 19.9 0.21 715.52353 306.0 15.1 0.82 553.45 421 493.8 19.9 0.31 1437.23354 312.5 15.1 0.84 545.88 422 497.3 19.8 0.41 2176.12355 313.0 15.1 0.90 494.21 423 505.4 20.0 0.50 3182.21356 319.2 15.1 0.93 387.50 424 502.0 19.9 0.61 3416.08357 374.9 15.0 0.05 53.48 425 504.9 20.0 0.70 3815.83358 371.0 15.0 0.10 98.71 426 499.7 19.9 0.82 4191.44359 363.9 15.1 0.21 202.66 427 598.3 19.9 0.05 147.35360 369.5 15.1 0.31 352.02 428 596.9 19.9 0.10 808.56361 380.4 15.1 0.40 507.72 429 596.8 19.9 0.20 1664.57362 371.4 15.1 0.50 582.06 430 590.7 19.9 0.31 2318.54363 378.0 15.0 0.60 743.36 431 603.0 20.0 0.41 3030.85364 370.4 15.0 0.73 821.56 432 605.6 20.1 0.49 3519.47365 375.4 15.0 0.79 796.66 433 308.9 5.0 0.06 44.85366 378.8 15.2 0.85 771.38 434 297.3 5.1 0.10 63.02367 379.3 15.0 0.91 699.28 435 297.0 5.0 0.21 125.97
(continued on next page)
M. Padilla et al. / Experimental Thermal and Fluid Science 39 (2012) 98–111 109

Table B.1 (continued)
Test G (kg m�2 s�1) Tsat (�C) x DPrb(Pa) Test G (kg m�2 s�1) Tsat (�C) x DPrb (Pa)
368 379.0 15.4 0.97 582.53 436 301.4 5.3 0.30 199.22369 401.9 15.1 0.05 82.98 437 294.4 5.1 0.41 284.75370 403.0 15.1 0.11 116.75 438 295.3 5.9 0.51 367.98371 391.5 15.1 0.21 248.67 439 296.8 5.0 0.59 449.07
Table B.2Summary of R-134a experimental data in horizontal return bends (over the length pR) for D = 7.90 mm and 2R/D = 4.05.
Test G (kg m�2 s�1) Tsat (�C) x DPrb(Pa) Test G (kg m�2 s�1) Tsat (�C) x DPrb (Pa)
440 405.7 10.1 0.04 123.12 508 752.2 15.1 0.41 4441.22441 370.7 10.2 0.11 249.84 509 751.6 15.1 0.49 5139.71442 391.9 10.1 0.19 408.76 510 743.2 15.0 0.61 5874.79443 582.9 10.1 0.11 602.89 511 759.4 15.1 0.70 6058.51444 571.7 10.2 0.21 1062.47 512 754.6 15.2 0.81 5072.83445 565.1 10.1 0.29 1744.88 513 761.2 15.4 0.85 4708.08446 576.2 10.1 0.41 2766.27 514 765.0 15.3 0.91 3647.17447 579.3 10.3 0.50 3211.72 515 764.2 15.3 0.96 3062.72448 576.3 10.2 0.62 3467.20 516 947.2 15.0 0.05 429.79449 578.8 10.2 0.67 3269.23 517 935.9 15.0 0.10 1324.72450 551.4 9.8 0.80 2632.16 518 942.0 15.0 0.21 3003.21451 550.4 10.5 0.86 2137.38 519 953.2 14.9 0.30 5362.28452 550.2 9.8 0.92 1516.89 520 941.6 15.0 0.40 7063.02453 700.4 10.1 0.05 336.59 521 947.9 15.1 0.52 9185.76454 697.8 10.3 0.11 838.04 522 953.3 15.1 0.61 9590.43455 696.1 10.2 0.21 1863.01 523 941.7 15.5 0.69 9658.15456 693.9 10.1 0.31 3015.63 524 1116.8 15.0 0.06 1008.83457 697.4 10.1 0.41 4753.73 525 1118.5 15.0 0.11 2294.24458 698.4 10.2 0.50 5424.90 526 1140.6 15.1 0.21 4848.38459 704.7 10.5 0.61 7310.74 527 1140.0 15.1 0.31 7814.36460 708.6 11.4 0.70 6764.00 528 1141.1 15.0 0.41 11201.95461 711.2 10.2 0.79 5188.80 529 575.4 19.9 0.06 270.01462 709.3 10.4 0.86 3931.56 530 591.8 19.9 0.10 703.59463 707.0 10.4 0.91 2872.70 531 554.5 19.9 0.22 1342.52464 693.1 10.5 0.97 2675.09 532 557.0 19.9 0.32 1909.59465 756.5 10.1 0.05 429.21 533 574.4 19.9 0.42 2272.74466 751.4 10.2 0.10 1072.85 534 568.3 19.9 0.53 2594.28467 741.5 10.2 0.21 2395.89 535 573.0 19.9 0.60 2713.33468 756.0 10.2 0.30 3724.77 536 559.7 19.8 0.73 2749.73469 752.4 10.3 0.41 5431.28 537 558.6 19.9 0.81 2586.38470 749.7 10.1 0.49 6031.95 538 572.5 19.8 0.86 2423.93471 752.3 10.2 0.60 6353.09 539 575.2 19.9 0.92 2097.56472 748.8 10.1 0.70 6095.47 540 578.1 20.0 0.96 1891.97473 759.0 10.9 0.80 6062.04 541 766.9 19.9 0.05 476.42474 771.3 11.2 0.85 5361.92 542 748.2 19.9 0.11 1012.32475 914.2 10.2 0.06 815.19 543 753.5 19.9 0.20 1463.35476 932.5 10.2 0.11 2036.96 544 739.9 19.8 0.32 2822.67477 949.3 10.1 0.20 3632.80 545 753.4 19.9 0.40 3820.74478 939.8 10.5 0.33 6751.92 546 759.6 19.8 0.50 4751.92479 936.6 10.7 0.40 8698.13 547 759.2 19.9 0.62 5478.38480 928.3 10.3 0.50 10067.50 548 741.1 20.0 0.72 5327.17481 568.8 15.0 0.06 234.18 549 739.2 19.9 0.82 4732.44482 563.9 15.1 0.11 443.01 550 750.1 19.9 0.87 3949.86483 567.1 15.1 0.21 975.68 551 755.4 19.9 0.91 3201.54484 574.6 15.0 0.30 1498.77 552 760.0 19.9 0.94 3007.34485 576.9 15.0 0.40 2258.66 553 936.0 19.8 0.05 346.53486 573.2 15.1 0.51 3051.47 554 939.2 19.8 0.11 1160.20487 563.2 15.0 0.61 3314.65 555 953.8 19.9 0.21 2669.62488 577.9 15.0 0.69 3308.95 556 931.5 19.9 0.31 4721.55489 577.3 15.1 0.82 2967.59 557 938.0 19.8 0.41 6426.88490 589.5 15.1 0.84 2652.77 558 953.2 20.0 0.50 6885.45491 590.3 15.1 0.90 2327.52 559 946.9 19.9 0.61 8022.71492 602.1 15.1 0.93 1884.15 560 952.5 20.0 0.70 7564.30493 707.1 15.0 0.05 325.90 561 942.6 19.9 0.82 6255.11494 699.9 15.0 0.10 775.44 562 1128.5 19.9 0.05 688.94495 686.4 15.1 0.21 1669.69 563 1125.8 19.9 0.10 2032.01496 697.0 15.1 0.31 2711.38 564 1125.7 19.9 0.20 4873.47497 717.6 15.1 0.40 3937.93 565 1114.2 19.9 0.31 7605.33498 700.6 15.1 0.50 4581.39 566 1137.4 20.0 0.41 9536.93499 712.9 15.0 0.60 5090.70 567 1142.4 20.1 0.49 10864.43500 698.7 15.0 0.73 4969.04 568 582.8 5.0 0.06 397.78501 708.1 15.0 0.79 4974.62 569 560.7 5.1 0.10 629.92502 714.5 15.2 0.85 3850.62 570 560.1 5.0 0.21 1313.24503 715.5 15.0 0.91 3280.17 571 568.4 5.3 0.30 1919.94
110 M. Padilla et al. / Experimental Thermal and Fluid Science 39 (2012) 98–111
Table B.2 (continued)
Test G (kg m�2 s�1) Tsat (�C) x DPrb(Pa) Test G (kg m�2 s�1) Tsat (�C) x DPrb (Pa)
504 714.9 15.4 0.97 3005.22 572 555.3 5.1 0.41 2658.47505 760.2 15.1 0.11 926.67 573 557.0 5.9 0.51 3041.53506 738.5 15.1 0.21 1939.96 574 559.8 5.0 0.59 3644.16507 751.1 15.2 0.31 3149.56
M. Padilla et al. / Experimental Thermal and Fluid Science 39 (2012) 98–111 111
D = 7.90 mm), the upstream tap position can be located up to 5Dwithout obtaining a significant difference on return bend pressuredrop. Note that the perturbation length is a function of the vaporquality.
In addition, 574 pressure drop data points measured in horizon-tal return bends have been presented for the next generationrefrigerant HFO-1234yf and the well-known R-134a refrigerant.The tube diameter (D) ranged from 7.9 to 10.85 mm and the curva-ture ratio (2R/D) from 3.68 to 4.05. The return bend pressure dropwas determined by subtracting the inlet and outlet regular pres-sure drops in straight tube from the total pressure drop. It has beenshown that the return bend pressure drop increases when the massvelocity increases because of the increasing effect of the centrifugalforce acting on both phases. This experimental data have beencompared against correlations found in the literature.
In the future, an improved prediction method for return bendpressure drop including important parameters such as void frac-tion, curvature ratio and effect of the orientation (i.e vertical orien-tation) should be developed in order to better predict the presentexperimental data.
Appendix A
See Tables A.1, A.2.
Appendix B
See Tables B.1, B.2.
References
[1] I.Y. Chen, C.-C. Wang, S.Y. Lin, Measurements and correlations of frictionalsingle-phase and two-phase pressure drops of R-410A flow in small U-typereturn bends, Exp. Thermal Fluid Sci. 47 (2004) 2241–2249.
[2] I.Y. Chen, Y.-S. Wu, J.-S. Liaw, C.-C. Wang, Two-phase frictional pressure dropmeasurements in U-type wavy tubes subject to horizontal and verticalarrangements, Appl. Thermal Eng. 28 (2008) 847–855.
[3] D. Chisholm, Two-phase flow in pipelines and heat exchangers, GeorgeGodwin, London, 1983. p. 304.
[4] P.A. Domanski, C.J.L. Hermes, An improved correlation for two-phase pressuredrop of R-22 and R-410A in 180� return bends, Appl. Thermal Eng. 28 (2008)793–800.
[5] D.F. Geary, Return bend pressure drop in refrigeration systems, ASHRAE Trans.81 (1975) 250–264.
[6] I.E. Idelshik, Handbook of Hydraulic Resistance, second ed., Hemisphere, NewYork, p. 640, 1986.
[7] E. Lemmon, M. McLinden, M. Huber, NIST Reference Fluids Thermodynamicand Transport Properties – Refprop 8.0, NIST Standard Reference Database23, National Institute of Standards and Technology, 2007, Gaithersburg, MD,USA.
[8] H. Müller-Steinhagen, K. Heck, A simple friction pressure drop correlation fortwo-phase flow pipes, Chem. Eng. Proc. 20 (1986) 297–308.
[9] M. Padilla, R. Revellin, J. Bonjour, Prediction and simulation of two-phasepressure drop in return bends, Int. J. Refrig. 32 (2009) 1776–1783.
[10] M. Padilla, R. Revellin, P. Haberschill, A. Bensafi, J. Bonjour, Flow regimes andtwo-phase pressure gradient in horizontal straight tubes: Experimental resultsfor HFO1234yf, R134a and R410A, Exp. Thermal Fluid Sci. 35 (2011)1113–1126.
[11] M. Padilla, R. Revellin, P. Haberschill, J. Bonjour, Two-phase pressure drop inreturn bends: Experimental results for R410A, Int. J. Refrig. 34 (2011)1854–1865.
[12] B. Pierre, Flow resistance with boiling refrigerants-Part II flow resistance inreturn bends, ASHRAE J. (1964) 73–77.
[13] R. Revellin, S. Lips, S. Khandekar, J. Bonjour, Local entropy generation forsaturated two-phase flow, Energy 34 (9) (2009) 1113–1121.
[14] R. Silva-Lima, J. Thome, Two-phase pressure drops in adiabatic horizontalcircular smooth u-bends and contiguous straight pipes, HVAC & R Res. 16 (3)(2010) 383–397.
[15] D.P. Traviss, W.M. Rohsenow, The influence of return bends on thedownstream pressure drop and condensation heat transfer in tubes, in:ASHRAE Semiannual Meeting, Chicago, Paper 2269RP-63, 1973.
[16] F. Wilcoxon, Some rapid approximate statistical procedures, Ann. N.Y. Acad.Sci. 52 (6) (1950) 808–814.
[17] L. Wojtan, T. Ursenbacher, J.R. Thome, Investigation of flow boiling inhorizontal tubes. Part I – A new diabatic two-phase flow pattern map, Int. J.Heat Mass Transfer 48 (2005) 2955–2969.

![Theorotical Exergy Analysis of Actual Vapour Compression … · 2017-07-22 · appreciably lower than that of R-134a. Navarro-Esbri[17] analysed that the cooling capacity of R-1234yf](https://static.fdocuments.us/doc/165x107/5e3ecd8aa012942cfb099d08/theorotical-exergy-analysis-of-actual-vapour-compression-2017-07-22-appreciably.jpg)