Two distinct neuronal mechanisms underlying high frequency...
29
Two distinct neuronal mechanisms underlying high frequency power changes in human local field potential recordings Ashwin G. Ramayya 1 , Jeremy R. Manning 3,4 , Joshua Jacobs 5 , Itzhak Fried 6,7,8,9 , and Michael J. Kahana 2 1 Neuroscience Graduate Group and 2 Department of Psychology, University of Pennsylvania, Philadelphia, PA 19104 3 Princeton Neuroscience Institute and 4 Department of Computer Science, Princeton University, Princeton, NJ 08540 5 School of Biomedical Engineering, Sciences, and Health Systems, Drexel University, Philadelphia, PA 19104 6 Division of Neurosurgery and 7 Semel Institute of Neuroscience and Human Behavior, University of California, Los Angeles, CA 90095 8 Functional neurosurgery unit, Tel-Aviv Medical Center and 9 Sackler Faculty of Medicine, Tel-Aviv University, Tel-Aviv 69978, Israel Correspondence should be addressed to M.J.K. ([email protected]). Mailing address: Department of Psychology University of Pennsylvania 3401 Walnut St., Room 303C Philadelphia, PA 19104 lick here to view linked References
Transcript of Two distinct neuronal mechanisms underlying high frequency...
Two distinct neuronal mechanisms underlying highfrequency power changes in human local field potential
recordings
Ashwin G. Ramayya1, Jeremy R. Manning3,4, Joshua Jacobs5, Itzhak Fried6,7,8,9,and Michael J. Kahana2
1Neuroscience Graduate Group and 2Department of Psychology, University of Pennsylvania,Philadelphia, PA 19104
3Princeton Neuroscience Institute and 4Department of Computer Science, Princeton University,Princeton, NJ 08540
5School of Biomedical Engineering, Sciences, and Health Systems, Drexel University,Philadelphia, PA 19104
6Division of Neurosurgery and 7Semel Institute of Neuroscience and Human Behavior,University of California, Los Angeles, CA 90095
8Functional neurosurgery unit, Tel-Aviv Medical Center and 9Sackler Faculty of Medicine,Tel-Aviv University, Tel-Aviv 69978, Israel
Correspondence should be addressed to M.J.K. ([email protected]).Mailing address:
Department of PsychologyUniversity of Pennsylvania3401 Walnut St., Room 303C
Philadelphia, PA 19104
*ManuscriptClick here to view linked References
Summary
Recent work has established broadband, high frequency power (50-200 Hz) in the local field
potential (LFP) as an important correlate of neuronal firing rates. To better understand how the
firing rates of individual neurons relate to high frequency power in the LFP, we simultaneously
recorded single-neuron firing and LFPs from the brains of 20 neurosurgical patients. Analyzing
data from 2,030 neocortical and medial temporal lobe neurons, we identified neurons whose
firing rates were positively correlated with high frequency power and assessed whether there
were non-linearities in these relations. We discovered two subpopulations of neurons: one for
which increases in firing rate were associated with superlinear increases in high frequency power,
and another for which increases in firing rate were associated with linear increases in high
frequency power. These subpopulations of neurons displayed distinct local neuronal correlations
and thus likely represent functionally distinct contributions to high frequency changes in LFP
power.
1
Research highlights:
• Two neuronal subpopulations display a positive correlation with HFP (50-200 Hz)
• Superlinear neurons increase their correlation with HFP as a function of firing rate
• Linear neurons maintain a similar correlation with HFP across various firing rates
• These subpopulations di↵er in their local neuronal correlations
2
Introduction
Whereas much has been learned about how spectral components of the local field potential (LFP)
vary with behavioral and cognitive states (Buzsaki, 2006; Manning et al., 2011, 2012), the relation
of the LFP to underlying neuronal activity remains poorly understood. A deeper understanding
of the neuronal mechanisms underlying spectral changes in the LFP is particularly important for
studies where single-neuron firing rates are not recorded (Buzsaki et al., 2012).
Several aspects of the relation between neuronal activity and the LFP have recently been
characterized. For example, the firing rates of individual neurons have been shown to be
positively correlated with broadband, high frequency power (HFP, most prominently in the
50–200 Hz range) in the LFP, both in humans (Manning et al., 2009) and monkeys (Ray et al.,
2008a,b; Whittingstall and Logothetis, 2009). These spectral changes, which have been referred to
in the literature both as changes in “high-gamma” and “broadband” power, are observed as
changes in power at a broad range of high frequencies, and likely represent a distinct
physiological process from the well-described, 30–50 Hz gamma oscillation (Jacobs et al., 2010b;
Miller, 2010; Crone et al., 2011; Ray and Maunsell, 2011).
When describing the relation between neural firing and HFP, many studies implicitly assume
a linear relation between the two processes (Fries et al., 2001; Mukamel et al., 2005; Rasch et al.,
2008; Manning et al., 2009). However, recent work has suggested that there may be substantial
non-linearities in the firing rate–HFP relation (Nir et al., 2007; Ray et al., 2008a; Mazzoni et al.,
2010). Nir et al. (2007) described neurons in the human auditory cortex whose firing rates became
more positively correlated with HFP as they became more positively correlated with the firing
rates of surrounding neurons in the local population. Furthermore, Ray et al 2008a proposed a
model which predicts a superlinear relation between firing rate and HFP when sampling from a
neuronal population that is firing in a correlated manner, but a linear relation when sampling
3
from a population that is firing in an uncorrelated manner.
To determine whether neurons in the human brain exhibit such non-linearities, we analyzed
simultaneous single-neuron and LFP recordings taken as neurosurgical patients performed a
virtual navigation task (Ekstrom et al., 2003). Our analyses revealed two populations of neurons:
one that displays a superlinear relation between firing rate and HFP, and another that displays a
linear relation. We show that superlinear neurons display greater firing rate–related increases in
local neuronal correlations than do linear neurons. Our findings thus suggest two distinct
neuronal mechanisms that underlie high frequency spectral changes in the LFP.
Experimental Procedures
Electrophysiological recordings. We analyzed microelectrode recordings from 20
neurosurgical patients undergoing treatment for drug-resistant epilepsy. Patients played a
virtual-navigation game, Yellow Cab, in which they assume the role of a taxi driver and chau↵eur
(virtual) passengers to their desired destinations. While playing this game, patients learn the
virtual environment’s layout (Newman et al., 2007). Previous studies have used this dataset to
report on the neural correlates of spatial navigation (Caplan et al., 2003; Ekstrom et al., 2003, 2005;
Jacobs et al., 2010a) and the relation between single-unit firing and spectral features of the LFP
(Jacobs et al., 2007; Manning et al., 2009).
Patients were implanted with 6-12 depth macroelectrodes to map functional brain tissue and
identify their seizure foci for potential subsequent surgical resection. Nine microwires (40 µm in
diameter) extended from the tip of each depth macroelectrode and recorded voltage from local
regions of cortex (the ninth wire served as a recording reference). We obtained 32 kHz recordings
from the frontal cortex, posterior cortex (temporal, parietal and occipital cortices), amygdala,
hippocampus, and parahippocampal region (Witter, 2002). We isolated both low-frequency LFPs
4
(Mukamel et al., 2005; Jacobs et al., 2007) and high-frequency single-unit action potentials (Fried
et al., 1999) from each microwire contact. We used the WaveClus software package (Quiroga
et al., 2004), to identify 0-4 neurons per microwire, for a total of 2,030 neurons across all
participants. We then convolved each neuron’s spike train with a Gaussian kernel (half-width =
500 ms) to generate a smoothed firing rate over each recording session. To prevent action
potential waveforms from contaminating the LFP signal, we replaced the data samples in the -2
to 8 ms window surrounding each action potential with a linear interpolation of the underlying
LFP signal (Jacobs et al., 2007). In order to reduce computational load, we downsampled the LFP
recordings to 2 kHz. We then applied second-order Butterworth notch filters at 60 Hz, 120 Hz
and 180 Hz to remove line noise and harmonics thereof.
LFP feature extraction We measured oscillatory power in the LFP signal using Morlet wavelets
(wave number = 5) at 50 log-spaced frequencies between 2 and 200 Hz. We log-transformed the
wavelet-calculated powers to make the distributions approximately Gaussian (Percival and
Walden, 1993; Henrie and Shapley, 2005) and z-transformed the powers recorded at each
electrode to have a mean of 0 and a SD of 1 to account for inter-electrode impedence di↵erences.
We also z-tranformed the power distribution at each individual frequency to have a mean of 0
and a SD of 1 so that power at individual frequencies contributed equally to our analyses despite
the overall 1/ f ↵ shape of the power spectrum. To analyze the relation between spectral power
and neuronal firing rates, we next divided each recording session into 500 ms epochs. This epoch
length was chosen to balance temporal resolution (which we sought to maximize) with
correlation across successive measurements (which we sought to minimize). In each epoch, we
then computed the mean smoothed firing rate (FR), and mean broadband high-frequency power
(HFP, 50–200 Hz). We removed epochs with either FR or HFP above the 99th percentile to reduce
5
the e↵ects of non-biological noise on our analysis.
HFP+ neurons Because previous work has shown that HFP is generally positively correlated
with FR (Mukamel et al., 2005; Manning et al., 2009; Ray and Maunsell, 2011), and because our
goal here is to understand the nature of this positive correlation, we have limited our analyses to
neurons whose FRs were positively correlated with HFP (HFP+ neurons). For each neuron, we
computed a Pearson’s correlation coe�cient (r) between FR and HFP over the entire recording
session (with one mean FR, and one mean HFP measured for each 500 ms epoch). We used a
permutation procedure to determine whether r was statistically significant. For each neuron, we
generated 1,000 shu✏ed recordings by circularly shifting the FR values across epochs by a
random number of elements. We then computed r between FR and HFP in each shu✏ed session
and determined, for each neuron, the value of r that allowed for a 5% false positive rate in
designating the neuron as HFP+ (rFP). We designated a neuron as HFP+ if r was greater than rFP.
We excluded two recording sessions that had relatively few observations (< 5 percentile, 14.8
min) when compared to the typical session (mean ± SD, 24.53 ± 6.56 min). Additionally, we
excluded sparsely firing neurons (mean firing rates < 1 Hz) as they are often incorrectly labelled
as independent neurons by waveform clustering algorithms (Quiroga et al., 2005; Martinez et al.,
2009).
Assessing the non-linearity of the FR–HFP relation To assess the non-linearity of the FR–HFP
relation, we used a sliding window-based method to estimate how HFP changed as a function of
the FR of each neuron. Based on FR across the entire recording session, we identified
incrementally increasing and overlapping firing rate windows (0-20, 0.1-20.1,...80-100 percentile),
henceforth “windows.” Prior to defining these windows, we excluded epochs that contained no
spikes. Each window contained an approximately equal number of 500 ms epochs. For each
6
window, we computed mean FR and mean HFP to generate a FR–HFP function, which
summarized the relation between each neuron’s FR and HFP. Next, we assesed whether there
were significant non-linearities in this relation by fitting a quadratic model to each neuron’s
FR–HFP function using least-squares regression. If the second-order � coe�cient of this model
was significantly greater than zero (as determined by a permutation procedure; see below), we
classified the neuron as “superlinear.” If the second-order � coe�cient was significantly less than
zero, we classified the neuron as “sublinear.” If the second-order � coe�cient was not
significantly di↵erent from zero, we classified the neuron as “linear.” In this way, we classified
neurons based on the non-linearity of their firing rate-LFP relations.
Again, we used a permutation procedure to measure the statistical significance of these
patterns. For each neuron, we generated 1,000 shu✏ed FR–HFP functions by repeating our
sliding window-based analysis on shu✏ed recordings, where the FR values were circularly
shifted accross epochs (see “Identifying HFP+ neurons”). We then used least squares regression
to fit quadratic functions to each of these 1,000 shu✏ed FR–HFP functions and determined a p
threshold to ensure a 5% false-positive rate for designating a neuron as nonlinear (superlinear or
sublinear).
Assessing a neuron’s relation to the surrounding neurons in the local population Because
each macroelectrode had 8 microelectrode contacts (see, “Electrophysiological recordings,”
above) we were able to obtain simultaneous recordings from multiple neurons within a localized
region of cortex (Fried et al., 1999). Thus, we were able to assess each neuron’s relation to
neighboring neurons in the local population. For each neuron, we defined “neighboring
neurons” as neurons recorded on the same macroelectrode, but not on the same microelectrode
contact (to avoid artifactual correlations that may have emerged when the clustering algorithm
7
falsely labelled a single neuron as multiple neurons). We only considered neurons with at least 6
identified neigboring neurons to ensure adequate sampling of the surrounding population while
maintaining a sizeable number neurons in the analysis.
To simultaneously capture fluctuations in the FR–HFP and FR–FR relations, we divided each
neuron’s recording session into 10-second time epochs and quantified the FR–HFP and the
FR–FR relations in the following manner. For the FR–HFP relation, we measured the Pearson’s
correlation coe�cient between FR and HFP (rFR�HFP), each measured over 500 ms epochs (see
“LFP feature extraction”). For the FR–FR relation, we calculated the mean pairwise correlation
(rFR�FR) between the neuron’s FR and FRs of neighboring neurons, again measured over 500 ms
epochs. The mean pairwise correlation assesses the degree to which the firing rates of local
neurons covary, but does not assess synchronous (or co-incident) firing of individual action
potentials within the local population (Denker et al., 2011).
Results
Twenty neurosurgical patients were implanted with microelectrode bundles that simultaneously
recorded co-localized neuronal spiking (2,030 neurons total) and LFP signals as they performed a
virtual navigation task. For each neuron, we mesured mean firing rate (FR) and mean high
frequency power (HFP, 50–200 Hz) recorded from the microelectrode over 500 ms epochs. We
identified 1,155 neurons met our minimum FR and session length inclusion criteria (see
Experimental Procedures). We found the FRs of 330 of these neurons to be positively correlated
with HFP (HFP+ neurons, as compared with the expected count of 57 neurons,
�21 = 1, 351; p < 0.001). For each HFP+ neuron, we generated a FR–HFP function, which measured
FR and HFP over incrementally increasing and overlapping quintiles of firing rate (Figures 1.a
and 2.a). We observed many of these neurons to have positively accelerated FR–HFP functions.
8
To quantify these nonlinearities, we fit a quadratic model to each neuron’s FR–HFP function. If
the second-order � coe�cient of this quadratic model was significantly greater than zero (as
determined by a permutation procedure), we classified the neuron as superlinear; if it was
significantly less than zero, we classified the neuron as sublinear. On the other hand, if the
second-order � coe�cient was not significantly di↵erent from zero, we classified the neuron as
linear. A superlinear function suggests that FR is most positively correlated with HFP during
periods of relatively rapid firing, while a sublinear function suggests that FR is most positively
correlated with HFP during periods of relatively slow firing. A linear function, on the other hand,
suggests that FR is similarly correlated with HFP both during periods of rapid and slow firing.
Among HFP+ neurons, we identified more superlinear neurons (n=100), but not more
sublinear neurons (n=5), than expected by chance (�22 = 1, 047; p < 0.001, Table S1). The few
sublinear neurons detected here were likely false-positives from our sliding window-based
detection method, which we set to have a 5% false positive rate (see Experimental Procedures);
therefore, we do not discuss these sublinear neurons further. In summary, we found that the
population of HFP+ neurons were comprised of superlinear and linear subpopulations. The
remainder of our analyses assess di↵erences between these neuronal subpopulations.
Relation between firing rate (FR) and high frequency power (HFP)
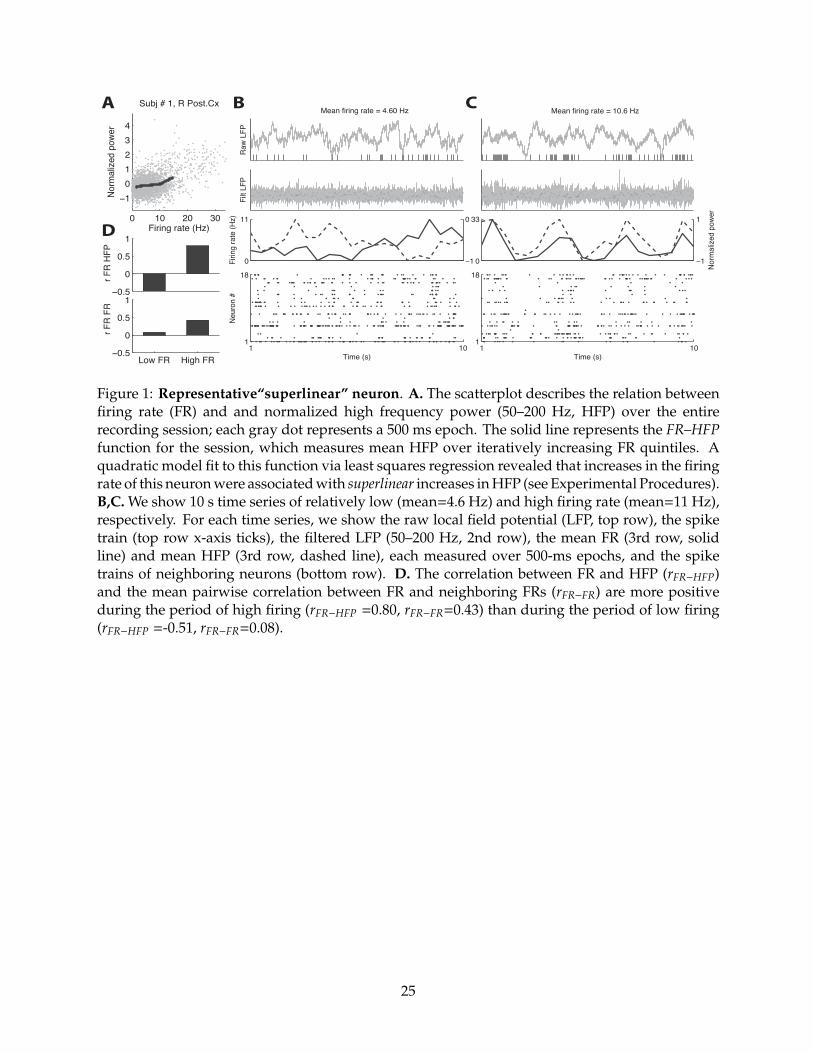
Figure 1 shows a representative superlinear neuron. The scatterplot (Figure 1a.) indicates how
HFP changes with FR over the entire recording session. A quadratic model fit to this neuron’s
FR–HFP function (solid line) was associated with a significantly positive second-order �
coe�cient (p < 0.05 via permutation procedure), indicating that HFP increased as a superlinear
function of FR in this neuron. This means that the FR for this neuron was typically more
positively correlated with HFP during periods of rapid firing (e.g., 1.c, mean FR = 10.6 Hz,
9
rFR�HFP = 0.80) than during periods of slow firing (e.g., 1.b, mean FR = 4.60 Hz, rFR�HFP = �0.51).
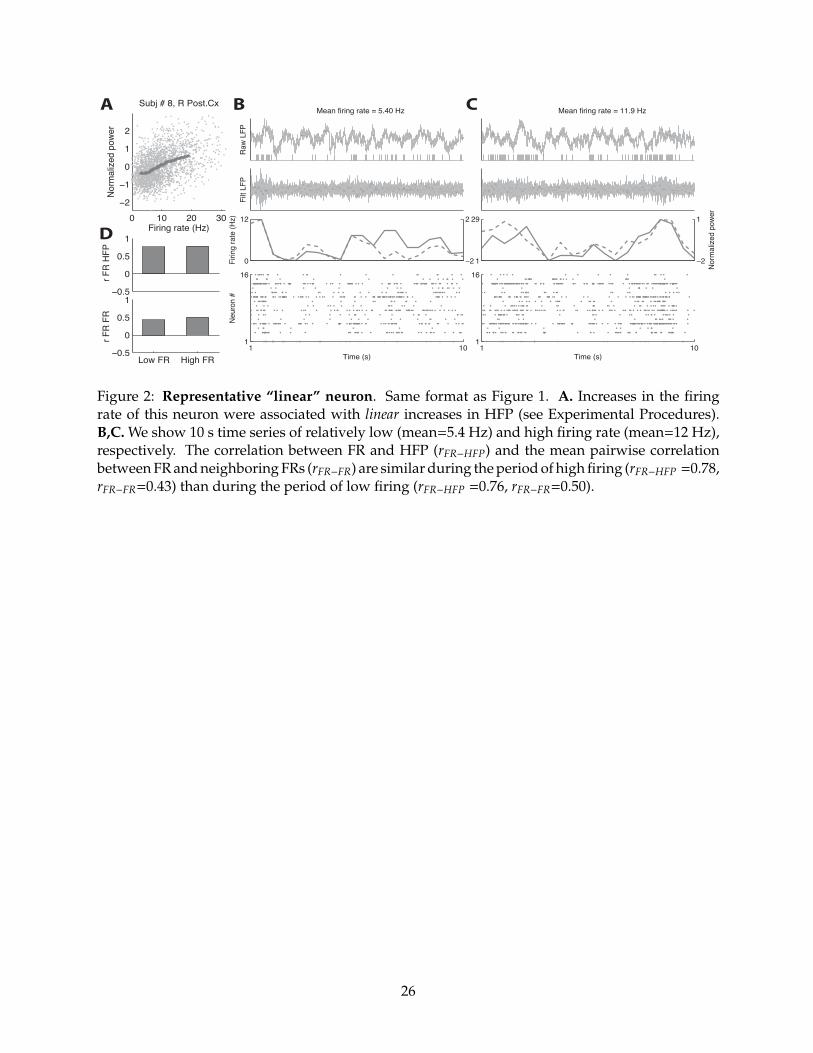
On the other hand, a representative linear neuron (Figure 2) was associated with a non-significant
second-order � coe�cient (p > 0.2, via permutation procedure) suggesting that increases in the
FR of this neuron were associated with linear increases in HFP. The FR of this linear neuron was
similarly correlated with HFP during periods of rapid firing (e.g., 2.c, mean FR = 11.9 Hz,
rFR�HFP = 0.78 ) and during periods of slow firing (e.g., 2.b, mean FR = 5.40 Hz, rFR�HFP = 0.76).
[Figure 1 about here.]
[Figure 2 about here.]
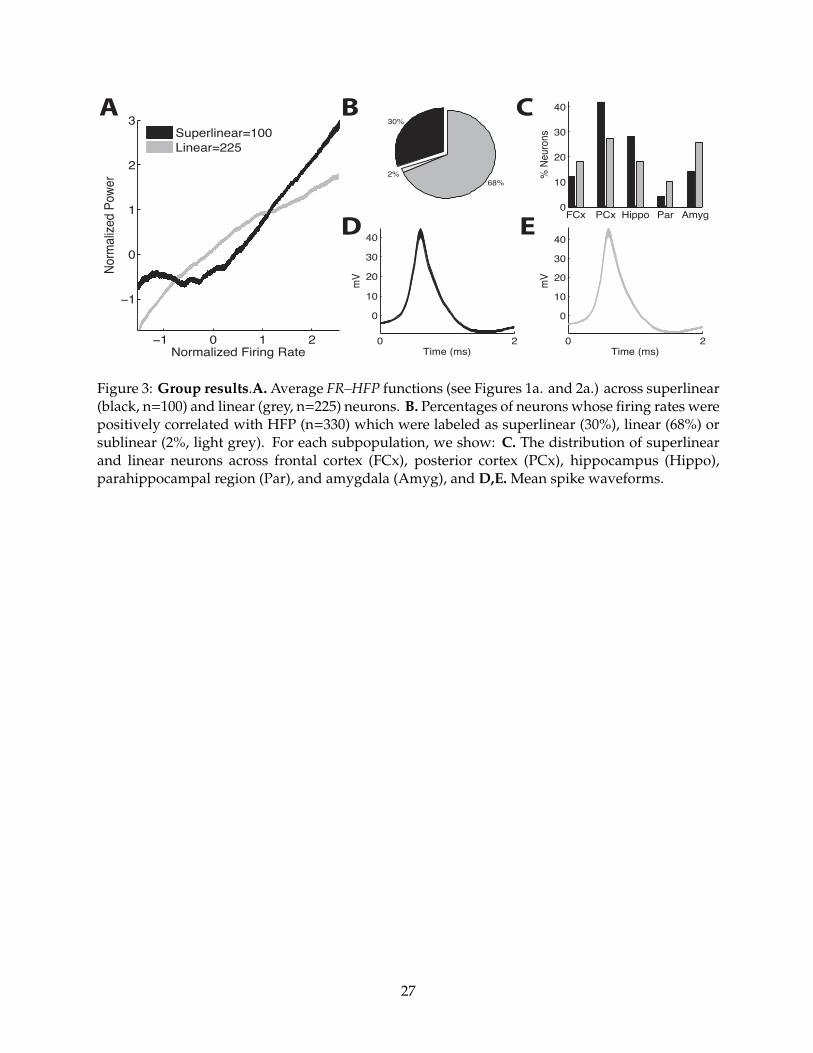
Figure 3.a illustrates the form of the FR–HFP relation across superlinear and linear HFP+
neurons. As a further test of the non-linearities observed in the FR–HFP functions of superlinear
neurons, we found that the correlation between FR and HFP was higher during 10 second epochs
of relatively rapid firing (highest quartile, rFR�HFP = 0.14) than during periods of relatively slow
firing (lowest quartile, rFR�HFP = 0.05, t(99) = 7.98; p < 0.001). This di↵erence was not significant
for linear neurons (rapid firing, rFR�HFP = 0.11, slow firing, rFR�HFP = 0.10, t(224) = 0.30; p > 0.5 ).
Similarly, the correlation between rFR�HFP and FR was positive for superlinear neurons (r = 0.11,
t(99) = 7.83; p < 0.001) but not for linear neurons (r = �0.002, t(224) = �0.23; p > 0.5).
[Figure 3 about here.]
Anatomical distribution and intrinsic physiological properties
Superlinear neurons were less frequently observed (30%) than linear neurons (68%,
�21 = 48.1, p < 10�12 Figure 3.b) and displayed a di↵erent anatomical distribution (Figure 3.c). In
particular, superlinear neurons were more frequently observed in the posterior cortex (PCx, 42%
vs. 28%) and hippocampus (Hippo, 28% vs. 18%), but less frequently observed in the frontal
10
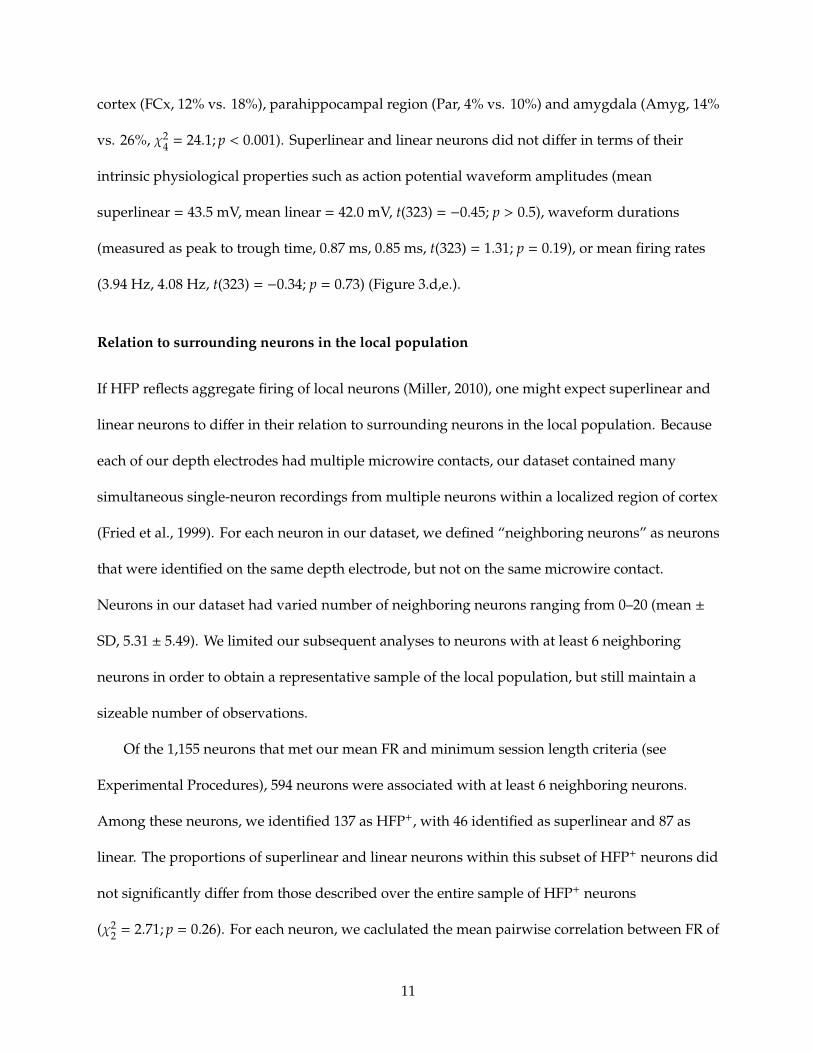
cortex (FCx, 12% vs. 18%), parahippocampal region (Par, 4% vs. 10%) and amygdala (Amyg, 14%
vs. 26%, �24 = 24.1; p < 0.001). Superlinear and linear neurons did not di↵er in terms of their
intrinsic physiological properties such as action potential waveform amplitudes (mean
superlinear = 43.5 mV, mean linear = 42.0 mV, t(323) = �0.45; p > 0.5), waveform durations
(measured as peak to trough time, 0.87 ms, 0.85 ms, t(323) = 1.31; p = 0.19), or mean firing rates
(3.94 Hz, 4.08 Hz, t(323) = �0.34; p = 0.73) (Figure 3.d,e.).
Relation to surrounding neurons in the local population
If HFP reflects aggregate firing of local neurons (Miller, 2010), one might expect superlinear and
linear neurons to di↵er in their relation to surrounding neurons in the local population. Because
each of our depth electrodes had multiple microwire contacts, our dataset contained many
simultaneous single-neuron recordings from multiple neurons within a localized region of cortex
(Fried et al., 1999). For each neuron in our dataset, we defined “neighboring neurons” as neurons
that were identified on the same depth electrode, but not on the same microwire contact.
Neurons in our dataset had varied number of neighboring neurons ranging from 0–20 (mean ±
SD, 5.31 ± 5.49). We limited our subsequent analyses to neurons with at least 6 neighboring
neurons in order to obtain a representative sample of the local population, but still maintain a
sizeable number of observations.
Of the 1,155 neurons that met our mean FR and minimum session length criteria (see
Experimental Procedures), 594 neurons were associated with at least 6 neighboring neurons.
Among these neurons, we identified 137 as HFP+, with 46 identified as superlinear and 87 as
linear. The proportions of superlinear and linear neurons within this subset of HFP+ neurons did
not significantly di↵er from those described over the entire sample of HFP+ neurons
(�22 = 2.71; p = 0.26). For each neuron, we caclulated the mean pairwise correlation between FR of
11
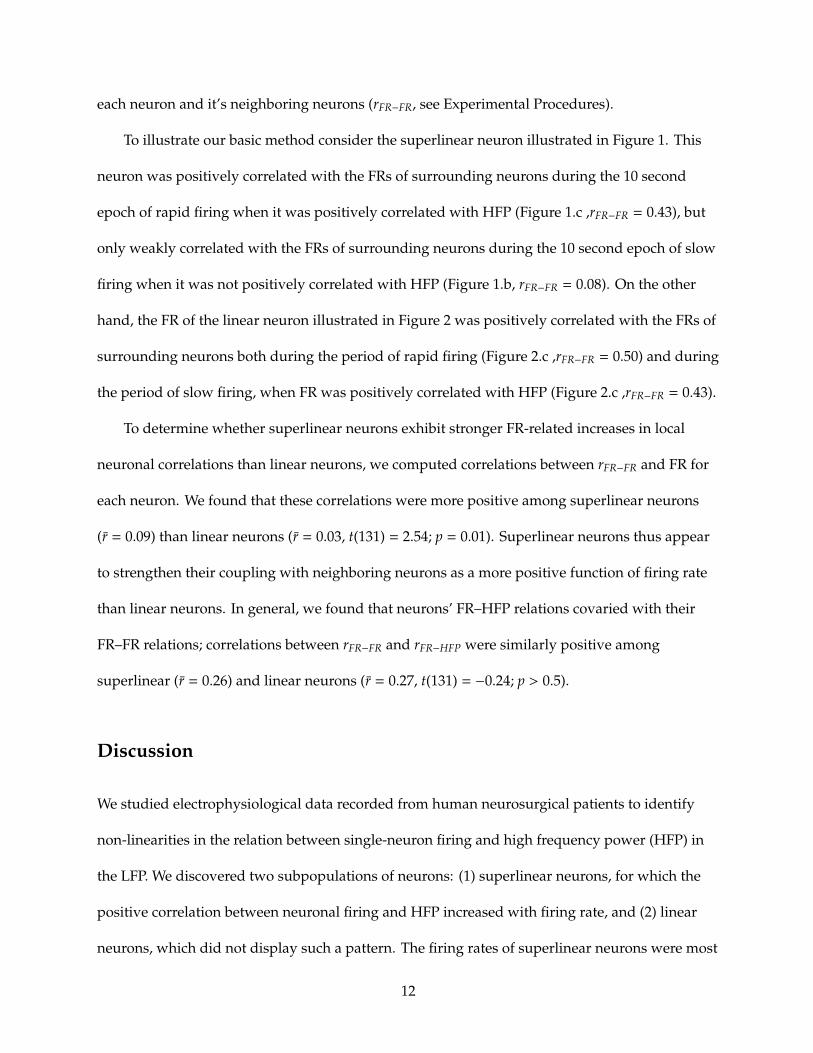
each neuron and it’s neighboring neurons (rFR�FR, see Experimental Procedures).
To illustrate our basic method consider the superlinear neuron illustrated in Figure 1. This
neuron was positively correlated with the FRs of surrounding neurons during the 10 second
epoch of rapid firing when it was positively correlated with HFP (Figure 1.c ,rFR�FR = 0.43), but
only weakly correlated with the FRs of surrounding neurons during the 10 second epoch of slow
firing when it was not positively correlated with HFP (Figure 1.b, rFR�FR = 0.08). On the other
hand, the FR of the linear neuron illustrated in Figure 2 was positively correlated with the FRs of
surrounding neurons both during the period of rapid firing (Figure 2.c ,rFR�FR = 0.50) and during
the period of slow firing, when FR was positively correlated with HFP (Figure 2.c ,rFR�FR = 0.43).
To determine whether superlinear neurons exhibit stronger FR-related increases in local
neuronal correlations than linear neurons, we computed correlations between rFR�FR and FR for
each neuron. We found that these correlations were more positive among superlinear neurons
(r = 0.09) than linear neurons (r = 0.03, t(131) = 2.54; p = 0.01). Superlinear neurons thus appear
to strengthen their coupling with neighboring neurons as a more positive function of firing rate
than linear neurons. In general, we found that neurons’ FR–HFP relations covaried with their
FR–FR relations; correlations between rFR�FR and rFR�HFP were similarly positive among
superlinear (r = 0.26) and linear neurons (r = 0.27, t(131) = �0.24; p > 0.5).
Discussion
We studied electrophysiological data recorded from human neurosurgical patients to identify
non-linearities in the relation between single-neuron firing and high frequency power (HFP) in
the LFP. We discovered two subpopulations of neurons: (1) superlinear neurons, for which the
positive correlation between neuronal firing and HFP increased with firing rate, and (2) linear
neurons, which did not display such a pattern. The firing rates of superlinear neurons were most
12
strongly correlated with HFP during periods of relatively rapid firing, while the firing rates of
linear neurons were similarly correlated with HFP during periods of slow and rapid firing.
Finally, we found that superlinear neurons were associated with greater firing rate-related
increases in local neuronal correlations than linear neurons.
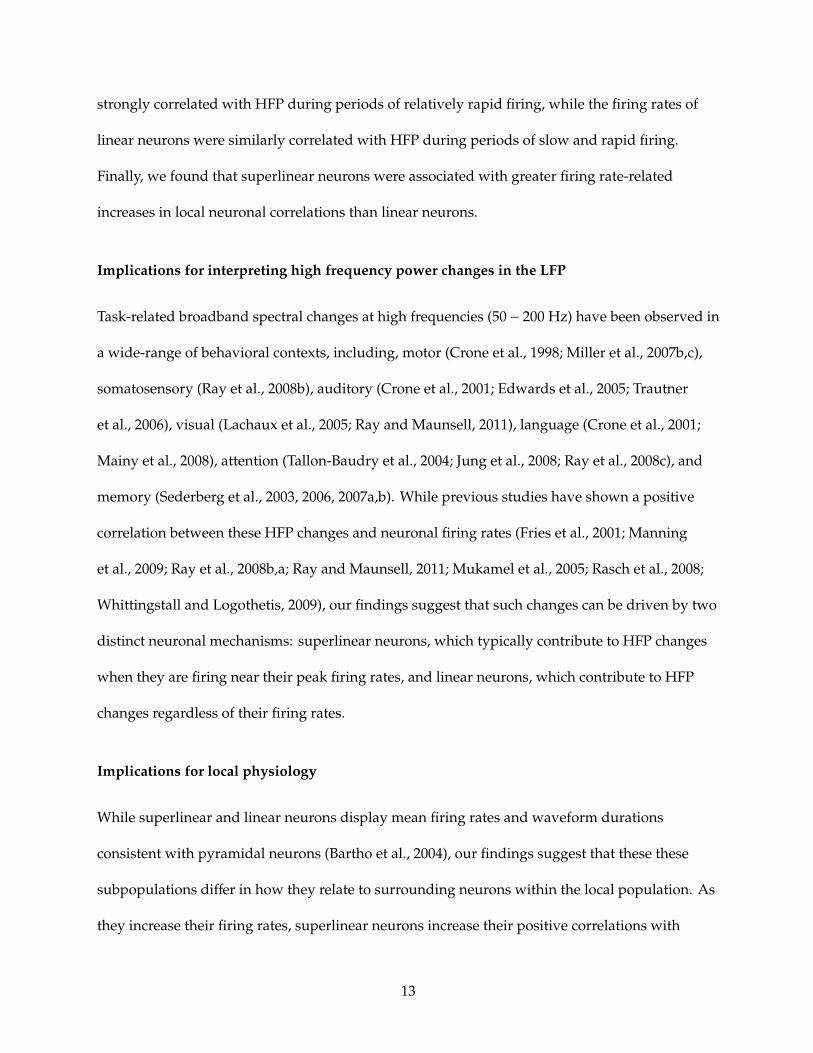
Implications for interpreting high frequency power changes in the LFP
Task-related broadband spectral changes at high frequencies (50 � 200 Hz) have been observed in
a wide-range of behavioral contexts, including, motor (Crone et al., 1998; Miller et al., 2007b,c),
somatosensory (Ray et al., 2008b), auditory (Crone et al., 2001; Edwards et al., 2005; Trautner
et al., 2006), visual (Lachaux et al., 2005; Ray and Maunsell, 2011), language (Crone et al., 2001;
Mainy et al., 2008), attention (Tallon-Baudry et al., 2004; Jung et al., 2008; Ray et al., 2008c), and
memory (Sederberg et al., 2003, 2006, 2007a,b). While previous studies have shown a positive
correlation between these HFP changes and neuronal firing rates (Fries et al., 2001; Manning
et al., 2009; Ray et al., 2008b,a; Ray and Maunsell, 2011; Mukamel et al., 2005; Rasch et al., 2008;
Whittingstall and Logothetis, 2009), our findings suggest that such changes can be driven by two
distinct neuronal mechanisms: superlinear neurons, which typically contribute to HFP changes
when they are firing near their peak firing rates, and linear neurons, which contribute to HFP
changes regardless of their firing rates.
Implications for local physiology
While superlinear and linear neurons display mean firing rates and waveform durations
consistent with pyramidal neurons (Bartho et al., 2004), our findings suggest that these these
subpopulations di↵er in how they relate to surrounding neurons within the local population. As
they increase their firing rates, superlinear neurons increase their positive correlations with
13
neighboring neurons to a greater degree than linear neurons. These di↵erences are similar to
those observed betwen each subpopulation’s firing rate–HFP relations, and thus suggest a
general correlation between neurons’ relations with HFP and their relations with surrounding
neurons in the local population. We observed such a correlation among both superlinear and
linear neurons. This pattern has previously been described in human auditory neurons by Nir
et al. (2007) and may reflect the importance of temporal synchrony in determining how much a
neuronal population contributes to the LFP (Buzsaki et al., 2012).
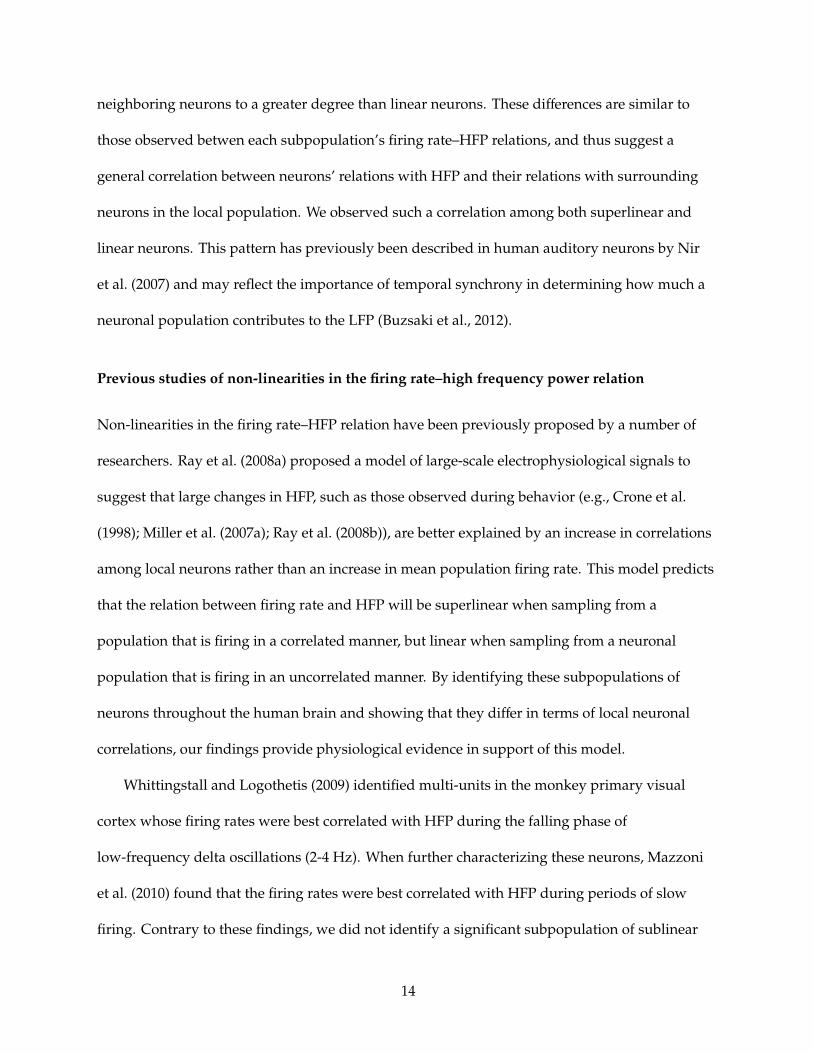
Previous studies of non-linearities in the firing rate–high frequency power relation
Non-linearities in the firing rate–HFP relation have been previously proposed by a number of
researchers. Ray et al. (2008a) proposed a model of large-scale electrophysiological signals to
suggest that large changes in HFP, such as those observed during behavior (e.g., Crone et al.
(1998); Miller et al. (2007a); Ray et al. (2008b)), are better explained by an increase in correlations
among local neurons rather than an increase in mean population firing rate. This model predicts
that the relation between firing rate and HFP will be superlinear when sampling from a
population that is firing in a correlated manner, but linear when sampling from a neuronal
population that is firing in an uncorrelated manner. By identifying these subpopulations of
neurons throughout the human brain and showing that they di↵er in terms of local neuronal
correlations, our findings provide physiological evidence in support of this model.
Whittingstall and Logothetis (2009) identified multi-units in the monkey primary visual
cortex whose firing rates were best correlated with HFP during the falling phase of
low-frequency delta oscillations (2-4 Hz). When further characterizing these neurons, Mazzoni
et al. (2010) found that the firing rates were best correlated with HFP during periods of slow
firing. Contrary to these findings, we did not identify a significant subpopulation of sublinear
14
neurons, whose firing rates would be better correlated with HFP during periods of slow firing
than during periods of rapid firing. We suggest two possibilities for this inconsistency. First, it
may be that these sublinear neurons are unique to primary visual cortex, which we were unable
to appropriately sample due to clinical electrode placement. Second, it may be that our sliding
window-based method was not sensitive enough to detect sublinear neurons. Indeed, there is a
subtle downward-curve (or “sublinearity”) the firing rate–HFP relation of linear neurons (Figure
3.a).
Challenges associated with measuring local neuronal correlations
Assessing local neuronal correlations is a powerful approach to studying network activity within
a local population. However, there are many challenges associated with measuring and
interpreting local neuronal correlations (Cohen and Kohn, 2011). First, the time window used to
count spikes can critically influence the measured local neuronal correlations. Particularly, if the
window used to count spikes is too small, local neuronal correlations can be substantially
underestimated due to a jitter in when spikes occur. We overcome this challenge by using large
time windows (500 ms) to measure firing rates. Notably, the firing rate correlations that we
measure in this study are distinct from spike synchrony measures (Denker et al., 2011) which
assess co-incident spiking at the 1-3 ms resolution, and may have di↵erent physiological
implications (Fries et al., 2007).
Second, the mean firing rate of neurons can serve as a major confound when assessing
neuronal correlations. Correlations in the spiking responses of a population of neurons arises
because of co-fluctuations in the neurons’ membrane potentials (Lampl et al., 1999; Okun et al.,
2010). At low firing rates, however, the spiking activity of a neuron is a poor reflection of these
membrane potential fluctuations (which are occuring far below spike threshold). Thus, pairwise
15
correlations between neurons’ membrane potential fluctuations are typically underestimated
when one of the neurons in the pair is firing slowly (Cohen and Kohn, 2011). Based on this
principle, it is expected that one would observe a positive correlation between a neuron’s firing
rate and the neuron’s correlations with surrounding neurons (which we observe for both
superlinear and linear neurons, de la Rocha et al. (2007)). However, we found that this positive
correlation was larger among superlinear neurons than among linear neurons even though these
groups did not di↵er in their mean firing rates. Thus, our findings suggest that the firing
rate–related increase in local neuronal correlations observed in superlinear neurons is greater
than that expected by an increase in firing rate alone.
Third, errors in the spike-sorting process, which involves estimating the number of distinct
neurons that were recorded from a given microelectrode contact, can lead to an overestimation of
pairwise neuronal correlations. This occurs, for example, when action potentials from a single
neuron are incorrectly assigned to multiple neurons on the same microelectrode contact. Here,
one would identify a spurrious, and dramatic, pairwise correlation between these falsely-labelled
neurons. We control for this possibilty by excluding neurons identified on the same
microelectrode contact when measuring correlations between a given neuron and surrounding
neurons in the local population. Our finding of significant di↵erences in pairwise local
correlations across the two groups of neurons is reassuring as any spike-sorting errors should
a↵ect both groups equally.
Conclusion
We describe two distinct classes of neural responses that underlie high frequency power changes
in the LFP: superlinear neurons, which primarily contribute to HFP during periods of rapid
firing, and linear neurons, which contribute to HFP across various firing rates. Our findings
16
suggest that these neuronal subpopulations di↵er in how they relate to surrounding neurons
within the local population. As discussed by Buzsaki et al. (2012), understanding the microscopic
events that underlie changes in the LFP is critical to deriving behaviorally-useful information
from this complex, macroscopic signal. Furthermore, one would expect each of these
subpopulations to have di↵erent functional roles within a network or encode distinct
information. Thus, we suggest that each of these subpopulations be analyzed seperately when
studying the single-neuron correlates of behavior or cognition.
17
References
Bartho, P., Hirase, H., Moncoduit, L., Zugaro, M., Harris, K., and Buzsaki, G. (2004).
Characterization of neocortical principal cells and interneurons by network interactions and
extracellular features. Journal of Neurophyiology, 92:600–608.
Buzsaki, G. (2006). Rhythms of the Brain. Oxford University Press, New York.
Buzsaki, G., Anastassiou, C., and Koch, C. (2012). The origin of extracellular fields and currents -
eeg, ecog, lfp and spikes. Nature Reviews Neuroscience, 13:407–419.
Caplan, J. B., Madsen, J. R., Schulze-Bonhage, A., Aschenbrenner-Scheibe, R., Newman, E. L., and
Kahana, M. J. (2003). Human theta oscillations related to sensorimotor integration and spatial
learning. Journal of Neuroscience, 23:4726–4736.
Cohen, M. and Kohn, A. (2011). Measuring and interpreting neuronal correlations. Nature
Neuroscience, 14(7):811–819.
Crone, N. E., Boatman, D., Gordon, B., and Hao, L. (2001). Induced electrocorticographic gamma
activity during auditory perception. Clinical Neurophysiology, 112:565 – 582.
Crone, N. E., Korzeniewska, A., and Franaszczuk, P. (2011). Cortical gamma responses: searching
high and low. International Journal of Psychophysiology, 79(1):9–15.
Crone, N. E., Miglioretti, D. L., Gordon, B., and Lesser, R. P. (1998). Functional mapping of human
sensorimotor cortex with electrocorticographic spectral analysis. II. Event-related
synchronization in the gamma band. Brain, 121(12):2301.
de la Rocha, J., B, D., Shea-Brown, E., Josic, K., and Reyes, A. (2007). Correlation between neural
spike trains increases with firing rate. Nature, 448(7155):802–6.
18
Denker, M., Roux, S., Linden, H., Diesmann, M., Riehle, A., and Grun, S. (2011). The local field
potential reflects surplus spike synchrony. Cerebral Cortex, 12:2681–2695.
Edwards, E., Soltani, M., Deouell, L. Y., Berger, M. S., and Knight, R. T. (2005). High gamma
activity in response to deviant auditory stimuli recorded directly from human cortex. Journal of
Neurophysiology, 94:4269 – 4280.
Ekstrom, A. D., Caplan, J., Ho, E., Shattuck, K., Fried, I., and Kahana, M. (2005). Human
hippocampal theta activity during virtual navigation. Hippocampus, 15:881–889.
Ekstrom, A. D., Kahana, M. J., Caplan, J. B., Fields, T. A., Isham, E. A., Newman, E. L., and Fried,
I. (2003). Cellular networks underlying human spatial navigation. Nature, 425:184–187.
Fried, I., Wilson, C., Maidment, N., Engel, J. J., Behnke, E., Fields, T., MacDonald, K., Morrow, J.,
and Ackerson, L. (1999). Cerebral microdialysis combined with single-neuron and
electroencephalographic recording in neurosurgical patients. Journal of Neurosurgery,
91:697–705.
Fries, P., Nikolic, D., and Singer, W. (2007). The gamma cycle. Trends in Neurosciences,
30(7):309–316.
Fries, P., Reynolds, J. H., Rorie, A. E., and Desimone, R. (2001). Modulation of oscillatory
neuronal synchronization by selective visual attention. Science, 291(5508):1560–1563.
Henrie, J. A. and Shapley, R. (2005). LFP power spectra in V1 cortex: the graded e↵ect of stimulus
contrast. Journal of Neurophysiology, 94:479 – 490.
Jacobs, J., Kahana, M. J., Ekstrom, A. D., and Fried, I. (2007). Brain oscillations control timing of
single-neuron activity in humans. Journal of Neuroscience, 27(14):3839–3844.
19
Jacobs, J., Kahana, M. J., Ekstrom, A. D., Mollison, M. V., and Fried, I. (2010a). A sense of direction
in human entorhinal cortex. Proceedings of the National Academy of Sciences, USA,
107(14):6487–6482.
Jacobs, J., Manning, J., and Kahana, M. (2010b). Response to Miller: “Broadband” vs. “high
gamma” electrocorticographic signals. Journal of Neuroscience, 30(19).
Jung, J., Mainy, N., Kahane, P., Minotti, L., Ho↵mann, D., Bertrand, O., and Lachaux, J. (2008).
The neural bases of attentive reading. Human Brain Mapping, 29(1193-1206).
Lachaux, J. P., George, N., Tallon-Baudry, C., Martinerie, J., Hugueville, L., Minotti, L., Kahane, P.,
and Renault, B. (2005). The many faces of the gamma band response to complex visual stimuli.
NeuroImage, 25:491–501.
Lampl, I., Reichova, I., and D., F. (1999). Synchronous membrane potential fluctuations in
neurons of the cat visual cortex. Neuron, 22:361–374.
Mainy, N., Jung, J., Baciu, M., Kahane, P., Schoendor↵, B., Minotti, L., Ho↵mann, D., Bertrand, O.,
and Lachaux, J. (2008). Cortical dynamics of word recognition. Human brain mapping,
29(11):1215.
Manning, J. R., Jacobs, J., Fried, I., and Kahana, M. (2009). Broadband shifts in LFP power spectra
are correlated with single-neuron spiking in humans. Journal of Neuroscience, 29(43):13613 –
13620.
Manning, J. R., Polyn, S. M., Baltuch, G., Litt, B., and Kahana, M. J. (2011). Oscillatory patterns in
temporal lobe reveal context reinstatement during memory search. Proc Natl Acad Sci U S A,
108(31):12893 – 12897.
20
Manning, J. R., Sperling, M. R., Sharan, A., Rosenberg, E. A., and Kahana, M. J. (2012).
Spontaneously reactivated patterns in frontal and temporal lobe predict semantic clustering
during memory search. Journal of Neuroscience, 32(26):8871–8878.
Martinez, J., Pedreira, C., Ison, M., and Quiroga, R. (2009). Realistic simulation of extracellular
recordings. Journal of Neuroscience Methods, 184:285–293.
Mazzoni, N., Whittingstall, K., Brunel, N., Logothetis, N. K., and Panzeri, S. (2010).
Understanding the relationships between spike rate and delta/gamma frequency bands of lfps
and eegs using a local cortical network model. NeuroImage, 52(3):956–72.
Miller, J., Polyn, S., and Kahana, M. (2007a). Clustering by spatial proximity during memory
search. Society for Mathematical Psychology conference. Irvine, CA.
Miller, K., Leuthardt, E. C., Schalk, G., Rao, R. P. N., Anderson, N. R., Moran, D. W., Miller, J. W.,
and Ojemann, J. G. (2007b). Spectral Changes in Cortical Surface Potentials during Motor
Movement. Journal of Neuroscience, 27(9):2424.
Miller, K., Sorensen, L., Ojemann, J., and den Nijs, M. (2007c). ECoG observations of power-law
scaling in the human cortex. Arxiv preprint arXiv, 712.
Miller, K. J. (2010). Broadband spectral change: evidence for a macroscale correlate of population
firing rate? Journal of Neuroscience, 30(19):6477–9.
Mukamel, R., Gelbard, H., Arieli, A., Hasson, U., Fried, I., and Malach, R. (2005). Coupling
between neuronal firing, field potentials, and fMRI in human auditory cortex. Science,
309(5736):951–954.
Newman, E. L., Caplan, J. B., Kirschen, M. P., Korolev, I. O., Sekuler, R., and Kahana, M. J. (2007).
21
Learning your way around town: How virtual taxicab drivers learn to use both layout and
landmark information. Cognition, 104(2):231–253.
Nir, Y., Fisch, L., Mukamel, R., Gelbard-Sagiv, H., Arieli, A., Fried, I., and Malach, R. (2007).
Coupling between neuronal firing rate, gamma LFP, and BOLD fMRI is related to
interneuronal correlations. Current Biology, 17(15):1275–1285.
Okun, M., Nain, A., and Lampl, I. (2010). The subthreshold relationship between cortical local
field potential and neuronal firing unveiled by intracellular recordings in awake rats. Journal of
Neuroscience, 20:4440–4448.
Percival, D. B. and Walden, A. T. (1993). Spectral Analysis for Physical Applications. Cambridge
University Press, Cambridge, U. K.
Quiroga, R. Q., Nadasdy, Z., and Ben-Shaul, Y. (2004). Unsupervised spike detection and sorting
with wavelets and superparamagnetic clustering. Neural Computation, 16:1661–1687.
Quiroga, R. Q., Reddy, L., Kreiman, G., Koch, C., and Fried, I. (2005). Invariant visual
representation by single neurons in the human brain. Nature, 435(23):1102–1107.
Rasch, M. J., Gretton, A., Murayama, Y., Maass, W., and Logothetis, N. K. (2008). Inferring spike
trains from local field potentials. Journal of Neurophysiology, 99:1461–1476.
Ray, S., Crone, N., Niebur, E., Franaszczuk, P., and Hsiao, S. (2008a). Neural Correlates of
High-Gamma Oscillations (60-200 Hz) in Macaque Local Field Potentials and Their Potential
Implications in Electrocorticography. Journal of Neuroscience, 28(45):11526.
Ray, S., Hsiao, S., Crone, N., Franaszczuk, P., and Niebur, E. (2008b). E↵ect of stimulus intensity
on the spike-local field potential relationship in the secondary somatosensory cortex. Journal of
Neuroscience, 28:7334–7343.
22
Ray, S. and Maunsell, J. (2011). Di↵erent Origins of Gamma Rhythm and High-Gamma Activity
in Macaque Visual Cortex. PLoS Biology, 9(4):e1000610.
Ray, S., Niebur, E., Hsiao, S., Sinai, A., and Crone, N. (2008c). High-frequency gamma activity
(80–150Hz) is increased in human cortex during selective attention. Clinical Neurophysiology,
119(1):116—133.
Sederberg, P. B., Gauthier, L. V., Terushkin, V., Miller, J. F., Barnathan, J. A., and Kahana, M. J.
(2006). Oscillatory correlates of the primacy e↵ect in episodic memory. NeuroImage,
32(3):1422–1431.
Sederberg, P. B., Kahana, M. J., Howard, M. W., Donner, E. J., and Madsen, J. R. (2003). Theta and
gamma oscillations during encoding predict subsequent recall. Journal of Neuroscience,
23(34):10809–10814.
Sederberg, P. B., Schulze-Bonhage, A., Madsen, J. R., Bromfield, E. B., Litt, B., Brandt, A., and
Kahana, M. J. (2007a). Gamma oscillations distinguish true from false memories. Psychological
Science, 18(11):927–932.
Sederberg, P. B., Schulze-Bonhage, A., Madsen, J. R., Bromfield, E. B., McCarthy, D. C., Brandt, A.,
Tully, M. S., and Kahana, M. J. (2007b). Hippocampal and neocortical gamma oscillations
predict memory formation in humans. Cerebral Cortex, 17(5):1190–1196.
Tallon-Baudry, C., Bertrand, O., Hena↵, M., Isnard, J., and Fischer, C. (2004). Attention modulates
gamma-band oscillations di↵erently in the human lateral occipital cortex and fusiform gyrus.
Cerebral Cortex, Advance Access(15 sept).
Trautner, P., Rosburg, T., Dietl, T., Fell, J., Korzyukov, O. A., Kurthen, M., Schaller, C., Elger, C. E.,
23
and Boutros, N. N. (2006). Sensory gating of auditory evoked and induced gamma band
activity in intracranial recordings. Neuroimage, 32:790 – 798.
Whittingstall, K. and Logothetis, N. (2009). Frequency-Band Coupling in Surface EEG Reflects
Spiking Activity in Monkey Visual Cortex. Neuron, 64(2):281–289.
Witter, M. (2002). The parahippocampal region: past, present and future. In M., W. and
Wouterlood, F., editors, The Parahippocampal Region: Organization and Role in Cognitive Functions,
pages 3–19. Oxford Univ. Press, Oxford.
24
0 10 20 30
ï�01234
Firing rate (Hz)
Norm
alize
d po
wer
Subj # 1, R Post.Cx
Raw
LFP
Mean firing rate = 4.60 Hz
Mean firing rate = 10.6 Hz
Filt
LFP
0
11Fi
ring
rate
(Hz)
ï�
0
0
33
ï�
1
Norm
alize
d po
wer
1 101
18
Time (s)
Neur
on #
1 101
18
Time (s)
��
0
���
1
r FR
HFP
Low FR High FR��
0
���
1
r FR
FR
D
A B C
Figure 1: Representative“superlinear” neuron. A. The scatterplot describes the relation betweenfiring rate (FR) and and normalized high frequency power (50–200 Hz, HFP) over the entirerecording session; each gray dot represents a 500 ms epoch. The solid line represents the FR–HFPfunction for the session, which measures mean HFP over iteratively increasing FR quintiles. Aquadratic model fit to this function via least squares regression revealed that increases in the firingrate of this neuron were associated with superlinear increases in HFP (see Experimental Procedures).B,C. We show 10 s time series of relatively low (mean=4.6 Hz) and high firing rate (mean=11 Hz),respectively. For each time series, we show the raw local field potential (LFP, top row), the spiketrain (top row x-axis ticks), the filtered LFP (50–200 Hz, 2nd row), the mean FR (3rd row, solidline) and mean HFP (3rd row, dashed line), each measured over 500-ms epochs, and the spiketrains of neighboring neurons (bottom row). D. The correlation between FR and HFP (rFR�HFP)and the mean pairwise correlation between FR and neighboring FRs (rFR�FR) are more positiveduring the period of high firing (rFR�HFP =0.80, rFR�FR=0.43) than during the period of low firing(rFR�HFP =-0.51, rFR�FR=0.08).
25
0 10 20 30ï�
ï�
0
1
2
Firing rate (Hz)
Norm
alize
d po
wer
Subj # 8, R Post.Cx
Raw
LFP
Mean firing rate = 5.40 Hz
Mean firing rate = 11.9 Hz
Filt
LFP
0
12Fi
ring
rate
(Hz)
ï�
2
1
29
ï�
1
Norm
alize
d po
wer
1 101
16
Time (s)
Neur
on #
1 101
16
Time (s)
��
0
0.5
1
Low FR High FR��
0
0.5
1
r FR
HFP
r FR
FR
D
A B C
Figure 2: Representative “linear” neuron. Same format as Figure 1. A. Increases in the firingrate of this neuron were associated with linear increases in HFP (see Experimental Procedures).B,C. We show 10 s time series of relatively low (mean=5.4 Hz) and high firing rate (mean=12 Hz),respectively. The correlation between FR and HFP (rFR�HFP) and the mean pairwise correlationbetween FR and neighboring FRs (rFR�FR) are similar during the period of high firing (rFR�HFP =0.78,rFR�FR=0.43) than during the period of low firing (rFR�HFP =0.76, rFR�FR=0.50).
26
A B
D
C
E
ï� 0 � 2
ï�
0
�
2
3
Normalized Firing Rate
Norm
alize
d Po
wer
6XSHUOLQHDU ���Linear=225
30%
2%68%
FCx PCx Hippo Par Amyg0
��
20
30
40
% N
euro
ns
0 2
0
��
20
30
40
Time (ms)
mV
0 2
0
��
20
30
40
Time (ms)m
V
Figure 3: Group results.A. Average FR–HFP functions (see Figures 1a. and 2a.) across superlinear(black, n=100) and linear (grey, n=225) neurons. B. Percentages of neurons whose firing rates werepositively correlated with HFP (n=330) which were labeled as superlinear (30%), linear (68%) orsublinear (2%, light grey). For each subpopulation, we show: C. The distribution of superlinearand linear neurons across frontal cortex (FCx), posterior cortex (PCx), hippocampus (Hippo),parahippocampal region (Par), and amygdala (Amyg), and D,E. Mean spike waveforms.
27
Subject Table
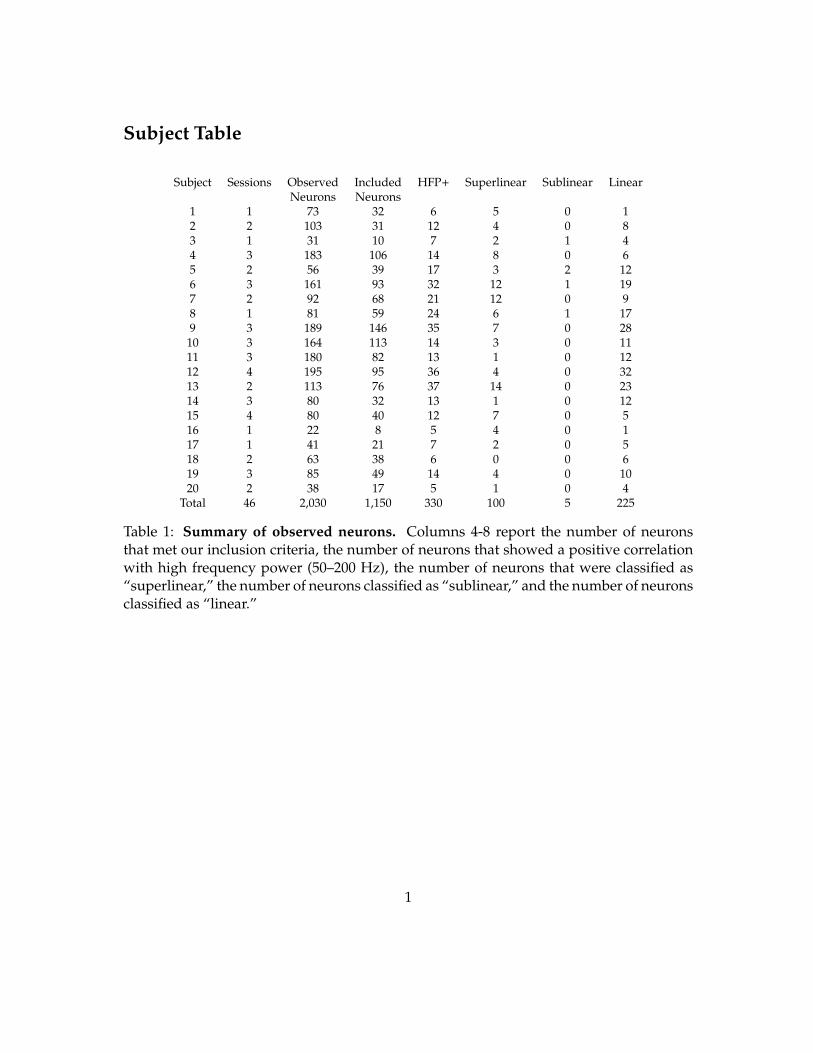
Subject Sessions Observed Included HFP+ Superlinear Sublinear LinearNeurons Neurons
1 1 73 32 6 5 0 12 2 103 31 12 4 0 83 1 31 10 7 2 1 44 3 183 106 14 8 0 65 2 56 39 17 3 2 126 3 161 93 32 12 1 197 2 92 68 21 12 0 98 1 81 59 24 6 1 179 3 189 146 35 7 0 28
10 3 164 113 14 3 0 1111 3 180 82 13 1 0 1212 4 195 95 36 4 0 3213 2 113 76 37 14 0 2314 3 80 32 13 1 0 1215 4 80 40 12 7 0 516 1 22 8 5 4 0 117 1 41 21 7 2 0 518 2 63 38 6 0 0 619 3 85 49 14 4 0 1020 2 38 17 5 1 0 4
Total 46 2,030 1,150 330 100 5 225
Table 1: Summary of observed neurons. Columns 4-8 report the number of neuronsthat met our inclusion criteria, the number of neurons that showed a positive correlationwith high frequency power (50–200 Hz), the number of neurons that were classified as“superlinear,” the number of neurons classified as “sublinear,” and the number of neuronsclassified as “linear.”
1
Supplemental Text and Figures