
Twitter in Academic Events: A Study of Temporal Usage ... · [email protected] dSchool of...
17
Twitter in Academic Events: A Study of Temporal Usage, Communication, Sentimental and Topical Patterns in 16 Computer Science Conferences Denis Parra a , Christoph Trattner b , Diego G´ omez c , Mat´ ıas Hurtado a , Xidao Wen d , Yu-Ru Lin d a Departamento de Ciencia de la Computaci´ on, Pontificia Universidad Cat´olica de Chile, Santiago, Chile {dparra, mhurtado}@ing.puc.cl b Department of Computer and Information Science, Norwegian University of Science and Technology, Norway {chritrat}@idi.ntnu.edu c School of Communications, Pontificia Universidad Cat´ olica de Chile, Santiago, Chile {dgomezara}@puc.cl d School of Information Sciences, University of Pittsburgh, USA {xiw55, yurulin@}@pitt.edu Abstract Twitter is often referred to as a backchannel for conferences. While the main conference takes place in a physical setting, on-site and off-site attendees socialize, introduce new ideas or broadcast information by microblogging on Twitter. In this paper we analyze scholars’ Twitter usage in 16 Computer Science conferences over a timespan of five years. Our primary finding is that over the years there are differences with respect to the uses of Twitter, with an increase of informational activity (retweets and URLs), and a decrease of conversational usage (replies and mentions), which also impacts the network structure – meaning the amount of connected components – of the informational and conversational networks. We also applied topic modeling over the tweets’ content and found that when clustering conferences according to their topics the resulting dendrogram clearly reveals the similarities and differences of the actual research interests of those events. Furthermore, we also analyzed the sentiment of tweets and found persistent differences among conferences. It also shows that some communities consistently express messages with higher levels of emotions while others do it in a more neutral manner. Finally, we investigated some features that can help predict future user participation in the online Twitter conference activity. By casting the problem as a classification task, we created a model that identifies factors that contribute to the continuing user participation. Our results have implications for research communities to implement strategies for continuous and active participation among members. Moreover, our work reveals the potential for the use of information shared on Twitter in order to facilitate communication and cooperation among research communities, by providing visibility to new resources or researchers from relevant but often little known research communities. Keywords: Twitter; academic conferences; evolution over time; topic models; sentiment analysis 1. Introduction Twitter has gained a lot in popularity as one of the most used and valuable microblogging services in recent years. According to the current statistics as published by the company itself 1 , there are more than 300 million monthly active users, generating over 500 million tweets every day, expressing their opinions on several issues all over the world. This massive amount of data generated by the crowd has been shown to be very useful in many ways, e.g., to predict the stock market [9], to support government efforts in cases of natural disasters [1], to assess political polarization in the public [12, 42], and so on. Another popular application of Twitter not only on a global scale, but in a more contextualized one, is the usage of the microblogging service in specific local events, which happen around the world. Usual examples are large 1 https://about.twitter.com/company as of May 2015. sports events such as the World Cup or the NFL finals, but also smaller events such as conferences, meetings or workshops where people gather together in communities around specific topics. These events are typically identified with a particular hashtag on Twitter (e.g., #www2014) and setup by an organizing team to give the audience a simple-to-use platform to discuss and share impressions or opinions happening during these events to serve as a back-channel for communication [32, 53, 3]. It is not surprising that recent research has also iden- tified the need to study Twitter further for instance for communication [14, 48] or dissemination [46, 27, 30, 4, 50] purposes. These studies suggest that Twitter serves as an important tool for scholars to establish new links in a com- munity or to increase the visibility of their research within the scientific landscape. Although there is a considerable body of work in this area, there is not much focus yet in studying a large sample of scientific events at the same time, which would help to generalize the results obtained. Preprint submitted to Computer Communications July 11, 2015
Transcript of Twitter in Academic Events: A Study of Temporal Usage ... · [email protected] dSchool of...

Twitter in Academic Events: A Study of Temporal Usage, Communication,Sentimental and Topical Patterns in 16 Computer Science Conferences
Denis Parraa, Christoph Trattnerb, Diego Gomezc, Matıas Hurtadoa, Xidao Wend, Yu-Ru Lind
aDepartamento de Ciencia de la Computacion, Pontificia Universidad Catolica de Chile, Santiago, Chile{dparra, mhurtado}@ing.puc.cl
bDepartment of Computer and Information Science, Norwegian University of Science and Technology, Norway{chritrat}@idi.ntnu.edu
cSchool of Communications, Pontificia Universidad Catolica de Chile, Santiago, Chile{dgomezara}@puc.cl
dSchool of Information Sciences, University of Pittsburgh, USA{xiw55, yurulin@}@pitt.edu
Abstract
Twitter is often referred to as a backchannel for conferences. While the main conference takes place in a physicalsetting, on-site and off-site attendees socialize, introduce new ideas or broadcast information by microblogging on Twitter.In this paper we analyze scholars’ Twitter usage in 16 Computer Science conferences over a timespan of five years. Ourprimary finding is that over the years there are differences with respect to the uses of Twitter, with an increase ofinformational activity (retweets and URLs), and a decrease of conversational usage (replies and mentions), which alsoimpacts the network structure – meaning the amount of connected components – of the informational and conversationalnetworks. We also applied topic modeling over the tweets’ content and found that when clustering conferences accordingto their topics the resulting dendrogram clearly reveals the similarities and differences of the actual research interests ofthose events. Furthermore, we also analyzed the sentiment of tweets and found persistent differences among conferences.It also shows that some communities consistently express messages with higher levels of emotions while others do it in amore neutral manner. Finally, we investigated some features that can help predict future user participation in the onlineTwitter conference activity. By casting the problem as a classification task, we created a model that identifies factors thatcontribute to the continuing user participation. Our results have implications for research communities to implementstrategies for continuous and active participation among members. Moreover, our work reveals the potential for the useof information shared on Twitter in order to facilitate communication and cooperation among research communities, byproviding visibility to new resources or researchers from relevant but often little known research communities.
Keywords: Twitter; academic conferences; evolution over time; topic models; sentiment analysis
1. Introduction
Twitter has gained a lot in popularity as one of themost used and valuable microblogging services in recentyears. According to the current statistics as publishedby the company itself 1, there are more than 300 millionmonthly active users, generating over 500 million tweetsevery day, expressing their opinions on several issues allover the world. This massive amount of data generated bythe crowd has been shown to be very useful in many ways,e.g., to predict the stock market [9], to support governmentefforts in cases of natural disasters [1], to assess politicalpolarization in the public [12, 42], and so on.
Another popular application of Twitter not only ona global scale, but in a more contextualized one, is theusage of the microblogging service in specific local events,which happen around the world. Usual examples are large
1https://about.twitter.com/company as of May 2015.
sports events such as the World Cup or the NFL finals,but also smaller events such as conferences, meetings orworkshops where people gather together in communitiesaround specific topics. These events are typically identifiedwith a particular hashtag on Twitter (e.g., #www2014)and setup by an organizing team to give the audience asimple-to-use platform to discuss and share impressionsor opinions happening during these events to serve as aback-channel for communication [32, 53, 3].
It is not surprising that recent research has also iden-tified the need to study Twitter further for instance forcommunication [14, 48] or dissemination [46, 27, 30, 4, 50]purposes. These studies suggest that Twitter serves as animportant tool for scholars to establish new links in a com-munity or to increase the visibility of their research withinthe scientific landscape. Although there is a considerablebody of work in this area, there is not much focus yet instudying a large sample of scientific events at the sametime, which would help to generalize the results obtained.
Preprint submitted to Computer Communications July 11, 2015

Until now, most researchers have investigated only one, oras many as three, scientific events simultaneously, whileignoring temporal effects in terms of usage, networking,or content. These are important aspects to be considered,since Twitter’s population and content types are quicklyand continually changing [26].
Studying Twitter as a back-channeling tool for eventssuch as academic conferences has several uses. For in-stance, by investigating usage patterns or content pub-lished, conference organizers could be able to better un-derstand their attendees. By identifying (i) which are themost popular conference topics (ii) who emerge as the on-line community leaders (iii) how participants interact (iv)what is the users’ sentiment towards the event, etc. orga-nizers and researchers can create attendance and partic-ipation prediction models, they can also quantify trend-ing topics in their respective research community, or theymight invent novel recommendation systems helping aca-demics connect to each other with greater ease [48, 18, 47].
Objective. Overall, our objective with this kind ofwork is to shed light on how Twitter is used for communi-cation purposes across scientific events over time (and es-pecially in the computer science domain). What is more,we wish to unveil community characteristics such as top-ical trends and sentiment which can be used to forecastwhether or not a user will be returning to the scientificevent in the following years.
Research questions. In this respect we have iden-tified five research questions, which we used to drive ourinvestigation. In particular, they were as follows:
RQ1 (Usage): Do people use Twitter more for socializingwith peers or for information sharing during confer-ences? How has such use of Twitter changed overthe years?
RQ2 (Network): What are the structures of conversationand information sharing networks at each confer-ence? Have these network structures changed overtime?
RQ3 (Topics): To what extent do conferences differ intheir topical coverage? Is there a topical drift intime over the years or does this stay stable?
RQ4 (Sentiment): Are there differences in the sentimentof Twitter posts between conferences? Does senti-ment of the tweets posted in each year of the confer-ence change over time?
RQ5 (Engagement): Do users who participate on Twit-ter during conferences keep participating over time?Which features are more helpful to predict this userbehavior?
To answer these questions, we crawled Twitter to col-lect a dataset that consists of tweets from 16 Computer
Science conferences from 2009 to 2013 – all 16 confer-ences each year. We examined the use given to Twit-ter in these conferences by characterizing its use throughretweets, replies, etc. We studied the structures of con-versation and information-sharing by deriving two net-works from the dataset: conversational (replies and men-tions) and informational (retweets) networks. Moreover,we studied the content of the tweets posted by analyzingtheir sentiments and latent topics trends. Furthermore, tounderstand the factors that drive users’ continuous partic-ipation, we propose a prediction framework which incor-porates usage, content and network metrics.
Findings. As a result of our analyses, we found: (i) anincreasing trend of informational usage (URLs and retweets)compared to the stable pattern of conversational usage(replies and mentions) of conferences on Twitter over time;(ii) the conversation network is more fragmented than theinformation network, along with an increase in the frag-menting of the over time; (iii) important differences be-tween conferences in terms of the sentiments extractedfrom their tweets; (iv) Dynamic Topic Model (DTM) com-pared to traditional LDA, captures relevant and differentwords and topics, but the latter provides more consistencyin the semantic of topics, and (v) that the number of con-ference tweets, the users’ centrality in information net-works, and the sentimentality of tweets are relevant fea-tures to predict users’ continuous participation on Twit-ter during academic conferences. These results summarizethe online user participation of a real research community,which in turn helps to understand how it is perceived inonline social networks and whether it is able to attractrecurring attention over time.
Contributions. Overall, our contributions can besummarized as follows:
• The in-depth study and a set of interesting findingson the temporal dynamics Twitter usage of 16 com-puter science conferences in the years 2009 to 2013.
• The mining, introduction and provision of a novellarge-scale dataset to study Twitter usage patternsin academic conferences over time.
Paper structure. Section 2 reviews Twitter as abackchannel in academic events. Then, Section 3 describesthe dataset in this study and how we obtained it. Section 4presents the experiment setup, followed by section 5 whichprovides the results. Section 6 summarizes our findingsand concludes our paper. Finally, Section 7 discusses thelimitations of our research and provides insights to futurework in this field.
2. Related Work
Twitter usage has been studied in circumstances as di-verse as political elections [22, 43], sporting events [21, 54],and natural disasters [2, 29]. However, the research that
2

studies Twitter as a backchannel in academic conferencesis closer to our work. Ebner et al. [14] studied tweetsposted during the ED-MEDIA 2008 conference, aand theyargue that micro-blogging can enhance participation in theusual conference setting. They conducted a survey of over41 people who used Twitter during conferences, and foundthat people who actively participate via Twitter are notonly physical attendants, but also that the reasons peopleparticipate are mainly for sharing resources, communicat-ing with peers, and establishing an online presence [36].
Considering another area, Letierce et al. [24] studiedTwitter in the semantic web community during the ISWCconference of 2009. They analyzed three other conferences[23] and found that examining Twitter activity during theconference helps to summarize the event (by categorizinghashtags and URLs shared)). Additionally, they discov-ered that the way people share information online is in-fluenced by their use of Twitter. Similarly, Ross et al.[38]investigated the use of Twitter as a backchannel withinthe community of digital humanists; by studying threeconferences in 2009 they found that the micro-bloggingactivity during the conference is not a single conversa-tion but rather multiple monologues with few dialoguesbetween users and that the use of Twitter expands theparticipation of members of the research community. Re-garding applications, Sopan et al. [39] created a tool thatprovides real-time visualization and analysis for backchan-nel conversations in online conferences.
In Wen et al.[48], the use of Twitter in three confer-ences in 2012 was investigated in relation to user mod-eling research communities. Twitter users were classi-fied into groups and it was found that most senior mem-bers of the research community tend to communicate withother senior members, and newcomers (usually masters orfirst year PhD students) receive little attention from othergroups; challenging Reinhardt’s assumption [36] about Twit-ter being an ideal tool to include newcomers in an estab-lished learning community.
In comparison to previous research, and to the best ofour knowledge, this article is the first to study a largersample of conferences (16 in total) over a period of fiveyears (2009-2013). This dataset allows us to make a con-tribution to Information and Computer Science, as well asanalyze trends of Twitter usage over time.
3. Dataset
Previous studies on analyzing tweets during confer-ences examined a small number of events [13, 24]. Foreach conference, they collected the tweets that containthe official hashtag in its text, for example, #kidneywk11,#iswc2009. They produced insights of how users employTwitter during the conference, but their results are lim-ited considering that they analyzed at most three of theseinstances. On the other hand, we are interested in study-ing trends of the usage and the structure over time, wherewe aimed to collect a dataset of tweets from a larger set of
conferences over several years. Our conference dataset wasobtained by following the list of conferences in ComputerScience available in csconf.net. We used the Topsy API2
to crawl tweets by searching for each conference’s officialhashtag. Since, as summarized by [36], Twitter activitycan happen at different stages of a conference: before,during, and after a conference; search in a time windowof seven days before the conference and seven days afterthe conference, in order to capture most of its Twitteractivity.
Conference dataset. For this study, we focused on 16conferences that had Twitter activity from 2009 to 2013.The crawling process lasted a total of two weeks in De-cember 2013. We aggregated 109,076 tweets from 16 con-ferences over the last five years3.
User-Timeline dataset. We acknowledge that userswould also interact with each other without the confer-ence hashtag, and therefore we additionally constructedthe timeline dataset by crawling the timeline tweets ofthose users who participated in the conference during thesame period (users from the conference dataset). Since theTwitter API only allows us to collect the most recent 3,200tweets for a given user, we used the Topsy API which doesnot have this limitation. Table 1 shows the statistics of ourdataset. In addition, we publish the detailed informationabout each conference4.
Random dataset. Any pattern observed would bebarely relevant unless we compare with a baseline, becausethe change might be a byproduct of Twitter usage trendsoverall. Hence, we show the conference tweets trend incomparison with a random sampled dataset. Several sam-pling methods about data collection from Twitter havebeen discussed by [37]. Unfortunately, none of those ap-proaches are applicable in this study, as most of them drewthe sample from the tweets posted during limited time pe-riods through Twitter APIs. Sampling from the historicaltweets (especially for the tweets in the five year period)via Twitter APIs seems to be a dead end. To overcomethis issue, we again used Topsy API, because it claims tohave full access to all historical tweets. As Topsy does notprovide direct sampling APIs, we then wrote a script toconstruct a sample from all the tweets in the Topsy archive,and to ensure the sampling process is random and the sam-ple acquired is representative. To eliminate the diurnal ef-fect on Twitter, we randomly picked two-thirds of all thehours in each year, randomly picked two minutes from theeach hour as our search time interval, and randomly pickedthe page number in the returned search result. The queryaims to search for the tweets that contain any one of the al-phabetical characters (from A to Z). The crawling processtook two days in December, 2013. As each query returned100 tweets, we were able to collect 5,784,649 tweets from2009 to 2013. Our strategy was designed to create a quasi-
2http://topsy.com3The dataset can be obtained upon request.4https://github.com/xidaow/twitter-academic
3
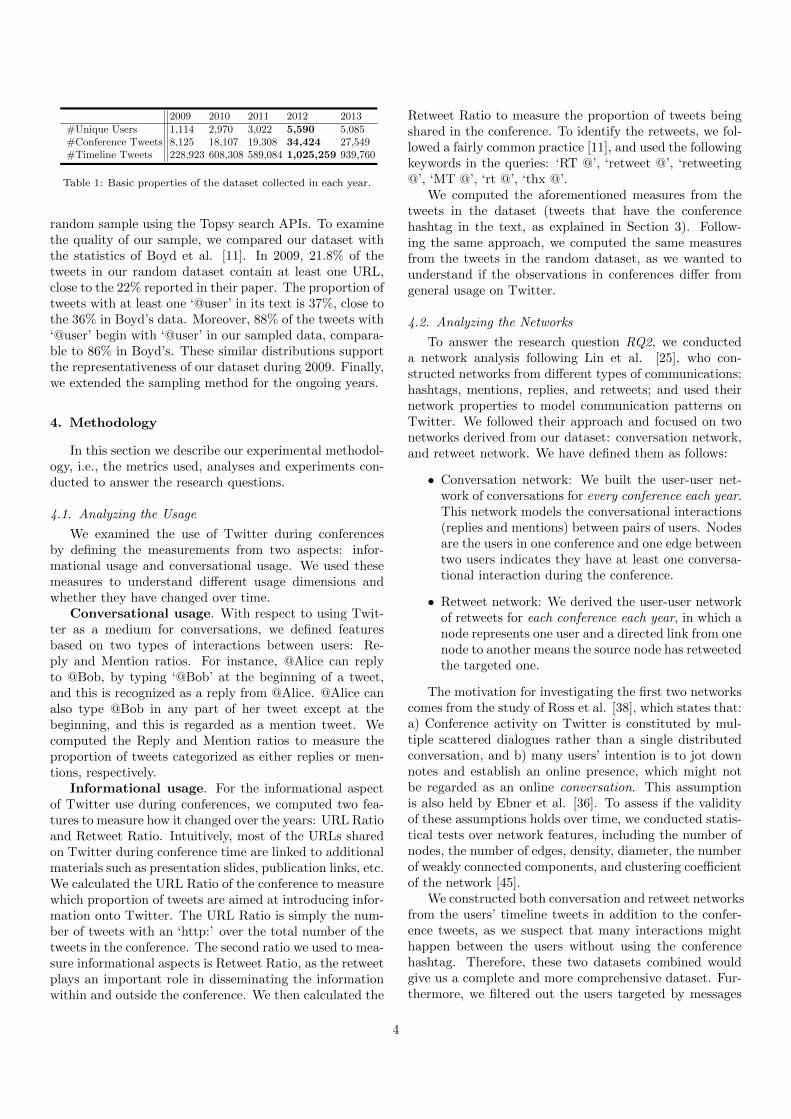
2009 2010 2011 2012 2013#Unique Users 1,114 2,970 3,022 5,590 5,085#Conference Tweets 8,125 18,107 19,308 34,424 27,549#Timeline Tweets 228,923 608,308 589,084 1,025,259 939,760
Table 1: Basic properties of the dataset collected in each year.
random sample using the Topsy search APIs. To examinethe quality of our sample, we compared our dataset withthe statistics of Boyd et al. [11]. In 2009, 21.8% of thetweets in our random dataset contain at least one URL,close to the 22% reported in their paper. The proportion oftweets with at least one ‘@user’ in its text is 37%, close tothe 36% in Boyd’s data. Moreover, 88% of the tweets with‘@user’ begin with ‘@user’ in our sampled data, compara-ble to 86% in Boyd’s. These similar distributions supportthe representativeness of our dataset during 2009. Finally,we extended the sampling method for the ongoing years.
4. Methodology
In this section we describe our experimental methodol-ogy, i.e., the metrics used, analyses and experiments con-ducted to answer the research questions.
4.1. Analyzing the Usage
We examined the use of Twitter during conferencesby defining the measurements from two aspects: infor-mational usage and conversational usage. We used thesemeasures to understand different usage dimensions andwhether they have changed over time.
Conversational usage. With respect to using Twit-ter as a medium for conversations, we defined featuresbased on two types of interactions between users: Re-ply and Mention ratios. For instance, @Alice can replyto @Bob, by typing ‘@Bob’ at the beginning of a tweet,and this is recognized as a reply from @Alice. @Alice canalso type @Bob in any part of her tweet except at thebeginning, and this is regarded as a mention tweet. Wecomputed the Reply and Mention ratios to measure theproportion of tweets categorized as either replies or men-tions, respectively.
Informational usage. For the informational aspectof Twitter use during conferences, we computed two fea-tures to measure how it changed over the years: URL Ratioand Retweet Ratio. Intuitively, most of the URLs sharedon Twitter during conference time are linked to additionalmaterials such as presentation slides, publication links, etc.We calculated the URL Ratio of the conference to measurewhich proportion of tweets are aimed at introducing infor-mation onto Twitter. The URL Ratio is simply the num-ber of tweets with an ‘http:’ over the total number of thetweets in the conference. The second ratio we used to mea-sure informational aspects is Retweet Ratio, as the retweetplays an important role in disseminating the informationwithin and outside the conference. We then calculated the
Retweet Ratio to measure the proportion of tweets beingshared in the conference. To identify the retweets, we fol-lowed a fairly common practice [11], and used the followingkeywords in the queries: ‘RT @’, ‘retweet @’, ‘retweeting@’, ‘MT @’, ‘rt @’, ‘thx @’.
We computed the aforementioned measures from thetweets in the dataset (tweets that have the conferencehashtag in the text, as explained in Section 3). Follow-ing the same approach, we computed the same measuresfrom the tweets in the random dataset, as we wanted tounderstand if the observations in conferences differ fromgeneral usage on Twitter.
4.2. Analyzing the Networks
To answer the research question RQ2, we conducteda network analysis following Lin et al. [25], who con-structed networks from different types of communications:hashtags, mentions, replies, and retweets; and used theirnetwork properties to model communication patterns onTwitter. We followed their approach and focused on twonetworks derived from our dataset: conversation network,and retweet network. We have defined them as follows:
• Conversation network: We built the user-user net-work of conversations for every conference each year.This network models the conversational interactions(replies and mentions) between pairs of users. Nodesare the users in one conference and one edge betweentwo users indicates they have at least one conversa-tional interaction during the conference.
• Retweet network: We derived the user-user networkof retweets for each conference each year, in which anode represents one user and a directed link from onenode to another means the source node has retweetedthe targeted one.
The motivation for investigating the first two networkscomes from the study of Ross et al. [38], which states that:a) Conference activity on Twitter is constituted by mul-tiple scattered dialogues rather than a single distributedconversation, and b) many users’ intention is to jot downnotes and establish an online presence, which might notbe regarded as an online conversation. This assumptionis also held by Ebner et al. [36]. To assess if the validityof these assumptions holds over time, we conducted statis-tical tests over network features, including the number ofnodes, the number of edges, density, diameter, the numberof weakly connected components, and clustering coefficientof the network [45].
We constructed both conversation and retweet networksfrom the users’ timeline tweets in addition to the confer-ence tweets, as we suspect that many interactions mighthappen between the users without using the conferencehashtag. Therefore, these two datasets combined wouldgive us a complete and more comprehensive dataset. Fur-thermore, we filtered out the users targeted by messages
4

in both networks who are not in the corresponding confer-ence dataset to assure these two networks only capture theinteraction activities between conference Twitter users.
4.3. Analyzing the Topics
To answer the research question RQ3, we conductedtwo different kinds of experiments: In the first one welooked at the topics emerging from the tweets in each con-ference and compared them to each other. In the secondone we tracked the topics emerging from the tweets postedby the users of each conference over the years. There areseveral ways to derive topics from text. Typically, this isdone via probabilistic topic modeling [5, 40] over a giventext corpus. Probably the most popular approach for thiskind of task is Latent Dirichlet Allocation [7], also knownas LDA, for which there are many implementations avail-able online such as Mallet5 and gensim6. LDA is a gen-erative probabilistic model which assumes that each doc-ument in the collection is “generated” by sampling wordsfrom a fixed number of topics in a corpus. By analyzingthe co-occurrence of words in a set of documents, LDAidentifies latent topics zi in the collection which are prob-ability distributions over words p(w|Z = zi) in the corpus,while also allowing the obtainment of the probability dis-tribution of those topics per each document p(z|D = di).This technique has been well studied and used in severalworks [5]). In the context of our study we applied LDA tothe first part of RQ3.
Although LDA is a well-established method to derivetopics from a static text corpus, the model also has somedrawbacks. In particular, temporal changes in the cor-pus are not well tracked. To overcome this issue, recentresearch has developed more sophisticated methods thatalso take the time variable into account. In this context,a popular approach is called the Dynamic Topic Modeling(DTM) [6], this particular model assumes that the orderof the documents reflects an evolving set of topics. Hence,it identifies a fixed set of topics that evolve over a periodof time. We used DTM to study the extent to which topicschange in conferences over the years as well as the secondpart of RQ3.
4.4. Analyzing the Sentiment
To understand how participants express themselves inthe context of a conference we studied the sentiment ofwhat was tweeted during the conferences. In previouswork, researchers have successfully applied sentiment anal-ysis in social media [33, 8, 52] to, for instance, understandhow communities react when faced with political, socialand other public events as well, or how links between usersare formed.
5http://mallet.cs.umass.edu/topics.php6http://radimrehurek.com/gensim/
There are several ways to derive sentiment from text,e.g., NLTK7 or TextBlob8. Our tool of choice is Sen-tiStrength9, a framework developed by Thelwall et al. [41],which has been used many times as a reliable tool for an-alyzing social media content [35, 20]. SentiStrength pro-vides two measures to analyze text in terms of the sen-timent expressed by the user: positivity ϕ+(t) (between+1 and +5, +5 being more positive) and negativity ϕ−(t)(between -1 and -5, -5 being more negative). Followingthe analysis of Kucuktunc et al. [20], we derived twometrics based on the values of positivity and negativityprovided by SentiStrength: sentimentality ψ(t) and atti-tude φ(t). Sentimentality measures how sentimental, asopposed to neutral, the analyzed text is. It is calculatedas ψ(t) = ϕ+(t)−ϕ−(t)−2. On the other hand, attitude isa metric that provides the predominant sentiment of a textby combining positivity and negativity. It is calculated asφ(t) = ϕ+(t) + ϕ−(t). As an example, if a text has nega-tivity/positivity values -5/+5 is extremely sentimental (-5-(-5) -2 = 8), while its attitude is neither positive nor neg-ative (+5 + (-5) = 0). Based on these two metrics, wecompared the sentiment of the dataset across conferences,statically and over time.
4.5. Analyzing Continuous Participation
To understand which users’ factors drive their continu-ing participation in the conference on Twitter, we traineda binary classifier with some features induced from users’Twitter usage and their network metrics. Based on ourown experience, we can attest that attending academicconferences has two major benefits: access to quality re-search and networking opportunities. We expect that asimilar effect exists when one continuously participates onTwitter. Users’ experience tweeting during a conferencecould have an effect on whether they decide to participatevia twitter again. Twitter could assist in delivering addi-tional valuable information and meaningful conversationsto the conference experience. To capture both ends of auser’s Twitter experience, we computed the usage mea-sures, as described in Section 4.1, and user’s network po-sition [25] in each of the networks: conversation networkand retweet network, as discussed in Section 4.2. Mea-sures for user’s network position are calculated to repre-sent the user’s relative importance within the network, in-cluding degree, in-degree, out-degree, HIT hub score [19],HIT authority score [19], PageRank score [34], eigenvec-tor centrality score [10], closeness centrality [45], between-ness centrality [45], and clustering coefficient [45]. Finally,considering recent work in this area that shows that senti-ment can be helpful in the link-prediction problem [52], weextracted two sentiment-based metrics and incorporatedthem in the prediction model.
7http://www.nltk.org8http://textblob.readthedocs.org/en/dev/9http://sentistrength.wlv.ac.uk
5

Dataset. We identified 14,456 unique user-conferenceparticipations from 2009 to 2012 in our dataset. We thendefined a positive continuing participation if one user showedup again in the same conference he or she participated invia Twitter last year, while a negative positive continu-ing participation if the user failed to. For example, @Aliceposted a tweet with ‘#cscw2010’ during the CSCW confer-ence in 2010, we counted it as one positive continuing par-ticipation if @Alice posted a tweet with ‘#cscw2011’ dur-ing the CSCW conference in 2011. By checking these users’conference participation records via Twitter in the follow-ing year (2010-2013), we identified 2,749 positive contin-uing participations. We then constructed a dataset with2,749 positive continuing participations and 2,749 negativecontinuing participations (random sampling [16]).
Features. In the prediction dataset, each instanceconsisted of a set of features that describe the user’s in-formation in one conference in one year from differentaspects, and the responsive variable was a binary indica-tor of whether the user came back in the following year.We formally defined the key aspects of one user’s featuresdiscussed above, in the following:
• Baseline: This set only includes the number of time-line tweets and the number of tweets with the confer-ence hashtag, as the users’ continuous participationmight be correlated with their frequencies of writingtweets. We consider this as the primary informationabout a user and this information will be includedin the rest of the feature sets.
• Conversational: We built this set by including theconversational usage measures (Mention Ratio andRe- ply Ratio) and network position of the user inthe conversation network.
• Informational: This set captures the information ori-ented features, including the information usages (RetweetRatio, URL Ratio) and user’s position in the retweetnetwork.
• Sentiment: We also considered sentimentality andattitude [20] as content features to test whether thesentiment extracted from tweets’ text can help pre-dict whether a user will participate in a conferencein the following years.
• Combined features: A set of features that utilizes allthe features above to test them as a combination.
Evaluation. We used Information Gain to determinethe importance of individual features in WEKA [15]. Thenwe computed the normalized score of each variable’s Info-Gain value as its relative importance. To evaluate thebinary classifier, we deployed different supervised learningalgorithms and used the area under ROC curve (AUC) todetermine the performance of our feature sets. The eval-uation was performed using 10-fold cross validation in theWEKA machine learning suite.
5. Results
In the following sections we report on the results ob-tained for each of our analyses.
5.1. Has usage changed?
We can highlight two distinct patterns first. The trendsobserved for the informational usage ratios are similar.The Retweet Ratio increases (6.7% in 2009, 48.2% in 2013)over the years (one-way ANOVA, p < .001) along withURL Ratio (21.2% in 2009, 51.3% in 2013; one-way ANOVA,p < .001). Figure 1 shows the overtime ratio values ofdifferent Twitter usage metrics in the conferences accom-panied by their corresponding values from the randomdataset. Noticeably, the Retweet Ratio rapidly increasedfrom 2009 to 2010 but rather steadily gained afterward.We believe this could be explained by the Twitter inter-face being changed in 2009, when they officially moved‘Retweet’ button above the Twitter stream [11]. On theother hand, rather stable patterns can be observed in bothconversational measures: Reply Ratio (8.2% in 2009, 6.1%in 2013) and Mention Ratio (10.0% in 2009, 12.9% in2013). Therefore, as we expected, Twitter behaved moreas an information sharing platform during the conference,while the conversational usage did not seem to change overthe years.
Figure 1 also presents the differences between the ratiovalues in the conference dataset and the baseline dataset,as we want to understand if the trend observed above is thereflection of Twitter usage in general. During the confer-ences, we observed a higher Retweet Ratio and URL Ratio.We argue that it is rather expected because of the nature ofacademic conferences: sharing knowledge and valuable re-cent work. The Mention Ratio in the conference is slightlyhigher than it is in the random dataset, because the con-ference is rather where people interact with each other in ashort period of time. However, we observe a significant dif-ference in the Reply Ratio. Users start the conversationon Twitter using the conference hashtag to some extentlike all users, but most users who reply (more than 90%)usually drop the hashtag. Although the conversation re-mains public, dropping the hashtag could be a method ofisolating the conversation from the rest of the conferenceparticipants. However, a deeper analysis, which is outsidethe context of this research, should be conducted to assessthis assumption, since in some cases users would drop thehashtag simply to have more characters available in themessage.
Table 2 shows the evolution of the network measures.Each metric is an average of all the conferences per year.We first highlight the similar patterns over years observedfrom both networks: conversation network and retweetnetwork. During the evolution, several types of networkmeasures increase in both networks: (i) the average num-ber of nodes; (ii) the average number of edges; and (iii)the average in/out degree. This suggests that more people
6

0.0
0.2
0.4
0.6
2009 2010 2011 2012 2013
Rat
io V
alue
Mention Reply Retweet URL
Conference Tweets Random Tweets
Figure 1: Usage pattern over the years in terms of proportion of each category of tweets. Continuous lines represent conference tweets, dashedlines a random dataset from Twitter.
Feature 2009 2010 2011 2012 2013
Con
vers
atio
n
#Nodes 165.313± 50.358 323.688± 100.481 385.625± 100.294 649.313± 202.518 622.188± 142.485#Edges 342.188± 126.758 660.625± 240.704 688.500± 227.768 1469.000± 643.431 1157.813± 344.484In/Out degree 1.446± 0.153 1.567± 0.161 1.502± 0.086 1.646± 0.144 1.618± 0.088Density 0.044± 0.020 0.010± 0.002 0.007± 0.001 0.005± 0.001 0.004± 0.000Clustering Coefficient 0.066± 0.015 0.086± 0.014 0.074± 0.008 0.070± 0.009 0.078± 0.006Reciprocity 0.172± 0.034 0.210± 0.029 0.237± 0.023 0.195± 0.022 0.203± 0.017#WCCs 4.750± 0.911 13.438± 3.243 16.625± 4.118 26.750± 6.956 29.188± 5.930
Ret
wee
t
#Nodes 87.063± 30.005 355.500± 107.412 476.813± 117.641 720.875± 210.047 734.375± 153.998#Edges 116.375± 46.124 722.125± 258.400 940.938± 277.384 1676.250± 693.462 1431.625± 351.722In/Out degree 0.981± 0.102 1.607± 0.129 1.653± 0.114 1.760± 0.143 1.728± 0.094Density 0.121± 0.048 0.009± 0.001 0.006± 0.001 0.004± 0.000 0.003± 0.000Clustering Coefficient 0.051± 0.016 0.078± 0.010 0.063± 0.008 0.048± 0.008 0.060± 0.006Reciprocity 0.053± 0.018 0.066± 0.010 0.054± 0.005 0.058± 0.008 0.070± 0.006#WCCs 6.250± 1.627 6.500± 1.780 5.375± 1.341 6.625± 1.326 6.625± 1.998
Table 2: Descriptive statistics (mean± SE) of network metrics for the retweet and conversation networks over time. Each metric is an averageover the individual conferences.
are participating in the communication network.
Since there is a large between-conference variability interms of nodes and edges in both conversation and retweetnetworks (large S.E. values in Table 2), we present ad-ditional details of these metrics in Figure 2. This plotgrid shows nodes and edges over time of the conversa-tion and retweet networks at every conference, and it al-lows to capture some relation between community size(in terms of relative conference attendance) and socialmedia engagement. Large conferences such as CHI andWWW also present larger amounts of participation in so-
cial media, but, interestingly, the CHI community showsmore conversational edges than the WWW community,which shows more retweet edges. Small conferences suchas IKNOW and IUI also have a rather small participationin social media, but the HT conference, being similarlysmall-sized, presents more activity. Another interestingcase is the community of the RECSYS conference (Rec-ommender Systems), which has more activity than otherlarger conferences such as KDD, SIGIR, UBICOMP andUIST. This behavior shows evidence of a certain relationbetween conference size and social media engagement, butthe relation is not followed by all conference communities.
7

CHI CIKM ECTEL HT
IKNOW ISWC IUI KDD
RECSYS SIGIR SIGMOD UBICOMP
UIST VLDB WISE WWW
0
1000
2000
3000
4000
5000
0
1000
2000
3000
100
200
300
400
500
0
200
400
600
800
100
200
300
1000
2000
3000
0
100
200
300
400
0
500
1000
1500
0
500
1000
1500
2000
400
800
1200
1600
0
100
200
300
400
0
100
200
300
400
500
0
200
400
600
100
200
300
400
0
500
1000
1500
2000
0
3000
6000
9000
20092010
20112012
20132009
20102011
20122013
20092010
20112012
20132009
20102011
20122013
20092010
20112012
20132009
20102011
20122013
20092010
20112012
20132009
20102011
20122013
20092010
20112012
20132009
20102011
20122013
20092010
20112012
20132009
20102011
20122013
20092010
20112012
20132009
20102011
20122013
20092010
20112012
20132009
20102011
20122013
Variable Conversation Nodes Conversation Edges Retweet Nodes Retweet Edges
Figure 2: Evolution of nodes and edges in informational and conversational networks.
Then, we compare these two networks in terms of thedifferences observed. Table 2 shows that the average num-ber of weakly connected components in conversation net-work (#WCC) grows steadily over time from 4.750 com-ponents on average in 2009 to a significantly larger 29.188components in 2013, with the CHI conference being themost fragmented (#WCC=87, #Nodes=2117). However,the counterpart value in retweet network is almost invari-able, staying between 5.375 and 6.625 on average. The for-mer metric supports the assumption of Ross et al. [38] interms of the scattered characteristic of the activity network(i.e., multiple non-connected conversations). The #WCCsuggests that the retweet network is more connected thanthe conversation network. Finally, in Figure 2 we see thatthe number of retweet edges is larger than the number ofconversation edges with a very few exceptions such as CHIand a few conferences back in 2009.
5.2. Has interaction changed?
To answer this research question we transformed infor-mational interactions (retweets) and conversational inter-actions (replies, mentions) into networks. Not surprisingly,the reciprocity in the conversation network is significantlyhigher than the one in the retweet network (p < .001 in allyears; pair-wise t-test). This shows that the conversationsare more two-way rounded interactions between pairs ofusers while people who get retweeted do not necessarilyretweet back. Both results are rather expected. The men-tions and replies are tweets sent to particular users, and
therefore the addressed users are more likely to reply dueto social norms. Yet, the retweet network is more like astar network, and users in the center do not necessarilyretweet back.
Moreover, we observe that the average clustering coef-ficient in conversation network is higher than the one inretweet network, in general. We think that two users whotalked to the same people on Twitter during conferencesare more likely to be talking to each other, while users whoretweeted the same person do not necessarily retweet eachother. However, this significant difference is only found in2012 (p < .05; t-test) and 2013 (p < .001; t-test). We tendto believe that it is the nature of communication on Twit-ter, but further analysis and observations are required tosupport this claim.
5.3. Have latent topics changed?
To answer RQ3 we conducted two types of analyses:in the first one we utilized LDA [7] to discover and sum-marize the main topics of each conference with the goal offinding similarities and differences between them, and inthe second one we applied DTM [6] to examine how thetopics at each conference evolve over time.
LDA. To apply LDA over the conference dataset, weused MALLET 10, considering each tweet as a single docu-ment and each conference as a separate corpus. Although
10http://mallet.cs.umass.edu/topics.php
8
CHI CIKM ECTEL HTTopic 1 Topic 2 Topic 3 Topic 1 Topic 2 Topic 3 Topic 1 Topic 2 Topic 3 Topic 1 Topic 2 Topic 3people research design twitter search data workshop learning paper hypertext paper social
talk time great social paper talk presentation good great conference session keynotesession interaction good slides people industry nice work keynote workshop networks mediasocial paper work session workshop keynote design talk people twitter talk linkspaper workshop today time entities user slides teachers conference presentation science tagginguser papers conference entity nice great online session social papers influence slides
twitter nice game online google work project mobile technology great data tagsvideo human panel query users research john reflection creativity link viral systems
IKNOW ISWC IUI KDDTopic 1 Topic 2 Topic 3 Topic 1 Topic 2 Topic 3 Topic 1 Topic 2 Topic 3 Topic 1 Topic 2 Topic 3
conference data keynote semantic ontology data paper talk social great paper datagraz knowledge session paper conference slides workshop user keynote workshop talk conference
social talk research talk great keynote presentation great conference slides keynote panellearning semantic poster challenge session workshop nice google users tutorial analytics papers
presentation great management social people open proceedings session people session industry socialonline room track presentation good ontologies media context data topic award domainnice paper event nice demo sparql good time twitter year models knowledgetool good semantics track work iswc papers library interesting blei people start
RECSYS SIGIR SIGMOD UBICOMPTopic 1 Topic 2 Topic 3 Topic 1 Topic 2 Topic 3 Topic 1 Topic 2 Topic 3 Topic 1 Topic 2 Topic 3
talk recommender recommendation search data paper great data paper paper great talkuser slides paper people user slides query conference sigmod ubicomp workshop socialgood systems social time industry talk linkedin keynote demo nice session workgreat recommendations users results query session people today session year online mobile
keynote tutorial twitter conference retrieval great analytics twitter talk papers conference goodconference recsys people users good award workshop graph time ubiquitous computing poster
work presentation industry information track panel good management award demo location videosworkshop data nice evaluation papers keynote team large pods home find award
UIST VLDB WISE WWWTopic 1 Topic 2 Topic 3 Topic 1 Topic 2 Topic 3 Topic 1 Topic 2 Topic 3 Topic 1 Topic 2 Topic 3paper touch great today paper data education world summit conference people datamedia student work tutorial check talk children learning teachers search internet socialaward talk uist system analytics vldb school wise learners twitter open talkproject innovation demo dbms keynote infrastructure future session doha great paper berners
wins time conference seattle session workshop technology students qatar time cerf keynoteshape papers keynote panel google search people great teacher today google slidessession video cool people demo queries change innovation life panel world tutorialworld people research query database consistency initiative live global papers network session
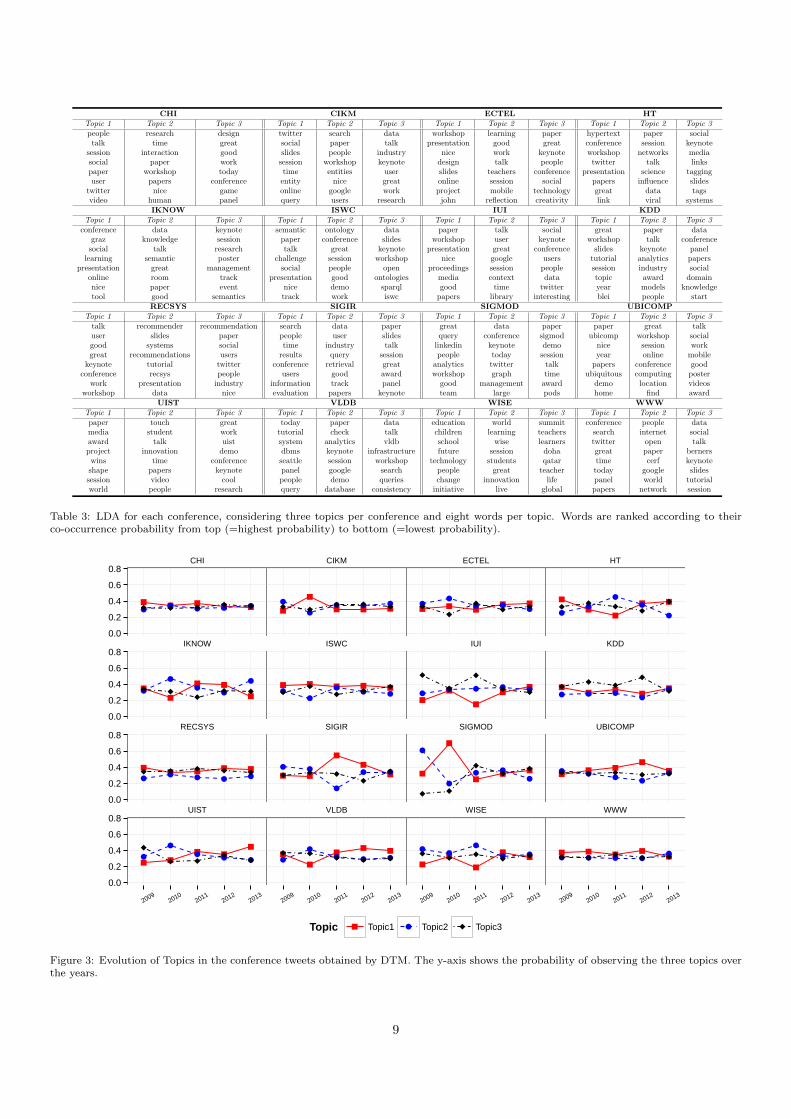
Table 3: LDA for each conference, considering three topics per conference and eight words per topic. Words are ranked according to theirco-occurrence probability from top (=highest probability) to bottom (=lowest probability).
CHI CIKM ECTEL HT
IKNOW ISWC IUI KDD
RECSYS SIGIR SIGMOD UBICOMP
UIST VLDB WISE WWW
0.0
0.2
0.4
0.6
0.8
0.0
0.2
0.4
0.6
0.8
0.0
0.2
0.4
0.6
0.8
0.0
0.2
0.4
0.6
0.8
20092010
20112012
20132009
20102011
20122013
20092010
20112012
20132009
20102011
20122013
Topic Topic1 Topic2 Topic3
Figure 3: Evolution of Topics in the conference tweets obtained by DTM. The y-axis shows the probability of observing the three topics overthe years.
9

Figure 4: Dendrogram presenting clusters of conferences based on their tweets using LDA. Each conference is represented as a vector of thewords extracted from the LDA latent topics, where weights are computed employing tf-idf. The dissimilarities between topics are calculatedwith cosine distance. Finally, we applied Ward’s hierarchical clustering method to generate the dendrogram.
using LDA on short texts, such as tweets, has shown lim-itations in comparison to documents of larger length [17,51], some studies have shown a good performance by pool-ing tweets based on common features [49, 28] while othershave just considered very few topics per tweet [31]. Inour analysis, in order to deal with short text, we consid-ered only 3 topics per tweet. We pre-processed the contentby keeping only tweets in English, and by removing stopwords, special characters (e.g., commas, periods, colonsand semicolons), URLs and words with less than threecharacters. We tried with several number of topics (3, 5,10, and 15), but found that k=3 topics showed the bestfit of relevant and semantically coherent topics, as shownin table 3. In this grid, each topic is presented as a listof words, ranking by co-occurrence probability from topto bottom. We see that words related to academic con-ferences, in a general sense emerge with high probabili-ties for almost all conferences, such as talk, session, paper,slides, workshop, keynote, tutorial and presentation, show-ing evidence that people use Twitter and the conferencehashtag to present their opinions about entities or activ-ities strongly related to these kind of events. Moreover,people use words that represent the main topics of theconferences.
An interesting question in this context is whether ornot these words can be used to cluster conferences ac-cording to their semantics. To do so, we represented eachconference as a vector of words extracted from LDA top-ics and applied a hierarchical clustering routine known asWard’s method [44]. The main result of this experimentcan be found in Figure 4. The explicit cosine distances toproduce the clustering dendrogram are presented in TableA.6. Interestingly, we find that this approach performsextremely well: (a) both SIGMOD and VLDB are con-ferences in the database and database management areas,(b) HT and WWW are related to the hypertext, the Weband social media, (c) CIKM and SIGIR and conferencesrelated to information retrieval, (d) IUI and RECSYS dealwith recommendation and personalization, (e) WISE and
ECTEL’s main topic is technologies in education, (f) CHIand UIST are related to Human-Computer interaction,and (g) KDD and IKNOW’s main themes are data miningand machine learning. These results can have an impor-tant impact: since researchers often complain that it isquite a challenge to find work or to cross different, pos-sibly relevant, communities to their own work, it opensthe door for microblogging content to connect different re-search communities, and build, for instance, applicationsthat recommend relevant researchers or content across sim-ilar communities in a timely manner.
DTM. The second part of RQ3 involves understand-ing the evolution of topics at each conference over time,and whether different conferences present similar evolu-tion patterns. We used DTM for this task, and performedthe same content pre-processing steps as described before.Similarly to the LDA analysis, we defined K=3 topics perconference and plotted their evolution over time based onthe average document-topic probabilities observed at eachyear. Figure 3 presents the results of this experiment. Wecan observe that at certain conferences (e.g., CHI, WWWor ISWC), the topical trend stays stable over time. How-ever, other conferences show significant differences in theprobability of certain topics. This is for instance the casefor KDD and UBICOMP, where one topic shows a largerprobability than the others over the years. Other confer-ences such as IUI, SIGIR and SIGMOD show very cleardrifts of their topics over time. These results suggest thatconferences have important differences on how their la-tent topics extracted from Twitter conversations, evolveover time. One interesting question that stems from theseresults, which is out of the scope of this article, is the ques-tion of why this topical drift in time is actually happening:is it because the research community itself (=conferenceparticipants) becomes interested in different subjects overtime or because the conference organizers bring in newtopics every year?
10

0.00
0.25
0.50
0.75
CHI
CIKM
ECTEL
HT
IKNOW
ISWC
IUI
KDD
RecSys
SIGIR
SIGMOD
UBICOMP
UIST
VLDB
WISE
WWW
Sentim
entality
0.0
0.2
0.4
CHI
CIKM
ECTEL
HT
IKNOW
ISWC
IUI
KDD
RecSys
SIGIR
SIGMOD
UBICOMP
UIST
VLDB
WISE
WWW
Attitude
Figure 5: Average attitude and sentimentality in each conference. The red dotted line shows the average value for the whole dataset.
neutral sentimental stable unstable
CIKM
CIKM
IKNOW
IKNOWRecSysWWWECTEL
UBICOMPCHIUIST
ECTELWWW
RecSys
UBICOMP
UIST
CHI
HT
WISEISWCSIG
MODIUISIG
IRVLDB
KDD
VLDB
KDDISWCHT
WISESIGIR
SIGMOD
IUI
0.5
1.0
2009 2010 2011 2012 2013 2009 2010 2011 2012 2013 2009 2010 2011 2012 2013 2009 2010 2011 2012 2013
year
Sentimentality Trend (neutral vs. sentimental)
Figure 6: Trends of Sentimentality at each conference in every year.
negative positive stable unstable
IUIHT
HT
IUI
ECTELSIG
MODIKNOW
SIGMOD
IKNOW
ECTEL
KDDWWW
CHI
WWWKDD
CHI
RecSys
WISEVLDBISWCCIKMSIGIR
UBICOMP
UIST
VLDB
RecSysSIGIRISWC
WISE
UISTUBICOMP
CIKM
-0.5
0.0
0.5
2009 2010 2011 2012 2013 2009 2010 2011 2012 2013 2009 2010 2011 2012 2013 2009 2010 2011 2012 2013
year
Attitude Trend (positive vs. negative)
Figure 7: Trends of Attitude at each conference in every year.
5.4. Has sentiment changed?
We analyzed the sentiment of the tweets to addressRQ4 by calculating sentimentality and attitude to comparethem across conferences. Overall, we can observe fromthis analysis (see Figure 5 and 6) that for both sentiment-
related metrics half of the conferences show a rather in-consistent behavior over time, though it is still possible toobserve some patterns. Conferences that have well estab-lished communities with several thousands of users tweet-ing during the academic event, such as CHI or WWW,
11

tend to perform in a stable manner in terms of sentimen-tality and attitude. Moreover, conferences in the Human-Computer interaction area, though not always uniformlyover time, show a consistent positive attitude comparedto conferences in areas such as Social Media Analysis andData-Mining. A third finding is that conferences with re-cent history such as ECTEL or IKNOW, although fromdifferent areas of Computer Science, show a positive ten-dency in terms of attitude.
Sentimentality. As shown on the top of Figure 5,sentimentality measures the level of emotion expressed inthe tweets, with either positive or negative polarity, and ithas a mean value of 0.714±0.046 in the conference dataset.This is rather uniform across all conferences, but we ob-serve that the conferences related to the area of Human-Computer interaction such as UBICOMP, UIST and CHIhave the largest sentimentality. This means that tweetsin these conferences contain more positive words such asfor instance great, nice or good than other conferences.We can also observe this in the topics as presented intable 3. Meanwhile, ECTEL and HT, which are relatedto Technology-Enhanced Learning and Hypertext, respec-tively, are the ones showing less sentimental tweets. How-ever, their average sentimentality is not too far from thatfound in CHI and UBICOMP. At the bottom of Figure5, attitude of the users’ content, i.e., towards more posi-tive or negative sentiment polarity, is presented. We seethat all conferences have positive attitude on average, butthis value has a different distribution than sentimentality.Again, UIST and UBICOMP are the top conferences, withmore positive attitude on average compared to a meandataset attitude of 0.344± 0.048, but this time CHI is leftin fifth place behind CIKM and IKNOW. On the otherhand, SIGMOD, VLDB and WWW show the lowest pos-itive attitude values. To answer the second part of RQ4,we further studied the patterns of these values over time.
Figure 6 shows each conference’s sentimentality trendsover time. As highlighted, the conferences are categorizedinto four groups neutral, sentimental, stable and unstable.We observe conferences with a trend towards becoming ei-ther more neutral (CIKM) or more sentimental over time(see IKNOW), but we also show those conferences thatpresent stable patterns of sentimentality such as CHI andWWW, and those presenting unstable behavior. Amongthe conferences with stable sentimentality, UIST, UBI-COMP and CHI are always more sentimental in averagecompared to WWW, RecSys and ECTEL. Here we see dif-ferences among CHI and WWW, two well-established re-search communities, showing that the messages in WWWare more neutral, while CHI tweets have more emotionassociated to them.
A special case is ECTEL, which with the exception ofthe year 2010 where its sentimentality suffered a significantdrop, the rest of the time has shown stable behavior simi-lar to WWW. Finally, we see that half of the conferenceshave unstable sentimentality, exhibiting different values inconsecutive years.
Attitude. The perspective provided by sentimental-ity allows to tell whether certain research communities aremore likely to share content in a neutral language or ex-pressing opinions with emotion, either positive or nega-tive, however it does not tell whether this sentiment hasa positive or negative attitude. This is the reason whyour analysis also considers attitude. Figure 7 shows eachconference’s attitude trends over time, while also clas-sifying them into four attitude-related groups: positive,negative, stable and unstable. We observe that HT andIUI conferences have a tendency to decrease the positiv-ity of posted Twitter messages. The opposite is found forECTEL, IKNOW and SIGMOD. SIGMOD shows a posi-tive tendency, but is the only conference that had a neg-ative attitude back in 2009. Among the conference com-munities with stable attitude, CHI and WWW show upagain supporting the idea that well-established researchcommunities are not only stable in their sentiment, butalso in their attitude, with CHI attitude always appear-ing as more positive than WWW. It is interesting to ob-serve KDD (Knowledge and Data Discovery conference)grouped as a conference of stable attitude, since it wasfound to be unstable in terms of sentimentality. However,this example shows that having a varying sentimentality(more or less emotional) over time does not necessarilyaffect the overall attitude (always positive or negative).The other conferences do not show consistent patterns inattitude behavior.
5.5. What keeps the users returning?
In order to identify the variables that influence whetherusers participate in Twitter in the subsequent conferences,we defined a prediction task where the class to be predictedis whether users participated in a conference or not, usingthe features presented in section 4.5. These features aremostly based on user activity and position on the inter-action networks, and we have grouped them into base-line (number of tweets posted), conversational (mentionsand replies), informational (retweets and URLs), senti-ment (sentimentality and attitude from tweets content)and combined features (all features already described).The results of the prediction model are shown in Table 4.As highlighted, the Bagging approach achieved the high-est performance across all the feature sets with the onlyexception being the Baseline metrics, which achieved theirtop performance using Adaboost. If we analyze the fourgroups of feature sets separately (baseline, informationalnetwork, conversational network, and sentiment) we seethat all of them perform well over random guessing (AUCsover 0.5). However, the set carrying the most informationto predict the ongoing participation is the group of featuresobtained from the informational network (AUC=0.750),i.e., the network of retweets. The second place goes tothe baseline feature set with an AUC of 0.719 and thethird place goes to the conversational feature set showingan AUC of 0.714 when applying Bagging. Although thesentiment feature set places fourth the performance is still
12

0.00
0.25
0.50
0.75
1.00
co
nfe
ren
ce
tw
ee
ts
ind
eg
ree
eig
en
ve
cto
r ce
ntr
alit
y
be
twe
en
ne
ss
de
gre
e
de
gre
e
eig
en
ve
cto
r ce
ntr
alit
y
au
tho
rity
avg
se
ntim
en
talit
y
url
ra
tio
retw
ee
t ra
tio
au
tho
rity
ou
tde
gre
e
be
twe
en
ne
ss
ou
tde
gre
e
ind
eg
ree
avg
attitu
de
hu
b
pa
ge
ra
nk
clo
se
ne
ss
pa
ge
ra
nk
clu
ste
r co
effic
ien
t
clu
ste
r co
effic
ien
t
clo
se
ne
ss
me
ntio
n r
atio
rep
ly r
atio
hu
b
time
line
tw
ee
ts
Re
lati
ve
Im
po
rta
nc
e
baseline conversational informational sentiment
Figure 8: Relative Importance (based on information gain) of the features for the task of predicting participation in the upcoming year ofthe same conference.
Feature Sets RF ADA Bagging LR SVMBaseline 0.661 0.719 0.711 0.715 0.558
Informational 0.732 0.743 0.750 0.718 0.627Conversational 0.692 0.690 0.714 0.690 0.621
Sentiment 0.653 0.660 0.676 0.574 0.495
Combined 0.774 0.772 0.791 0.767 0.687
Table 4: Area under the ROC curve (AUC) for predicting continuing participation in the upcoming year with different feature sets andlearning algorithms. The best algorithm for each feature set is highlighted. Methods used as Random forest (RF), Adaptive Boosting (ADA),Bagging, logistic regression (LR), and support vector machines (SVM).
remarkably high with an AUC of 0.676. Overall, we canachieve 0.791 AUC when training the model with all fourfeature sets.
We further examined the importance of single featuresin the combined set based on their information gain mea-sures. Figure 8 shows the relative importance of everyfeature in comparison to the best one, which is the num-ber of tweets posted with the official hashtag during theconference. First, it is interesting that two features in thebaseline have a distinct importance: the amount of tweetsusing the conference hashtag produced the largest infor-mation gain, while the general Twitter activity of the userduring the conference event days, i.e., the number of time-line tweets, shows the lowest information gain. This resultis to some extent expected, and supports the hypothesisthat the Twitter activity directly related to the academicevent is what helps predict user engagement with a con-ference or research community, rather than the generalamount of Twitter activity during the conference days.
Among the 28 features, the sentiment-related featuresof attitude and sentimentality seem to split the other fea-
tures into 3 levels of performance. Between these two fea-tures, sentimentality provides more information than atti-tude, meaning that not only positive tweets show engage-ment with a research community, but rather both positiveand negative ones. It is the intensity of the emotion asso-ciated to the tweet that predicts engagement. Among the10 most important features, we see that eigenvector anddegree centrality in both informational and conversationalnetworks help predict the participation of users, while clus-tering coefficient and closeness are among the network fea-tures that provide smaller information gain. In respect toeigenvector centrality, we can argue that being replied ormentioned several times or by active people helps to ex-plain the engagement of a user within the research commu-nity, and a similar effect can be observed in the conversa-tional and informational networks. With reference to theinformational network, we conjecture that users with higheigenvector centrality are influential members that spreadinformation and they are referred by other users in theconference, making their participation more likely in thefuture. On the other hand, being connected to people who
13

are highly connected, which can be observed by high clus-tering coefficients, or being a few hops away from reachingany other users in the network (as measured by closeness)does not help predict the continuous participation of theuser over time.
In relation to the usage metrics based on ratios of urlsand retweets (informational network), and ratios of men-tions and replies (conversational network), the first twoseem to carry important information, while the other twodo not contribute to the prediction. We explain this be-havior by connecting the results of usage over time: sincethe proportion of retweets and tweets that contain URLsincrease their presence over time, they become more im-portant than the ratio of replies and mentions. These havebecome less common and even more scattered, so theycarry little information for predicting user participationover time.
In addition to the results provided above, we also con-ducted an experiment where we tried to predict whetheror not a user will come back in any of the following years,not only the very next year, using the same features asour previous experiment. In a nutshell, these predictionresults are on average five percent better than predictingparticipation in the following years overall. Furthermore,we have found that the features had the same impact onthe supervised learning methods on the next year as ongeneral following years. This is also the reason why weomit these results, given that no new interesting resultscould be found, except for the fact that next-year partici-pation prediction is more efficient at forecasting conferenceattendance.
6. Discussion and Conclusions
In this paper, we investigated how Twitter has beenused in academic conferences and how this has changedover the years. We addressed this research under five re-search questions to study the usage, the network struc-tures, latent topics, user sentiment, and user participationon Twitter during conferences.
To answer the first research question RQ1, we com-puted four features to quantitatively measure two aspectsof Twitter use at conferences: informational usage andconversational usage. Our results show that researchersare, in fact, using Twitter in 2013 in a different way thanthey did back in 2009, by favoring the information-sharingvalue of Twitter. Users have increased the use of theretweet operation and the sharing of external resources bymeans of URL posting, along with a proportional decreasein the use of Twitter for conversational interactions, suchas replies and mentions.
Secondly, in order to answer RQ2, we constructed theconversation network and the retweet network of each con-ference and used network properties to measure how peo-ple interacted over the years. Our results show that withan increase in participants over time, the conversation
scattered into smaller groups, while the information flow(retweets) stayed mostly within one giant component
Regarding research question RQ3 we attempted to dis-cover latent topics emerging from users’ tweets, and whetherthese topics could help us categorize the conferences, aswell as analyze differences in topical evolution across theyears. Interestingly, we found that representing the con-ferences as their topics, high quality clusters could be ex-tracted, which made the grouping together of conferenceswith similar interests and research areas possible; in addi-tion to setting apart those conferences who have less topicsin common. At the same time, it was possible to accountfor latent topical differences over time between conferencesby applying Dynamic Topic Models (DTM).
As for the fourth research question RQ4, we investi-gated the extent to which conferences differ in regards tothe sentiment expressed in their tweets, and whether theiroverall sentiment changes over time. We found that half ofthe conferences do not present consistent patterns of senti-ment. Yet, well-established communities, such as CHI andWWW present stable patterns and Human Computer In-teraction conferences (CHI, IUST, UBICOMP) show con-sistently more emotion and a higher number of positivetweets than conferences in more analytical areas such asWWW, KDD and ISWC.
Finally, to answer the fifth research question RQ5, wetrained a binary classifier based on the information gen-erated from Twitter usage, such as the user’s network po-sition,, and sentiment inferred from the tweeted content.Our model shows a promising performance, achieving thebest prediction when combining conversational features,informational features, sentiment and baseline features.We also found that the most influential factors in driv-ing users’ continuous participation are actively using theconference hashtag, possessing a central position in theinformation network (as measured by eigenvector central-ity), and talking to a larger amount of participants
7. Limitations and Future Work
We acknowledge there are some limitations to the workpresented. First of all, we obtained the quasi-randomtweets from the historical tweets, however this approachstill needs refinement regarding the choices of several pa-rameters, although we achieved reasonable results com-pared to other studies11. Secondly, we assumed that con-ference hashtags were the medium through which usersshared information and interacted with others during andabout the conference. Although this is adopted by relatedstudies, we may have collected an incomplete set of data
11As of the time we run our analysis, we did not find other articlespresenting efficient methods to efficiently sample random tweets fromtwitter that could have served as a basis for our study. However,later, Liu et al. [26] provided statistics and a method on how toderive a random sample from Twitter. Although their method isslightly different to ours their results are similar.
14
as a result of the fact that some participants simply didnot use the official hashtag when tweeting about the con-ference.
In future work, we plan to extend our study to a largerset of conferences across different domains in the field suchas Information Systems and Data Mining, in order to seewhether users in these conferences behave differently onTwitter. In addition, we expect to perform further analy-sis on the content of tweets. We plan to conduct anotherexperiment involving entity extraction on the topic mod-els, in order to better identify which people, concepts, orplaces generate the most interest in a conference. We alsoplan to further study the content of the URLs shared byusers on Twitter. So far, we haven’t investigated whichtype of resources and content people share, and whetherwe can find differences between research communities. Wealso plan to incorporate content features in our classifica-tion model, in order to tell whether the content shared isalso a predictor of continuous conference participation.
Acknowledgements: Parts of this work was carriedout during the tenure of an ERCIM “Alain Bensoussan”fellowship program by the second author.
Appendix A. Detailed Statistics
Descriptive statistics of each conference are in TableA.5. For each year at every conference we calculated thenumber of unique users (# Unique Users), total amount oftweets collected (# Tweets) and among them the numberof retweets (# Retweets), replies (# Replies), mentions(# Mentions) and the tweets that contain URLs (# URLTweets).
Table A.6 shows the pairwise dissimilarity matrix, cal-culated as cosine distances, between the conferences rep-resented with their topics models.
References
[1] Abel, F., Hauff, C., Houben, G.J., Stronkman, R., Tao, K.,2012a. Twitcident: fighting fire with information from socialweb streams, in: Proceedings of the 21st international confer-ence companion on World Wide Web, ACM. pp. 305–308.
[2] Abel, F., Hauff, C., Houben, G.J., Stronkman, R., Tao, K.,2012b. Twitcident: fighting fire with information from socialweb streams, in: Proceedings of the 21st international confer-ence companion on World Wide Web, ACM. pp. 305–308.
[3] Atkinson, C., 2009. The backchannel: how audiences are usingTwitter and social media and changing presentations forever.New Riders.
[4] Awad, N.I., Cocchio, C., 2015. Use of twitter at a majornational pharmacy conference. American Journal of Health-System Pharmacy 72, 65–69.
[5] Blei, D.M., 2012. Probabilistic topic models. Communicationsof the ACM 55, 77–84.
[6] Blei, D.M., Lafferty, J.D., 2006. Dynamic topic models, in:Proceedings of the 23rd International Conference on MachineLearning, ACM, New York, NY, USA. pp. 113–120. URL:http://doi.acm.org/10.1145/1143844.1143859, doi:10.1145/1143844.1143859.
[7] Blei, D.M., Ng, A.Y., Jordan, M.I., 2003. Latent dirichlet allo-cation. the Journal of machine Learning research 3, 993–1022.
[8] Bollen, J., Mao, H., Pepe, A., 2011a. Modeling public mood andemotion: Twitter sentiment and socio-economic phenomena.,in: ICWSM.
[9] Bollen, J., Mao, H., Zeng, X., 2011b. Twitter mood predictsthe stock market. Journal of Computational Science 2, 1–8.
[10] Bonacich, P., 1972. Factoring and weighting approaches to sta-tus scores and clique identification. Journal of MathematicalSociology 2, 113–120.
[11] Boyd, D., Golder, S., Lotan, G., 2010. Tweet, tweet, retweet:Conversational aspects of retweeting on twitter, in: System Sci-ences (HICSS), 2010 43rd Hawaii International Conference on,IEEE. pp. 1–10.
[12] Conover, M., Ratkiewicz, J., Francisco, M., Goncalves, B.,Menczer, F., Flammini, A., 2011. Political polarization on twit-ter., in: ICWSM.
[13] Desai, T., Shariff, A., Shariff, A., Kats, M., Fang, X., Chris-tiano, C., Ferris, M., 2012. Tweeting the meeting: an in-depthanalysis of twitter activity at kidney week 2011. PloS one 7,e40253.
[14] Ebner, M., 2009. Introducing live microblogging: How singlepresentations can be enhanced by the mass. Journal of researchin innovative teaching 2.
[15] Hall, M., Frank, E., Holmes, G., Pfahringer, B., Reutemann,P., Witten, I.H., 2009. The weka data mining software: An up-date. SIGKDD Explor. Newsl. 11, 10–18. doi:10.1145/1656274.1656278.
[16] He, H., Garcia, E.A., 2009. Learning from imbalanced data.IEEE Trans. on Knowl. and Data Eng. 21, 1263–1284.
[17] Hong, L., Davison, B.D., 2010. Empirical study of topicmodeling in twitter, in: Proceedings of the First Workshopon Social Media Analytics, ACM, New York, NY, USA. pp.80–88. URL: http://doi.acm.org/10.1145/1964858.1964870,doi:10.1145/1964858.1964870.
[18] Kawase, R., Siehndel, P., Gadiraju, U., 2014. Technology en-hancing learning: Past, present and future, in: Open Learn-ing and Teaching in Educational Communities - 9th EuropeanConference on Technology Enhanced Learning, EC-TEL 2014,Graz, Austria, September 16-19, 2014, Proceedings, pp. 193–206. URL: http://dx.doi.org/10.1007/978-3-319-11200-8_15, doi:10.1007/978-3-319-11200-8_15.
[19] Kleinberg, J.M., 1999. Authoritative sources in a hyperlinkedenvironment. JOURNAL OF THE ACM 46, 604–632.
[20] Kucuktunc, O., Cambazoglu, B.B., Weber, I., Ferhatosman-oglu, H., 2012. A large-scale sentiment analysis for yahoo! an-swers, in: Proceedings of the fifth ACM international conferenceon Web search and data mining, ACM. pp. 633–642.
[21] Lanagan, J., Smeaton, A.F., 2011. Using twitter to detect andtag important events in live sports. Artificial Intelligence , 542–545.
[22] Larsson, A.O., Moe, H., 2012. Studying political microblogging:Twitter users in the 2010 swedish election campaign. New Media& Society 14, 729–747.
[23] Letierce, J., Passant, A., Breslin, J., Decker, S., 2010a. Under-standing how twitter is used to spread scientific messages, in:Proceedings of the ACM WebScience Conference, ACM.
[24] Letierce, J., Passant, A., Breslin, J.G., Decker, S., 2010b. Usingtwitter during an academic conference: The# iswc2009 use-case., in: ICWSM.
[25] Lin, Y.R., Keegan, B., Margolin, D., Lazer, D., 2013. Risingtides or rising stars?: Dynamics of shared attention on twitterduring media events. CoRR abs/1307.2785.
[26] Liu, Y., Kliman-Silver, C., Mislove, A., 2014. The tweets theyare a-changin’: Evolution of twitter users and behavior .
[27] McKendrick, D.R., Cumming, G.P., Lee, A.J., 2012. Increaseduse of twitter at a medical conference: a report and a reviewof the educational opportunities. Journal of medical Internetresearch 14.
15

Year Measure CHI CIKM ECTEL HT IKNOW ISWC IUI KDD RECSYS SIGIR SIGMOD UBICOMP UIST VLDB WISE WWW2009 # Unique Users 299 7 55 42 37 255 1 11 52 91 1 20 38 15 5 311
# Tweets 1860 36 487 247 173 1350 9 56 488 565 5 102 92 65 17 2581# Retweets 69 1 57 19 12 233 0 2 84 57 0 11 4 3 0 170# Replies 249 1 78 16 18 184 0 6 31 80 0 12 6 7 0 215# Mentions 160 2 32 22 18 203 0 4 48 64 0 10 9 6 7 158# URL Tweets 205 1 93 90 52 458 1 16 154 144 0 42 22 9 2 489
2010 # Unique Users 787 53 32 43 50 179 46 47 138 84 37 89 53 20 562 1114# Tweets 5263 218 99 261 138 783 191 64 984 270 41 450 126 39 3006 5484# Retweets 1045 74 21 45 44 273 33 27 367 87 32 133 27 9 1280 1736# Replies 412 9 4 16 12 34 33 2 83 15 1 27 10 3 284 361# Mentions 467 21 4 26 20 58 17 6 88 17 0 25 16 0 207 1034# URL Tweets 810 50 31 92 54 378 50 21 285 84 32 143 50 22 527 1566
2011 # Unique Users 1207 153 58 119 97 452 61 175 194 83 63 74 70 102 37 604# Tweets 6042 898 314 457 372 3506 175 503 1517 176 187 363 179 507 98 2446# Retweets 1662 336 63 92 119 1619 64 204 669 93 49 121 51 147 47 995# Replies 627 37 33 74 24 211 8 35 144 4 6 52 19 10 2 152# Mentions 678 63 46 38 43 487 25 68 174 10 11 63 21 33 11 233# URL Tweets 1356 188 68 159 131 1478 59 209 481 59 47 125 50 94 75 718
2012 # Unique Users 1195 194 113 118 92 623 40 74 324 279 105 89 80 115 239 2653# Tweets 7590 747 544 381 638 2751 137 187 2256 1240 372 214 192 265 433 12150# Retweets 1981 352 197 190 92 1263 32 88 1270 660 99 72 100 118 275 5630# Replies 831 39 30 36 12 138 8 13 80 140 66 9 8 3 27 609# Mentions 732 58 94 54 55 322 10 10 305 68 31 29 11 13 54 1670# URL Tweets 1871 194 240 198 242 1053 51 116 971 416 125 88 110 144 369 5229
2013 # Unique Users 1526 785 123 59 98 424 67 447 240 373 88 141 225 103 207 1020# Tweets 7424 1525 707 121 271 2169 288 1324 1362 2059 238 591 533 241 479 4885# Retweets 2311 1095 290 35 114 1082 81 725 820 933 105 299 358 118 269 2492# Replies 883 27 53 10 21 96 22 40 62 392 16 18 10 9 13 179# Mentions 836 149 100 27 52 295 36 219 183 201 12 56 57 37 53 614# URL Tweets 2648 966 369 47 136 1190 101 550 797 721 80 361 386 120 430 2353
Table A.5: Detailed dataset statistics of the 16 collected conferences in the years 2009 to 2013.
CHI CIKM ECTEL HT IKNOW ISWC IUI KDD RECSYS SIGIR SIGMOD UBICOMP UIST VLDB WISE WWWCHI 0 0.889 0.884 0.963 0.955 0.89 0.934 0.946 0.914 0.908 0.971 0.945 0.857 0.964 0.998 0.917
CIKM 0.889 0 0.938 0.941 0.966 0.937 0.907 0.933 0.874 0.726 0.939 0.958 0.976 0.843 0.998 0.848ECTEL 0.884 0.938 0 0.976 0.909 0.956 0.951 0.953 0.958 0.978 0.976 0.935 0.933 0.982 0.812 0.937
HT 0.963 0.941 0.976 0 0.936 0.974 0.951 0.954 0.918 0.95 0.995 0.986 0.983 0.952 1 0.881IKNOW 0.955 0.966 0.909 0.936 0 0.88 0.966 0.856 0.982 0.879 0.93 0.904 0.965 0.935 0.975 0.961
ISWC 0.89 0.937 0.956 0.974 0.88 0 0.976 0.982 0.955 0.926 0.963 0.952 0.933 0.968 0.998 0.893IUI 0.934 0.907 0.951 0.951 0.966 0.976 0 0.994 0.87 0.949 0.987 0.959 0.924 0.974 0.999 0.884
KDD 0.946 0.933 0.953 0.954 0.856 0.982 0.994 0 0.944 0.895 0.955 0.948 0.963 0.956 1 0.936RECSYS 0.914 0.874 0.958 0.918 0.982 0.955 0.87 0.944 0 0.803 0.973 0.972 0.982 0.947 0.998 0.937
SIGIR 0.908 0.726 0.978 0.95 0.879 0.926 0.949 0.895 0.803 0 0.923 0.97 0.967 0.918 0.998 0.886SIGMOD 0.971 0.939 0.976 0.995 0.93 0.963 0.987 0.955 0.973 0.923 0 0.967 0.966 0.84 0.999 0.961
UBICOMP 0.945 0.958 0.935 0.986 0.904 0.952 0.959 0.948 0.972 0.97 0.967 0 0.945 0.983 0.999 0.954UIST 0.857 0.976 0.933 0.983 0.965 0.933 0.924 0.963 0.982 0.967 0.966 0.945 0 0.984 0.946 0.934
VLDB 0.964 0.843 0.982 0.952 0.935 0.968 0.974 0.956 0.947 0.918 0.84 0.983 0.984 0 1 0.909WISE 0.998 0.998 0.812 1 0.975 0.998 0.999 1 0.998 0.998 0.999 0.999 0.946 1 0 0.971
WWW 0.917 0.848 0.937 0.881 0.961 0.893 0.884 0.936 0.937 0.886 0.961 0.954 0.934 0.909 0.971 0
Table A.6: Cosine Distances between pairs of conferences based on their representation as latent topics
[28] Mehrotra, R., Sanner, S., Buntine, W., Xie, L., 2013. Im-proving lda topic models for microblogs via tweet poolingand automatic labeling, in: Proceedings of the 36th Inter-national ACM SIGIR Conference on Research and Develop-ment in Information Retrieval, ACM, New York, NY, USA.pp. 889–892. URL: http://doi.acm.org.ezproxy.puc.cl/10.1145/2484028.2484166, doi:10.1145/2484028.2484166.
[29] Mendoza, M., Poblete, B., Castillo, C., 2010. Twitter undercrisis: can we trust what we rt?, in: Proceedings of the firstworkshop on social media analytics, ACM. pp. 71–79.
[30] Mishori, R., Levy, B., Donvan, B., 2014. Twitter use at a familymedicine conference: Analyzing# stfm13. Family medicine 46,608–614.
[31] Naveed, N., Gottron, T., Kunegis, J., Alhadi, A.C., 2011.Searching microblogs: Coping with sparsity and document qual-ity, in: Proceedings of the 20th ACM International Conferenceon Information and Knowledge Management, ACM, New York,NY, USA. pp. 183–188. URL: http://doi.acm.org/10.1145/2063576.2063607, doi:10.1145/2063576.2063607.
[32] Nichols, J., Mahmud, J., Drews, C., 2012. Summarizing sport-ing events using twitter, in: Proceedings of the 2012 ACM Inter-national Conference on Intelligent User Interfaces, ACM, NewYork, NY, USA. pp. 189–198. URL: http://doi.acm.org/10.1145/2166966.2166999, doi:10.1145/2166966.2166999.
[33] O’Connor, B., Balasubramanyan, R., Routledge, B.R., Smith,N.A., 2010. From tweets to polls: Linking text sentiment topublic opinion time series. ICWSM 11, 122–129.
[34] Page, L., Brin, S., Motwani, R., Winograd, T., 1999. The pager-ank citation ranking: Bringing order to the web.
[35] Pfitzner, R., Garas, A., Schweitzer, F., 2012. Emotional diver-gence influences information spreading in twitter. ICWSM 12,2–5.
[36] Reinhardt, W., Ebner, M., Beham, G., Costa, C., 2009. Howpeople are using twitter during conferences. Creativity and in-novation Competencies on the Web , 145.
[37] Rieder, B., 2012. The refraction chamber: Twitter as sphereand network. First Monday 17.
16

[38] Ross, C., Terras, M., Warwick, C., Welsh, A., 2011. Enabledbackchannel: conference twitter use by digital humanists. Jour-nal of Documentation 67, 214–237.
[39] Sopan, A., Rey, P., Butler, B., Shneiderman, B., 2012. Moni-toring academic conferences: Real-time visualization and retro-spective analysis of backchannel conversations, in: Social Infor-matics (SocialInformatics), 2012 International Conference on,IEEE. pp. 62–69.
[40] Steyvers, M., Griffiths, T., 2007. Probabilistic topic models.Handbook of latent semantic analysis 427, 424–440.
[41] Thelwall, M., Buckley, K., Paltoglou, G., Cai, D., Kappas, A.,2010. Sentiment strength detection in short informal text. Jour-nal of the American Society for Information Science and Tech-nology 61, 2544–2558.
[42] Tumasjan, A., Sprenger, T.O., Sandner, P.G., Welpe, I.M.,2010a. Election forecasts with twitter: How 140 characters re-flect the political landscape. Social Science Computer Review ,0894439310386557.
[43] Tumasjan, A., Sprenger, T.O., Sandner, P.G., Welpe, I.M.,2010b. Predicting elections with twitter: What 140 charactersreveal about political sentiment. ICWSM 10, 178–185.
[44] Ward Jr, J.H., 1963. Hierarchical grouping to optimize an ob-jective function. Journal of the American statistical association58, 236–244.
[45] Wasserman, S., Faust, K., 1994. Social network analysis: meth-ods and applications. Cambridge University Press, Cambridge;New York.
[46] Weller, K., Droge, E., Puschmann, C., 2011. Citation analysisin twitter: Approaches for defining and measuring informationflows within tweets during scientific conferences, in: Proceed-ings of Making Sense of Microposts Workshop (# MSM2011).Co-located with Extended Semantic Web Conference, Crete,Greece.
[47] Wen, X., Lin, Y.R., 2015. Tweeting questions in academic con-ferences: Seeking or promoting information? .
[48] Wen, X., Parra, D., Trattner, C., 2014. How groups of peopleinteract with each other on twitter during academic conferences,in: Proceedings of the Companion Publication of the 17th ACMConference on Computer Supported Cooperative Work & SocialComputing, ACM, New York, NY, USA. pp. 253–256.
[49] Weng, J., Lim, E.P., Jiang, J., He, Q., 2010. Twitterrank:Finding topic-sensitive influential twitterers, in: Proceedingsof the Third ACM International Conference on Web Searchand Data Mining, ACM, New York, NY, USA. pp. 261–270.URL: http://doi.acm.org/10.1145/1718487.1718520, doi:10.1145/1718487.1718520.
[50] Wilkinson, S.E., Basto, M.Y., Perovic, G., Lawrentschuk, N.,Murphy, D.G., 2014. The social media revolution is changingthe conference experience: analytics and trends from eight in-ternational meetings. BJU international .
[51] Yan, X., Guo, J., Lan, Y., Cheng, X., 2013. A biterm topicmodel for short texts, in: Proceedings of the 22Nd Interna-tional Conference on World Wide Web, International WorldWide Web Conferences Steering Committee, Republic and Can-ton of Geneva, Switzerland. pp. 1445–1456. URL: http://dl.acm.org/citation.cfm?id=2488388.2488514.
[52] Yuan, G., Murukannaiah, P.K., Zhang, Z., Singh, M.P., 2014.Exploiting sentiment homophily for link prediction, in: Pro-ceedings of the 8th ACM Conference on Recommender Systems,ACM, New York, NY, USA. pp. 17–24. URL: http://doi.acm.org/10.1145/2645710.2645734, doi:10.1145/2645710.2645734.
[53] Zubiaga, A., Spina, D., Amigo, E., Gonzalo, J., 2012. To-wards real-time summarization of scheduled events from twitterstreams, in: Proceedings of the 23rd ACM conference on Hy-pertext and social media, ACM. pp. 319–320.
[54] Zubiaga, A., Spina, D., Fresno, V., Martınez, R., 2011. Clas-sifying trending topics: a typology of conversation triggers ontwitter, in: Proceedings of the 20th ACM international con-ference on Information and knowledge management, ACM. pp.2461–2464.
17


