Tutorial for measurements of magnitude and phase responses
16
Digital Signal Processing Audio Measurements Custom Designed Tools Page 1 Tutorial for measurements of magnitude and phase responses In this tutorial we show different techniques to measure a system. We focus on magnitude and phase response with: • FFT-analyzer • MLS • Stepped sine (tracking generator) Setup • WinAudioMLS PRO EX • Signalgenerator PRO • Sweep/tracking plugin For phase measurements we need the dual channel capabilities of the PRO EX version. The system for testing is a Butterworth filter of second order with a 2kHz cut-off frequency. Note: We used the free filter plugin for the signal generator to create such filter. In addition we used our virtual ASIO loopback driver that connects both the generator and the analyser without any cables. This setup is similar to an analog filter connected between input and output of a soundcard but the pure digital solution we used is more reproducible and free of any noise or hum.
Transcript of Tutorial for measurements of magnitude and phase responses

Digital Signal Processing Audio Measurements
Custom Designed Tools
Page 1
Tutorial for measurements of magnitude and phase responses In this tutorial we show different techniques to measure a system. We focus on magnitude and phase response with:
• FFT-analyzer • MLS • Stepped sine (tracking generator)
Setup
• WinAudioMLS PRO EX • Signalgenerator PRO • Sweep/tracking plugin
For phase measurements we need the dual channel capabilities of the PRO EX version. The system for testing is a Butterworth filter of second order with a 2kHz cut-off frequency. Note: We used the free filter plugin for the signal generator to create such filter. In addition we used our virtual ASIO loopback driver that connects both the generator and the analyser without any cables. This setup is similar to an analog filter connected between input and output of a soundcard but the pure digital solution we used is more reproducible and free of any noise or hum.

Digital Signal Processing Audio Measurements
Custom Designed Tools
Page 2
FFT analyser For the first measurement we used white noise at the signal generator and measured the magnitude with the analyser. We need long averaging (around 10s) to get a smooth curve.
Magnitude response without averaging

Digital Signal Processing Audio Measurements
Custom Designed Tools
Page 3
Magnitude response with averaging
At the cut-off frequency of 2kHz the amplitude drop is 3dB.

Digital Signal Processing Audio Measurements
Custom Designed Tools
Page 4
Phase response For phase response measurement we need to measure both the phase at the input and output of the filter and calculate the difference. We can do this with the DSP options.
At the cut-of frequency we get a phase shift around 90degree.
Digital Signal Processing Audio Measurements
Custom Designed Tools
Page 5
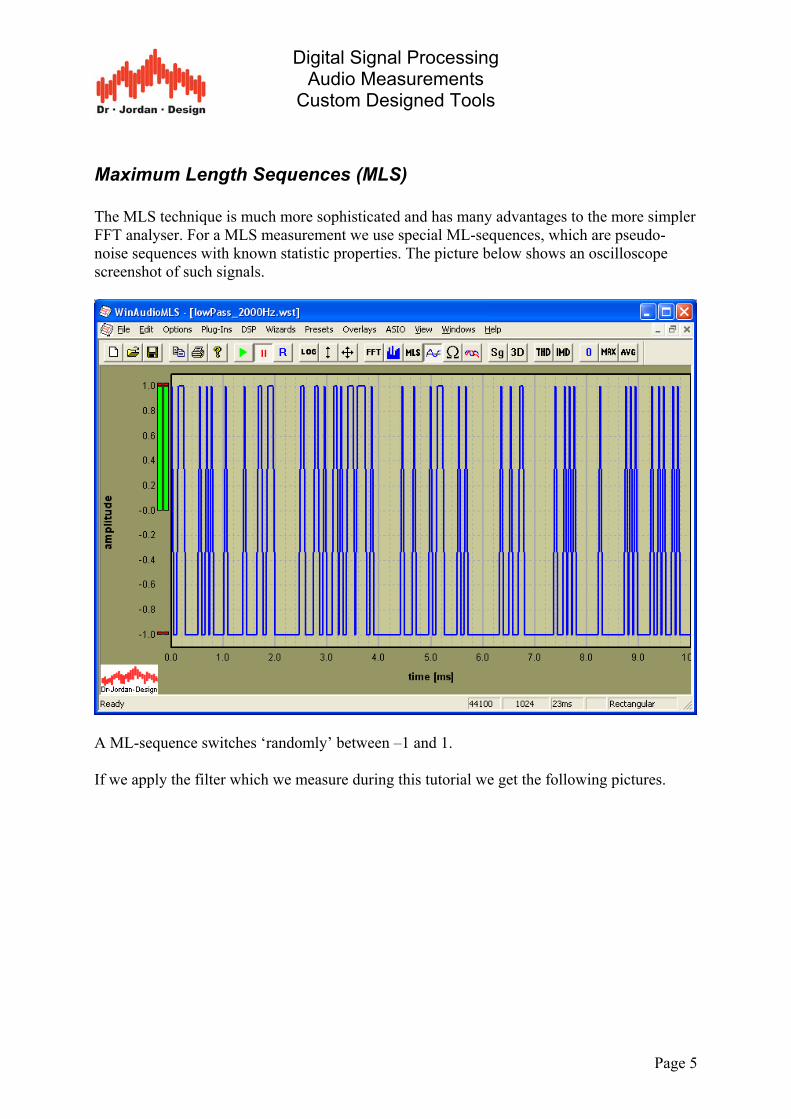
Maximum Length Sequences (MLS) The MLS technique is much more sophisticated and has many advantages to the more simpler FFT analyser. For a MLS measurement we use special ML-sequences, which are pseudo-noise sequences with known statistic properties. The picture below shows an oscilloscope screenshot of such signals.
A ML-sequence switches ‘randomly’ between –1 and 1. If we apply the filter which we measure during this tutorial we get the following pictures.

Digital Signal Processing Audio Measurements
Custom Designed Tools
Page 6
With MLS we can easily measure the frequency or phase response and the impulse response. We used the following settings for MLS magnitude responses.

Digital Signal Processing Audio Measurements
Custom Designed Tools
Page 7
Magnitude response with MLS
Please note that the measurement time is around 100ms . This means you get a complete magnitude response almost instantly. This is extremely helpful when optimising devices.

Digital Signal Processing Audio Measurements
Custom Designed Tools
Page 8
Impulse response This plot shows the impulse response of the filter under test. Impulse reponses are e.g. of particular interest when measuring room impulses.
Phase analysis For phase analysis we need the second channel to measure the reference phase similar to the FFT phase measurement. We feed the filtered signal to channel 1 and the unfiltered reference channel to channel 2. The following plot shows the magnitude response of both channels.

Digital Signal Processing Audio Measurements
Custom Designed Tools
Page 9
Magnitude response of both channels
We switch now to phase plot and calculate the phase difference similar to the FFT measurement.

Digital Signal Processing Audio Measurements
Custom Designed Tools
Page 10
Phase response with MLS

Digital Signal Processing Audio Measurements
Custom Designed Tools
Page 11
Measurement with stepped sine signals The oldest technique for measuring generic systems are pure sines. Although this technique is very slow, it has many advantages that make it still an important tool. We measure first at a single frequency by hand. The signal generator is set to sine mode and we use the cut-off frequency of 2kHz.
We watch the output with a dual channel spectrum analyser, while the second channel is used as a reference. We use both magnitude and phase analysis.

Digital Signal Processing Audio Measurements
Custom Designed Tools
Page 12
Magnitude
We get a drop of 3dB at 2kHz

Digital Signal Processing Audio Measurements
Custom Designed Tools
Page 13
Phase
All phase information other than 2kHz is not usable because there is no user signal. The frequency shift between both channel is 90degree. We can verify this with the oscilloscope.

Digital Signal Processing Audio Measurements
Custom Designed Tools
Page 14
Automatic measurements It would be a lot of work to get a frequency measurement manually, by setting it to certain frequencies and logging the results. WinAudioMLS can do this task fully automatically, and can measure level, phase, THD and THD+N with one run. We used the following settings to cover the frequency range from 50 to 15kHz with 40 steps. Please note that the measurement time is 28s.

Digital Signal Processing Audio Measurements
Custom Designed Tools
Page 15
Magnitude response
Phase response

Digital Signal Processing Audio Measurements
Custom Designed Tools
Page 16
Summary All different techniques have different aspects and are suitable for certain applications. In this table we summarize the most important differences. Technique PRO CONTRA Applications FFT Analyzer • Can be used with arbitrary
signals also music • Requires long averaging • Quick generic tool
MLS Analyzer • Very fast • High frequency resolution • Impulse response • Allows time window-ing to
reduce echos • Correlation gain
• Sensitive to distortion • Sensitive to frequency
shifts (clock offsets) • High computational
effort.
• Real-time analysis of responses
• Room analysis • Suppression of early
reflections
Stepped sine • Very precise • Very simple setup • Highly immune against
noise and distortion • THD, THD+N
measurement included • Low computational effort
• Very slow • Single sines with high
energy can endanger the equipment
• Not applicable to time varying systems
• Any not time critical measurement.
• Non-linear systems e.g. tube amplifier, mp3 player