Tutorial A Objective Measurement of User-Perceived … Measurement of User-Perceived Audio and Video...
140
Tutorial A Objective Measurement of User-Perceived Audio and Video Quality
Transcript of Tutorial A Objective Measurement of User-Perceived … Measurement of User-Perceived Audio and Video...
Tutorial A
Objective Measurement of User-Perceived Audio and
Video Quality
Objective Measurement of User-Perceived Audio and Video Quality
Lectures:Measurement of Audio Quality, Steve Voran, (≈30 min)Measurement of Video Quality, Steve Wolf , (≈30 min)
Demonstration: Real-Time, In-Service Video Quality Measurement, Margaret Pinson , (≈20 min)
All Presenters are with: Institute for Telecommunication Sciences, Boulder Coloradowww.its.bldrdoc.gov/audio www.its.bldrdoc.gov/n3/video
{svoran, swolf, mpinson} @its.bldrdoc.gov

Combined A/V (MM) Quality
Perceived overall A/V quality depends onAudio qualityVideo qualityA/V synchronizationImportance audio and video in application

Measurement of Audio QualityMotivation
Subjective MeasurementTechniquesIssuesOpen Questions
Objective EstimationBasic ConceptsPerception-based ApproachStandardized AlgorithmsMoving Forward

One Major MotivationTelecommunications: Five-Way Trade-Off
Complexity vs. delay vs. bit rate vs. robustness vs. speech qualityThe first four are fairly easily defined and measuredSpeech quality is more challenging
Constrained optimization of coders and/or channelsSystem monitoring and maintenance alertsPicking “best” designs for standardizationEquipment evaluation for purchase

Demonstration: Speech Coding Algorithms
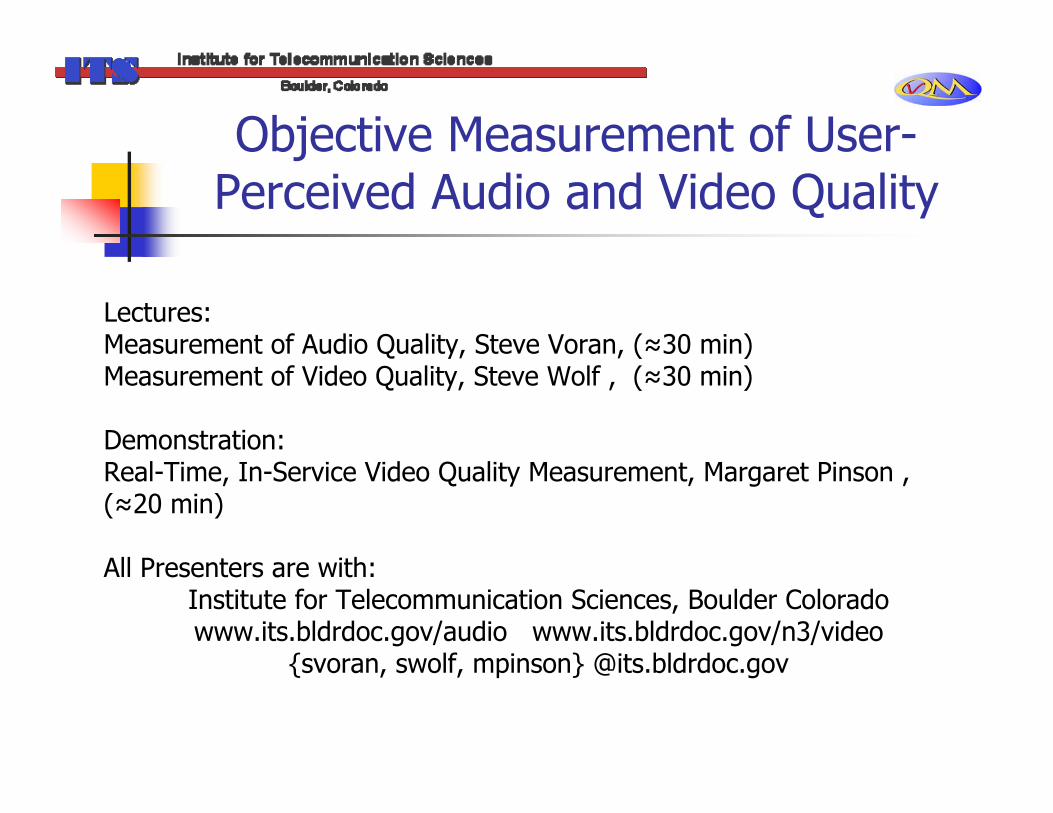
All have nominal 3 dB bandwidth of 300-3400 Hz4 Talkers: female, male, female, maleClear channel (no bit errors, lost packets or frames)
Demonstration: Speech Coding Algorithms
Original SpeechG.711 64 kbps PCMG.726 32 kbps ADPCMG.728 16 kbps LD-CELPGSM 13 kbps RPE-LTPG.729 8 kbps CS-ACELPG.723.1 5.3 kbps ACELPFed. Standard 2.4 kbps MELPFS-1015 2.4 kbps LPC10e

Quality Assessment Challenges
Signal dependent distortionsMale vs. femaleSpeech levelLanguageTones vs. speech
Variety of distortion typesBuzz, robotic Warble, shimmerMuffled, flat
Listener expectationsFixed vs. wirelessCost

Quality Assessment Challenges: Heterogeneous Network Paths
Network isWired and wireless
Analog and digital
Circuit switched and packet switched
Central Office
Central Office
Central Office
Internet
Gateway
MTSO
Quality Assessment Challenges
Tandems, mixed tandemsChannel issues:
Bit error rate, packet loss rateTemporal distribution of errorsDelay variation
Handset types and hands freeBackground noise – demo follows
Background Noise Demo
Speech Coder 4800 bits/secondon airplane
original after speech coderin laundry room
original after speech coder on the boat with the radio
original after speech coder

Subjective Measurement: Have People Listen and Respond
Example: Absolute Category Rating Test

Subjective Measurement
Advantages:If done carefully, results are highly relevant (standards exist)Can select relevant population of listenersCan educate them about applicationCan ask the most relevant question(s)

Subjective Measurement
Disadvantages:Expensive and time consumingControlled acoustic environment requiredTransparent playback equipment requiredInherent spread of opinions - depending on confidence intervals required, 20 to 60 listeners may be requiredEach listener may spend 30 to 120 minutes
Results not absolute, reference conditions required

ITS Subjective Measurement Capabilities
ITS has two acoustically isolated rooms and associated laboratory equipment (pictures follow)Loudspeaker, headphone, or handset playback is availableITS has conducted numerous listening and conversation tests in conformance with applicable ITU Recommendations

Control Station for Subjective Testing Lab

Inside a Subjective Testing Room
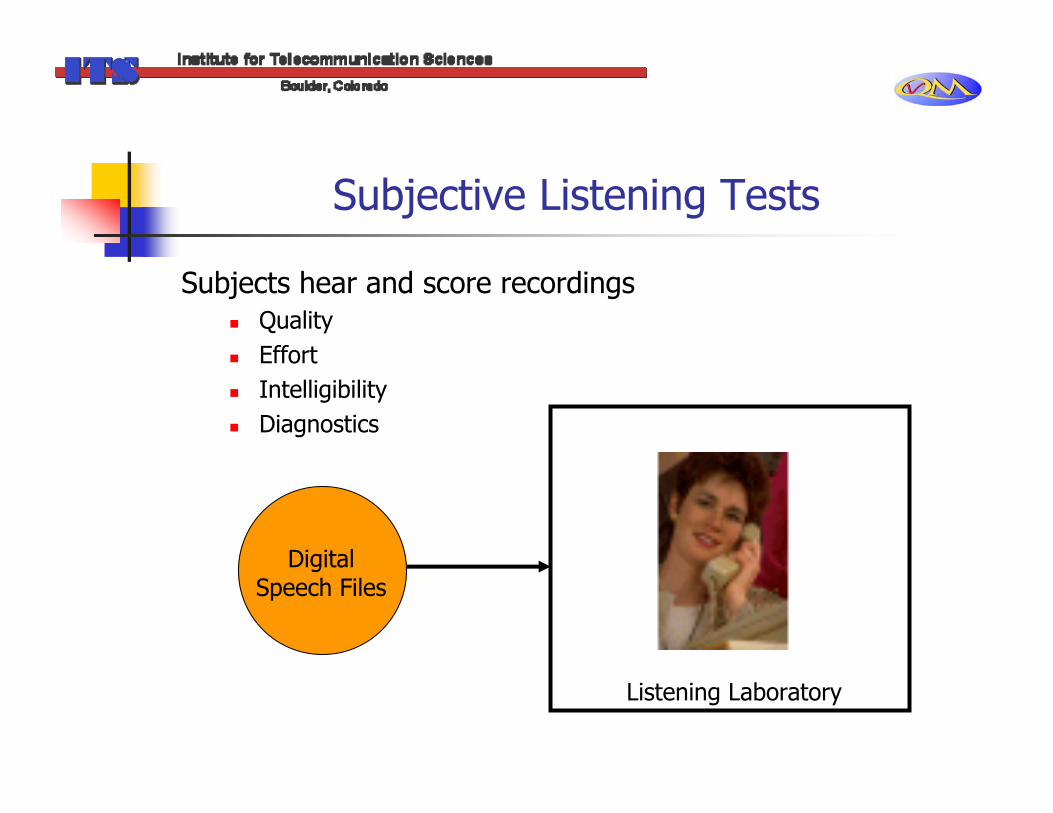
Subjective Listening Tests
Subjects hear and score recordingsQualityEffortIntelligibilityDiagnostics
Digital Speech Files
Listening Laboratory

Subjective Conversation Tests
Subjects use system under test for actual conversationSubjects score system under test
QualityEffort
SystemUnderTest
Listening Laboratory 1
Listening Laboratory 2

Considerations in Subjective Testing
Listening instrument, expectationsBackground noiseSelection of listeners: demographics, hearing acuity, prior knowledge, expectationsListener fatigueProperly balanced test materialRandomization to prevent order effects

Subjective Listening Test Example 1
Single stimulusAbsolute category rating (ACR)Mean opinion score (MOS) scale
Please rate the speech quality5=Excellent4=Good3=Fair2=Poor1=Bad
Best suited for wide ranges of speech quality

Subjective Listening Test Example 2
Dual stimulus (takes longer than single stimulus)Degradation category rating (DCR)Degradation mean opinion score (DMOS) scale
Please rate the degradation of the second sample5=Imperceptible4=Perceptible but not annoying3=Slightly annoying2=Annoying,1=Very annoying
Scale mixes perception and opinion Able to resolve smaller quality differences

Issue - Time Varying Speech Quality
Speech Quality in Telecom is no longer constant (e.g., wireless, VoIP)If quality varies moment by moment, what is the “overall quality”?

A Subjective Test
A burst of higher quality in the middle of a ≈3 second recordingBurst duration of 0 to 3 secondsBurst of lower quality also considered
QH
QL
Speech Quality
Time

A Key Result
QL ≈2.25
QH ≈4.10
Mathematical mean (blue line) is too optimistic!

Issue – Fixed vs. Free Timing
Most subjective tests force timing:Hear 5-9 second recordingRate its qualityRepeat
Efficient implementation, controlWhen do subjects naturally form opinions?ITS did pass/fail speech quality test, subjects could vote at any time after recording started

A Key Result
Green: listening times before “pass”
Red: Listening times before “fail”
Subjects are quick to criticize, slow to approve
Subjects speed up
Objective Estimation of Audio Quality
3 Main ApproachesTelecom network element based (E-model)Measured network parameter basedAudio signal based: DSP analysis of (sent) and received audio signals

Objective Estimation vs. Subjective Measurement
+ Fast, inexpensive and repeatable+ Just need software and some common hardware (e.g. off the shelf PC )+ Listener variable and all associated issues are removed+ Results are absolute, reference conditions not required- Can only estimate perceived audio quality
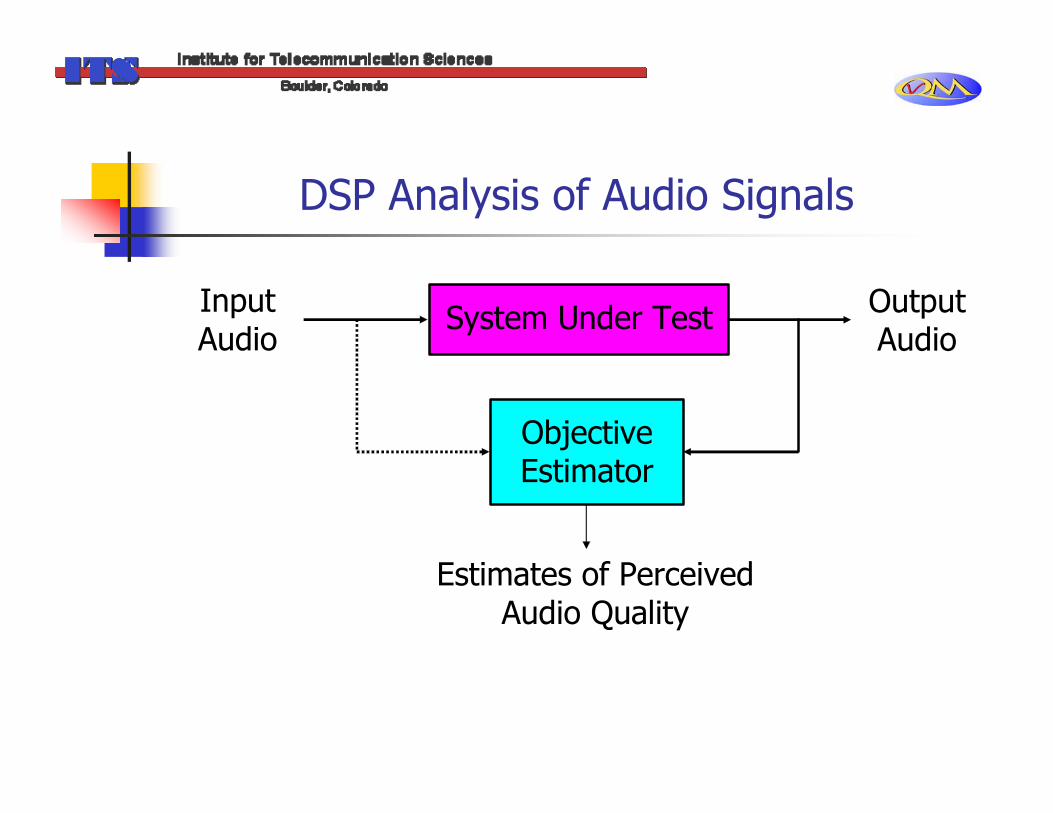
DSP Analysis of Audio Signals
System Under Test
Objective Estimator
Input Audio
Output Audio
Estimates of Perceived Audio Quality
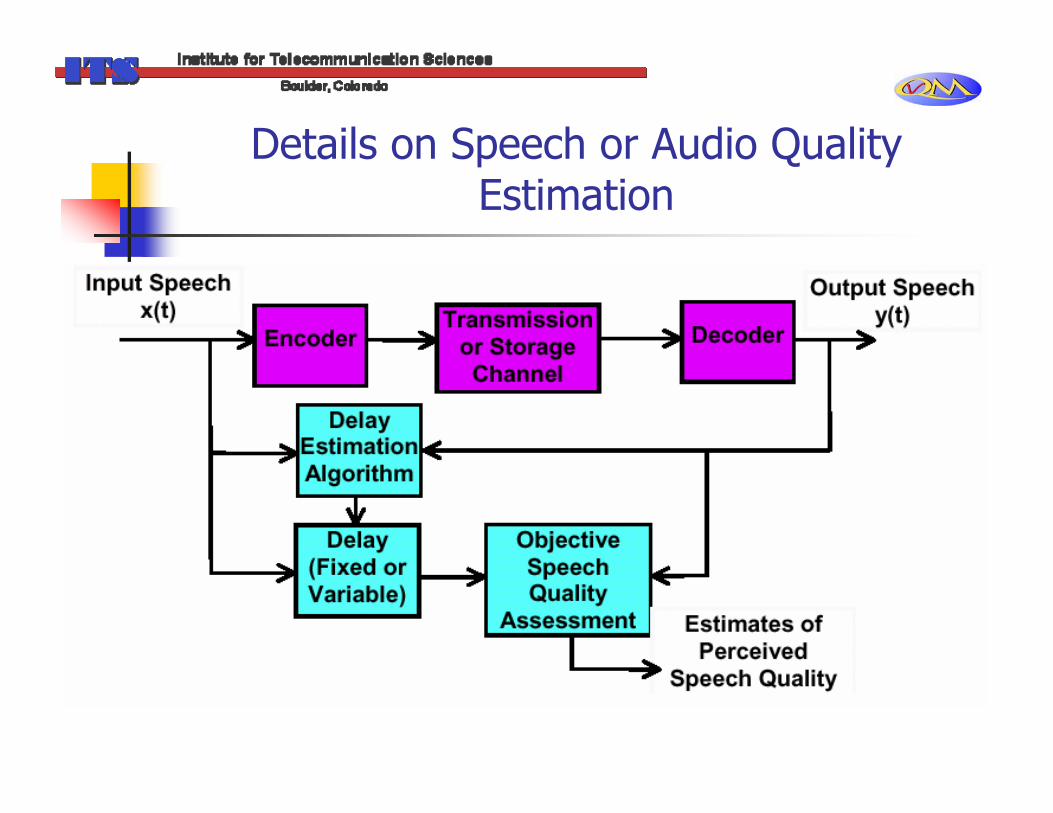
Details on Speech or Audio Quality Estimation

Nomenclature
Algorithms that require input and output are sometimes calledInput/outputTwo-endedFull ReferenceIntrusive
Algorithms that require just output are sometimes calledOutput onlyOutput basedSingle-endedZero ReferenceNon-intrusive
Trade-offSimplicity (output only) vs. Accuracy (input/output)

Use Waveforms to Estimate Quality?
e.g., Segmental SNR
Can measure coding noise or quantization distortion, each of which is related to audio qualityDoes not measure perceived audio quality in generalWaveform fidelity is sufficient but not necessary for good audio quality
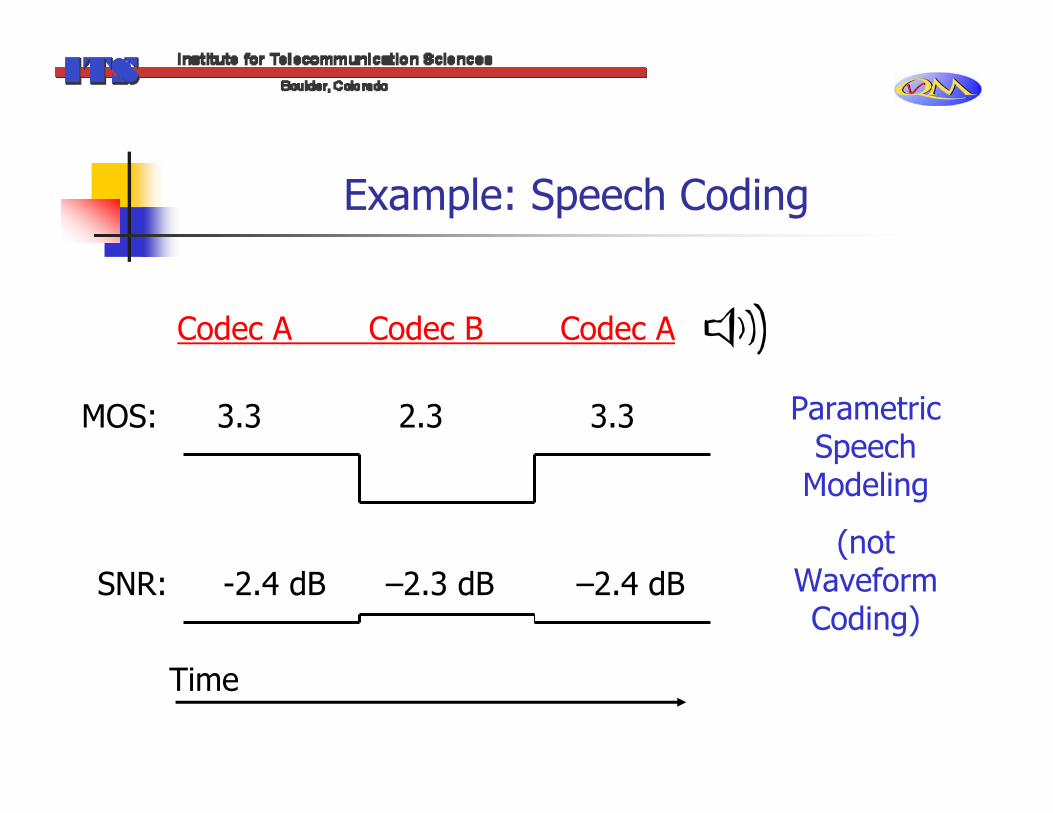
Example: Speech Coding
SNR: -2.4 dB –2.3 dB –2.4 dB
MOS: 3.3 2.3 3.3
Codec A Codec B Codec A
Time
Parametric Speech
Modeling
(not Waveform Coding)

Example: Music Coding
Codec 1: SNR=20 dB Codec 2: SNR=20 dB
Perceptual Coding
(not Waveform Coding)

What to Do?
Waveforms are all we have, yet waveforms do not tell the whole storyEmulate what humans doPerception-based approach

Perception-Based Approach, Input/Output
Distance Measure
(Judgment Model)
Estimates of
Perceived Audio Quality
Perceptual Transformation (Hearing Model)
Output Audio
Perceptual Transformation (Hearing Model)
Input Audio

Perception-Based Approach, Output-Only
Quality Classification
Algorithm
Estimates of
Perceived Audio
Perceptual Transformation (Hearing Model)
Output Audio
Prior Knowledge

Perceptual Transformation(Hearing Model)
Frequency resolution not uniform on Hz scale ⇒Use psychoacoustic frequency scale(Bark or Critical Band Scale)
Loudness growth ⇒Transform signal power to perceived loudness
Sensitivity vs. frequency ⇒Apply equal loudness weightings
Hearing thresholds ⇒Discard signals below threshold
Frequency and time domain masking ⇒Simulate by spreading signals in frequency and time

ITS Results (4 KHz Speech)Based on experiments involving objective-subjective comparisons
Distance measure (judgment model) is at least as important as perceptual transformation (hearing model)Some perception-based objective assessments may over-emphasize perceptual transformations (hearing model) and under-emphasize distance measure (judgment model)Hearing properties for noise and tone have been well-established through decades of researchJudgment is relatively open questionITS contribution to problem involves more insightful and effective distance measures.
Measure and remove spectral deviations at one time or frequency scale then proceed to the next scaleWork from larger to smaller scales, because this is most likely to emulate listeners’ patterns of adaptation and reaction
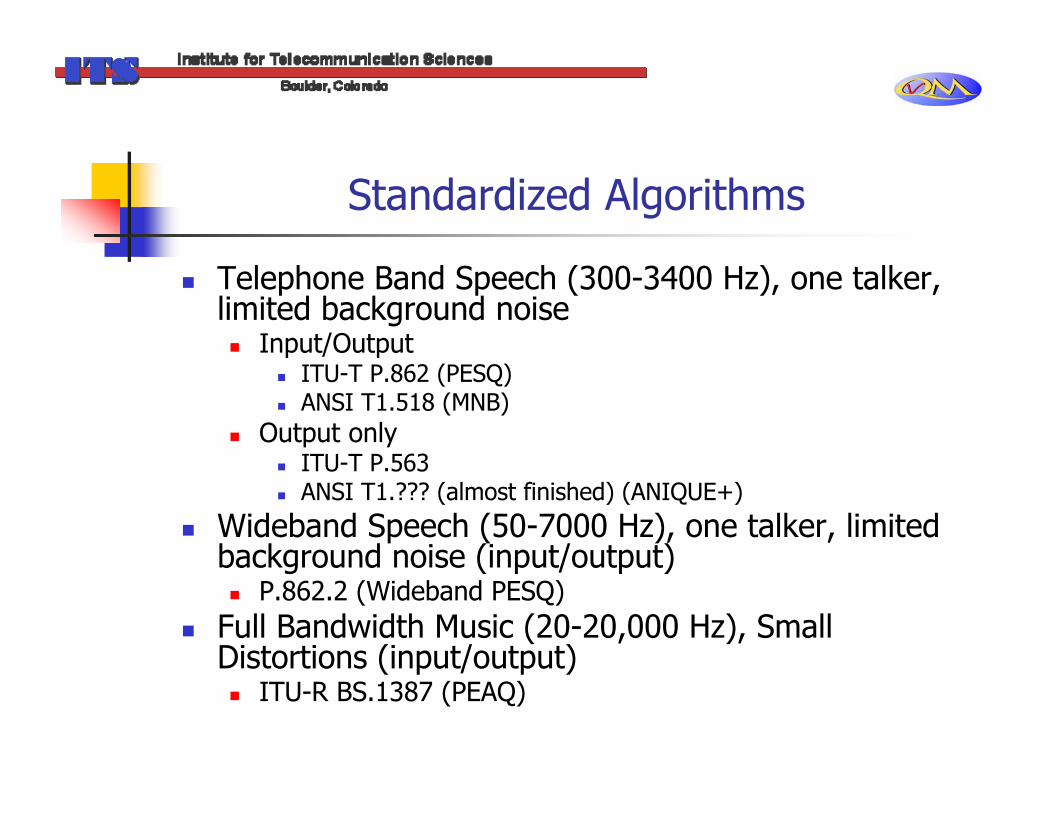
Standardized Algorithms
Telephone Band Speech (300-3400 Hz), one talker, limited background noise
Input/OutputITU-T P.862 (PESQ)ANSI T1.518 (MNB)
Output onlyITU-T P.563ANSI T1.??? (almost finished) (ANIQUE+)
Wideband Speech (50-7000 Hz), one talker, limited background noise (input/output)
P.862.2 (Wideband PESQ)Full Bandwidth Music (20-20,000 Hz), Small Distortions (input/output)
ITU-R BS.1387 (PEAQ)

How Well Do They Work?
Use subjective test results as “truth data”Look at objective-subjective correlationLook at objective-subjective RMS error

Example Results r.e. 20 Subjective Tests
Objective-Subjective Correlations (per condition)Telephone bandwidth (4 kHz) speech, single talker, limited background noise
P.862 (Input/Output
P.563
(Output Only)

Are We There Yet?
Bandwidth
20-20,000 Hz
300-3600 Hz
50-7000 Hz
20-15,000 Hz
ContentSingle Talker
Arbitrary AudioTalker
& NoiseMusic
ImpairmentsSmall
Uniform
Large
Clustered
Channels
12
5.1
It depends on where “there” is!

Moving Forward
Reduced estimation error (esp. in output only algorithms) Increased applicability
Tandems of codersSignal content (multiple speakers, speech + background noise, sound effects, music)Signal bandwidth (7 kHz, 15 or 20 kHz)
ITU-T SG12, Q9, P.OLQAWideband speech (50-7000 Hz)Handsets & HandsfreeMusic on hold
ITU-R WP6Q, extend BS.1387 Add channelsLower quality music coding

Objective Measurement of User-Perceived Video Quality
Stephen Wolf and Margaret PinsonNational Telecommunications and Information
Administration (NTIA)Institute for Telecommunication Sciences (ITS)
Boulder, CO
Outline of Presentation
New Measurements RequiredSubjective Video PerformanceObjective Video PerformanceVideo Standardization EffortsExtensions of TechnologyDemonstration of Tools

Estimating the User Quality of Service (QoS) Experience
Two Automated MethodsIndirect Method - Measure Network Performance => Relate to User Experience
Difficult to Map to User ExperienceMap is Dependent on Coder/Decoder
Direct Method - Measure Data Received by User => Relate to User Experience
This Presentation – Direct Method
Advantages of Direct Method
Measurement System “Sees” Exactly What User Sees
Important Because User QoS is User-Data DependentScene Complexities (e.g., Spatial, Temporal) Significantly Influence Quality

Advantages of Direct Method
Measurement System Can Be Made Technology Independent
Coder/Decoder Designe.g., Error Concealment in Decoder
Transmission Method
To Be Accurate (i.e., Track Subjective), In-Service Measurements are Required

Three Direct Objective Methods (ITU-T Recommendation J.143)
Full Reference (FR)Full Access to Source VideoAccurate But Not Useful for In-ServiceScene and Technology Independent
No Reference (NR)No Access to Source VideoIn-Service But Not Accurate
“Like Measuring Voltage without a Ground Wire”
Not Scene or Technology Independent
Three Direct Objective Methods (ITU-T Recommendation J.143)
Reduced Reference (RR)Uses Low Bandwidth Quality Features Extracted From Source and Destination Video StreamsIn-Service MonitoringScene and Technology IndependentAccurate as FR, Degrades Gracefully as RR Bandwidth is Reduced

Reduced-Reference (RR) Measurement Paradigm
Feature Extraction
Video Codec
Net
wor
k In
terf
ace
Video Codec
Net
wor
k In
terf
ace Network
Feature Extraction
Distance Measures -------------Upstream / Downstream
Quality Mapping
Estimates of Perceived
Video Quality
Low Bandwidth Features
Source (Original)
Destination (Processed)

Outline of Presentation
New Measurements RequiredSubjective Video PerformanceObjective Video PerformanceVideo Standardization EffortsExtensions of TechnologyDemonstration of Tools

Subjective Testing MethodsTruth Data for Objective MethodsStandardized Test Procedures
ITU-R BT.500 (TV)ITU-T P.910 (Multimedia)
Controlled Test EnvironmentsMonitor Setup, Viewing Distance, Lighting, etc.
Controlled Test MethodsTrainingSubject and Material Selection, Presentation, Scales

Subjective Testing Methods
Single Stimulus (SS) vs. Double Stimulus (DS)
Explicit or Hidden Reference for DSDS More Robust (Context, Bias)
Discrete vs. Continuous AssessmentRandomization and Balance Over Test Variables is Very Important

Absolute Subjective Ratings
For Practical Reasons, They Don’t Exist!Viewer Pool Variability, Criticality, Cultural DifferencesOverall Range of Quality in ExperimentApplication DependenciesLaboratory Setup and Methodology
Relative Ratings are Stable
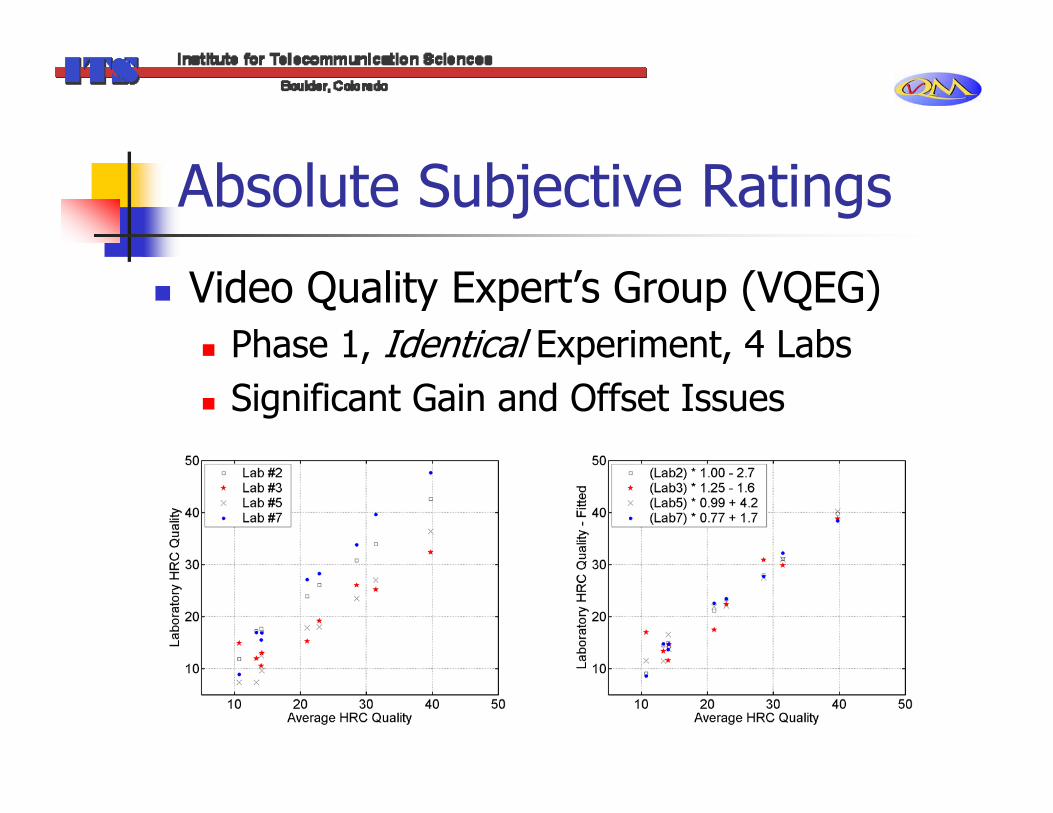
Absolute Subjective Ratings
Video Quality Expert’s Group (VQEG)Phase 1, Identical Experiment, 4 LabsSignificant Gain and Offset Issues

ITS-Developed Data Mapping Observations Led to the Development of Mathematical Data Mapping MethodIterative Nested Least Squares Algorithm (INLSA)
Linear Transformation of Subjective Data SetsSimultaneous Minimization of Objective Estimation Error
Produces Large Coherent Subjective Data BaseBetter Video Quality Models (VQMs)

Recent Papers on INLSA and Subjective Video Testing Issues
July, 2003, "An Objective Method for Combining Multiple Subjective Data Sets," SPIE Video Communications and Image Processing Conference, Lugano, Switzerland. July, 2003, "Comparing Subjective Video Quality Testing Methodologies," SPIE Video Communications and Image Processing Conference, Lugano, Switzerland.“spie03obj.pdf” and “spie03subj.pdf”
http://www.its.bldrdoc.gov/n3/video/documents.htm

ITS Subjective Test Facilities
Two Sound Isolated RoomsInteractive TestsConfigurable (A, V, A/V)
Fully AutomatedA/V PlaybackSubjective Scores
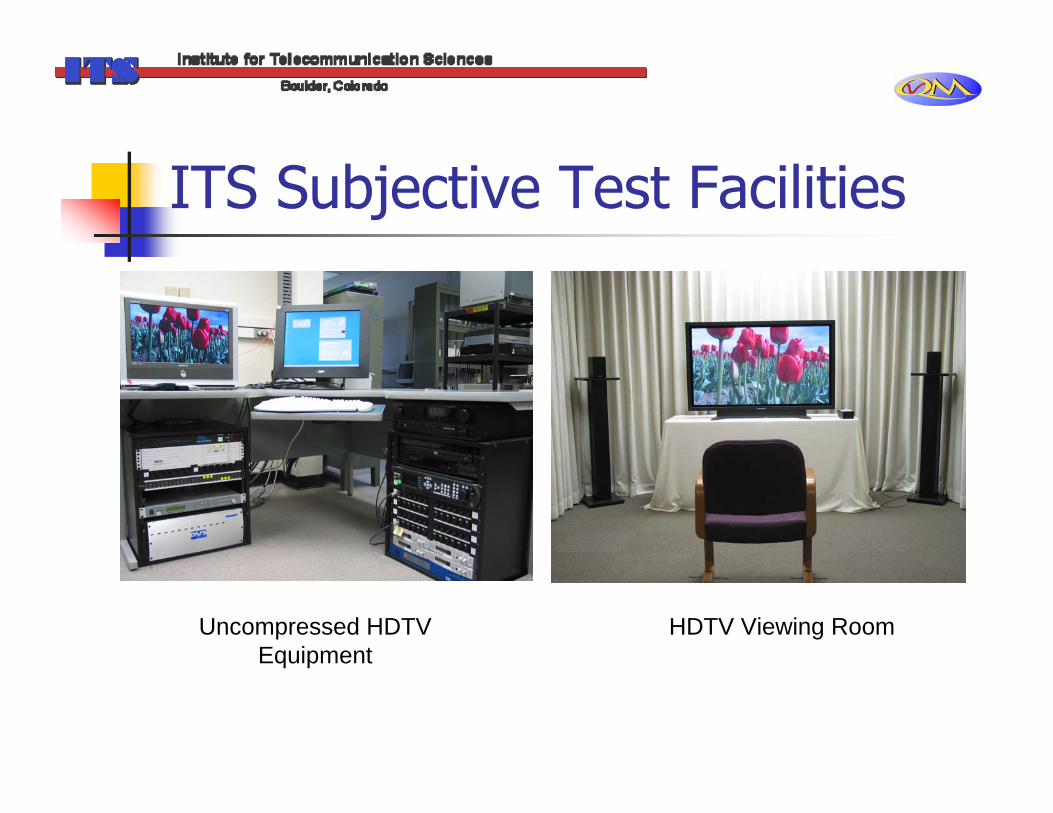
ITS Subjective Test Facilities
Uncompressed HDTV Equipment
HDTV Viewing Room

ITS’s Extensive Subjective Data Sets
19 SD Data Sets (2651 Video Clips) + 1 HD Data Set392 SD Scenes
Wide Range of Spatial Detail, Motion, Contrast, Brightness, Color
272 SD HRCs (Video Systems)Wide Range of Bit Rates, Coders, Transmission Channels, including Analog
National Archive

Outline of Presentation
New Measurements RequiredSubjective Video PerformanceObjective Video PerformanceVideo Standardization EffortsExtensions of TechnologyDemonstration of Tools

Objective Video Quality-Estimation ComponentsStep 0: Calibration
Remove Perceptually-Irrelevant Systematic Errors from Destination SignalReport Separately From Perception-Based Quality
Step 1: Feature ExtractionExtract Perceptually-Relevant, Quality-Related Attributes from Source and Destination Signals.00001 < (Feature Bit-Rate/Signal Bit-Rate) < 1
“Reduced Reference” In-Service MeasurementsStep 2: Distance Measures
Calculate a Perceptually-Relevant Distance Between the Source and Destination Feature Streams
Step 3: Quality MappingRelate Perceptual Distances to Estimates of Perceived Quality

Objective Video Quality-Estimation Components
Most Step 0 to 3 AlgorithmsDocumented in NTIA Report 02-392, “Video Quality Measurement Techniques”
“vqm_techniques_v2.pdf” available at: http://www.its.bldrdoc.gov/n3/video/documents.htm
Sept, 2004, “A New Standardized Method for Objectively Measuring Video Quality,” IEEE Transactions on Broadcasting, v. 50, n. 3, pp. 312-322.
“ieee04.pdf” also available at: http://www.its.bldrdoc.gov/n3/video/documents.htm
Additional Documentation Will Be Presented When Covered

Step 0: CalibrationEstimate and Remove (Order is Important)
Temporal Shifts (Video Delay)Spatial Scaling (Horizontal and Vertical)Spatial Shifts (Horizontal and Vertical)Valid Region ReductionGain and Level Offset
Importance Depends Upon Objective Measurement Technique
PSNR is Highly SensitiveRR Measurements are Much Less Sensitive

Step 0: Calibration
Most Calibration Quantities are Fixed for a Given Hypothetical Reference Circuit (HRC) – i.e., system under test.
Except Temporal RegistrationNeed Only Estimate Once or Infrequently at System SetupSpatial Scaling and Spatial Registration are CPU and Bandwidth Intensive

Temporal Registration –Two Methods
Frame BasedSlow, High RR Bandwidth, Sensitive to CalibrationLaboratory, Bench-Top, Out-of-ServiceProduces Delay Estimate for Each Frame
Sequence BasedFast, Low RR Bandwidth, In-Sensitive to CalibrationIn-ServiceProduces Delay Estimate for Each SequenceWorks Well with RR Quality Measurements
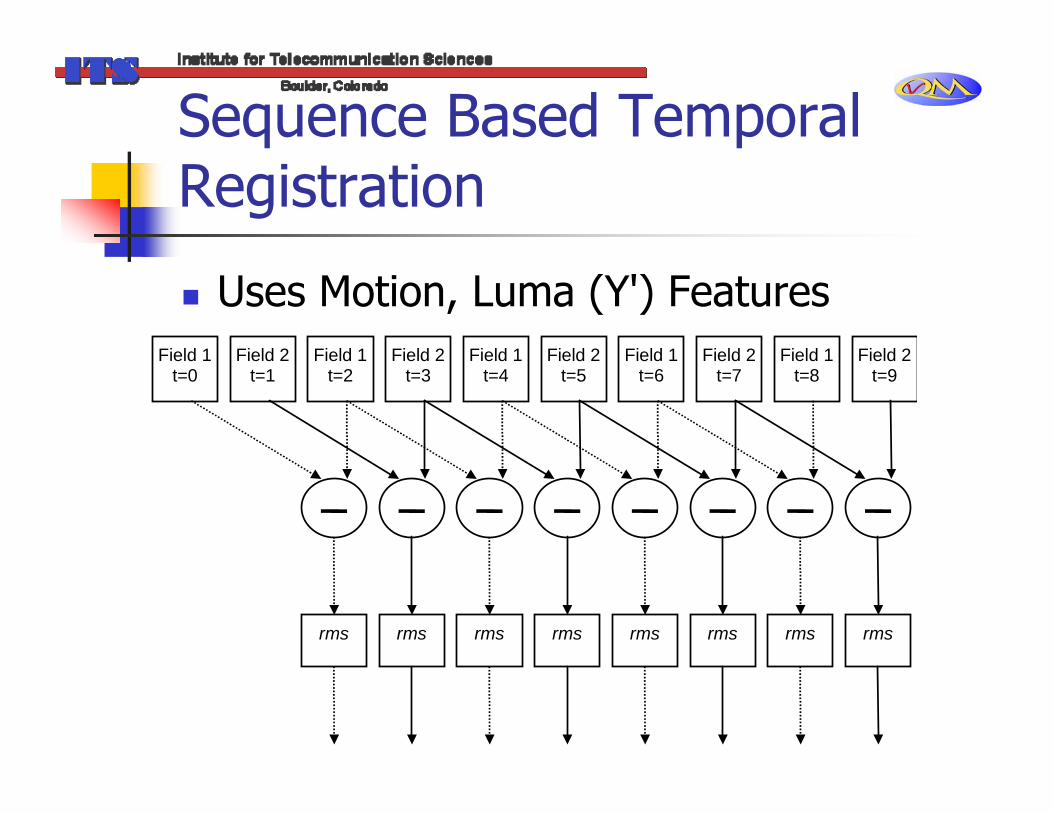
Sequence Based Temporal Registration
Uses Motion, Luma (Y') Features Field 2
t=5 Field 1
t=4 Field 2
t=3 Field 1
t=2 Field 2
t=1 Field 1
t=8 Field 2
t=7 Field 1
t=6 Field 1
t=0 Field 2
t=9
rms rms rms rms rms rms rms rms

Sequence Based Temporal Registration
Correlation to Align Source (Blue) and Destination (Red) Feature Streams
Spatial Scaling Estimation
More Applicable to Multimedia than TVHas Been Observed For TV (Rare)
Uses H and V Image ProfilesAverage of Image Columns (H), Rows (V)Reduces Scaling Estimation Complexity
Use Smart Search to Find Optimal Stretch or ShrinkageUse Several Scenes & Filter Results
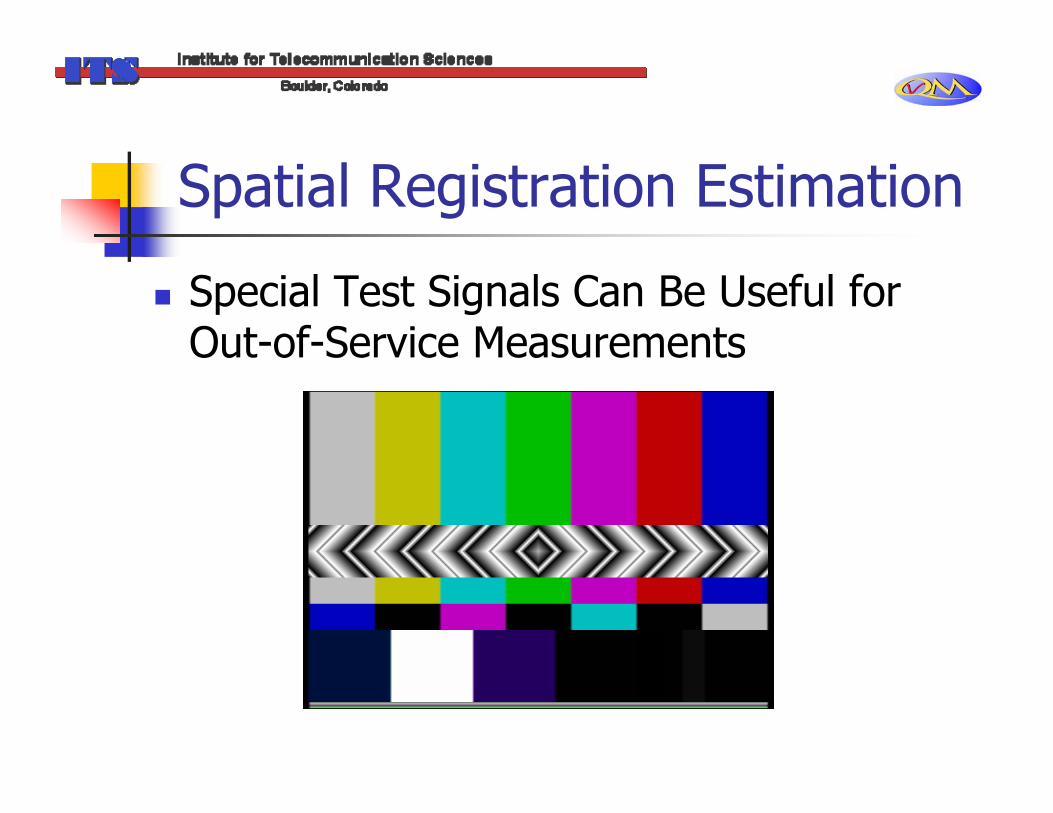
Spatial Registration Estimation
Special Test Signals Can Be Useful for Out-of-Service Measurements
Spatial Registration Estimation
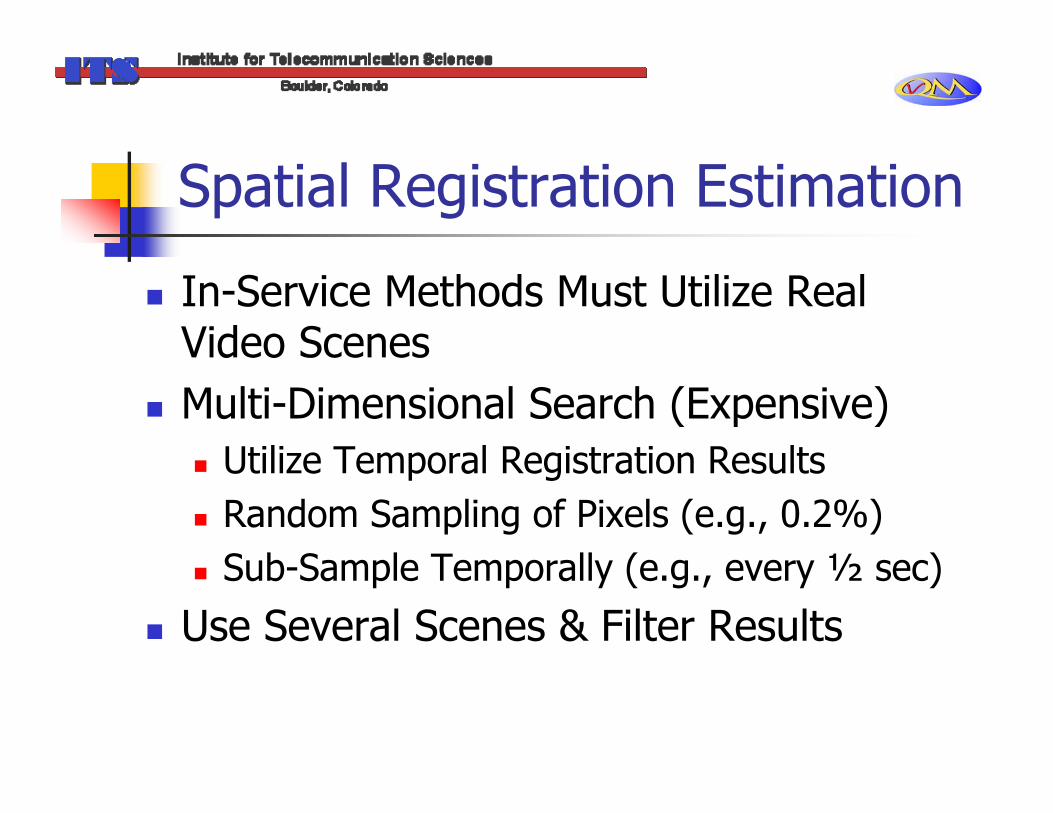
In-Service Methods Must Utilize Real Video ScenesMulti-Dimensional Search (Expensive)
Utilize Temporal Registration ResultsRandom Sampling of Pixels (e.g., 0.2%)Sub-Sample Temporally (e.g., every ½ sec)
Use Several Scenes & Filter Results

Spatial Registration Estimation
Spatial Registration Uses Field ProcessingSome Video Systems “Re-Frame”
0 1 2 3 4 5 6 7 8 9
0 0 1 1 2 2 3 3 4 4
field line frame line
field two (later) field one (earlier)

Spatial Scaling and Registration Estimation
NTIA Technical Report TR-06-433, “Reduced Reference Video Calibration Algorithms”“ntia_tr_06_433.pdf” available at:
http://www.its.bldrdoc.gov/n3/video/documents.htm

Valid Region Reduction
Video Systems Often Reduce Picture AreaMechanism to Save Bits
Use Mean Value of Columns & RowsTransitions (Ramps) Not Included
Referenced to Source, Accounting for Spatial Scaling and Shifts

Gain and Level Offset –Independent Color Components
Temporally & Spatially Scaled & RegisteredTreat Each Component (e.g., Y', Cb, Cr) SeparatelyDivide Valid Region into N Sub-Regions
Take Mean of Each Sub-RegionSolve Least Squares Problem
lSgD +=

Gain and Level Offset –Dependent Color Components
Required for Complex Color Errors (e.g., Hue)Estimate and Remove Arbitrary Color Component Mixing Plus DC Shift
Must Solve for 12 Unknownse.g., For RGB Color Space, Red Color Component of 1st Corrected Sample is
11,411,311,21,11 _*_*_*_ˆ BDAGDARDAARS +++=
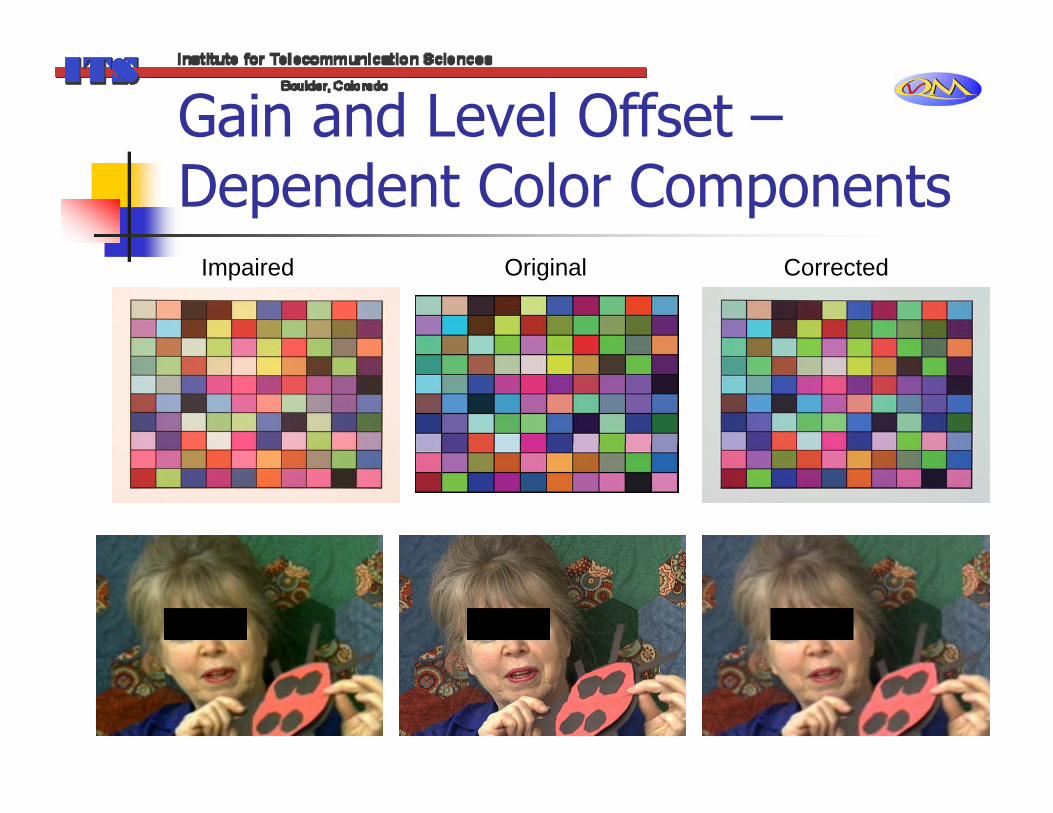
Gain and Level Offset –Dependent Color Components
Impaired Original Corrected

Gain and Level Offset –Dependent Color Components
NTIA TM-04-406, “Color Correction Matrix for Digital Still and Video Imaging Systems”“ntia406.pdf” available at:
http://www.its.bldrdoc.gov/n3/video/documents.htm
Excellent Practical Video Color Space Reference “ColorFAQ.pdf” available at:
http://www.poynton.com/PDFs/ColorFAQ.pdf
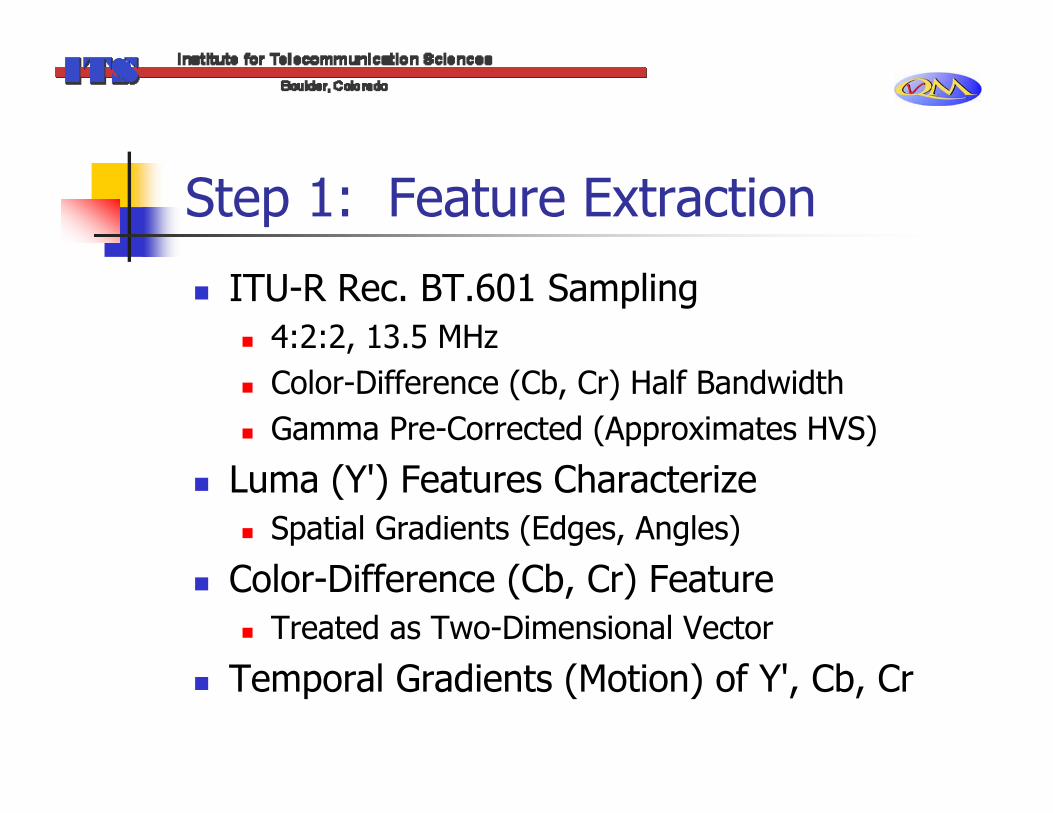
Step 1: Feature Extraction
ITU-R Rec. BT.601 Sampling4:2:2, 13.5 MHzColor-Difference (Cb, Cr) Half BandwidthGamma Pre-Corrected (Approximates HVS)
Luma (Y') Features CharacterizeSpatial Gradients (Edges, Angles)
Color-Difference (Cb, Cr) FeatureTreated as Two-Dimensional Vector
Temporal Gradients (Motion) of Y', Cb, Cr

83
Overview of Spatial Gradient Feature Extraction
Y'in Horizontal
Edge Enhancement
Filter
Extract Features From S-T Regions
Apply Perceptibility Thresholds
Apply Spatial Collapsing Function
Apply Temporal Collapsing Function
Apply Visual Masking Functions
fin(s, t)
gain(s, t) loss(s, t)
gain(t) loss(t)
gain loss
Vertical Edge Enhancement
Filter
Y'outHorizontal Edge
Enhancement Filter
Extract Features From S-T Regions
Apply Perceptibility Thresholds
fout(s, t)Vertical Edge Enhancement
Filter
84
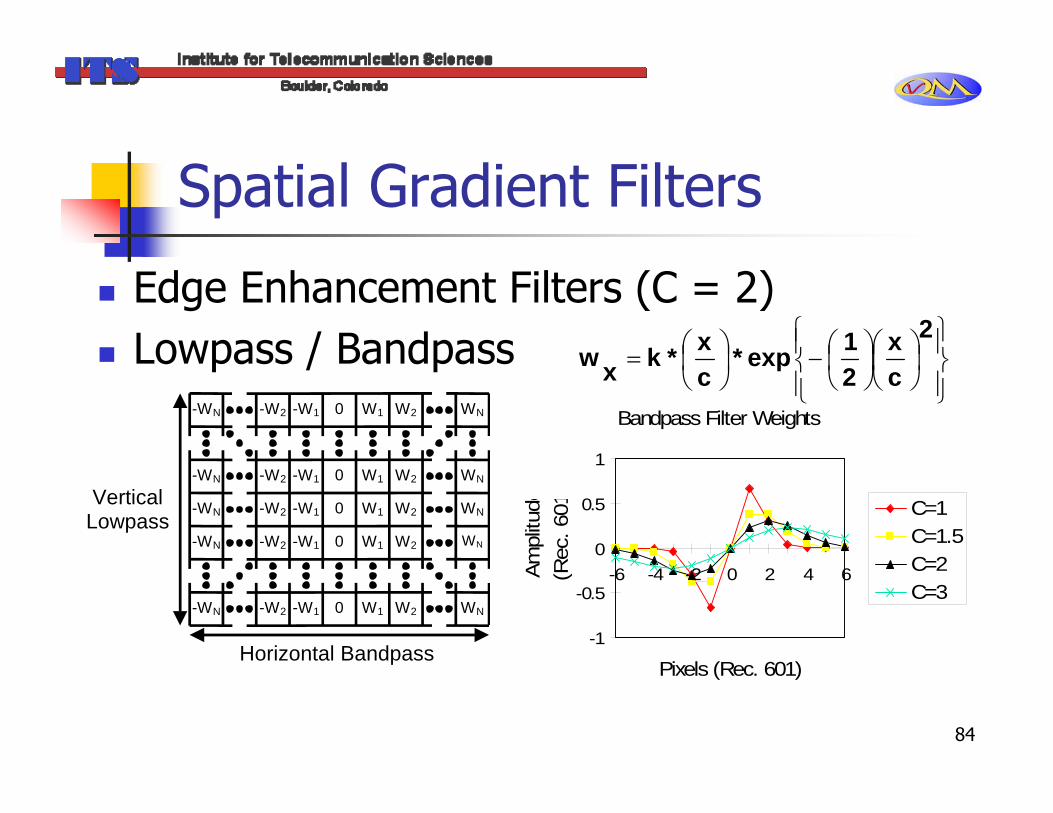
Spatial Gradient Filters
Edge Enhancement Filters (C = 2)Lowpass / Bandpass
0 -W1 W1 W2-W2 WN-WN
0 -W1 W1 W2-W2 WN-WN
0 -W1 W1 W2-W2 WN-WN
0 -W1 W1 W2-W2 WN-WN
0 -W1 W1 W2-W2 WN-WN
Horizontal Bandpass
Vertical Lowpass
Bandpass Filter Weights
-1
-0.5
0
0.5
1
-6 -4 -2 0 2 4 6
Pixels (Rec. 601)
Ampl
itude
(Rec
. 601 C=1
C=1.5C=2C=3
⎪⎭
⎪⎬⎫
⎪⎩
⎪⎨⎧
⎟⎠⎞
⎜⎝⎛⎟⎠⎞
⎜⎝⎛−⎟
⎠⎞
⎜⎝⎛=
2
cx
21exp*
cx*kxw
85
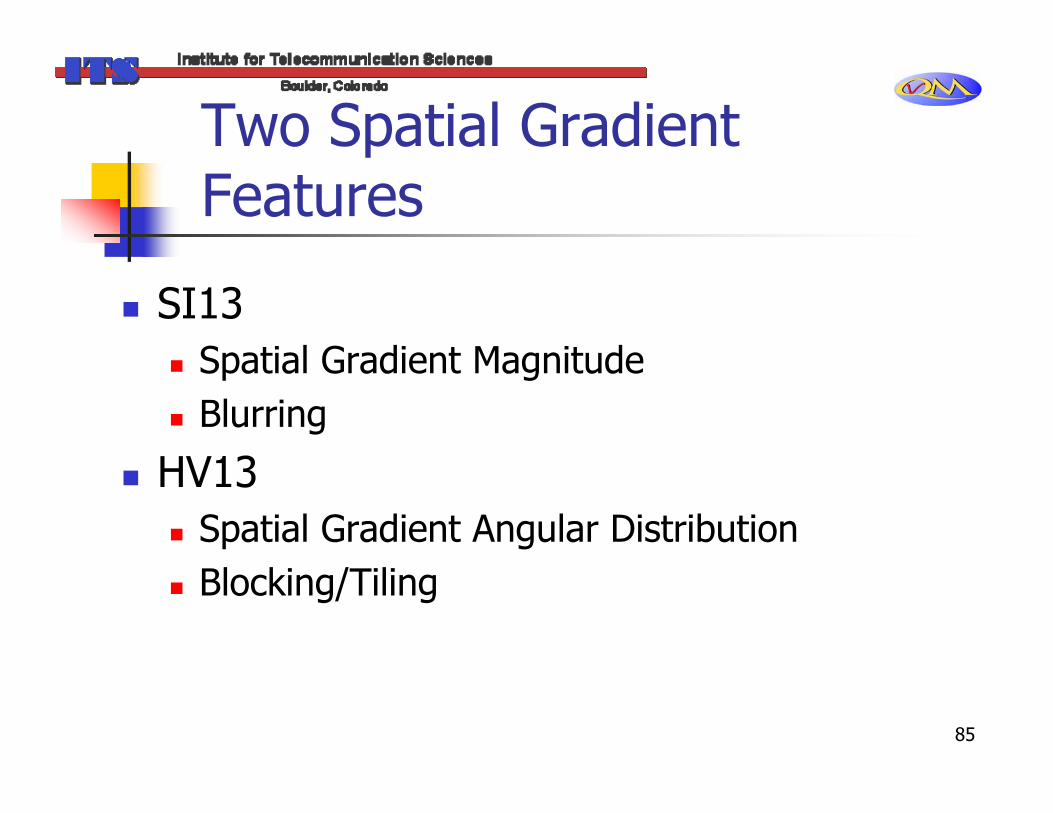
Two Spatial Gradient Features
SI13Spatial Gradient MagnitudeBlurring
HV13Spatial Gradient Angular DistributionBlocking/Tiling

86
Graphical Depiction of Spatial Gradient Features
H
V
2Δθ
2Δθ
H(i,j,t)
V(i,j,t) R
θ
rmin
SI13
HV13
( )[ ]{ }PtjiR ,,stdev
( )( )
mean , ,
mean , ,
R i j t
R i j t
HV P
HV P
⎡⎣⎢
⎤⎦⎥
⎧⎨⎩
⎫⎬⎭
⎡
⎣⎢
⎤
⎦⎥
⎧⎨⎪
⎩⎪
⎫⎬⎪
⎭⎪

87
Spatial Gradient Feature Examples
Missing Edges - Blurring, SmearingAdded Edges - Tiling, Edge Busyness, Lines
SpatialSpatial
FilterFilter
Spatial Spatial Information (SI)Information (SI)

88
Blurring
SpatialSpatial
FilterFilter
SpatialSpatial
FilterFilter

89
Tiling / Blocking
SpatialSpatial
FilterFilter
SpatialSpatial
FilterFilter
H
V
2Δθ
2Δθ
H(i,j,t)
V(i,j,t) R
θ
rmin
90
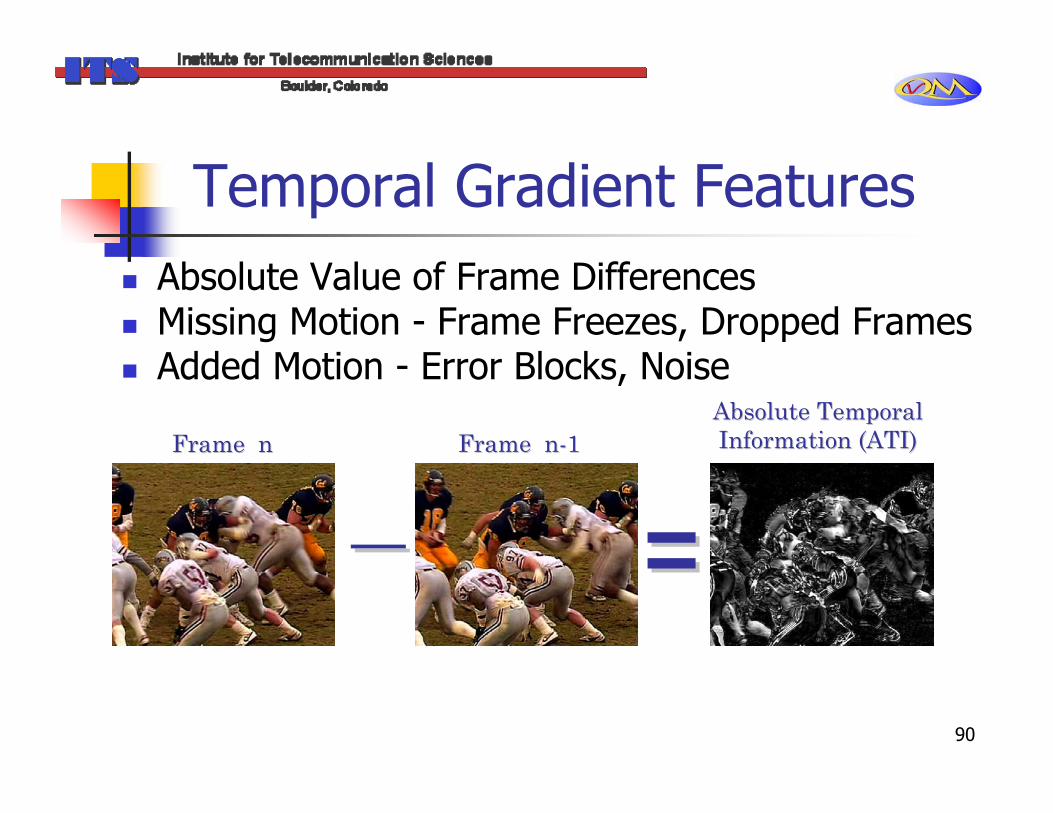
Temporal Gradient FeaturesAbsolute Value of Frame DifferencesMissing Motion - Frame Freezes, Dropped FramesAdded Motion - Error Blocks, Noise
__ ==Frame nFrame n Frame nFrame n--11
Absolute Temporal Absolute Temporal Information (ATI)Information (ATI)

91
Frame Freezes, Dropped Frames
Absolute Absolute Temporal Temporal
Information Information (ATI)(ATI)
92
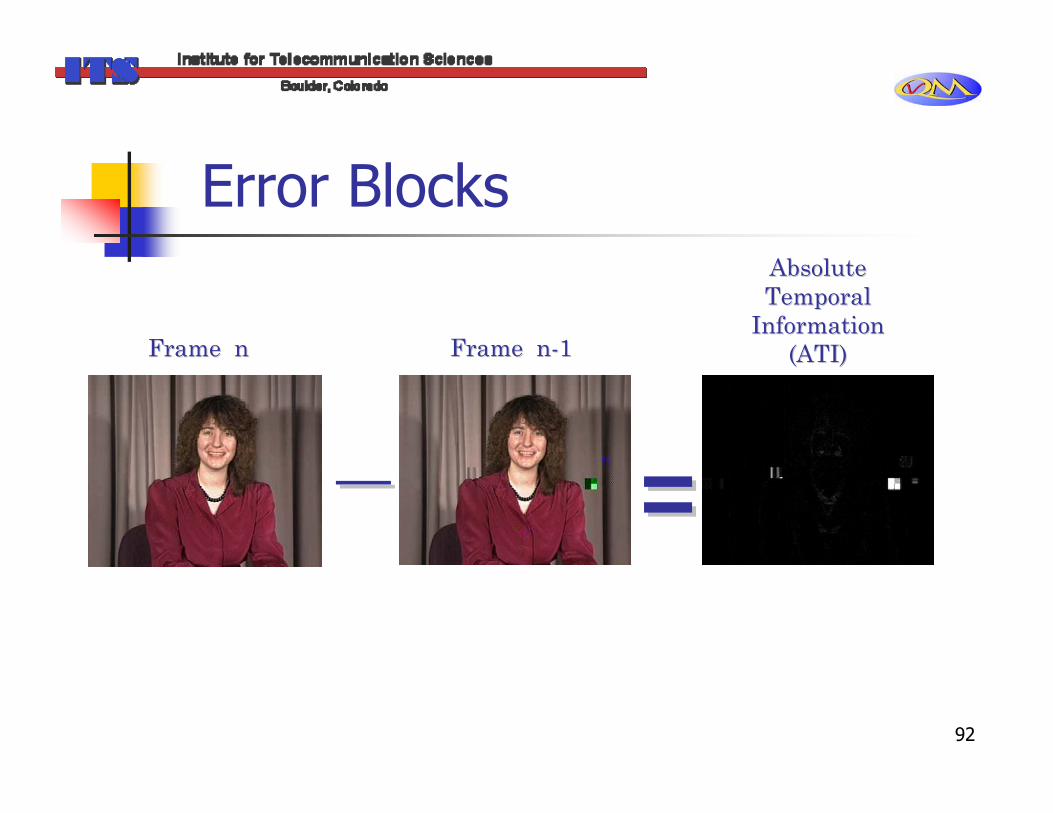
Error Blocks
Frame nFrame n Frame nFrame n--11
Absolute Absolute Temporal Temporal
Information Information (ATI)(ATI)
__ ==

Temporal FeatureLowbw (10 kbits/s) VQM
For Noise & ErrorsATI = RMS { Y'CbCr(t) – Y'CbCr(t-0.2s) }
0.2s Makes Feature Insensitive to Frame Repeats Present in Low Frame Rate Multimedia Systems
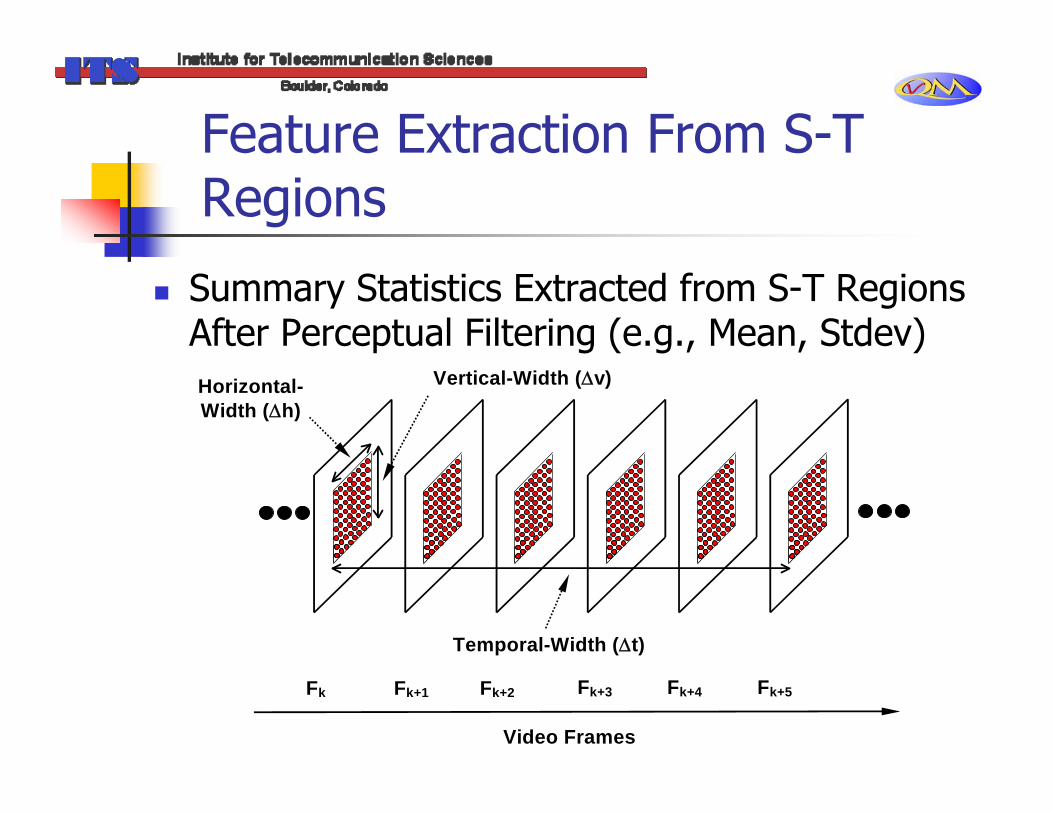
Feature Extraction From S-T Regions
Summary Statistics Extracted from S-T Regions After Perceptual Filtering (e.g., Mean, Stdev)
Video Frames
Fk Fk+1 Fk+2 Fk+3 Fk+4 Fk+5
Temporal-Width (Δt)
Vertical-Width (Δv) Horizontal-Width (Δh)

Objective to Subjective Correlation: S-T Region Size
Optimal S-T Region Size8 x 8 x 0.2 Seconds (Used in General VQM)Shorter Temporal Extents => Poorer Correlation
Correlation Falls Off Slowly For Increasing Temporal Extents
32 x 32 x 1 Second - Lowbw (10kbits/s) VQM

Objective to Subjective Correlation: S-T Region Size
HV Loss (General VQM Error Pooling)
97
Objective to Subjective Correlation: S-T Region Size
SCI / ISAS 2001 paper, "The Relationship Between Performance and Spatial-Temporal Region Size for Reduced-Reference, In-Service Video Quality Monitoring Systems”“iiis01.pdf” available at:
http://www.its.bldrdoc.gov/n3/video/documents.htm
Feature Quantization
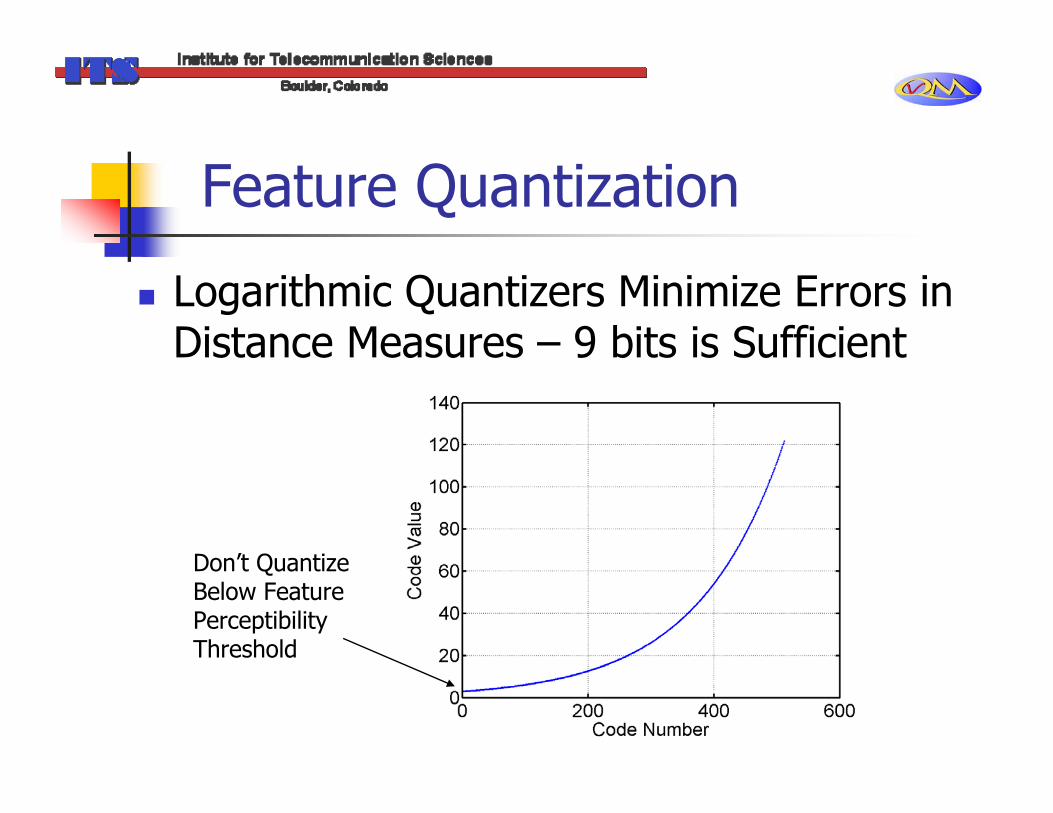
Logarithmic Quantizers Minimize Errors in Distance Measures – 9 bits is Sufficient
Don’t Quantize Below Feature Perceptibility Threshold
99
Step 2: Distance Measures -Quality Parameters
Convert Feature Streams To Quality ParametersMeasure Perceptual Impairments For Each S-T RegionApply Perceptibility Threshold
Clip Features at Low End

Step 2: Distance Measures -Quality Parameters
Apply Visual Masking Functions(Out-In)/In, log (Out/In)Separate Gain and Loss (i.e., Positive Part, Negative Part)
Error Pooling (Over Space and Time)Normally Worst Case (e.g., 5%)Depends on Feature and S-T Region Size

Improved Error PoolingLowbw (10 kbits/s) VQM
Macroblocks (MB) (e.g., 3r x 3c x 2t)Worse Case Processing Within MBLocalized S-T Impairments
Generalized MinkowskiRemoves Non-Linearity Before Fitting
RN
i
Piv
NRPMinkowski ∑
=
=1
1),(
Step 3: Video Quality Mapping or Model (VQM)
Depends on Subjective Testing Methodology
e.g., DSCQS, SSCQE (See ITU-R Rec. 500)Expert/Non-Expert Viewers
Depends on Video ApplicationTelevisionVideoconferencing

INLSA-Based VQMs
ITS General VQM11 Subjective Data Sets (1563 Video Clips)7 Quality Parameters
Lowbw (10 kbits/s) VQM19 Subjective Data Sets (2651 Video Clips)8 Quality Parameters“vpqm05.pdf” available at:
http://www.its.bldrdoc.gov/n3/video/documents.htm
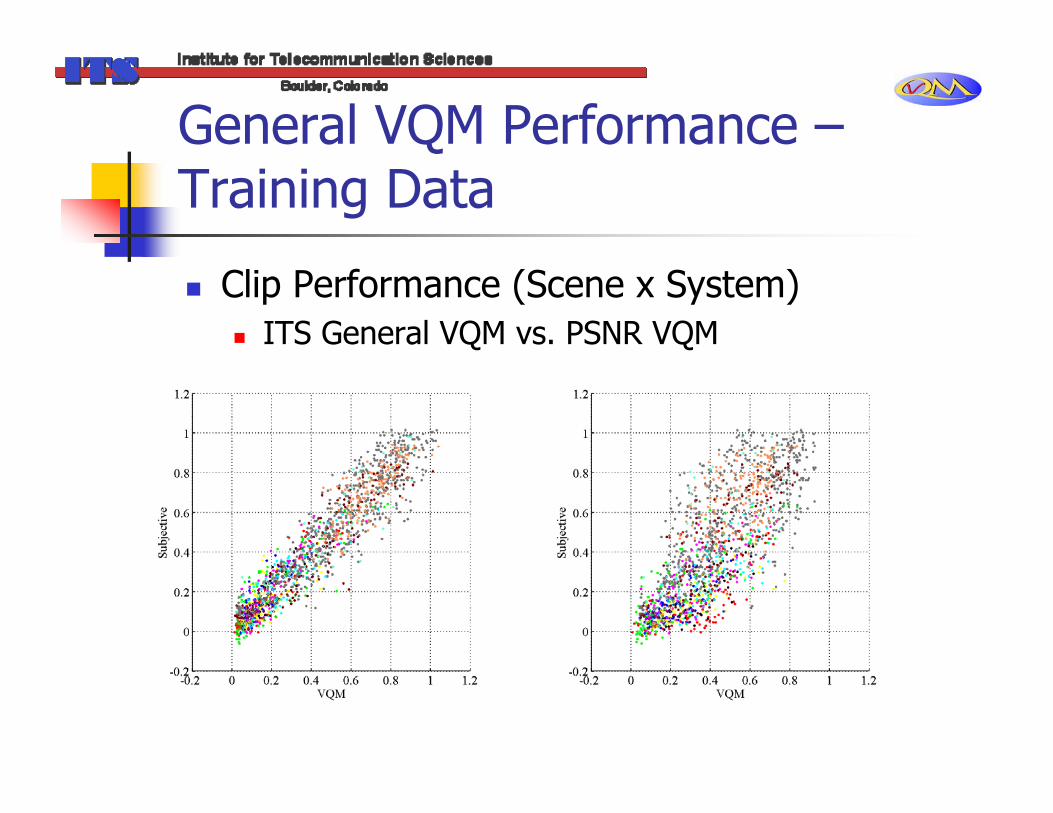
General VQM Performance –Training Data
Clip Performance (Scene x System)ITS General VQM vs. PSNR VQM

General VQM Performance -Training Data
Average Video System (HRC) PerformanceITS General Model vs. PSNR

Lowbw (10 kbits/s) VQM Performance - Training Data
Clip Performanceρ = .927RMS Error
0.096(0, 1) Scale

Lowbw (10 kbits/s) VQM Performance – Training Data
HRC Performanceρ = .967RMS Error
0.066(0, 1) Scale
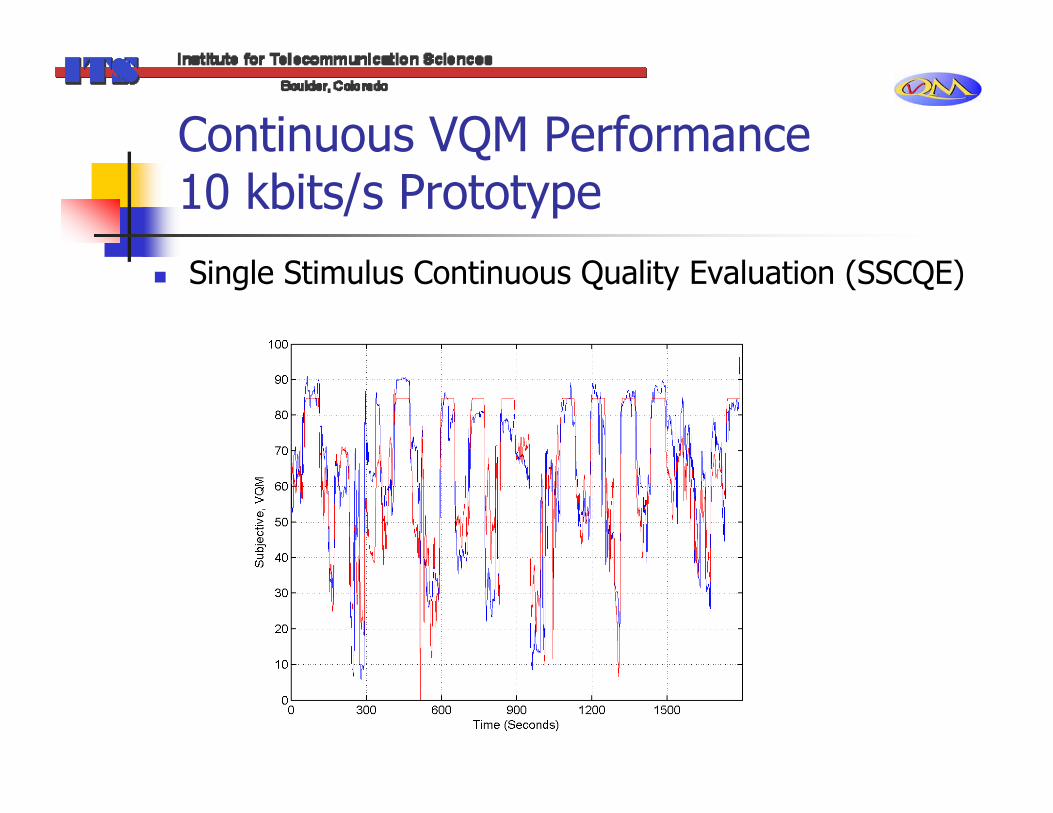
Continuous VQM Performance 10 kbits/s Prototype
Single Stimulus Continuous Quality Evaluation (SSCQE)

Outline of Presentation
New Measurements RequiredSubjective Video PerformanceObjective Video PerformanceVideo Standardization EffortsExtensions of TechnologyDemonstration of Tools

Objective Metrics and Standards – 1990’s SummaryFour National Standards in Mid-1990s
ANSI T1.801.01-1995 (Test Scenes)ANSI T1.801.02-1996 (Terms and Definitions)ANSI T1.801.03-1996 (Objective Metrics)
Test Signals and Patterns Did Not Correlate with Subjective (Spinning Wheel, 3D Sine waves. etc.)ITS Measurements Yielded 0.88 Correlation – Suitable for Quality Monitoring (Not System Comparison)Spatial-Temporal Metrics Incorporated in ITU-T Rec. P.910 (Annex A) for Objectively Quantifying Scene Criticality
ANSI T1.801.04-1997 (Multimedia Delay, Synch, FR)Later Standardized by ITU-T (P.931)

Objective Metrics and Standards – 1990’s Summary
Hardware Feasibility Demonstrated (Real-Time, In-Service, Perception-Based)Reduced Reference (RR) Measurement Paradigm Adopted by the ITU
ITU-T Rec. J.143

Video Quality Expert’s Group (VQEG)
Founded and Co-Chaired by ITS Staff (1997)ITU-T SG 9 & 12, and ITU-R WP 6Q Experts
ITS ManagesWebsite (www.vqeg.org)Doc Server (ftp://ftp.its.bldrdoc.gov/dist/ituvidq/)Video File Server (ftp://vqeg.its.bldrdoc.gov/)
Mission – Validate Objective Video Quality Metrics & Forward Test Reports to ITU
Independent Lab Group (ILG) Conducts TestsITU Writes and Approves Recommendations
Video Quality Expert’s Group (VQEG) Full Reference TV (FRTV) Phase 1
From 1997 to 20008 Subjective Labs, 10 Objective Proponents20 Source Sequences (split 525 & 625)32 Video SystemsNo Clear “Winner”
ITU-T J.144 (March 2001)VQEG Phase 1 Report

Committee T1 Technical Reports
From 2000 – 2002Jointly Developed by ITS and Sarnoff
VQEG Phase 1 Spin-off
Five Committee T1 Technical ReportsT1.TR.72 - Specifying Accuracy and Cross Calibration of Video Quality MetricsT1.TR.73, 74, 75, 77 - Calibration, PSNR, JND, Test Code and Data

Committee T1 Technical Reports
Resolving Power & Classification Errors
Resolving Power Classification Errors
Committee T1 Technical Reports
Revised For ClarityT1.TR.72-2003 (Approved Dec., 2003) “Methodological Framework for Specifying Accuracy and Cross-Calibration of Video Quality Metrics.”
International RecommendationITU-T Recommendation J.149 (Approved Mar., 2004) “Method for Specifying Accuracy and Cross-Calibration of Video Quality Metrics (VQM).”
Video Quality Expert’s Group (VQEG) Full Reference TV (FRTV) Phase 2
From 2000 to 20043 Subjective Labs, 8 Objective Proponents (2 Withdrew)26 Source Sequences (split 525 & 625)24 Video SystemsFour Systems Were Recommended
ITU-T J.144 (March 2004)ITU-R BT.1683VQEG Phase 2 Report
ITS General VQMSubmitted to VQEG Phase II FRTV TestsDesigned for Wide Range of Video Systems
Hence the name “General” VQMHigh Bandwidth RR VQM
Mbits/s of Reference InformationTop Performing VQM in VQEG Tests
Only VQM in Top Performing Group (at 99% Level) for Both 525-line and 625-line TV StandardsOnly VQM with an Average Correlation to Subjective Score > 0.9 (Over 525-line and 625-line Tests)0.94 Correlation to 525-line Subjective Test

ITS General VQM
North American StandardizationANSI T1.801.03-2003 (Approved Sept. 2003) “Digital Transport of One-Way Video Signals – Parameters for Objective Performance Assessment.”Only Method Approved by ANSI for Video System ComparisonsScope Does Not Include Transmission Errors

VQEG Timeline and Future Activities
2000 20041997 1999 2005 20061996 1998 2001 2002 2003 2007 2008
FRTV-I
FRTV-II
HDTV
Multimedia
601
QCIF
CIF
RRNR-TV
Multimedia:601: TV over IPCIF: StreamingQCIF: Hand Held Video

Joint Rapporteur Group on Multimedia Quality Assessment (JRG-MMQA)
Recently Founded (2004) Audio Experts from ITU-T SG12Video Experts From ITU-T SG9First Several Meetings – Revised Multimedia Test Plan

Outline of Presentation
New Measurements RequiredSubjective Video PerformanceObjective Video PerformanceVideo Standardization EffortsExtensions of TechnologyDemonstration of Tools
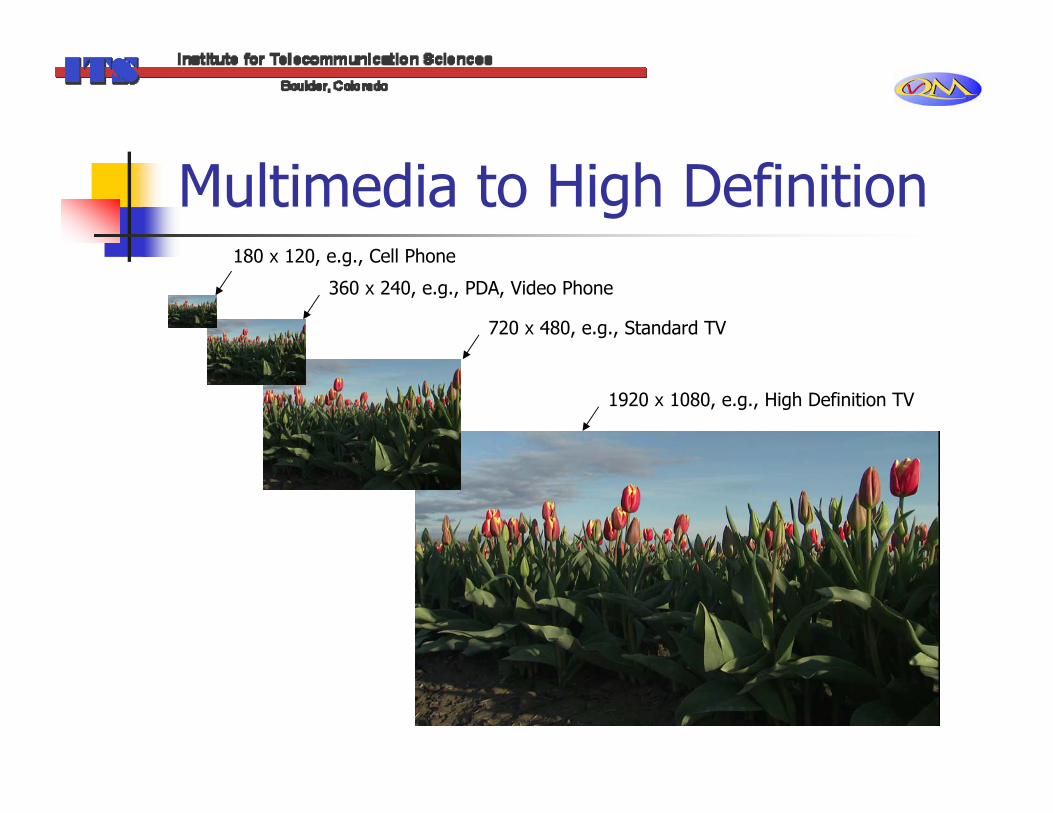
Multimedia to High Definition180 x 120, e.g., Cell Phone
360 x 240, e.g., PDA, Video Phone
720 x 480, e.g., Standard TV
1920 x 1080, e.g., High Definition TV

Multimedia
Different than TVSmall, Low Resolution Screens (LCDs)Different Physics
Farther Viewing Distances (in terms of Picture Height)Less Pixels per Degree
Spatial Scaling IssuesDifferent Applications
Access to Video Signals

HDTV
Different than TVLarge High Resolution ScreensDifferent Physics
Closer Viewing Distances (in terms of Picture Height)Same Pixels Per Degree but Greater Viewing AngleSubject Focus, Object/Scene Tracking Issues
Challenges / Questions
Localized Errors (in space and/or time) can Have a Large Perceptual Impact
Very Small % of Video StreamThus, Difficult to Measure Robustly
How Much Human Behavior Should We Really Model?
SSCQE Thought Experiment
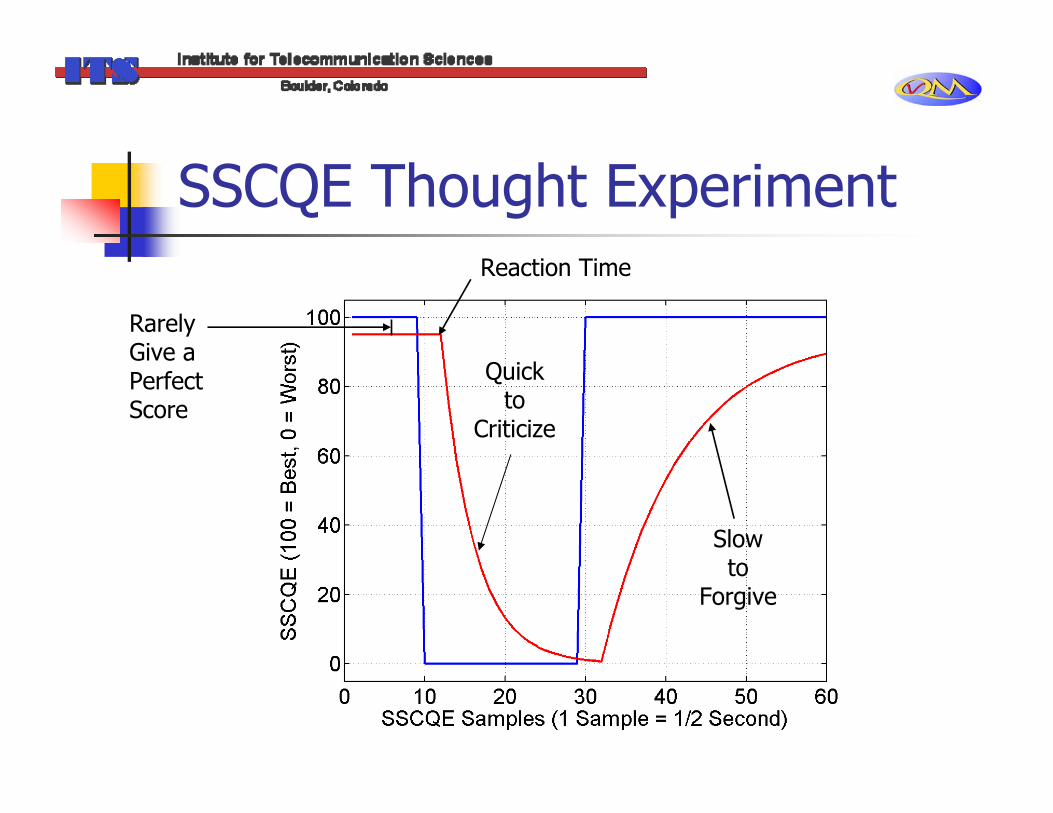
SSCQE Thought ExperimentReaction Time
Rarely Give a Perfect Score
Quick to
Criticize
Slow to
Forgive

Outline of Presentation
New Measurements RequiredSubjective Video PerformanceObjective Video PerformanceVideo Standardization EffortsExtensions of TechnologyDemonstration of Tools
Laboratory VQM Tool Overview
Designed for Bench Top EvaluationSource and Destination Video Signals / files available at one PC
UNIX (Batch) and PC (Interactive) Versions
PC Version Jointly Developed by ITS and IntelFocus on PC Version Here

Laboratory VQM Tool Overview
Two Software FlowsTest Video Sequence (TVS)
Calibration Assisted by Special Test PatternU.S. Patent Pending
Original (Source) and Processed (Destination) Library of Video Clips
Calibration Uses ScenesAll Clips Must be From Same HRC

Laboratory VQM Tool Overview
Calibration Algorithms (Spatial, Temporal, Gain & Level Offset, Valid Region)
Includes Calibration Root Cause Analysis
Five VQMs (General, Video Conferencing, TV, and Developers – Fast, PSNR)
Includes Impairment Root Cause Analysis
Hierarchical Presentation of ResultsHRC VQM -> Clip VQM -> Clip Parameter -> Parameter Time Histories -> Perceptual Features

Laboratory VQM Tool Overview
VQM Calculation is Multi-threadedVFW Frame Capture IncludedVideo Conversion Tools Included
UYVY is Native Tool Format

Laboratory VQM Tool User’s Manuals
UNIX – NTIA Handbook 02-01, “Video Quality Measurement User Manual,”Feb., 2002.PC – Web PDF Document, “Video Quality Measurement PC User's Manual,” Nov., 2002.
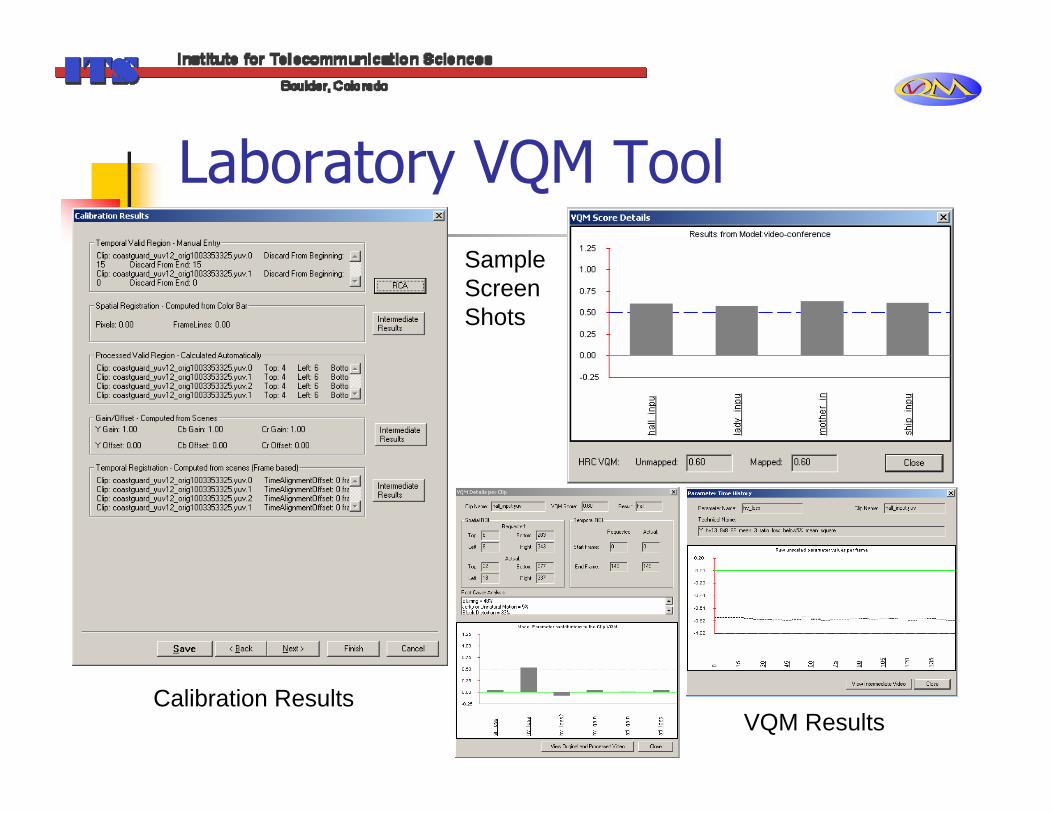
Laboratory VQM Tool
Calibration ResultsVQM Results
Sample Screen Shots
In-Service VQM (IVQM) Tool OverviewDeveloped by ITS (04 to 05)Perform End-to-End In-Service VQM (IVQM) Measurements
Requires Two PCs (Source and Destination)RR Features Communicated over Internet
Passive Monitoring of Video StreamAttach Video Capture Probes at Two PointsPlot Measured Quality
MATLAB-Based
IVQM Tool OverviewSupports Real Time Video Capture
e.g., USB2 Video Capture on LaptopsLarge RAM Requirements
Includes Full Calibratione.g., Temporal Registration, Spatial Scaling, Spatial Registration, Valid Region, Gain / Level OffsetVideo Delay with Synchronized Clocks
Currently Implements 4 VQMsGeneral, Developer (Fast Version of General)Lowbw, Fastlowbw

IVQM Tool Overview
Non-Real Time MeasurementsDepends on VQM and Image Resolution
Captures Sequence -> Analyzes Sequence -> Captures Next SequenceUser’s Manual
NTIA Handbook, “In-Service Video Quality Metric (IVQM) User’s Manual”, Dec, 2005.

IVQM Tool Setup Screen
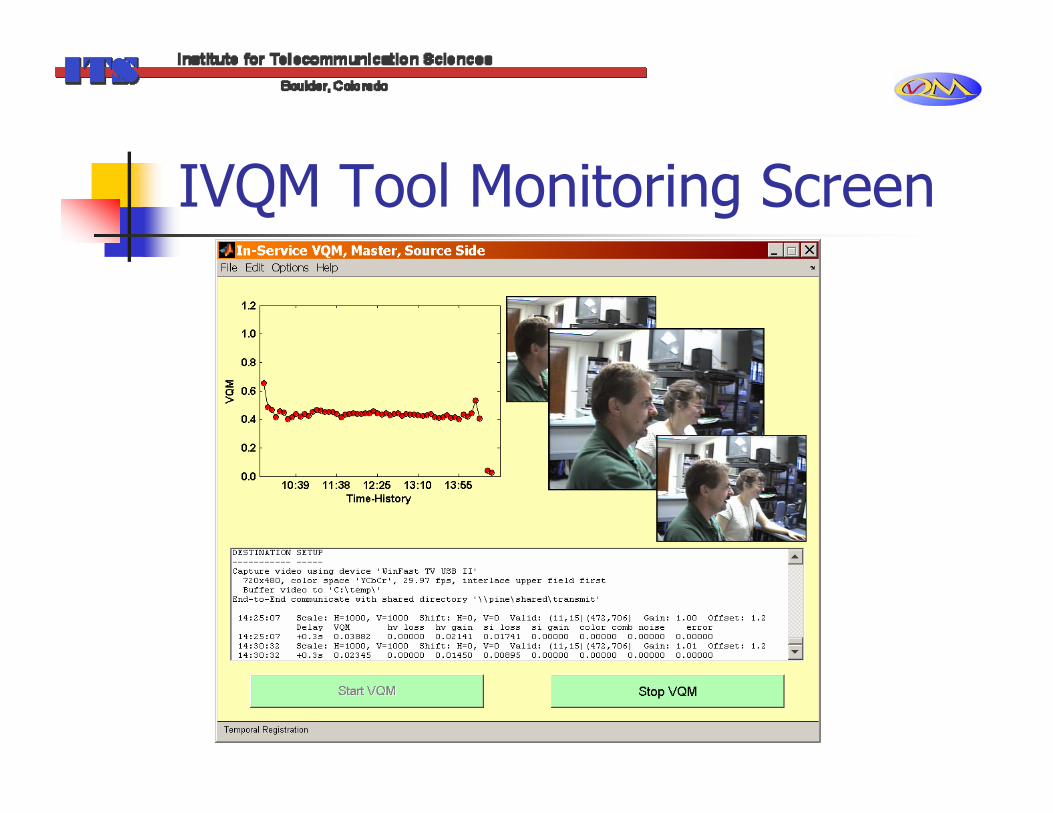
IVQM Tool Monitoring Screen

New Measurement Tools(Available Shortly)
Command-line VQM (CVQM)Simple Window’s Command Line Interface
Batch VQM (BVQM)GUI InterfaceGreatly Simplify Batch Processing on PC
Dynamically Linked Library (DLL)Standard Interface for Third Party Applications