Tutorial 8. Modeling Flow Through Porous Mediabarbertj/CFD Training/Fluent 12/tut08.pdf · Tutorial...
30
Tutorial 8. Modeling Flow Through Porous Media Introduction Many industrial applications such as filters, catalyst beds and packing, involve modeling the flow through porous media. This tutorial illustrates how to set up and solve a problem involving gas flow through porous media. The industrial problem solved here involves gas flow through a catalytic converter. Cat- alytic converters are commonly used to purify emissions from gasoline and diesel engines by converting environmentally hazardous exhaust emissions to acceptable substances. Examples of such emissions include carbon monoxide (CO), nitrogen oxides (NO x ), and unburned hydrocarbon fuels. These exhaust gas emissions are forced through a substrate, which is a ceramic structure coated with a metal catalyst such as platinum or palladium. The nature of the exhaust gas flow is a very important factor in determining the per- formance of the catalytic converter. Of particular importance is the pressure gradient and velocity distribution through the substrate. Hence CFD analysis is used to design efficient catalytic converters. By modeling the exhaust gas flow, the pressure drop and the uniformity of flow through the substrate can be determined. In this tutorial, ANSYS FLUENT is used to model the flow of nitrogen gas through a catalytic converter geometry, so that the flow field structure may be analyzed. This tutorial demonstrates how to do the following: • Set up a porous zone for the substrate with appropriate resistances. • Calculate a solution for gas flow through the catalytic converter using the pressure- based solver. • Plot pressure and velocity distribution on specified planes of the geometry. • Determine the pressure drop through the substrate and the degree of non-uniformity of flow through cross sections of the geometry using X-Y plots and numerical re- ports. Prerequisites This tutorial is written with the assumption that you have completed Tutorial 1, and that you are familiar with the ANSYS FLUENT navigation pane and menu structure. Some steps in the setup and solution procedure will not be shown explicitly. Release 12.0 c ANSYS, Inc. March 12, 2009 8-1
Transcript of Tutorial 8. Modeling Flow Through Porous Mediabarbertj/CFD Training/Fluent 12/tut08.pdf · Tutorial...
Tutorial 8. Modeling Flow Through Porous Media
Introduction
Many industrial applications such as filters, catalyst beds and packing, involve modelingthe flow through porous media. This tutorial illustrates how to set up and solve a probleminvolving gas flow through porous media.
The industrial problem solved here involves gas flow through a catalytic converter. Cat-alytic converters are commonly used to purify emissions from gasoline and diesel enginesby converting environmentally hazardous exhaust emissions to acceptable substances.Examples of such emissions include carbon monoxide (CO), nitrogen oxides (NOx), andunburned hydrocarbon fuels. These exhaust gas emissions are forced through a substrate,which is a ceramic structure coated with a metal catalyst such as platinum or palladium.
The nature of the exhaust gas flow is a very important factor in determining the per-formance of the catalytic converter. Of particular importance is the pressure gradientand velocity distribution through the substrate. Hence CFD analysis is used to designefficient catalytic converters. By modeling the exhaust gas flow, the pressure drop andthe uniformity of flow through the substrate can be determined. In this tutorial, ANSYSFLUENT is used to model the flow of nitrogen gas through a catalytic converter geometry,so that the flow field structure may be analyzed.
This tutorial demonstrates how to do the following:
• Set up a porous zone for the substrate with appropriate resistances.
• Calculate a solution for gas flow through the catalytic converter using the pressure-based solver.
• Plot pressure and velocity distribution on specified planes of the geometry.
• Determine the pressure drop through the substrate and the degree of non-uniformityof flow through cross sections of the geometry using X-Y plots and numerical re-ports.
Prerequisites
This tutorial is written with the assumption that you have completed Tutorial 1, andthat you are familiar with the ANSYS FLUENT navigation pane and menu structure.Some steps in the setup and solution procedure will not be shown explicitly.
Release 12.0 c© ANSYS, Inc. March 12, 2009 8-1
Modeling Flow Through Porous Media
Problem Description
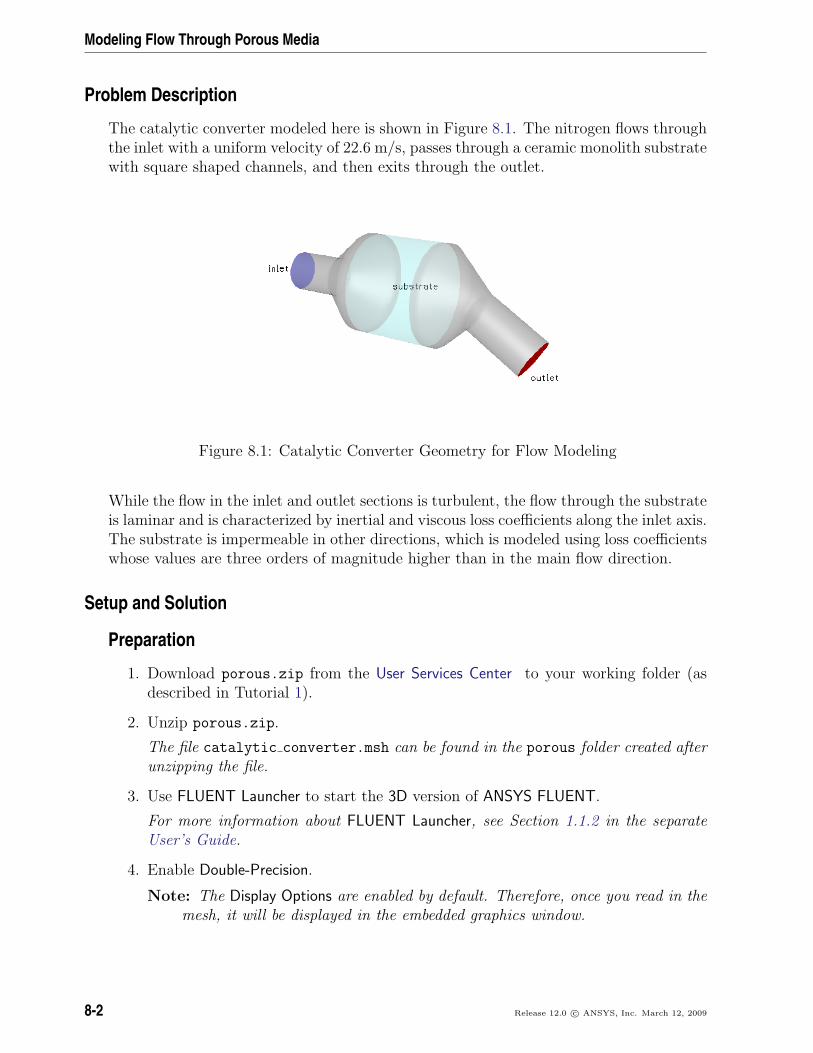
The catalytic converter modeled here is shown in Figure 8.1. The nitrogen flows throughthe inlet with a uniform velocity of 22.6 m/s, passes through a ceramic monolith substratewith square shaped channels, and then exits through the outlet.
Figure 8.1: Catalytic Converter Geometry for Flow Modeling
While the flow in the inlet and outlet sections is turbulent, the flow through the substrateis laminar and is characterized by inertial and viscous loss coefficients along the inlet axis.The substrate is impermeable in other directions, which is modeled using loss coefficientswhose values are three orders of magnitude higher than in the main flow direction.
Setup and Solution
Preparation
1. Download porous.zip from the User Services Center to your working folder (asdescribed in Tutorial 1).
2. Unzip porous.zip.
The file catalytic converter.msh can be found in the porous folder created afterunzipping the file.
3. Use FLUENT Launcher to start the 3D version of ANSYS FLUENT.
For more information about FLUENT Launcher, see Section 1.1.2 in the separateUser’s Guide.
4. Enable Double-Precision.
Note: The Display Options are enabled by default. Therefore, once you read in themesh, it will be displayed in the embedded graphics window.
8-2 Release 12.0 c© ANSYS, Inc. March 12, 2009

Modeling Flow Through Porous Media
Step 1: Mesh
1. Read the mesh file (catalytic converter.msh).
File −→ Read −→Mesh...
2. Check the mesh.
General −→ Check
ANSYS FLUENT will perform various checks on the mesh and report the progressin the console. Make sure that the reported minimum volume is a positive number.
3. Scale the mesh.
General −→ Scale...
(a) Select mm from the Mesh Was Created In drop-down list.
(b) Click Scale.
(c) Select mm from the View Length Unit In drop-down list.
All dimensions will now be shown in millimeters.
(d) Close the Scale Mesh dialog box.
4. Check the mesh.
General −→ Check
Note: It is a good idea to check the mesh after you manipulate it (i.e., scale,convert to polyhedra, merge, separate, fuse, add zones, or smooth and swap.)This will ensure that the quality of the mesh has not been compromised.
Release 12.0 c© ANSYS, Inc. March 12, 2009 8-3

Modeling Flow Through Porous Media
5. Examine the mesh.
Rotate the view and zoom in to get the display shown in Figure 8.2.The hex meshon the geometry contains a total of 34,580 cells.
Figure 8.2: Mesh for the Catalytic Converter Geometry
Step 2: General Settings
General
1. Retain the default solver settings.
8-4 Release 12.0 c© ANSYS, Inc. March 12, 2009
Modeling Flow Through Porous Media
Step 3: Models
Models
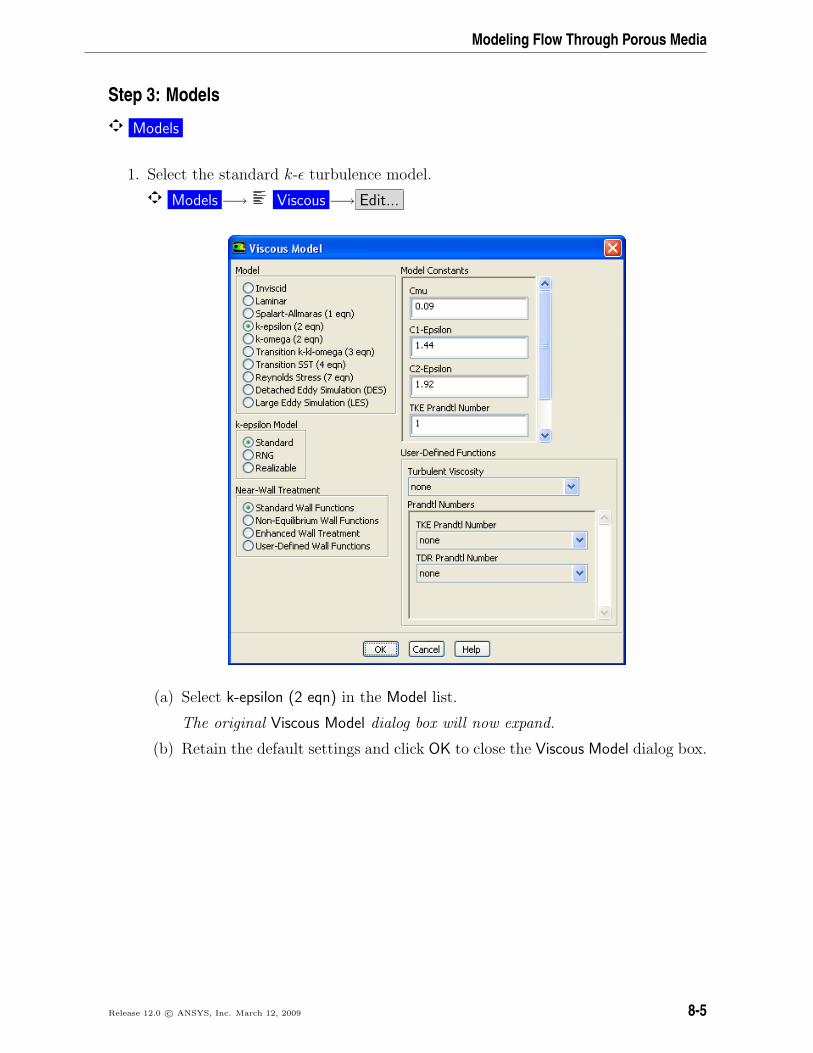
1. Select the standard k-ε turbulence model.
Models −→ Viscous −→ Edit...
(a) Select k-epsilon (2 eqn) in the Model list.
The original Viscous Model dialog box will now expand.
(b) Retain the default settings and click OK to close the Viscous Model dialog box.
Release 12.0 c© ANSYS, Inc. March 12, 2009 8-5

Modeling Flow Through Porous Media
Step 4: Materials
Materials
1. Add nitrogen to the list of fluid materials by copying it from the ANSYS FLUENTDatabase of materials.
Materials −→ air −→ Create/Edit...
(a) Click the ANSYS FLUENT Database... button to open the ANSYS FLUENTDatabase Materials dialog box.
8-6 Release 12.0 c© ANSYS, Inc. March 12, 2009

Modeling Flow Through Porous Media
i. Select nitrogen (n2) in the ANSYS FLUENT Fluid Materials selection list.
ii. Click Copy to copy the information for nitrogen to your list of fluid mate-rials.
iii. Close the ANSYS FLUENT Database Materials dialog box.
(b) Click Change/Create and close the Create/Edit Materials dialog box.
Release 12.0 c© ANSYS, Inc. March 12, 2009 8-7

Modeling Flow Through Porous Media
Step 5: Cell Zone Conditions
Cell Zone Conditions
8-8 Release 12.0 c© ANSYS, Inc. March 12, 2009

Modeling Flow Through Porous Media
1. Set the cell zone conditions for the fluid (fluid).
Cell Zone Conditions −→ fluid −→ Edit...
(a) Select nitrogen from the Material Name drop-down list.
(b) Click OK to close the Fluid dialog box.
Release 12.0 c© ANSYS, Inc. March 12, 2009 8-9

Modeling Flow Through Porous Media
2. Set the cell zone conditions for the substrate (substrate).
Cell Zone Conditions −→ substrate −→ Edit...
(a) Select nitrogen from the Material Name drop-down list.
(b) Enable Porous Zone to activate the porous zone model.
(c) Enable Laminar Zone to solve the flow in the porous zone without turbulence.
(d) Click the Porous Zone tab.
i. Make sure that the principal direction vectors are set as shown in Ta-ble 8.1.
ANSYS FLUENT automatically calculates the third (z-direction) vectorbased on your inputs for the first two vectors. The direction vectors deter-mine which axis the viscous and internal resistance coefficients act upon.
Axis Direction-1 Vector Direction-2 VectorX 1 0Y 0 1Z 0 0
Table 8.1: Values for the Principle Direction Vectors
Use the scroll bar to access the fields that are not initially visible in thedialog box.
8-10 Release 12.0 c© ANSYS, Inc. March 12, 2009

Modeling Flow Through Porous Media
ii. Enter the values in Table 8.2 for the Viscous Resistance and Inertial Resis-tance.
Direction-2 and Direction-3 are set to arbitrary large numbers. These val-ues are several orders of magnitude greater than that of Direction-1 flowand will make any radial flow insignificant.
Scroll down to access the fields that are not initially visible in the panel.
Direction Viscous Resistance Inertial Resistance(1/m2) (1/m)
Direction-1 3.846e+07 20.414
Direction-2 3.846e+10 20414
Direction-3 3.846e+10 20414
Table 8.2: Values for the Viscous and Inertial Resistance
(e) Click OK to close the Fluid dialog box.
Step 6: Boundary Conditions
Boundary Conditions
Release 12.0 c© ANSYS, Inc. March 12, 2009 8-11

Modeling Flow Through Porous Media
1. Set the velocity and turbulence boundary conditions at the inlet (inlet).
Boundary Conditions −→ inlet −→ Edit...
(a) Enter 22.6 m/s for Velocity Magnitude.
(b) Select Intensity and Hydraulic Diameter from the Specification Method drop-down list in the Turbulence group box.
(c) Retain the default value of 10% for the Turbulent Intensity.
(d) Enter 42 mm for the Hydraulic Diameter.
(e) Click OK to close the Velocity Inlet dialog box.
8-12 Release 12.0 c© ANSYS, Inc. March 12, 2009

Modeling Flow Through Porous Media
2. Set the boundary conditions at the outlet (outlet).
Boundary Conditions −→ outlet −→ Edit...
(a) Retain the default setting of 0 for Gauge Pressure.
(b) Select Intensity and Hydraulic Diameter from the Specification Method drop-down list in the Turbulence group box.
(c) Enter 5% for the Backflow Turbulent Intensity.
(d) Enter 42 mm for the Backflow Hydraulic Diameter.
(e) Click OK to close the Pressure Outlet dialog box.
3. Retain the default boundary conditions for the walls (substrate-wall and wall).
Release 12.0 c© ANSYS, Inc. March 12, 2009 8-13
Modeling Flow Through Porous Media
Step 7: Solution
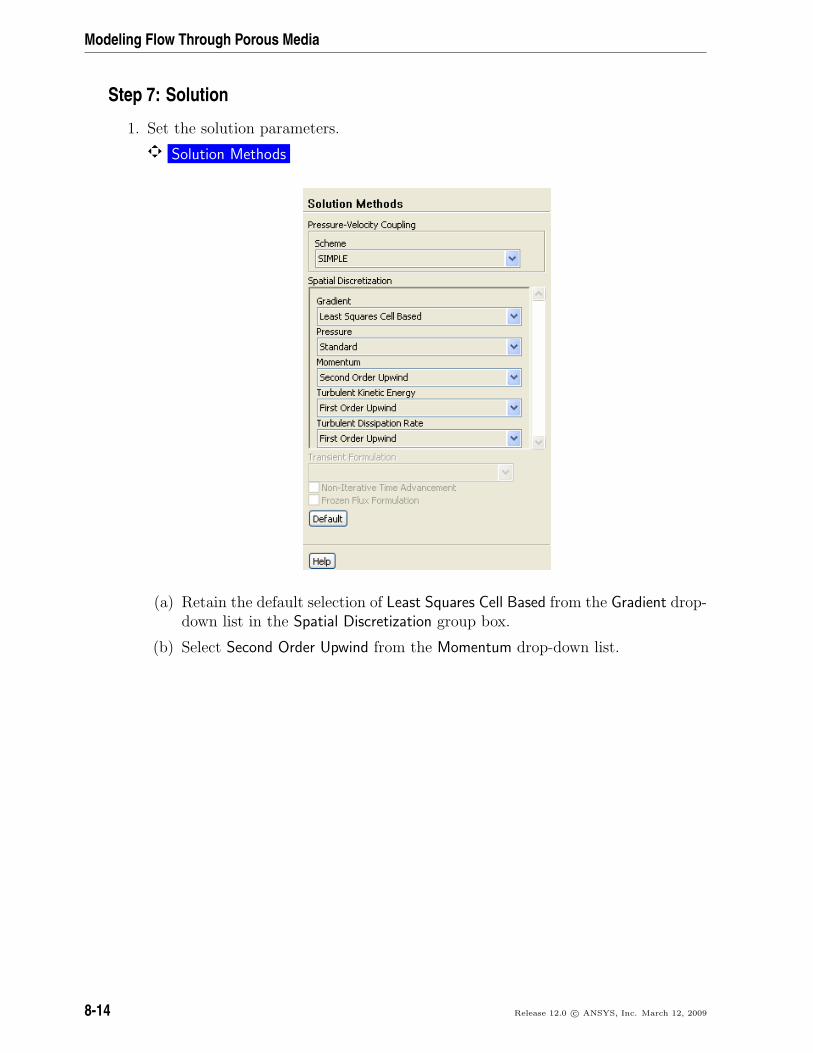
1. Set the solution parameters.
Solution Methods
(a) Retain the default selection of Least Squares Cell Based from the Gradient drop-down list in the Spatial Discretization group box.
(b) Select Second Order Upwind from the Momentum drop-down list.
8-14 Release 12.0 c© ANSYS, Inc. March 12, 2009
Modeling Flow Through Porous Media
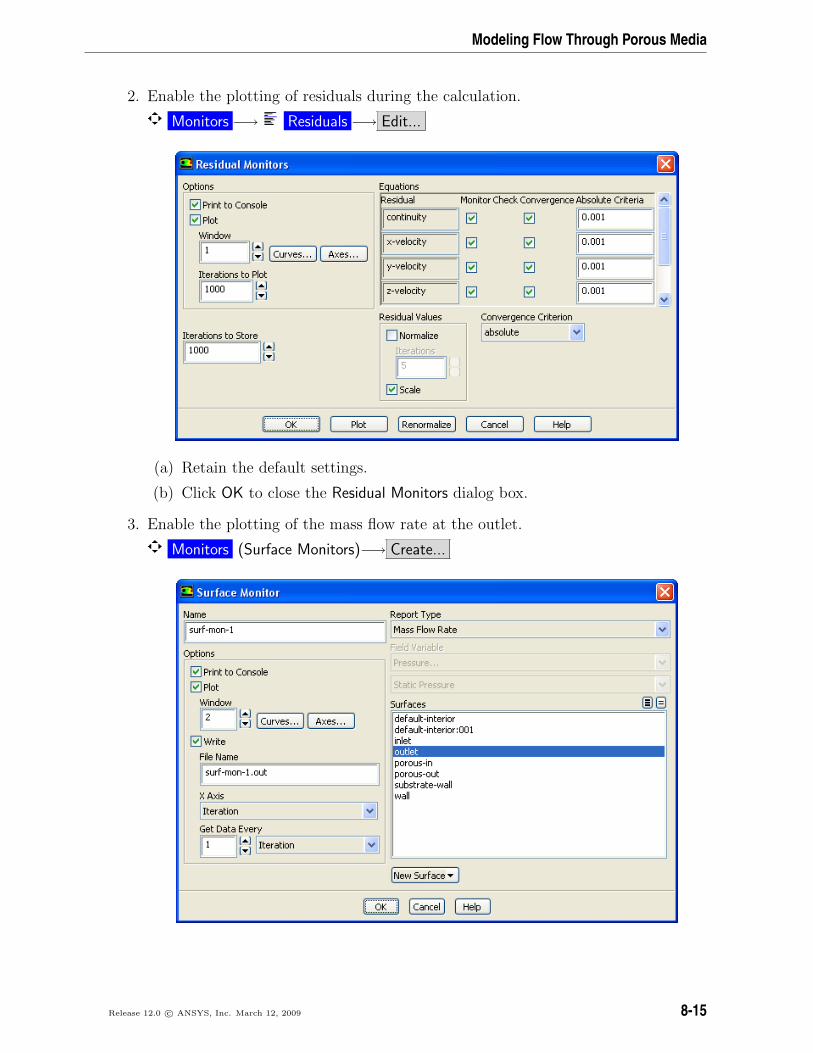
2. Enable the plotting of residuals during the calculation.
Monitors −→ Residuals −→ Edit...
(a) Retain the default settings.
(b) Click OK to close the Residual Monitors dialog box.
3. Enable the plotting of the mass flow rate at the outlet.
Monitors (Surface Monitors)−→ Create...
Release 12.0 c© ANSYS, Inc. March 12, 2009 8-15

Modeling Flow Through Porous Media
(a) Enable Plot and Write.
(b) Select Mass Flow Rate from the Report Type drop-down list.
(c) Select outlet in the Surfaces selection list.
(d) Click OK to close the Surface Monitor dialog box.
4. Initialize the solution from the inlet.
Solution Initialization
(a) Select inlet from the Compute From drop-down list.
(b) Click Initialize.
5. Save the case file (catalytic converter.cas).
File −→ Write −→Case...
8-16 Release 12.0 c© ANSYS, Inc. March 12, 2009
Modeling Flow Through Porous Media
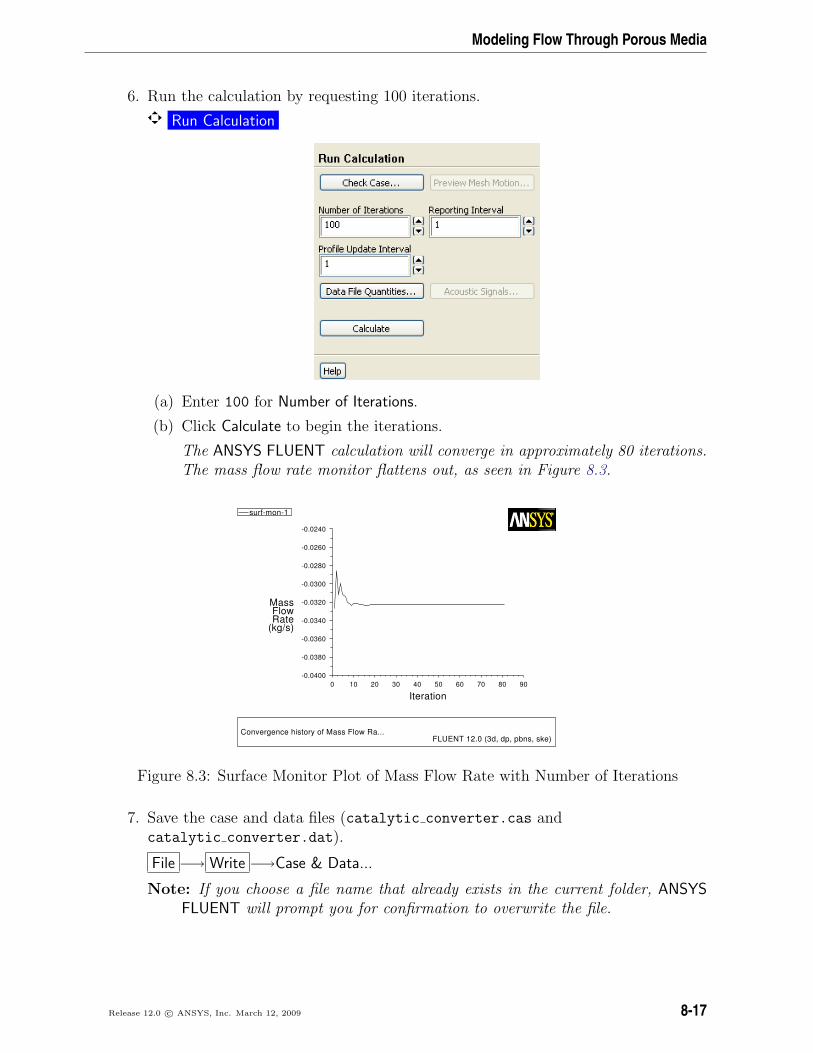
6. Run the calculation by requesting 100 iterations.
Run Calculation
(a) Enter 100 for Number of Iterations.
(b) Click Calculate to begin the iterations.
The ANSYS FLUENT calculation will converge in approximately 80 iterations.The mass flow rate monitor flattens out, as seen in Figure 8.3.
Convergence history of Mass Flow Ra...FLUENT 12.0 (3d, dp, pbns, ske)
Iteration
(kg/s)RateFlow
Mass
9080706050403020100
-0.0240
-0.0260
-0.0280
-0.0300
-0.0320
-0.0340
-0.0360
-0.0380
-0.0400
surf-mon-1
Figure 8.3: Surface Monitor Plot of Mass Flow Rate with Number of Iterations
7. Save the case and data files (catalytic converter.cas andcatalytic converter.dat).
File −→ Write −→Case & Data...
Note: If you choose a file name that already exists in the current folder, ANSYSFLUENT will prompt you for confirmation to overwrite the file.
Release 12.0 c© ANSYS, Inc. March 12, 2009 8-17

Modeling Flow Through Porous Media
Step 8: Postprocessing
1. Create a surface passing through the centerline for postprocessing purposes.
Surface −→Iso-Surface...
(a) Select Mesh... and Y-Coordinate from the Surface of Constant drop-down lists.
(b) Click Compute to calculate the Min and Max values.
(c) Retain the default value of 0 for Iso-Values.
(d) Enter y=0 for New Surface Name.
(e) Click Create.
Note: To interactively place the surface on your mesh, use the slider bar in theIso-Surface dialog box.
8-18 Release 12.0 c© ANSYS, Inc. March 12, 2009

Modeling Flow Through Porous Media
2. Create cross-sectional surfaces at locations on either side of the substrate, as wellas at its center.
Surface −→Iso-Surface...
(a) Select Mesh... and X-Coordinate from the Surface of Constant drop-down lists.
(b) Click Compute to calculate the Min and Max values.
(c) Enter 95 for Iso-Values.
(d) Enter x=95 for the New Surface Name.
(e) Click Create.
(f) In a similar manner, create surfaces named x=130 and x=165 with Iso-Valuesof 130 and 165, respectively.
(g) Close the Iso-Surface dialog box after all the surfaces have been created.
Release 12.0 c© ANSYS, Inc. March 12, 2009 8-19

Modeling Flow Through Porous Media
3. Create a line surface for the centerline of the porous media.
Surface −→Line/Rake...
(a) Enter the coordinates of the end points of the line in the End Points group boxas shown.
(b) Enter porous-cl for the New Surface Name.
(c) Click Create to create the surface.
(d) Close the Line/Rake Surface dialog box.
4. Display the two wall zones (substrate-wall and wall).
Graphics and Animations −→ Mesh −→ Set Up...
8-20 Release 12.0 c© ANSYS, Inc. March 12, 2009
Modeling Flow Through Porous Media
(a) Disable Edges and enable Faces in the Options group box.
(b) Deselect inlet and outlet in the Surfaces selection list, and make sure that onlysubstrate-wall and wall are selected.
(c) Click Display and close the Mesh Display dialog box.
(d) Rotate the view and zoom so that the display is similar to Figure 8.2.
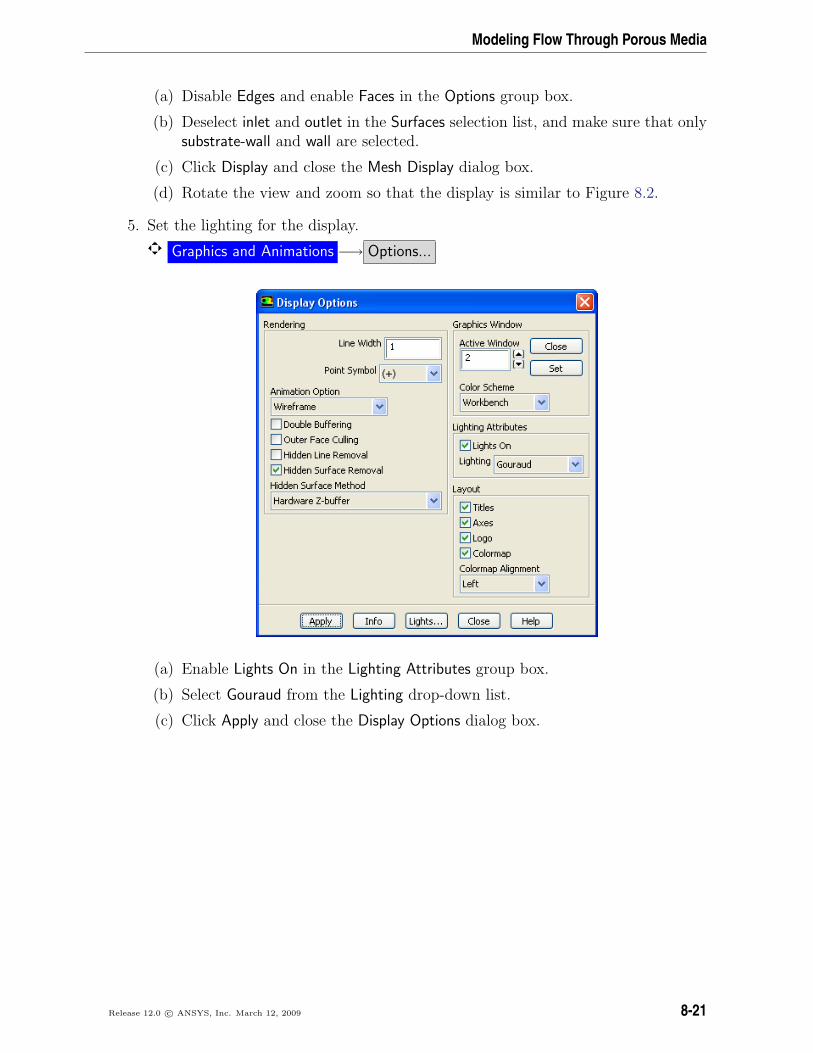
5. Set the lighting for the display.
Graphics and Animations −→ Options...
(a) Enable Lights On in the Lighting Attributes group box.
(b) Select Gouraud from the Lighting drop-down list.
(c) Click Apply and close the Display Options dialog box.
Release 12.0 c© ANSYS, Inc. March 12, 2009 8-21

Modeling Flow Through Porous Media
6. Set the transparency parameter for the wall zones (substrate-wall and wall).
Graphics and Animations −→ Scene...
(a) Select substrate-wall and wall in the Names selection list.
(b) Click the Display... button in the Geometry Attributes group box to open theDisplay Properties dialog box.
i. Make sure that Red, Green, and Blue sliders are set to the maximumposition (i.e. 255).
ii. Set the Transparency slider to 70.
iii. Click Apply and close the Display Properties dialog box.
(c) Click Apply and close the Scene Description dialog box.
8-22 Release 12.0 c© ANSYS, Inc. March 12, 2009

Modeling Flow Through Porous Media
7. Display velocity vectors on the y=0 surface (Figure 8.4).
Graphics and Animations −→ Vectors −→ Set Up...
(a) Enable Draw Mesh in the Options group box to open the Mesh Display dialogbox.
Release 12.0 c© ANSYS, Inc. March 12, 2009 8-23

Modeling Flow Through Porous Media
i. Make sure that substrate-wall and wall are selected in the Surfaces selectionlist.
ii. Click Display and close the Mesh Display dialog box.
(b) Enter 5 for Scale.
(c) Set Skip to 1.
(d) Select y=0 in the Surfaces selection list.
(e) Click Display and close the Vectors dialog box.
Figure 8.4: Velocity Vectors on the y=0 Plane
The flow pattern shows that the flow enters the catalytic converter as a jet, withrecirculation on either side of the jet. As it passes through the porous substrate, itdecelerates and straightens out, and exhibits a more uniform velocity distribution.This allows the metal catalyst present in the substrate to be more effective.
8-24 Release 12.0 c© ANSYS, Inc. March 12, 2009

Modeling Flow Through Porous Media
8. Display filled contours of static pressure on the y=0 plane (Figure 8.5).
Graphics and Animations −→ Contours −→ Set Up...
(a) Enable Filled in the Options group box.
(b) Enable Draw Mesh to open the Mesh Display dialog box.
i. Make sure that substrate-wall and wall are selected in the Surfaces selectionlist.
ii. Click Display and close the Mesh Display dialog box.
(c) Make sure that Pressure... and Static Pressure are selected from the Contoursof drop-down lists.
(d) Select y=0 in the Surfaces selection list.
(e) Click Display and close the Contours dialog box.
The pressure changes rapidly in the middle section, where the fluid velocity changesas it passes through the porous substrate. The pressure drop can be high, due to theinertial and viscous resistance of the porous media. Determining this pressure dropis one of the goals of the CFD analysis. In the next step, you will learn how to plotthe pressure drop along the centerline of the substrate.
Release 12.0 c© ANSYS, Inc. March 12, 2009 8-25
Modeling Flow Through Porous Media
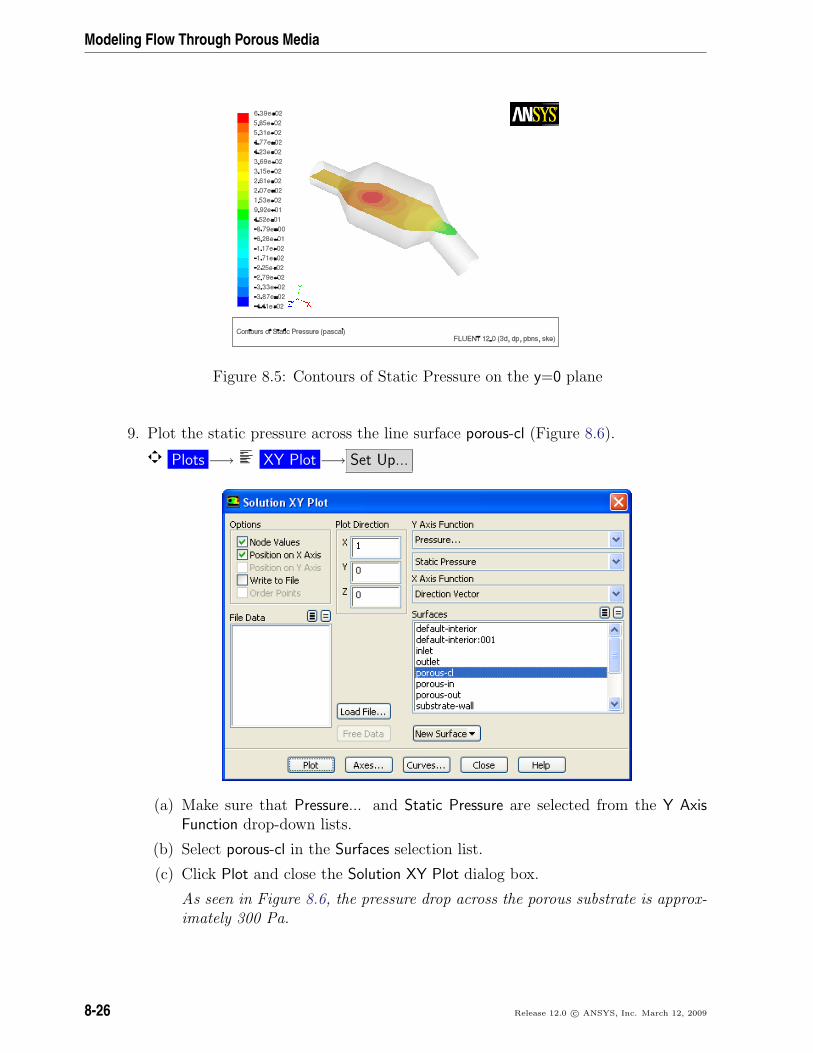
Figure 8.5: Contours of Static Pressure on the y=0 plane
9. Plot the static pressure across the line surface porous-cl (Figure 8.6).
Plots −→ XY Plot −→ Set Up...
(a) Make sure that Pressure... and Static Pressure are selected from the Y AxisFunction drop-down lists.
(b) Select porous-cl in the Surfaces selection list.
(c) Click Plot and close the Solution XY Plot dialog box.
As seen in Figure 8.6, the pressure drop across the porous substrate is approx-imately 300 Pa.
8-26 Release 12.0 c© ANSYS, Inc. March 12, 2009

Modeling Flow Through Porous Media
Figure 8.6: Plot of Static Pressure on the porous-cl Line Surface
10. Display filled contours of the velocity in the X direction on the x=95, x=130, andx=165 surfaces (Figure 8.7).
Graphics and Animations −→ Contours −→ Set Up...
(a) Enable Filled in the Options group box.
(b) Enable Draw Mesh to open the Mesh Display dialog box.
Release 12.0 c© ANSYS, Inc. March 12, 2009 8-27

Modeling Flow Through Porous Media
i. Make sure that substrate-wall and wall are selected in the Surfaces selectionlist.
ii. Click Display and close the Mesh Display dialog box.
(c) Disable Global Range in the Options group box.
(d) Select Velocity... and X Velocity from the Contours of drop-down lists.
(e) Select x=130, x=165, and x=95 in the Surfaces selection list.
(f) Click Display and close the Contours dialog box.
Figure 8.7: Contours of the X Velocity on the x=95, x=130, and x=165 Surfaces
The velocity profile becomes more uniform as the fluid passes through the porousmedia. The velocity is very high at the center (the area in red) just before thenitrogen enters the substrate and then decreases as it passes through and exits thesubstrate. The area in green, which corresponds to a moderate velocity, increasesin extent.
8-28 Release 12.0 c© ANSYS, Inc. March 12, 2009

Modeling Flow Through Porous Media
11. Use numerical reports to determine the average, minimum, and maximum of thevelocity distribution before and after the porous substrate.
Reports −→ Surface Integrals −→ Set Up...
(a) Select Mass-Weighted Average from the Report Type drop-down list.
(b) Select Velocity and X Velocity from the Field Variable drop-down lists.
(c) Select x=165 and x=95 in the Surfaces selection list.
(d) Click Compute.
(e) Select Facet Minimum from the Report Type drop-down list and click Compute.
(f) Select Facet Maximum from the Report Type drop-down list and click Compute.
The numerical report of average, maximum and minimum velocity can be seenin the main ANSYS FLUENT console.
(g) Close the Surface Integrals dialog box.
The spread between the average, maximum, and minimum values for X velocity gives thedegree to which the velocity distribution is non-uniform. You can also use these numbersto calculate the velocity ratio (i.e., the maximum velocity divided by the mean velocity)and the space velocity (i.e., the product of the mean velocity and the substrate length).
Custom field functions and UDFs can be also used to calculate more complex measuresof non-uniformity, such as the standard deviation and the gamma uniformity index.
Release 12.0 c© ANSYS, Inc. March 12, 2009 8-29

Modeling Flow Through Porous Media
Mass-Weighted AverageX Velocity (m/s)
-------------------------------- --------------------x=165 4.0038509x=95 5.2266927
---------------- --------------------Net 4.6102977
Minimum of Facet ValuesX Velocity (m/s)
-------------------------------- --------------------x=165 2.4261272x=95 0.31741163
---------------- --------------------Net 0.31741163
Maximum of Facet ValuesX Velocity (m/s)
-------------------------------- --------------------x=165 6.1665144x=95 7.7021732
---------------- --------------------Net 7.7021732
Summary
In this tutorial, you learned how to set up and solve a problem involving gas flow throughporous media in ANSYS FLUENT. You also learned how to perform appropriate postpro-cessing. Flow non-uniformities were rapidly discovered through images of velocity vectorsand pressure contours. Surface integrals and xy-plots provided purely numeric data.
For additional details about modeling flow through porous media (including heat transferand reaction modeling), see Section 7.2.3 in the separate User’s Guide.
Further Improvements
This tutorial guides you through the steps to reach an initial solution. You may be ableto obtain a more accurate solution by using an appropriate higher-order discretizationscheme and by adapting the mesh. Mesh adaption can also ensure that the solution isindependent of the mesh. These steps are demonstrated in Tutorial 1.
8-30 Release 12.0 c© ANSYS, Inc. March 12, 2009