Turning the Tables - Dante A. B. Iozzo · other and the virus through a stochastic compartmental...
20
Background Previous Work Our Model Results Concluding Remarks Turning the Tables Modeling the Fight Against Ebola Andrew T. Harris Dante A.B. Iozzo Nigel S. Michki SUNY at Buffalo August 8, 2015 1 / 16
Transcript of Turning the Tables - Dante A. B. Iozzo · other and the virus through a stochastic compartmental...

Background Previous Work Our Model Results Concluding Remarks
Turning the TablesModeling the Fight Against Ebola
Andrew T. HarrisDante A.B. IozzoNigel S. Michki
SUNY at Buffalo
August 8, 2015
1 / 16

Background Previous Work Our Model Results Concluding Remarks
The Ebola Outbreak in West Africa
Image from [1].
The 2014 West African Ebolaoutbreak was one of the worstglobal health crises of the lastthirty years.
Ebola has a rapid and uniqueprogression.
Unsanitary conditions and unsafehealth practices in this region werekey factors leading to theoutbreak.
2 / 16
Background Previous Work Our Model Results Concluding Remarks
MCM 2015 Problem A
The world medical association has announced that their new medi-cation could stop Ebola and cure patients whose disease is not ad-vanced. Build a realistic, sensible, and useful model that considers:
The spread of the disease
The quantity of the medicine needed
Possible feasible delivery systems (sending the medicine towhere it is needed)
Locations of delivery
Speed of manufacturing of the vaccine or drug
Any other critical factors your team considers necessary as partof the model to optimize the eradication of Ebola, or at leastits current strain.
3 / 16
Background Previous Work Our Model Results Concluding Remarks
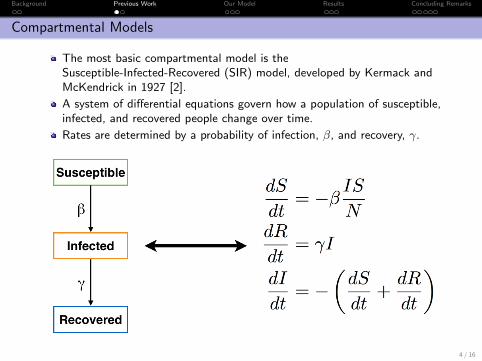
Compartmental Models
The most basic compartmental model is theSusceptible-Infected-Recovered (SIR) model, developed by Kermack andMcKendrick in 1927 [2].
A system of differential equations govern how a population of susceptible,infected, and recovered people change over time.
Rates are determined by a probability of infection, β, and recovery, γ.
4 / 16

Background Previous Work Our Model Results Concluding Remarks
GLEAM Simulator
GLEAM combines compartmentalmodels at the level of theindividual with transportationmodels and real world data [3].
The closed-source client had manyinternal parameters that could notbe modified:
Number of hospitalsHow doctors interact with themodelVaccine/medicine distribution
5 / 16

Background Previous Work Our Model Results Concluding Remarks
Multi-layer State Based Stochastic Model
We generalized GLEAM’smulti-layer approach to includesupport for cure and vaccinationpathways
Three layers: individuals, cities,and regions
“Individual” models arecompartmental“City” level enables modelingdynamics between separategroups“Region” level enables modelingdifferences in culture andpractice between regions
6 / 16

Background Previous Work Our Model Results Concluding Remarks
Individual Level
Individuals interact with eachother and the virus through astochastic compartmental model.
Various parameters were used todescribe the probability ofprogressing to a different stage ofthe disease.
These parameters are based off ofdata from Guinea, Liberia, andSierra Leone and characterize eachregion.
7 / 16
Background Previous Work Our Model Results Concluding Remarks
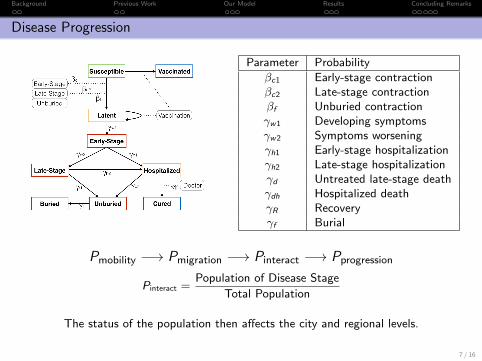
Disease Progression
Parameter Probabilityβc1 Early-stage contractionβc2 Late-stage contractionβf Unburied contractionγw1 Developing symptomsγw2 Symptoms worseningγh1 Early-stage hospitalizationγh2 Late-stage hospitalizationγd Untreated late-stage deathγdh Hospitalized deathγR Recoveryγf Burial
Pmobility −→ Pmigration −→ Pinteract −→ Pprogression
Pinteract =Population of Disease Stage
Total Population
The status of the population then affects the city and regional levels.
7 / 16
Background Previous Work Our Model Results Concluding Remarks
Regional and City Levels
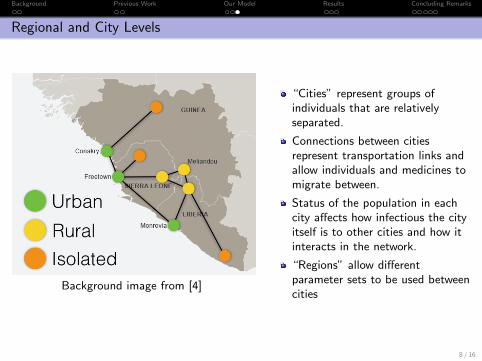
Background image from [4]
“Cities” represent groups ofindividuals that are relativelyseparated.
Connections between citiesrepresent transportation links andallow individuals and medicines tomigrate between.
Status of the population in eachcity affects how infectious the cityitself is to other cities and how itinteracts in the network.
“Regions” allow differentparameter sets to be used betweencities
8 / 16

Background Previous Work Our Model Results Concluding Remarks
Flare-out Effect
Figure: Top: 5% latent infected. Bottom: 20%latent infected.
Outbreaks tend todie-down as time goes on,even when the number ofinitial infected is increased.
This is to be expectedwhen a disease’s kill rate ishigher than its rate ofinfection.
This matches the behaviorof prior Ebola outbreaks.
9 / 16
Background Previous Work Our Model Results Concluding Remarks
Utility of Effective Quarantine
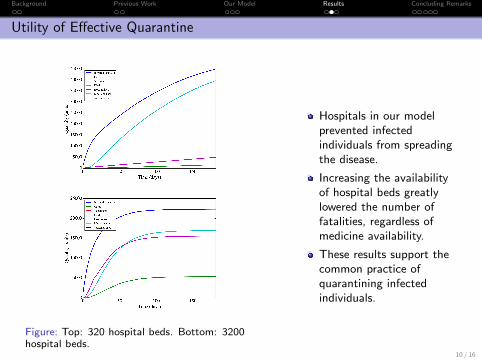
Figure: Top: 320 hospital beds. Bottom: 3200hospital beds.
Hospitals in our modelprevented infectedindividuals from spreadingthe disease.
Increasing the availabilityof hospital beds greatlylowered the number offatalities, regardless ofmedicine availability.
These results support thecommon practice ofquarantining infectedindividuals.
10 / 16

Background Previous Work Our Model Results Concluding Remarks
Overestimated Efficacy of Medicine
Figure: Top: Unlimited medicine available athospitals; 1-day cure time. Bottom: 1000 vaccinesdelivered to region every 5 days.
We assume that cureswould only beadministered in hospitals.
Outpatient treatment isnot a feasible optionwith medicines having arealistic multi-day curetime.
Even with an “ideal” cure,hospital beds remained abottleneck, leading to aminimal reduction inoverall fatalities.
Vaccines were ineffectivewhen delivered to theregion in realisticquantities.
11 / 16
Background Previous Work Our Model Results Concluding Remarks
Collecting Better Data
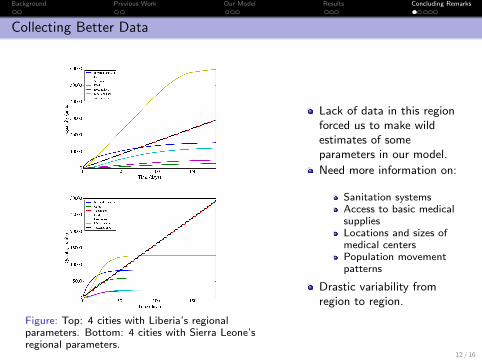
Figure: Top: 4 cities with Liberia’s regionalparameters. Bottom: 4 cities with Sierra Leone’sregional parameters.
Lack of data in this regionforced us to make wildestimates of someparameters in our model.
Need more information on:
Sanitation systemsAccess to basic medicalsuppliesLocations and sizes ofmedical centersPopulation movementpatterns
Drastic variability fromregion to region.
12 / 16

Background Previous Work Our Model Results Concluding Remarks
The Current State of the Ebola Outbreak
Figure: Total reported cases of Ebola in WestAfrica, from the WHO [5].
Ebola has been on thedecline in West Africasince early 2015.
This is without anycurative medicines orvaccines being delivered tothe region.
A vaccine currently indevelopment has shown tobe very effective atcombating the disease inhuman trials.
13 / 16

Background Previous Work Our Model Results Concluding Remarks
Summary
Modelling Ebola’s impact on a community is hindered by itscomplexity and the gross lack of data on sanitation and medicalinfrastructure in West Africa.
Our model predicts that Ebola epidemics tend to flare-out on theirown, as we have seen happen in West Africa.
Adding curative medicines and vaccines to combat an outbreak ofEbola has limited impact in realistic quantities.
Bolstering the medical infrastructure and implementing effectivequarantine strategies are the most important places for us to focusour efforts.
14 / 16

Background Previous Work Our Model Results Concluding Remarks
Acknowledgements
Dr. John Ringland & the UB Math Department
COMAP
MAA
Simulations made possible by Python, the PyPy interpreter, and theMatplotlib and Numpy libraries.
15 / 16

Background Previous Work Our Model Results Concluding Remarks
References I
[1] (2014, October). [Online]. Available:https://www.oxfam.org.au/2014/10/as-the-ebola-outbreak-spreads-heres-how-you-can-make-a-difference/
[2] A Contribution to the Mathematical Theory of Epidemics, vol. 115, no.772. Royal Society of London. Series A, Containing Papers of aMathematical and Physical Character, August 1927.
[3] GLEAMviz Simulator Client Manual, The Global Epidemic and MobilityModel.
[4] (2015, February) Ebola response roadmap. World Health Organization.[Online]. Available: http://maps.who.int/MapJournal/?appid=5b29178821dd4584b78dcb18d280326a
[5] (2015, July) Current state of the west africa ebola outbreak. WorldHealth Organization. [Online]. Available: http://www.cdc.gov/vhf/ebola/outbreaks/2014-west-africa/cumulative-cases-graphs.html
16 / 16

Background Previous Work Our Model Results Concluding Remarks
Gravity Transportation Model
Probability of population migration was based on a modified gravitymodel, in which population is the mass of a city
More massive cities (urban) draw people from the surrounding area.
Original gravity models resulted in “black hole” cities completely drainingthe population of the network.
A confidence factor, φ(t), was introduced which would “dissuade”individuals from migrating to overcrowded and understocked cities.
φ(t) = exp
[(Nbeds + Ndoctors) − (Ninfected + Nunburied)
Total Population
]
16 / 16
Background Previous Work Our Model Results Concluding Remarks
Implementation
Individuals, hospitals, and regions were represented in the computer asPython classes.
Individuals progressed from state-to-state stochastically according to ourcompartmental model.
Travel between regions was also stochastic and governed by our modifiedgravity model.
The PyPy interpreter was used to run our Python program, giving us anearly 8x speedup compared to the standard Python interpreter.
16 / 16

Background Previous Work Our Model Results Concluding Remarks
Our Differential Equations
The following equations can be used to describe the changes of state in ourcompartment model on a more rigorous mathematical basis:
16 / 16