TURKISH TOURISM INVESTORS ASSOCIATION Dr.OKTAY VARLIER Chairman of the Board.
24
TURKISH TOURISM INVESTORS ASSOCIATION Dr.OKTAY VARLIER Chairman of the Board
-
Upload
annis-stafford -
Category
Documents
-
view
218 -
download
1
Transcript of TURKISH TOURISM INVESTORS ASSOCIATION Dr.OKTAY VARLIER Chairman of the Board.

TURKISH TOURISM INVESTORS ASSOCIATION
Dr.OKTAY VARLIER Chairman of the Board

Turkish Tourism Investors Association
-Established in 1988
-185 members
-US$ 18 billions investment portfolio

-AccommodationAccommodation (over 200 thousand beds)
-MarinasMarinas
-YachtingYachting
-Tourism Oriented Land and Air TransportTourism Oriented Land and Air Transport
-Tour OperatingTour Operating
-Touristic Shopping CentersTouristic Shopping Centers
-Golf CoursesGolf Courses
-Entertainment and Recreation FacilitiesEntertainment and Recreation Facilities
-Turnkey Project DesignTurnkey Project Design
TYD Members have invested in :

KEY FACTS ABOUT TURKISH TOURISM
• World Tourism Organization ranks Turkey as the 8th largest tourism revenue earner in the world,in 2004.
• Great geographical advantage• -one quarter of the world population can be reached
within 4 hours flight time • Elements of success
- good balance between price and quality- high performance of Turkish tour operators abroad- charter flights of Turkish air carriers- expensive euro in recent years
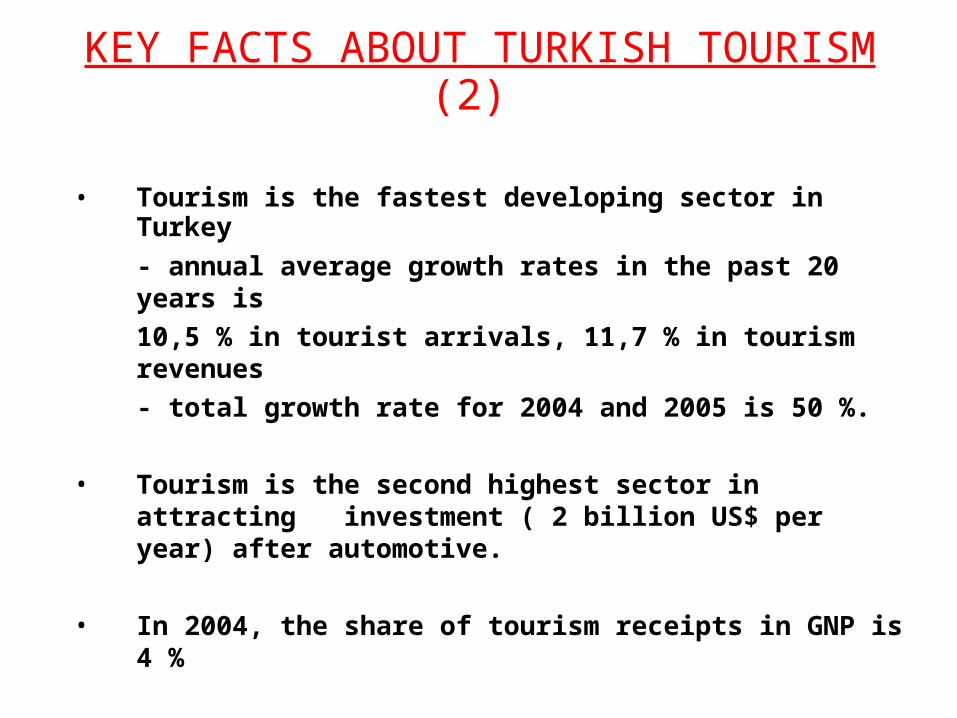
KEY FACTS ABOUT TURKISH TOURISM(2)
• Tourism is the fastest developing sector in Turkey
- annual average growth rates in the past 20 years is
10,5 % in tourist arrivals, 11,7 % in tourism revenues
- total growth rate for 2004 and 2005 is 50 %.
• Tourism is the second highest sector in attracting investment ( 2 billion US$ per year) after automotive.
• In 2004, the share of tourism receipts in GNP is 4 %
• 5% of the total employement in Turkey is in the tourism sector.
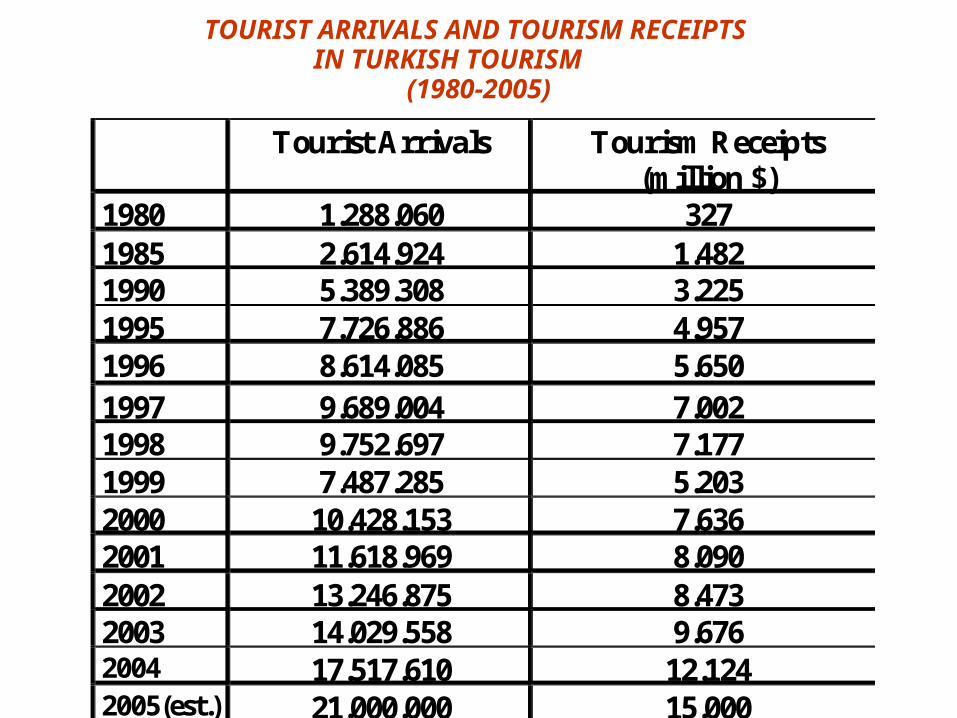
TOURIST ARRIVALS AND TOURISM RECEIPTS IN TURKISH TOURISM
(1980-2005)
Tourist Arrivals Tourism Receipts (million $)
1980 1.288.060 327 1985 2.614.924 1.482 1990 5.389.308 3.225 1995 7.726.886 4.957 1996 8.614.085 5.650 1997 9.689.004 7.002 1998 9.752.697 7.177 1999 7.487.285 5.203 2000 10.428.153 7.636 2001 11.618.969 8.090 2002 13.246.875 8.473 2003 14.029.558 9.676 2004 17.517.610 12.124 2005(est.) 21.000.000 15.000

Tourist Arrivals and Tourism Receipts in Turkish Tourism (1980-2004)
0
5.000
10.000
15.000
20.000
25.000
1980
1985
1990
1995
1996
1997
1998
1999
2000
2001
2002
2003
2004
2005
(est
)
Tourist Arrivals(thousand)
TourismReceipts (million$)

TOURIST ARRIVALS BY MAIN COUNTRIES OF NATIONALITY (2004)
Nationality Tourist Arrivals % ShareGermany 3.983.939 22,7
UIS 2.792.123 15,9United Kingdom 1.387.817 7,9
Bulgaria 1.309.885 7,5Netherlands 1.191.382 6,8
Iran 628.726 3,6France 548.858 3,1Greece 485.417 2,8Austria 455.863 2,6Belgium 426.971 2,4
Italy 318.097 1,8Israel 299.172 1,7
Main markets (2004)-EU countries ........................... 55 % -Union of Independent States .. 16 %(Russian Federation................... 9 %)-Asian countries...........................9 %-Israel is in the 12th place with 1,7 %

Tourist Arrivals By Main Countries of Nationality (2004)
22,7
15,9
7,9
7,5
6,8
3,6
3,1
2,8
2,6
2,4
1,8
1,7
Germany
UIS(former USSR)
United Kingdom
Bulgaria
Netherlands
Iran
France
Greece
Austria
Belgium
Italy
Israel

Tourist Arrivals By Region In The World(2004)
OECD61,7
Africa1,1
Other0,1Asia
9,3
Latin America0,2
East Europe27,6
OECD
East Europe
Asia
Africa
Latin America
Other

TOURIST ARRIVALS BY REGIONS IN THE WORLD (2004)
Tourist Arrivals
% Share
European Union (*)
9.594.968 54,8
OECD 10.806.760 61,7
East Europe 4.836.286 27,6 Asia 1.626.889 9,3
Africa 197.712 1,1 Latin America 30.737 0,2
Other 19.226 0,1 TOTAL 17.517.610 100,0
(*) (*) Arrivals from EU countries are included in OECD figures.Arrivals from EU countries are included in OECD figures.

REALIZED AVERAGE ANNUAL GROWTH RATES (1994-2004)
Tourist Arrivals Tourism RevenueTurkey 9,6% 14,0%World 3,4% 6,0%
In the past decade with regard to both tourist arrivals and tourism receipts Turkey’s growth rates are higher than the double of world average.

Realized Average Annual Growth Rates (1994-2004)
9,6%
3,4%
6,0%
14,0%
0,0%
2,0%
4,0%
6,0%
8,0%
10,0%
12,0%
14,0%
16,0%
Tourist Arrivals Tourism Revenue
Turkey World

Tourist Arrivals by Tourist Arrivals by Regions(2004)Regions(2004)Tourist Arrivals % Share
Antalya 6.050.000 35
Aegean Coast 3.500.000 20
Istanbul 3.500.000 20
•Antalya is the most visited tourism center with 35 % market share ,followed by Istanbul and Aegean Coast with 20 % each.

ACCOMMODATION CAPACITY (End of 2004)
Tourism Center Number of Beds % ShareAntalya 195.000 40,0
Aegean Coast 145.000 30,0Istanbul 60.000 13Others 80.000 17,0TOTAL 480.000 100
40 % of the accommodation capacity is in Antalya. Aegean Coast has
30 % and Istanbul 13 % of the total beds.

Tourist Arrivals by Means of Tourist Arrivals by Means of Transport (2004)Transport (2004)
Tourist Arrivals % Share
Air 12.576.000 71,8
Land 3.717.000 21,2
Sea 1.152.000 6,6
Train 73.000 0,4
In 2004, 72 % of tourists arrived by airlines, most of them carried by Turkish charter planes.

Public-Private Sector CooperationPublic-Private Sector Cooperation
• In Turkey , Belek Tourism Center is a perfect example of public-private sector coordination and considered as a good model of governance in tourism by international institutions.
• Belek region is on the Mediterranean coast and located 30 km. to the east of Antalya city center. Belek has 80-150 m. wide and 23km.long sandy beach with 300 days of sunshine.
• Belek was proclaimed tourism center by the Ministry of Tourism in 1984. First investors in Belek faced huge problems about infrastructure (infact no infrastructure was available when the lands were allocated to tourism investors)and decided to form a dynamic structure to overcome these problems with the cooperation of the public institutions. With this aim ,Belek Tourism Investors Union (BETUYAB) was established in 1989.With the leadership and coordination of BETUYAB infrastructure investments(roads,electricity and water supply,telecomunication,waste water treatment) were completed in the 1990s.
• Total expenditures for infrastructure are estimated to be around 400 million $,shared 1/3 by tourism investors, 1/3 by the Ministry of Tourism and 1/3 by other public institutions like municipalities, Ministry of Energy, Ministry of Public Works, etc.

Public-Private Sector Cooperation (2)Public-Private Sector Cooperation (2)
• Presently, there are 38 tourism facilites in Belek with 35.000 beds. They are 5 star hotels and 1st class holiday villages. All the facilities offer tennis courts, indoor and outdoor swimming pools, completely equipped health and fitness centers,restaurants,bars,kid clubs, play areas etc..
• The availability of large spectacular spaces suitable for golf and the temperate climate of the region create a greate potential for golf tourism. Presently there are 6 golf courses and 5 new golf courses are on construction. Belek is a candidate to be an important golf center at international standards.

2010 Targets2010 Targets
- 32 million tourists- 32 million tourists
- 27 billion $ tourism receipts- 27 billion $ tourism receipts
- 1 million bed capacity with international standards- 1 million bed capacity with international standards
Expected Investments Until 2010Expected Investments Until 2010
- 480.000 beds present capacity( int.standarts)480.000 beds present capacity( int.standarts)
- 100.000 beds on construction100.000 beds on construction
- 300.000 beds low quality beds to be modernized300.000 beds low quality beds to be modernized
- 120.000 beds to be built newly120.000 beds to be built newly

REASONS TO INVEST IN TURKISH TOURISM
• Unique geographical location • Large and dynamic sector with high growth potential• New, modern and quality oriented tourism establishments• High skilled, cost effective labour force• Low construction costs• Land allocation for tourism investors on 49 years lease base• Well developed infrastructure in tourism destinations• Highly liberalized exchange rate regime and foreign investment
regulation-No pre permits for foreign company establishment-No minimum capital requirement-Any form of company is acceptable-Company establishment in 2-3 days-Foreign and domestic investors are treated equally-Free transfer of profits

GOVERNMENT INCENTIVES FOR TOURISM INVESTMENTS
• Investment allowance
(40 % in developed, 80 % in underdeveloped regions).• Tax exemption on imported items.• VAT exemption on local machinery and equipment.• Tax duties and charges exemption on local purchases.• Land allocation on 49 year lease base.• Electricity and water consumption at the lowest available
price (during investment and operation periods)


TAXES
• Corporate Tax 30% (in 2006 20%)
• Value Added Tax 18%
• Income Tax 20-40%(in 2006 15-35%)

THANK YOU