Turkish Food Retail-EQUITIES - Bigparaf.bigpara.com/20151126_Turkish Consumers_HSBC.pdfSource: HSBC...
35
Disclaimer & Disclosures This report must be read with the disclosures and the analyst certifications in the Disclosure appendix, and with the Disclaimer, which forms part of it. Issuer of report: HSBC Yatirim Menkul Degerler A.S. View HSBC Global Research at: https://www.research.hsbc.com Lucrative growth potential still exists based on consolidation and growing share of modern retail But challenges such as rising employee costs will remain under the spotlights going forward Our highest conviction call is Migros (Buy, TP TRY22.5), which benefits from recovery in TRY. We reiterate Buy for BIM In this report we try to dig deeper into the Turkish organised food retail market. We touch base on ongoing sector trends and impacts from currency devaluation, high food inflation, rising share of employee costs, weak consumer confidence and consolidation. In order to better reflect and compare the trends in the Turkish food retail we have also included peer analysis including Russia and South Africa. The Turkish food retail space has grown at an astounding rate of c12% CAGR over the last 5 years. We think it continues to offer a host of opportunities for food retail players with relatively low c40% share of modern retail and only c18% market share for the top 5 players. At the same time, we think that the sector has its own challenges to tackle. The ratio of employee costs to sales has been increasing at an alarming pace in last 3 years. Turkish Retailers are currently facing a tougher challenge to sustain margins with the Government’s plan to hike the minimum wage level in the country by 30% in FY16. However, Turkish Retailers (especially leaders of their segments BIM and Migros) have so far successfully improved gross margins by putting more pressure on suppliers and kept other costs under control to compensate for this pressure. We find Migros to be our favourite stock among the covered Turkish food retail players. Migros not only benefits from faster expansion and higher LFL traffic growth but also is one of the most exposed to currency risk due to its EUR based loans; therefore recent strength in TRY against EUR based on a more positive outlook should be a positive catalyst for the shares. We also argue that Migros is likely to be one of the strongest candidates for consolidating smaller players in the sector in the long run. BIM’s high growth rate supported by strong LFL numbers and space expansion make it one of the clear winners in the industry for the next 2-3 year period. Its potential success in its new supermarket format and investments outside of Turkey might extend its high growth prospects to further years. Bizim benefitted from cost restructuring and growth driven by higher tobacco sales in FY15; however we think low like for like in main category sales remains as an issue and wage hikes in FY16 have the potential to delay the long awaited margin recovery. 26 November 2015 Bulent Yurdagul* Analyst HSBC Yatirim Menkul Degerler A.S. [email protected] +90 212 3764612 Neerav Agarwal* Associate, Bangalore * Employed by a non-US affiliate of HSBC Securities (USA) Inc, and is not registered/ qualified pursuant to FINRA regulations Turkish Food Retail EQUITIES CONSUMER BRANDS & RETAIL Turkey Turkey Food retailers Stock Ticker Rec CP __ TP ___ Upside/ New Old downside BIM BIMAS TI Buy 55.65 61.0 64.0 10% Bizim BIZIM TI Hold 13.15 13.9 14.0 6% Migros MGROS TI Buy 17.70 22.5 23.0 27% Source: HSBC estimates and Thomson Reuters Datastream Closing price in TRY as on 24 Nov 2015. Target prices in TRY. Structural growth to overcome near term challenges
Transcript of Turkish Food Retail-EQUITIES - Bigparaf.bigpara.com/20151126_Turkish Consumers_HSBC.pdfSource: HSBC...

Disclaimer & Disclosures This report must be read with the disclosures and the analyst certifications in the Disclosure appendix, and with the Disclaimer, which forms part of it.
Issuer of report: HSBC Yatirim Menkul Degerler A.S.
View HSBC Global Research at:
https://www.research.hsbc.com
Lucrative growth potential still exists based on consolidation
and growing share of modern retail
But challenges such as rising employee costs will remain under the spotlights going forward
Our highest conviction call is Migros (Buy, TP TRY22.5), which benefits from recovery in TRY. We reiterate Buy for BIM
In this report we try to dig deeper into the Turkish organised food retail market. We
touch base on ongoing sector trends and impacts from currency devaluation, high
food inflation, rising share of employee costs, weak consumer confidence and
consolidation. In order to better reflect and compare the trends in the Turkish food
retail we have also included peer analysis including Russia and South Africa.
The Turkish food retail space has grown at an astounding rate of c12% CAGR over
the last 5 years. We think it continues to offer a host of opportunities for food retail
players with relatively low c40% share of modern retail and only c18% market share
for the top 5 players. At the same time, we think that the sector has its own
challenges to tackle. The ratio of employee costs to sales has been increasing at an
alarming pace in last 3 years. Turkish Retailers are currently facing a tougher
challenge to sustain margins with the Government’s plan to hike the minimum wage
level in the country by 30% in FY16. However, Turkish Retailers (especially leaders
of their segments BIM and Migros) have so far successfully improved gross margins
by putting more pressure on suppliers and kept other costs under control to
compensate for this pressure.
We find Migros to be our favourite stock among the covered Turkish food retail
players. Migros not only benefits from faster expansion and higher LFL traffic growth
but also is one of the most exposed to currency risk due to its EUR based loans;
therefore recent strength in TRY against EUR based on a more positive outlook
should be a positive catalyst for the shares. We also argue that Migros is likely to be
one of the strongest candidates for consolidating smaller players in the sector in the
long run.
BIM’s high growth rate supported by strong LFL numbers and space expansion make
it one of the clear winners in the industry for the next 2-3 year period. Its potential
success in its new supermarket format and investments outside of Turkey might
extend its high growth prospects to further years. Bizim benefitted from cost
restructuring and growth driven by higher tobacco sales in FY15; however we think
low like for like in main category sales remains as an issue and wage hikes in FY16
have the potential to delay the long awaited margin recovery.
26 November 2015
Bulent Yurdagul* Analyst HSBC Yatirim Menkul Degerler A.S. [email protected] +90 212 3764612
Neerav Agarwal* Associate, Bangalore
* Employed by a non-US affiliate of HSBC Securities (USA) Inc, and is not registered/ qualified pursuant to FINRA regulations
Turkish Food Retail EQUITIES CONSUMER BRANDS & RETAIL
Turkey
Turkey Food retailers
Stock Ticker Rec CP __ TP ___ Upside/ New Old downside
BIM BIMAS TI Buy 55.65 61.0 64.0 10%Bizim BIZIM TI Hold 13.15 13.9 14.0 6%Migros MGROS TI Buy 17.70 22.5 23.0 27%Source: HSBC estimates and Thomson Reuters Datastream Closing price in TRY as on 24 Nov 2015. Target prices in TRY.
Structural growth to overcome near term challenges

abc
EQUITIES CONSUMER BRANDS & RETAIL
26 November 2015
2
Structural growth to overcome challenges 3
Lucrative growth in Turkey if you can manage the challenges well 3
Recovery in LFL growth 6
Rising staff expenses a concern… 8
Minimum wage in Turkey might increase sharply… 10
Rent expense pressure is comparatively limited in Turkey… 12
But pressure on margins continues 13
Growth and exit - consolidation in the industry plays on 15
Company Section 17
BIM 18
Bizim 22
Migros 26
Disclosure appendix 30
Disclaimer 34
Contents

abc
3
EQUITIES CONSUMER BRANDS & RETAIL
26 November 2015
Lucrative growth in Turkey if you can manage the challenges well
In this report we try to dig deeper into Turkish organised food retail market and find out the
reasons behind the changing industry landscape. We touch base on ongoing sector trends and
impacts from currency devaluation, high food inflation, potential significant wage hike in FY16,
rising share of employee costs, weak consumer confidence and consolidation. Apart from our
coverage universe - BIM, Bizim and Migros - we expand our analysis to include other names to
get a comprehensive view of organised food retail in Turkey. Further in order to better reflect
and compare the trends in the Turkish food retail we have also included peer analysis taking
Russia and South Africa as they have gone through a similar phase of currency devaluation and
high food inflation cycle.
Challenges may mask the sector attractiveness at times but what truly matters is the long-term
potential that is based on the fundamental drivers of the sector. Here, we are revisiting the
potential and opportunities that the food retail sector in Turkey has to offer in the longer-run and
we try to evaluate whether problems are serious enough to challenge growing modern retail.
Structural growth to
overcome challenges
Turkish food retail fundamentals remain strong supported by low penetration level of modern retail
Stronger sales growth likely in Turkey as food inflation remains high and like for like traffic increasing especially for selected players
Margin pressure from rising employee costs as well as intensifying competition are the key challenges for the industry
Lower penetration of modern food retail in Turkey compared to peer countries (FY14)
Value growth across broader food retail formats
Source: Euromonitor, HSBC calculations , company reports Source: Euromonitor, HSBC calculations
89%
83%
81%
77%
70%
64%
37%
0%
20%
40%
60%
80%
100%
UK
Ger
man
y
Fran
ce
Pola
nd
Sout
h Af
rica
Russ
ia
Turk
ey
-10%
0%
10%
20%
30%
2010 2011 2012 2013 2014Small Modern Large Modern Trad it ional

abc
EQUITIES CONSUMER BRANDS & RETAIL
26 November 2015
4
First, we looked at the modern retail penetration level in Turkey which we believe is still
very low and has some way to go before it catches up with that of peer countries like
Russia and South Africa. This implies Turkey should continue to see higher growth in
organised retail along similar lines to what we have witnessed in the last 5 years. At a 5-year
CAGR of 24.5% small format stores (discounters and convenience) continue to expand rapidly
across the country driving up the growth in modern food retail. Euromonitor estimates the
penetration level to reach 42% by 2016e (from 37% currently) and further to 48% by 2019e.
This clearly highlights the significant growth potential that exists in this sector.
Second, within modern food retail, discounters and convenience stores are the fastest
growing formats in Turkey. Discounters form 31% of the total modern retail as of FY14 (from
21% in 2010) and are challenging the supermarket share in the organised market. Though
supermarkets continue to have a bigger piece of the pie, their overall share has fallen from 66%
of the organised market (in 2010) to 54% in 2014. On the other hand, convenience stores form
a small fraction of the organised market (less than 10%) but have gained importance over the
last three years with y-o-y growth rate averaging even higher than discounters. Supermarket
players like Migros and CarrefourSA are increasingly focusing on smaller format convenience
stores to gain a foot-hold in this growing market.
However, as we pointed out earlier in our 21 October 2014 report Four By Four in 2020 we believe
discounters will continue their dominance of Turkish food retail in coming years, before the rising
income level drives up the consumer towards greater choices and better shopping experiences.
Even then we believe the discounters would adapt and diversify their network into convenience or
supermarket formats based on location and income levels. Leading discounter BIM’s entry into
discount supermarket stores called ‘FILE’ is a welcoming sign of the same.
Modern food retail breakdown by formats Value growth in modern food retail formats
Source: Euromonitor, HSBC estimates Source: Euromonitor, HSBC calculations
Third, between supermarkets and discounters it is quite evident that discounters have
grown by leaps and bounds in Turkey whereas supermarkets struggle to keep up. The
attractiveness of discounters to customers becomes clear if we look at their increasing sales per
18% 21% 25% 27% 29% 31% 34% 37%
69% 66% 62% 59% 57% 54% 51% 48%
0%
25%
50%
75%
100%
2009 2010 2011 2012 2013 2014 2015e 2016eConvenience & Forecourt HypermarketsSupermarkets Discounters
0%
10%
20%
30%
40%
50%
2010 2011 2012 2013 2014Discounters SupermarketsHypermarke ts Convenience & Forecourt
Supermarket players like Migros and CarrefourSA are focusing on smaller formats convenience to make a foot-hold in this growing market
Market share movement of discounters and supermarkets
Sales per outlet growth trend for discounters and supermarkets
Source: Euromonitor, HSBC estimates Source: Euromonitor, HSBC calculations
Discount stores preferred by consumers due to lower pricing, location and quality private label products
0%
5%
10%
15%
20%
25%
2010 2011 2012 2013 2014 2015e 2016eDiscounters Supermarkets
-0.6%
0.0%
0.6%
1.2%
1.8%
2.4%
0%
3%
6%
9%
12%
15%
2010 2011 2012 2013 2014Discounters Supermarkets (rhs)

abc
5
EQUITIES CONSUMER BRANDS & RETAIL
26 November 2015
outlet. Discounters sales per outlet have grown at a y-o-y rate of over 10% in the last two years
compared to 1% for supermarkets. We see discount stores being preferred by consumers due
to factors like lower pricing (10-20% lower than supermarkets), location (generally in high
population density areas) and high quality private label products.
15% Market share of top 5 players in Turkey
Fourth, the fragmented nature of the Turkish food retail sector makes it highly attractive
for growth via consolidation. The top 5 players in Turkey have a market share of only 15% as
compared to +60% in western countries and South Africa. The top 5 players have nearly
doubled their market share since 2010 via expansion of store network (like BIM and Migros) and
acquisitions (like Yildiz Holding and Carrefoursa). We believe there is ample scope for these
players to further increase their market share via both the above mentioned channels.
Top 5 players form only 15% of organised food retail in Turkey (2014)
But top 5 players growing much faster than any other segment in Turkey Retail
Source: Euromonitor, HSBC estimates , Company reports Source: Euromonitor, HSBC estimates
To further test our point on consolidation we analysed the movement in market share of big
market players. We see that the big players in market now forms c.46% of the organised retail
market, up by 9 pp from 2010 level. Yes, most of the movement is due to the aggressive
expansion by these players but acquisitions like that of DIA and SOK by Yildiz also have a role
to play. Interestingly the share of major alcohol selling retailers in the organised market has
gone down over the years. This we believe is a result of non-alcohol selling players like BIM and
A101 (discounters) capturing market share faster than the alcohol selling players (mostly
69%
61%
61%
60%
47%
20%
15%
0%
20%
40%
60%
80%
Ger
man
y
Fran
ce UK
Sout
h Af
rica
Pola
nd
Russ
ia
Turk
ey
8%10%
11%13%
15%
0%
3%
6%
9%
12%
15%
18%
2010 2011 2012 2013 2014
BIM MigrosA101 YildizCarrefourSA
Turkey’s top 5 have one fourth of their peers’ market share in developed countries
Among Top 5, BIM market share increased in Turkey
Share of alcohol selling retailers declining in organised retail market
Source: Euromonitor, HSBC calculations * BIM, A101, Migros, Yildiz, CarrefourSA, Kipa and Anadolu; ^ Kiler share included in CarrefourSA
Source: Euromonitor, HSBC calculations
37% 39% 42% 44% 46%
0%
10%
20%
30%
40%
50%
2010 2011 2012 2013 2014
22%19% 19% 18% 17%
0%
5%
10%
15%
20%
25%
2010 2011 2012 2013 2014

abc
EQUITIES CONSUMER BRANDS & RETAIL
26 November 2015
6
supermarkets and hypermarkets). Another factor could be that foreign players have formed the
major alcohol selling retailers in Turkey and they have been finding it increasingly difficult to
match the pace of expansion of domestic retailers. A few have exited the Turkish market or cut
their shareholding level or are considering doing so, thus bringing down the share of alcohol
selling retailers. This implies that non-alcohol selling retailers have better growth prospects as
organized segment capture share from traditional segment, which is less focussed on alcohol
products, especially in eastern part of Turkey.
Having taken a look at the key fundamental factors shaping the Turkish food retail landscape,
we dig into the recent trends observed among the food retail companies in Turkey. We look at
key drivers for growth, margins and consolidation in the industry below.
Recovery in LFL growth
Like-for-like metrics show a holistic view of the growth patterns of a food retail company. In 2014
we have seen a stronger LFL growth for most of the food retailers predominantly due to
favourable impact from high food inflation level. Among peer countries, Russia leads the way
with LFL at 12.5% (rising from 4.3% in 2013) followed by Turkey which registered an 8.8% LFL
growth compared to 6.3% in 2013. South Africa also shows an improvement from 3.6% in 2013
to 5.0% in 2014. Trends in 9M15 results were also similar with inflation zooming ahead in
Russia and slightly moderating in Turkey and South Africa. Therefore, in our view 2015 will see
an even stronger LFL growth for food retailers in general.
LFL growth trends Quarterly inflation trend
Source: Company, HSBC calculations Source: Datastream, HSBC estimates
Within Turkey LFL growth was strongest for CarrefourSA in 2014 marked by a successful
turnaround of its operations. The Company had to post negative growth in FY15 also because
of a strong base. Among the covered companies, BIM continues to show a strong LFL number
after a marginal dip in 2013. As we argued earlier in our report Four for Four in 2020 that
discounters are the best format for growth in Turkey, we believe BIM as well as other
discounters will have a stronger growth prospect over other food retailers in Turkey. The 11.5%
LFL growth during the first nine months of 2015 supports our point of view. Furthermore, it’s
interesting to note that despite pressure from increasing competition (A101 and Sok), higher
space growth (c.500 store openings in 2014) and related cannibalisation of sales, the company
has been able to sustain a robust real LFL growth trend over the last 2 years.
For Migros it was the change in strategy that helped the company to post better growth
numbers. The company started focusing more and more on smaller format stores (Mjet) and
expanded rapidly, capitalising on the convenience market space opportunity. Its supermarket
stores also performed in-line with last year capitalising on the trust that it has built over a long
history in Turkey together with strong improvement in product portfolio and competitive pricing
strategy especially on SKUs that are available in discounters. Together with increasing space
-10%
0%
10%
20%
Bizim
Tesc
o Ki
pa
Kile
r*
Sout
h Af
rica
Mig
ros
Turk
ey^
BIM
Russ
ia
Carre
four
sa
2012 2013 2014 9M 15
Migros started focusing more and more on smaller format stores and expanded rapidly

abc
7
EQUITIES CONSUMER BRANDS & RETAIL
26 November 2015
growth, the Company started posting +15% top line growth levels in recent quarters, which is
quite a success within the supermarket universe.
Bizim on the other hand fared poorly during the last year due to restrictions on credit card
transactions and overall tougher environment for wholesalers. However, the company has since
then bounced back with a stronger LFL growth of 9.5% in 9M15. Exceptional growth in tobacco
business along with marginal recovery in main category sales has been the primary driving
force for Bizim this year.
LFL alone is not sufficient to measure the overall growth trend of food retailers. It’s equally
imperative to focus on the trends in selling space metrics also. If we look at selling space
growth, Russia witnessed the strongest growth as top food retailers expanded aggressively in
the country. Turkey, though relatively lower in space growth as compared to Russia, has seen
strong expansion from key players like BIM and A101 in discounters, Migros and Carrefoursa in
convenience supermarket and Bizim in wholesale market over 2012-14. On average, every year
more than 3000 stores have been added to the modern retail segment in the last three years
and the pace continues to increase during YTD 2015.
Average space growth (LTM %) Number of stores added in modern retail space in Turkey
Source: HSBC estimates, * acquired by CarrefourSA in FY15 Source: Euromonitor
However, average sales per sqm Turkey continues to lag behind that of Russia and South
Africa as the basket size and value of goods are comparatively higher in these countries as
Turkey’s modern retail is now more skewed towards discounters. In the Turkish market Bizim
has higher sales per sqm as it realizes much higher volumes due to its wholesale business
model. Higher sales per sqm vs. supermarkets outline the popularity of BIM among Turkish
customers as well as effectiveness of its format. In general, discounters SKUs are priced
considerably lower than supermarkets but due to higher volumes and smaller space
requirement they see higher sales revenues per sqm of their space. Within supermarkets clearly
Migros leads with a higher sales per sqm compared to peers. Its dominant position in
supermarket space along with increasing contribution from smaller format convenience stores
are the key factors that supports Migros sales number. More importantly both BIM and Migros
achieve 7-8% sales per sqm growth, which is almost equal to internal inflation of these
companies, indicating a healthy space expansion strategy.
-10% -5% 0% 5% 10% 15% 20% 25%
Tesco KipaKiler*Bizim
South AfricaMigrosTurkey
BIMCarrefoursa
Russia
0500
1000150020002500300035004000
2010 2011 2012 2013 2014

abc
EQUITIES CONSUMER BRANDS & RETAIL
26 November 2015
8
LTM Sales per sqm (USD) (6M 2015) Sales per sqm growth (LTM)
Source: HSBC estimates, * acquired by CarrefourSA, Source: HSBC calculations
In our opinion discounters should see the highest space growth in the next 2-3 years closely
followed by convenience operators. Within our coverage stocks, we believe BIM has a clear
advantage due to its strong pricing power (thanks to higher private label share) and faster store
expansion in the market but Migros also well positioned for convenience format growth.
Rising staff expenses a concern…
Over the last three years average employee cost to sales for Turkish food retailers has
increased considerably and currently stands at c.8% of sales. One of the primary factors that
are driving up the growth in employee cost is the high wage inflation level prevailing in the
country as well as lack of enough personnel to hire. Turkey’s nominal wage inflation in 2014
was 14% and remained high at c12% in 2015. The high inflation rate along with minimum wage
hike as seen in 2014 and 2015 have continuously put pressure on the employee cost for food
retailers in the region. We believe the trend will continue to play out in the medium term and
could mean further increases in staff cost over the next 2-3 years.
Wage inflation (nominal) Employee growth trends in Turkish Retail
Source: HSBC estimates Source: HSBC calculations
- 2,000 4,000 6,000 8,000
Kiler*Tesco KipaCarrefoursa
MigrosTurkey
BIMSouth Africa
RussiaBizim
-15%
-10%
-5%
0%
5%
10%
0%
2%
4%
6%
8%
10%
Mar
-13
Jun-
13
Sep-
13
Dec-
13
Mar
-14
Jun-
14
Sep-
14
Dec-
14
Mar
-15
Jun-
15
Sep-
15
BIM Migros Bizim (rhs)
0%
5%
10%
15%
20%
2010 2011 2012 2013 2014 2015e 2016eTurkey Russia South Africa
-1.5%
-1.0%
-0.5%
0.0%
0.5%
1.0%
0%
2%
4%
6%
8%
10%
Mar
-13
Jun-
13
Sep-
13
Dec-
13
Mar
-14
Jun-
14
Sep-
14
Dec-
14
Mar
-15
Jun-
15
Sep-
15
Average employee growthEmployee per sqm growth (rhs)
Turkey’s nominal wage inflation in 2014 was 14% and remained high at c12% in 2015 yoy

abc
9
EQUITIES CONSUMER BRANDS & RETAIL
26 November 2015
However, wage inflation is not the only thing that is putting pressure on margins here. The
heightened expansion of stores in Turkey from all the major players is also adding to the cost
side pressure. More than 3,000 stores were added in Turkey in 2014 with a similar number
expected to come online in 2015. This has led to a significant increase in demand for store
personnel’s over the last 2 years. We saw a c.9% increase in employees in the Turkish food
retail market during LTM (June 2015) with the majority of it resulting from the high rate of
expansion from players like BIM, Migros and Carrefoursa. As we are continuing to see a higher
number of stores opening up each year, we believe food retailers could find it increasingly
difficult to hire store personnel at inflation-adjusted wage levels.
The third trend which we would like to highlight is the employees per thousand square metre of
food retail space in Turkey. Employee per thousand sqm continues to decline since mid of 2013
due to rapid expansion in the industry leading to higher space growth. Though the rate of
decline has slowed down a bit, we believe with greater pressure from wage inflation the trend
should continue in medium term. With another minimum wage hike in news, we believe the
retail players would focus on increasing their employee efficiency and could lead to a further
drop in employees per sqm level.
If we look at the peer country level, South Africa has shown a relatively stable employee cost to
sales ratio which is more or less explained by the steady wage inflation in the country. On the
other hand Russia shows a declining employee cost to sales supported by drop in real wage
inflation level and store personnel optimisation by some of the players. This is in contrast with
Turkey where this metric shows a consistent increase over the years.
Within Turkey itself, there are different growth patterns in employee costs which we believe is
dependent on the pace of expansion and the store formats of the companies. Bizim for example
have a lower staff cost to sales on account of it being in wholesale business where volumes are
much higher than supermarkets and discount stores. On the other hand BIM has seen one of
the strongest growth rates in number of personnel’s which directly maps to its higher opening of
stores in last two year. In order to compare the growth in staff cost we looked at per employee
costs (inflation adjusted) for food retailers in the country. To our surprise CarrefourSa emerged
as the best performer in this metric but we believe this to be a temporary blip as the company
has been actively involved in acquisitions recently which have skewed the data points for the
first half of 2015.
Employee costs to sales – Turkey growing faster than others
Employee cost to sales (LTM)
Source: HSBC calculations Source: HSBC calculations, * acquired by CarrefourSA,
Employees per thousand sqm continues to decline since mid of 2013…. …though the rate of decline has slowed down a bit, we believe with greater pressure from wage inflation the trend should continue in medium term
8.5%
9.0%
9.5%
10.0%
10.5%
11.0%
7.0%
7.2%
7.4%
7.6%
7.8%
8.0%
8.2%
Q1
13
Q2
13
Q3
13
Q4
13
Q1
14
Q2
14
Q3
14
Q4
14
Q1
15
Q2
15
Q3
15
Turkey S. Africa Russia (rhs)
0% 3% 6% 9% 12% 15%
BizimBIM
TurkeySouth Africa
Kiler*MigrosRussia
CarrefoursaTesco Kipa

abc
EQUITIES CONSUMER BRANDS & RETAIL
26 November 2015
10
Per employee cost growth (inflation adjusted LTM average)
Per employee costs growth trend (LTM)
Source: HSBC calculations Source: HSBC calculations
From the point of view of our covered stocks, BIM remains the winner by far, which, despite
continued store expansion has managed to control its costs structure. BIM per employee costs
growth (inflation adjusted) was limited to c.1%, better than Turkey’s average of 1.5%. Migros on
the other has a slightly higher employee costs growth due to its store formats (supermarkets
has a higher cost structure for employees) and rapid expansion across Turkey.
Minimum wage in Turkey might increase sharply…
The Turkish Government is planning to a significant rise in minimum wage at a degree of 30%,
which is more than triple of the average CPI in the country, as a result of the pledges given to
the public ahead of the recently realized general elections. While we have assumed c17% rise
for employee wages for FY16e, if the Government looks for an imminent 30% rise in January
2016, we think retailers will feel further impacts on their margins. We think they will be reflecting
the cost increases to their prices after a period of time. However, FY16 margins may be
negatively affected by this. As demonstrated in the charts on next page we think that an
additional 20% increase in wages (compared to our base case), will have the potential to cut
25% and 32% of FY16 EBITDA estimates for BIM and Migros, respectively.
-6%
-4%
-2% 0% 2% 4% 6% 8%
CarrefoursaRussia
South AfricaBIM
Tesco KipaTurkey
BizimMigros
Kiler*
5%
7%
9%
11%
13%
15%
Mar
-13
Jun-
13
Sep-
13
Dec-
13
Mar
-14
Jun-
14
Sep-
14
Dec-
14
Mar
-15
Jun-
15
Sep-
15
BIM Bizim Migros
Minimum wage increasing much faster than CPI for the last 10 years …
…BIM’s average wage costs do not reflect this precisely but still feel the pressure
Source: Turkstat
Source: Turkstat and BIM reports
0%
5%
10%
15%
20%
25%
2006
2007
2008
2009
2010
2011
2012
2013
2014
2015
Turkey - CPI Turkey - Min. Wage Inc.
0%
10%
20%
30%
2006
2007
2008
2009
2010
2011
2012
2013
2014
2015
Turkey - Min. Wage Inc.BIM Avg. Wage Cost Inc. Per Employee

abc
11
EQUITIES CONSUMER BRANDS & RETAIL
26 November 2015
Impact of 5% additional wage hike on Turkish food retailers EBITDA*
Impact of 10% additional wage hike on Turkish food retailer EBITDA*
Source: Company reports and HSBC estimates * assuming that companies do not increase prices to reflect the cost push
Source: Company reports and HSBC estimates * assuming that companies do not increase prices to reflect the cost pus
BIM EBITDA margin was down by 91bps in FY08 when minimum wage was increased by 20% - almost double of the inflation in that year
Source: Turkstat and BIM reports
-7% impact on
FY16e EBITDA
-9% impact on
FY16eEBITDA
-6% impact on
FY16eEBITDA
0 300 600 900 1,200 1,500 1,800 2,100
BIM
Migros
Bizim
Employee Costs Expected for FY16e (TRYm)Additional Cost Burden from 10% Real Inc. In Wages
-14% impact on
FY16eEBITDA
-18% impact on
FY16eEBITDA
-13% impact on
FY16e EBITDA
0 300 600 900 1,200 1,500 1,800 2,100
BIM
Migros
Bizim
Employee Costs for FY16e EBITDA after 10% add.hike (TRYm)Impact on FY16e EBITDA from 10% add. Hike
-150
-100
-50
0
50
100
150
200
0%
5%
10%
15%
20%
25%
2006 2007 2008 2009 2010 2011 2012 2013 2014 2015
Turkey - Min. Wage Inc. BIM EBITDA Marg. Chg
abc
EQUITIES CONSUMER BRANDS & RETAIL
26 November 2015
12
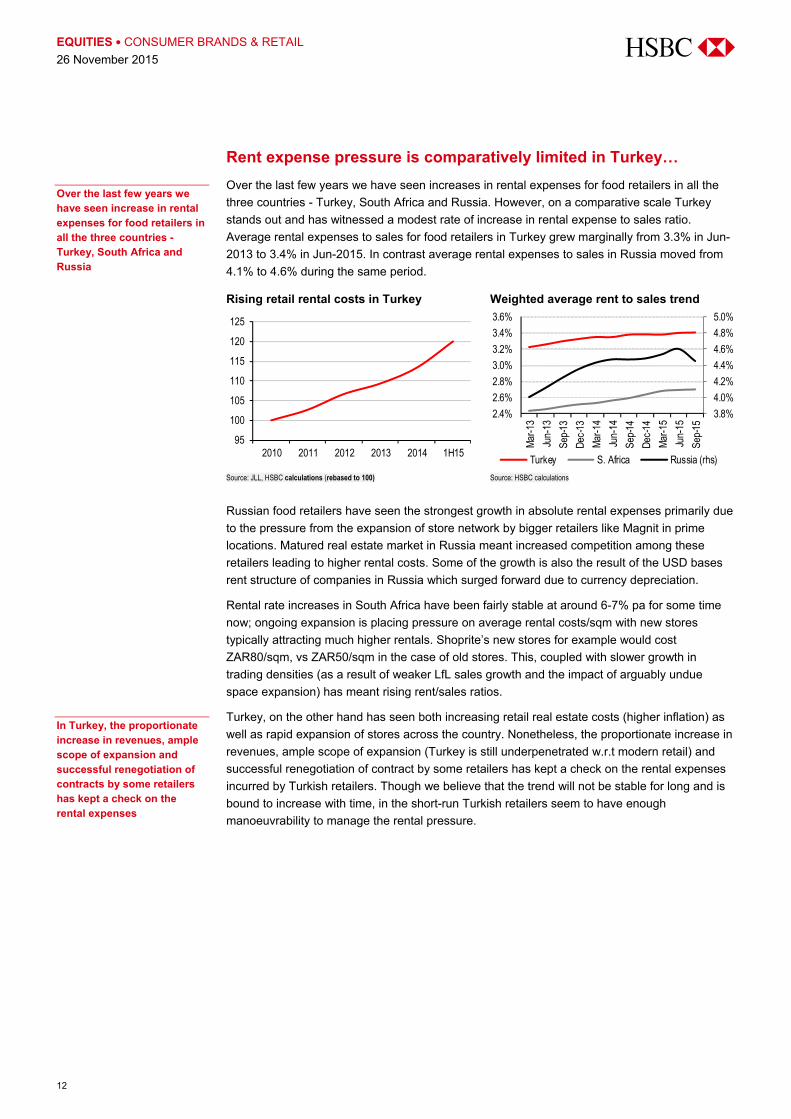
Rent expense pressure is comparatively limited in Turkey…
Over the last few years we have seen increases in rental expenses for food retailers in all the
three countries - Turkey, South Africa and Russia. However, on a comparative scale Turkey
stands out and has witnessed a modest rate of increase in rental expense to sales ratio.
Average rental expenses to sales for food retailers in Turkey grew marginally from 3.3% in Jun-
2013 to 3.4% in Jun-2015. In contrast average rental expenses to sales in Russia moved from
4.1% to 4.6% during the same period.
Rising retail rental costs in Turkey Weighted average rent to sales trend
Source: JLL, HSBC calculations (rebased to 100) Source: HSBC calculations
Russian food retailers have seen the strongest growth in absolute rental expenses primarily due
to the pressure from the expansion of store network by bigger retailers like Magnit in prime
locations. Matured real estate market in Russia meant increased competition among these
retailers leading to higher rental costs. Some of the growth is also the result of the USD bases
rent structure of companies in Russia which surged forward due to currency depreciation.
Rental rate increases in South Africa have been fairly stable at around 6-7% pa for some time
now; ongoing expansion is placing pressure on average rental costs/sqm with new stores
typically attracting much higher rentals. Shoprite’s new stores for example would cost
ZAR80/sqm, vs ZAR50/sqm in the case of old stores. This, coupled with slower growth in
trading densities (as a result of weaker LfL sales growth and the impact of arguably undue
space expansion) has meant rising rent/sales ratios.
Turkey, on the other hand has seen both increasing retail real estate costs (higher inflation) as
well as rapid expansion of stores across the country. Nonetheless, the proportionate increase in
revenues, ample scope of expansion (Turkey is still underpenetrated w.r.t modern retail) and
successful renegotiation of contract by some retailers has kept a check on the rental expenses
incurred by Turkish retailers. Though we believe that the trend will not be stable for long and is
bound to increase with time, in the short-run Turkish retailers seem to have enough
manoeuvrability to manage the rental pressure.
95
100
105
110
115
120
125
2010 2011 2012 2013 2014 1H15
3.8%
4.0%
4.2%
4.4%
4.6%
4.8%
5.0%
2.4%
2.6%
2.8%
3.0%
3.2%
3.4%
3.6%
Mar
-13
Jun-
13
Sep-
13
Dec-
13
Mar
-14
Jun-
14
Sep-
14
Dec-
14
Mar
-15
Jun-
15
Sep-
15
Turkey S. Africa Russia (rhs)
Over the last few years we have seen increase in rental expenses for food retailers in all the three countries - Turkey, South Africa and Russia
In Turkey, the proportionate increase in revenues, ample scope of expansion and successful renegotiation of contracts by some retailers has kept a check on the rental expenses

abc
13
EQUITIES CONSUMER BRANDS & RETAIL
26 November 2015
Rent per sqm growth (inflation adjusted LTM average)
Rent to sales (average)
Source: HSBC calculations *recently acquired by Carrefoursa Source: HSBC calculations *recently acquired by Carrefoursa
Rent cost to sales in Turkey is influenced by a number of factors like store size, format, location
and rental currency. It’s quite obvious that supermarkets will have a higher rental cost attached
compared to a discounter due to their larger size and prime locations. Within Turkey the trend is
more or less the same with Bizim and BIM leading due to their nature of operations (wholesaler
and discounter respectively). Migros has a higher rent to sales ratio due to nature of the business
but also because a substantial part of its rental cost is denominated in hard currency (c22%).
We further looked into rent per sqm and adjusted it for the inflation in Turkey. The results were
quite as expected. BIM stands out from the rest with inflation adjusted rent per sqm actually
dropping by 1.2% over the LTM time frame of our analysis. This shows that the company has
been successful in contracting new space for its store network expansion and also kept a strict
tab on its rental expenses. In supermarkets, Tesco Kipa showed declining trend mainly due to a
higher base effect whereas CarrefourSA witnessed the highest rises in rent.
We believe rental costs for food retailers in the short run will be influenced by the macro
weakness (lower consumer confidence) and are likely to remain stable. However, given the
expansion of organised retail in major cities, we feel that it’s a matter of time before the costs
start soaring up. Food retailers are most likely to find prime properties increasing costly to rent
and competition in discounter space (with increasing number of Migros convenience stores and
rise of other discounters like A101, Sok etc.) means demand for neighbourhood store locations
could push up the current rental rates.
But pressure on margins continues
For food retailers EBITDA margins depend on two main functions i.e. pricing power and cost
control. A company’s pricing policy often involves discounts, promotions and competitive pricing
which have a bearing on the margins of that company. While for cost control, we have already
seen above how food retailers in Turkey are managing their rent and employee cost (biggest
expenses for food retailers).
-8%
-6%
-4%
-2% 0% 2% 4% 6%
Tesco KipaRussia
BIMTurkeyMigros
South AfricaKiler*
CarrefoursaBizim
0% 1% 2% 3% 4% 5% 6%
BizimBIM
South AfricaTurkey
CarrefoursaTesco Kipa
RussiaMigros
Kiler*
EBITDA margins for food retailers in Turkey has been under pressure in recent times mainly due to increasing competition

abc
EQUITIES CONSUMER BRANDS & RETAIL
26 November 2015
14
Weighted EBITDA margins for the peer countries (LTM)
EBITDA margins of Turkish food retail stocks (LTM)
Source: HSBC calculations, Company Data Source: HSBC calculations, Company Data
It’s clear from the above chart that EBITDA margins for food retailers in Turkey have been under
pressure in recent times despite a recent recovery. We believe one of the reasons for the
decline in margins is increasing competition in the market. Not only are the discounters
expanding at an unprecedented pace, they have kicked in a strong retaliation from other
formats, specifically supermarkets and hypermarkets. Challenged by increasing number of
discounter stores, supermarkets are now putting in measures to defend their share of pie.
Measures undertaken includes diversification of formats (like into convenience space in case of
Migros), refurbishing of stores for increasing customer appeal, higher store discounts, matching
pricing of discounters and heightened promotional activities. In our opinion the competitive
landscape of Turkey is not going to ease anytime sooner and should continue to put pressure
on EBITDA margins in the medium run. Over the longer horizon we believe consolidation of
fragmented players will be a key factor which should bring about scale of operations and help
support margins.
As we have seen above, rising employee expenses (from minimum wage hikes and increasing
stores network) is also one of the major elements which has extended considerable pressure on
EBITDA margins. Within the covered stocks, Migros is the only one which has been able to hold
on to its EBITDA margins whereas both BIM and Bizim have shown declining trends in the last
two years. Migros control on its cost structure has been fairly well managed and has benefitted
the company with stable margin trends in 2013 and 2014. However, in recent quarters we have
seen increasing opex cost for Migros mainly from increase in employee costs (due to
accelerated expansion of store network) and increase in rental expenses (from depreciation of
TRY against USD as Migros has c22% of its rental agreement in FX terms). This has put some
pressure on the EBITDA margin of the company in 9M 2015.
EBITDA Margin (LTM)
Company Mar-14 Jun-14 Sep-14 Dec-14 Mar-15 Jun-15 AverageBIM 4.9% 4.7% 4.6% 4.3% 4.2% 4.5% 4.5%Bizim 2.9% 2.9% 3.0% 2.7% 2.5% 2.4% 2.8%Migros 6.0% 6.1% 6.2% 6.0% 6.0% 6.0% 6.0%Turkey^ 5.1% 5.0% 5.0% 4.7% 4.7% 4.8% 4.9%Russia 8.9% 9.1% 9.3% 8.9% 8.9% 8.9% 9.0%South Africa 5.1% 5.1% 5.0% 5.0% 5.0% 5.0% 5.0%Source: HSBC calculations, company information
In the cases of Bizim and BIM, higher employee costs have been the key factor for the decline.
However, it’s worth noting that BIM came back strongly so far this year with an improvement in
EBITDA margin. The company exercised its buying power and was able to negotiate favourable
terms with its suppliers thus helping to gather some support to its gross margin base. We
believe BIM’s current gains on margins are sustainable in the long run and are further supported
by normalisation of the extreme wage hikes seen last year.
6%
7%
8%
9%
10%
4.5%
5.0%
5.5%
6.0%
Mar
-13
Jun-
13
Sep-
13
Dec-
13
Mar
-14
Jun-
14
Sep-
14
Dec-
14
Mar
-15
Jun-
15
Sep-
15
Turkey S. Africa Russia (rhs)
2%
3%
4%
5%
6%
7%
Mar
-13
Jun-
13
Sep-
13
Dec-
13
Mar
-14
Jun-
14
Sep-
14
Dec-
14
Mar
-15
Jun-
15
Sep-
15
BIM Bizim Migros
Migros was able to hold on to its EBITDA margins whereas both BIM and Bizim have shown declining trends in the last two years

abc
15
EQUITIES CONSUMER BRANDS & RETAIL
26 November 2015
Overall, the Turkish food retail sector is marked by declining margins which is quite a contrast
with the significant growth we are seeing in revenue numbers. In our opinion the competitive
landscape and fragmented market structure is to blame for the same. A pricing war within the
industry (including discounters and supermarkets) has made scope for margin recovery look
bleak. However, we believe the industry is going through an expansion phase and should
mature in the next 3-5 years. In medium term we should see some stabilisation of cost structure
and a better control on margins by the food retailers. However we would like to point out that a
steep hike in minimum wage rate poses the greatest risk to food retail margins.
Growth and exit - consolidation in the industry plays on
We have seen earlier that the Turkish retail market is highly fragmented and offers significant
scope for consolidation. In recent times there have been a number of acquisitions in this space
and we observe two distinct trends which are highlighted below:
1) Exit of foreign players – Weaker macro-economic environment, depreciating currency, and
problems in their home countries as well reaching desired return rates has led many foreign
players to exit Turkey food retail market in the recent past. The biggest of them was BC
Partners selling off half its stake (40.25%) in Migros to Anadolu Holding at USD800m. Recently
in Sep-2015, Tesco Kipa sold 10 of its stores to Begendik group and is also contemplating
selling off its Central and Eastern European units which includes its Kipa stores in Turkey.
2) Domestic players remain bullish – The recent acquisitions in supermarkets including that
of Kiler by CarrefourSA (major shareholder Sabanci Holdings) shows that local players remain
bullish on the growth potential of the Turkish food retail market. Anadolu Holding’s (controlled by
Yazicilar Group) acquisition of a stake in Migros also points out to the emergence of domestic
powerhouses in this sector.
Recent major mergers and acquisition in food retail space of Turkey Deal Date Acquirer Target Stake Number of
storesDeal Value (USD mn)
14-Jun-15 Begendik Real Hypermarkets (Metro Group) 100.0% 12 NA14-Dec-15 Anadolu Endustri Holding Migros 40.3% 1,352 799.22-Feb-15 CarrefourSA Ismar stores 100% 26 10.813-Mar-15 CarrefourSA Stores at Antalya Market 100% 29 1215-May-15 CarrefourSA Kiler 85.0% 202 260.97-Sep-15 Begendik Part of Tesco Kipa stores - 10 13.2Source: HSBC, Bloomberg
Taking a walk through the timeline we see the consolidation and exit of foreign players as a
continuation of the trend that started in 2013. That year Yildiz Holding acquired the discounter
chain Diasa from its Spanish parent DIA and Carrefour sold some of its stakes in Turkish
subsidiary to Sabanci Holding, making Sabanci as the majority shareholder. Last year Anadolu
Holdings (68% owned by Yazicilar Holdings), which also controls Ekomini franchise chain of
stores under its banner announced the acquisition of 40.25% stake in Migros from BC Partners.
This year by acquiring Kiler supermarkets, CarrefourSA further consolidated its market share in
the fragments space of Turkish food retail. On a combined basis, the above three
conglomerates control c19% of organised food retail market in Turkey, 1% higher than BIM’s
share of 18% in 2014.
Furthermore, with the acquisition of 12 Real hypermarkets from Metro in 2014 and 10 Tesco
Kipa stores in 2015, we are seeing the emergence of another domestic player – Begendik. This
takes the total store count of Begendik to 69 out of which 13 are hypermarkets and the rest are
supermarkets. In our view Turkish market should continue to see more consolidation going
The biggest of the transactions in the sector recently was BC Partners selling off half its stake in Migros to Anadolu Group
Yildiz Holding acquired the Diasa and Carrefour sold some of its stake in Turkish subsidiary to Sabanci Holding Carrefoursa recently acquired local supermarket Kiler

abc
EQUITIES CONSUMER BRANDS & RETAIL
26 November 2015
16
forward with local players looking to acquire scale and established players trying to expand their
presence in the growing market.
Modern retail market share breakdown (2014)*
BIM holds c.45% weight among the top 5 players (9M2015)
Source: : Euromonitor, HSBC calculations; *Conglomerates includes Migros and Ekomini (Yazicilar Holding), CarrefourSA and Kiler (Sabanci Holdings), Sok (Yildiz Holding)
Source: Euromonitor, HSBC calculations
BIM, 18%
A101, 6%
Kipa, 3%
Conglomerates, 19%
Others, 54%
BIM45%
Migros21%
A10115%
Yildiz10%
CarrefourSA9%

abc
17
EQUITIES CONSUMER BRANDS & RETAIL
26 November 2015
Company Section

abc
EQUITIES CONSUMER BRANDS & RETAIL
26 November 2015
18
Investment thesis
BIM’s rapid expansion in Turkey and its low price discounter formats are the key growth drivers
of the company. We believe BIM will continue to see higher growth rates in medium term as the
1,000 stores opened during 2014 and 2015 matures. In addition we expect BIM’s expansion to
continue with addition of another 500 store in 2016 as Turkey still offers ample scope being an
under penetrated market (in modern food retail formats). BIM success factor of having a strong
and higher percentage (c.70%) of private label brands helps it to be ahead of competition in
terms of pricing. In our view BIM’s affordability (3% lower than nearest competition and 15%-
25% lower than supermarkets), availability (strong store network of over 5,000 stores) and
quality private label products are the differentiating factor which should lead to positive traffic
growth for some time.
In terms of margin BIM has played on very well till now in 2015. Supported by strong negotiating
power with its suppliers (gaining suppliers discount) and greater capability in pushing higher
food inflation to consumers (selective price increases) BIM has seen some strong margin
expansion of 100bps in 2Q14 and followed by 50bps in 3Q15. We believe the gains to be
sustainable and should lead to a sharp recovery in EBITDA margin to 4.8% in 2015 (from the
low of 4.3% in 2014). In our view the bulk purchasing of commodities, higher private label share
and limited SKU’s provides BIM a better control on its costs of goods and hence the gross
margins. Furthermore, we think the improved gross margin level in the overall organized retail
industry supports upside potential on the margins both in the short and the long term. However
on a cautious note, a minimum wage rate hike in Turkey would add pressure on margins which
would be true for all the players in the industry including BIM.
BIM offers +40% ROE, a visible and strong growth rate, and a relatively lower risk profile with
no FX short position. We believe this deserves premium valuation and that outperformance
relative to the Turkey Index should continue in the long term. Downside risks include higher
cannibalization and pressure on margins going forward.
BIM
Strong like for like growth and gross margin expansion boost EBITDA but employee wages will be a key factor to watch in FY16e
3Q15 EBITDA margins improved to 5.2% thanks to better pricing strategy and stronger buying power
Cut DCF based target price to TRY61.0 (from TRY64.0) and maintain Buy

abc
19
EQUITIES CONSUMER BRANDS & RETAIL
26 November 2015
Key Trends to look-out for in BIM
Gross margin* recovered in recent quarters despite a fall in the sector
EBITDA margin* also on a recovery trend despite a fall in the organized segment
Source: Company reports * Gross margin (LTM) Source: Company reports * EBITDA margin (LTM)
BIM continues to show a strong LFL number after a marginal dip in 2013. We believe BIM as
well as other discounters will have a stronger growth prospect over other food retailers in Turkey
in the upcoming years. The 11.5% LFL growth during the first nine months of 2015 supports our
view point. Furthermore, it’s interesting to note that despite pressure from increasing
competition (A101 and Sok), higher space growth (c.500 store openings in 2014&2015) and
related cannibalisation of sales, the company has been able to sustain a robust real LFL growth
trend over the last 2 years. Despite increasing pressure from rising wages, we think ongoing
gross margin expansion will continue to drive strong growth rates in EBITDA in the upcoming
quarters.
3Q15 Results
BIM’s 3Q15 results were in line with our expectation delivering a strong LFL revenue growth of
11.2%. Thanks to positive growth in LFL traffic (+1.8% in 3Q15) and continued expansion
(added 56 stores in Turkey during the quarter), BIM posted stronger growth numbers (+18.5% in
3Q15) despite having 2 lesser trading days (vs. 3Q14). BIM was also successful in retaining the
margin gains seen in 2Q15. EBITDA margins reached 5.2% in 3Q15 implying an expansion of
50bps over the comparable period. Selective price increases across SKUs and better supplier
terms has led to margin gains for the company in the last two quarters. A growth of 46% in net
profit was really surprising and was driven by two factors - operational (EBITDA growth of 31%)
and a one-off (FX gains of TRY23m from credits provided to operations in Egypt and Morocco).
15%
17%
19%
21%
Q4
13
Q1
14
Q2
14
Q3
14
Q4
14
Q1
15
Q2
15
Q3
15
BIM Turkey Organised
0%
1%
2%
3%
4%
5%
Q4
13
Q1
14
Q2
14
Q3
14
Q4
14
Q1
15
Q2
15
Q3
15
BIM Turkey Organised
Sales per sqm growing healthily – significantly faster than the sector
EBIT per sqm averages started to recover in FY15
Source: Company reports *Sales per sq m (TRY, LTM) Source: Company reports * EBIT per sq m (TRY, LTM)
50bps EBITDA margin gains in 3Q15
8,500 9,000 9,500
10,000 10,500 11,000 11,500 12,000
Q4
13
Q1
14
Q2
14
Q3
14
Q4
14
Q1
15
Q2
15
Q3
15
BIM Turkey Organised
50
80
110
140
Q4
13
Q1
14
Q2
14
Q3
14
Q4
14
Q1
15
Q2
15
Q3
15
BIM Turkey Organised

abc
EQUITIES CONSUMER BRANDS & RETAIL
26 November 2015
20
Estimate Changes
BIM – changes to estimates
Key items ___________ 2015e ____________ ___________ 2016e ____________ ___________ 2017e ____________ (TRYm) Old New Chg. Old New Change Old New ChangeSales 17,516 17,470 -0.3% 20,998 21,651 3.1% 25,097 26,102 4.0%EBITDA 837 846 1.1% 1,020 1,010 -1.0% 1,261 1,281 1.6%Net profit 551 564 2.3% 667 650 -2.4% 831 835 0.5%EBITDA margin
4.8% 4.8% 4.9% 4.7% 5.0% 4.9%
Source: HSBC estimates
We revise our estimates marginally after the 3Q15 results. Our EBITDA and Net profit numbers
for 2015e are revised upwards reflecting the strong margin expansion and one off FX gains in
3Q15. We slightly cut our long term margin expectations for the group and now see stronger
revenue growth. Margin cuts are due to higher wage increases we assumed for FY16e and
FY17e due to Government's plans to increase minimum wage by 30% in FY16e.
Valuation and risks
Our DCF-based target price of TRY61 for BIM is based on a WACC of 11.8% (from 12.8%), a
risk-free rate of 8.5% (from 9.5%), an ERP of 5.5% and beta of 0.60 (both unchanged). This
leads to a fair value target price of TRY61.0 (from TRY64.0). The cut in our target price reflects
the changes to our estimates. Our target price implies upside of 10%, and we reiterate our Buy
rating based on BIM’s strong growth potential.
Risks
The main downside risks include lower-than-expected store expansion and like-for-like sales
growth. Also, an increase in minimum wage in Turkey, a possible failure in the international
expansion and/or in the FILE stores could create pressure on the margins and bottom line.

abc
21
EQUITIES CONSUMER BRANDS & RETAIL
26 November 2015
Financials & valuation: BIM Buy Financial statements Year to 12/2014a 12/2015e 12/2016e 12/2017eProfit & loss summary (TRYm)
Revenue 14,463 17,470 21,651 26,102
EBITDA 619 846 1,010 1,281
Depreciation & amortisation -137 -166 -206 -247
Operating profit/EBIT 482 680 804 1,035
Net interest 17 12 17 25
PBT 512 723 834 1,071
HSBC PBT 512 723 834 1,071
Taxation -117 -159 -183 -236
Net profit 395 564 650 835
HSBC net profit 395 564 650 835Cash flow summary (TRYm)
Cash flow from operations 569 853 1,013 1,246
Capex -410 -450 -491 -543
Cash flow from investment -394 -450 -491 -543
Dividends -243 -237 -338 -390
Change in net debt 84 -166 -184 -313
FCF equity 144 375 512 694Balance sheet summary (TRYm)
Intangible fixed assets 5 6 7 8
Tangible fixed assets 1,264 1,547 1,833 2,129
Current assets 1,812 2,204 2,740 3,425
Cash & others 325 492 675 988
Total assets 3,238 3,915 4,737 5,719
Operating liabilities 2,056 2,407 2,916 3,453
Gross debt 17 17 17 17
Net debt -308 -474 -658 -971
Shareholders' funds 1,150 1,476 1,788 2,233
Invested capital 699 859 988 1,120
Ratio, growth and per share analysis Year to 12/2014a 12/2015e 12/2016e 12/2017eY-o-y % change
Revenue 22.1 20.8 23.9 20.6
EBITDA 3.8 36.8 19.4 26.9
Operating profit -0.7 41.1 18.2 28.7
PBT -2.7 41.2 15.4 28.4
HSBC EPS -4.3 42.6 15.4 28.4Ratios (%)
Revenue/IC (x) 24.1 22.4 23.4 24.8
ROIC 61.9 68.1 67.9 76.6
ROE 36.8 42.9 39.8 41.5
ROA 13.3 15.8 15.0 16.0
EBITDA margin 4.3 4.8 4.7 4.9
Operating profit margin 3.3 3.9 3.7 4.0
EBITDA/net interest (x)
Net debt/equity -26.8 -32.1 -36.8 -43.5
Net debt/EBITDA (x) -0.5 -0.6 -0.7 -0.8
CF from operations/net debt Per share data (TRY)
EPS Rep (diluted) 1.30 1.86 2.14 2.75
HSBC EPS (diluted) 1.30 1.86 2.14 2.75
DPS 0.80 0.78 1.11 1.29
Book value 3.79 4.86 5.89 7.36
Valuation data Year to 12/2014a 12/2015e 12/2016e 12/2017e
EV/sales 1.1 0.9 0.7 0.6
EV/EBITDA 26.6 19.2 15.9 12.3
EV/IC 23.5 18.9 16.3 14.1
PE* 42.7 30.0 26.0 20.2
PB 14.7 11.4 9.4 7.6
FCF yield (%) 0.9 2.2 3.1 4.1
Dividend yield (%) 1.4 1.4 2.0 2.3
* Based on HSBC EPS (diluted)
Issuer information
Share price (TRY) 55.65 Free float 55%Target price (TRY) 61.00 Sector Multiline RetailReuters (Equity) BIMAS.IS Country TurkeyBloomberg (Equity) BIMAS TI Analyst Bulent YurdagulMarket cap (USDm) 5,880 Contact +90 212 3764612
Price relative
Source: HSBC
Note: Priced at close of 24 Nov 2015
34.00
39.00
44.00
49.00
54.00
59.00
64.00
34.00
39.00
44.00
49.00
54.00
59.00
64.00
2013 2014 2015 2016BIM Rel to ISTANBUL COMP

abc
EQUITIES CONSUMER BRANDS & RETAIL
26 November 2015
22
Investment thesis
Bizim growth story in 2015 has been structurally very different. A major part of the revenue
growth in the first nine month of 2015 has been driven by higher tobacco sales and addition of
franchise business. Crackdown on illegal tobacco trade by the authorities has pushed the
tobacco sales upwards for Bizim by c.34% in 9M15. In our view it possesses two challenges for
Bizim. First is the change in sales mix diluting the margins (tobacco profitability are much lower)
and the second is the question of sustainability of such an unprecedented growth. In context of
franchise, it has been a mixed performance so far. Bizim was able to reach breakeven EBITDA
level much earlier than anticipated but at the same time it failed to ramp-up its franchise network
to the targeted level. Management pointed out that they are focussing on the right franchise
partners and have closed some of the stores from the initial count of 196 at the time of
acquisition. In our view in medium term tobacco sales should return back to normalised level
and revenue growth would mostly be driven by increasing franchise network and sales. The
company expects to have 600 franchise stores by 2018 with a revenue base of c.TRY800m and
a penetration level of 75 to 80%.
Although we see Bizim growing in terms of revenues, its margins are a cause of concern.
Increasing share of tobacco mix in Bizim’s revenue and start-up costs of the low margin
franchise business are expected to keep EBITDA margin under pressure in coming quarters.
We believe the above impact should be mitigated to some extent by improvement in main
category gross margin, increasing focus on profitable channels like HoReCa (Hotels,
Restaurants and Cafes) and cost savings initiatives (as seen in 9M15). This would at best keep
the EBITDA margin from contracting any further and hence, we see limited opportunities for any
significant margin improvement in the medium term unless share of tobacco comes down
sharply (which would hurt top line growth rate). Additionally we would also like to point out that
any increase in minimum wage in Turkey would add to the margin pressure and would be
potential negative catalysts for Bizim.
Bizim
Significant recovery in like for like rates in 9M15 is a result of growth in low margin businesses
Increasing share of lower margin tobacco sales continues to keep EBITDA margin under pressure (10bps contraction in 3Q15)
Cut DCF based target price to TRY13.9 (from TRY14.0) and reiterate Hold

abc
23
EQUITIES CONSUMER BRANDS & RETAIL
26 November 2015
Key Trends to look-out for in Bizim
Gross margin under pressure due to wholesale format and high tobacco sales
EBITDA margin remains weak despite efforts for focus on cost structure
Source: Company reports * Gross margin (LTM) Source: Company reports * EBITDA margin (LTM)
Sales per sqm rising much better than the sector growth rate in FY15
But EBIT per sqm continues to decline in last few years
Source: Company reports * Sales per sqm (TRY, LTM) Source: Company reports * EBIT per sqm (TRY, LTM)
Bizim fared poorly during FY14 due to restrictions on credit card transactions and the overall
tougher environment for wholesalers. However, the company has since then bounced back with
a stronger LFL growth of 9.5% in 9M15. Exceptional growth in tobacco business along with
marginal recovery in main category sales has been the primary driving force for Bizim this year.
If we assume that the growth in tobacco sales may be temporary then this level of growth in LFL
numbers may not be sustainable in the near future. However, due to good cost control and
restructuring of the business, the Company might be benefitting from increasing margins in the
main category business as well as franchise business going forward. Consolidation in the
general retail market could be positive for Bizim’s growth while it could also be an acquisition
target with its very well positioned store network throughout the country and its first entry
advantage to franchise business.
3Q15 Results
Bizim’s growth rate continued to be robust with 9.9% increase in revenue during 3Q15. Its
performance is mainly driven by higher tobacco sales which registered +37.4% (LFL of 35.5%)
growth whereas main category sales remains subdued at 1.1% (LFL of +1.0%). Although the
company improved its gross margin in the main category by 40bps from focusing on profitable
channels, lower margin tobacco sales weighed on the overall gross margin which declined to
8.7% in 3Q15 (vs. 9.2% in 3Q14). However, the company managed to recover some of the
margins from a tighter opex management and c.8.0m of costs savings, resulting in an EBITDA
margin of 2.8% (vs. 2.9% in 3Q14). Management expect the current opex level to be
8%
11%
14%
17%
20%
23%
Q4
13
Q1
14
Q2
14
Q3
14
Q4
14
Q1
15
Q2
15
Q3
15
Bizim Turkey Organised
0.0%0.5%1.0%1.5%2.0%2.5%3.0%3.5%
Q4
13
Q1
14
Q2
14
Q3
14
Q4
14
Q1
15
Q2
15
Q3
15
Bizim Turkey Organised
8,000
8,400
8,800
9,200
9,600
Q4
13
Q1
14
Q2
14
Q3
14
Q4
14
Q1
15
Q2
15
Q3
15
Bizim
Turkey Organised 20 30 40 50 60 70 80 90
Q4
13
Q1
14
Q2
14
Q3
14
Q4
14
Q1
15
Q2
15
Q3
15
Bizim Turkey Organised
Revenue growth driven by higher tobacco sales

abc
EQUITIES CONSUMER BRANDS & RETAIL
26 November 2015
24
sustainable and guided for a margin of 2.7% for 2015, which we believe to be achievable. Some
slowdown in franchise expansion was also observed as Bizim added only 11 net franchises
during the quarter. Management also lowered the year-end guidance for franchise stores to 270
and revenue contribution to TRY120m (from 300 stores and TRY140m revenue previously).
Estimate Changes
BIZIM – changes to estimates Key items ___________ 2015e__________ ___________ 2016e ____________ ___________ 2017e ____________(TRYm) Old New Change Old New Change Old New ChangeSales 2,550 2,550 0.0% 2,906 2,924 0.6% 3,295 3,304 0.3%EBITDA 65 68 4.0% 78 75 -3.9% 89 89 -0.4%Net profit 10 13 23.8% 16 14 -12.7% 22 22 1.2%EBITDA margin 2.6% 2.7% 2.7% 2.6% 2.7% 2.7%Source: HSBC estimates
We revise our estimates for Bizim after the 3Q15 results. We revise our short term forecast (for
2015) upwards based on management guidance of 2.7% EBITDA margin and net profit growth
of 25%. In medium term we see slightly lower revenues mainly from lower franchise
contributions but in our view a tighter opex via costs savings should keep margins stable and
contribute to net profit growth. Margin cuts are due to higher wage increases we assumed for
FY16e and FY17e due to Government's plans to increase minimum wage by 30% in FY16e.
Valuation and risks
Our DCF-based valuation produces a fair value target price of TRY13.9 (from TRY14.0) using a
WACC of 11.8%, a risk free rate of 8.5%, an ERP of 5.5% and a beta of 0.70 (all unchanged).
The cut in our target price reflects the changes to our estimates. Our target price implies 6%
upside from the current price and we reiterate our Hold rating on the stock as we see medium-
term margins to remain under pressure from increasing share of low margin business like
franchise and tobacco.
Risks
The main upside risks are better than expected like-for-like sales growth and higher penetration
levels in franchise business. Key downside risks include increase in minimum wage rate in
Turkey, weakness in like-for like growth and management’s inability to efficiently execute the
new store franchising plans.

abc
25
EQUITIES CONSUMER BRANDS & RETAIL
26 November 2015
Financials & valuation: Bizim Toptan Hold Financial statements Year to 12/2014a 12/2015e 12/2016e 12/2017eProfit & loss summary (TRYm)
Revenue 2,279 2,550 2,924 3,304
EBITDA 63 68 75 89
Depreciation & amortisation -17 -20 -25 -30
Operating profit/EBIT 46 47 50 59
Net interest -10 -12 -12 -10
PBT 14 16 17 27
HSBC PBT 14 16 17 27
Taxation -3 -3 -4 -6
Net profit 11 13 14 22
HSBC net profit 11 13 14 22Cash flow summary (TRYm)
Cash flow from operations 55 36 42 54
Capex -24 -30 -46 -49
Cash flow from investment -47 -30 -46 -49
Dividends -13 -4 -5 -5
Change in net debt 27 -2 8 0
FCF equity 21 25 16 26Balance sheet summary (TRYm)
Intangible fixed assets 27 29 33 37
Tangible fixed assets 112 120 136 152
Current assets 384 448 495 571
Cash & others 26 48 40 60
Total assets 531 605 672 767
Operating liabilities 380 424 482 541
Gross debt 11 31 31 51
Net debt -15 -17 -8 -8
Shareholders' funds 134 143 153 170
Invested capital 117 125 143 159
Ratio, growth and per share analysis Year to 12/2014a 12/2015e 12/2016e 12/2017eY-o-y % change
Revenue 1.4 11.9 14.7 13.0
EBITDA -9.2 8.0 10.8 18.9
Operating profit -18.1 3.2 4.5 19.5
PBT -70.9 18.2 8.2 57.1
HSBC EPS -72.7 18.2 8.2 57.1Ratios (%)
Revenue/IC (x) 21.9 21.1 21.9 21.9
ROIC 35.1 31.2 29.5 31.2
ROE 8.0 9.3 9.4 13.6
ROA 2.2 2.3 2.2 3.0
EBITDA margin 2.7 2.7 2.6 2.7
Operating profit margin 2.0 1.9 1.7 1.8
EBITDA/net interest (x) 6.5 5.5 6.2 8.6
Net debt/equity -11.0 -11.6 -5.4 -4.9
Net debt/EBITDA (x) -0.2 -0.2 -0.1 -0.1
CF from operations/net debt Per share data (TRY)
EPS Rep (diluted) 0.27 0.32 0.35 0.55
HSBC EPS (diluted) 0.27 0.32 0.35 0.55
DPS 0.32 0.10 0.11 0.12
Book value 3.36 3.59 3.82 4.25
Valuation data Year to 12/2014a 12/2015e 12/2016e 12/2017e
EV/sales 0.2 0.2 0.2 0.2
EV/EBITDA 8.2 7.5 6.9 5.8
EV/IC 4.4 4.1 3.6 3.2
PE* 48.3 40.9 37.8 24.0
PB 3.9 3.7 3.4 3.1
FCF yield (%) 4.0 4.7 3.1 5.0
Dividend yield (%) 2.4 0.7 0.9 0.9
* Based on HSBC EPS (diluted)
Issuer information
Share price (TRY) 13.15 Free float 40%Target price (TRY) 13.90 Sector Specialty RetailReuters (Equity) BIZIM.IS Country TurkeyBloomberg (Equity) BIZIM TI Analyst Bulent YurdagulMarket cap (USDm) 183 Contact +90 212 3764612
Price relative
Source: HSBC
Note: Priced at close of 24 Nov 2015
8.00
13.00
18.00
23.00
28.00
33.00
38.00
8.00
13.00
18.00
23.00
28.00
33.00
38.00
2013 2014 2015 2016Bizim Toptan Rel to ISTANBUL COMP

abc
EQUITIES CONSUMER BRANDS & RETAIL
26 November 2015
26
Investment thesis
Migros has a mostly EUR based debt profile which with a depreciating local currency (TRY vs
EUR) has kept the bottom-line under pressure in recent quarters. However, given the result of
the general election in Turkey, political uncertainty should dissipate and the TRY should
strengthen (see HSBC FX’s piece: TRY: Post-election rally: USD-TRY to move lower on
surprise large AKP majority, 1 November 2015). In this context we see the pressure on Migros
bottom-line (and hence the equity) easing-off to a great extent in the last quarter of the year.
Furthermore, we expect the volatility in exchange rate to reduce helping the company to
minimise any non-cash losses from FX movements. We believe that with political uncertainty
and currency volatility diminishing, the stock’s fundamental value should become a key driver of
performance.
We believe Migros’ shift in strategy to focus on smaller format Mjet stores has really paid-off as
the company has seen some consistent strong growth rates since the beginning of 2014.
Expansion across Mjet format has been remarkable with the company adding 155 stores to date
in 2015 (vs adding 129 stores in 2014). In 3Q15 management revised the total store opening
target to 225+ for 2015 (from 175-200 previously) which is positive for the company. In our view
management will continue to invest in smaller formats with overall space addition of c.6%-7% y-
o-y in medium term. We believe higher number of stores and increasing focus on traffic growth
should drive revenue CAGR of c13% in 2014-2017e. Furthermore we believe the conversion of
c.170 Tansas stores into Migros is a positive move. In 3Q15 conference call, Management has
pointed out that profitability of Migros brand is better than that of Tansas. In our view this would
support the brand value of Migros and should drive-in higher traffic for the company.
On the margin side, the company surprised in 3Q15 with gains in gross margin nearly offsetting
the pressure from increasing rental and employee costs. We expect this pressure to remain for
some more time as the company continues to expand its store network but better gross margins
from increased price competitiveness of Migros should provide some relief. Further with TRY
gaining back on USD/EUR we believe the rental pressure will ease off considerably (the
company has c.22% of its rental cost in foreign currency - USD and EUR based). Though we
see positive trends supporting margin upside we maintain caution as recent news on minimum
wage hike could depress Migros’ margins in the coming year.
Migros
High LFL rates as well as expanding gross margins are positive indicators
Robust margin of 6.7% in 3Q15 but higher FX losses and one time impairment weighed on the bottom-line
Cut target price to TRY22.5 (from TRY23.0) and reiterate our Buy based on increasing stronger expansion of Mjet formats

abc
27
EQUITIES CONSUMER BRANDS & RETAIL
26 November 2015
Key Trends to look-out for in Migros
Gross margin is very strong and even improving slightly in recent years
EBITDA margin again stable – differentiating sharply from the sector
Source: Company reports * Gross margin (LTM) Source: Company reports * EBITDA margin (LTM)
Sales per sqm boosted in recent years with optimization of the formats
EBIT per sqm gives more healthy signals in recent quarters
Source: Company reports * Sales per sq m (TRY, LTM) Source: Company reports * EBIT per sqm (TRY, LTM)
For Migros it was the change in strategy that helped the company to post better growth
numbers recently rather than a major pickup in growth rates in supermarket segment. The
company started focusing more and more on smaller format stores (Mjet) ahead of the sector
and expanded rapidly, capitalising on the convenience market space opportunity. Its
supermarket stores also performed strong capitalising on the trust that it has built over a long
history in Turkey together with strong improvement in product portfolio and competitive pricing
strategy especially on SKUs that are available in discounters. Together with increasing space
growth, the Company started posting +15% top line growth levels in recent quarters, which is
quite a success within the supermarket universe. Following the takeover of part of management
control by leading conglomerate Anadolu Group this year, we think Migros might be even more
successful in supplier contracts. Together with consolidation of the market, gross margins might
continue to expand offsetting potential negative impacts from rising employee or rental costs.
We argue that Migros might be a consolidator of the sector in the upcoming years with its strong
shareholder base and successful branding and product portfolio in the supermarket segment.
15%
18%
21%
24%
27%
30%
Q4
13
Q1
14
Q2
14
Q3
14
Q4
14
Q1
15
Q2
15
Q3
15
Migros Turkey Organised
0%1%2%3%4%5%6%7%
Q4
13
Q1
14
Q2
14
Q3
14
Q4
14
Q1
15
Q2
15
Q3
15
Migros Turkey Organised
8,000
8,400
8,800
9,200
9,600
Q4
13
Q1
14
Q2
14
Q3
14
Q4
14
Q1
15
Q2
15
Q3
15
Migros
TurkeyOrganised
50
100
150
Q4
13
Q1
14
Q2
14
Q3
14
Q4
14
Q1
15
Q2
15
Q3
15
Migros Turkey Organised

abc
EQUITIES CONSUMER BRANDS & RETAIL
26 November 2015
28
3Q15 Results
Migros’ strong EBITDA margin of 6.7% in 3Q15 came as a surprise against our expectation for
a margin of 6.3%. Robust revenue growth of +15.2% and 30bps improvement in gross margin
provided support to the EBITDA margin. We believe management’s initiative to increase the
price competitiveness of Migros and investment in private label brands has led to margin
stabilisation. Strong revenue growth continued in 3Q15 with higher than expected store network
expansion (Migros adding c.224 stores in the last 12 months). However, due to FX losses on its
EUR denominated debt and a one-time impairment of TRY111.5m (on its Tansas trademark)
brought down the company net loss to TRY342m in 3Q15 (against our expectation for a net loss
of TRY269m). The impairment resulted from the conversion of c.170 Tansas stores into Migros
brand this year. Nonetheless, the store expansion target revision to 225+ in 2015 (from 175-200
previously) is clearly a positive for the company in our view.
Estimate Changes
Migros – changes to estimates
Key items ___________ 2015e __________ ___________ 2016e ____________ ___________ 2017e ____________ (TRYm) Old New Change Old New Change Old New ChangeSales 9,399 9,408 0.1% 10,509 11,006 4.7% 11,643 12,531 7.6%EBITDA 549 577 5.2% 624 6.34 1.6% 694 743 7.1%Net profit -60 -150 NM 77 85 9.9% 218 257 18.2%HSBC net profit 66 87 31.4% 158 166 4.8% 218 257 18.2%EBITDA margin 5.8% 6.1% 5.9% 5.8% 6.0% 5.9%Source: HSBC estimates
We revise our sales and margin estimates slightly upwards after the 3Q15 results due to higher
than expected expansion in Mjet stores. Our cut in net loss for 2015 from –TRY60m to –
TRY171m reflects the one-off impairments made by the company on its Tansas brand in 3Q15.
Margin cuts are due to higher wage increases we assumed for FY16e and FY17e due to
Government's plans to increase minimum wage by 30% in FY16e.
Valuation and risks
Our DCF analysis, using a risk-free rate of 8.5%, an ERP of 5.5%, a beta of 0.95 and a WACC
of 11.3% (all unchanged), produces a fair value target price of TRY22.5 (from TRY23) per
share. The cut in our target price reflects the changes to our estimates. Our target price implies
27% upside from the current price and we reiterate our Buy rating on the stock. We believe the
success of smaller format Mjet stores and a rapid expansion of store network should drive
stronger revenue growth for the company in medium term.
Risks
Downside risks include FX losses as Migros has significant EUR denominated debt that could
adversely affect profitability. Management inability to keep-up with the increasing competition
from discounters and other convenience store operators would mean loss of market share and
could be a potential downside risk for the company. Further an increase in minimum wage rate
in Turkey could impact margins negatively.
Store expansion target for 2015 revised upwards to 225+

abc
29
EQUITIES CONSUMER BRANDS & RETAIL
26 November 2015
Financials & valuation: Migros Buy Financial statements Year to 12/2014a 12/2015e 12/2016e 12/2017eProfit & loss summary (TRYm)
Revenue 8,123 9,408 11,006 12,531
EBITDA 490 577 634 743
Depreciation & amortisation -162 -178 -195 -215
Operating profit/EBIT 328 399 439 528
Net interest -15 -300 -251 -138
PBT 184 -111 106 322
HSBC PBT 184 -111 106 322
Taxation -85 -40 -21 -64
Net profit 99 -150 85 257
HSBC net profit 20 87 166 257Cash flow summary (TRYm)
Cash flow from operations 462 61 455 681
Capex -232 -228 -250 -268
Cash flow from investment -226 -228 -250 -268
Dividends 0 0 0 -25
Change in net debt -221 167 -204 -388
FCF equity 293 37 274 471Balance sheet summary (TRYm)
Intangible fixed assets 2,501 2,534 2,571 2,605
Tangible fixed assets 1,335 1,352 1,371 1,389
Current assets 1,729 1,730 2,077 2,439
Cash & others 689 532 680 860
Total assets 5,593 5,645 6,047 6,462
Operating liabilities 2,203 2,398 2,772 3,162
Gross debt 2,353 2,363 2,306 2,099
Net debt 1,664 1,831 1,626 1,239
Shareholders' funds 918 768 853 1,085
Invested capital 2,673 2,686 2,567 2,411
Ratio, growth and per share analysis Year to 12/2014a 12/2015e 12/2016e 12/2017eY-o-y % change
Revenue 14.0 15.8 17.0 13.9
EBITDA 12.7 17.8 9.8 17.3
Operating profit 12.5 21.8 9.8 20.4
PBT -160.2 203.1
HSBC EPS 339.0 90.5 55.0Ratios (%)
Revenue/IC (x) 3.0 3.5 4.2 5.0
ROIC 6.4 20.2 13.4 17.0
ROE 2.3 10.3 20.5 26.6
ROA 1.7 -2.7 1.5 4.1
EBITDA margin 6.0 6.1 5.8 5.9
Operating profit margin 4.0 4.2 4.0 4.2
EBITDA/net interest (x) 32.2 1.9 2.5 5.4
Net debt/equity 181.0 238.1 190.5 114.1
Net debt/EBITDA (x) 3.4 3.2 2.6 1.7
CF from operations/net debt 27.8 3.3 27.9 55.0Per share data (TRY)
EPS Rep (diluted) 0.55 -0.85 0.48 1.45
HSBC EPS (diluted) 0.11 0.49 0.93 1.45
DPS 0.00 0.00 0.00 0.14
Book value 5.16 4.31 4.79 6.09
Valuation data Year to 12/2014a 12/2015e 12/2016e 12/2017e
EV/sales 0.6 0.5 0.4 0.4
EV/EBITDA 9.8 8.6 7.5 5.9
EV/IC 1.8 1.9 1.9 1.8
PE* 158.7 36.2 19.0 12.2
PB 3.4 4.1 3.7 2.9
FCF yield (%) 9.3 1.2 8.7 14.9
Dividend yield (%) 0.0 0.0 0.0 0.8
* Based on HSBC EPS (diluted)
Issuer information
Share price (TRY) 17.70 Free float 19%Target price (TRY) 22.50 Sector Food & Staples RetailingReuters (Equity) MGROS.IS Country TurkeyBloomberg (Equity) MGROS TI Analyst Bulent YurdagulMarket cap (USDm) 1,097 Contact +90 212 3764612
Price relative
Source: HSBC
Note: Priced at close of 24 Nov 2015
12.00
14.00
16.00
18.00
20.00
22.00
24.00
26.00
28.00
12.00
14.00
16.00
18.00
20.00
22.00
24.00
26.00
28.00
2013 2014 2015 2016Migros Rel to ISTANBUL COMP

abc
EQUITIES CONSUMER BRANDS & RETAIL
26 November 2015
30
Disclosure appendix
Analyst Certification
The following analyst(s), economist(s), and/or strategist(s) who is(are) primarily responsible for this report, certifies(y) that the
opinion(s) on the subject security(ies) or issuer(s) and/or any other views or forecasts expressed herein accurately reflect their
personal view(s) and that no part of their compensation was, is or will be directly or indirectly related to the specific
recommendation(s) or views contained in this research report: Bulent Yurdagul
Important disclosures
Equities: Stock ratings and basis for financial analysis
HSBC believes an investor's decision to buy or sell a stock should depend on individual circumstances such as the investor's
existing holdings, risk tolerance and other considerations and that investors utilise various disciplines and investment horizons
when making investment decisions. Ratings should not be used or relied on in isolation as investment advice. Different
securities firms use a variety of ratings terms as well as different rating systems to describe their recommendations and
therefore investors should carefully read the definitions of the ratings used in each research report. Further, investors should
carefully read the entire research report and not infer its contents from the rating because research reports contain more
complete information concerning the analysts' views and the basis for the rating.
From 23rd March 2015 HSBC has assigned ratings on the following basis:
The target price is based on the analyst’s assessment of the stock’s actual current value, although we expect it to take six to 12
months for the market price to reflect this. When the target price is more than 20% above the current share price, the stock will
be classified as a Buy; when it is between 5% and 20% above the current share price, the stock may be classified as a Buy or a
Hold; when it is between 5% below and 5% above the current share price, the stock will be classified as a Hold; when it is
between 5% and 20% below the current share price, the stock may be classified as a Hold or a Reduce; and when it is more
than 20% below the current share price, the stock will be classified as a Reduce.
Our ratings are re-calibrated against these bands at the time of any 'material change' (initiation or resumption of coverage,
change in target price or estimates).
Upside/Downside is the percentage difference between the target price and the share price.
Prior to this date, HSBC’s rating structure was applied on the following basis:
For each stock we set a required rate of return calculated from the cost of equity for that stock’s domestic or, as appropriate,
regional market established by our strategy team. The target price for a stock represented the value the analyst expected the
stock to reach over our performance horizon. The performance horizon was 12 months. For a stock to be classified as
Overweight, the potential return, which equals the percentage difference between the current share price and the target price,
including the forecast dividend yield when indicated, had to exceed the required return by at least 5 percentage points over the
succeeding 12 months (or 10 percentage points for a stock classified as Volatile*). For a stock to be classified as Underweight,
the stock was expected to underperform its required return by at least 5 percentage points over the succeeding 12 months (or
10 percentage points for a stock classified as Volatile*). Stocks between these bands were classified as Neutral.
*A stock was classified as volatile if its historical volatility had exceeded 40%, if the stock had been listed for less than 12
months (unless it was in an industry or sector where volatility is low) or if the analyst expected significant volatility. However,
stocks which we did not consider volatile may in fact also have behaved in such a way. Historical volatility was defined as the
past month's average of the daily 365-day moving average volatilities. In order to avoid misleadingly frequent changes in rating,
however, volatility had to move 2.5 percentage points past the 40% benchmark in either direction for a stock's status to change.

abc
31
EQUITIES CONSUMER BRANDS & RETAIL
26 November 2015
Rating distribution for long-term investment opportunities
As of 25 November 2015, the distribution of all ratings published is as follows: Buy 46% (31% of these provided with Investment Banking Services)
Hold 40% (29% of these provided with Investment Banking Services)
Sell 14% (17% of these provided with Investment Banking Services)
For the purposes of the distribution above the following mapping structure is used during the transition from the previous to
current rating models: under our previous model, Overweight = Buy, Neutral = Hold and Underweight = Sell; under our current
model Buy = Buy, Hold = Hold and Reduce = Sell. For rating definitions under both models, please see “Stock ratings and basis
for financial analysis” above.
Share price and rating changes for long-term investment opportunities
Bizim Toptan (BIZIM.IS) Share Price performance TRY
Vs HSBC rating history
Recommendation & price target history
From To Date
Overweight Neutral 18 March 2014 Neutral Overweight 16 July 2014 Overweight Buy 30 April 2015 Buy Hold 15 July 2015 Target Price Value Date
Price 1 34.00 16 January 2013 Price 2 35.00 29 April 2013 Price 3 38.50 15 May 2013 Price 4 32.00 05 September 2013 Price 5 28.60 07 November 2013 Price 6 23.30 03 February 2014 Price 7 23.80 03 March 2014 Price 8 22.30 02 May 2014 Price 9 23.20 23 July 2014 Price 10 21.40 20 October 2014 Price 11 23.70 13 November 2014 Price 12 23.40 22 January 2015 Price 13 17.00 30 April 2015 Price 14 14.00 15 July 2015 Source: HSBC
Source: HSBC
11
16
21
26
31
36
Nov
-10
Nov
-11
Nov
-12
Nov
-13
Nov
-14
Nov
-15

abc
EQUITIES CONSUMER BRANDS & RETAIL
26 November 2015
32
BIM (BIMAS.IS) Share Price performance TRY Vs HSBC
rating history
Recommendation & price target history
From To Date
Neutral Overweight 15 May 2013 Overweight Buy 30 April 2015 Target Price Value Date
Price 1 48.00 18 February 2013 Price 2 49.00 29 April 2013 Price 3 57.00 15 May 2013 Price 4 46.00 05 September 2013 Price 5 50.00 21 October 2013 Price 6 51.00 03 March 2014 Price 7 53.00 07 March 2014 Price 8 58.00 02 May 2014 Price 9 59.00 20 August 2014 Price 10 57.00 20 October 2014 Price 11 59.00 13 November 2014 Price 12 55.00 11 March 2015 Price 13 54.00 30 April 2015 Price 14 55.00 15 July 2015 Price 15 56.00 24 August 2015 Price 16 64.00 14 October 2015 Source: HSBC
Source: HSBC
Migros (MGROS.IS) Share Price performance TRY Vs
HSBC rating history
Recommendation & price target history
From To Date
Overweight Neutral 20 October 2014 Neutral Hold 30 April 2015 Hold Buy 04 November 2015 Target Price Value Date
Price 1 27.00 18 February 2013 Price 2 29.40 15 May 2013 Price 3 21.70 05 September 2013 Price 4 21.80 07 November 2013 Price 5 20.10 29 January 2014 Price 6 20.60 18 March 2014 Price 7 22.50 02 May 2014 Price 8 22.80 20 August 2014 Price 9 21.40 20 October 2014 Price 10 25.00 13 November 2014 Price 11 26.50 22 January 2015 Price 12 24.60 30 April 2015 Price 13 19.60 26 August 2015 Price 14 23.00 04 November 2015 Source: HSBC
Source: HSBC
7
17
27
37
47
57
Nov
-10
Nov
-11
Nov
-12
Nov
-13
Nov
-14
Nov
-15
5
10
15
20
25
30
35
Nov
-10
Nov
-11
Nov
-12
Nov
-13
Nov
-14
Nov
-15

abc
33
EQUITIES CONSUMER BRANDS & RETAIL
26 November 2015
HSBC & Analyst disclosures
Disclosure checklist
Company Ticker Recent price Price Date Disclosure
BIZIM TOPTAN BIZIM.IS 13.15 24-Nov-2015 7
MIGROS MGROS.IS 17.70 24-Nov-2015 6, 7
Source: HSBC
1 HSBC has managed or co-managed a public offering of securities for this company within the past 12 months. 2 HSBC expects to receive or intends to seek compensation for investment banking services from this company in the next 3
months. 3 At the time of publication of this report, HSBC Securities (USA) Inc. is a Market Maker in securities issued by this
company. 4 As of 31 October 2015 HSBC beneficially owned 1% or more of a class of common equity securities of this company. 5 As of 30 September 2015, this company was a client of HSBC or had during the preceding 12 month period been a client
of and/or paid compensation to HSBC in respect of investment banking services. 6 As of 30 September 2015, this company was a client of HSBC or had during the preceding 12 month period been a client
of and/or paid compensation to HSBC in respect of non-investment banking securities-related services. 7 As of 30 September 2015, this company was a client of HSBC or had during the preceding 12 month period been a client
of and/or paid compensation to HSBC in respect of non-securities services. 8 A covering analyst/s has received compensation from this company in the past 12 months. 9 A covering analyst/s or a member of his/her household has a financial interest in the securities of this company, as
detailed below. 10 A covering analyst/s or a member of his/her household is an officer, director or supervisory board member of this
company, as detailed below. 11 At the time of publication of this report, HSBC is a non-US Market Maker in securities issued by this company and/or in
securities in respect of this company
HSBC and its affiliates will from time to time sell to and buy from customers the securities/instruments (including derivatives) of
companies covered in HSBC Research on a principal or agency basis.
Analysts, economists, and strategists are paid in part by reference to the profitability of HSBC which includes investment
banking revenues.
Whether, or in what time frame, an update of this analysis will be published is not determined in advance.
For disclosures in respect of any company mentioned in this report, please see the most recently published report on that
company available at www.hsbcnet.com/research.
Additional disclosures
1 This report is dated as at 26 November 2015. 2 All market data included in this report are dated as at close 24 November 2015, unless otherwise indicated in the report. 3 HSBC has procedures in place to identify and manage any potential conflicts of interest that arise in connection with its
Research business. HSBC's analysts and its other staff who are involved in the preparation and dissemination of Research operate and have a management reporting line independent of HSBC's Investment Banking business. Information Barrier procedures are in place between the Investment Banking and Research businesses to ensure that any confidential and/or price sensitive information is handled in an appropriate manner.

abc
EQUITIES CONSUMER BRANDS & RETAIL
26 November 2015
34
Disclaimer
* Legal entities as at 30 May 2014
‘UAE’ HSBC Bank Middle East Limited, Dubai; ‘HK’ The Hongkong and Shanghai Banking Corporation Limited, Hong
Kong; ‘TW’ HSBC Securities (Taiwan) Corporation Limited; 'CA' HSBC Bank Canada, Toronto; HSBC Bank, Paris Branch;
HSBC France; ‘DE’ HSBC Trinkaus & Burkhardt AG, Düsseldorf; 000 HSBC Bank (RR), Moscow; ‘IN’ HSBC Securities and
Capital Markets (India) Private Limited, Mumbai; ‘JP’ HSBC Securities (Japan) Limited, Tokyo; ‘EG’ HSBC Securities Egypt
SAE, Cairo; ‘CN’ HSBC Investment Bank Asia Limited, Beijing Representative Office; The Hongkong and Shanghai
Banking Corporation Limited, Singapore Branch; The Hongkong and Shanghai Banking Corporation Limited, Seoul
Securities Branch; The Hongkong and Shanghai Banking Corporation Limited, Seoul Branch; HSBC Securities (South
Africa) (Pty) Ltd, Johannesburg; HSBC Bank plc, London, Madrid, Milan, Stockholm, Tel Aviv; ‘US’ HSBC Securities (USA)
Inc, New York; HSBC Yatirim Menkul Degerler AS, Istanbul; HSBC México, SA, Institución de Banca Múltiple, Grupo
Financiero HSBC; HSBC Bank Brasil SA – Banco Múltiplo; HSBC Bank Australia Limited; HSBC Bank Argentina SA; HSBC
Saudi Arabia Limited; The Hongkong and Shanghai Banking Corporation Limited, New Zealand Branch incorporated in
Hong Kong SAR; The Hongkong and Shanghai Banking Corporation Limited, Bangkok Branch
Issuer of report
HSBC Yatirim Menkul Degerler A.S.
Buyukdere Caddesi No: 122 / D Kat:9
Esentepe/Sisli 34394 Istanbul, Turkey
Telephone: +90 212 376 46 00
Fax: +90 212 376 49 13
www.research.hsbc.com
www.hsbcyatirim.com.tr
This document has been issued by HSBC Yatırım Menkul Degerler A.S. (HSBC) for the information of its customers only. If it is received by a customer of an affiliate of HSBC, its provision to
the recipient is subject to the terms of business in place between the recipient and such affiliate.
HSBC has based this document on information obtained from sources it believes to be reliable but which it has not independently verified; HSBC makes no guarantee, representation or
warranty and accepts no responsibility or liability as to its accuracy or completeness. Expressions of opinion are those of the Research Department of HSBC only and are subject to change
without notice.
The information, comments and recommendations involved here are not within the scope of investment consultancy. Investment consultancy services are only provided within the framework of
the investment consultancy agreement as agreed between brokerage companies, portfolio management companies, banks not accepting deposits, and the customer. The conclusions arrived
at here are based upon the preferred calculation method and/or the personal opinions of the individuals responsible for the comments and recommendations, so they may not be appropriate for
your financial situation and risk and return preferences. Therefore, any investment decision made only on the basis of the information involved here may not lead to the optimum results.
HSBC and its affiliates and/or their officers, directors and employees may have positions in any securities mentioned in this document (or in any related investment) and may from time to time
add to or dispose of any such securities (or investment). HSBC and its affiliates may have assumed an underwriting commitment in the securities of companies discussed in this document (or
in related investments), may sell them to or buy them from customers on a principal basis and may also perform or seek to perform investment banking or underwriting services for or relating to
those companies and may also be represented in the supervisory board or any other committee of those companies.
The information and opinions contained within the research reports are based upon rates of taxation applicable at the time of publication but which are subject to change from time to time. Past
performance is not necessarily a guide to future performance. The value of any investment or income may go down as well as up and you may not get back the full amount invested. Where an
investment is denominated in a currency other than the local currency of the recipient of the research report, changes in the exchange rates may have an adverse effect on the value, price or
income of that investment. In case of investments for which there is no recognised market it may be difficult for investors to sell their investments or to obtain reliable information about its value
or the extent of the risk to which it is exposed.
HSBC Securities (USA) Inc. accepts responsibility for the content of this research report prepared by its non-US foreign affiliate. All U.S. persons receiving and/or accessing this report and
wishing to effect transactions in any security discussed herein should do so with HSBC Securities (USA) Inc. in the United States and not with its non-US foreign affiliate, the issuer of this
report.
In the UK this report may only be distributed to persons of a kind described in Article 19(5) of the Financial Services and Markets Act 2000 (Financial Promotion) Order 2005. The protections afforded by
the UK regulatory regime are available only to those dealing with a representative of HSBC Bank plc in the UK. In Singapore, this publication is distributed by The Hongkong and Shanghai Banking
Corporation Limited, Singapore Branch for the general information of institutional investors or other persons specified in Sections 274 and 304 of the Securities and Futures Act (Chapter 289) (“SFA”) and
accredited investors and other persons in accordance with the conditions specified in Sections 275 and 305 of the SFA. This publication is not a prospectus as defined in the SFA. It may not be further
distributed in whole or in part for any purpose. The Hongkong and Shanghai Banking Corporation Limited Singapore Branch is regulated by the Monetary Authority of Singapore. Recipients in Singapore
should contact a "Hongkong and Shanghai Banking Corporation Limited, Singapore Branch" representative in respect of any matters arising from, or in connection with this report. In Canada, this
publication may be distributed by HSBC Securities (Canada) Inc for the information of its customers only. All inquiries by such recipients must be directed to HSBC Securities (Canada) Inc. In Australia,
this publication may be distributed by HSBC Stockbroking (Australia) Pty Limited. In Malaysia, this publication may be distributed by HSBC Research (Malaysia) Sdn Bhd. In Korea, this publication is
distributed by either The Hongkong and Shanghai Banking Corporation Limited, Seoul Securities Branch ("HBAP SLS") or The Hongkong and Shanghai Banking Corporation Limited, Seoul Branch
("HBAP SEL") for the general information of professional investors specified in Article 9 of the Financial Investment Services and Capital Markets Act (“FSCMA”). This publication is not a prospectus as
defined in the FSCMA. It may not be further distributed in whole or in part for any purpose. Both HBAP SLS and HBAP SEL are regulated by the Financial Services Commission and the Financial
Supervisory Service of Korea. This publication is distributed in New Zealand by The Hongkong and Shanghai Banking Corporation Limited, New Zealand Branch incorporated in Hong Kong SAR. In
Japan, this publication may be distributed by HSBC Securities (Japan) Limited. It may not be reproduced or further distributed in whole or in part for any purpose.
In Australia, this publication has been distributed by The Hongkong and Shanghai Banking Corporation Limited (ABN 65 117 925 970, AFSL 301737) for the general information of its
“wholesale” customers (as defined in the Corporations Act 2001). Where distributed to retail customers, this research is distributed by HSBC Bank Australia Limited (AFSL No. 232595). These
respective entities make no representations that the products or services mentioned in this document are available to persons in Australia or are necessarily suitable for any particular person or
appropriate in accordance with local law. No consideration has been given to the particular investment objectives, financial situation or particular needs of any recipient. In Canada, this
document has been distributed by HSBC Bank Canada and/or its affiliates. Where this document contains market updates/overviews, or similar materials (collectively deemed “Commentary” in
Canada although other affiliate jurisdictions may term “Commentary” as either “macro-research” or “research”), the Commentary is not an offer to sell, or a solicitation of an offer to sell or
subscribe for, any financial product or instrument (including, without limitation, any currencies, securities, commodities or other financial instruments).
This communication is only intended for investment professionals within Article 19 of the Financial Services and Markets Act 2000 (Financial Promotion) Order 2005. Persons who do not have professional
experience in matters relating to investments should not rely on it. HSBC Yatırım Menkul Degerler A.S. is regulated and authorised by the Central Bank of Turkey, Capital Markets Board, Ministry of
Finance, Takasbank and is a member of Istanbul Stock Exchange, Takasbank (Turkish Custodian Bank) and the Association of Capital Market Intermediary Institutions of Turkey.
© Copyright 2015, HSBC Yatirim Menkul Degerler A.S., ALL RIGHTS RESERVED. No part of this publication may be reproduced, stored in a retrieval system, or transmitted, on any form or by
any means, electronic, mechanical, photocopying, recording, or otherwise, without the prior written permission of HSBC. MICA (P) 073/06/2015 , MICA (P) 136/02/2015 and MICA (P)
041/01/2015
[487516]

abc
Co-Head of Turkey Equity Research Cenk Orcan +90 212 376 46 14 [email protected]
Co-Head of Turkey Equity Research Bulent Yurdagul +90 212 376 46 12 [email protected]
Analyst Levent Bayar +90 212 376 46 17 [email protected]
Chief Economist Melis Metiner +44 20 3359 2636 [email protected]
Turkey Research Team