TURKISH AIRLINES · 6 Regional Yield Development in USD (4Q’17 vs 4Q’18) Domestic America...
42
1 4Q’18 Results Summary TURKISH AIRLINES
Transcript of TURKISH AIRLINES · 6 Regional Yield Development in USD (4Q’17 vs 4Q’18) Domestic America...

1
4Q’18 Results Summary
TURKISH AIRLINES
2
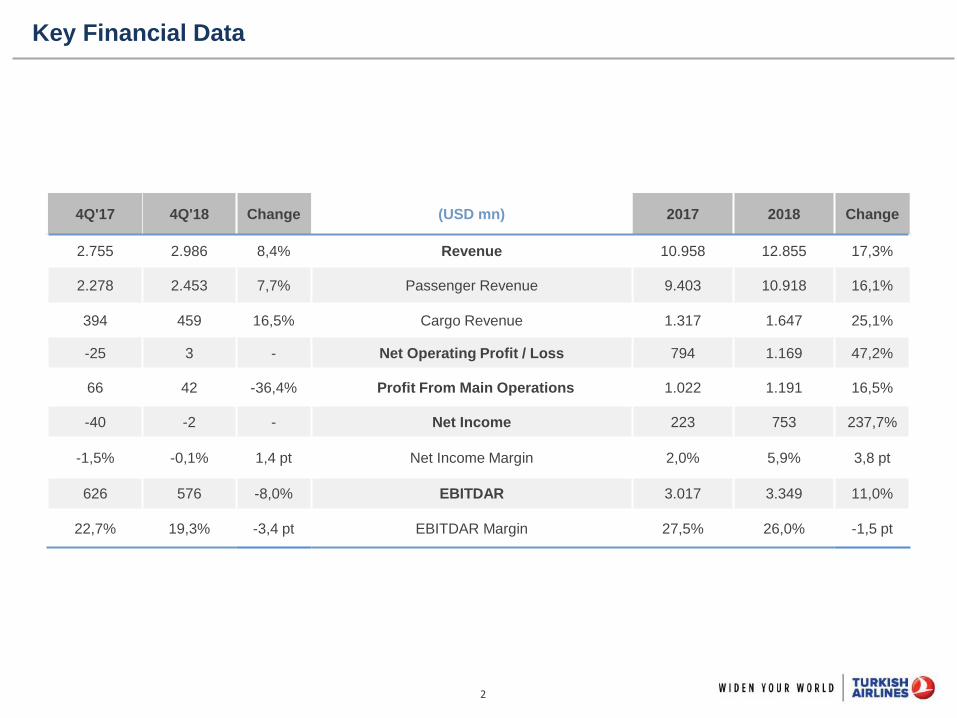
Key Financial Data
4Q'17 4Q'18 Change (USD mn) 2017 2018 Change
2.755 2.986 8,4% Revenue 10.958 12.855 17,3%
2.278 2.453 7,7% Passenger Revenue 9.403 10.918 16,1%
394 459 16,5% Cargo Revenue 1.317 1.647 25,1%
-25 3 - Net Operating Profit / Loss 794 1.169 47,2%
66 42 -36,4% Profit From Main Operations 1.022 1.191 16,5%
-40 -2 - Net Income 223 753 237,7%
-1,5% -0,1% 1,4 pt Net Income Margin 2,0% 5,9% 3,8 pt
626 576 -8,0% EBITDAR 3.017 3.349 11,0%
22,7% 19,3% -3,4 pt EBITDAR Margin 27,5% 26,0% -1,5 pt
3
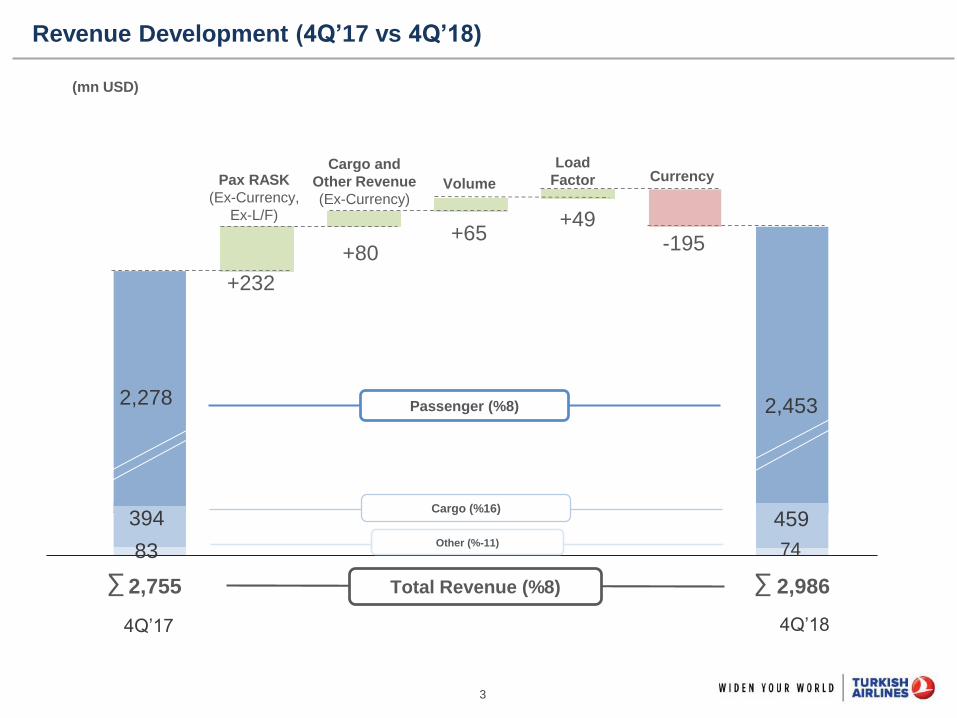
Gelir Gelişimi (2Q’16 ve 2Q’17) Revenue Development (4Q’17 vs 4Q’18)
2,755 Total Revenue (%8)∑ 2,986∑
4Q’17 4Q’18
Other (%-11)
Cargo (%16)
2,278
+232
+65
Passenger (%8)
(mn USD)
394
83
459
74
-195+49
+80
CurrencyVolumePax RASK
(Ex-Currency,
Ex-L/F)
Load
FactorCargo and
Other Revenue
(Ex-Currency)
2,453
4
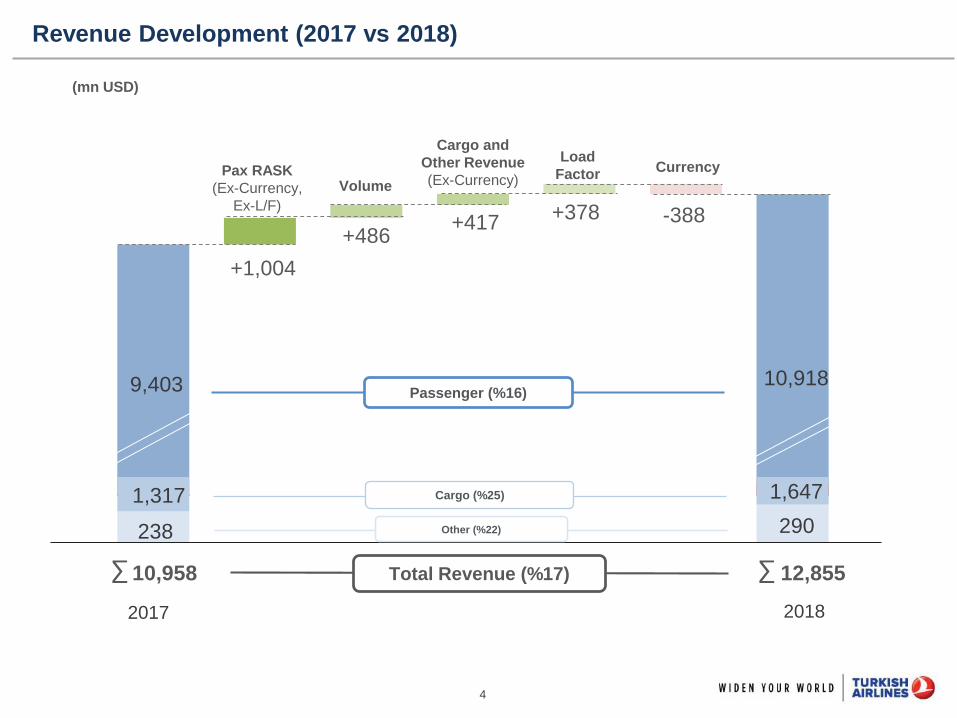
Gelir Gelişimi (2Q’16 ve 2Q’17) Revenue Development (2017 vs 2018)
10,958 Total Revenue (%17)∑ 12,855∑
2017 2018
Other (%22)
Cargo (%25)
9,403
+1,004
+378
Passenger (%16)
(mn USD)
1,317
238
1,647
290
-388+417+486
Currency
VolumePax RASK
(Ex-Currency,
Ex-L/F)
Load
Factor
Cargo and
Other Revenue
(Ex-Currency)
10,918

5
6,67 6,857,30
6,877,32 7,50
4Q'17 4Q'18 4Q'18 ex-currency 2017 2018 2018 ex-currency
5,81 5,926,29
5,816,30 6,44
4Q'17 4Q'18 4Q'18 ex-currency 2017 2018 2018 ex-currency
RASK (USc)
Unit Revenue Development
R/Y (Usc)
%9,4 %9,3
%8,2%10,9
R/Y : Yield : Passenger Revenue / RPK (Scheduled and Unscheduled)RASK : Passenger and Cargo Revenue / ASK* (Scheduled and Unscheduled)* ASK value is adjusted for cargo operations.

6
Regional Yield Development in USD (4Q’17 vs 4Q’18)
Domestic
America
Middle EastAfrica
Europe Asia / Far East
R/Y : Yield : Passenger Revenue / RPK (Scheduled and Unscheduled)RASK : Passenger and Cargo Revenue / ASK* (Scheduled and Unscheduled)* ASK value is adjusted for cargo operations.
2,3%6,9%
9,4% 12,6%
ASK RASK R/YR/Y ex-currency
5,6%2,1% 2,5%
6,7%
ASK RASK R/YR/Y ex-currency
1,7%
-0,9%
2,9%6,7%
ASK RASK R/YR/Y ex-currency
1,7%10,5%
4,1% 6,9%
ASK RASK R/YR/Y ex-currency
-0,6%
-8,1% -7,9%
23,6%ASK RASK R/Y
R/Y ex-currency
5,1% 2,6% 1,4% 3,3%
ASK RASK R/YR/Y ex-currency

7
Regional Yield Development in USD (2017 vs 2018)
Domestic
America
Middle EastAfrica
Europe Asia / Far East
R/Y : Yield : Passenger Revenue / RPK (Scheduled and Unscheduled)RASK : Passenger and Cargo Revenue / ASK* (Scheduled and Unscheduled)* ASK value is adjusted for cargo operations.
3,5%13,0%
12,2%13,5%
ASK RASK R/YR/Y ex-currency
6,6%11,9% 10,3% 9,2%
ASK RASK R/YR/Y ex-currency
4,4%8,3% 8,2% 7,4%
ASK RASK R/YR/Y ex-currency
4,1%
13,9%6,7% 6,0%
ASK RASK R/YR/Y ex-currency
7,6%
-5,6% -7,0%
15,2%
ASK RASK R/YR/Y ex-currency
3,7% 6,8% 4,4% 4,2%
ASK RASK R/YR/Y ex-currency
8
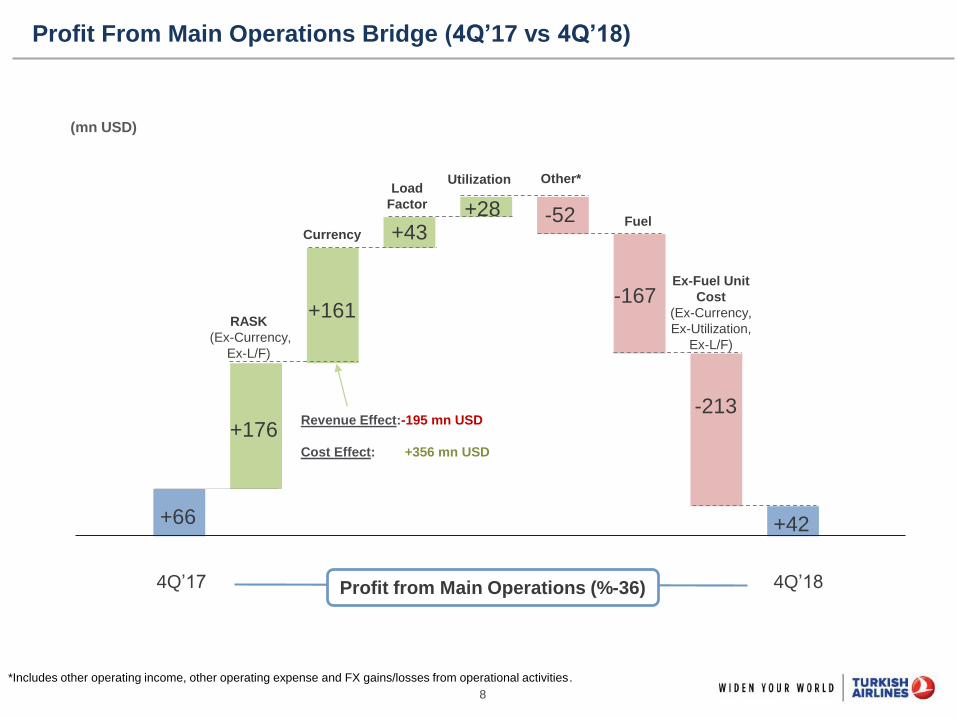
Gelir Gelişimi (2Q’16 ve 2Q’17) Profit From Main Operations Bridge (4Q’17 vs 4Q’18)
+66
+176
+28+43
-213
-167
+42
Profit from Main Operations (%-36)
(mn USD)
4Q’17 4Q’18
+161
-52
Load
Factor
Utilization
CurrencyFuel
Ex-Fuel Unit
Cost
(Ex-Currency,
Ex-Utilization,
Ex-L/F)
RASK
(Ex-Currency,
Ex-L/F)
Other*
Revenue Effect:-195 mn USD
Cost Effect: +356 mn USD
*Includes other operating income, other operating expense and FX gains/losses from operational activities.
9
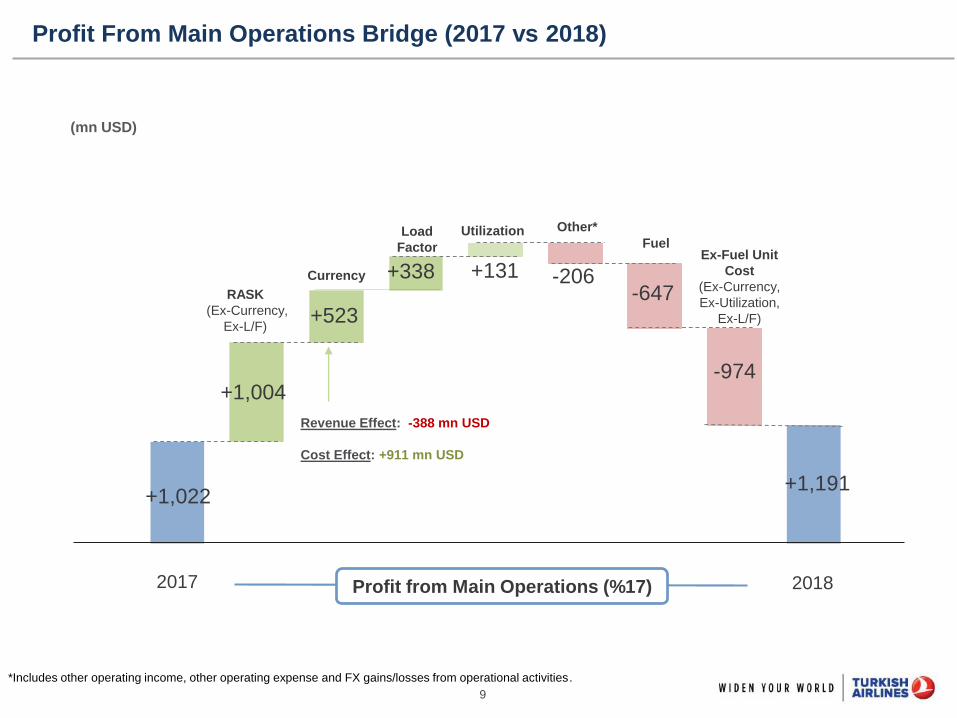
Gelir Gelişimi (2Q’16 ve 2Q’17) Profit From Main Operations Bridge (2017 vs 2018)
+1,022
+1,004
+131
+523
-206
-974
+1,191
Profit from Main Operations (%17)
(mn USD)
2017 2018
+338-647
Load
Factor
Utilization
Currency
FuelEx-Fuel Unit
Cost
(Ex-Currency,
Ex-Utilization,
Ex-L/F)
RASK
(Ex-Currency,
Ex-L/F)
Other*
Revenue Effect: -388 mn USD
Cost Effect: +911 mn USD
*Includes other operating income, other operating expense and FX gains/losses from operational activities.
10
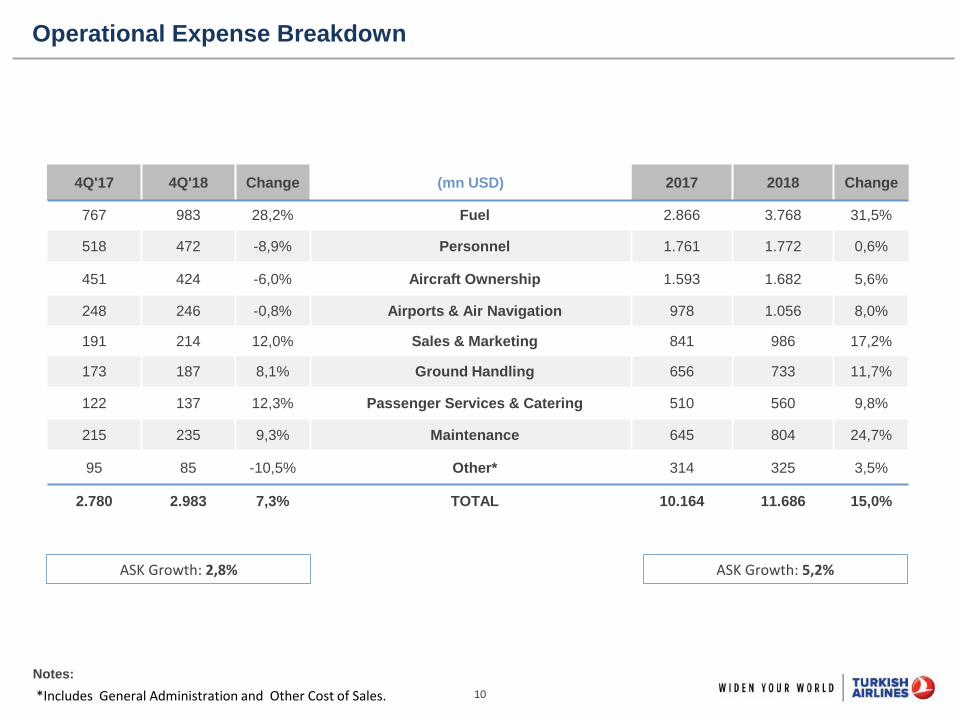
Operational Expense Breakdown
Notes:
*Includes General Administration and Other Cost of Sales.
ASK Growth: 5,2%ASK Growth: 2,8%
4Q'17 4Q'18 Change (mn USD) 2017 2018 Change
767 983 28,2% Fuel 2.866 3.768 31,5%
518 472 -8,9% Personnel 1.761 1.772 0,6%
451 424 -6,0% Aircraft Ownership 1.593 1.682 5,6%
248 246 -0,8% Airports & Air Navigation 978 1.056 8,0%
191 214 12,0% Sales & Marketing 841 986 17,2%
173 187 8,1% Ground Handling 656 733 11,7%
122 137 12,3% Passenger Services & Catering 510 560 9,8%
215 235 9,3% Maintenance 645 804 24,7%
95 85 -10,5% Other* 314 325 3,5%
2.780 2.983 7,3% TOTAL 10.164 11.686 15,0%

11
CASK Breakdown
Ex-Fuel CASK : -3,4% Ex-Fuel CASK : 3,2%
4Q'17 4Q'18 Change (USc) 2017 2018 Change
1,80 2,24 24,6% Fuel 1,66 2,07 25,0%
1,22 1,08 -11,4% Personnel 1,02 0,97 -4,3%
1,06 0,97 -8,6% Aircraft Ownership 0,92 0,92 0,4%
0,58 0,56 -3,5% Airports & Air Navigation 0,57 0,58 2,7%
0,45 0,49 8,9% Sales & Marketing 0,49 0,54 11,5%
0,41 0,43 5,1% Ground Handling 0,38 0,40 6,2%
0,29 0,31 9,2% Passenger Services & Catering 0,29 0,31 4,4%
0,50 0,54 6,3% Maintenance 0,37 0,44 18,5%
0,22 0,19 -13,0% Other 0,18 0,18 -1,6%
6,52 6,81 4,3% TOTAL 5,87 6,42 9,3%

12
Selected KPI’s
4Q'17 4Q'18 Change 2017 2018 Change
629 758 20,4% Fuel Price (Usd/ton) 591 714 20,7%
3,32 3,29 -0,8% Fuel Consumption (lt) per 100 ASK2 3,29 3,31 0,6%
1.340 1.220 -9,0% Aircraft Ownership Cost per BH 1.171 1.174 0,3%
639 676 5,9% Maintenance Cost per BH 474 561 18,4%
1.507 1.604 6,4% Handling Cost per Landing 1.397 1.484 6,2%
1.218 1.166 -4,3% Airports & Air Navigation Cost per km Flown 1.184 1.219 2,9%
7,18 7,80 8,7% Passenger Services & Catering Cost per Pax 7,43 7,45 0,3%
6,9% 7,2% 0,2 pt Sales & Marketing Cost / Total Revenue 7,7% 7,7% -0,0 pt

13
EBITDAR Calculation
Notes:
- For 2018 Turkish Technic’s contribution to EBITDAR through consolidation is 226 mn USD, compared to 173 mn in 2017.
- For 2018 adjustments for heavy maintenance of operational lease expenses were 743 mn USD compared to 654 mn USD in 2017.
4Q'17 4Q'18 Change EBITDAR (mn USD) 2017 2018 Change
2.755 2.986 8,4% Sales Revenue 10.958 12.855 17,3%
2.434 2.635 8,3% Cost of Sales (-) 8.762 10.136 15,7%
321 351 9,3% GROSS PROFIT / (LOSS) 2.196 2.719 23,8%
71 56 -21,1% General Administrative Expenses (-) 275 260 -5,5%
275 292 6,2% Marketing and Sales Expenses (-) 1.127 1.290 14,5%
-25 3 - NET OPERATING PROFIT / (LOSS) 794 1.169 47,2%
97 51 -47,4% Other Operating Income 264 165 -37,5%
6 12 100,0% Other Operating Expense (-) 36 143 297,2%
66 42 -36,4% Profit / (Loss) from Main Operations 1.022 1.191 16,5%
12 14 16,7% Adjustments 164 185 12,8%
-4 -5 -Share of Investments' Profit / Loss Accounted by
Using The Equity Method102 123 20,6%
16 19 18,8% Income From Government Incentives 62 62 0,0%
78 56 -28,2% EBIT 1.186 1.376 16,0%
308 280 -9,1% Depreciation 1.066 1.087 2,0%
386 336 -13,0% EBITDA 2.252 2.463 9,4%
209 208 -0,5% Adjusted Operating Lease Expenses1 654 743 13,7%
31 32 3,5% Adjusted Short term Lease Expenses (Wet-lease)2 112 142 27,6%
626 576 -8,0% EBITDAR 3.017 3.349 11,0%
22,7% 19,3% -3,43 EBITDAR MARGIN 27,5% 26,0% -1,49
1 Adjusted for A/C heavy maintenance 2
Adjusted for A/C rent and heavy maintenance portion (Aprox. 55%)

14
TURKISH AIRLINES
4Q’18 Results

15
Source: General Directorate of State Airports Authority (DHMI) – January 2019
(*): Adjusted for double count on Domestic Pax
Annual RPK Growth (%)
Aviation Sector & Economy
7,2% 5,6%
Turkish Market Growth (mn passengers)
Source: IATA
’13-’21F CAGR
38,142,7
48,5 51,2 54,8 56,461,2 63,9 66,6
73,380,3 84,0
71,2
83,5
97,2105,5
109,3113,1
2013 2014 2015 2016 2017 2018 2019F 2020F 2021F
Domestic (*) International
6,3%5,3% 5,2% 5,7%
7,3% 7,4%
8,0%6,5%
22,9%
26,7%
23,2%
16,2%
11,6%
6,3%
7,9% 8,9%
2011 2012 2013 2014 2015 2016 2017 2018
World RPK Growth THY RPK Growth

16
* As of 31.12.2018
Note: Diameters of the bubbles are proportional to the number of passengers carried.
Turkish Airlines Historical Growth Turkish Airlines Historical Growth
1.000
2.000
3.000
4.000
5.000
6.000
7.000
8.000
9.000
10.000
11.000
12.000
100 110 120 130 140 150 160 170 180 190 200 210 220 230 240 250 260 270 280 290 300 310 320
Wee
kly
Flig
hts
Destinations
2005-83
2006-103
2007-101
2008-127
2009-132
2010-153
2011-180
2012-202
2013-233
2014-261
2015
–299
2016 – 334 Aircraft
2017 - 329 Aircraft 69m pax
14m pax17m pax
20m pax
23m pax25m pax
29m pax
33m pax
48m pax
39m pax
55m pax 61m pax
63m pax4x growth in fleet,
5x growth in pax,
3x growth in # destinations since 20052018 - 332 Aircraft 75m pax

17
We Fly to 124 Countries
* As of 31.12.2018
EUROPE AFRICA MIDDLE EAST FAR EAST
43 COUNTRIES, 114 CITIES 37 COUNTRIES, 55 CITIES 13 COUNTRIES, 34 CITIES 22 COUNTRIES, 37 CITIES
Germany Russia Belgium Moldova Egypt Gabon Saudi Arabia UAE China Bangladesh
Munich Moscow Brussels Chisinau Cairo Libreville Jeddah Dubai Beijing Dhaka
Frankfurt Sochi Bulgaria Poland Alexandria Mali Madinah Abu Dhabi Guangzhou Indonesia
Berlin St. Petersburg Sofia Warsaw Hurghada Bamako Riyadh Lebanon Shanghai Jakarta
Stuttgart Kazan Varna Belarus Sharmel-Sheikh Burkina Faso Dammam Beirut Taipei Maldives
Düsseldorf Rostov Romania Minsk Algeria Ougadougou Yanbu Jordan Hong Kong Male
Cologne Ekaterinburg Bucharest Slovakia Algiers Cote D'Ivore El Qassim Amman Pakistan Singapore
Hamburg Ufa Cluj Kosice Oran Abidjan Taif Akabe Karachi Singapore
Hanover Astrakhan Constanta Constantine Chad Iran Qatar Islamabad Sri Lanka
Nuremberg Novosibirsk Hungary Tlemcen N'Djamena Tehran Doha Lahore Colombo
Bremen Stravropol Budapest Batna Benin Mashad Bahrain Kyrgyzstan Uzbekistan
Friedrichshafen Voronezh Czech Rep. South Africa Cotonou Shiraz Bahrain Bishkek Tashkent
Leipzig Samara Prague Johannesburg Guinea Tabriz Oman Osh SamarkandMünster Krasnador Croatia Cape Town Conakry Isfahan Muscat Kazakhstan Philippines
Baden-Baden Switzerland Zagreb Durban Mozambique Kermanshah Syria Almaty Manila
Italy Zurich Dubrovnik Nigeria Maputo Ahvaz Aleppo Astana Tajikistan
Milan Geneva Portugal Lagos Niger Israel Damascus Japan Dushanbe
Rome Basel Lisbon Abuja Niamey Tel Aviv Yemen Tokyo Khujand
Venice Ukraine Porto Kano Eritrea Iraq Aden Osaka Nepal
Bologna Kiev Bosnia Cameroon Asmara Erbil Sanaa India Kathmandu
Naples Odessa Sarajevo Douala Madagascar Baghdad Mumbai Mongolia
Catania Ivano-Frankivsk Finland Yaounde Antananarivo BasraFuture Routes
New Delhi Ulaanbaatar
Turin Dnepropetrovsk Helsinki Kenya Mauritius Sulaymaniyah Thailand
Pisa Kharkiv Norway Mombasa Port Louis Najaf Saudi Arabia Phuket
Bari Kherson OsloFuture Routes
Nairobi Seychelles Mosul Abha Bangkok
Genoa Zaporijya Albania Tanzania Seychelles Kuwait UAE Turkmenistan
France Lviv Tirana Azerbaijan Dar Es Selaam Libya Kuwait Sharjah Ashgabat
Paris Simferopol Ireland Lankeran Kilimenjaro Misurata Malaysia
Lyon Donetsk Dublin Poland Zanzibar Benghazi Kuala Lumpur
Nice Austria Kosovo Krakow Tunisia SebhaAMERICAS
South Korea
Marseille Vienna Pristina France Tunis Tripoli Seoul
Toulouse Salzburg Macedonia Nantes Djibouti Sierra Leone8 COUNTRIES, 17 CITIES
AfghanistanFuture Routes
Bordeaux Graz Skopje Spain Djibouti Freetown Kabul
UK Northern Cyprus Serbia La Coruna Ethiopia Comoros USA Panama Mazar-ı Sharif Indonesia
London Lefkosa Belgrade Russia Addis Ababa Moroni New York Panama Vietnam Denpasar
Manchester Azerbaijan Malta Makhachkala Ghana Gambia Los Angeles Cuba Ho Chi Minh
Birmingham Baku Malta Italia Accra Banjul Washington Havana Hanoi
Spain Ganja Slovenia Palermo Morocco Zambia Boston Venezuela
Barcelona Nakhichevan Ljublijana Finland Casablanca Lusaka Chicago CaracasDOMESTIC
Madrid Netherlands Montenegro Rovaniemi Rwanda Houston
Malaga Amsterdam Podgorica KigaliFuture Routes
Miami49 CITIES
Valencia Rotterdam Scotland Somalia Atlanta
Bilbao Greece Edinburgh Mogadishu Angola San Francisco
Athens Estonia Sudan Luanda CanadaFuture Routes
Thessaloniki Tallinn Khartoum Egypt Toronto
Sweden Latvia Uganda Aswan Montreal Mexico
Stockholm Riga Entebbe Luxor Argentina Mexico City
Gothenburg Lithuania Mauritania South Sudan Buenos Aires Cancun
Denmark Vilnius Nouakchott Juba Brazil USA
Copenhagen Luxemburg Senegal Morocco Sao Paulo Newark
Aalborg Luxembourg Dakar Marrakech Columbia
Billund Congo Sudan Bogota
Georgia Kinshasa Port Sudan
Tbilisi Republic of the Congo
Batumi Pointe-Noire
Nigeria
Port Harcourt
18
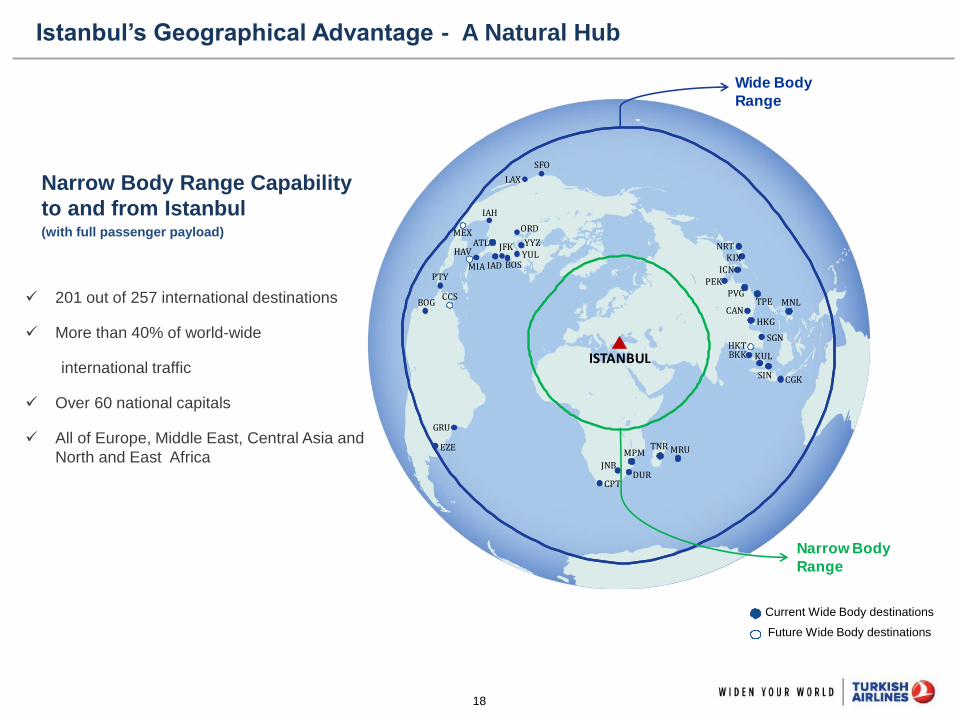
Istanbul’s Geographical Advantage - A Natural Hub
Narrow Body Range Capability
to and from Istanbul(with full passenger payload)
201 out of 257 international destinations
More than 40% of world-wide
international traffic
Over 60 national capitals
All of Europe, Middle East, Central Asia and
North and East Africa
Current Wide Body destinations
Future Wide Body destinations
Wide Body
Range
ISTANBUL
BOS
HKG
NRT
PEK
BKK
JNB
LAX
GRU
EZE
SGN
CPT
CAN
IAD
IAH
JFK
ICN
KIX
KUL
SIN
ORD
CGK
YYZ
YUL
PVG
Narrow Body
Range
SFO
MEX
BOGCCS
MIA
MNLTPE
MPM
DUR
ATL
MRU
HKT
TNR
HAV
PTY
19
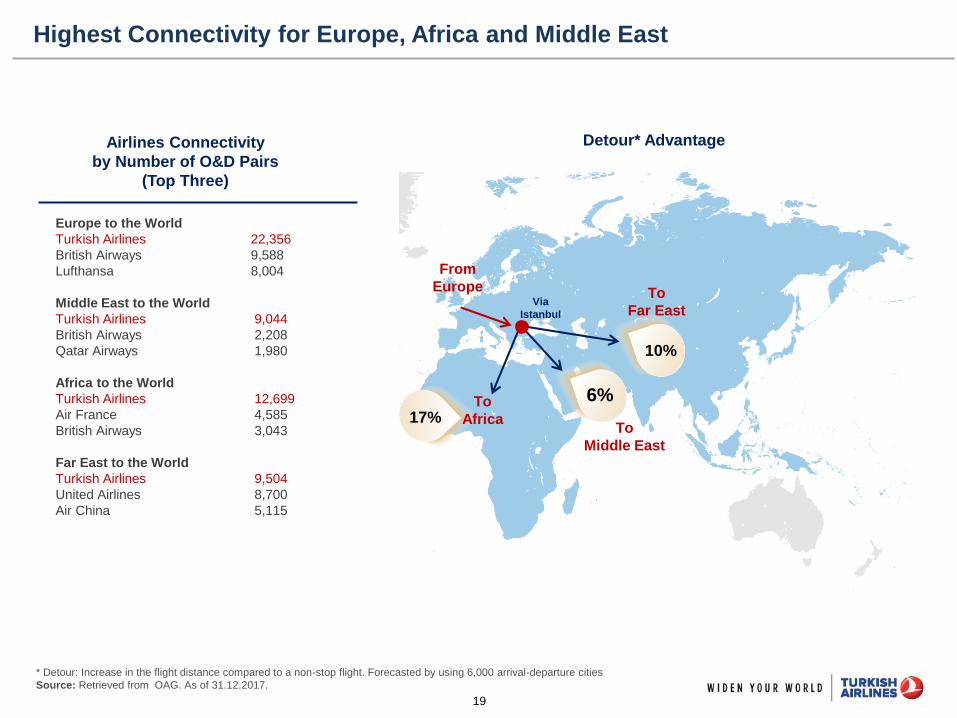
Highest Connectivity for Europe, Africa and Middle East
Europe to the World
Turkish Airlines 22,356
British Airways 9,588
Lufthansa 8,004
Middle East to the World
Turkish Airlines 9,044
British Airways 2,208
Qatar Airways 1,980
Africa to the World
Turkish Airlines 12,699
Air France 4,585
British Airways 3,043
Far East to the World
Turkish Airlines 9,504
United Airlines 8,700
Air China 5,115
17%
6%
10%
Detour* Advantage
Via
Istanbul
Airlines Connectivity
by Number of O&D Pairs
(Top Three)
From
Europe To
Far East
To
Middle East
To
Africa
* Detour: Increase in the flight distance compared to a non-stop flight. Forecasted by using 6,000 arrival-departure cities
Source: Retrieved from OAG. As of 31.12.2017.
20
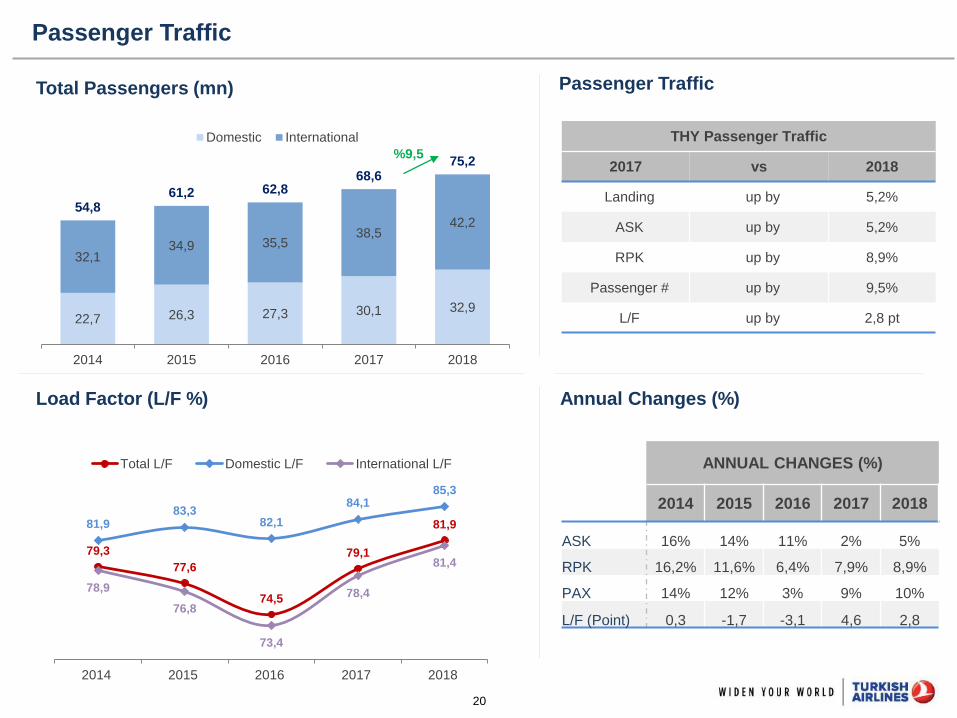
22,7 26,3 27,3 30,1 32,9
32,134,9 35,5
38,542,2
54,861,2 62,8
68,675,2
2014 2015 2016 2017 2018
Domestic International
Passenger Traffic
Total Passengers (mn) Passenger Traffic
Load Factor (L/F %) Annual Changes (%)
%9,5
ANNUAL CHANGES (%)
2014 2015 2016 2017 2018
ASK 16% 14% 11% 2% 5%
RPK 16,2% 11,6% 6,4% 7,9% 8,9%
PAX 14% 12% 3% 9% 10%
L/F (Point) 0,3 -1,7 -3,1 4,6 2,8
THY Passenger Traffic
2017 vs 2018
Landing up by 5,2%
ASK up by 5,2%
RPK up by 8,9%
Passenger # up by 9,5%
L/F up by 2,8 pt
79,3
77,6
74,5
79,1
81,981,983,3
82,1
84,185,3
78,9
76,8
73,4
78,4
81,4
2014 2015 2016 2017 2018
Total L/F Domestic L/F International L/F

21
Europe
Passenger Breakdown
Int’l Passenger Breakdown by GeographyInt’l to Int’l Transfer Passengers (’000)
Passenger Breakdown by Transfer Type
Note: Includes only scheduled passengers.
Note: Int’l to int’l transfer passengers’ share in total international passengers is 56%.
Domestic
Int’l Direct
Int’l-Int’l
Transfer
Int’l-Dom
Transfer
Middle East
Americas
Africa
Far East
2018
2017
2018
2017
15.564
18.363
20.93021.746
23.441
2014 2015 2016 2017 2018
32%
11%
13%
44%
31%
11%
14%
44%
55%
15%
14%
8%7%
56%
15%
14%
9%
7%

22
3.8062.997 2.673 2.866
3.768
1.694
1.640 1.865 1.761
1.772
4.929
5.203 5.604 5.537
6.146
10.4299.840 10.142 10.164
11.686
2014 2015 2016 2017 2018
Fuel Personnel Other
8.373 7.961 7.2908.034
9.537
1.4011.349
1.2501.295
1.3181.2961.212
1.251
1.629
2.00011.07010.522
9.792
10.958
12.855
2014 2015 2016 2017 2018
International Pax Domestic Pax Other
Revenues (mn USD) Expenses (mn USD)
Total Revenue and Expenses
Note: International and domestic pax revenue indicates scheduled pax revenue.
Other revenue includes cargo, charter and other revenue.
23
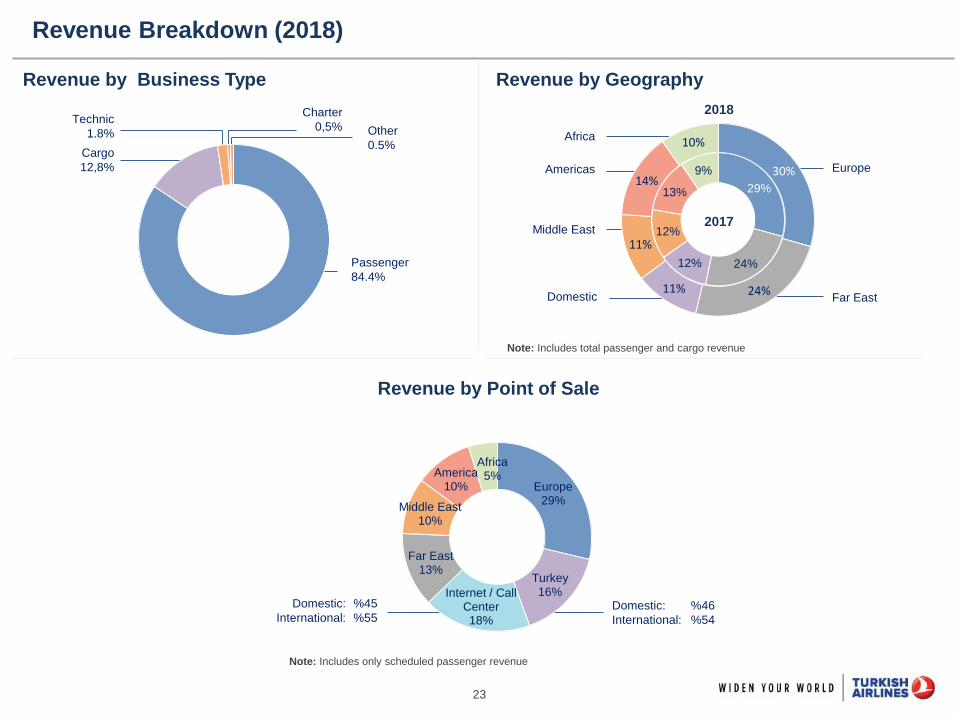
Revenue by Point of Sale
Revenue by Geography
Revenue Breakdown (2018)
Revenue by Business Type
Domestic:
International:
%45
%55Domestic:
International:
%46
%54
Note: Includes total passenger and cargo revenue
Note: Includes only scheduled passenger revenue
Middle East
Domestic
Americas
Africa
Far East
Europe
2018
2017
Charter
0,5% Other
0.5%
Technic
1.8%
Cargo
12,8%
Passenger
84.4%
Europe29%
Turkey16%Internet / Call
Center18%
Far East13%
Middle East10%
America10%
Africa5%
29%
24%12%
12%
13%
9% 30%
24%11%
11%
14%
10%
24
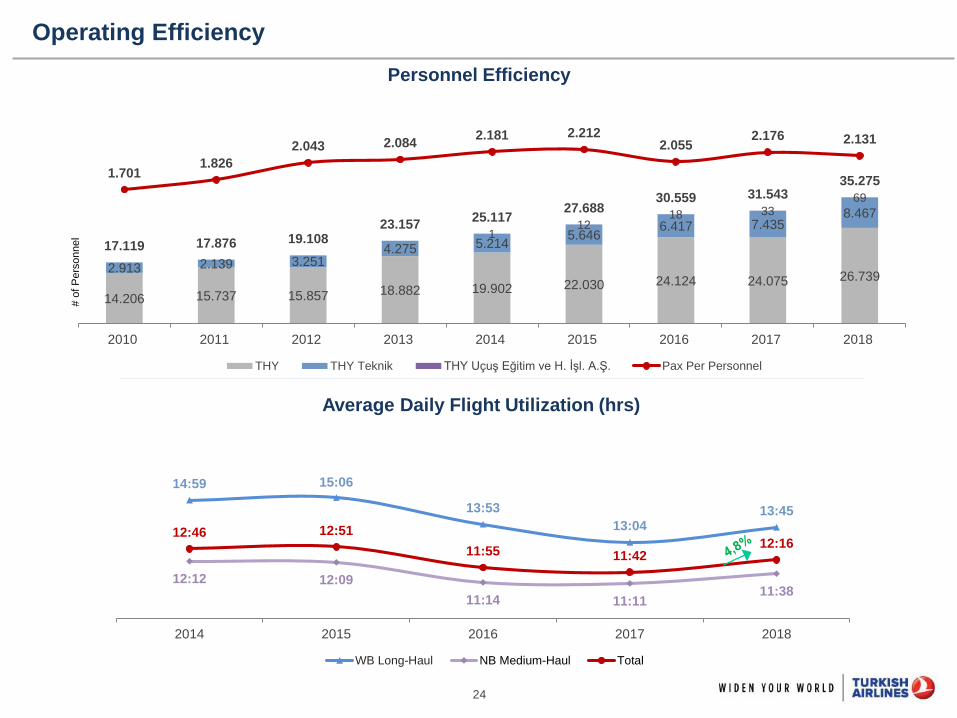
14:59 15:06
13:53
13:0413:45
12:12 12:09
11:14 11:1111:38
12:46 12:51
11:55 11:4212:16
2014 2015 2016 2017 2018
WB Long-Haul NB Medium-Haul Total
Personnel Efficiency
Average Daily Flight Utilization (hrs)
Operating Efficiency
# o
f P
ers
onnel
14.206 15.737 15.857 18.882 19.902 22.030 24.124 24.075 26.7392.913 2.139 3.251
4.275 5.2145.646
6.417 7.4358.467
112
18 3369
17.119 17.876 19.10823.157
25.11727.688
30.559 31.54335.275
1.7011.826
2.043 2.0842.181 2.212
2.0552.176 2.131
2010 2011 2012 2013 2014 2015 2016 2017 2018
THY THY Teknik THY Uçuş Eğitim ve H. İşl. A.Ş. Pax Per Personnel

25
EBITDAR Margin
Avg. EBITDAR Margin (2014-2018): 23%
18,8%
24,5%
16,6%
27,5% 26,0%
11.07010.522
9.792
10.958
12.855
2014 2015 2016 2017 2018
EBITDAR Margin Revenue (mn USD)
(mn USD) 2014 2015 2016 2017 2018 YoY Change
Revenue (mn USD) 11.070 10.522 9.792 10.958 12.855 17,3%
EBITDAR 2.085 2.580 1.628 3.017 3.349 11,0%
EBITDAR Margin 18,8% 24,5% 16,6% 27,5% 26,0% -1,5 pt
26
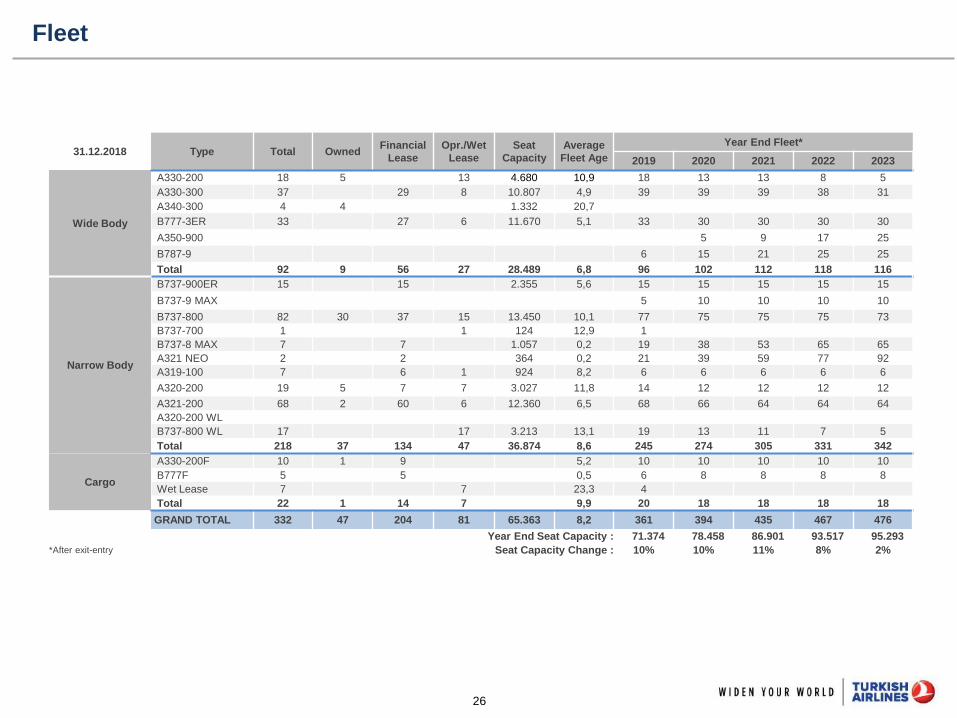
Fleet
31.12.2018 Type Total Owned Financial
Lease
Opr./Wet
Lease
Seat
Capacity
Average
Fleet Age
Year End Fleet*
2019 2020 2021 2022 2023
Wide Body
A330-200 18 5 13 4.680 10,9 18 13 13 8 5
A330-300 37 29 8 10.807 4,9 39 39 39 38 31
A340-300 4 4 1.332 20,7
B777-3ER 33 27 6 11.670 5,1 33 30 30 30 30
A350-900 5 9 17 25
B787-9 6 15 21 25 25
Total 92 9 56 27 28.489 6,8 96 102 112 118 116
Narrow Body
B737-900ER 15 15 2.355 5,6 15 15 15 15 15
B737-9 MAX 5 10 10 10 10
B737-800 82 30 37 15 13.450 10,1 77 75 75 75 73
B737-700 1 1 124 12,9 1
B737-8 MAX 7 7 1.057 0,2 19 38 53 65 65
A321 NEO 2 2 364 0,2 21 39 59 77 92
A319-100 7 6 1 924 8,2 6 6 6 6 6
A320-200 19 5 7 7 3.027 11,8 14 12 12 12 12
A321-200 68 2 60 6 12.360 6,5 68 66 64 64 64
A320-200 WL
B737-800 WL 17 17 3.213 13,1 19 13 11 7 5
Total 218 37 134 47 36.874 8,6 245 274 305 331 342
Cargo
A330-200F 10 1 9 5,2 10 10 10 10 10
B777F 5 5 0,5 6 8 8 8 8
Wet Lease 7 7 23,3 4
Total 22 1 14 7 9,9 20 18 18 18 18
GRAND TOTAL 332 47 204 81 65.363 8,2 361 394 435 467 476
Year End Seat Capacity : 71.374 78.458 86.901 93.517 95.293
*After exit-entry Seat Capacity Change : 10% 10% 11% 8% 2%

27
Fleet Development
TOTAL DELIVERIES
31.12.2018 Type 2019 2020 2021 2022 2023 TOTAL
Wide Body
A350-900 5 4 8 8 25
B787-9 6 9 6 4 25
A330-300
B777-3ER
Total 6 14 10 12 8 50
Narrow Body
B737-900ER
B737-9 MAX 5 5 10
B737-800
B737-8 MAX 12 19 15 12 58
A321
A321 NEO 19 18 20 18 15 90
A319
Total 36 42 35 30 15 158
Cargo
A330-200F
B777F 1 2 3
Total 1 2 3
GRAND TOTAL 43 58 45 42 23 211
28
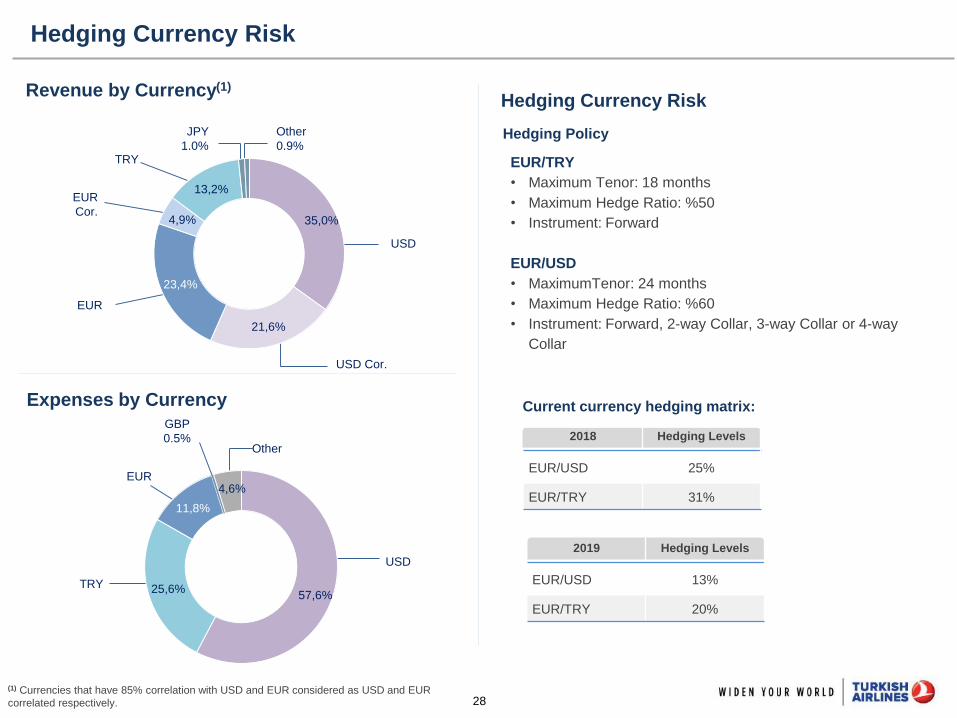
Hedging Currency Risk
(1) Currencies that have 85% correlation with USD and EUR considered as USD and EUR
correlated respectively.
JPY
1.0%
Other
0.9%
USD Cor.
USD
EUR
EUR
Cor.
TRY
Revenue by Currency(1)
EUR
TRY
USD
Other
GBP
0.5%
Expenses by Currency
Hedging Currency Risk
Current currency hedging matrix:
2018 Hedging Levels
EUR/USD 25%
EUR/TRY 31%
Hedging Policy
2019 Hedging Levels
EUR/USD 13%
EUR/TRY 20%
EUR/TRY
• Maximum Tenor: 18 months
• Maximum Hedge Ratio: %50
• Instrument: Forward
EUR/USD
• MaximumTenor: 24 months
• Maximum Hedge Ratio: %60
• Instrument: Forward, 2-way Collar, 3-way Collar or 4-way
Collar
35,0%
21,6%
23,4%
4,9%
13,2%
57,6%25,6%
11,8%
4,6%
29
5
15
25
35
45
55
65
75
85
95
105
115
125
135
145
5 15 25 35 45 55 65 75 85 95 105 115 125 135 145
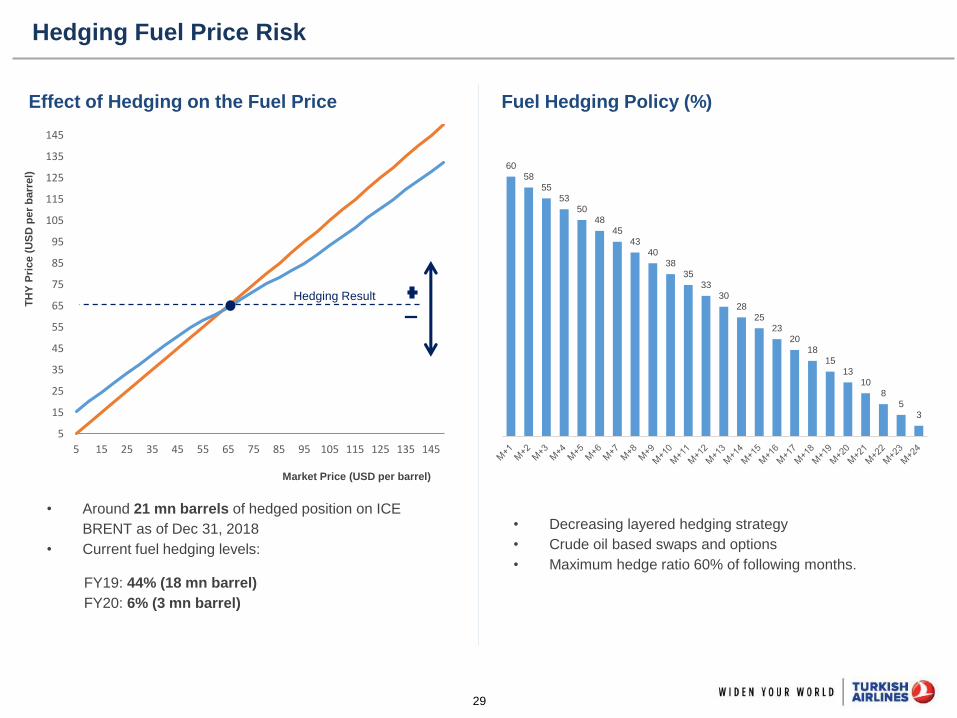
• Decreasing layered hedging strategy
• Crude oil based swaps and options
• Maximum hedge ratio 60% of following months.
Hedging Fuel Price Risk
Fuel Hedging Policy (%) Effect of Hedging on the Fuel Price
TH
Y P
rice (
US
D p
er
ba
rrel)
Market Price (USD per barrel)
Hedging Result
• Around 21 mn barrels of hedged position on ICE
BRENT as of Dec 31, 2018
• Current fuel hedging levels:
FY19: 44% (18 mn barrel)
FY20: 6% (3 mn barrel)
6058
5553
5048
4543
4038
3533
3028
2523
2018
1513
108
53

30
Aircraft Financing and Debt Management
As of 31.12.2018
Total Financial Lease Liabilities: 7,4 bn USD
Operational Leases: 1.6 bn USD
5 Year Maturity Profile (USD mn)
Currency Breakdown of Financial Lease Liabilities
Weighted Average Interest Rate: 2.85%
Floating27%
Fixed73%
988 1.0111.136 1.033
875
2019 2020 2021 2022 2023
USD21%
EUR44%
JPY32%
CHF3%
(mn USD)31.12.2018
MaturityYearly Debt
ServiceTotal Debt
USD 1.533 10-12 Years 262
EUR 3.309 10-12 Years 431
JPY 2.416 10-11 Years 285
CHF 185 12 Years 31
Total 7.444 1.009
31
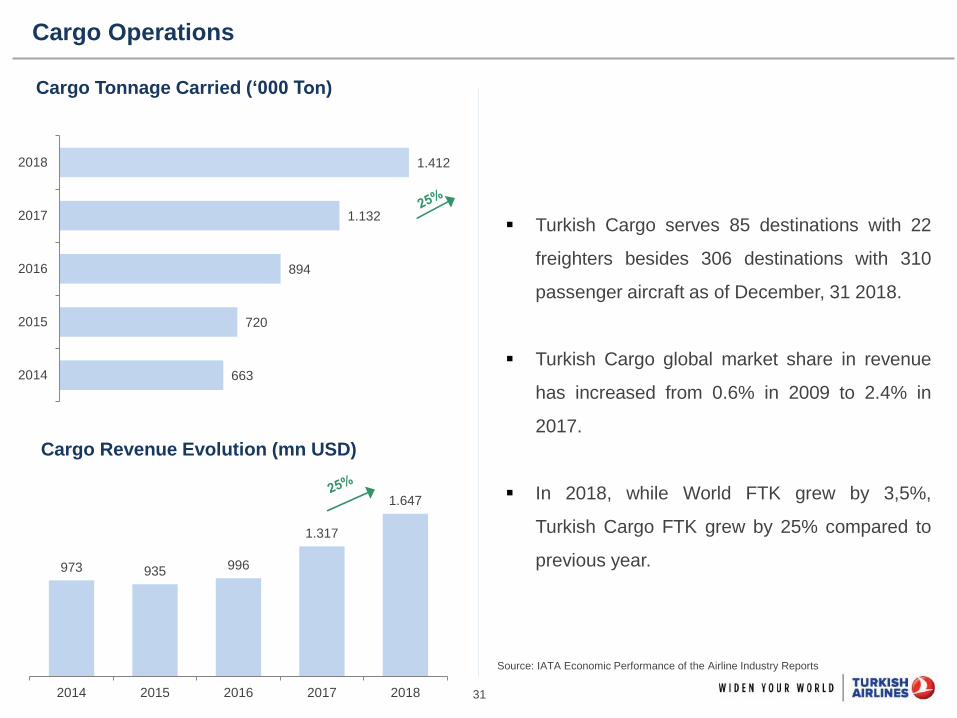
Cargo Operations
Cargo Revenue Evolution (mn USD)
Cargo Tonnage Carried (‘000 Ton)
Source: IATA Economic Performance of the Airline Industry Reports
Turkish Cargo serves 85 destinations with 22
freighters besides 306 destinations with 310
passenger aircraft as of December, 31 2018.
Turkish Cargo global market share in revenue
has increased from 0.6% in 2009 to 2.4% in
2017.
In 2018, while World FTK grew by 3,5%,
Turkish Cargo FTK grew by 25% compared to
previous year.
663
720
894
1.132
1.412
2014
2015
2016
2017
2018
973 935 996
1.317
1.647
2014 2015 2016 2017 2018
32
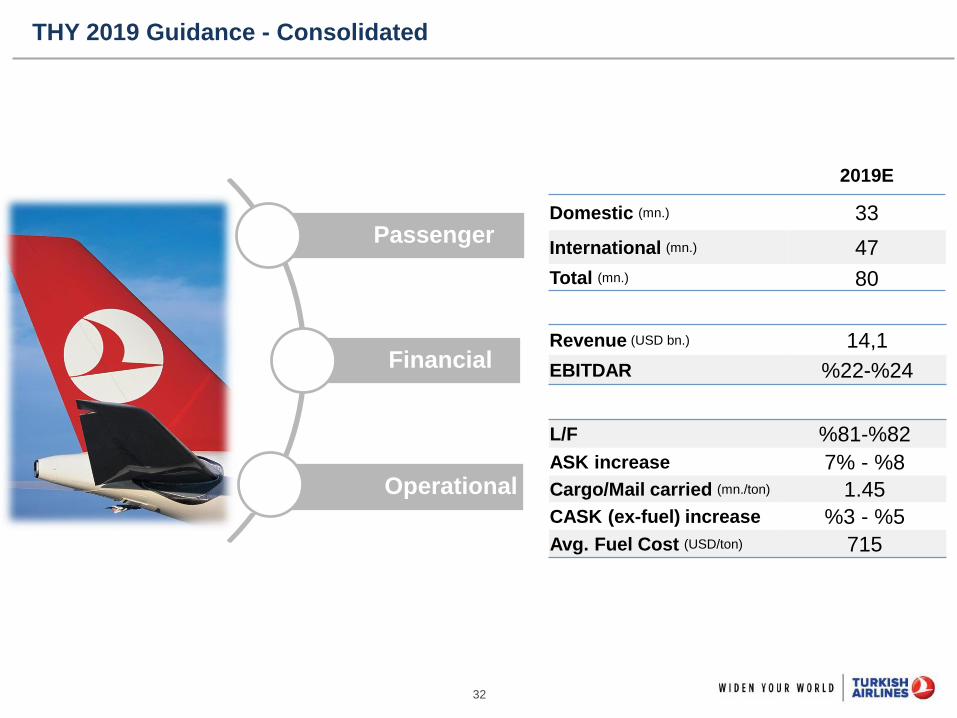
2019E
Domestic (mn.) 33
International (mn.) 47
Total (mn.) 80
Revenue (USD bn.) 14,1
EBITDAR %22-%24
Passenger
Financial
Operational
L/F %81-%82
ASK increase 7% - %8
Cargo/Mail carried (mn./ton) 1.45
CASK (ex-fuel) increase %3 - %5
Avg. Fuel Cost (USD/ton) 715
THY 2019 Guidance - Consolidated

33
Balance Sheet
Assets (mn USD) 2014 2015 2016 2017 2018
Cash and Equivalents 722 962 1.815 2.086 2.155
Trade Receivables 456 361 379 592 570
Pre-delivery Payment (PDP) Receivables 990 1.139 596 117 809
Other Current Assets 663 684 811 836 971
Total Current Assets 2.831 3.146 3.601 3.631 4.505
Net Fixed Assets 9.201 11.415 13.476 13.002 13.918
of which Aircraft and Engines 8.167 10.177 12.134 11.683 12.127
Pre-delivery Payment (PDP) Receivables 650 392 207 247 505
Other Non-Current Assets 1.064 1.430 1.207 1.317 1.804
Total Non-Current Assets 10.915 13.237 14.890 14.566 16.227
Total Assets 13.746 16.383 18.491 18.197 20.732
Liabilities (mn USD) 2014 2015 2016 2017 2018
Lease Obligations 5.931 7.399 8.886 8.322 9.509
Passenger Flight Liabilities 1.398 1.091 785 1.000 1.002
Accounts Payable 662 671 616 855 1.022
Other Liabilities 1.805 2.380 3.117 2.674 3.254
Total Liabilities 9.796 11.541 13.404 12.851 14.787
Total Shareholders Equity 3.950 4.842 5.087 5.346 5.945
of which Issued Capital 1.597 1.597 1.597 1.597 1.597
of which Retained Earnings 1.714 2.559 3.628 3.551 3.760
of which Differences from Currency Translation -47 -84 -106 -108 -160
of which Net Profit for the Period 845 1.069 -77 223 753
Total Liabilities & Shareholders Equity 13.746 16.383 18.491 18.197 20.732

34
Income Statement
(mn USD) 2014 2015 2016 2017 2018 YoY Change
Operating Revenue 11.070 10.522 9.792 10.958 12.855 17%
Operating Expenses (-) 10.429 9.840 10.142 10.164 11.686 15,0%
of which Fuel 3.806 2.997 2.673 2.866 3.768 31%
of which Personnel 1.694 1.640 1.865 1.761 1.772 1%
of which Depreciation 743 924 1.148 1.066 1.087 2%
of which Rent 543 527 496 527 595 13%
Net Operating Profit / Loss 641 682 -350 794 1.169 47%
Income From Other Operations 80 244 145 264 167 -37%
Expense From Other Operations (-) 45 31 86 36 145 303%
Profit / Loss From Main Operations 676 895 -291 1.022 1.191 17%
Income From Investment Activities (Net) 72 101 117 177 99 -44%
Share of Investments' Profit / Loss 75 80 44 102 123 21%
Financial Income 419 532 300 56 129 130%
Financial Expense (-) 196 201 229 1.078 588 -45%
Profit Before Tax 1.046 1.407 -59 279 954 242%
Tax (-) 201 338 18 56 201 259%
Net Profit 845 1.069 -77 223 753 238%

35
Operational Expense Breakdown
(mn USD) 2017 % in Total 2018 % in Total Change 18/17
Fuel 2.866 28,2% 3.768 32,2% 31,5%
Personnel 1.761 17,3% 1.772 15,2% 0,6%
Landing, Navigation & Air Traffic 978 9,6% 1.056 9,0% 8,0%
Landing and navigation 469 4,6% 514 4,4% 9,6%
Air Traffic Control 509 5,0% 542 4,6% 6,5%
Sales & Marketing 841 8,3% 986 8,4% 17,2%
Commissions and Incentives 318 3,1% 401 3,4% 26,1%
Reservation System 232 2,3% 255 2,2% 9,9%
Advertising 165 1,6% 189 1,6% 14,5%
Other 126 1,2% 141 1,2% 11,9%
Depreciation 1.066 10,5% 1.087 9,3% 2,0%
Ground Handling 656 6,5% 733 6,3% 11,7%
Aircraft Rent 527 5,2% 595 5,1% 12,9%
Operational Lease 324 3,2% 336 2,9% 3,7%
Wet Lease 203 2,0% 259 2,2% 27,6%
Passenger Services & Catering 510 5,0% 560 4,8% 9,8%
Maintenance 645 6,3% 804 6,9% 24,7%
General Administration 112 1,1% 122 1,0% 8,9%
Other 202 2,0% 203 1,7% 0,5%
TOTAL 10.164 100% 11.686 100% 15,0%
Operating Cost per ASK (USc) 5,87 - 6,42 - 9,3%
Ex-fuel Operating Cost per ASK (Usc) 4,22 - 4,35 - 3,2%
Fixed Costs 2.963 29,2% 3.163 27,1% 6,8%
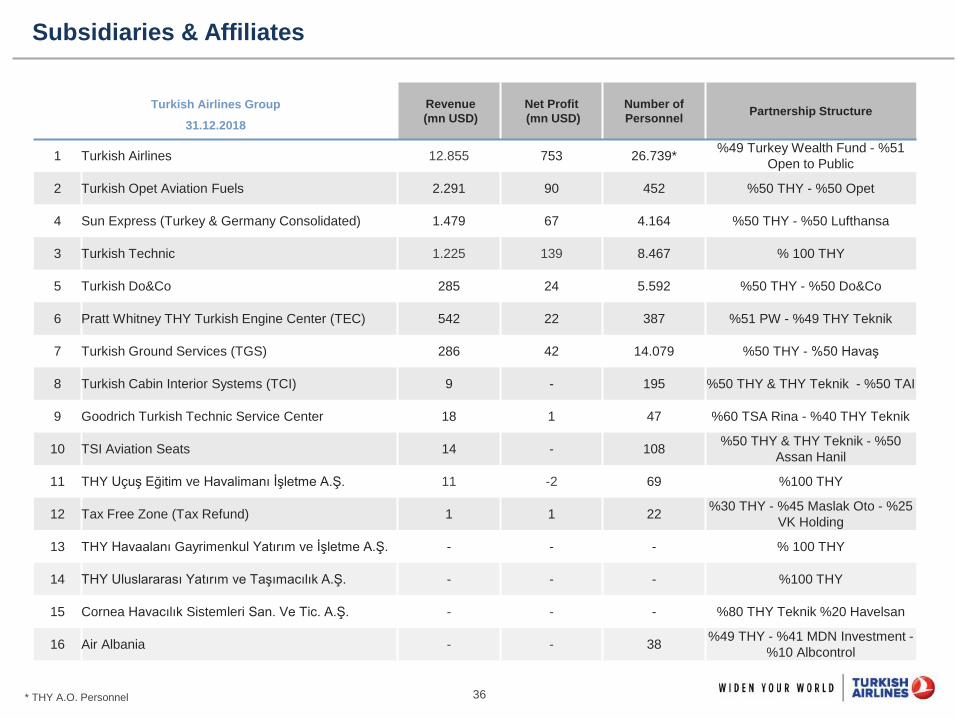
36* THY A.O. Personnel
Subsidiaries & Affiliates
Turkish Airlines Group Revenue
(mn USD)
Net Profit
(mn USD)
Number of
Personnel Partnership Structure
31.12.2018
1 Turkish Airlines 12.855 753 26.739*%49 Turkey Wealth Fund - %51
Open to Public
2 Turkish Opet Aviation Fuels 2.291 90 452 %50 THY - %50 Opet
4 Sun Express (Turkey & Germany Consolidated) 1.479 67 4.164 %50 THY - %50 Lufthansa
3 Turkish Technic 1.225 139 8.467 % 100 THY
5 Turkish Do&Co 285 24 5.592 %50 THY - %50 Do&Co
6 Pratt Whitney THY Turkish Engine Center (TEC) 542 22 387 %51 PW - %49 THY Teknik
7 Turkish Ground Services (TGS) 286 42 14.079 %50 THY - %50 Havaş
8 Turkish Cabin Interior Systems (TCI) 9 - 195 %50 THY & THY Teknik - %50 TAI
9 Goodrich Turkish Technic Service Center 18 1 47 %60 TSA Rina - %40 THY Teknik
10 TSI Aviation Seats 14 - 108%50 THY & THY Teknik - %50
Assan Hanil
11 THY Uçuş Eğitim ve Havalimanı İşletme A.Ş. 11 -2 69 %100 THY
12 Tax Free Zone (Tax Refund) 1 1 22%30 THY - %45 Maslak Oto - %25
VK Holding
13 THY Havaalanı Gayrimenkul Yatırım ve İşletme A.Ş. - - - % 100 THY
14 THY Uluslararası Yatırım ve Taşımacılık A.Ş. - - - %100 THY
15 Cornea Havacılık Sistemleri San. Ve Tic. A.Ş. - - - %80 THY Teknik %20 Havelsan
16 Air Albania - - 38%49 THY - %41 MDN Investment -
%10 Albcontrol
37
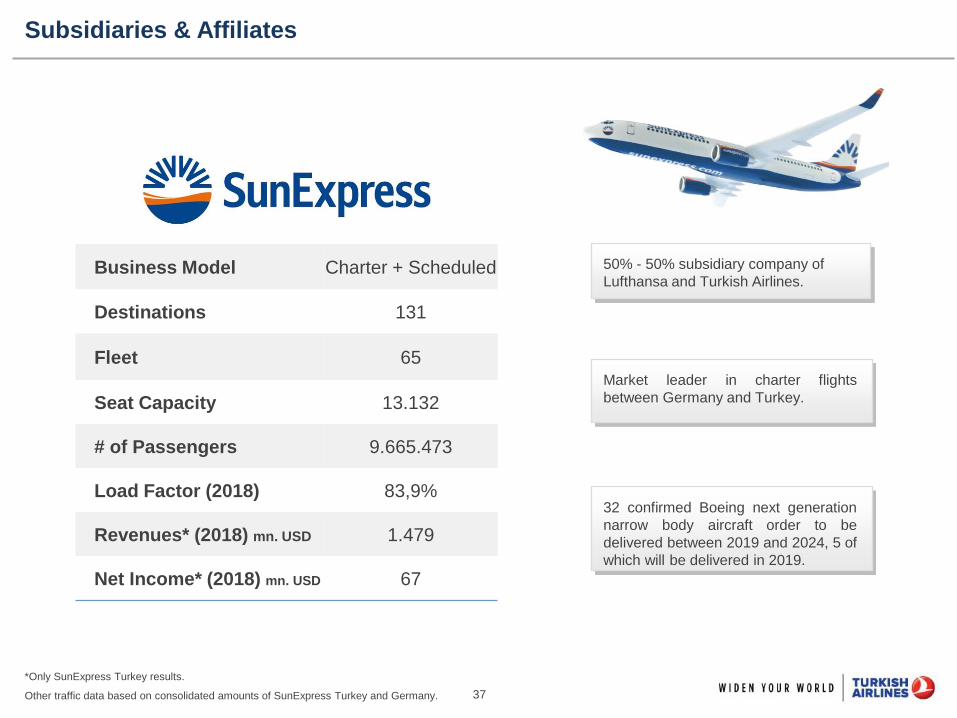
Subsidiaries & Affiliates
Market leader in charter flights
between Germany and Turkey.
32 confirmed Boeing next generation
narrow body aircraft order to be
delivered between 2019 and 2024, 5 of
which will be delivered in 2019.
50% - 50% subsidiary company of
Lufthansa and Turkish Airlines.
*Only SunExpress Turkey results.
Other traffic data based on consolidated amounts of SunExpress Turkey and Germany.
Business Model Charter + Scheduled
Destinations 131
Fleet 65
Seat Capacity 13.132
# of Passengers 9.665.473
Load Factor (2018) 83,9%
Revenues* (2018) mn. USD 1.479
Net Income* (2018) mn. USD 67
38
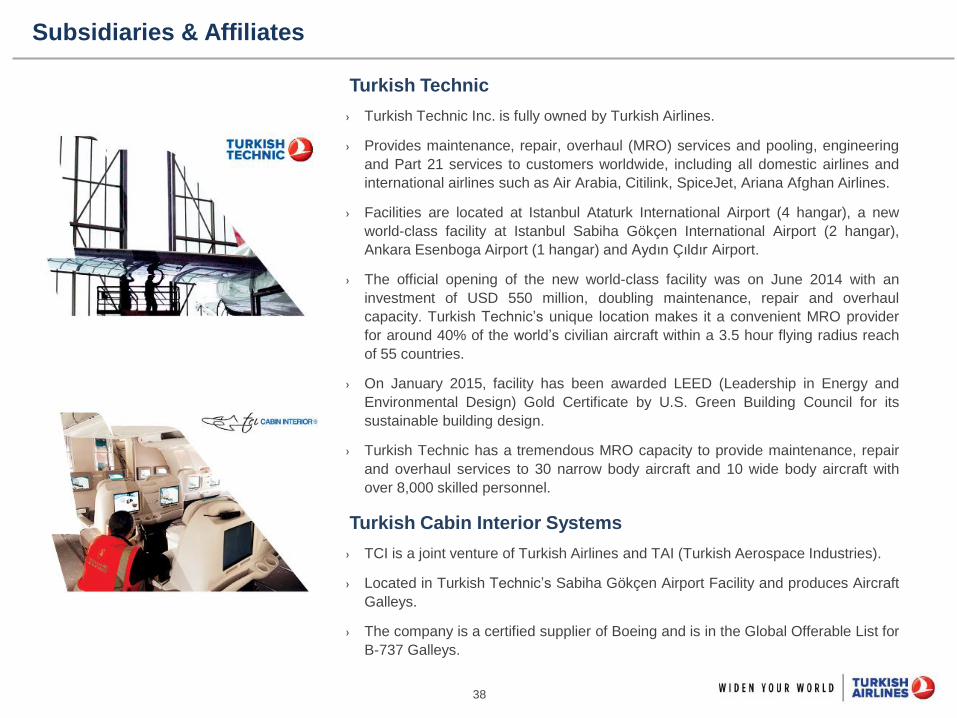
Turkish Technic
› Turkish Technic Inc. is fully owned by Turkish Airlines.
› Provides maintenance, repair, overhaul (MRO) services and pooling, engineering
and Part 21 services to customers worldwide, including all domestic airlines and
international airlines such as Air Arabia, Citilink, SpiceJet, Ariana Afghan Airlines.
› Facilities are located at Istanbul Ataturk International Airport (4 hangar), a new
world-class facility at Istanbul Sabiha Gökçen International Airport (2 hangar),
Ankara Esenboga Airport (1 hangar) and Aydın Çıldır Airport.
› The official opening of the new world-class facility was on June 2014 with an
investment of USD 550 million, doubling maintenance, repair and overhaul
capacity. Turkish Technic’s unique location makes it a convenient MRO provider
for around 40% of the world’s civilian aircraft within a 3.5 hour flying radius reach
of 55 countries.
› On January 2015, facility has been awarded LEED (Leadership in Energy and
Environmental Design) Gold Certificate by U.S. Green Building Council for its
sustainable building design.
› Turkish Technic has a tremendous MRO capacity to provide maintenance, repair
and overhaul services to 30 narrow body aircraft and 10 wide body aircraft with
over 8,000 skilled personnel.
Subsidiaries & Affiliates
Turkish Cabin Interior Systems
› TCI is a joint venture of Turkish Airlines and TAI (Turkish Aerospace Industries).
› Located in Turkish Technic’s Sabiha Gökçen Airport Facility and produces Aircraft
Galleys.
› The company is a certified supplier of Boeing and is in the Global Offerable List for
B-737 Galleys.
39
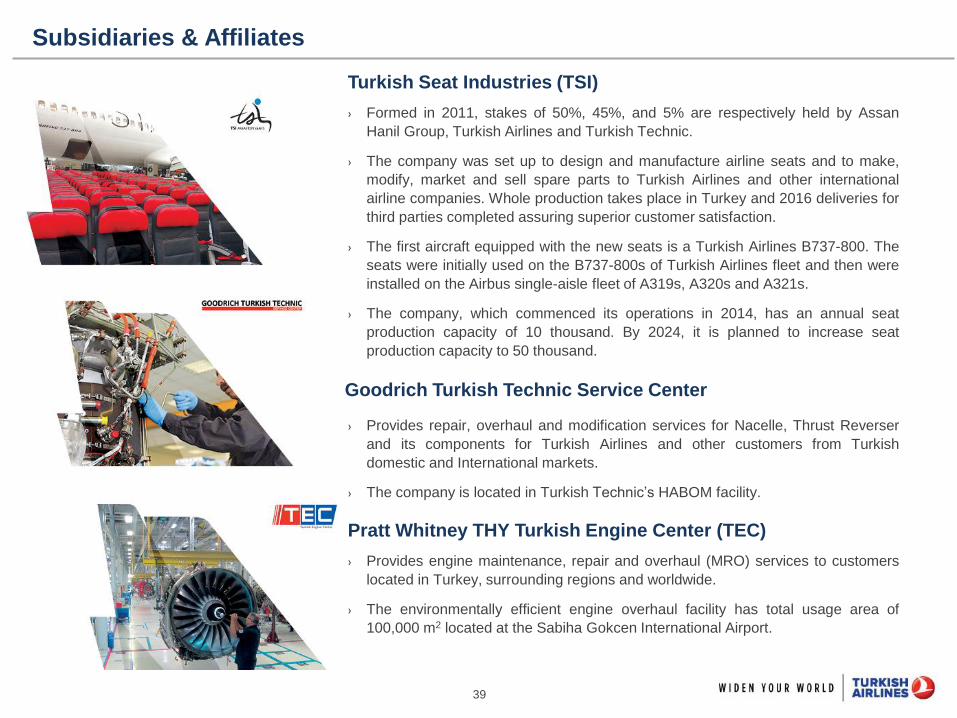
Turkish Seat Industries (TSI)
› Formed in 2011, stakes of 50%, 45%, and 5% are respectively held by Assan
Hanil Group, Turkish Airlines and Turkish Technic.
› The company was set up to design and manufacture airline seats and to make,
modify, market and sell spare parts to Turkish Airlines and other international
airline companies. Whole production takes place in Turkey and 2016 deliveries for
third parties completed assuring superior customer satisfaction.
› The first aircraft equipped with the new seats is a Turkish Airlines B737-800. The
seats were initially used on the B737-800s of Turkish Airlines fleet and then were
installed on the Airbus single-aisle fleet of A319s, A320s and A321s.
› The company, which commenced its operations in 2014, has an annual seat
production capacity of 10 thousand. By 2024, it is planned to increase seat
production capacity to 50 thousand.
Subsidiaries & Affiliates
Goodrich Turkish Technic Service Center
› Provides repair, overhaul and modification services for Nacelle, Thrust Reverser
and its components for Turkish Airlines and other customers from Turkish
domestic and International markets.
› The company is located in Turkish Technic’s HABOM facility.
Pratt Whitney THY Turkish Engine Center (TEC)
› Provides engine maintenance, repair and overhaul (MRO) services to customers
located in Turkey, surrounding regions and worldwide.
› The environmentally efficient engine overhaul facility has total usage area of
100,000 m2 located at the Sabiha Gokcen International Airport.

40
Turkish Do&Co
› Established in 2007, Turkish Do&Co
operates in nine gourmet kitchens all
over Turkey: Istanbul (Atatürk and
Sabiha Gökcen), Ankara, Antalya,
Izmir, Bodrum, Trabzon, Dalaman and
Adana. Over 60 national and
international airlines are catered from
these locations.
› Turkish Do&Co has significantly
improved the quality of catering service
offered by Turkish Airlines on board,
bringing many international awards to
our Company.
Turkish Ground Services
› Owned 50% - 50% by THY and Havaş
Havaalanları Yer Hizmetleri A.Ş.
› Provides ground services to Turkish
Airlines and other customers since the
beginning of 2010 and currently
operates at eight major airports in
Turkey: Istanbul (Ataturk and Sabiha
Gokcen), Izmir, Ankara, Antalya,
Adana, Bodrum, Dalaman.
Turkish OPET
› In terms of investment on jet fuel
supply Turkish Airlines established a
jet fuel supply company together with
local oil retailer OPET on September
2009.
› Today, the Company has the largest
integrated jet fuel facility in Turkey and
has fuel servicing capability at all
domestic airports across Turkey.
› In 2016, the Company maintained its
market leader position with jet fuel
sales of over 3.7 million cubic meters.
Subsidiaries & Affiliates
41
TURKISH AIRLINES
INVESTOR RELATIONS
Tel: +90 (212) 463-6363 x-13630 e-mail: [email protected]
Did you check out our IR application?*…
* The application is accessible via Apple Store and Google Play with the searching word “Turkish Airlines”.
THANK YOU..

42
Türk Hava Yolları A.O. (the “Incorporation” or ‘’Turkish Airlines’’) has prepared this presentation for the sole purpose of providing information about its
business, operations, operational and financial results. The information in this presentation is subject to updating, revision and amendment. This
presentation is not, and does not support to be comprehensive and to contain all information related to Turkish Airlines.
This presentation does not constitute or form part of any offer or invitation to sell or issue, or any solicitation of any offer to purchase or subscribe for, any
securities of Turkish Airlines nor any of its subsidiaries or their respective affiliates nor should it or any part of it or the fact of its distribution form the
basis of, or be relied on in connection with, any contract or investment decision in relation thereto. This presentation is not intended for distribution to, or
use by, any person or entity in any jurisdiction or country where such distribution would be contrary to law or regulation. The information contained in this
presentation has not been subject to any independent audit or review and may contain forward-looking statements, estimates and projections.
Statements herein, other than statements of historical fact, regarding future events or prospects, are forward-looking statements. Although Turkish
Airlines believes that the estimates and projections reflected in the forward-looking statements are reasonable, they may prove materially incorrect, and
actual results may materially differ. As a result, you should not rely on these forward-looking statements. Turkish Airlines undertakes no obligation to
update or revise any forward-looking statements, whether as a result of new information, future events or otherwise, except to the extent required by law.
Any forward-looking statement in this presentation speaks only as of the date on which it is made, and Turkish Airlines undertakes no obligation to
update any forward-looking statement to reflect events or circumstances after the date on which the statement is made or to reflect the occurrence of
unanticipated events, except to the extent required by law.
Industry, market and competitive data and certain industry forecasts used in this presentation were obtained from internal research, market research,
publicly available information and industry publications and other market commentaries. Industry publications generally state that the information
contained therein has been obtained from sources believed to be reliable at the relevant time, but that the accuracy and completeness of such
information is not guaranteed. Similarly, internal research, market research, industry publications and other publicly available information, while believed
to be reliable, have not been independently verified, and Turkish Airlines does not make any representation as to the completeness or accuracy of such
information.
No representation, warranty or undertaking, expressed or implied, is or will be made by Turkish Airlines or its shareholders, affiliates, advisors or
representatives or any other person as to, and no reliance should be placed on, the fairness, accuracy, completeness or correctness of the information
or the opinions contained in this presentation (or whether any information has been omitted from this presentation). Turkish Airlines, to the extent
permitted by law, and each of its respective directors, officers, employees, affiliates, advisors or representatives disclaims all liability whatsoever (in
negligence or otherwise) for any loss however arising, directly or indirectly, from any use of this presentation or its contents or otherwise arising in
connection with this presentation.
This presentation should not be construed as financial, legal, tax, accounting, investment or other advice or a recommendation with respect to any
investment. Under no circumstances is this information and material to be construed as a prospectus, supplement, offering memorandum or
advertisement, and neither any part of this presentation nor any information or statement contained herein shall form the basis of or be relied upon in
connection with any contract, commitment or investment decision.
By reading this presentation or attending or listening to any relevant meeting, conference call or webcast organized by the Company, you agree to be
bound by the above provisions.
Disclaimer