TURK EKONOMI BANKASI - TEB BUY · capital-to-assets ratio, TEB will be posting a loss on...
47
"This publication has been prepared by Park-Raymond James Yatirim Menkul Kiymetler A.S. and may be distributed by it and its affiliated companies (collectively "Raymond James") solely for the information of the customers of Raymond James. While reasonable care has been used in its preparation, this report does not purport to be a complete description of the securities, markets or developments referred to herein, and Raymond James does not warrant its accuracy or completeness. The information contained herein may be changed without notice. To the extent permitted by law, Raymond James, or its officers, employees or agents, may have bought or sold the securities mentioned in this report, or may do so in the future. Raymond James may perform investment banking or other services (including acting as adviser, lender or manager) for, or solicit investment banking or other business from, any company mentioned in this report. This report is not an offer, or solicitation of an offer, to buy or sell any security mentioned herein. This publication is for distribution in the United Kingdom only to persons of the kind described in Article 11 (3) of the Financial Services Act 1986 and may not be distributed to or passed on to any other class of persons, including private investors." Haldun Alperat [email protected] Tel: +90 212 287 6381 Emir Sarpyener [email protected] Tel: +90 212 287 4004 Serkan Bayramoglu [email protected] Tel: +90 212 287 4004 TURK EKONOMI BANKASI - TEB BUY (TEBNK.IS) TL2,500-Usc0.19 / BANKING We BET on TEB A winning banking strategy in the volatile Turkish market... •= TEB’s prudent management style proved to be a virtue after the twin crises of November 2000 and February 2001. Now TEB shines among its peers as the beneficiary of the ongoing consolidation phase with minimal risk of being adversely affected by the special audit process under the recapitalization program. •= The NPL ratio of 1.3% in 9M2001 together with 0.1% related party lending, as well as liquidity standing at 49.5%, compared to the corresponding averages of our Turkish banking coverage universe; 5%, 19% and 17%, highlight the bank’s superior asset quality, to be leveraged in the loan market once the economy shifts to growth in 2H2002. •= After an estimated lack luster loss figure of US$22mn in IAS consolidated statements in 2001, TEB’s bottom-line will shift into the black in 2002 with US$17mn. We project further 32% EPS growth in 2003. •= Based on our sum of parts valuation, TEB’s fair value stands at US$200 mn (TL4,900/share from current US$ rate), of which US$129 mn is the bank-only value. Our target value for the bank implies 96% upside potential at an undemanding 2002E Adj. P/BV of 1.1x on consolidated basis. •= Our strong opinion that TEB’s financials are almost immune to the special audit supports our valuation and BUY recommendation. May 1, 2002 (US$ mn) 2000 2001 2002E 2003F Total Assets* 2,024 1,775 2,152 2,396 growth yoy 26% -12% 21% 11% Loans* 686 659 1,021 1,246 growth yoy 68% -4% 55% 22% Deposits* 989 1,145 1,436 1,436 growth yoy 29% 16% 25% 0% SH Equity* 169 125 142 165 growth yoy 52% -26% 14% 16% Adj. Net Int. Incom 189 83 93 89 growth yoy 70% -56% 12% -5% Net Income* 16 (22) 17 23 growth yoy -47% n.m. n.m. 32% Adjusted NIM* 8.3% 4.6% 4.8% 3.9% ROAA %* 0.9% n.m. 0.9% 1.0% ROAE %* 11.1% n.m. 12.8% 14.7% (in US$) P/E (x) 6.8 n.m. 6.2 4.7 P/Deposits (x) 0.11 0.09 0.07 0.07 P/Assets (x) 0.05 0.06 0.05 0.04 P/BV (x) 0.63 0.84 0.74 0.64 Adj. P/BV (x) 0.52 0.67 0.60 0.53 *IAS Consolidated As of May 01, 2002 KEY DATA Shares Outstanding Mcap. Major Shareholder TEB Mali Yatırımlar 70.1% Free Float 20.0% Foreign Holding* 43.2% 12mth Range TL3,500 - TL1,200 USc0.07 - USc0.29 Avg. Daily Vol. Price Performance 1mth 3mths 12mths YTD US$ -4% -28% -33% -3% Relative -3% -22% -17% 6% TL/US$= 1,350,726 *As % of free float 3 mth - US$0.58 mn 1 mth - US$0.49 mn ISE-100= 11,481 55,125 mn US$102 mn
Transcript of TURK EKONOMI BANKASI - TEB BUY · capital-to-assets ratio, TEB will be posting a loss on...

"This publication has been prepared by Park-Raymond James Yatirim Menkul Kiymetler A.S. and may be distributed by it and its affiliated companies (collectively "Raymond James") solely for the information of the customers of Raymond James. While reasonable care has been used in its preparation, this report does not purport to be a complete description of the securities, markets or developments referred to herein, and Raymond James does not warrant its accuracy or completeness. The information contained herein may be changed without notice. To the extent permitted by law, Raymond James, or its officers, employees or agents, may have bought or sold the securities mentioned in this report, or may do so in the future. Raymond James may perform investment banking or other services (including acting as adviser, lender or manager) for, or solicit investment banking or other business from, any company mentioned in this report. This report is not an offer, or solicitation of an offer, to buy or sell any security mentioned herein. This publication is for distribution in the United Kingdom only to persons of the kind described in Article 11 (3) of the Financial Services Act 1986 and may not be distributed to or passed on to any other class of persons, including private investors."
Haldun [email protected]
Tel: +90 212 287 6381
Emir [email protected]
Tel: +90 212 287 4004
Serkan [email protected]
Tel: +90 212 287 4004
TURK EKONOMI BANKASI - TEB BUY (TEBNK.IS) TL2,500-Usc0.19
/ BANKING
We BET on TEB A winning banking strategy in the volatileTurkish market... • = TEB’s prudent management style proved
to be a virtue after the twin crises ofNovember 2000 and February 2001. NowTEB shines among its peers as thebeneficiary of the ongoing consolidationphase with minimal risk of being adverselyaffected by the special audit processunder the recapitalization program.
• = The NPL ratio of 1.3% in 9M2001 togetherwith 0.1% related party lending, as well asliquidity standing at 49.5%, compared tothe corresponding averages of our Turkishbanking coverage universe; 5%, 19% and17%, highlight the bank’s superior assetquality, to be leveraged in the loan marketonce the economy shifts to growth in2H2002.
• = After an estimated lack luster loss figure of US$22mn in IAS consolidatedstatements in 2001, TEB’s bottom-line will shift into the black in 2002 with US$17mn.We project further 32% EPS growth in2003.
• = Based on our sum of parts valuation,TEB’s fair value stands at US$200 mn(TL4,900/share from current US$ rate), ofwhich US$129 mn is the bank-only value. Our target value for the bank implies 96%upside potential at an undemanding2002E Adj. P/BV of 1.1x on consolidatedbasis.
• = Our strong opinion that TEB’s financialsare almost immune to the special auditsupports our valuation and BUYrecommendation.
May 1, 2002
(US$ mn) 2000 2001 2002E 2003F
Total Assets* 2,024 1,775 2,152 2,396 growth yoy 26% -12% 21% 11%Loans* 686 659 1,021 1,246 growth yoy 68% -4% 55% 22%Deposits* 989 1,145 1,436 1,436 growth yoy 29% 16% 25% 0%SH Equity* 169 125 142 165 growth yoy 52% -26% 14% 16%Adj. Net Int. Incom 189 83 93 89 growth yoy 70% -56% 12% -5%Net Income* 16 (22) 17 23 growth yoy -47% n.m. n.m. 32%
Adjusted NIM* 8.3% 4.6% 4.8% 3.9%ROAA %* 0.9% n.m. 0.9% 1.0%ROAE %* 11.1% n.m. 12.8% 14.7%
(in US$)P/E (x) 6.8 n.m. 6.2 4.7P/Deposits (x) 0.11 0.09 0.07 0.07P/Assets (x) 0.05 0.06 0.05 0.04P/BV (x) 0.63 0.84 0.74 0.64Adj. P/BV (x) 0.52 0.67 0.60 0.53*IAS Consolidated
As of May 01, 2002 KEY DATAShares Outstanding Mcap.Major Shareholder TEB Mali Yatırımlar 70.1%Free Float 20.0%Foreign Holding* 43.2%12mth Range TL3,500 - TL1,200
USc0.07 - USc0.29Avg. Daily Vol.
Price Performance 1mth 3mths 12mths YTDUS$ -4% -28% -33% -3%Relative -3% -22% -17% 6%TL/US$= 1,350,726*As % of free float
3 mth - US$0.58 mn1 mth - US$0.49 mn
ISE-100= 11,481
55,125 mnUS$102 mn

RAYMOND JAMES SECURITIES – TURKEY
RELATIVE PERFORMANCE TEB Relative to the ISE Adjusted P/BV CHART –IAS Consolidated
TEB’s Historic Adj. P/BV RELATIVE P/BV CHART
TEB’s Historic Adj. P/BV Relative to the Big 4 TABLE OF CONTENTS
Highlights and Negatives ………………………………………………………………. 1 Valuation ………………………………………………………………. 3 Financial Review ………………………………………………………………. 6 Earnings Outlook ………………………………………………………………. 9 Balance Sheet Analysis ………………………………………………………………. 12 Income Statement Structure & Earnings Quality……………………………………… . 17 Strategy ………………………………………………………………. 18 Company Overview ………………………………………………………………. 20 Sector Overview ………………………………………………………………. 21 Recapitalization Program ………………………………………………………………. 32 Financials ………………………………………………………………. 35 Appendix ………………………………………………………………. 44
T E
B
0
100
200
300
400
500
02/0
0
04/0
0
05/0
0
06/0
0
07/0
0
08/0
0
09/0
0
10/0
0
12/0
0
01/0
1
02/0
1
03/0
1
05/0
1
06/0
1
07/0
1
08/0
1
09/0
1
10/0
1
11/0
1
01/0
2
02/0
2
03/0
2
04/0
2
0.00.20.40.60.81.01.21.41.6TEB MCAP Price Relative to ISE100US$ mn
0.0
0.51.0
1.52.0
2.5
02/0
0
03/0
0
05/0
0
06/0
0
07/0
0
08/0
0
09/0
0
10/0
0
11/0
0
01/0
1
02/0
1
03/0
1
04/0
1
05/0
1
06/0
1
07/0
1
08/0
1
09/0
1
11/0
1
12/0
1
01/0
2
02/0
2
03/0
2
04/0
2
TEB Adj P/BV TEB Avg Adj. P/BV
Avg. Adj. P/BV = 0.94Adj. P/BV = 0.59
0.00.20.40.60.81.01.21.4
02/0
0
03/0
0
05/0
0
06/0
0
07/0
0
08/0
0
09/0
0
10/0
0
11/0
0
01/0
1
02/0
1
03/0
1
04/0
1
05/0
1
06/0
1
07/0
1
08/0
1
09/0
1
11/0
1
12/0
1
01/0
2
02/0
2
03/0
2
04/0
2
Adj. P/BV Relative to BIG4 Adj. P/BV Avg Relative P/BV
Avg. Relative Adj. P/BV = 0.73
Relative Adj. P/BV = 0.71

RAYMOND JAMES SECURITIES – TURKEY
1
INVESTMENT HIGHLIGHTS Conservatism, a virtue in the Turkish banking sector… TEB’s highly criticized conservatism proved to be a virtue during the twin crises of November 2000 and February 2001. In the mentioned period the bank was able to overcome the crises period with minimum damage parallel to its high liquidity, almost always square fx position and negligible maturity mismatch.
A high quality loan book with lowest NPL… TEB’s cautious approach to lending resulted in a very low NPL ratio of 1.3% as of 9M2001 against the 5% average of our banking universe and 23.6% industry average including State banks and banks under State Deposit Insurance Fund (SDIF). Moreover, TEB’s NPLs are fully provisioned for, while the provision ratio is 45.3% for our coverage universe and 65.3% for the sector as of 9M2001, another fact to note regarding TEB’s asset quality.
Very negligible related party exposure… Despite being a part of a large industrial group with total sales turnover of US$1.1 bn in 2001 xcluding financial sector participations-, the bank’s Group exposure is relatively low with the Group credits at only 0.1% of its total lending, compared to its peers with an average related party exposure at 19.3%.
Best quality deposit base: stable and low cost… In our coverage universe, TEB has the highest client deposits to total deposits ratio with 98.7%, versus the peer group average of 87.2%. The dominance of core deposits in the overall deposit base is an important aspect, determining the quality and the reliability of the deposit base. Moreover, TEB’s clients are banking with TEB to minimize risks rather than maximize returns and this factor positively impacts the banks’ deposit cost. Linked to their risk averse nature, TEB’s clientele prefer hard currency deposits to the more costly TL, and for safety as well as high quality service they tolerate a return lower than offered by TEB’s competitors. To that end, TEB enjoys the lowest fx deposit cost in our universe despite its smaller size. However, as the bank’s strategy is to grow in TL loans in 2002, TEB’s TL deposit rates are the highest among the peer group for the sake of attracting TL deposits and hence to enhance the deposit base while enjoying perfect currency match. Having said that, TEB is not an outlier in terms of its TL deposit rates when compared to the market rates. Last but not the least, at TEB the overall cost of deposits is still the lowest among banks under our coverage.
A brand name in private banking, creating significant synergy for the bank… The bank’s brand name, which is associated with high quality service and conservatism, makes TEB the bank, where the Turkish affluent mass parks its savings. On top of this, the bank’s proven track record in asset management makes TEB Turkey’s leading local private banking house. Private banking deposits make up 40% of TEB’s total deposit base, while TEB together with its brokerage subsidiary TEB Investment manage US$207mn in mutual funds - as of April 24, 2002 -, commanding 3.6% market share ahead of many larger-size banks.
Well positioned for the ongoing consolidation process in the sector… Together with the Big 4 (Four largest Turkish banks, namely Akbank, YKB, Garanti, Isbank) and foreign banks, TEB stands in the list of banks, which will benefit from the ongoing consolidation in the
T E
B

RAYMOND JAMES SECURITIES – TURKEY
2
banking sector. The 9M2001 figures already highlight TEB as the beneficiary of flight to quality with the bank’s deposit market share surging to 1.0%, up from 0.6% in FY2000. In our view, the recent acquisition of Kentbank branches should further boost the ongoing trend.
Visible earnings outlook and attractive valuation… After remaining in the negative territory throughout 2001, mainly linked to diminishing margins and monetary loss because of high free capital-to-assets ratio, TEB will be posting a loss on consolidated-IAS29 basis in FY2001. However, we forecast TEB to report profit starting in 2002 and expect the bottom line to grow by another 32% in 2003, linked to the anticipated asset growth and shift to lending in parallel to our economic recovery anticipations. Based on our IAS forecasts, with its consolidated 2002E P/E of 6.0x and 2002E Adj. P/BV of 0.58x, TEB trades at respective discounts of 75% and 56% to the average of the Big 4. Although some discount is reasonable, given TEB’s smaller size, the current discount is not fundamentally justified in our view, also considering TEB’s superior qualities over some banks in our coverage.
Historically proven conservative reporting policy is an advantage for equity investors ahead of special audit results… In our opinion, TEB is likely to be among the least adversely affected banks from the ongoing special audit process in the framework of the bank recapitalization program thanks to its conservative reporting. This is an aspect supporting our valuation and BUY recommendation for the bank. INVESTMENT NEGATIVES
Despite stronghold in retail investment products low penetration to retail lending and credit card segment remains a weakness… Although TEB launched Telepati brand/platform to expand its retail banking penetration in 2000, it still has a negligible market share with the number of credit cards at c63K, in September 2001 – against c14 million for the sector. The bank’s overall market share in retail lending is an insignificant 0.05% as well. This has its roots in the bank’s general cautious approach, but TEB has the resources to expand in this segment through capitalizing on the recently acquired Kentbank branches once the economy recovers and macro visibility improves. A small cap investment idea, with relatively lower liquidity… TEB is a small cap investment idea and is not listed on the MSCI-EM Turkey index, but the average daily trading volume of US$1mn in 2002 makes the stock investable, in our opinion. On the other hand, TEB’s share in daily trading volume of the ISE rose to 0.36% so far in 2002, compared to 0.31% on average in 2001.
Diminishing chances in the Citibank deal, but still a good acquisition target… A merger with Citibank was the main driving force behind TEB’s share price up until recently and the diminishing chances regarding the realization of this deal upset some of the dedicated followers of the stock, especially at the local side. But in our view, TEB is still a suitable target for foreign banks seeking presence in Turkey, especially after its expansion via the acquisition of 21 Kentbank branches from the State Deposit and Insurance Fund (SDIF).
T E
B

RAYMOND JAMES SECURITIES – TURKEY
3
VALUATION Methodology: Sum-of-parts…We prefer to value the bank using the sum-of-parts methodology. For the valuation of TEB’s core banking business, we make use of a dividend discount model (DDM) and add the estimated value of participations and real estate portfolio to come up with a target price for TEB shares. The table below sets forth our valuation model assumptions. Source: RJST
Our main assumptions are based on the following: Risk free rate: We use the current yield of the long-term Eurobonds. Equity Risk Premium: We conservatively use a 60% equity risk premium as % of risk free rate. The average equity risk premium that we use for large banks under our coverage is 35% and the above average rate that we use for TEB is due to its relatively smaller size and shallow liquidity. Growth Rate: This is the most subjective part of our DDM model. Theoretically, for Turkish banks, dividend growth is a function of earnings based on TAS (Turkish accounting standards) accounts, though the accounting standards will move to international standards in the medium term. Here we use the net earnings CAGR of 8% TEB posted in the past decade based on TAS accounts. With a pessimistic view, one can argue that spreads and margins should be squeezed with declining inflation, and thus, historical earnings growth may not be maintained. However, note that declining inflation should positively affect the monetary loss item on IAS accounts and hence the bottom line. Moreover, we think that TEB will surely surpass its last decade average asset growth performance with the ongoing consolidation in the sector, thereby making up for the margin squeeze. Also, TEB has not historically relied on trading income and lucrative
T E
B
Risk Free Rate 11.3%Equity Risk Premium as % of risk free rate 60%Beta 0.93Cost of equity 17.6%Growth Rate 8.0%Avg. Free Capital (2001-2002) 64Banking Earnings (2002) 11RoA Free Capital (2002) 17.1%Target P/BV 0.912 Month Target Banking Value 2002 129Participations 46Real Estate 26Fair Equity Value 200MCAP 102Upside 96%
DDM Model Assumptions

RAYMOND JAMES SECURITIES – TURKEY
4
returns on Government securities, hence its bottom line performance should rather be affected at a limited degree with the normalization of the Turkish banking system earnings drivers. On the other hand, we forecast TEB to post EPS CAGR of 13.2% between 2000-2003 in TAS accounts, 13.0% in IAS bank-only accounts and 18.4% in IAS consolidated accounts compared to our long-term growth estimate of 8.0% that we use in our DDM. Free Capital: Here we use bank-only IAS forecasts of TEB. We prefer to reach a target only for the free capital base of the bank rather than its equity to avoid any distortion that would have otherwise come from investments. Later, following the determination of a target market value based on the free capital of the bank, we add the fair value of investments, i.e. the value of its participations and real estates. Banking earnings: Here as well we use bank-only IAS forecasts of TEB. Value of participations and real estate: For these, we use the latest reported book values in IAS accounts. Valuation Summary and Recommendation… According to the methodology described, we value the core banking business of TEB at US$129mn and its equity value at US$200mn, including the value of its participations and real estate portfolio. Accordingly, our 12-month target value for TEB at US$200mn suggests 96% upside to its current MCAP and 33% relative upside compared to our 12-month index target. At our target MCAP, 2002E Adj. P/BV would stand at an undemanding 1.1x, compared to historical average 12 month forward looking multiple of 0.94x. All in all, we comfortably maintain our BUY rating for the bank.
T E
B T
E B
RAYMOND JAMES SECURITIES – TURKEY
5
T E
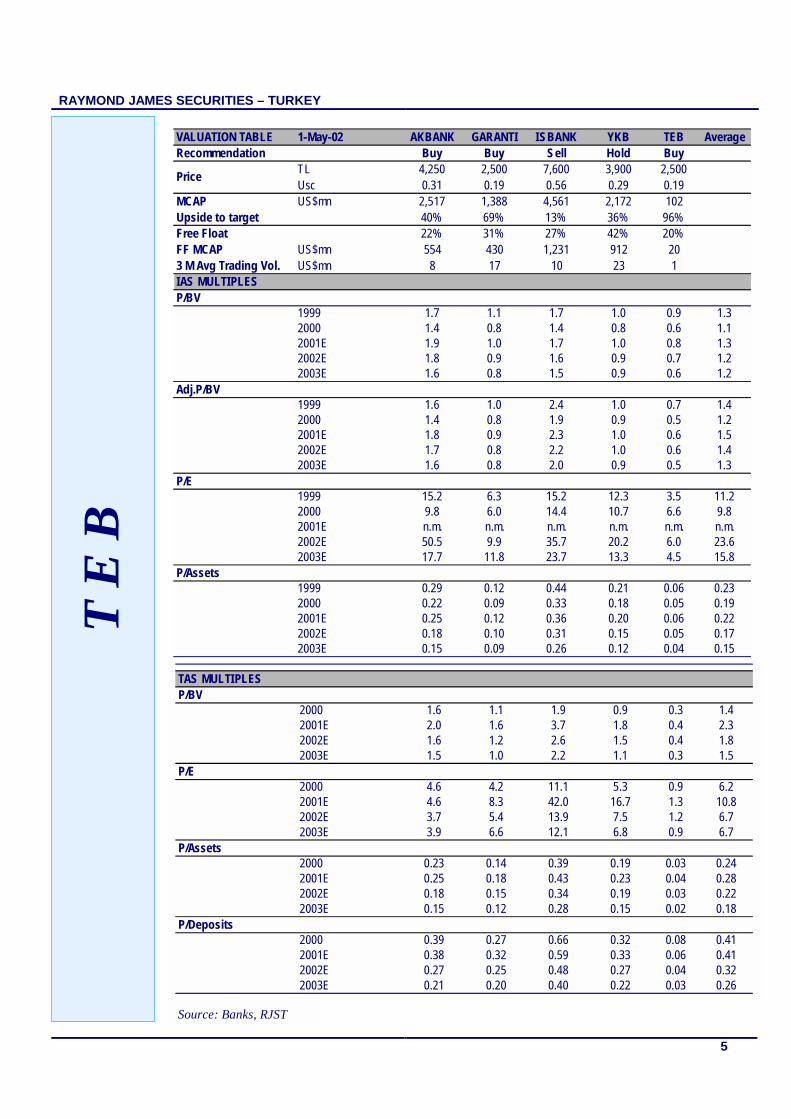
B VALUATION TABLE 1-May-02 AKBANK GARANTI ISBANK YKB TEB AverageRecommendation Buy Buy Sell Hold Buy
TL 4,250 2,500 7,600 3,900 2,500Usc 0.31 0.19 0.56 0.29 0.19
MCAP US$mn 2,517 1,388 4,561 2,172 102 10,740Upside to target 40% 69% 13% 36% 96% 32%Free Float 22% 31% 27% 42% 20%FF MCAP US$mn 554 430 1,231 912 203 M Avg Trading Vol. US$mn 8 17 10 23 1IAS MULTIPLESP/BV
1999 1.7 1.1 1.7 1.0 0.9 1.32000 1.4 0.8 1.4 0.8 0.6 1.12001E 1.9 1.0 1.7 1.0 0.8 1.32002E 1.8 0.9 1.6 0.9 0.7 1.22003E 1.6 0.8 1.5 0.9 0.6 1.2
Adj.P/BV1999 1.6 1.0 2.4 1.0 0.7 1.42000 1.4 0.8 1.9 0.9 0.5 1.22001E 1.8 0.9 2.3 1.0 0.6 1.52002E 1.7 0.8 2.2 1.0 0.6 1.42003E 1.6 0.8 2.0 0.9 0.5 1.3
P/E1999 15.2 6.3 15.2 12.3 3.5 11.22000 9.8 6.0 14.4 10.7 6.6 9.82001E n.m. n.m. n.m. n.m. n.m. n.m.2002E 50.5 9.9 35.7 20.2 6.0 23.62003E 17.7 11.8 23.7 13.3 4.5 15.8
P/Assets1999 0.29 0.12 0.44 0.21 0.06 0.232000 0.22 0.09 0.33 0.18 0.05 0.192001E 0.25 0.12 0.36 0.20 0.06 0.222002E 0.18 0.10 0.31 0.15 0.05 0.172003E 0.15 0.09 0.26 0.12 0.04 0.15
Price
TAS MULTIPLESP/BV
2000 1.6 1.1 1.9 0.9 0.3 1.42001E 2.0 1.6 3.7 1.8 0.4 2.32002E 1.6 1.2 2.6 1.5 0.4 1.82003E 1.5 1.0 2.2 1.1 0.3 1.5
P/E2000 4.6 4.2 11.1 5.3 0.9 6.22001E 4.6 8.3 42.0 16.7 1.3 10.82002E 3.7 5.4 13.9 7.5 1.2 6.72003E 3.9 6.6 12.1 6.8 0.9 6.7
P/Assets2000 0.23 0.14 0.39 0.19 0.03 0.242001E 0.25 0.18 0.43 0.23 0.04 0.282002E 0.18 0.15 0.34 0.19 0.03 0.222003E 0.15 0.12 0.28 0.15 0.02 0.18
P/Deposits2000 0.39 0.27 0.66 0.32 0.08 0.412001E 0.38 0.32 0.59 0.33 0.06 0.412002E 0.27 0.25 0.48 0.27 0.04 0.322003E 0.21 0.20 0.40 0.22 0.03 0.26
Source: Banks, RJST

RAYMOND JAMES SECURITIES – TURKEY
6
FINANCIAL REVIEW Growth Strategy and Track Record Conservative growth rather than uncalculated aggressiveness for profitability… Since its inception, TEB has pursued a conservative growth strategy, placing greater importance on operational quality than uncalculated aggressiveness for profitability. A strategy focus on reliable banking rather than the hedge fund approach has paid off largely given the highly volatile nature of the Turkish economy and financial markets, limiting the damage in periods of crisis that came periodically every three to four years. In our opinion, this trait together with TEB’s proven conservative reporting policy will be more apparent when the results of the special audit process will be public latest around mid-June. Once again, we expect TEB’s financials to produce no negative surprise. Yet, superior track record in terms of growth vis-à-vis the sector… Within the past decade, TEB’s deposit and asset growth surpassed the banking sector averages based on TAS accounts, with CAGR of 16.7% versus 10.8% and CAGR of 15.8% versus 11.4%, respectively, while TEB’s loan growth lagged slightly behind the sector average, with CAGR of 8.5% versus 9.9%. This is not to our surprise and in fact is a product of TEB’s prudent lending policy, visible at the bank’s significantly lower-than-average NPLs. The picture is similar when TEB is compared to our coverage universe (including large four banks and TEB) performance in the last decade that posted deposit and loan CAGR of 10.2% and asset CAGR of 11.2%, lagging behind TEB’s performance. In fact, in the mentioned period, TEB’s deposit growth surpassed all the banks in our coverage universe individually. Its asset growth was only lower than that of Garanti (with CAGR of 16.3%), and its loan growth only surpassed that of Isbank (with CAGR of 5.6%). Below average yet high earnings growth performance in the past decade… In terms of profitability, as we mentioned above, TEB’s bottom line and shareholder’s equity growth has been limited relative to our coverage universe: between 1990 and 2000, TEB posted CAGR of 8% in net income and 13% in equity compared to our coverage universe averages of 16% and 18%, respectively. Growth Outlook Superior growth trend of TEB will continue… In our opinion, in the new era, through the ongoing consolidation and the yet-to-follow removal of State guarantee on deposits that we estimate to take place within the next 24 months, TEB’s proven brand name as a quality bank and its conservative stance should pave the way for a period with growth superior to the sector average, even surpassing its own past performance.
T E
B

RAYMOND JAMES SECURITIES – TURKEY
7
Deposits The acquisition of 21 branches should give a nice boost to deposit growth in 2002-2003… For the short term outlook, the acquisition of 21 branches, suggesting an almost 40% growth in the number of branches and a 25% jump in GDP coverage should boost the deposits in 2002 and 2003, let alone the still ongoing flight to quality that will gain pace especially in 2003-2004 with the removal of State guarantee on deposits. Note that the ex-Kentbank branches acquired by TEB had a total of US$500mn deposits prior to their acquisition. Management conservatively foresees 15% deposit growth in both 2002 and 2003 versus our estimation of 23% and 22%, respectively, in TAS accounts. Note that our deposit growth forecasts of 13% and 11% respectively for 2002 and 2003 IAS consolidated financials are relatively milder due to our relatively lower deposit growth projection mainly in TEB N.V. in the mentioned period. Our 2002 deposit growth forecasts for TAS accounts yield a US$168mn increase in deposits to US$908mn versus the FY2001E figure of US$740mn, a rather conservative estimate given the potential contribution of new branches. Loans Aggressive loan growth is aimed yet at TEB’s way… TEB’s 2002 main strategy is based on an aggressive loan growth, yet at TEB’s way. The management targets 67% YoY loan growth contrary to the bank’s past decade strategy of controlled asset growth. The management intends especially to be relatively more aggressive on TL loans, evident also from its relatively higher TL deposit rates that we will discuss in more details further in this report. We forecast TEB‘s loan book to post 55% and 40% respective growths in 2002 and 2003 in TAS accounts, significantly above our respective growth projections of 12% and 24% for the banking sector aggregate loan book. Note that our house real GDP growth forecasts are 1.8% and 4%, respectively for 2002 and 2003.
T E
B

RAYMOND JAMES SECURITIES – TURKEY
8
Source: Banks' Association of Turkey, RJST
GROWTHUS$ mn TAS % chg. IAS-bank only % chg. IAS Cons. % chg. TAS % chg. IAS % chg.Loans2001E 316 -9% 316 -8% 659 -4% 12,633 -25% 16,308 -18%2002E 490 55% 461 46% 1,021 55% 13,619 8% 21,097 29%2003E 688 40% 640 39% 1,246 22% 18,685 37% 26,637 26%CAGR 2000/1990 16% n.a. n.a. 11% n.a.CAGR 2003E/2001E 48% 42% 38% 22% 28%Assets2001E 1,211 -21% 1,132 -19% 1,775 -12% 38,929 -14% 49,112 -14%2002E 1,422 17% 1,323 17% 2,152 21% 49,746 28% 62,200 27%2003E 1,766 24% 1,654 25% 2,396 11% 60,759 22% 73,991 19%CAGR 2000/1990 9% n.a. n.a. 10% n.a.CAGR 2003E/2001E 21% 21% 16% 25% 23%Deposits2001E 740 12% 725 10% 1,145 16% 26,057 0% 30,341 -1%2002E 908 23% 854 18% 1,294 13% 33,381 28% 37,551 24%2003E 1,108 22% 1,052 23% 1,436 11% 41,446 24% 45,974 22%CAGR 2000/1990 17% n.a. n.a. 10% n.a.CAGR 2003E/2001E 22% 20% 12% 26% 23%Equity2001E 103 -26% 125 -18% 125 -26% 4,668 -41% 8,059 -17%2002E 137 33% 136 9% 142 14% 6,119 31% 8,604 7%2003E 166 21% 153 12% 165 16% 7,259 19% 9,163 7%CAGR 2000/1990 13% n.a. n.a. 18% n.a.CAGR 2003E/2001E 27% 11% 15% 25% 7%Net Income2001E 38 3% -8 n.m. -22 n.m. 993 -43% -50 n.m.2002E 48 24% 11 n.m. 17 n.m. 1,598 61% 456 n.m.2003E 54 13% 17 53% 23 32% 1,611 1% 681 49%CAGR 2000/1990 8% n.a. n.a. 12% n.a.CAGR 2003E/2001E 19% n.m. n.m. 27% n.m.
TEB RJ Universe: Big4+TEB
T E
B

RAYMOND JAMES SECURITIES – TURKEY
9
EARNINGS OUTLOOK 2001 is another year of proven resilience for TEB… 2001, was the most severe crisis year that Turkey faced in her history. TEB’s prudent and pro-active style, differentiated its earnings performance from that of the sector so far in 2001. Despite the 29% YoY fall of fx gain/loss adjusted net interest income, the 47% cost cutting achieved in operating expenses –driven by the 57% reduction in personnel expenses and 41% in rent expenses- resulted in a strong bottom line, surging by 13.5% YoY, according to TAS accounts, in 9M2001. Note that our coverage universe aggregate net income slump has been 67% YoY, in the same period, mainly driven by huge fx losses. Immune to special audit process of the BRSA: 2001 net income is forecast to post 3.1% YoY growth in TAS accounts… We are pretty much confident that the special audit process introduced by BRSA (Banking Regulation and Supervision Agency) will not produce significant negative surprises for TEB, if any, thanks to the prudent reporting tradition of the bank already in place. We view TEB as one of the safest banking bets in the Turkish banking universe, together with Akbank, in the framework of the recapitalization program, in terms of recognition of previous periods’ losses. Having said that, our FY2001 net income forecast of US$39mn for TEB suggests a 3.1% YoY surge, slightly below than the 9M2001 performance in terms of growth just because of strong 4Q2000. However, on IAS bank-only accounts, we forecast TEB to report a US$8mn loss, mainly on the back of US$45mn net monetary loss forecast, a consequence of TEB’s low leverage -a similar case to Akbank that reports relatively lower earnings in the IAS format when compared to TAS accounts. Similarly, we project TEB to post a US$22mn loss in the consolidated IAS format as well. Profitability Outlook 2002-2003 for the Banking Sector Spread Analysis…To simplify the calculations, below we present the evolution of spreads, namely returns on TL and hard currency loans and compare them with cost of deposits. Fx spreads already enjoyed some major improvement, and going forward there will be some minor retreat… A sharp decline in fx deposit rates in parallel to FED’s rate cuts has already taken place: the average 3-month US$ deposit rate came down from 16.9% in YE2000 to 4.2% as of YE2001 (and further down to 3.7% as of March, 2002), according to Central Bank data. The improvement is significant considering that the average 3-month US$ deposit rates were 8.2% in the past five years. In the same period, given that the decline in the return of fx assets was not significant, fx spreads improved significantly to around 10 pp levels. More specifically, our coverage universe average annualized fx spread stood at 9.6 pp in 3Q2001 compared to the five-year average of 5.6 pp. Currently, fx deposit rates further declined to 2-3% levels –the average of our coverage universe for 3-month fx deposits stands currently at 2.5%- and the US$ abundance in the market does suggest the continuation of the trend, up until the rise of interest rates globally. In our forecast period, we expect fx spreads to stabilize at around 8 pp by YE2003 with a slight decline in US$ loan returns, though we expect fx deposit rates to move to 3-4% levels by YE2003, for banks under our coverage.
T E
B

RAYMOND JAMES SECURITIES – TURKEY
10
…as it is the case for TL spreads… Our coverage universe’s five-year average annualized TL spread is 9.4 pp, compared to the 9M2001 level of 29 pp. Current TL deposit rates are still quite high as banks intend to attract TL deposits since demand for fx loans is limited. In our opinion, going forward, TL spreads should narrow down with the Turkish Central Bank lowering its quotations in parallel to success in disinflation. Having said that, we forecast TL spreads to level at 23.3 pp on average in the 2002-2003 period. Yet a more comprehensive picture should be attained through an analysis of US$-based returns. According to our calculations, our coverage universe’s five-year average net gain on TL loans funded by TL deposits stood at 33 pp and the 3Q2001 annualized return was slightly below at 30%. Our forecasts suggest that US$ return on TL asset/liability class will average 23.3 pp in the 2002-2003 period for our coverage universe, lower than the past five years average. In overall terms, our 2002-2003 forecasts suggest that combined US$ return will be 3.3 pp lower with fx spreads partially making up the lower TL returns.
Source: RJST
US$-based returns might be improved through a shift in earning assets/liabilities to TL from hard currencies…For our coverage universe, we forecast TL spreads to yield more than two fold annual return over fx spreads on average. Hence banks can limit the upcoming margin contraction through a shift of earning assets/liabilities from hard currencies to TL, while we do not anticipate banks to resort to fx short positions for profit maximization, as it is currently the case along with BRSA’s recent announcements. All in all, profitability of the sector is improving but the special audit creates substantial uncertainty for FY2001 financials. The profitability of the banking sector which was eroded until 9M2001, should have improved in the last quarter of 2001 and in 1Q2002, mainly linked to TL’s real appreciation and downward trend of the interest rates with bond rates currently standing at as low as 52% ca compared to 90% ca in September 2001, while 10 years Turkish Eurobonds are yielding over 10.7% annually again compared to 14.5% in September 2001. Banks are also benefiting from their positive asset maturity gap -assets with longer average maturity compared to liabilities- but the spreads should narrow later in the year and also in 2003. Yet, all of these positive developments on the profitability front are clouded by the special audit process, a factor creating substantial uncertainty regarding the true financial picture of the private banks.
T E
B
5 Years Avg. 3Q2001 2002-2003 Avg.TL Spread 9.4 pp 28.6 pp 11.4 ppFX Spread 5.4 pp 9.6 pp 8.3 pp$ Return on TL 33.2 pp 28.7 pp 23.3 pp$ Return on fx 5.4 pp 9.6 pp 8.3 ppCombined $ Return 17.0 pp 17.2 pp 13.7 pp
Summary Spread and Return Analysis

RAYMOND JAMES SECURITIES – TURKEY
11
TEB’s Case: 2002-2003 Outlook High liquidity will be gradually invested in high yield earning assets… As of 9M2001, TEB still sits on high liquidity, with liquid assets making up 49.5% of total assets, almost three fold of the average ratio of our coverage universe. As of 9M2001, 25% of the bank’s liquidity is placed on international banks, at possibly around libor plus a minor margin and another 61% in the interbank market -compared to 7% in the past five years’ average- where obviously yields are lower compared to commercial lending. Currently the high liquid asset base of the bank offers a strong upside for future profitability, when the risk of lending declines together with a general pick up in the economy. Cost of funding to decline more than the sector average… According to our calculations, in 3Q2001, TEB enjoyed the lowest US$ deposit cost –1% quarterly cost compared to 1.4% of our coverage universe average - but faced high TL deposit cost -12.9% quarterly in US$ terms compared to 10.2% of our coverage universe average. In fact, thanks to its reliable and stable deposit base, TEB has always offered deposit rates below market averages. Yet, along with the previously outlined strategy, TEB tries to attract TL deposits from the market at market rates as well as to motivate its existing clients to reverse currency substitution. Hence, the downside in TL deposit costs is significantly higher than the market average, another upside for the profitability. Net fee income is forecast to grow at a CAGR of 25% in 2002-2003… In the 2002-2003 period, we estimate 25% CAGR in net fee income (versus 22% CAGR in deposits and 48% in loans), from our forecast of US11.5mn in FY2001 to US$18mn in FY2003. Note that in 9M2001, TEB recorded a 48% YoY net fee income growth. Here TEB’s stable deposit base comes on to the scene one more time coupled with the bank’s strong hold in commission-generating products as well as cross-selling opportunities. Margin improvement together with strong earning assets growth will produce 19% CAGR in TAS bottom line… Our projections yield 24% and 13% US$ EPS growth in 2002 and 2003 respectively, in TAS accounts. In IAS bank-only accounts, we forecast net income to grow to US$11mn in 2002 and US$17mn in 2003 from US$8mn loss forecast in 2001. Similarly, for the IAS consolidated accounts, we project net income to grow to US$17mn in 2002 and US$23mn in 2003 from US$22mn loss forecast in 2001. The table below depicts the summary of our forecasts and profitability ratios. Source: Banks' Association of Turkey, RJST
T E
B
2000 2001E 2002E 2003E 2000 2001E 2002E 2003E 2000 2001E 2002E 2003ENet Income (US$ mn) 37 38 48 54 12 -8 11 17 14 -22 17 23 yoy change -19% 3.1% 24.0% 13.3% -43% n.m. n.m. 53% -54% n.m. n.m. 32%Adj. Net Int. Income (US$ 108 66 82 100 103 72 60 65 189 83 93 89 yoy change 2% -39% 25% 21% 19% -30% -17% 9% 73% -56% 12% -5%RoAE 33% 32% 40% 36% 9% n.m. 8% 12% 10% n.m. 13% 15%RoAA 2.7% 2.8% 3.6% 3.4% 0.9% n.m. 0.9% 1.1% 0.7% n.m. 0.9% 1.0%
TAS IAS bank only IAS consolidatedSummary Earnings Forecasts and Ratios
RAYMOND JAMES SECURITIES – TURKEY
12
BALANCE SHEET ANALYSIS Liquidity High liquidity ratio of 49.5% as of 9M2001, compared to our coverage universe average of 17.4%. The bank’s liquid assets to total assets ratio reached over 65% in 3M2001, just after the devaluation along with squared positions on loans and G-bonds. Yet, throughout the normalization period, the liquidity has been gradually pulled down to its 9M2001 level of 49.5% that we estimate to further decline to 37.5% in 2002 and 33.4% by 2003. The recent boost in liquidity of TEB is in fact a natural consequence of TEB’s stable deposit base. Accordingly, when lending is reduced due to increased risk perception and/or low loan demand, the liquidity rises eventually. Looking forward the stable deposit base is one important asset of the bank, for the sake of the balance sheet flexibility. As it has been the case in the past, we anticipate the current excess liquidity to be primarily diverted to loans in parallel to the economic recovery. Loans Prudent lending…TEB has always pursued a conservative stance against extending loans. This strategy is obviously evident in the bank’s loans to assets and loans to earning assets ratios when compared to its peers’: TEB’s current loans/assets and loans/earning assets ratios of 25.7% and 27.8% are lowest, when compared to our coverage universe average ratios of 35.3% and 34.9%, respectively, as of 9M2001. The picture is similar in terms of historical averages as well. Five-year average loans to assets of our coverage universe stood at 38.3% compared to TEB’s 29.5%. Yet, given the bank’s aggressive loan growth target of 67% in 2002, its FY2002 loans to assets ratio is expected by the management at 45% in FY2002, compared to our forecast of 35%. TEB’s lending breakdown is currently as follows: corporate loans making up 53% of total, commercial loans comprising 41% of total and retail loans making up the remaining 6%. We estimate the current composition of loans to remain largely intact in 2002, with some expansion in favor of commercial lending, in parallel to the management guidance. As of 9M2001, TEB’s fx loans to total loans ratio stands at 63%, the minimum compared to our coverage universe average of 76%. TEB’s breakdown of loans supports the management intension of being aggressive on TL loans that is also highly viable in terms of profitability, in our opinion, an issue that we elaborated in the earnings outlook section. Marketable Securities Low marketable securities exposure… One other distinctive strategic investment choice of TEB’s management has been low marketable securities exposure compared to the rest of the sector that historically relied, above international standards, on lucrative but unsustainable returns on government securities mostly financed through massive short fx positions. As of
T E
B
RAYMOND JAMES SECURITIES – TURKEY
13
9M2001, TEB has the lowest repo inclusive government securities to assets ratio at 13.4% versus the average ratio of our coverage universe at 26.2%. This is a product of TEB’s traditional stance of emphasizing on real banking activities with a longer-term scope at the expense of short-term gains. We anticipate the bank’s G-bond exposure to remain at current levels, mostly on relatively less risky Eurobonds and floating rate notes. We forecast repo inclusive G-bonds to total assets ratio of TEB at 13.3% and 13.1% of assets in FY2002 and FY2003, respectively. Deposits One of the two banks that experienced net deposit inflow since YE2000… TEB’s strong brand image is visible in its deposit base evolution through the crisis period in 2001. Since YE2000, in a period when depositors’ confidence to the Turkish banking system was lowest as perceived from the significant fund outflows from the system, TEB’s deposits grew by 10% versus our coverage universe’s average 6% decline, with only Isbank managing some deposit base expansion. One more time, this is a product of TEB’s strong brand image visible in stable and high quality deposit franchise. As of 9M2001, deposits to assets ratio of TEB currently stands at 68.3%, in line with our coverage universe average of 69.1%. Fx deposits to total deposits ratio stands at 85% as of 9M2001, significantly higher than the peer group average of 75%. In our opinion, this is related to the rather conservative nature of TEB’s dedicated depositors. Highest demand deposits share… As of 9M2001, the bank’s weight of demand deposits in the total deposit mix at 23% is only lower than that of Garanti with 25% and compares favorably with our coverage universe average of 19.4%. A high quality deposit franchise… One aspect determining the quality of a deposit base is definitely the amount of core deposits within total deposits. In our coverage universe, TEB has the highest client deposits to total deposits ratio of 98.7%, versus the average of 87.2%. More strikingly, some 40% of TEB’s deposit base comes from the bank’s private banking clients. Lowest deposit costs despite its smaller size in our coverage universe… As the bank’s strategy is to grow in TL loans in 2002, TEB’s TL deposit rates are the highest compared to Big 4, as of 3Q2001, at annualized cost of 64% in TL terms. Yet, according to the CBT data, the banking sector weigthed average 3 month TL deposit rates stood at 67.7% in 3Q2001 and hence TEB’s TL deposit costs are in line with the market. On the other hand, the bank offered the lowest rates in fx deposits at annualized cost of only 4.1% in 3Q2001. All in all, in 3Q2001, TEB enjoyed the lowest annualized US$ deposit cost of 12%, compared to the peer group average of 15.1% despite its significantly smaller size.
T E
B

RAYMOND JAMES SECURITIES – TURKEY
14
Funds Borrowed Funds borrowed declined from a record high level of US$608mn in YE2000 to US$193mn as of 9M2001, in line with the trend in the sector. This has its roots not only in lenders’ increased risk perception against Turkish banks following the devaluation, but also in the scarcity of profitable but low-risk investment opportunities. TEB renewed a loan facility of US$100mn in 4Q2001 that matured in 9M2001 and the management indicates its intention to rollover only maturing borrowings without taking on board a new syndicated loan facility within a 12-month horizon. Currently, the funds borrowed to total assets ratio of 18.1% is slightly above our coverage universe, averaging at 16.7%. The same ratio stood at 31% between 1996-2000 for TEB and we expect it to reach 24.2% as of YE2001.
Source: Banks' Association of Turkey, RJST
T E
B
TEB: Evolution of Asset Structure
0%
10%
20%
30%
40%
50%
60%
70%
80%
90%
100%
1996 1997 1998 1999 2000 2001E 2002E 2003E
Other Marketable Securities Loans Cash and Banks
TEB: Evolution of Liability Structure
0%
10%
20%
30%
40%
50%
60%
70%
80%
90%
100%
1996 1997 1998 1999 2000 2001E 2002E 2003E
Other Deposits Funds Borrowed Equity Repos
Comparative Asset Breakdown
0%10%20%30%40%50%60%70%80%90%
100%
TEB Akbank Garanti Isbank YKB Average
Other Marketable Securities Loans Cash and Banks
Comparative Liability Breakdown
0%10%
20%30%40%50%
60%70%80%
90%100%
TEB Akbank Garanti Isbank YKB Average
Other Equity Funds Borrowed Deposits Repos

RAYMOND JAMES SECURITIES – TURKEY
15
Asset Quality and Balance Sheet Management TEB’s sound fundamentals are also strongly confirmed by the rating agencies… As it can be followed from the table below, despite being a mid-size bank, TEB’s ratings are in parallel to the largest Turkish banks.
High quality loan book: low NPL, related party loans and accrued interest on loans…TEB has the lowest NPL to loans ratio of 1.3% as of 9M2001 in our coverage universe with average of 5% and well below the industry average of 23.6%. TEB’s success in maintaining a quality loan book cannot be utterly related to its prudent lending practices. Proactive loan book management is also an aspect of this success: both in the 1998 and 2002 crises, TEB management systematically and quickly reduced its lending activities together with the first signs of the bleak outlook. Secondly and more importantly, TEB’s policy to approve credit demand from high quality and selected clients, together with its highly institutionalized credit monitoring & reviewing processes as well as a strict collateral policy are the basis of the bank’s success in achieving a high quality loan book. We are also in the view that the familiarity of the bank’s management with the market in general is another factor to mention. Moreover, TEB’s NPLs are fully provisioned, while our coverage universe’s and the sector’s provisioning ratios are 45.3% and 65.3%, respectively, as of 9M2001.
T E
B
BANKSLong Term
FX DepositsShort Term
DepositsAkbank B3 NPTürkiye Garanti Bankası B3 NPTEB B3 NPTürkiye İş Bankası B3 NPKoçbank B3 NP
BANKS Individual SupportLong Term
FX Deposits LCAkbank C 4T B B+TEB C/D 4T B BTürkiye İş Bankası C/D 4T B B-Türkiye Garanti Bankası C/D 4T B B-Yapı Kredi Bankası C/D 4T B B-Koçbank C/D 4T B B-
BANKSDomestic Strength Support
Long Term FX Deposits
Short Term FX
Akbank A 2 B CTürkiye Garanti Bankası A 2 B CTEB A- 2 B CTürkiye İş Bankası A- 2 B CKoçbank BBB 2 B CYapı Kredi Bankası BBB- 2 B C
CAPITAL INTELLIGENCE
TURKISH BANKS' RATINGS (April 2002)
MOODY'S INVESTORS SERVICESBank Financial Strength
(BFS)D+
FITCH
D+D+DE+

RAYMOND JAMES SECURITIES – TURKEY
16
TEB has a minimal related party loan exposure of only US$0.2mn or 0.1% of net loans as of 9M2001, compared to our coverage universe average of 19.3% of net loans. The bank has traditionally pursued an arm’s length lending policy with the Group companies, which are in fact high quality corporations in their fields. One other aspect of the quality loan book is evident with TEB’s low accrued interest income on loans, when compared to the peers. It is often suspected by the investment community that an increased amount of accrued interest income on loans might emanate from increased, but non-recognized NPLs. As of 9M2001, TEB booked US$9mn accrued interest income on loans, representing 8.7% of its 12M trailing interest income versus our coverage universe’s average ratio of 20.3%. Note that only Akbank, which has also a high quality loan book -though with a bigger size-, scores as good as TEB in this respect with a similar ratio. A scarce quality, virtually no maturity mismatch… One major weakness of the Turkish banking system is the high maturity mismatch between assets and liabilities emanating from both the short maturity choice of depositors, due to historically high volatility in interest rates and fx prices, and more importantly the unavailability of long-term local financing sources. Once again, TEB stands out from the crowd with only an estimated 10-day maturity mismatch as of 9M2001 between assets and liabilities compared to our coverage universe average of over 6 months. Most of the banks suffered enormously from the maturity mismatch, especially after the devaluation when the rates skyrocketed. Particularly after the debt swap, where the banks switched their short-term maturity TL based securities with longer-term fx linked bonds, the average maturity mismatch of the system widened further. Yet, the downtrend in interest rates since mid-September works to the benefit of the system and we anticipate this to be the case in the foreseeable future. In TEB’s case, especially with growth resuming in 2H2002, the bank’s strategy of aggressive loan extension should widen the maturity mismatch of the bank. Currency risk exposure… The bank’s currency position has historically never been aggressive, compared to its equity base due to the management’s evident risk aversion. As of 9M2001, TEB has a negligible US$7mn short fx position, climbing to a moderate US$26mn including off-balance sheet exposure. As a proof of the management’s foresightedness, the bank had a US$18mn fx short position as of 6M2000 and reduced it to US$1mn as of 9M2000, before the November liquidity crisis, having felt the upcoming turbulence. In the meantime, TEB recorded some US$13mn net fx gains –through active fx trading possibly- despite a US$4mn short position on average until 9M2001, representing 4% of TAS average equity base in the mentioned period, that is well below the regulatory limit of 20%.
T E
B T
E B

RAYMOND JAMES SECURITIES – TURKEY
17
INCOME STATEMENT STRUCTURE and EARNINGS QUALITY High earnings quality…TEB scores well in terms of earnings quality, as well. Based on 9M2001 TAS accounts, the bank enjoys the highest net fee income and lowest trading income as % of operating income. Looking forward, given the potential margin erosion with the hopefully declining inflation and interest rates, profitability of the sector will narrow compared to the past. In TEB, the stable depositor base and successful product differentiation, together with the strength in retail investment products, as highlighted by TEB’s (and its investment subsidiaries’) strong presence in the mutual fund business with a total size of US$207mn and 3.6% market share (US$400mn including off-shore), are the most important elements of the relatively stronger fee income generation potential of the bank.
Source: Banks' Association of Turkey, RJST …and also relatively lower earnings volatility… As previously highlighted, TEB’s strategy of not relying on short term trading gains with high risk exposure, results in a relatively more sustainable profitability for the bank. More importantly, the damage in crisis years that TEB faced has been relatively milder than the sector average. As an example, in 9M2001 TEB reported a 14% US$ EPS growth compared to a 67% slump in our coverage universe in the mentioned period, based on financials prepared according to TAS. Likewise, TEB’s equity eroded by 32% compared to our coverage universe average equity plunge of 53%, in the same period. High operational efficiency due to rational cost structure… Among the banks we cover, TEB has the lowest cost to income ratio, lagging only behind Akbank. As of 9M2001, the cost to income ratio of TEB stands at 66% versus 45% of Akbank and 82% of our coverage universe average. Similarly and not to our surprise at all, in terms of branch and employee efficiency measures, TEB statistics score well above the sector averages. High level of interest earning assets, a major contributor to asset profitability… Among the banks in our coverage universe, TEB differentiates itself from the crowd with the highest earnings assets to total assets ratio of 92%, even surpassing that of Akbank and significantly exceeding the average of our coverage universe at 84%. Indeed, as of 9M2001, TEB’s annualized RoAA of 3.4% is only inferior to that of Akbank that stands at 3.9%, compared to our coverage universe average of 1.7%.
T E
B
TEB: Breakdown of Operating Profits
20%
3%
66%
11%
Net Fee IncomeNet Trading IncomeNet Interest IncomeOther
Average of RJST Banking Universe
14%
15%
53%
18%
Net Fee IncomeNet Trading IncomeNet Interest IncomeOther

RAYMOND JAMES SECURITIES – TURKEY
18
STRATEGY A clean and flexible balance sheet managed with a controlled growth strategy…TEB bases its strategy on a clean and flexible balance sheet as well as controlled growth. TEB’s conservative approach and its contribution to the bank’s brand name made it the bank, where affluent Turks, seeking risk minimization rather than return optimization, parked their holdings. Over the years, this factor enabled TEB to establish a strong base of relationship banking, where clients seek TEB branded products without scrutinizing the alternatives. This factor also enhances the cross-selling capacity of TEB. A widely used marketing strategy by TEB is also a horizontal penetration through the clients of clients, a system which also reduces the risk of non-performing assets especially in corporate lending. With increased focus on lower segments…TEB’s acquisition of Kentbank branches also implies that TEB is now expanding its target clientele towards the lower segments, but obviously under TEB’s cautious culture which proved to be a virtue under the current banking environment. Increased the efficiency…TEB already increased its efficiency level through cost rationalization. The bank has reduced its number of personnel by 8% since FY2000. Accordingly, the bank’s cost to assets ratio dropped to annualized 4.5% in 9M2001, from 6.7% in FY2000, despite the fact that banks’ assets shrunk by 31% in US$ terms in the same time span in parallel to the contracting economy. Although TEB’s cost to assets ratio is favorable compared to large banks in our universe, with the exception of Akbank, the management nevertheless implies desire for higher efficiency. In our view, the leaner structure of the bank should bring an increased efficiency level to TEB going forward, as the bank could easily command a larger asset base keeping a stable cost structure. Corporate Banking…To expand the client base in corporate lending TEB divided its corporate clients into two categories. Clients with more than US$25mn sales volume are covered by the Corporate Banking Group, while smaller accounts are handled by the commercial banking group. The bank’s main corporate banking activity is to provide short-term foreign trade financing among many other services, while services of subsidiaries, i.e. leasing, factoring and insurance, are marketed to complement the corporate banking package and optimize cross-selling opportunities. As of the most recent 2001 data TEB commands a 4% market share in foreign trade financing. Retail Banking… Aiming to create a strong brand in retail banking, TEB launched the “Telepati” brand/platform, providing around the clock services to retail banking clientele via branch offices and contemporary alternative distribution channels such as internet and telephone banking. Yet, “Telepati” and related marketing efforts could not boost the bank’s credit card market share as the number of credit cards remained at a negligible c63K, compared to 14 million credit cards issued by the sector. Nevertheless, the number of the payroll accounts approached 15K compared to 10.8K in FY2000. Obviously, the current position in retail banking is not satisfactory and the bank seeks risk averse expansion on this front, also capitalizing on the penetration potential brought by the recently acquired Kentbank branches.
T E
B
RAYMOND JAMES SECURITIES – TURKEY
19
Private Banking…TEB is the leader of the private banking segment in Turkey as being the first bank seriously tapping the affluent mass in the country through a wide range of financial products, providing services both in Turkey and abroad. The bank’s generally accepted conservatism was a point of attraction for local individuals with high net worth, when choosing TEB. Moreover, TEB’s stronghold in asset management, as proven with its 3.6% market share in mutual funds, is also a strong factor behind TEB’s successful penetration into the private banking segment. In parallel to this strong edge, 40% of the bank’s deposit base is made up by the private banking clients. Together with the variety of the product range and high caliber services, the horizontal penetration approach paid-off as private banking clients are mainly the owners, shareholders and senior management of the bank’s corporate clients. All in all TEB’s strategy has never been to be a high street bank, but rather a service and product driven niche institution with the primary goal of being the largest mid-size entity of Turkey, always putting a special emphasis on private banking activities.
T E
B T
E B

RAYMOND JAMES SECURITIES – TURKEY
20
COMPANY OVERVIEW Turkey’s 10th largest private commercial bank… A private commercial bank, TEB was previously established as a regional bank in 1927 under the name of “Kocaeli Halk Bankasi”. The bank was later acquired by the Colakoglu Group and its name was changed to Turk Ekonomi Bankasi. The bank is mainly active in corporate, private and retail banking as well as Treasury operations. TEB operates with 1,524 employees in 73 branches and ranks 10th among private commercial banks as of 1Q2002. A full fletched financial institution… The bank owns financial participations active in different segments of financial services, namely leasing, factoring, insurance, investment banking and asset management. TEB also wholly owns a large bank subsidiary in Netherlands, with assets and equity of €615mn and €35mn, respectively, as of FY2001.
TEB's SUBSIDIARIES TEB Investment (Owned 74.8% by TEB) TEB Factoring (Owned 65.8% by TEB) Among the leading brokerage houses with strong underwriting capacity. The company ranked 9th in terms of equity market trading volume with a 3.7% market share in 2001.
Third largest factoring company in Turkey in 2001 with a 9.1% market share in the sector. Mainly supports exporter clients of the bank.
TEB N.V.(Owned 100% by TEB) TEB Asset Management (Owned 55.9% by TEB)
Established in the Netherlands in 1998, the bank is mainly involved in trade finance. As of FY2001 TEB N.V. has a total asset size of €615mn with equity size of €35mn.
One of the largest fund management company of Turkey with assets under management of US$207mn corresponding to c4% market share. The total number of clients is around 15,000.
TEB Leasing (Owned 68.7% by TEB) TEB Insurance (Owned 50% by TEB) TEB Leasing commands 1.8% market share as of FY2001, ranking 10th in the sector. Ability to access foreign funding is a major advantage over rivals. Both factoring and leasing subsidiaries should benefit from consolidation in the financial sector.
Non-life niche insurer with around 98,000 policy holders, established to complement banking services. The first insurance company to be assessed by an international rating agency, Fitch, with a rating of A-.
Source: Company, RJST Part of a large group… TEB is owned by TEB Mali Yatirimlar, that controls the financial subsidiaries of the Colakoglu Group. Established in 1930, the Colakoglu Group is one of Turkey’s largest business groups, active in the iron & steel industry, trade shipping and energy other than banking & finance. Excluding financial sector participations, the group’s 2001 combined turnover stands at US$1.1 bn. TEB’s parent TEB Mali Yatırımlar has recently announced an interest in the privatization of Vakifbank. Societe Generale together with Groupama, Akbank, Dogan Holding & Dısbank and Oyakbank are the other interested parties invited to one to one meetings by the auction committee. The binding offers will be submitted to the auction committee by the first week of June and the block sale will be finalized by the end of June 2002.
T E
B

RAYMOND JAMES SECURITIES – TURKEY
21
SECTOR OVERVIEW Long-necessitated consolidation in the Turkish banking sector is now progressing… The twin crises of November 2000 and February 2001 made local depositors brand quality sensitive contrary to their previous focus on returns. Brand quality will gain further importance in our view, once the existing full State guarantee –actually in practice- on deposits is removed. This development is expected in 18 months, after the completion of the bank recapitalization program in August 2002 (or in around 2 years from now on), according to the revelations of the President of BRSA. The Big 4 have gained 7 pp market share in deposits since FY2000… In our view, the above consideration suggests that the Turkish banking sector is going into an inevitable consolidation stage, where only prominent local brands along with foreign names will remain as the players to share a growing pie. In that respect, the flight to quality is already taking place despite the existing deposit guarantee scheme. The market share gain of the four large private banks up from 27.7% in FY 2000 to 35.8% in 3Q2001 is a clear indication of increased risk perception of depositors. Despite being a mid-size bank, TEB was among the beneficiaries of the flight to quality trend in the sector as its deposit market share surged by 0.4 pp, to 1% as of 9M2001. In our view, TEB is among the few mid-size banks benefiting from a high reliability tag.
Significant growth potential in banking assets… Growth will not only come through the consolidation, but also through the inherent expansion potential of the sector in the coming years. In our opinion, the shrinkage in 1994 and subsequent recovery in 1995 sets a good example for the potential recovery in late 2002 and 2003 although the current economic dynamics are much more different. Compared to the aftermath of the 1994 devaluation, we think that the Turkish economy’s switch to growth will take longer, starting in the second half of 2002 and gaining pace in the last quarter. Moreover the slow process of the bank
T E
B T
E B
Akbank Garanti Isbank YKB TEB TOTALMarket Shares (%)FY1995 5.9% 5.1% 9.5% 7.3% 0.8% 28.6%FY1996 5.4% 5.3% 7.7% 6.8% 0.9% 26.2%FY1997 6.0% 5.7% 7.4% 7.2% 0.9% 27.1%FY1998 5.9% 7.6% 6.4% 7.1% 0.8% 27.7%FY1999 5.4% 8.1% 6.2% 7.2% 0.6% 27.5%9M2000 6.4% 7.8% 6.7% 6.5% 0.8% 28.2%FY2000 6.4% 7.7% 6.8% 6.7% 0.6% 28.3%3M2001 7.2% 7.9% 6.9% 7.4% 1.1% 30.6%6M2001 8.2% 8.0% 8.9% 7.4% 0.8% 33.3%9M2001 8.7% 8.0% 9.8% 8.2% 1.0% 35.8%2001E 8.3% 8.1% 9.9% 8.4% 1.0% 35.8%2002E 9.2% 7.3% 10.2% 8.7% 1.0% 36.4%2003E 10.1% 8.4% 11.3% 9.8% 1.1% 40.7%2004E 10.8% 8.9% 11.9% 10.5% 1.1% 43.2%2005E 11.5% 9.3% 12.4% 11.0% 1.2% 45.4%Source: Banks' Association of Turkey, RJST
Market Share in Deposits

RAYMOND JAMES SECURITIES – TURKEY
22
recapitalization program appears to be a factor, delaying the recovery in bank financials and the economy overall. With double digit growth forecast until 2005… Yet, inspired by the 1994 crisis experience and using a statistical correlation model, we envisage a 14% US$ based growth in aggregate banking assets in Turkey on the back of the expected 2.2% GNP growth in 2002, which will be followed by another 4% growth in 2003. The reason of higher asset growth forecast in 2002 is in fact a product of TL’s 14% expected real appreciation, according to our house estimate. Similarly, we forecast the deposit growth of the sector to reach 17% in 2002. In 2002-2005, we anticipate an attractive pace in the growth of banking assets at CAGR of 10%. We foresee the loan-to-GDP ratio of the sector to jump to 28.5% by the end of 2005 from 22.5% in 9M2001, a rather conservative figure in our opinion.
Source: Banks’ Association of Turkey, RJST Margin contraction… On the dark side, the sector will eventually experience a margin contraction in case Turkey proves successful in its disinflation strides as this would consequently lead to lower real interest rates. Actually, the first sign of margin contraction was evident in the year 2000 as interest rates came down significantly with the implementation of the 1999 Stand-by program. The profitability of banks decreased gradually until 9M2000, purely due to declining inflation and interest rates. In the same period, Turkish banks especially increased efforts in the area of core financial services –especially in retail banking-, concentrated on increased efficiency on the operational side, accelerated technology investments and expanded alternative distribution channels. Cost efficiency and product variety are critical success factors… The same trend will also prevail in the upcoming post-recapitalization era and more efficient franchises will be better off. Profitability in the low interest rate environment will be positively influenced by an efficient cost base in operations & funding and increased product variety together with enhanced access to masses. With respect to the latter, reaching a certain number of clients
BANKING SECTOR AGGREGATES (US$ bn)
0
2040
6080
100
120140
160180
200
1990
1991
1992
1993
1994
1995
1996
1997
1998
1999
2000
2001
E
2002
F
2003
F
2004
F
2005
F
Assets Loans Deposits
T E
B
RAYMOND JAMES SECURITIES – TURKEY
23
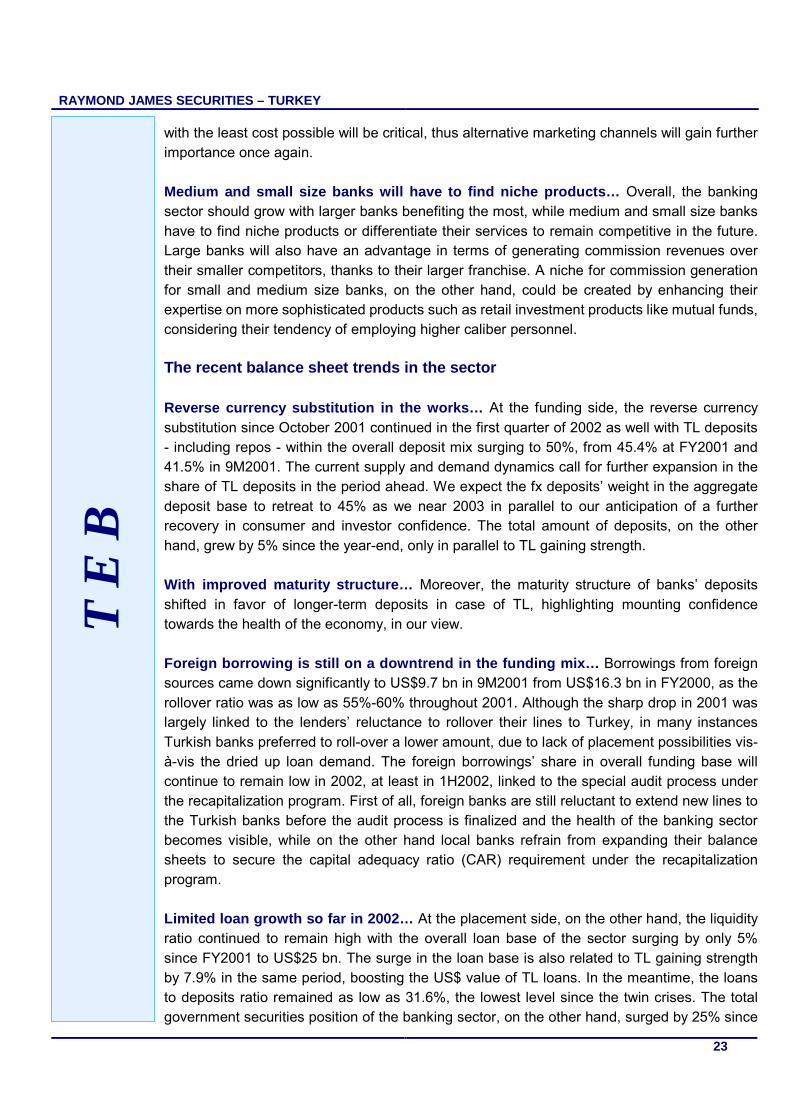
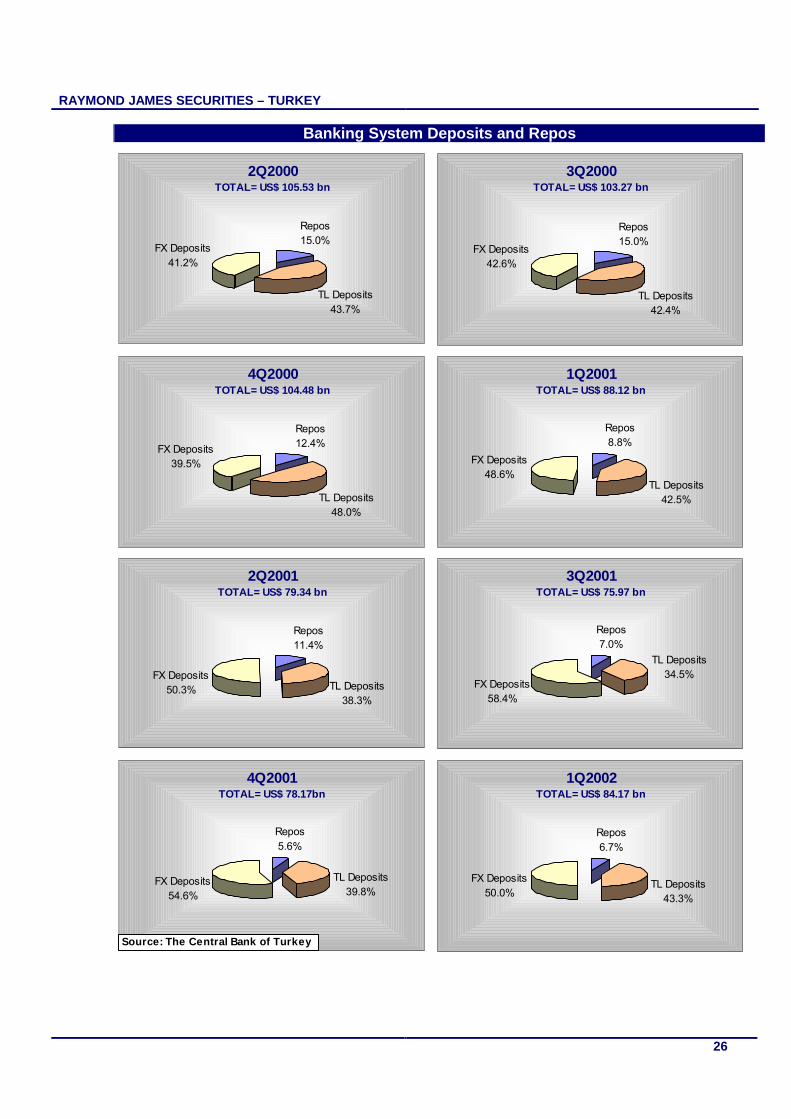
with the least cost possible will be critical, thus alternative marketing channels will gain further importance once again. Medium and small size banks will have to find niche products… Overall, the banking sector should grow with larger banks benefiting the most, while medium and small size banks have to find niche products or differentiate their services to remain competitive in the future. Large banks will also have an advantage in terms of generating commission revenues over their smaller competitors, thanks to their larger franchise. A niche for commission generation for small and medium size banks, on the other hand, could be created by enhancing their expertise on more sophisticated products such as retail investment products like mutual funds, considering their tendency of employing higher caliber personnel. The recent balance sheet trends in the sector Reverse currency substitution in the works… At the funding side, the reverse currency substitution since October 2001 continued in the first quarter of 2002 as well with TL deposits - including repos - within the overall deposit mix surging to 50%, from 45.4% at FY2001 and 41.5% in 9M2001. The current supply and demand dynamics call for further expansion in the share of TL deposits in the period ahead. We expect the fx deposits’ weight in the aggregate deposit base to retreat to 45% as we near 2003 in parallel to our anticipation of a further recovery in consumer and investor confidence. The total amount of deposits, on the other hand, grew by 5% since the year-end, only in parallel to TL gaining strength. With improved maturity structure… Moreover, the maturity structure of banks’ deposits shifted in favor of longer-term deposits in case of TL, highlighting mounting confidence towards the health of the economy, in our view. Foreign borrowing is still on a downtrend in the funding mix… Borrowings from foreign sources came down significantly to US$9.7 bn in 9M2001 from US$16.3 bn in FY2000, as the rollover ratio was as low as 55%-60% throughout 2001. Although the sharp drop in 2001 was largely linked to the lenders’ reluctance to rollover their lines to Turkey, in many instances Turkish banks preferred to roll-over a lower amount, due to lack of placement possibilities vis-à-vis the dried up loan demand. The foreign borrowings’ share in overall funding base will continue to remain low in 2002, at least in 1H2002, linked to the special audit process under the recapitalization program. First of all, foreign banks are still reluctant to extend new lines to the Turkish banks before the audit process is finalized and the health of the banking sector becomes visible, while on the other hand local banks refrain from expanding their balance sheets to secure the capital adequacy ratio (CAR) requirement under the recapitalization program. Limited loan growth so far in 2002… At the placement side, on the other hand, the liquidity ratio continued to remain high with the overall loan base of the sector surging by only 5% since FY2001 to US$25 bn. The surge in the loan base is also related to TL gaining strength by 7.9% in the same period, boosting the US$ value of TL loans. In the meantime, the loans to deposits ratio remained as low as 31.6%, the lowest level since the twin crises. The total government securities position of the banking sector, on the other hand, surged by 25% since
T E
B T
E B
RAYMOND JAMES SECURITIES – TURKEY
24
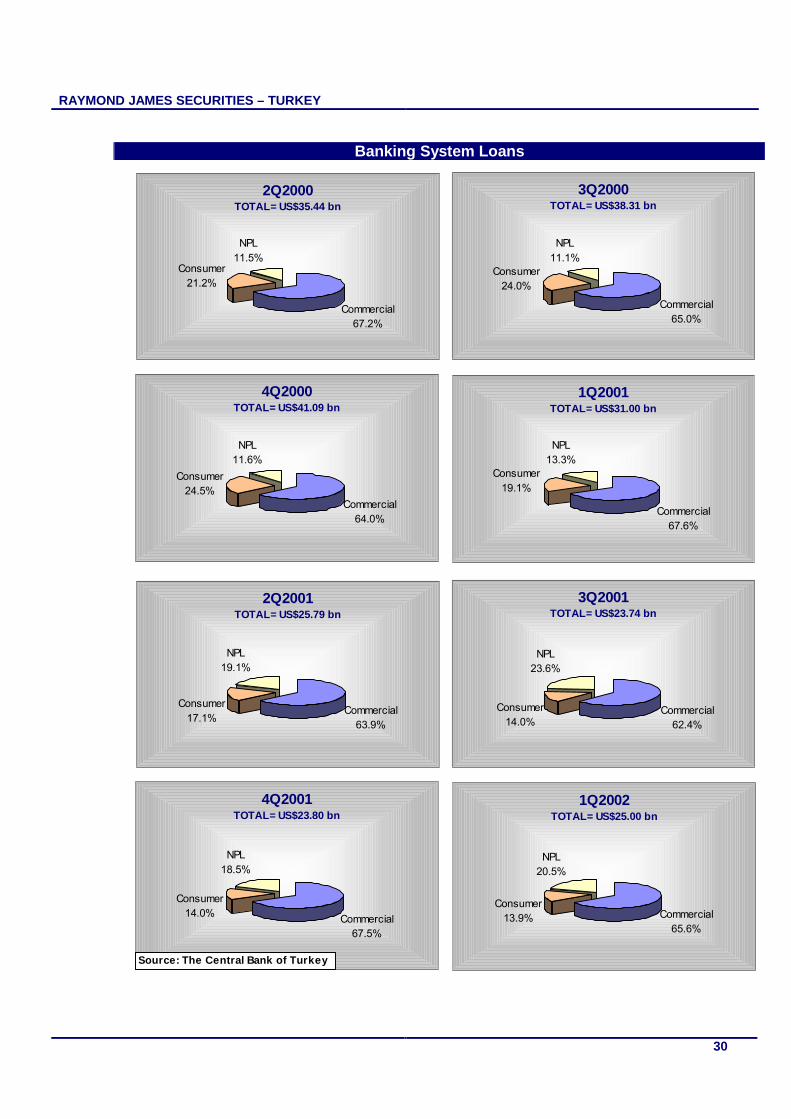
year-end 2001, to US$50.6 bn. This is also linked to weak loan demand and the crowding-out effect of public debt, but banks also refrain from lending in order to be able to keep high BIS ratios not to resort to State assistance provided in the framework of the bank recapitalization program. Shift to TL lending…The composition of the aggregate loan portfolio on the other hand, changed in favor of TL lending. The share of TL loans to total loans grew to 58% as of March 22, 2002 from 55.3% in FY2001 and 49.2% in 3Q2001. Though, this is largely linked to TL’s appreciation against fx, the changing tendency of depositors in favor of TL at the funding side is a factor affecting banks’ appetite towards TL lending as well. A growing NPL problem… A negative development has been the further climb of the NPL ratio to 20.5%, from 18.5% in FY2001, as the ripple effects of the twin crises of November 2000 and February 2001 continued and the stagnant economic activity persisted to adversely impact the financial health of the real sector. In our opinion, the ratio could potentially go further up following the special audit process as banks will have to recognize new NPLs, which they have not recorded so far.
T E
B

RAYMOND JAMES SECURITIES – TURKEY
25
Banking System Balance Sheet Trends
Source: The Central Bank of Turkey
Banking SystemBalance Sheet Trends
0
2040
6080
100
120140
160
2000Q2 2000Q3 2000Q4 2001Q1 2001Q2 2001Q3 2001Q4 2002Q1
US$ bn
Assets Loans Deposits Equity Repos
Banking SystemBalance Sheet Ratios
0%
10%20%
30%
40%
50%60%
70%
80%
2000Q2 2000Q3 2000Q4 2001Q1 2001Q2 2001Q3 2001Q4 2002Q1
Loans/Assets Deposits/Assets Loans / Deposits Loans/(Deposits+Repos)
RAYMOND JAMES SECURITIES – TURKEY
26
Banking System Deposits and Repos
2Q2000TOTAL= US$ 105.53 bn
Repos 15.0%
TL Deposits43.7%
FX Deposits41.2%
3Q2000TOTAL= US$ 103.27 bn
Repos 15.0%
TL Deposits42.4%
FX Deposits42.6%
4Q2000TOTAL= US$ 104.48 bn
Repos 12.4%
TL Deposits48.0%
FX Deposits39.5%
1Q2001TOTAL= US$ 88.12 bn
Repos 8.8%
TL Deposits42.5%
FX Deposits48.6%
2Q2001TOTAL= US$ 79.34 bn
Repos 11.4%
TL Deposits38.3%
FX Deposits50.3%
3Q2001TOTAL= US$ 75.97 bn
Repos 7.0%
TL Deposits34.5%
FX Deposits58.4%
4Q2001TOTAL= US$ 78.17bn
Repos 5.6%
TL Deposits39.8%
FX Deposits54.6%
1Q2002TOTAL= US$ 84.17 bn
Repos 6.7%
TL Deposits43.3%
FX Deposits50.0%
Source: The Central Bank of Turkey

RAYMOND JAMES SECURITIES – TURKEY
27
Maturity Breakdown of TL Deposits
2Q2000
TOTAL= US$ 38.81 bn
Sight and 7 days notice
19%
1M17%
3M43%
6M17%
12M<4%
3Q2000TOTAL= US$ 38.05 bn
Sight and 7 days notice
20%
1M16%
3M41%
6M21%
12M<2%
4Q2000TOTAL= US$ 46.17 bn
Sight and 7 days notice
21%
1M27%
3M41%
6M10%
12M<1%
1Q2001TOTAL= US$ 36.09 bn
Sight and 7 days notice
18%
1M27%
3M47%
6M7%
12M<1%
2Q2001TOTAL= US$ 30.76 bn
Sight and 7 days notice
21%
1M25%
3M47%
6M6%
12M<1%
3Q2001TOTAL= US$ 26.51 bn
Sight and 7 days notice
21%
1M27%
3M45%
6M5%
12M<2%
4Q2001TOTAL= US$ 30.76 bn
Sight and 7 days notice
17%
1M23%3M
52%
6M5%
12M<3%
1Q2002TOTAL= US$ 35.77 bn
Sight and 7 days notice
18%
1M22%3M
50%
6M6%
12M<4%
Source: The Central Bank of Turkey

RAYMOND JAMES SECURITIES – TURKEY
28
Maturity Breakdown of FX Deposits
2Q2000
TOTAL= US$ 38.97 bn
Sight and 7 days notice19%
1M29%
3M33%
6M8%
12M<11%
3Q2000TOTAL= US$ 42.91 bn
Sight and 7 days notice
18%
1M31%
3M32%
6M8%
12M<11%
4Q2000TOTAL= US$ 40.80 bn
Sight and 7 days notice16%
1M31%3M
34%
6M8%
12M<11%
1Q2001TOTAL= US$ 38.05 bn
Sight and 7 days notice
15%
1M35%
3M32%
6M7%
12M<11%
2Q2001TOTAL= US$ 39.11 bn
Sight and 7 days notice15%
1M39%
3M30%
6M6%
12M<10%
3Q2001TOTAL= US$ 42.57 bn
Sight and 7 days notice
16%
1M40%
3M30%
6M5%
12M<9%
4Q2001TOTAL= US$ 43.07 bn
Sight and 7 days notice17%
1M41%
3M28%
6M6%
12M<8%
1Q2002TOTAL= US$ 43.13 bn
Sight and 7 days notice
18%
1M39%
3M28%
6M7%
12M<8%
Source: The Central Bank of Turkey

RAYMOND JAMES SECURITIES – TURKEY
29
Banking System Funding Sources
2Q2000
TOTAL=US$ 139.80 bn
Foreign Borrowings
9%
Deposits69%
Repos14%
Others8%
3Q2000 TOTAL=US$ 143.69 bn
Foreign Borrowings
8%
Deposits70%
Repos11%
Others11%
4Q2000 TOTAL=US$ 152.65 bn
Foreign Borrowings
8%
Deposits70%
Repos11%
Others11%
1Q2001 TOTAL=US$ 125.47 bn
Foreign Borrowings
9%
Deposits69%
Repos11%
Others11%
2Q2001 TOTAL=US$ 109.86 bn
Foreign Borrowings
9%
Deposits75%
Repos8%
Others8%
3Q2001 TOTAL=US$ 100.84 bn
Foreign Borrowings
8%
Deposits80%
Repos6%
Others6%
Source: The Banks Association of Turkey
RAYMOND JAMES SECURITIES – TURKEY
30
Banking System Loans
2Q2000TOTAL= US$35.44 bn
Commercial 67.2%
Consumer21.2%
NPL11.5%
3Q2000TOTAL= US$38.31 bn
Commercial 65.0%
Consumer24.0%
NPL11.1%
4Q2000TOTAL= US$41.09 bn
Commercial 64.0%
Consumer24.5%
NPL11.6%
1Q2001TOTAL= US$31.00 bn
Commercial 67.6%
Consumer19.1%
NPL13.3%
2Q2001TOTAL= US$25.79 bn
Commercial 63.9%
Consumer17.1%
NPL19.1%
3Q2001TOTAL= US$23.74 bn
Commercial 62.4%
Consumer14.0%
NPL23.6%
4Q2001TOTAL= US$23.80 bn
Commercial 67.5%
Consumer14.0%
NPL18.5%
1Q2002TOTAL= US$25.00 bn
Commercial 65.6%
Consumer13.9%
NPL20.5%
Source: The Central Bank of Turkey
RAYMOND JAMES SECURITIES – TURKEY
31
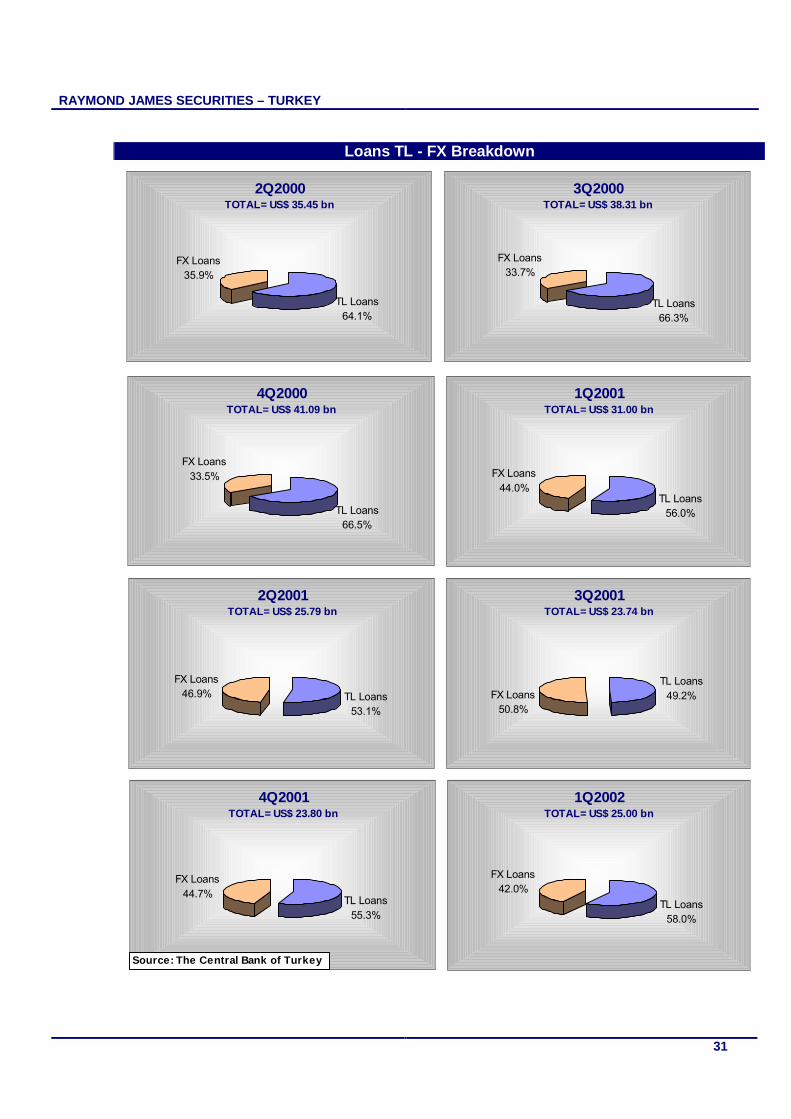
Loans TL - FX Breakdown
2Q2000TOTAL= US$ 35.45 bn
TL Loans64.1%
FX Loans35.9%
3Q2000TOTAL= US$ 38.31 bn
TL Loans66.3%
FX Loans33.7%
4Q2000TOTAL= US$ 41.09 bn
TL Loans66.5%
FX Loans33.5%
1Q2001TOTAL= US$ 31.00 bn
TL Loans56.0%
FX Loans44.0%
2Q2001TOTAL= US$ 25.79 bn
TL Loans53.1%
FX Loans46.9%
3Q2001TOTAL= US$ 23.74 bn
TL Loans49.2%FX Loans
50.8%
4Q2001TOTAL= US$ 23.80 bn
TL Loans55.3%
FX Loans44.7%
1Q2002TOTAL= US$ 25.00 bn
TL Loans58.0%
FX Loans42.0%
Source: The Central Bank of Turkey

RAYMOND JAMES SECURITIES – TURKEY
32
THE RECAPITALIZATION PROGRAM Rehabilitation and transformation of the system in the works…The Turkish banking sector is currently in the midst of a major transformation and rehabilitation process to soothe the wounds of the twin crises: huge fx losses and shrunken balance sheets as well as rising NPLs. So far the State has transferred funds amounting to around US$40-45 bn -representing around 27-30% of 2001 GDP- to the sector both to recapitalize State banks and to assume the losses of the private sector banks that failed. In the meantime, the number of ailing banks under the SDIF has been reduced from 19 to three. The BRSA has done a great job, so far…In our opinion, the BRSA has done a great job in terms of setting up the necessary framework for the much needed restructuring of the sector. The recapitalization program is well designed to increase the transparency of the system, reduce the systematic risk, force the bank owners to increase their banks’ capitalization, open up the way for mergers, hence for further consolidation of the sector and allow the use of State funds by the banks -even if at a high cost- with proper supervision. In that respect BRSA’s work is appreciated by both the IMF and the WB as well as by the financial circles. Private banking sector recapitalization program… The State is determined to put a final and decisive touch to the private banking sector via injecting some funds, namely US$3-4bn according to the estimates of the BRSA before the special audit. According to the plan, funds will be channeled to the undercapitalized banks with CAR below 8% –calculated according to IAS for both bank-only and consolidated financials - in return of bank shares, either as collateral or equity.
T E
B
Summary Legislation on State funding to the private sector banks... Eligibility criteria and the form of the State assistance are categorized as follows:
1-Banks with CAR between 5-8%: All banks will be eligible to get the State assistancein the form of G-bonds to be issued by the Treasury with a +5% spread to the marketrates. The bonds will carry a 7-year maturity with two years of grace period.
2-Banks with CAR between 0-5%: These banks have to increase their CAR to 5% toget the State assistance. The regulation categorizes these banks into two as describedbelow.
a - Banks with market share higher than 1% in terms of assets or banks reachingthis criterion through merger: These banks would opt a cash capital increase to raisethe CAR to 5%, where the contribution of the State will at most be equal to thecontribution of the existing shareholders. Yet, the capital contribution of the State willbe in the form of G-bonds to be issued by the Treasury at market rates, and not incash.
b - Banks with market share less than 1%: These banks will have the CAR raised to5% via a cash capital injection of the existing shareholders to apply for State assistanceto further increase their capital adequacy ratio from 5% to 8%.

RAYMOND JAMES SECURITIES – TURKEY
33
Private sector banks in a blackout period until mid-May… Currently, the deadline of the 2nd phase of the special audit process has expired, including the one week extension. The final evaluation of the special audit will be made by the BRSA around May 15, 2002 along with the regulator’s written notification to all the private banks. At least until then, banks are in a blackout period. So far, the BRSA has not done any public announcement regarding the timing of the release of financials for the listed banks, but according to the below timetable we estimate it as June 15, 2002, the latest.
The short term outcome is a big question mark… Most banks under our coverage have already revealed that they do not intend to apply to the State assistance claiming that their expected capital adequacy ratios are above the 8% requirement. It is true that the IAS29 standards will inflate the capital base of most banks compared to what is reported in financial statements prepared according to TAS. On the other hand, we strongly believe that the audit regulations issued by the BRSA will be strictly followed by the auditors and the BRSA will be aggressive on identifying previously hidden losses or overstated gains on loans, fx transactions and securities portfolios, through optimist judgments. As such, the outcome of the recapitalization program is still a big question mark. All in all, the recapitalization program promises a financially healthier and more transparent banking sector with lower systematic risk, but on the dark side there is a potential for a decline in private banks’ equities and a possibility of dilution for existing shareholders of the banks. Yet, the longer term implications of the program are buoyant... • = The fund transfer to the private banks by the State will reduce investors' and depositors’ risk perception regarding the banking sector, once finalized. • = With improved CARs, banks will be able to contribute more to the financing of both the private and public sector. • = The rehabilitation cost of the banking sector will decline, since the State funding will work as a leverage until the financial health of the sector is improved and the State Guarantee on deposits is eventually removed.
BANK RECAPITALIZATION PROGRAM TIMELINE Date Event April 8 First audit to be completed. April 22 Completion of the second audit and BRSA's evaluation of the audits May-15 BRSA to send letters to banks stipulating required actions on the basis of the BRSA’s evaluation May-18 Banks with losses higher than their reserves should notify BRSA the precautions to be taken May-31 All banks will call their General Assemblies
If needed, Extraordinary General Assemblies should be called to propose rights offerings June 15 Deadline to finalize Assemblies June 18 Banks’ public announcement of the decisions of management in the Assemblies June 21 Announcement of the rights issue if required June 30 BRSA to issue an implementation regulation to ensure that banks’ end-2002 financials to comply with IAS July 7 The right offerings should be finalized and the start of the application for the recapitalization program July 12 The unused rights of listed banks should be offered to public August Injection of state funds to the banks Source: BRSA, RJST
T E
B

RAYMOND JAMES SECURITIES – TURKEY
34
• = The 1% market share limit reduces the survival chance of small banks on one hand, but it encourages M&A activity on the other hand, which will further stimulate required consolidation in the sector. • = The increased transparency and consolidation in the sector will heighten foreign banks’ appetite for entering the Turkish banking system.
Real Sector Problems: The resolution of NPLs and the “Istanbul Approach”
Transition to growth from the current economic stagnancy is a necessity… A fast transition to growth from the current economic stagnancy is a must for the government as it faces high pressure from the real sector representatives regarding their financial problems with the banks. The coalition parties believe that they did all that was planned by the bureaucrats and the international institutions, but the betterment is still not visible in the real economy. Hence, the Government is pressuring the BRSA hard to speed up the process for the banks in order to restructure the problematic loans to financially viable companies and extend new loans to ignite economic growth. This plan is called the “Istanbul Approach”.
Banks are asked to be cooperative with the real sector problems, and that with no incentive… It is true that, if banks trigger the liquidation process of NPLs in chase of collaterals with fear of someone else moving ahead, this would obviously mean more job losses and a major hit on expected growth in 2002. Regarding the problem of the real sector, banks are squeezed to recognize their NPLs in the BRSA’s special audit, but also asked to be patient with their debtors in terms of calling loans back or chasing collaterals, and even to be cooperative in restructuring problematic loans, with no specific incentive. It all boils down to the need of extra financing for the resolution of the problem.
The WB is likely to put money on the table for the resolution of the problem… Chief of Turkey Desk Chibber made it specifically clear that “the WB will surely financially support the project”. He also added that the WB aims to make “the maximum available contribution” as this would help the economic activity to pick up in Turkey. In that respect, the WB, the Turkish Treasury and the financial sector representatives gathered on April 5, 2002. There were unconfirmed news in the media revealing that the WB will contribute to the financing of the resolution plan.
The solution: establishment of an Asset Management Company (AMC)… Parallel to the other countries’ experiences, the solution lies in the operational existence of an AMC that will purchase bad loans from banks so that they can extend new loans to the real sector with new funds available. The SDIF recently made a public announcement regarding the establishment of an AMC, a step towards the resolution of bad loan management with minimum damage to the real sector companies. According to the detailed timetable, the AMC is aimed to be established earliest by August 2002 and it will begin to purchase bad loans from private sector banks only after that. The selection of viable real sector companies is another problematic issue of the whole process.
T E
B

RAYMOND JAMES SECURITIES – TURKEY
35
BALANCE SHEET (US$mn) 1998 1999 2000 2001E 2002E 2003E
Cash and due from banks 328 488 441 211 224 306Interbank Placings 15 28 269 329 292 280Reserve deposits with the CBT 60 57 63 67 82 100Securities 335 323 176 115 165 222Loans, Net 260 213 344 316 461 640Accrued interest income 34 0 0 0 0 0Investment in Associates 22 30 46 45 45 45Property and equipment 17 19 26 21 21 21Other assets and pre-payments 0 22 35 28 33 41Total Assets 1,069 1,181 1,399 1,132 1,323 1,654
Deposits 581 575 660 725 854 1,052Interbank Takings 0 0 1 0 0 0Obligations for repurchase agreements 93 188 61 66 25 10Short Term Borrowings 244 220 434 173 268 390Short Term Bonds payable 0 0 0 0 0 0Taxation on Income 26 31 15 10 8 11Accrued interest and other Liabilities 49 68 76 32 33 38Long Term Debts 0 0 0 0 0 0Total Liabilities 992 1,083 1,247 1,007 1,187 1,502
Share capital 63 63 104 91 91 91Retained Earnings 14 34 48 34 45 62Total shareholders' equity 77 98 152 125 136 153Total Liabilities and equity 1,069 1,181 1,399 1,132 1,323 1,654
IAS BANK ONLY FINANCIALS
INCOME STATEMENT (US$ mn) 1998 1999 2000 2001E 2002E 2003ETotal interest income 216 219 230 248 161 172Total interest expenses 89 94 101 190 106 101Net interest income 127 125 130 58 54 72FX gains and (losses) -40 -39 -27 14 6 -6Net interest income after fx gains and losses 86 86 103 72 60 65Provision for loan losses 1 1 4 4 4 4Net interest income after fx and loan losses 85 86 99 68 56 62Total non-interest income 10 36 41 44 50 56Income from banking and financial services 7 12 12 15 17 19Net Trading Income 0 18 6 10 6 5Other Operating Income 3 6 23 19 27 32Total non-interest expenses 56 75 108 69 74 82Salaries and Wages 29 36 41 25 28 31Administration and other expenses 19 29 41 30 30 33Transaction Taxes 4 6 20 8 12 14Depreciation and amortisation 4 4 6 6 4 4Other Expenses 0 0 0 0 0 0Loss on net monetary position 4 9 12 45 15 13Income before income taxes 35 38 19 -2 17 23Income taxes 13 18 8 6 6 6(Loss)/income before extraordinary taxes 21 20 12 -8 11 17Extraordinary items 0 0 0 0 0 0Net Income 21 20 12 -8 11 17Source: Company, RJST

RAYMOND JAMES SECURITIES – TURKEY
36
BALANCE SHEET (US$ mn) 1998 1999 2000 2001E 2002E 2003E
Cash and due from banks 340 612 598 349 361 395Interbank Placings 15 42 269 350 260 170Reserve deposits with the CBT 60 57 63 70 79 88Securities 373 338 170 170 201 241Loans, Net 258 408 686 659 1,021 1,246Accrued interest income 40 44 61 22 48 57Investment in Associates 2 3 2 2 2 2Property and equipment 19 22 30 26 26 26Other assets and pre-payments 67 76 144 126 153 171Total Assets 1,173 1,601 2,024 1,775 2,152 2,396
Deposits 481 767 989 1,145 1,294 1,436Interbank Takings 0 0 0 0 0 0Obligations for repurchase agreements 93 200 60 155 225 239Short Term Borrowings 338 390 655 255 348 396Short Term Bonds payable 79 0 9 0 0 0Taxation on Income 30 37 25 15 17 25Accrued interest and other Liabilities 65 86 106 75 119 127Long Term Debts 0 0 0 0 0 0Total Liabilities 1,086 1,480 1,845 1,645 2,003 2,223
Minority Interest 5 10 10 5 7 8
Share capital 63 63 104 91 91 91Retained Earnings 18 48 65 34 51 74Total shareholders' equity 82 111 169 125 142 165Total Liabilities and shareholders' equity 1,173 1,601 2,024 1,775 2,152 2,396
IAS CONSOLIDATED FINANCIALS
INCOME STATEMENT (US$ mn) 1998 1999 2000 2001E 2002E 2003ETotal interest income 259 302 341 357 280 263Total interest expenses 97 128 147 251 177 168Net interest income 162 174 193 106 103 94FX gains and losses 58 64 4 23 10 5Net interest income after fx gains and losses 104 110 189 83 93 89Provision for loan losses 1 1 55 5 8 10Net interest income after fx and loan losses 103 109 134 78 85 79Total non-interest income 17 56 56 56 72 82Total non-interest expenses 69 94 132 91 111 123Loss on net monetary position 6 13 18 57 15 -2Income before income taxes 45 58 40 -14 31 40Income taxes 17 24 20 11 12 15(Loss)/income before extraordinary taxes 28 34 20 -25 19 25Extraordinary items 0 0 0 0 0 0Net (loss)/income before minority interests 28 34 20 -25 19 25Minority Interest 3 4 5 -2 2 2Net Income 25 29 16 -22 17 23Source: Company, RJST

RAYMOND JAMES SECURITIES – TURKEY
37
BALANCE SHEET (US$ mn) 1998 1999 9M2000 2000 9M2001 2001E 2002E 2003E
Cash and Banks 363 512 771 708 528 601 533 590Marketable Securities 246 262 237 220 114 115 165 222Loans 279 213 365 347 273 316 490 688Participations 20 24 29 37 32 39 44 44Fixed Assets 10 10 10 13 9 10 12 12Accrued Interest Income 27 65 90 83 33 45 72 76Reserve Deposits 56 56 70 63 66 67 82 100Other assets 31 62 67 65 11 18 24 35Total Assets 1,033 1,205 1,639 1,537 1,066 1,211 1,422 1,766
Deposits 616 574 766 660 728 740 908 1,108Funds Borrowed 259 419 544 608 193 293 293 390Accrued Interest Expense 29 53 92 68 19 32 33 38Provisions 18 31 10 15 3 4 6 8Other Liabilities 26 40 97 48 34 39 46 57Shareholders' Equity 85 87 130 139 89 103 137 166Paid-in-Capital 40 41 83 82 36 38 32 25Legal Reserves 6 6 6 6 3 4 30 55Provisionary Reserves 2 2 10 10 19 20 17 13Revaluation Fund 3 3 4 6 6 8 17 24Current Year Profit 34 36 27 35 25 33 40 48Total Liabilities 1,033 1,205 1,639 1,537 1,066 1,211 1,422 1,766
TURKISH ACCOUNTING STANDARDS FINANCIALS -Bank Only
INCOME STATEMENT (US$ mn) 1998 1999 9M2000 2000 9M2001 2001E 2002E 2003EInterest Income 274 280 164 250 178 216 206 233Interest Expense 112 124 79 114 143 164 121 126Net Interest Income 162 155 84 136 34 52 85 107Loan Loss Provision 1 1 1 1 2 3 8 4Net Int. Income after LL Provision 161 155 84 135 33 48 77 103Non Interest Income -40 -14 30 13 47 52 42 43Net Commission Income 7 8 5 6 8 11 15 18Net FX Gain (Loss) -51 -50 -17 -29 13 14 -3 -8Trading Income (Loss) -1 21 19 14 3 1 2 1Other 4 6 22 22 22 26 28 33Non Interest Expense 63 68 81 102 43 56 56 66Personnel Expenses 30 34 28 37 16 21 23 24Indemnity Provisions 0 0 1 2 1 1 0 0Other Provisions 2 1 3 4 1 2 2 3Taxes and Duties Expenses 4 5 10 8 5 7 6 7Rent Expense 4 5 5 6 4 5 6 7Depreciation Expense 2 3 2 3 2 3 2 1Other Expenses 20 20 33 42 14 18 16 24Net Non-Interest Income -103 -83 -51 -89 4 -5 -14 -22PBT 58 72 33 47 36 44 64 81Tax Provisions 17 26 3 9 3 5 16 27Net Profit 41 46 29 37 33 38 48 54Source: Company, RJST

RAYMOND JAMES SECURITIES – TURKEY
38
Source: RJST
TAS ACCOUNTS AKBANK GARANTI ISBANK YKB TEB SUM / AVERAGEASSET STRUCTUREAssets (US$ mn)2000 10,983 9,866 11,635 11,208 1,537 45,228Current 9,540 6,844 9,581 8,719 1,066 35,750Loans (US$ mn)2000 3,926 3,749 4,354 4,395 347 16,770Current 3,295 2,230 3,359 3,476 273.5 12,633Current Ratios and Loan Related DataMarket Share 10.3% 7.0% 10.5% 10.9% 0.9% 39.6%Loans/Assets 34.5% 32.6% 35.1% 39.9% 25.7% 35.3%Loans/Earnings Assets 37.8% 41.9% 43.4% 48.9% 27.8% 35.0%FX Loans/Total Loans 82.3% 79.0% 81.0% 73.6% 63.3% 75.8%Gross Total NPL (US$ mn) 56 154 240 207 4 661Total Provisions (US$ mn) 56 68 75 96 4 299Total Net NPL (US$ mn) 0 86 165 111 0 362Gross NPL/Gross Loans 1.7% 6.5% 6.7% 5.6% 1.3% 5.0%NPL Coverage 100.0% 44.0% 31.4% 46.4% 100.0% 45.3%Loans under watch (US$ mn) 27 6 550 123 3 709 % of net loans 0.8% 0.3% 16.4% 3.5% 1.0% 5.6%Related Party Loans (US$ mn) 542 213 504 1,173 0.2 2,432 % of net loans 16.4% 9.5% 15.0% 33.7% 0.1% 19.3%Retail Loans (US$ mn) 181.2 384.0 407.2 430.0 16.3 1,418.7 % of net loans 5.5% 17.2% 12.1% 12.4% 6.0% 11.2%Accrued Interest on Loans (US$ mn) 111 194 483 409 9 1,206Acc. Int. on Loans/12M Int. on Loans 8.7% 19.2% 33.7% 31.4% 8.7% 20.3%Total Loan Risks (US$ mn) 3,433 2,516 4,557 4,120 285 14,202Loan Risk/Assets 36% 37% 48% 47% 27% 40%Off balance Sheet Related Party Exposure (US$ mn)Total 555 159 440 667 129Marketable Securities (US$ mn)Total Marketable Securities 2,803 1,658 2,287 1,394 114 8,256Repo 279 281 323 235 30 1,149Total G bonds (Repo inc. Marketable Securi 3,082 1,940 2,610 1,630 143 9,404G bonds/Assets 32.3% 28.3% 27.2% 18.7% 13.4% 26.3%G bonds/Interest Earnings Assets 35.3% 36.4% 33.8% 22.9% 14.6% 31.5%Liquid Assets (US$ mn)Current 2,043 927 1,158 1,571 528 6,226Liquid Assets/Total Assets 21.4% 13.5% 12.1% 18.0% 49.5% 17.4%Net Money Market Position (US$ mn)Current 1,772 693 863 1,336 498 5,161Money Market Position/Assets 18.6% 10.1% 9.0% 15.3% 46.7% 14.4%

RAYMOND JAMES SECURITIES – TURKEY
39
Source: RJST
TAS ACCOUNTS AKBANK GARANTI ISBANK YKB TEB SUM / AVERAGELIABILITY STRUCTUREDeposits (US$ mn)2000 6,532 5,130 6,951 6,887 660 26,160Current 6,505 4,042 7,303 6,132 728 24,708Net Deposit flow in last quarter 161 213 472 417 121 1,384% chg in last quarter 3% 6% 7% 7% 20% 6%Deposit flow in 12 M 234 -823 755 -262 -38 -135FX/Total Deposits 70.8% 72.2% 76.5% 70.2% 85.4% 75.0%Weighted Avg Demand Deposits/Deposits 13.6% 25.0% 20.2% 18.1% 23.0% 19.4%Market Share 8.7% 5.4% 9.8% 8.2% 1.0% 33.2%Deposits/Assets 68.2% 59.1% 76.2% 70.3% 68.3% 69.1%Deposits/Interest Bearing Liabilities 79.5% 70.5% 90.6% 82.4% 79.0% 81.4%Bank Deposits/Total Deposits 9.0% 4.4% 2.1% 3.9% 1.3% 4.1%Funds Borrowed (US$ mn)Current 1,677 1,695 754 1,312 193 5,631Borrowings/Interest Bearing Liabilities 20.5% 29.5% 9.4% 17.6% 21.0% 18.6%12 M chg in borrowings -224 -747 -371 86 -351 -1,607Interest Bearing LiabilitiesCurrent 8,181 5,737 8,056 7,444 921 30,3392000 8,851 8,105 8,344 8,131 1,268 34,699Equity (US$ mn)2000 1,615 1,221 2,447 2,483 139 7,905Current 951 645 1,011 1,007 89 3,704Current RatiosEquity/Assets 10.0% 9.4% 10.6% 11.6% 8.3% 10.4%Equity/Interest Bearing Liabilities 11.6% 11.3% 12.6% 13.5% 9.6% 12.2%Leverage 8.6 8.9 8.0 7.4 10.4 8.2Free Capital 753 -142 -57 163 48 764Free Capital/Equity 79.2% -22.0% -5.7% 16.2% 54.0% 20.6%Free Capital / Total Assets 7.9% -2.1% -0.6% 1.9% 4.5% 2.1%Capital AdequcyBIS RatioTAS 18.1% 8.1% 12.5% 11.3% 10.7% n.m.Tier 1TAS 16.5% 8.4% 12.0% 11.5% 16.6% n.m.Short Position in FXGross -On balance Sheet 87 -40 1 174 -7 215FX Position/CMB Current Equity 9% -6% 0% 17% -8% 6%Net -Including off-Balance Sheet 64 -24 121 126 -33 254Estimated Maturity MismatchMaturity Gap (Assets > Liabilities) -Months 9 10 10 5 0 7

RAYMOND JAMES SECURITIES – TURKEY
40
Source: RJST
TAS ACCOUNTS AKBANK GARANTI ISBANK YKB TEB SUM / AVERAGEPROFITABILITYExpenses, ytd (US$ mn)Personnel Expenses 133 171 374 222 37 938Total Operating Expenses 437 656 744 512 96 2,445Provisions 76 83 204 122 6 491Tax Provisions 272 96 143 153 9 673Breakdown of Operating IncomeNet Fee Income 56% 56% 27% 36% 47% 48%Net Trading Income 20% 23% 12% 23% 28% 20%FX Adjusted Interest Income 24% 20% 47% 29% 25% 27%Other 1% 2% 14% 11% 1% 5%Net Profit (US$ mn)2000 550 329 409 410 37 1,7362001E 549 167 109 130 38 993CAGR 2003-2000 6% -14% -3% -8% 13% -2%Profitability Ratios -US$ basedPretax Profits/Avg. Total Assets, ytd 3.8% 0.8% 0.4% 0.8% 2.8% 1.5%Operating Income/Avg. Total Assets, ytd 6.9% 5.1% 4.5% 3.9% 5.5% 5.1%Net Interest Income/Avg. Interest Earnings 21.0% 6.5% 9.1% 5.6% 3.0% 10.9%3Q01 Adjusted NIM 2.1% 0.9% 1.1% 1.1% 2.2% 1.5%9M01 Adjusted NIM 6.0% 1.4% 3.1% 1.8% 4.1% 3.3%ROAA annualised 3.9% 1.1% 0.5% 0.9% 3.4% 1.7%ROAE annualised 30.9% 9.4% 3.2% 5.3% 38.9% 11.7%Loan Yield3Q01 Quarterly $ yield in loans 7.8% 7.3% 8.8% 8.2% 8.3% 8.1%Deposit Yield3Q01 Quarterly $ cost of deposits 3.2% 4.5% 4.0% 4.2% 3.0% 3.8%Spreads3Q01 Quarterly $ Spread on TL 11.9% 10.2% 17.7% 8.4% 3.3% 10.3%3Q01 Quarterly $ Spread on FX 3.7% 1.8% 1.8% 2.3% 2.4% 2.4%3Q01 Quarterly $ Spread 4.6% 2.8% 4.8% 4.1% 5.3% 4.3%EFFICIENCYCost/Income AnalysisOperating Efficiency (%)2000 49% 93% 75% 96% 77% 78%Current 70% 93% 65% 94% 58% 76%2001E 69% 85% 65% 88% 51% 72%2002E 53% 74% 68% 102% 53% 70%2003E 46% 73% 67% 104% 53% 69%Cost/Income2000 39% 52% 67% 55% 71% 57%Current 45% 98% 103% 97% 66% 82%2001E 37% 86% 90% 84% 69% 73%2002E 34% 69% 59% 54% 58% 55%2003E 34% 68% 62% 55% 53% 55%Cost / Assets 3.1% 5.0% 4.8% 4.1% 3.5% 4.2%Current Employee/Branch Efficiency (US$mn, unless stated otherwise)Deposits/Branches 11 14 9 15 13 11Avg Monthly US$ Cost of an Employee 791 1,338 1,140 908 1,043 1,034Assets/Employee 1.1 1.2 0.6 0.9 0.9 0.9Loan / Branche 5.4 7.8 4.0 8.3 5.1 5.7Operating Income/ Branche 1.2 1.5 0.6 0.9 1.3 0.9Operating Expenses/ Branche 0.44 0.98 0.46 0.68 0.77 0.57

RAYMOND JAMES SECURITIES – TURKEY
41
Source: RJST
IAS ACCOUNTS AKBANK* GARANTI* ISBANK YKB TEB*ASSET STRUCTURELatest reporting period 9M2001 6M2001 6M2001 6M2001 YE2000Assets (US$ mn)2000 11,632 14,616 13,856 11,891 2,024Latest 9,703 11,084 11,700 9,346 2,024Loans (US$ mn)2000 3,779 5,855 4,394 4,368 686Latest 3,263 3,760 3,622 3,458 686Latest Ratios Loans/Assets 33.6% 33.9% 31.0% 37.0% 33.9%Loans/Earnings Assets 37.3% 42.9% 46.6% 54.4% 39.8%Net NPL (US$ mn) 55 174 186 n.a. 3Total Provisions (US$ mn) 77 121 79 n.a. 3Net NPL/Gross Loans 1.7% 4.4% 4.9% n.a. 0.8%NPL Coverage 139.0% 69.8% 42.7% n.a. 93.7%Marketable Securities (US$ mn)1999 3,771 3,791 2,150 2,050 3382000 2,315 4,075 3,265 2,439 170 G bonds/Assets 19.9% 27.9% 23.6% 20.5% 8.4% G bonds/Interest Earnings Assets 22.5% 34.0% 35.2% 28.6% 9.9%Latest 3,639 3,266 2,185 1,307 170 G bonds/Assets 37.5% 29.5% 18.7% 14.0% 8.4% G bonds/Interest Earnings Assets 41.6% 37.3% 28.1% 20.5% 9.9%Liquid Assets (US$ mn)1999 1,445 1,718 1,574 1,574 6542000 4,197 2,070 1,619 1,720 866 Liquid Assets/Total Assets 36.1% 14.2% 11.7% 14.5% 42.8%Latest 1,841 1,732 1,958 1,597 866 Liquid Assets/Total Assets 19.0% 15.6% 16.7% 17.1% 42.8%Interest Earning Assets (US$ mn)2000 10,291 12,001 9,278 8,526 1,723 Interest Earning Assets/Total Assets 88.5% 82.1% 67.0% 71.7% 85.1%Latest 8,743 8,759 7,765 6,362 1,723 Interest Earning Assets/Total Assets 90.1% 79.0% 66.4% 68.1% 85.1%Participations (US$ mn)Latest 86 80 1,312 779 2Participations/Assets 0.9% 0.7% 11.2% 8.3% 0.1%Real Estate (US$ mn)Latest 208 799 1,111 1,023 30Real Estate/Assets 2.1% 7.2% 9.5% 10.9% 1.5%*Consolidated

RAYMOND JAMES SECURITIES – TURKEY
42
Source: RJST
IAS ACCOUNTS AKBANK* GARANTI* ISBANK YKB TEB*LIABILITY STRUCTURELatest reporting period 9M2001 6M2001 6M2001 6M2001 YE2000Deposits (US$ mn)2000 7,261 7,379 7,213 6,707 989Latest 6,628 6,039 6,831 5,718 9892001E 6,558 6,617 7,785 6,636 1,145Growth 2001/2000 -10% -10% 8% -1% 16%Growth 2002/2001 44% 15% 21% 20% 13%CAGR 2003-2000 18% 7% 17% 14% 13%Latest RatiosDeposits/Assets 68.3% 54.5% 58.4% 61.2% 48.8%Deposits/Interest Bearing Liabilities 79.6% 69.7% 80.0% 80.0% 57.7%Funds Borrowed (US$ mn)2000 2,080 3,659 2,639 1,985 725Borrowings/Interest Bearing Liabilities 22.3% 33.2% 26.8% 22.8% 42.3%Latest 1,695 2,630 1,711 1,433 725Borrowings/Interest Bearing Liabilities 20.4% 30.3% 20.0% 20.0% 42.3%2001E 1,793 2,155 1,164 1,509 410Interest Bearing Liabilities (US$ mn)2000 9,340 11,038 9,852 8,692 1,714Latest 8,324 8,669 8,542 7,151 1,7142001E 8,351 8,772 8,950 8,145 1,555Total Liabilities (US$ mn)2000 9,868 12,934 10,642 9,282 1,845Latest 8,611 10,131 9,354 7,414 1,845Equity (US$ mn)1999 1,519 1,313 2,711 2,250 1112000 1,764 1,637 3,214 2,609 169 Equity/Assets 15.2% 11.2% 23.2% 21.9% 8.3%Latest 1,092 933 2,346 1,933 169 Equity/Assets 11.3% 8.4% 20.1% 20.7% 8.3%2001E 1,357 1,425 2,726 2,198 1252001E -Bank Only 1,268 992 1,414 1,419 125Bank Only/Consolidated 93% 70% 52% 65% 100%2002E 1,406 1,564 2,854 2,363 1422003E 1,549 1,682 3,046 2,419 165Growth 2001/2000 -23% -13% -15% -16% -26%Growth 2002/2001 4% 10% 5% 8% 14%Growth 2003/2002 10% 8% 7% 2% 16%CAGR 2003-2000 -4% 1% -2% -2% -1%Free Capital (US$ mn)2000 1,398 416 226 525 136Latest 797 53 -77 131 1362001E 1,052 431 303 396 97Latest RatiosEquity/Interest Bearing Liabilities 13.1% 10.8% 27.5% 27.0% 9.8%Leverage 12.7% 9.2% 25.1% 26.1% 9.1%Free Capital/Equity 73.0% 5.7% -3.3% 6.8% 80.8%Free Capital / Total Assets 8.2% 0.5% -0.7% 1.4% 6.7%BIS Ratio 27.0% 10.6% 15.0% 20.0% n.a.*Consolidated

RAYMOND JAMES SECURITIES – TURKEY
43
Source: RJST
IAS ACCOUNTS AKBANK* GARANTI* ISBANK YKB TEB*PROFITABILITYP&L Data Most Recent (US$ mn) 9M2001 6M2001 6M2001 6M2001 YE2000Net Interest Income 1,340 212 n.a. 364 193FX Gain (Loss) -771 -321 n.a. -280 -4Adjusted Interest Income 570 -109 459 85 189Provision for loan losses 36 36 37 72 55Net Fee Income 39 46 n.a. 97 33Net Trading Income 128 21 n.a. 24 9Other Operating Income 32 93 n.a. 70 14Total Operating Income 733 14 291 204 190Dividend Income 1 3 n.a. 70 n.a.Operating Expenses 254 376 670 240 132Gain (Loss) on net monetary position -477 -43 -6 -148 -18Pretax Profit 2 -404 -385 -184 40Income taxes 108 -56 7 -101 20Mınority Interest n.m. 16 n.m. n.m. 5Net Profit -106 -332 30 -84 16Net Profit (US$ mn)2000 256 232 317 203 162001E -87 39 109 -58 -22Growth 2001/2000 -134% -83% -66% -128% -243%Profitability Operating Income/Avg. Assets2000 16.1% 17.4% 14.8% 13.1% 5.3%2001E 13.1% 7.6% 8.5% 8.8% 7.1%Net Interest Margin2000 16.2% 14.9% 11.4% 15.0% 2.6%2001E 12.2% 5.7% 5.5% 9.4% 5.3%ROaE2000 15.6% 15.7% 10.7% 8.4% 11.1%2001E -5.6% 2.5% 3.7% -2.4% -15.2%2002E 3.6% 9.4% 4.6% 4.7% 12.8%2003E 9.6% 7.2% 6.5% 6.9% 14.7%EFFICIENCYCost/Income Analysis2000Cost / Assets 4.5% 7.3% 8.9% 6.1% 7.3%2001ECost / Assets Annualised 3.2% 5.8% 10.5% 4.5% 8.7%*Consolidated

RAYMOND JAMES SECURITIES – TURKEY
44
Appendix
Source: RJST
US$ /TL
1,000,000
1,200,000
1,400,000
1,600,000
1,800,000
2,000,000
2,200,000Ja
n-02
Feb-
02M
ar-0
2Ap
r-02
May
-02
Jun-
02
Jul-0
2Au
g-02
Sep-
02O
ct-0
2N
ov-0
2
Dec
-02
Jan-
03
Feb-
03M
ar-0
3Ap
r-03
May
-03
Jun-
03
Jul-0
3Au
g-03
Sep-
03O
ct-0
3N
ov-0
3
Dec
-03
Source: RJST
YoY CPI (expected) versus Secondary Market Compounded Bond Rates (expected)
25%30%35%40%45%50%55%60%65%70%75%80%
Jan-
02
Feb-
02
Mar
-02
Apr-0
2
May
-02
Jun-
02
Jul-0
2
Aug-
02
Sep-
02
Oct
-02
Nov
-02
Dec
-02
Jan-
03
Feb-
03
Mar
-03
Apr-0
3
May
-03
Jun-
03
Jul-0
3
Aug-
03
Sep-
03
Oct
-03
Nov
-03
Dec
-03
YoY CPI (%) Bond (%)

EEE MMM EEE RRR GGG III NNN GGG MMM AAA RRR KKK EEE TTT SSS TTT EEE AAA MMM
TURKEY
Research
Emir Sarpyener
Haldun Alperat Guldem Atabay
Ayse Kanioz Moroz
Banu Camlitepe
Ebru Bayar
Fuad Behbud
Mehmet Inal
Serkan Bayramoglu
RRaayymmoonndd JJaammeess SSeeccuurriittiieess -- TTuurrkkeeyy
Phone: 90.212.359.1000 Fax: 90.212.287.5115
Managing Director of Research Equity Strategy, Banks
Director of Research Equity Strategy, Banks Economy and Fixed Income
Conglomerates, Energy, Iron & Steel, Telecom & Tech.
Cement, Food, Petroleum & Deriv., Textiles
Automotives, Consumer Durables & Electronics, Tires
Airlines & Airline Services, Insurance, REIT
Beverages, Conglomerates, Media, Retail, Technology, Glass
Management Trainee
Sales – London Hakan Mitrani Ebru Ozekici
Sales – New York Oner Ayan Cengiz Baskir Sales – Turkey Mine Birmek Emre Birkan Mahmut Dermancioglu
Phone: 44.20.7696.6156 Fax: 44.20.7696.6197
Managing Director of Sales
Director of Sales Phone: 1.212.297 5603 Fax: 1.212.297 5643
Sales Trader Phone: 1.212.856 4385
Phone: 90.212.287 5652 Fax: 90.212.287 5115
ARGENTINA
Research Ricardo Cavanagh Norberto Sosa
RRJJ AArrggeennttiinnaa SSoocciieeddaadd ddee BBoollssaa SS..AA..
Phone: 54.11.4313.2554 Fax: 54.11.4313.2544
Senior Analyst Economist
INDIA Research
Anand Tandon Vikas Chauhan Hemindra Hazari Hozefa Topiwalla Ajay Mathrani Satish P. Jain Anil Siqueira Madhava Kumar
Sales – India Dick Mody
AASSKK--RRaayymmoonndd JJaammeess SSeeccuurriittiieess IInnddiiaa LLttdd..
Phone: 91.22.498.5670 Fax: 91.22.498.5666
Head of Research Pharmaceuticals, Cement Banking, Finance Consumer Goods, Media Information Technology Auto, Engineering, Telecommunications Editor Production
Phone: 91.22.498.5680 Fax: 91.22.498.5666
Director of Sales
Our research may also be accessed at the following sites: www.trapeze.net, www.multex.com andwww.firstcall.com