Turfgrass Sod: An Economic Assessment of the … · Turfgrass Sod: An Economic Assessment of the...
65
Turfgrass Sod: An Economic Assessment of the Feasibility of Providing Multiple-Peril Crop Insurance Prepared by the Economic Research Service, USDA for the Federal Crop Insurance Corporation February 23, 1995 Contributors: Agnes Perez, coordinator (202) 501-6779 Joy Harwood (202) 501-8554 Doyle Johnson (202) 219-0296 Agapi Somwaru (202) 219-0812 Glenn Zepp (202) 501-7703
Transcript of Turfgrass Sod: An Economic Assessment of the … · Turfgrass Sod: An Economic Assessment of the...

Turfgrass Sod: An Economic Assessment of the Feasibilityof Providing Multiple-Peril Crop Insurance
Prepared by the Economic Research Service, USDAfor the Federal Crop Insurance Corporation
February 23, 1995
Contributors: Agnes Perez, coordinator (202) 501-6779Joy Harwood (202) 501-8554 Doyle Johnson (202) 219-0296Agapi Somwaru (202) 219-0812Glenn Zepp (202) 501-7703

Table of Contents
Executive Summary . . . . . . . . . . . . . . . . . . . . . . . . . . . . 4
Introduction . . . . . . . . . . . . . . . . . . . . . . . . . . . . . . 6
The U.S. Sod Market . . . . . . . . . . . . . . . . . . . . . . . . . . . 6Supply . . . . . . . . . . . . . . . . . . . . . . . . . . . . . . 6Demand . . . . . . . . . . . . . . . . . . . . . . . . . . . . . . 9
Industry Characteristics . . . . . . . . . . . . . . . . . . . . . . . . 9Farms with Sod . . . . . . . . . . . . . . . . . . . . . . . . . . 9Income Diversification on Farms with Sod . . . . . . . . . . . . . 10
Cultivation and Management Practices . . . . . . . . . . . . . . . . . . 10Land Preparation . . . . . . . . . . . . . . . . . . . . . . . . . 10Planting . . . . . . . . . . . . . . . . . . . . . . . . . . . . . 11Climate . . . . . . . . . . . . . . . . . . . . . . . . . . . . . . 11Soil and Air Requirements . . . . . . . . . . . . . . . . . . . . . 11Grass Species . . . . . . . . . . . . . . . . . . . . . . . . . . . 13Fertilization . . . . . . . . . . . . . . . . . . . . . . . . . . . 13Water Management . . . . . . . . . . . . . . . . . . . . . . . . . 13Mowing . . . . . . . . . . . . . . . . . . . . . . . . . . . . . . 19Labor Requirements . . . . . . . . . . . . . . . . . . . . . . . . 19Plastic Netting . . . . . . . . . . . . . . . . . . . . . . . . . . 19
Harvesting . . . . . . . . . . . . . . . . . . . . . . . . . . . . . . . 20
Transporting . . . . . . . . . . . . . . . . . . . . . . . . . . . . . . 21
Marketing . . . . . . . . . . . . . . . . . . . . . . . . . . . . . . . . 21
Costs of Production . . . . . . . . . . . . . . . . . . . . . . . . . . . 23
Production Perils . . . . . . . . . . . . . . . . . . . . . . . . . . . . 23Excessive Moisture . . . . . . . . . . . . . . . . . . . . . . . . 23Excessive Heat and Dry Winds . . . . . . . . . . . . . . . . . . . 25Drought . . . . . . . . . . . . . . . . . . . . . . . . . . . . . . 25Prolonged Flooding . . . . . . . . . . . . . . . . . . . . . . . . 25Frosts, Hard Freezes, and Ice Storms . . . . . . . . . . . . . . . 25Excessive Fertilization . . . . . . . . . . . . . . . . . . . . . . 25Thatch . . . . . . . . . . . . . . . . . . . . . . . . . . . . . . 26High Salinity . . . . . . . . . . . . . . . . . . . . . . . . . . . 26Diseases . . . . . . . . . . . . . . . . . . . . . . . . . . . . . 26Insects . . . . . . . . . . . . . . . . . . . . . . . . . . . . . . 29Weeds . . . . . . . . . . . . . . . . . . . . . . . . . . . . . . . 31
Regional/State Analysis . . . . . . . . . . . . . . . . . . . . . . . . . 32New Jersey . . . . . . . . . . . . . . . . . . . . . . . . . . . . 32Minnesota . . . . . . . . . . . . . . . . . . . . . . . . . . . . . 33Illinois . . . . . . . . . . . . . . . . . . . . . . . . . . . . . 37

Florida . . . . . . . . . . . . . . . . . . . . . . . . . . . . . . 39Maryland . . . . . . . . . . . . . . . . . . . . . . . . . . . . . 42Alabama . . . . . . . . . . . . . . . . . . . . . . . . . . . . . . 43Texas . . . . . . . . . . . . . . . . . . . . . . . . . . . . . . . 45California . . . . . . . . . . . . . . . . . . . . . . . . . . . . 48
Ad Hoc Disaster Assistance for Turfgrass Sod . . . . . . . . . . . . . . 50
Turfgrass Sod Insurance Implementation Issues . . . . . . . . . . . . . . 52Adverse Selection . . . . . . . . . . . . . . . . . . . . . . . . . 52Setting Reference Prices . . . . . . . . . . . . . . . . . . . . . 52Estimating Production History . . . . . . . . . . . . . . . . . . . 53Estimating "Appraised Production" . . . . . . . . . . . . . . . . . 53Market Prices and Moral Hazard . . . . . . . . . . . . . . . . . . 53Availability of Individual Yield Data . . . . . . . . . . . . . . . 54Demand for Insurance . . . . . . . . . . . . . . . . . . . . . . . 54Defining "Areas" for the Non-Insured Assistance Program . . . . . . 55
References . . . . . . . . . . . . . . . . . . . . . . . . . . . . . . . 57

Executive Summary
The Census reported 218,161 harvested acres of U.S. sod production in 1992, up19 percent from the prior census year, 1987. The five leading sod-producingstates in 1992, ranked by acreage, were Florida, Texas, Alabama, Minnesota,and Georgia. These states represent about half of the total U.S. sod acreage.The most common turfgrass species grown in the U.S. include bermudagrass,bluegrass, centipedegrass, fine fescue, Kentucky bluegrass, ryegrass, St.Augustinegrass, tall fescue, and zoysiagrass.
The housing industry is the primary market for turfgrass sod, and the greatestdemand is in metropolitan areas. Other major markets include land developers,golf courses, parks, cemeteries, athletic fields, and schools. Virtually allsod is produced domestically because climatic conditions need to be similar inproducing and consuming areas. The average trucking distance from shippingpoint to landscape site is about 150 to 180 miles. Climatic conditionsgenerally do not change significantly within this radius.
Sod is classified into two general categories: cool-season grasses (such asbluegrass and tall fescue) and warm-season grass (including bermudagrass andzoysiagrass). Cool-season grasses grow best in the northern parts of theU.S., as well as in areas with higher elevations and coastal regions whereevening summer temperatures are in the 50- and 60- degree Fahrenheit range.Warm-season grasses are usually grown from lower Florida and along the GulfCoast northwards, throughout the upper South.
Sod can be established either by vegetative propagation or direct seeding. Ingeneral, warm-season grasses are established with vegetative propagation usingsprigs or plugs, while cool-season grasses are direct seeded. Sod may beproduced in blends or mixtures of two or more grasses, particularly for thosespecies established through seeding. Each type of grass responds differentlyto various stresses, and when blended or mixed, the more tolerant grass willdominate, increasing overall turf performance.
Generally, grass seed germinates best when soil temperatures are 50o F orless. Root development from sprigs requires higher temperatures. Growersirrigate and fertilize to promote rapid production of quality sod and toprotect against stand failure. Mowing is used to control weeds, remove excessgrowth, improve root growth, and promote lateral growth of the turfgrass. Infrequent mowing can cause the stand to become thin and aestheticallyunacceptable. It can also result in increased frequency of losses due todisease.
Marketable sod is typically produced in 6 to 24 months. Sod is ready forharvest when it has both green leaves and an actively growing root system. The actual growing period depends on soil type, moisture, temperature, grassspecies, fertilization, and other cultivation practices.
Sod is harvested on demand and is cut only to meet a particular days' orders. During periods of low prices, many sod growers put their fields under lowmaintenance for several years. By using this method, they hope to sell at

higher prices at a later time, rather than harvesting the sod at a loss orabandoning their fields.
Sod is cut with 1/2- to 5/8-inch of soil attached. This thinness allows foreasier handling, permits more rapid establishment, and requires less expensein transportation costs than if cut thicker. If cut much thinner, it will bedifficult to retain enough moisture to keep the sod fresh until installation.
The two basic techniques for sod harvesting are the ribbon-cut method and theclean-cut method. The application of a particular method depends on the typeof grass. Ribbon cutting is normally used for all warm-season grasses and isused to re-establish turf. When ribbon cutting is used, 1- to 2-inch-wideundisturbed turf ribbons or strips are left in the field between the harvestedstrips. Clear cutting, on the other hand, does not leave ribbons or surfacevegetation and is normally used on cool-season grasses which are re-seededafter harvest.
Major production perils include drought, excess heat, and excess moisture. Although many sod growers irrigate, prolonged dry conditions may cause pondsand streams, a major source of water, to dry up. While many insects anddiseases may affect turfgrass sod, the problems they create can generally becontrolled through management practices.
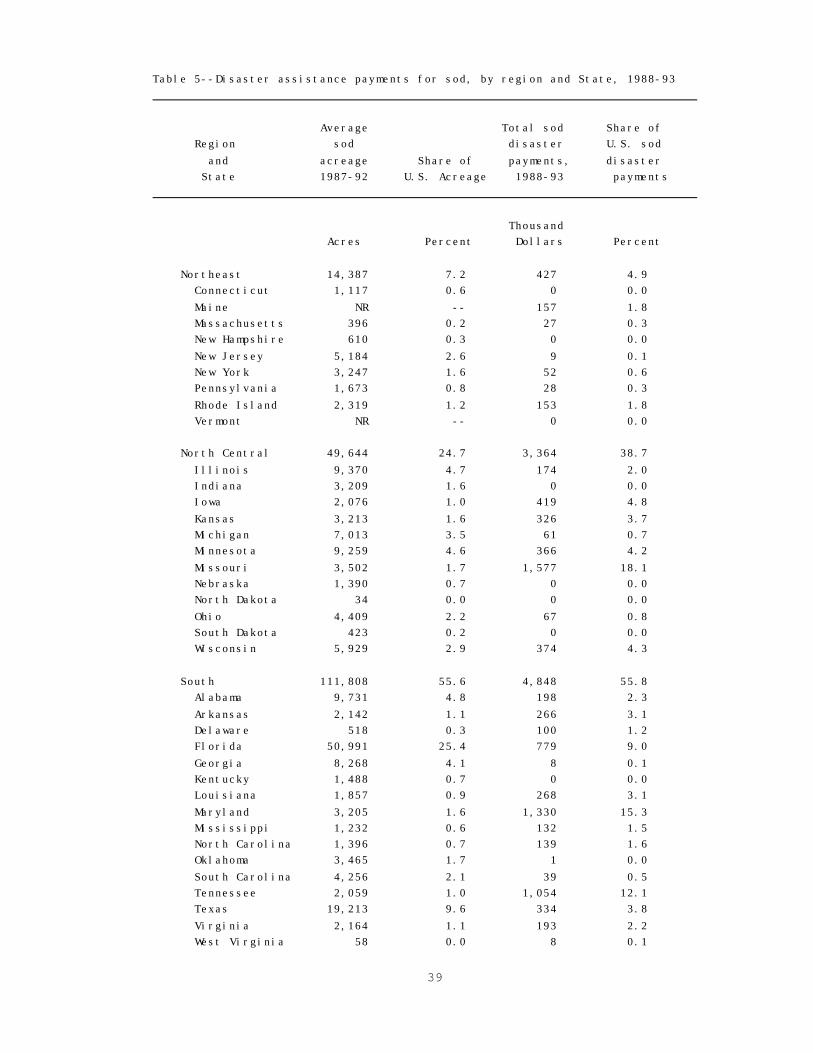
Disaster payment data indicate which sod-growing areas received large paymentsrelative to their acreage. For example, Missouri's share of U.S. sod acreagein recent years, at about 2 percent, was far less than their share of ad hocdisaster payments, at 18 percent. Similar situations are apparent in analysisof Maryland and Tennessee data. In contrast, Florida, Texas, and Alabamacollected a smaller share of ad hoc payments relative to their acreage.
Our assessment is that, although there would likely be moderate interest amongturfgrass producers in buying insurance for sod, participation is likely to belower than for most crops. One reason for lower interest among sod growers isthat most sod is irrigated. Production losses from erosion and flooding werealso cited as occasional production perils. The acreage subject to lossesfrom flooding, however, is likely to be quite small.
On a regional basis, we judge that participation in a sod insurance programwould be greatest in the North Central states. The basis for this judgementis the large amount of ad hoc disaster assistance payments for sod reportedfor this region over the 1988-93 period. Most of the losses were caused bydrought and floods. In addition, the largest amount of non-irrigated sod islocated in the North Central region.

6
Turfgrass Sod Contacts
Turfgrass Producers International:
Douglas H. FenderExecutive DirectorTurfgrass Producers International1855-A Hicks RoadRolling Meadows, IL 60008
(708) 705-9898 (800) 405-8873
New Jersey:
Dr. J. A. MurphyTurfgrass Management Extension SpecialistNew Jersey Cooperative Extension ServiceRutgers University(908) 932-9453
Dr. Henry IndykEx-Secretary (retired)Cultivated Sod Association of New Jersey(908) 247-8026 (Home)
Minnesota:
Dr. B. PetersonTurfgrass SpecialistSouthern Experiment StationUniversity of Minnesota(612) 624-7407 St. Paul Campus(507) 835-3620 Experiment Station Office
Kurt KlintExecutive DirectorMinnesota Turf Association(612) 755-4244
John HogdalSod Grower(612) 434-6828
Illinois:
Dr. T. B. VoigtTurfgrass SpecialistDepartment of HorticultureUniversity of Illinois
(217) 333-7847

7
Dr. H. T. WilkinsonTurfgrass SpecialistUniversity of Illinois(217) 333-8707
Maryland:
Dr. T. B. TurnerProfessor, Turfgrass ManagementDepartment of AgronomyUniversity of Maryland(301) 405-1306
Malcolm SarnaTurf and Seed SectionMaryland Department of Agriculture50 Harry S. Truman ParkwayAnnapolis, MD 21401(410) 841-5960
Texas:
Dr. R. L. DubleTurfgrass SpecialistTexas Agricultural Extension ServiceTexas A&M University(409) 845-3041
Florida:
Alan HodgesFood and Resource Economics DepartmentUniversity of FloridaP.O. Box 110240Gainesville, FL 32611(904) 392-5072
Dr. John CisarTurfgrass SpecialistFlorida Agricultural Extension StationUniversity of Florida(305) 475-8990
Bob YountExecutive DirectorFlorida Turfgrass Association(407) 898-6721

8
California:
Dr. V. A. GibeaultTurfgrass SpecialistCooperative Extension ServiceUniversity of California--Riverside
(909) 787-3575
Dr. Stephen T. CockerhamTurfgrass SpecialistCooperative Extension ServiceUniversity of California--Riverside(909) 787-5906
Yurgin GramckowOwner--Southland Sod CompanyPresident, California Sod Producers Association(805) 488-3585
Alabama
Dr. Colemand Y. WardTurf SpecialistExtension DivisionAuburn University(334) 844-5479

9
Turfgrass Sod: An Economic Assessment of the Feasibilityof Providing Multiple-Peril Crop Insurance
Introduction
Sod is a horticultural commodity intensively cultivated in most parts of theUnited States, primarily for its ornamental and environmental qualities. Sodconsists of perennial grass plants, soils, and microorganisms. Instant maturelawns can be achieved through the installation of turfgrass sod.
Numerous grass species may be grown as sod. Sod, like other agriculturalcommodities, is susceptible to production losses due to extremes of wind,moisture, and temperature throughout the production, harvesting, and marketingstages.
This report examines those aspects of the U.S. turfgrass sod industry thatrelate to the demand for crop insurance and the feasibility of developing acrop insurance policy for sod.
The U.S. Sod Market
Supply
The Census reported 218,161 harvested acres of U.S. sod production in 1992, up19 percent from the prior census year, 1987 (Table 1). Sod production isincreasing more rapidly in the South and West than in the northern states. The South had both the largest number of farms growing sod and the largestvolume of sales in 1992.
Growers' sod sales in the southern region amounted to nearly $207 million in1992. The South accounted for about 44 percent of U.S. total sod sales inthat year, up from 40 percent in 1987. Sales in the northeast region, incontrast, fell to 8 percent of the U.S. total, down from 13 percent in 1987. The north central region's share of U.S. sod sales held steady between 1987and 1992, at about 19 percent. The share held by the western region fellslightly.
The five leading sod-producing states in 1992, ranked by their acreage, wereFlorida, Texas, Alabama, Minnesota, and Georgia. These states represent abouthalf of the total U.S. sod acreage. Florida accounted for nearly a quarter ofthe nation's sod acreage. California ranked seventh in terms of acreage, buthad the largest volume of sales, amounting to $79.4 million.
Sod supplies are typically abundant from May through October, corresponding tothe harvest peak. Sod is not frequently harvested in the remaining months,with the exception of April, when about 9.5 percent of the year's sod suppliesare generally harvested (1993 ASPA Membership Profile Survey).

10
Table 1--Sod harvested: Farms, acreage, and sales, by region and State, 1992 and 1987 1992 1987 Region Area under Acreage Area under Acreageand Farms glass or other in the Sales Farms glass or other in the SalesState protection open protection open
Number Square feet Acres $1,000 Number Square feet Acres $1,000
Northeast: 124 (X) 12,415 36,065 118 (X) 16,359 51,010 Connecticut 9 (X) 931 2,229 13 (X) 1,303 6,116 Maine 3 (X) (D) (D) 1 (X) (NA) (NA) Massachusetts 8 (X) 475 855 3 (X) (D) (D) New Hampshire 4 (X) 276 1,035 4 (X) 944 2,850 New Jersey 41 (X) 3,998 11,605 41 (X) 6,370 16,582 New York 19 (X) 2,533 10,745 18 (X) 3,961 14,255 Pennsylvania 23 (X) 2,036 4,089 19 (X) 1,309 3,303 Rhode Island 15 (X) 2,166 5,507 18 (X) 2,472 7,904 Vermont 2 (X) (D) (D) 1 (X) (NA) (NA)
North Central: 505 (X) 54,720 90,918 457 (X) 44,568 77,401 Illinois 46 (X) 9,320 21,286 46 (X) 9,420 20,223 Indiana 27 (X) 3,445 6,810 27 (X) 2,973 6,461 Iowa 35 (X) 2,399 5,033 34 (X) 1,753 2,498 Kansas 38 (X) 3,705 5,045 26 (X) 2,721 5,344 Michigan 66 (X) 7,072 10,607 64 (X) 6,954 9,736

11
Minnesota 90 (X) 10,566 12,317 79 (X) 7,951 9,483 Missouri 47 (X) 4,121 6,184 41 (X) 2,883 4,624 Nebraska 26 (X) 1,523 2,647 28 (X) 1,257 1,977 North Dakota 4 (X) 41 91 1 (X) (NA) (NA) Ohio 48 (X) 4,859 7,612 39 (X) 3,959 9,143 South Dakota 7 (X) 508 937 3 (X) (D) (D) Wisconsin 71 (X) 7,161 12,349 69 (X) 4,697 7,912
South: 757 (X) 124,370 206,623 627 (X) 99,246 155,172 Alabama 82 (X) 11,967 17,835 59 (X) 7,494 17,480 Arkansas 36 (X) 2,408 4,102 30 (X) 1,875 3,399 Delaware 9 (X) 621 1,177 1 (X) (D) (D) Florida 154 (X) 52,030 64,215 137 (X) 49,952 72,037 Georgia 53 (X) 10,510 34,643 29 (X) 6,026 12,227 Kentucky 34 (X) 1,942 3,287 24 (X) 1,033 925 Louisiana 15 (X) 1,491 2,379 17 (X) 2,223 3,398 Maryland 30 (X) 3,171 6,674 42 (X) 3,239 5,753 Mississippi 35 (X) 1,585 2,186 24 (X) 878 1,433 North Carolina 25 (X) 1,711 5,987 20 (X) 1,080 3,575 Oklahoma 47 (X) 3,531 6,720 45 (X) 3,398 4,220 South Carolina 28 (X) 6,056 8,718 14 (X) 2,455 4,330 Tennessee 26 (X) 3,304 5,424 13 (X) 814 1,630 Texas 156 (X) 21,515 37,757 156 (X) 16,911 20,678 Virginia 23 (X) 2,459 5,519 14 (X) 1,868 4,087 West Virginia 4 (X) 69 (D) 2 (X) (NA) (NA)
West: 228 (X) 25,580 136,601 223 (X) 23,030 106,207

12
Alaska (X) (X) (X) (X) (X) (X) (X) (X) Arizona 7 (X) 1,621 6,505 6 (X) 1,393 8,875 California 62 (X) 8,420 79,357 56 (X) 7,205 60,281 Colorado 36 (X) 4,861 13,517 41 (X) 4,720 11,044 Hawaii 12 (X) 69 862 6 (X) (D) 450 Idaho 13 (X) 1,185 3,411 14 (X) 912 2,070 Montana 7 (X) 369 1,249 7 (X) 288 774 Nevada 10 (X) 832 3,450 6 (X) 480 1,346 New Mexico 9 (X) 1,278 3,909 11 (X) 1,383 4,385 Oregon 7 (X) 1,522 3,932 9 (X) 1,630 2,975 Utah 34 (X) 2,731 8,007 31 (X) 3,073 6,329 Washington 24 (X) 2,457 11,912 27 (X) 1,736 7,240 Wyoming 7 (X) 235 490 9 (X) 210 438
United States 1,614 (X) 218,161 471,640 1,427 (X) 184,070 391,635 (D) = Data are not published to avoid disclosure, but are included in U.S. totals.(X) = Not applicable.(NA) = Not available.
Source: 1992 Census of Agriculture.

1 The statistical description of industry structure is based on aspecial tabulation of Census farms growing sod in 1987. No comparabletabulation for farms with sod in 1992 has been completed at the time thisreport was prepared.
13
Virtually all sod is produced domestically because climatic conditions need tobe similar in producing and consuming areas. The average trucking distancefrom shipping point to landscape site is approximately 150 to 180 miles(Beard). Climatic conditions generally do not change significantly withinthis radius.
Demand
Turfgrass as a ground cover used in the landscaping of metropolitan areas,housing developments, churches, schools, parks, cemeteries, golf courses, andathletic fields. It has gained popularity because people appreciate opengreen space. It aids in cooling and erosion control, and in the filtering ofgroundwater recharge in open areas (Rogers).
Turfgrass sod has become a popular method of groundcover establishment becauseit provides an instant mature lawn. A professional sod lawn needs no specialcare because it is a healthy mature lawn when installed. In contrast, asprigged or seeded lawn requires several years of nurturing to reach maturity(ASPA). Lawns established with turfgrass sod are more effective incontrolling runoff than lawns established from seed, even after three years(Watschke).
The housing industry is the primary market for turfgrass sod, and the greatestdemand is in metropolitan areas (ISU Cooperative Extension Service). Othermarkets include land developers, golf courses, parks, cemeteries, athleticfields, and schools.
Industry Characteristics 1
Farms with Sod
The U.S. sod industry consists of a large number of medium- and small-sizeoperations, although the largest volume of production comes from large farms. In 1987, fifty-one percent of the farms growing sod had sales of $499,999 orless (Appendix table 1a). However, 72 percent of all sod sales were reportedby farms with sales of $500,000 or more (Appendix table 2). These farmsaccounted for only 16 percent of farms growing sod.
Most farms growing sod obtain their gross cash farm income from crop sales. Crop sales accounted for about 95 percent of U.S. gross cash income on farmswith sod in 1987. Of that gross income total, more than 60 percent came fromthe sale of sod (Appendix table 2). In general, livestock income is fairlyunimportant on farms with sod.

14
Farms in the Northeast and North Central states received a slightly largerpercentage of their farm income from sod than producers in the South and West. Because of greater specialization, growers in the Northeast and North Centralstates may have more interest in crop insurance for sod as a risk managementtool than growers in the South and West.
A significant proportion of farms with sod are individually- or family-ownedoperations, with 55 percent of farms growing sod in that category in 1987(Appendix table 3a). Corporate farming accounted for 27 percent of the sodoperations, while partnerships accounted for 12 percent.
Income Diversification on Farms with Sod
Sixty-seven percent of the operators growing sod identified farming as theirmain occupation in 1987 (Appendix table 4). However, about 45 percent of allsod farms, and 50 percent of small- and medium-size farms (those with lessthan $500,000 in sales), supplemented their income with off-farm employment.
In 1987, about 45 percent of all farms growing sod had operators who indicatedthat they worked off the farm at least one day during the year, and 33 percenthad operators who worked off the farm for 100 days or more (Appendix table 4). Sixty-eight percent of the farms with less than $25,000 in sales had operatorswho worked off the farm at least one day during the year, and 55 percent hadoperators who worked off the farm 100 days or more. For a number of thesesmaller producers, growing sod may be a part-time or sideline enterprise thatsupplements their off-farm income.
Other agricultural enterprises also provide income diversification for sodgrowers. Of the $638.3 million in gross cash farm income reported by the 1987Census for farms producing sod, 62 percent was from sod sales, 34 percent wasfrom other crop sales, and 4 percent from livestock sales.
The extent of farm income diversification varies by region, however. Sodsales accounted for about 92 and 85 percent of total farm sales on farms withsod in the Northeast and North Central regions, but only 53 and 55 percent inthe South and West (Appendix table 2).
Cultivation and Management Practices
Land Preparation
Careful land preparation is necessary to ensure uniform thickness and qualityof the sod at harvest. Land preparation may entail rock removal, leveling,plowing, fumigating, and other operations to assure a smooth seed bed free ofinsects and diseases. Surface irregularities prevent harvesting blades fromcutting the sod into pieces of uniform thickness. Low spots can cause holesin the sod pad, rendering it unsalable. In addition, the elimination of lowand high spots can improve surface drainage (Cockerham).

15
Planting
Sod can be established either by vegetative propagation or direct seeding. Ingeneral, warm-season grasses are established with vegetative propagation usingsprigs or plugs, while cool-season grasses are direct seeded. There are someexceptions, however. For example, some Kentucky bluegrass varieties (a cool-season grass) are planted vegetatively because they are poor seed producers(Cockerham).
Sprigs are stolon or rhizome segments that are about 2 to 4 inches in length.They are spread in the fields by sprigging machines or manure spreaders at arate of 250 to 450 bushels per acre. Generally, one bushel of sprigs (as wellas plugs) can be obtained from 1 square yard of sod (White, et. al.).
Plugs are sections of harvested sod that are cut into pieces of approximately2 to 4 square inches. They are planted in prepared seed beds on 6- to 8-inchcenters. Plugs are planted by hand or machine, using 300 to 450 square yardsper acre. The field may be rolled after establishment (following eithersprig- or plug- planting) to improve soil contact with the roots (White, et.al.).
Sod may be produced in blends or mixtures of two or more grasses, particularlyfor those species established through seeding. Each type of grass respondsdifferently to various stresses, and when blended or mixed, the more tolerantgrass will dominate, increasing overall turf performance. A blend is thecombination of two or more grasses of the same species, while a mixture is acombination of two or more different species.
Climate
Cool-season grasses grow best in the northern parts of the United States, aswell as in areas with higher elevations and coastal regions where eveningsummer temperatures are in the 50- and 60- degree Fahrenheit range (Beard). The cool-season zone (Zone A) is shown in Figure 2. Warm-season grasses areusually grown from lower Florida and along the Gulf Coast northwards,throughout the upper South (Zone C).
There is also a transition zone (Zone B), where both cool-season and warm-season grasses are grown. This zone presents real challenges for turfgrassgrowth because summer temperatures are generally too high for cool-seasongrasses and winter temperatures too low for warm-season grasses (Beard). Thiszone covers the lower elevations of Virginia and North Carolina, west throughWest Virginia, Kentucky, Tennessee, and Arkansas, as well as southern Ohio,Indiana, Illinois, Missouri, and Kansas.
Soil and Air Requirements
Generally, grass seed germinates best when soil temperatures are 50o F orless. Root development from sprigs requires higher temperatures. Air

16
temperatures must remain at or above freezing to prevent injury to the grassseedlings once they have germinated.
Good-quality sod can be produced on both muck and mineral soils. Because mucksoils are lighter in weight than organic soils, muck sod has a transportationcost advantage over mineral-soil sod. In addition, muck soils are naturallyhigh in nitrogen, which promotes growth of grasses. Except in south Florida,however, very few sod markets are located near muck soil areas.
Clay soils are less desirable for sod production than sandy and loam soils.Clay soils do not drain well and they remain wet for long periods, causingdifficulty in soil preparation, mowing, and other maintenance activities. Wetground also can delay harvesting because equipment cannot be brought into thefield. Excessive moisture in the soil increases the weight of the sod andincreases hauling expenses (Cockerham).
Grass Species
The most common turfgrass sod species grown in the U.S. are bermudagrass,bluegrass, centipedegrass, fine fescue, Kentucky bluegrass, ryegrass, St.Augustinegrass, tall fescue, and zoysiagrass. Table 2 summarizes thecharacteristics of these grass species.
Fertilization
The ability of sod to "knit together" depends primarily on the development ofits roots and rhizomes. Fertilization is critical to achieving a balancebetween shoot growth and root development (ISU Cooperative Extension Service). Excessive nitrogen at planting retards root development, while nitrogenapplied just prior to harvest may cause burning and death of the blades duringtransport. Too much nitrogen promotes excessive shoot growth, increasesmowing costs, and makes the grass more susceptible to diseases and stress(White, et. al.). Excessive nitrogen rates may also retard root developmentof the transplanted sod (Duble).
Water Management
Producers irrigate to promote rapid production of quality sod and to protectagainst stand failure. The best time to irrigate sod is before sunrise, sothat there will be minimum wind disturbance and evaporation losses. Eveningapplications may promote the development of diseases, as the grass remains wetthroughout the night. Daytime applications interfere with other culturalpractices, and may result in an uneven water distribution due to winds (White,et. al.).
The intensity of irrigation is important. Light and frequent applications ofwater promote shallow rooting. Shallow-rooted grass is susceptible to droughtand cold injury, both of which can cause significant yield losses (Duble).

17
Finally, sod should be irrigated several days prior to harvest so that itreaches its destination in good condition.

18
Table 2--Characteristics of selected grass species
Species Type Adaptation
TemperatureTolerance Drought
Resistance ShadeAdaptation
Other Characteristics and Limitations
Bermudagrass
Warm-season
Grows best inhot, dry,tropicalclimates.
Excellentperformance upto 110o F; hasa winterdormancyperiod; turnstan to brown attemperaturesbelow 55oF;poor coldhardiness.
Highly droughtresistant; cango into summerdormancy whenirrigation iswithheld; willgreen up againafter moisturesupply isreturned.
Requires fullsun for most ofthe day.
Dense and low growingrhizomes and stolons;some varieties toleratevery low maintenance;tolerates alkaline andslightly acidic soils;has good salt tolerance;Some varieties haveresistance to diseasessuch as Helminthosporiumsand rusts; insects aremore likely to be aproblem than diseases;some varieties areresistant to bermudagrassmite.
Bluegrass Cool-season
Grows best incool, humid,temperateregions.
Tolerates verycold winterweather;undergoesstress duringextremely hotweather.
Can go intosummer dormancywhen irrigationis withheld;will green upagain with thereturn ofmoisture.
Moderatelytolerant topartial shade;thrives insunny areas.
Recovers quickly fromoccasional abuse;performs best in fertile,non-acid soils with gooddrainage; fair toleranceto saline soils; newvarieties have improvedresistance to diseasessuch as leaf spot,stripe, smut, blight,summer patch and rust.

19
Table 2--Characteristics of selected grass species
Species Type Adaptation
Temperature Tolerance Drought
ResistanceShade
Adaptation
Other Characteristics and Limitations
Centipede-grass
Warm-season
Grows whererainfall ishigh andsummers arewarm and humid.
Grows well infull sun; verytolerant ofhightemperatures,but sensitiveto lowtemperatures;goes dormantthrough wintermonths.
Sensitive todrought but hasa rapid recoveryrate.
Moderate togood shadetolerance.
Slow growth pattern;recovers slowly fromdamage; deep root system;well adapted toinfertile, sandy, well-drained soil; aggressiveenough to competestrongly with weeds;resistant to chinch bugs,St. Augustine decline,and brown patch.
FineFescue
Cool-season
Adapted to coolsummers andhigh altitudesand can do wellin cold andarid climates.
Tolerates hotand coldweather well;has good winterhardiness; canbe used inareas that aresubject to widetemperaturefluctuations.
Very gooddroughttolerance; cango dormant insummer whenirrigation iswithheld.
Best cool-season grassfor dry, shadylawns but alsoneeds some sun.
Does not recover wellfrom severe injury;tolerates acid soils well(within range of pH 5.0-6.5); most varieties havegood resistance to manyturfgrass diseases; mixedwith other grasses, itadds disease resistanceto the turf; occasionalsusceptibility to summerdiseases in hot climates,especially in moist,fertile soil; grows wellin dry soils.

20
Table 2--Characteristics of selected grass species
Species Type
AdaptationTemperatureTolerance Drought
ResistanceShade
Adaptation
Other Characteristics andLimitations
KentuckyBluegrass
Cool-season
Widely adaptedin cool, humid,semi-arid andtemperateregions.
Will toleratevery coldwinters;undergoesstress duringextremely hotweather, butwill maintaingood color andappearance ifproperlywatered andmanaged.
Medium toleranceto drought.
Thrives insunny areas;fair to poorshadetolerance; afew varietiesare moderatelyadapted topartial shade.
Forms strong sod viarhizomes; recoversquickly from occasionalabuse; grows well infertile, non-acid soilswith good drainage; newvarieties have improvedresistance to diseasessuch as leafspot, stripesmut, powdery mildew,dollar spot, Typhulablight, summer patch, andrust.
Ryegrass Cool-season
Adapts well inregions withmild wintersand cool, moistsummers.
Most vigorouswhen cool andmoist.
Good droughttolerance.
Moderate. Compatible in mixes withbluegrass and fine fescueto make a hardier turf;highly adaptable to awide range of soils, fromlight and sandy to heavyand clayey; most newvarieties have goodresistance to brownpatch, leaf spot, stemand crown rust; used inwarm climates incombination withbluegrass to reduce thespread of major summerdiseases.

21

22
Table 2--Characteristics of selected grass species
Species Type Adaptation
TemperatureTolerance Drought
ResistanceShade
Adaptation
Other Characteristics andLimitations
TallFescue
Cool-season
Very welladapted to coldwinters andwarm summers.
Grows well in awide range oftemperatures.
Very good;extensive rootsystem protectsagainst drought.
Prefers fullsun.
Adapts to a wide range ofsoil types; goodtolerance to saline saltconditions; very trouble-free sod--very highdisease resistance,especially to brownpatch, leaf spot, andcrown rust; not generallyvulnerable to insectpests.
Zoysiagrass
Warm-season
Adapts to hot,humid, andtropicalclimates.
Tolerates heatexceptionallywell up to 100o
F; subject towinter dormancyat temperaturesbelow 55o F.
Moderate togood--resistsshort periods ofdrought; can gointo summerdormancy whenirrigation iswithheld.
Slow growing inpartial shade.
Spreads by stolons andrhizomes; shoot growthrate is slow; has bestwear resistance of anygrass; tolerates highsalinity and infertilesoil well; some varietieshave good resistance todiseases such as rust andleaf spot, and tobillbugs; dense turfprevents weeds fromappearing.

23
Table 2--Characteristics of selected grass species
Species Type Adaptation
TemperatureTolerance Drought
ResistanceShade Adaptation
Other Characteristics andLimitations
Bahiagrass Warm-season
Adapts to hot,humid, andtropicalclimates.
Very tolerantof hightemperatures.
Sensitive todrought.
Sensitive toshade.
--
CreepingBentgrass
Cool-season
Grows best incool, humid,and temperateregions.
Tolerates verycold winterweather;undergoesstress duringextremely hotweather.
Poor to gooddroughttolerance.
Tolerant ofshade.
spreads by stolons; highsalinity tolerance; somevarieties have resistanceto insect pests.
St.Augustine-grass
Warm-season
Well adapted tocoastal regionswith hot,tropicalclimates.
Adjusts well totemperatures upto 105o F; verypoor low-temperaturehardiness.
Excellent tofair; can gointo summerdormancy whenirrigation iswithheld.
Wide range ofshadeadaptation.
Creeping growth habit viastolons; thrives on wetsites; prefers neutral toalkaline soils; excellentsaline salt tolerance;some varieties resistantto chinch bugs and St.Augustine decline (SAD)virus.

24
Mowing
Sod growers mow their fields to control weeds, remove excess growth, improveroot growth, and promote lateral growth of the turfgrass. Infrequent mowingcan cause the stand to become thin and aesthetically unacceptable. It canalso result in increased frequency of losses due to disease.
Generally, about one-third of the leaf blade should be removed per mowing tomaintain good color and an even appearance to the turf surface (White, et.al.). Excessively low mowing, or scalping, weakens root growth, while mowingat a higher level encourages a healthy root system. However, mowing heights that are too high near harvest may cause the sod to heat after cutting, somowing heights should be decreased gradually during the weeks before harvest(ISU Cooperative Extension Service). This is also practiced to maintain abetter product appearance.
The following list shows the suggested mowing heights for different turfgrassspecies:
Bermudagrass 1/2 to 1 inchBluegrass 1 1/2 to 2 inchesCentipedegrass 1 to 2 inchesFine Fescue 1 to 2 1/2 inchesKentucky Bluegrass 1 1/2 to 2 inchesRyegrass 1 to 2 1/2 inchesSt. Augustinegrass 2 to 3 inchesTall Fescue 2 to 3 inchesZoysiagrass 3/4 to 1 1/2 inches
The use of mowing equipment on different species of turfgrass may cause fieldcontamination with off-types or unintended species of grasses. Clippings arealso collected because they can also contribute to field contamination.
Labor Requirements
Sod production is a labor-intensive process. While machines, such as the sodharvester, have been developed and adapted over the past few years, manuallabor is still required in rolling the cut sod, identifying damaged pieces,and gathering and loading the sod for transport.
Plastic Netting
Sod tensile strength is enhanced by cultural practices such as plastic nettingthat stimulate sod knitting. Plastic netting is typically used with cool-season grasses that do not produce rhizomes. It also can be used with somewarm-season grasses.
Netting allows the harvesting of much younger sod and cuts 25 percent or morefrom the time to crop maturity (Cockerham). Five Alabama sod growers reportedproducing a centipedegrass sod in as little as 8 months using netting over

25
seeded beds, versus an average of 12 to 15 months without netting. Growerswho use netting have an advantage because they can supply the early springmarket (White, et. al.).
HarvestingMarketable sod is typically produced in 6 to 24 months. Sod is ready forharvest when it has both green leaves and an actively growing root system. The actual growing period depends on soil type, moisture, temperature, grassspecies, fertilization, and other cultivation practices. As noted above,netting allows earlier harvesting by adding tensile strength.
Sod is harvested on demand and is cut only to meet a particular days' orders. When a sod harvester is used, harvesting requires that less soil be attachedto the roots than when sod is harvested by hand. Of course, it also requiresless hand labor to cut the sod.
Sod is cut with 1/2- to 5/8-inch of soil attached. This thinness allows foreasier handling, permits more rapid establishment, and requires less expensein transportation costs than if cut thicker. If cut much thinner, it will bedifficult to retain adequate moisture to keep the sod fresh until installation(Cockerham).
Sod harvesting involves order takers, dispatchers, a harvesting supervisor,production people, a harvesting crew, and truck drivers. The turf is groomedand irrigated to keep the soil moist enough for the sod harvester. Once thesod is moved out of the fields, the soil is immediately prepared for the nextplanting (Cockerham).
Sod harvesting machines have conveyors that carry the sod up to a rolling orfolding attachment. Part of a sod pad is being drawn up the conveyor beforethe rest of it is severed from the field. On hot days, the pallets of cut sodare hosed down every hour or so to prevent dehydration. In some cases, thesod may be hosed down again after loading on a trailer (Cockerham).
The two basic techniques for sod harvesting are the ribbon-cut method and theclean-cut method. The application of a particular method depends on the typeof grass. Ribbon cutting is normally used for all warm-season grasses and isused to re-establish turf (White, et. al.). Clear cutting, on the other hand,is normally used on cool-season grasses which are re-seeded after harvest(Peacock). However, there are also some exceptions. For example,bermudagrass, a warm-season grass, is normally clear cut (Peacock).
When ribbon cutting is used, 1- to 2-inch-wide undisturbed turf ribbons orstrips are left in the field between the harvested strips (White, et. al.). One problem with this method is that it compromises the uniformity and textureof the turfgrass. It also makes harvesting more difficult, and can reduceturf quality due to unevenness between the old and new growth (Haydu andCisar).

26
Clean cutting does not leave ribbons or surface vegetation. Re-establishmentis from intact rhizomes for grasses that grow rhizomes, and by seed for thosethat do not produce rhizomes (White, et. al.). This method usually results ina more uniform thatch or turf, easier harvesting, and more flexibility in thescheduling of production and harvesting activities. However, re-sodding aclear-cut field involves land preparation and sprigging costs that are unnecessary when the ribbon-cut method is used (Haydu and Cisar).
Harvested sod is arranged in overlapping layers so that the layers can be tiedtogether. If stacked improperly, sod can fall off the pallet during handlingand transport.
Transporting
Turfgrass sod is perishable and very heavy. It has a shelf life of only about36 hours, and heavy-duty equipment must be used for its transport (Cockerham). Sod heating within the pallet can reach lethal temperatures due to respiration(Peacock). Given these limitations, producing sod close to a market isimportant, particularly since shipping is expensive and sod can be damaged ifnot installed promptly.
The laws governing the weight each axle of a truck can carry over the roadvaries with each state. In most states, a three-axle tractor with a trailer40 feet long and a forklift can carry no more than 18 pallets with 500 squarefeet of sod each (Cockerham).
Marketing
Market outlets for sod in the U.S. include landscapers, landscape contractors,homeowners, nursery and garden centers, golf courses, cemeteries, airports,athletic departments, recreation or park facilities, and schools.
In a 1993 survey conducted by Turfgrass Producers International (TPI), 85percent of their farm membership sold sod at the wholesale level, while 15percent sold directly to retail markets (1993 ASPA Membership Profile Survey). Of these sales, about 80 percent were delivered and 20 percent were picked upin the fields by buyers. The majority of the sod that was delivered was notinstalled by the grower. It was estimated that their 650-plus farm membersrepresented 75 to 80 percent of U.S. sod acreage. Table 3 lists marketingoutlets for the American Sod Producers Association (ASPA) membership and thecorresponding shares of sod sales.
Marketing practices and characteristics vary across states and by firm size. In Florida, for example, very large operations have found it more economicaland less risky to hire independent shippers to distribute their sod. Smallerproducers, on the other hand, avoid head-to-head competition with the largefirms, and serve small landscape contractors and retail firms (Haydu andCisar).

27
Table 3--Percentage of sod sold by marketing outlet, 1988 and 1993 Customer-type 1988 1993
--------Percent--------
Landscape architects 1.7 0.8Landscape contractors 44.6 40.0Builders 12.0 9.0Land developers 2.6 2.0Homeowners 15.0 14.0Commercial building owners 2.2 ---Golf courses, parks, cemeteries 4.7 8.0Nursery/garden centers 7.9 12.0Sod brokers 7.1 6.0Government bid projects --- 4.0Other 2.0 4.0
Source: 1993 ASPA Membership Profile Survey.

28
California sod growers often sell to landscape contractors or sod installers,who then sell their services to consumers. Growers also commonly sell tonurseries. In both cases, the sod is ordered by the installer or the nursery,which has already sold it to the consumer. Direct retail outlets are alsoused, and may include do-it-yourself, custom-installed, or grower-installedgroups (Cockerham).
Evidence indicates that smaller operations rely more on field pick-up than dolarger operations. In Alabama, sod growers with 100 acres or less marketed 63percent of their sales by field pick-up. The remaining 37 percent of saleswere delivered to the point of sale. The larger operations sold 15 percent oftheir sod by field pick-up, while 85 percent was delivered to the point ofsale (White, et. al.).
Costs of Production
Moral hazard may arise if high harvesting costs and low market prices create asituation where receiving an indemnity is more profitable than selling at lowmarket prices. In general, sod harvesting costs account for less than 50percent of total production costs (Table 4). This may create a lesser moralhazard problem in developing an insurance policy than for certain othercommodities, such as fruits and vegetables, where harvesting costs are ahigher proportion of total production costs. Detailed cost of productionbudgets are presented in the appendix.
Marketable sod is continuously maintained in the field and harvested only whenthere is a purchase order ready. During periods of low prices, many sodgrowers put their fields under low maintenance for several years. By usingthis method, they are hoping to sell at higher prices, rather than harvestingthe sod at a loss or abandoning their fields. However, the viability of thesod decreases in delayed-harvest circumstances.
Production Perils
Major production perils cited in certain states include drought, excess heat,and excess moisture. Although many sod growers irrigate, prolonged dryconditions may cause ponds and streams, a major source of water, to dry up. While many insects and diseases may affect turfgrass sod, the problems theycreate can generally be controlled through management practices.
Excessive Moisture
Excess rain can cause wash-outs and gullies, and may promote weed invasionsthat take several years to eliminate (Beard). Excessive moisture can causeother problems. Because sod will not cut cleanly in very wet fields, and sodharvesters have difficulty tracking straight under such conditions, sod padswill not be uniform. Loaded forklifts and trucks tend to get stuck in wetfields and occasionally must be unloaded. Wet sod also causes problems forthe stackers, because of the weight and accumulation of mud on conveyors,

29
Table 4--Sod: Variable harvesting costs per acre, selected states 1
Variable Total Variable harvestState Output harvest cost 2 cost percent of total
Sq. yds/acre -------$/acre------- Percent
Alabama 4,000 743 2,505 30
California 4,840 1,840 4,482 41 Iowa 4,840 450 1,040 43
Texas 2,786 460 2,156 21
Florida 4,840 806 2,034 40 1 Costs may not be comparable among states because budgets may be for
different seasons and turfgrass species, and may not include the same costitems.
2 May include sales costs.
Note: For California, per-acre costs were estimated from a general budgetshowing sales of 110 acres of Elite tall fescue and Santa Ana hybridbermudagrass. For Iowa, all costs are variable. For Florida, per-acrecosts were estimated from total cash expenses of 46,000 acres of sod. Items included in Florida's variable harvesting costs were fuel,rentals, hourly wages, contract labor, and transportation.
Sources: White, et. al.; Cockerham; Iowa State University; Duble; Hodges, et.al.

30
rollers, and platforms. Also, extra-heavy sod reduces the number of pallets atruck can haul (Cockerham).
Excessive Heat and Dry Winds
High temperatures and drying winds can be a problem, especially during theharvest period. When the soil is dry and hard, sod harvesters are difficultto operate. The sod has little strength (if it can be cut at all), and theturf may be dead by the time it gets to the customer (Cockerham). Also, theneed for additional watering can interrupt harvesting.
During very warm and dry conditions, harvested sod that remains on the palletfor more than 36 hours will deteriorate very quickly. Pallets can be wateredwith sprinklers or with a hose and can be moved into the shade to help reducedrying. Exposed sod on the pallet will die if allowed to dry out (Cockerham).
Drought
The first symptom of drought stress is wilting of the grass blades, which mayroll or fold up lengthwise and turn bluish-green or slate gray. The blades ofdrought-stressed turf do not spring back after they have been compressed, sothat footprints make a long-lasting imprint (Smith).
During early stages of stress, the turf can recover with immediate irrigation. With prolonged drought, turf plants will die, and the density of the plantingwill decline. Seemingly minor drought stress can cause heavy waste losses atharvest, even weeks or months after the dry period occurs (Cockerham). Grassseedlings affected by drought may fail to establish.
Prolonged Flooding
Turfgrasses can usually withstand floods better than other plants. However,when submerged in water for an extended period, grass plants may die becausewaterlogged soils have very little oxygen available for root growth and rot-causing pathogens may become established.
Young seedlings are more sensitive to flooding than established plantings. Sod fields that have been recently seeded or sprigged may fail to establish. Grass seedlings are sensitive to drowning, and may die within hours, eventhree to four weeks after planting (Wilkinson).
Frosts, Hard Freezes, and Ice Storms
Frosts, hard freezes, and ice storms can cause similar damage to sod. Thesenatural perils injure newly planted seeds or sprigs of turfgrasses. They mayprevent seed germination, and stunt (or kill) young plants.
Excessive Fertilization
Fertilizer is applied to mature sod strictly to maintain or enhance color. There is a high risk of burning the turf both in the field and after harvest

31
when nitrogen is applied during the week before harvest. Ammonia and ureafertilizers can volatilize inside the sod rolls or folded pads, acting almostas fumigants and killing the grass. Nitrogen fertilizers also stimulatepathogens that can kill grass plants in the short time between harvest andinstallation. The risk decreases with lower temperatures, but is alwayspresent (Cockerham).
Thatch
Thatch is a layer of partially decomposed grass stems and roots, normally 1/4-to 1/2-inch thick, that accumulate over many years between the live grass andthe soil. Thatch may interfere with the flow of nutrients, water, and air tothe grass roots, harbor insects and plant diseases, and interfere with theaction of insecticides and fungicides.
Thatch builds up rapidly with the use of excessive fertilizer, the frequentuse of irrigation, and in conditions where the soil is too acidic. Sincethatch accumulates over many years, it becomes a particular problem when thesod is left unharvested for a number of years due to unfavorable marketconditions.
The best time to de-thatch is late spring for warm-season grasses and in the fall for cool-season grasses (Smith). Thatch is removed with a de-thatchingmachine, often called a verticutter, that has vertical rotating blades thatslice through the turf, cutting out the thatch.
High Salinity
Soil salinity is a frequent problem in arid climates. Irrigation can leachthe soil and correct problems with excessive soil salinity. The salts washout of the soil if the water has a lower salinity level than the soil(Cockerham). However, a field cannot profitably produce sod if the water ismore saline than the soil.
Alkali soils occur when sodium is present in very high concentration. Sodium-affected soils become so tight that water cannot move through. Althoughgypsum applications correct the condition, growers should not try to producesod on alkali soils (Cockerham).
Diseases
Most of the diseases attacking turfgrasses are caused by fungi. Fungi aresimple plants that prefer moist conditions, and are usually controlled bykeeping the plant leaves or the soil dry. However, frequent irrigation isnecessary for turf because of its shallow root system. In addition, grassblades are usually surrounded by humid air because they are packed so closelytogether and are close to the soil. Turfgrasses also have the capacity tostore nutrients, especially nitrogen, making the grass an inviting target forfungi.

32
Leaf Spot
Leaf spot is caused by several fungi. They cause the grass to turn brown andthin out in irregular patches that are 2 or more feet in diameter. Both thegreen and brown grass blades have small oval spots with straw-colored centersand dark maroon borders.
The most devastating leaf spot damage usually occurs in warm summers. It cankill the grass blades, spread to the base of the plant, and kill the entireplant. Turfgrasses that are rich in nitrogen, under stress from short mowing,and that receive frequent and light waterings are the most susceptible to leafspot attack. Fungicides and resistant varieties are available for control.
Rusts
Rusts are caused by a fungus of the Puccinia species, and occur most often onMerion Kentucky bluegrass, ryegrass, and zoysiagrass. Rusts are most activeduring moist, warm weather with temperatures between 70o F to 75o F, and inshady areas, but can be active all winter in mild areas. Moisture stress,nitrogen deficiency, and close mowing increase susceptibility to rust.
Grasses affected by rust turn light green or yellow, and the stand thins out. An orange powder coats the grass blades and rubs off easily, while reddish-brown lesions under the powder do not rub off. The orange powder is composedof millions of microscopic spores that spread easily in the wind. Turfgrassesseverely affected by rust are more likely to suffer winter damage. Fungicidesand the use of resistant varieties are control measures (Smith).
Leaf Smut
This disease is caused by the fungus Ustilago striiformis (or stripe smut) andUrocystis agropyri (or flag smut). Leaf smut is most prevalent on Kentuckybluegrass. It causes grass blades to turn pale green to yellow, with longyellowish streaks that later turn gray to black. Blades that curl, wither,and shred in thin strips from the tip downward are likely under the attack ofleaf smut. Spores causing this disease infect the plant's crown and adjoiningunderground stems. The fungus then grows throughout the plant's tissues.
The disease is most active in cool weather, with a temperature range of 50o Fto 60o F. The diseased plants then die during the next period of hot weather. Although difficult to eliminate completely, the severity of its infection canbe lessened by applying a fungicide, followed by thorough watering, so thatthe fungicide will reach the roots and can be absorbed into the plant. Also,resistant varieties are available (Smith).
Pythium Blight
This disease is also called grease spot or cottony blight. Turfgrasses mostsusceptible to their attack are those under stress from heat (85o F to 95o F)and that are grown in poorly-drained soils. Ryegrass is the most susceptibleturfgrass to pythium blight.

33
Pythium blight causes grass sections to wilt, shrivel, and turn light brown inirregular spots that are 1/2- to 4-inches in diameter. The spots can enlargerapidly, forming streaks that are 1 foot wide (or wider) and patches that are1- to 10-feet in diameter. Blades are often meshed together by white, cobweb-like threads in the early morning before the dew dries. Severely-infectedareas often never recover, and affected grass can die within 24 hours.
The fungal spores causing pythium blight spread easily in free-flowing wateror on the wheels of mowers. The disease is hard to control because it spreadsrapidly, killing large areas in hours. Fungicides are used to control thedisease as soon as it is noticed and during hot, humid weather. The avoidanceof over-watering during hot, humid weather is also a preventative measure(Smith).
Fusarium Blight
Fusarium blight is caused by several fungal organisms that are active duringthe summer at temperatures between 75o F and 100o F. It primarily attacksKentucky bluegrass. Fusarium blight causes crescent-shaped or streakedpatches of varying sizes to appear on the grass blades. They are first lightgreen and then turn straw-colored. Often the center patch remains green,resulting in a "frog-eye" pattern. The basal portions of dead stems dry outand turn brown or black.
Grasses that are under moisture stress, exposed to hot dry winds, or that arescalped by mowing are most susceptible to the disease. Although new grass mayfill the dead areas during cool weather in the fall, the disease may recur thefollowing year.
Fungicides containing benomyl or iprodione can be applied before the diseaserecurs the following year, followed by thorough watering. Resistant varietiesare also available (Smith).
St. Augustinegrass Decline
St. Augustinegrass decline is a viral disease that weakens St. Augustinegrassfor several years, yielding low-quality sod. The grass, however, can recoverfrom the damage, and it does not result in death of the sod (Duble).
Brown Patch
Brown patch is a disease caused by the fungus Rhizoctonia solani. It is oneof the most prevalent diseases attacking turfgrasses in warm and humid areaswith temperatures that range between 75o F and 85o F. The lush, tender growththat results from excessive nitrogen fertilization is the most susceptible toattack.
Symptoms of the disease include circular patches of dead grass that may be ofvarying diameters, and that are surrounded by dark-purplish smoky rings andfilmy-white tufts that cover the blades in the early morning before the dewdries. Sometimes, only the blades are affected, allowing the turf to recover.

34
However, when warm weather continues, the disease attacks the plant's crownsand kills the grass completely.
Fungicides are used to control brown patch. Keeping the turf as dry aspossible also can prevent spread of the disease (Smith).
Powdery Mildew
Powdery mildew, caused by the fungus Erysiphe graminis, is most prevalent whenthe nights are cool (in the 65o F to 70o F range) and damp, and the days arewarm and humid. Shady areas also favor development of powdery mildew. It ismost severe on Merion Kentucky bluegrass, but also attacks other varieties ofbluegrass, fescues, and bermudagrass.
Powdery mildew causes a whitish-gray mold to appear on the upper surfaces ofgrass blades during cool, rainy weather. The mold turns into powdery sporesthat spread easily in the wind, and grass plants can become infected in 2 to 4hours. Severely-infected plants wither and die. Benomyl can be used when thedisease is first detected (Smith).
Dollar Spot
Also known as small brown patch, the fungus that causes dollar spot is mostactive during warm (60o F to 85o F), moist days and cool nights, particularlyduring May to June, and September to October. The disease mainly attacksKentucky bluegrass and bermudagrass, and is easily spread by shoes, hoses,mowers, and other equipment.
Grasses under moisture- and nitrogen-deficiency stress are most susceptible todollar spot attack. The turf turns light brown to straw-colored, and covers acircular area ranging in size from a silver dollar to 6 inches in diameter. Although an infection seldom causes permanent damage, it may take severalweeks or months for the grass to recover. For control, fungicides may beapplied. Dollar spot is avoided if the turfgrass is kept as dry as possible,and proper nutrient levels are maintained (Smith).
Insects
Insects can damage turf growth, interfere with harvesting, and render the sodunmarketable. Insects are classified as subsurface feeding (those that feedon roots and rhizomes), surface feeding (those that cause damage to grassshoots, leaves, and stolons), or sod inhabiting (those whose feeding habitshave no direct damage to the turf, but that cause production, harvesting, orsales problems).
Bermudagrass Mites (surface feeding)
Bermudagrass mites (Eriophyes cynodoniensis) are related to spiders, and are amajor pest only to bermudagrass. They suck sap from the base of the blades,the blade sheaths, and the stems. Their feeding habits produce tight rosettesor knots on the plant, causing the grass to turn yellow and then brown.

35
Eventually, the plant may die. Green growth does not appear when populationsare high. The mites are most prevalent on well-fertilized bermudagrass andduring humid weather, particularly with temperatures of 75o F and above. Theyreproduce rapidly.
Chinch Bugs (surface feeding)
This surface-feeding bug is of the Blissus species. They feed on many kindsof turfgrass, but are the most serious problem for St. Augustinegrass. Theyare sun- and heat-loving insects. Both the adults and the nymphs suck thejuices out of the grass blades. At the same time, they inject a poison thatcauses the blades to turn brown and die. Heavy infestations may completelykill the turfgrass field. Insecticides are used for control. Irrigationshould precede insecticidal spraying to bring the insects to the surface(Smith).
Nematodes (subsurface feeding)
Nematodes are microscopic worms that live in the soil. They damage the grassroots, preventing the uptake of sufficient water and nutrients to the leafblades, causing stunted growth or death. They thrive best in moist, sandyloam soils and are most severe in the South. They may be carried longdistances by soil, water, tools, or infested plants. There are no easy-to-usenematicides to control their populations. It is best, therefore, to test theroots and soil for their presence, and to fumigate the soil before turfgrassestablishment.
Billbugs (subsurface feeding)
Billbugs are of the Sphenophorus species. Newly-hatched larvae hollow out thegrass stems and crown, leaving fine sand-like excrement. Older larvae canchew the roots. They can cause the grass to turn brown and die in expandingpatches from mid-June to late August. Insecticides are used for control. However, once the larvae have moved to the roots and inside the crown,chemical control is not effective.
Mole Crickets (subsurface feeding)
Mole crickets prefer bahiagrass and bermudagrass stands, but also feed on St.Augustinegrass, zoysiagrass, and centipedegrass. They tunnel through the top1 to 2 inches of soil, loosening it and uprooting plants, causing them to dryout. They also feed on grass roots, resulting in stunted growth. Large areasof the stand may turn brown and die. They are active at night, and in thedaytime, they return to their underground burrows. Insecticides are used forcontrol after the eggs hatch and before the young nymphs cause damage. Mowingand watering the field should precede insecticide application because molecrickets are not active in dry soil.

36
Sod Webworms (surface feeding)
In the adult stage, sod webworms are night-flying moths. The moths drop eggsinto the grass as they fly. The eggs hatch and turn into light brown or grayworms with black spots, and are 1/4- to 3/4-inch long. These worms feed ongrass blades at night or on cloudy, rainy days, forming brown patches in theturf that are about the size of a saucer. Grass blades are chewed off at thesoil level. In the daytime, the worms hide in white, silky tubes in the soil. A field may die in several days if the infestation is severe. Insecticidesare used for control.
Grubs (subsurface feeding)
Grubs are the larvae of different kinds of beetles. They feed on turf roots 1to 3 inches deep in the soil, causing the turf to turn brown in large patches. They may kill an entire field. The adult beetles do not damage the turf, butthey lay eggs in the soil in the spring and summer. In late fall, the grubsmove deep in the soil to over-winter and resume feeding in the spring. Forpreventive control, insecticides are applied at the first appearance of aproblem (Smith). Armyworms (surface feeding)
Armyworms are light tan to dark brown caterpillars (with yellow, orange, ordark brown stripes) that chew on grass blades. They may completely strip aturfgrass area in 2 to 3 days. They are most prevalent after cold, wet springweather, with the greatest damage occurring around mid-May. They do not over-winter in cold areas, although the moths migrate great distances in search ofplaces to lay eggs. Insecticidal sprays may be used for control.
Ants (sod-inhabiting)
Ants live underground in hot, dry areas. Even though they do not feed on thegrass, they may damage the plants in several ways. As they tunnel among thegrass roots, small mounds or hills of soil occur in the turf. In addition touprooting plants, the mounds of soil may dry out and kill the plants. Antsfeed on newly-planted grass seeds and sometimes store seeds in their nests. Growers are restricted by law from shipping sod infested with fire ants tofire ant-free areas. Currently, only one insecticide (chlorpyrifos) can beused for preparing sod for shipment out of infested areas into ant-free areas(White, et. al.).
Weeds
Turf contaminated with weeds is not of high quality. Weeds can be classifiedas broadleaf weeds and grass-type weeds. Broadleaf weeds that may invade asod field include buttercup, carpetweed, clovers, henbit, spurge, wild onion,wild garlic, and thistles. Grass-type weeds can be annuals such as crabgrass,annual bluegrass, and goosegrass, or perennials such as common bermudagrass.

37
Weed control in turfgrass sod production may include chemical controls, handweeding, and mowing. Close mowing of turf suppresses broadleaf weed activity,but does not control grassy weeds. Selective herbicides are effective whenapplied correctly (White, et. al.).
A hand-weeding crew can weed a turfgrass field if few weeds are present. Thisis at times a preferred method because it takes several weeks for a herbicideto be effective, and the risk of injury due to improper herbicide applicationmay at times be high. Some herbicides can also inhibit the rooting of newly-installed sod, by as much as 6 to 10 weeks (Cockerham).
Regional/State Analysis
New Jersey (Northeast Region)
The Census of Agriculture reported 41 farms in New Jersey with 3,998 acres ofsod in 1992 (Table 1). The value of sod production in that year was $11.6million. In the Northeast region, New Jersey is the dominant state both interms of acreage and total market value. Nearly a quarter of New Jersey's sodacreage is located in Monmouth County, while about 19 percent is in BurlingtonCounty.
Sixty-one percent of the farms with sod in New Jersey had $100,000 or more insales in 1987 (Appendix table 1b). Thirty-nine percent of New Jersey's sodfarms were individual- or family-owned operations in 1987, 32 percent werepartnerships, and 29 percent were corporate-type farms (Appendix table 3b).
Cultural Practices
New Jersey growers usually plant sod in late summer or early fall. The mostcommon turfgrass species planted are Kentucky bluegrass and tall fescue. Bothare cool-season grasses that are established through seeding. New Jersey sodgrowers have stopped producing warm-season grass sod in recent years (Murphy).
Almost all of the farms growing sod are irrigated, typically using a sprinklerirrigation system. Sod growers usually practice crop rotation. Some growersrotate their fields every year, while others rotate every three to four years,depending on market conditions (Murphy).
All New Jersey growers harvest sod mechanically using the clean-cut method. Both Kentucky bluegrass and tall fescue sod are ready for harvest about a yearafter planting. There is some flexibility, however, in the harvest period. When market conditions are not favorable, growers allow their sod fields toremain under low maintenance for up to 3 or 4 years (Murphy). When this isdone, difficulties may arise in harvesting, and the risk of insect and diseaseproblems is higher.
New Jersey sod growers often deliver turfgrass to landscapers, contractors,and other buyers. Growers usually own their own trucks. Occasionally, theyalso install the sod at the delivery site (Murphy).

38
New Jersey has a Certified Sod Program run by the New Jersey Department ofAgriculture. This program is voluntary and currently, less than half of thesod growers have requested sod certification (Murphy).
Production Perils
The most common weather-related production peril encountered by New Jerseygrowers is drought. This situation may result in higher expenses due to theneed for increased irrigation or, at the other extreme, the actual loss of asod field if ponds run dry.
The most damaging insect pests are white grubs, while the most common diseasesinclude pythium blight and brown patch. Damage due to these insects anddiseases is most prevalent during the summer.
Industry Organizations
The Cultivated Sod Association of New Jersey is comprised of about 40 growersand associated industry representatives. They hold quarterly meetings, attimes with the assistance of the Farm Bureau. Their main function lies insharing information, the offering of educational programs, and updates onindustry rules and regulations.
Demand For Crop Insurance
There probably would be minimal interest among New Jersey growers in a sodcrop insurance policy. Because of the widespread use of irrigation, droughtcauses major losses only in the event of a severe and prolonged dry period. Insects and diseases can be controlled using current cultural practices. Inaddition, New Jersey growers produce mainly Kentucky bluegrass and tallfescue, which are well adapted to the state's climate.
The small amount of ad hoc disaster assistance paid for sod between 1988 and1993 indicates that losses due to weather-related perils are minor. While NewJersey accounted for 2.6 percent of the average U.S. sod acreage, disasterassistance payments for sod were only 0.1 percent of the U.S. total during the1988 to 1993 period (Table 5). The $9,000 paid in disaster assistance to NewJersey growers during that period amounted to only 0.07 percent of the state'sestimated value of sod production (Table 6).
Minnesota (North Central Region)
The Census of Agriculture reported 90 farms in Minnesota harvesting 10,566acres of sod in 1992. The total value of the crop in that year was $12.3million (Table 1). Sod acreage in Minnesota ranked as the fourth largest inthe U.S., and accounted for nearly 5 percent of U.S. total sod acreage. Thevalue of Minnesota's crop accounted for about 3 percent of the U.S. total.
Production is concentrated mainly in Anoka (33 percent of Minnesota's sodacreage), Dakota (13 percent), and Chisago (11 percent) counties. Sod farmsusually are near metro areas, which are their major markets (Peterson). The
39
Table 5--Disaster assistance payments for sod, by region and State, 1988-93
Average Total sod Share of Region sod disaster U.S. sod and acreage Share of payments, disaster State 1987-92 U.S. Acreage 1988-93 payments
Thousand Acres Percent Dollars Percent
Northeast 14,387 7.2 427 4.9 Connecticut 1,117 0.6 0 0.0 Maine NR -- 157 1.8 Massachusetts 396 0.2 27 0.3 New Hampshire 610 0.3 0 0.0 New Jersey 5,184 2.6 9 0.1 New York 3,247 1.6 52 0.6 Pennsylvania 1,673 0.8 28 0.3 Rhode Island 2,319 1.2 153 1.8 Vermont NR -- 0 0.0
North Central 49,644 24.7 3,364 38.7 Illinois 9,370 4.7 174 2.0 Indiana 3,209 1.6 0 0.0 Iowa 2,076 1.0 419 4.8 Kansas 3,213 1.6 326 3.7 Michigan 7,013 3.5 61 0.7 Minnesota 9,259 4.6 366 4.2 Missouri 3,502 1.7 1,577 18.1 Nebraska 1,390 0.7 0 0.0 North Dakota 34 0.0 0 0.0 Ohio 4,409 2.2 67 0.8 South Dakota 423 0.2 0 0.0 Wisconsin 5,929 2.9 374 4.3
South 111,808 55.6 4,848 55.8 Alabama 9,731 4.8 198 2.3 Arkansas 2,142 1.1 266 3.1 Delaware 518 0.3 100 1.2 Florida 50,991 25.4 779 9.0 Georgia 8,268 4.1 8 0.1 Kentucky 1,488 0.7 0 0.0 Louisiana 1,857 0.9 268 3.1 Maryland 3,205 1.6 1,330 15.3 Mississippi 1,232 0.6 132 1.5 North Carolina 1,396 0.7 139 1.6 Oklahoma 3,465 1.7 1 0.0 South Carolina 4,256 2.1 39 0.5 Tennessee 2,059 1.0 1,054 12.1 Texas 19,213 9.6 334 3.8 Virginia 2,164 1.1 193 2.2 West Virginia 58 0.0 8 0.1

40
West 24,305 12.1 52 0.6 Alaska NR -- 0 0.0 Arizona 1,507 0.7 0 0.0 California 7,813 3.9 0 0.0 Colorado 4,791 2.4 0 0.0 Hawaii 58 0.0 0 0.0 Idaho 1,049 0.5 0 0.0 Montana 329 0.2 0 0.0 Nevada 656 0.3 0 0.0 New Mexico 1,331 0.7 0 0.0 Oregon 1,576 0.8 0 0.0 Utah 2,902 1.4 2 0.0 Washington 2,097 1.0 50 0.6 Wyoming 223 0.1 0 0.0
United States 201,116 100.0 8,691 100.0
NR= Not reported.
Note: Sod acreage is averaged for the years 1987 to 1992 only. A lineartrend was used to estimate acreage data for 1988 through 1991 utilizing 1987and 1992 Census of Agriculture data. Disaster assistance data are averagedover the 1988-93 period.
Sources: 1987 and 1993 Censuses of Agriculture and ASCS data files.

41
Table 6--Sod: Estimated crop value and disaster assistance, by region and State
Estimated Total Disaster cumulative disaster payments, crop value payments percent of 1988-92 1988-93 crop value
------1,000 dollars------ Percent
Northeast 42,043 427 1.01 Connecticut 3,784 0 0.00 Maine NR 157 -- Massachusetts 855 27 3.17 New Hampshire 1,761 0 0.00 New Jersey 13,596 9 0.07 New York 12,149 52 0.43 Pennsylvania 3,775 28 0.74 Rhode Island 6,466 153 2.36 Vermont NR 0 --
North Central 85,511 3,364 3.93 Illinois 20,861 174 0.84 Indiana 6,670 0 0.00 Iowa 4,019 419 10.43 Kansas 5,165 326 6.31 Michigan 10,259 61 0.59 Minnesota 11,183 366 3.27 Missouri 5,560 1,577 28.37 Nebraska 2,379 0 0.00 North Dakota 91 0 0.00 Ohio 8,224 67 0.82 South Dakota 937 0 0.00 Wisconsin 10,574 374 3.54
South 186,043 4,848 2.61 Alabama 17,693 198 1.12 Arkansas 3,821 266 6.97 Delaware 1,177 100 8.50 Florida 67,344 779 1.16 Georgia 25,677 8 0.03 Kentucky 2,342 0 0.00 Louisiana 2,787 268 9.62 Maryland 6,306 1,330 21.10 Mississippi 1,885 132 7.00 North Carolina 5,022 139 2.76 Oklahoma 5,720 1 0.01 South Carolina 6,963 39 0.56 Tennessee 3,906 1,054 26.98 Texas 30,925 334 1.08 Virginia 4,946 193 3.90 West Virginia NR 8 --

42
West 124,443 52 0.04 Alaska NR 0 -- Arizona 7,453 0 0.00 California 71,727 0 0.00 Colorado 12,528 0 0.00 Hawaii 697 0 0.00 Idaho 2,875 0 0.00 Montana 1,059 0 0.00 Nevada 2,608 0 0.00 New Mexico 4,099 0 0.00 Oregon 11,030 0 0.00 Utah 7,336 2 0.02 Washington 10,043 50 0.50 Wyoming 469 0 0.00
United States 439,638 8,691 1.98
NR= not reported.
Note: A linear trend was used to estimate crop values during 1988 through 1991utilizing 1987 and 1992 Census of Agriculture data on sod sales.
Sources: 1987 and 1992 Censuses of Agriculture. Disaster payments are from ASCSdata files, compiled by the General Accounting Office.

43
Census of Agriculture reported that, in 1987, 44 percent of Minnesota's farmswith sod had sales of $100,000 or more (Appendix table 1b).
Cultural Practices
Sod growers in Minnesota usually plant in late summer or early fall, withAugust the most common planting month. Most of Minnesota's sod production isestablished from seeds. The time from planting to harvest is at least oneyear.
Because of cold winters, Minnesota produces only cool-season grasses for sod. Kentucky bluegrass accounts for about 99 percent of the state's production. Asmall proportion of farms also grow ryegrass and other bluegrasses. About 15to 20 percent of the farms are irrigated, with sprinkler irrigation systemsthe most common. Most growers plant in August because they do not need toirrigate in the following months, which are often cool and moist (Peterson).
Plastic netting is not a common practice among Minnesota growers. This isbecause Kentucky bluegrass produces rhizomes, and therefore has the ability to"knit together" well. A few growers use netting to reduce the time needed forestablishment, and when growing ryegrass, which does not produce rhizomes.
Harvesting is done mechanically with a tractor-mounted harvester and a sodroller. Harvesting can be delayed for up to three years if market conditionsare not favorable (Fender). According to one sod grower, harvesting expensesare about 50 percent of total sod production costs (Hogdal). Harvested sod isnot inspected unless exported to Canada (Klint).
Sod is marketed through varying channels. While almost every producer sellssod at the production site, some growers also haul sod to the sites of buyerswho have their own crews for installation. Garden centers and retailerstypically use their own trucks and load pallets at the production site.
Production Perils
Heat and drought are the most severe production perils in Minnesota. Duringthe last two years, sod producers also experienced excessive rains and coldsummers that promoted weed development (Jensen; Peterson). The most commonweeds include bentgrass, quackgrass, or contamination by another bluegrass. These grass-type weeds affect the marketable quality of sod because they aredifficult or even impossible to eradicate.
Damage due to insects and diseases is not usually a major problem on Minnesotasod farms because the fields are usually large and located in open areas wherethere is free air movement (Peterson).
Ad hoc disaster payments to turfgrass sod producers were reported in Minnesotafor losses due to frost and ice in October of 1991, and to excessive rains anda relatively cold summer in 1993.

44
Industry Organizations
The Minnesota Turf Association (MTA) offers education, marketing, and outreachto sod growers. Growers account for about 90 percent of MTA's membership.According to Kurt Klint, Executive Director of MTA, sod producers do not needto have their sod inspected prior to marketing, except for export to Canada. There is also a Minnesota Turf and Grounds Association, to which MTA sends arepresentative.
Demand For Crop Insurance
Minnesota growers will probably have an interest in a crop insurance policyfor sod. Even though insect and disease problems do not appear to be a majorthreat to their production, they have experienced rather significant lossesdue to weather-related perils. Drought, excessive heat, excessive rains, icestorms, and frost were among those mentioned. Losses due to drought can besevere, as 80-85 percent of Minnesota's sod farms are not irrigated.
Disaster assistance payments for sod losses between 1988 to 1993 amounted toabout 4 percent of the U.S. total, and were slightly over 3 percent of thestate's estimated value of sod production (Tables 5 and 6). Ad hoc disasterpayments to Minnesota growers totalled $366,000 over that six-year period.
Illinois (North Central Region)
According to the Census of Agriculture, Illinois had 46 farms that producedsod in 1992 (Table 1). These farms had 9,320 acres in sod production, with atotal value of sod production of $21.3 million. About 32 percent of the sodacreage was in Kankakee County, 21 percent was in McHenry County, and 15percent was in Will County. These counties are all in the northeastern partof the state.
In 1987, the Census of Agriculture reported that 73 percent of Illinois farmswith sod had sales of $100,000 or more (Appendix table 1b). Forty-eightpercent of the farms with sod were corporations, 39 percent were individual-or family-owned operations, and 11 percent were partnerships (Appendix table3b).
Cultural Practices
Cool-season grasses dominate sod production in Illinois, where winters arecold and summers are warm and humid with frequent thunderstorms. The mostcommon turfgrass sods are Kentucky bluegrass and creeping bentgrass. Sodproducers usually seed fields in late summer or early fall at a rate of 30 to45 pounds per acre. Sod can be seeded in the spring, although weed control ismore of a problem than for fall seeding. A few bluegrass growers allow theirstands to propagate vegetatively, rather than through the seeding method. However, this practice is used only by a very few growers (Voight).
The majority of Illinois growers irrigate. Illinois sod is typically readyfor harvest about 12 to 18 months after seeding. Most of the harvesting is

45
done mechanically, and the fields are then re-seeded the following fall. Ifsod prices are low, growers sometimes postpone their harvesting activitiesuntil profitable market conditions return (Fender).
Some growers use plastic netting, particularly for grasses that do not producerhizomes, such as tall fescue. Tall fescue sod is not, however, commonlygrown in Illinois.
Production Perils
Because of the hot, humid summers, weeds and insect damage (particularly bywhite grubs and billbugs) are the most common production perils encountered bysod producers in Illinois. However, intensive field management generallyprovides adequate control (Fender).
In more recent years, excessive rains and flooding have been a problem. As anexample, during July 1993, three levies in Adams County broke due to excessiverains, leaving an estimated 40,000 cropland acres (including farms with sod)under water. Sod growers usually re-seed their fields in August or September,but the fields remained very wet until the first of 1994 (Dingerson).
Industry Organizations
Turfgrass Producers International (TPI), formerly the American Sod ProducersAssociation (ASPA), is an international, independent, non-profit association. It is the leading organization promoting the turfgrass sod industry, withoffices based in Illinois. The organization is comprised of 940 members with227 international members in 35 countries. Membership includes sod producersand others involved in the production of turfgrass sod.
The organization has over 650 farm members, representing 75 to 80 percent ofthe acres in sod production in the United States. Approximately 70 percent ofthe farm members own and operate sod farms of less than 200 acres, whileapproximately 11 percent own and operate farms of over 500 acres.
The organization has assumed a leadership role in research, legislative andregulatory issues affecting the industry. It is especially concerned with thebenefits of turfgrass sod, to better acquaint the public with their product,and to provide suggestions and instructions for the planting and proper careof their product.
Demand For Crop Insurance
Illinois sod growers may have an interest in a crop insurance policy for sod. Current management practices appear adequate to solve problems caused byinsects, diseases, and weeds, the most common problems encountered by theirgrowers (Voigt). Flooding, however, was a major threat in 1993.
Ad hoc payments to Illinois sod growers were about $174,000 during the 1988-93period, about 2 percent of the U.S. total (Table 5). These payments amounted

46
to less than 1 percent of the estimated value of sod production in the state(Table 6).
Florida (Southern Region)
The Census of Agriculture reported 154 farms in Florida producing 52,030 acresof sod in 1992. The value of Florida's sod production in that year totalled$64.2 million (Table 1). Florida ranked first in U.S. sod acreage, accountingfor about 24 percent of the U.S. total. Florida ranked second to Californiain the value of sod production, with 14 percent of the U.S. total.
About 70 percent of Florida's sod acreage is in the southern portion of thestate. Forty-three percent of Florida's sod acreage was located in Palm BeachCounty in 1992, 7 percent in Osceola County, 5 percent in Hendry County, and 4percent each in Polk County and Hillsborough County. Highlands, Lake, andOrange counties accounted for an aggregate of 7 percent of the state's sodacreage.
Thirty-five percent of Florida farms producing sod in 1987 had $500,000 ormore in sales, while 26 percent had sales of $100,000 to $499,999 (Appendixtable 1b). The very largest farms produce over 60 percent of the industry'stotal output (Hodges, et. al.). About 45 percent of Florida farms with sodwere corporations (mostly family-held), 36 percent were individual- or family-owned farms, and about 17 percent were partnerships (Appendix table 3b).
A recent University of Florida study indicates that small sod farms averagedabout 200 acres in size in 1988, medium-sized farms were 660 acres, and largefarms were 1,245 acres. The largest category averaged 4,755 acres in 1988(Hodges, et. al.)
Cultural Practices
St. Augustinegrass and bahiagrass are the two dominant grass species grown inFlorida. About 72 percent of Florida's sod acreage in 1991-92 was identifiedas St. Augustinegrass, 20 percent was bahiagrass, 4 percent was bermudagrass,and 4 percent was centipedegrass (Hodges, et. al.). Both bahiagrass andcentipedegrass are established mainly by seed, while St. Augustinegrass andbermudagrass are propagated vegetatively from freshly-harvested sprigs.
About 75 percent of Florida's sod acreage is irrigated. Common irrigationmethods include the use of fixed units such as pivot irrigation, portableunits such as tractor-mounted or self-propelled travelling guns, and seepageirrigation from ditches or high-maintained water tables. The use of thesemethods depends upon the size of area to be irrigated and the farm's location(Haydu and Cisar).
The most common harvesting method leaves strips or "ribbons" of sod that areabout 2 to 3 inches wide in the field. These ribbons are used to regeneratethe sod for future harvest (Haydu and Cisar). In 1987, sod growers harvestedabout 70 percent of the total area under production. The significant amountof unharvested acreage may be attributed to bahiagrass producers, who harvest

47
sod less frequently than other growers. Some growers also leave their fieldsunharvested for years when market conditions are not very favorable (Hodges,et. al.).
Between 1963 and 1987, the number of firms entering the sod industry roughlydoubled in Florida. Medium and large producers experienced the most dramaticshifts in varietal emphasis and planted acres between 1963 and 1987, resultingin a doubling of their harvesting ratio (Haydu and Cisar).
St. Augustinegrass accounted for ninety-five percent of Florida's 1991-92 sodsales, with the remaining sales consisting of bermudagrass, bahiagrass, andcentipedegrass (Table 7). Farm-gate prices vary according to grass species,with bermudagrass and centipedegrass sod the most expensive, and bahiagrassthe cheapest. Bahiagrass sod is used mainly as ground cover for roadsides,airports, and cemeteries (Haydu and Cisar).
Most Florida sod is marketed with the buyer making arrangements for pickup,delivery, and installation. Contract growing is also used, where the growerplants and manages the grass, but is not necessarily responsible for harvestand delivery. Some sod producers provide delivery and installation services. In 1991-92, sod sales accounted for 73 percent of the estimated products andservices provided by the sod production industry, with the remainder includingtransportation, landscaping, and laying sod (Haydu and Cisar).
The smallest growers often ship their sod directly to retail outlets. Ratherthan specialize, some small growers are vertically integrated so that they cansupplement their farm income. They do not have the economies of size in sodproduction that can be realized by the larger producers (Haydu and Cisar).
Production Perils
Drought has been the most common production peril for Florida sod growers. Drought was the main reason for disaster payments for sod in Pasco County in1991 and in Union County in 1993. In Union County, growers who applied forassistance said they were unable to irrigate prior to harvesting and followingplanting, causing death of the sprigs (Roberts).
Diseases affecting Florida sod include fusarium blight, brown patch, pythiumblight, and leaf spot. The most common insect perils include mole crickets,fire ants, and nematodes. Disease and insect damage is not typically aserious threat because most sod growers use intensive pest management and landcultivation practices.
Industry Organizations
The Florida Turfgrass Association includes both sod growers and others who areinvolved in the turfgrass business. The association's main purpose is to keepits membership informed of the latest developments in the turfgrass industry.

48
Table 7--Florida sod industry revenues: total sales, sales by grass species, and prices received, 1991-92.
Percent Turfgrass Value of sales of Florida total Farm price
1,000 dollars Percent Cents/Sq. Ft.
St. Augustinegrass 113,117 95 8Bermudagrass 3,451 3 9Bahiagrass 813 1 6Centipedegrass 938 1 9 Total 118,318 100 --
Source: Hodges, et. al.

49
Demand For Crop Insurance
There will likely be interest in crop insurance for sod among Florida growers,particularly if the policy covers drought. While continuous cultivation andmanagement practices lessen the threat of losses due to insects and diseases,drought remains a threat, particularly for the 25 percent of Florida's farmswith no irrigation.
Ad hoc disaster payments for sod in Florida over the 1988-93 period totalled$779,000. However, Florida's payments were low relative to the state's sodacreage. Florida's payments amounted to 9 percent of the U.S. total over thesix-year period, while Florida's acreage accounted for 25 percent of the U.S.sod acreage (Table 5). Disaster assistance payments amounted to 1 percent ofthe state's estimated value of sod production over the six-year period (Table6).
Maryland (Southern Region)
The Census of Agriculture reported 30 farms in Maryland producing 3,171 acresof sod. The value of the state's sod production in 1992 was $6.7 million(Table 1). Twenty-seven percent of Maryland's sod acreage was located in AnneArundel and Montgomery counties, with about 7 percent in Carroll and Harfordcounties.
Cultural Practices
Tall fescue and Kentucky bluegrass are the most common turfgrass species usedfor sod production in Maryland. Some growers also plant bermudagrass. Sodfarms in Maryland range from 10 acres to 800 acres in size (Turner).
Sod growers usually establish tall fescue fields through seeding in August andSeptember for harvest the following fall. In general, sod in Maryland takes 6to 18 months to reach maturity, depending on whether or not irrigation is used(Turner). Growers typically use the clean-cut method for harvesting tallfescue sod and the ribbon-cut method for Kentucky bluegrass.
Maryland has a certified sod program, which is administered by the MarylandDepartment of Agriculture. Sod that is certified contains only recommendedcultivars for Maryland and Virginia, has been seeded in recommendedpercentages, is of high quality, and is guaranteed free of insects, weeds, anddiseases. Grower participation in the program is voluntary.
Production Perils
Excessive heat and drought are the most common weather-related perils faced byMaryland sod growers. During the last few years, numerous farms lost hundredsof acres due to drought (Turner). Disaster payments during 1991 and 1993 weremostly due to losses caused by drought. Some sod producers did not harvestany sod in 1986 because of a dry period in the spring (USDA-MA). Problems dueto winterkill have also been encountered with bermudagrass (Turner).

50
Industry Organizations
The Maryland Turfgrass Association is comprised of sod producers and others inthe sod industry. Currently, the association has between 30 and 40 members. Its main function is to disseminate information on the agronomic and businessaspects of the sod industry, and on methods for improving sod quality. Theassociation also helped establish the sod certification program in Maryland.
Demand For Crop Insurance
Maryland growers will probably have an interest in a crop insurance policy forsod. Since Maryland is located in the transition zone where grass climatesoverlap, growers tend to face more uncertainties in sod farming. Selection ofgrass type and good management practices are very critical.
In recent years, Maryland sod growers have incurred losses caused mainly bydrought. While Maryland's share of U.S. sod acreage is only 1.6 percent,disaster assistance payments over the 1988-993 period amounted to about $1.3million, 15.3 percent of the U.S. total (Table 5). Disaster assistance toMaryland sod growers was the second largest reported in the United Statesduring that period, and accounted for over 21 percent of the state's estimatedvalue of sod production (Table 6).
Alabama (Southern Region)
The Census of Agriculture reported 82 farms with 11,967 acres in sod in 1992(Table 1). The total market value for Alabama's sod production during thatyear was $17.8 million. Alabama's sod acreage ranked third in the UnitedStates, accounting for slightly more than 5 percent of the total.
Alabama's sod production is clustered in Baldwin, St. Claire, and Barbourcounties (Ward). In 1992, about 25 percent of Alabama's sod was grown inBaldwin County, which has sandy soils and a long growing season (Census ofAgriculture). Other counties in the state each have smaller sod acreages.
Forty-five percent of Alabama's farms with sod had sales of less than $25,000in 1987 (Appendix table 1b). About 68 percent of the state's sod farms wereindividual- or family-owned operations, 24 percent were corporate-type farms,and 7 percent were partnerships (Appendix table 3b).
Cultural Practices
Alabama produces mostly warm-season grasses, including hybrid bermudagrass,centipedegrass, zoysiagrass, and St. Augustinegrass. A few producers alsogrow turf-type tall fescue, the only cool-season grass grown in the state. The tall fescue grown in Alabama is mostly for out-of-state shipment (Ward).
All of Alabama's warm-season grass production is vegetatively established fromsprigs or plugs, except for common centipedegrass and bermudagrass, which canalso be established from seed. A majority of growers prefer to plant using

51
sprigs, although plug planting is often used for St. Augustinegrass andzoysiagrass because of its greater effectiveness (White, et. al.).
Vegetative propagation is either done "in house" by producers or throughcustom planting contracts. Some producers also do custom planting for othergrowers. Overall, larger producers prefer to plant "in house," while farmswith less than 300 acres usually contract for custom planting (White, et.al.).
Sod growers usually plant warm-season grasses between mid-April and mid-July.Tall fescues are planted in September. Warm-season grasses are planted in thespring so that the plants become well established before winter. Producers inthe northern two-thirds of the state are reluctant to initiate establishmentof warm-season grasses after September 1 because of the potential for winterinjury to new plantings (White, et. al.).
The growing period ranges from 4 to 20 months. Zoysiagrass can be harvested18 months after planting, while bermudagrass has a relatively faster growthperiod. A grower in northern Alabama can harvest 3 bermudagrass crops everytwo years. In southern Alabama, growers can harvest 5 bermudagrass cropsevery two years (Ward).
Producers with large common centipedegrass acreages also produce seed. Theseed is harvested and used on the farm to over-seed vegetative centipedegrassproduction or is planted on prepared seed beds for establishment (White, et.al.). Growers who produce tall fescue sod use plastic netting to improve thetensile strength and thus, harvesting and handling qualities.
All of Alabama's sod farms are irrigated, and often use a sprinkler system. Sources of water for irrigation are natural streams, rivers, or ponds.
Sod harvesting is done mechanically, with the majority of growers using theribbon-cut method. If turf is harvested in late summer and new growth issubject to winter injury, ribbons are often left in the field. Growers havereported greater winter injury to clean-cut fields than ribbon-cut fields. Growers in the northern two-thirds of Alabama prefer re-establishment fromribbons because the growing season is shorter and the winters are more severethan in the southern part of the state (White, et. al.)
Over 50 percent of Alabama's sod production is shipped out of state to coastalcities in Florida, to New Orleans, and to Atlanta, where there is a greaterdemand for sod (Ward). Alabama does not have a large population, and about 30percent of the population is from rural areas. The average delivery area forsmall Alabama sod operations is reported at less than 35 miles and for thelarger operations, at 175 miles (White, et. al.).
Alabama's sod industry is largely a service industry. Deliveries to the pointof sale normally include on-site distribution. Producers must supply bothservices or discount their sod prices accordingly. For smaller operationsthat have less than 100 acres, most sales are for field pick-up, although somedeliveries are also made to the point of sale.

52
Forty-six percent of all sod sold in Alabama in 1988 was at the wholesalelevel (White, et. al.). Table 8 lists the major market outlets for sod inAlabama.
Production Perils
The most common natural perils to sod production in Alabama are floods anddroughts. Mole crickets, billbugs, grubs, sod webworms, armyworms, chinchbugs, and fire ants are some of the insects causing damage to sod fields. Mole crickets are the greatest insect threat to sod growers because they chewoff the tops and roots of the grass and produce tunnels in the soil, makingthe sod difficult to lift (Ward). Growers use acephate, ethoprop, isazophos,carbaryl, and chlorpyrifos for insect control. Diseases are not a majorthreat, except to tall fescue and St. Augustinegrass, which may be affected bybrown patch and gray leaf spot.
Industry Organizations
The Alabama Turfgrass Association's membership consists of sod growers, golfcourse superintendents, professional lawn care companies, and other serviceturfgrass-related companies. The association provides education on turfgrassproduction and is a vehicle for legislative initiatives. The association doesnot provide a marketing program.
Demand For Crop Insurance
There will likely be some interest in a crop insurance policy for sod amongAlabama growers, particularly one which covers droughts and floods. Sodproducers experienced about 12 inches of rain in 1994, causing flooding insome areas (Ward). There may also be interest in sod insurance if the policycovers losses due to mole crickets. Other disease and insect problems can behandled using current management practices.
Drought was the cause of disaster payments for sod in 1991, even though all ofAlabama's sod farms are irrigated. Growers may experience inadequate watersupplies for irrigation if natural streams, rivers, and ponds dry up duringprolonged periods of drought (Ward).
During the period from 1988-93, Alabama sod growers received $198,000 in adhoc payments. Alabama growers did not, however, collect disproportionatepayments relative to their acreage. Alabama accounted for about 5 percent ofU.S. sod acreage, while ad hoc payments to the state amounted to about 2percent of the U.S. total (Table 5). Alabama's disaster payments over thesix-year period amounted to about 1.1 percent of the state's estimated valueof sod production (Table 6).
Texas (Southern Region)
The Census of Agriculture reported 156 farms in Texas growing sod on 21,515acres in 1992. The value of Texas sod production in that year was $37.8million (Table 1). Texas had the largest number of farms producing sod in

53
Table 8--Volume and value of sales by major market outlets for surveyed turfgrass growers in Alabama, 1988 1
Volume of sales Percent of Value of sales Type of buyer (square yards) total sales (dollars) 2
Landscapers/contractors 7,438,704 51 7,661,865Home owners 2,994,555 20 3,084,392Garden centers 1,914,696 13 1,972,137Other growers 1,027,040 7 1,057,851Other 924,336 6 952,066Golf courses 234,752 2 241,794Gov't. agencies 137,917 1 142,054
Total 14,672,000 100 15,112,159
1 Based on responses from 30 (of 79) Alabama growers, 1988.2 Average of $1.03 per square yard for all sod, with no transport charges
included.
Note: Government agencies include athletic departments, recreation or parkfacilities, and school sytems.

54
1992, and the state ranked second in U.S acreage, accounting for nearly 10percent of the U.S. total. About 34 percent of Texas's sod acreage was inWharton County in 1992, 17 percent was in Harris County, and 12 percent was inMatagorda County. All of these counties are in the southeast coastal portionof the state.
More than half of the farms growing sod in Texas in 1987 had a total value ofcrop sales less than $100,000 (Appendix table 1b). Sixty percent of Texas'ssod farms were individual- or family-owned operations, 26 percent werecorporate farms, and 12 percent were partnerships (Appendix table 3b).
Cultural Practices
St. Augustinegrass and bermudagrass are the most common turf species producedin Texas. Currently, about 70 percent of the sod produced and marketed in thestate is St. Augustinegrass. Zoysiagrass and centipedegrass are other warm-season grasses produced in Texas. Growers usually plant in the spring orearly summer. Plastic netting is not used by growers.
All Texas's sod farms are irrigated, with sprinklers the most common method.Sprinkler systems usually consist of either permanent (underground) pipes orportable irrigation tubing that is moved by hand or mechanically.
Because most of Texas's sod is St. Augustinegrass, the ribbon-cut method ofharvesting is widely practiced. With proper fertilization, St. Augustinegrasstakes about 12 to 14 months to reach maturity after planting. Bermudagrass isready for harvest in the fall of the year it is planted. If sod prices arelow, growers can forego harvesting for up to a year (Duble).
The primary markets for sod include construction associated with new homes,businesses, and institution. Other markets include new athletic fields, golfcourses, roadsides, parks, and existing turfgrass areas undergoing renovation. Approximately 75 percent of the sod produced in Texas is marketed within 200miles of the production site, and 98 percent is sold in-state (Duble).
Texas has a certification program for sod that is handled by the Seed Divisionof the Texas Department of Agriculture. Turfgrasses presently approved forcertified production include the Raleigh and Floratam types of St.Augustinegrasses, and the Tifdwarf, Tifgreen, Tifway, and Texturf-10 types ofbermudagrass. Certified sod insures genetic purity and identity andguarantees reasonable standards of sod quality.
Production Perils
Production perils encountered by Texas sod growers vary by the type of grass. Brown patch damage is a peril for St. Augustinegrass, while white grubs andfire ants are a peril for bermudagrass production (Duble). St. Augustinedecline, a viral disease that weakens the grass for a number of years, is nota problem in Texas because growers plant resistant varieties. In general,insect and disease damage is kept at a minimum with proper turf management

55
practices. Some sod farms incurred losses due to a hard freeze in 1990(Quinn).
Industry Organizations
The Texas Sod Producers Association has about 50 members. The associationprovides education, marketing, and promotion assistance to sod producers.
Demand For Crop Insurance
Sod growers in Texas may have some interest in a crop insurance policy forsod. Between 1988 and 1993, disaster assistance payments were made only in1990, when sod was injured by a hard freeze (Quinn). In Matagorda County,some of the farmers who applied for assistance that year were not able toprevent further deterioration of their sod because they were financiallyunable to provide the recommended care.
Ad hoc payments made to Texas sod growers amounted to $334,000 over the 1988-93 period. Texas accounted for nearly 10 percent of U.S. sod acreage duringthat period, and only 3.8 percent of the total disaster assistance paymentsmade for that period (Table 5). Disaster assistance payments to Texas sodgrowers accounted for only about 1 percent of the estimated value of sodproduction (Table 6).
California (Western Region)
The Census of Agriculture reported 62 farms in California producing 8,420acres of sod in 1992. The total crop value was estimated at $79.4 million inthat year (Table 1). Ventura County has the largest concentration of sodproduction in the state, with substantial production also located in RiversideCounty (Gibeault).
Seventy percent of the farms growing sod in California in 1987 had sales of$100,000 or more (Appendix table 1b). About 48 percent of California's sodfarms were corporate-type farms, 34 percent were individual- or family-ownedoperations, and 16 percent were partnerships (Appendix table 3b).
Cultural Practices
Tall fescue is the major type of sod produced in California, and is seededmostly in blends of two or three varieties (Gibeault). Kentucky bluegrass andperennial ryegrass are cool-season sods that are also grown in the state. They are generally established from seeds, and produced in mixtures. However,a few Kentucky bluegrasses are established vegetatively. Cool-season grassescan mature in as few as 3 months in California (Cockerham).
In the warmer sections of the state, hybrid bermudagrass, St. Augustinegrass,and centipedegrass are also produced (Fender). These warm-season grasses areusually established by vegetative propagation using sprigs.

56
Seeding is usually done in the spring or fall, with most growers preferringfall seeding. When temperatures exceed 90o F during periods of dry winds, sodfields may require irrigation 2 or 3 times a day to cool and moisten the soilafter seeding (Cockerham).
Seeding is often performed using a drop seeder with rollers. One-half of theseeds are planted in parallel rows, with the remaining half planted in rowsperpendicular to the first planting. This seeding method appears to increasestand uniformity (Cockerham). Netting is used for tall fescue seedings.
All of California's farms growing sod are irrigated. The most common methoduses a sprinkler system, with portable pipes or movable structures. Sodfields are generally fumigated every 5 years to eliminate weeds, nematodes,and many turf diseases (Cockerham). The broadleaf weeds that thrive afterfumigation are controlled with selective weed killers.
Harvesting is done mechanically. Sod harvesting machines have conveyors thatcarry the sod to a rolling or folding attachment. Most grasses are harvestedwithout leaving ribbons or strips. Ribbons are generally left in the fieldswith St. Augustinegrass, as it is a less costly method than replanting.
Sod is either loaded directly onto delivery trucks in the field or hauled to adistribution yard. There, the pallets are arranged by order number, helduntil all trucks are ready, and then loaded onto the delivery trucks. Somegrowers have built shade covers with sprinklers for their holding areas tokeep the sod cool and the outside sod pieces moist.
Most of California's sod is delivered by growers to marketing outlets. Insome instances, customers may pick up their own orders.
Production Perils
Drought is the most common weather-related peril encountered by California sodproducers. However, this is not a serious threat because all of the sod farmsare irrigated. Earthquakes can also be a problem (Gibeault). Floods cancreate harvesting and maintenance problems, or may prevent the establishmentof newly seeded or sprigged fields.
Diseases are not typically a problem because California has low humidity andlow rainfall. The most common diseases affecting sod production, however, arePythium blight and brown patch. Grubs, sod webworms, and cutworms are insectpests of sod, but are more of a problem in maintained turfgrass sod areas,such as parks or home lawns, than in sod fields.
Industry Organizations
The California Sod Producers Association has 40 to 50 members. Although theyare not strongly organized, the association represents growers concerning theuse of natural resources. Water allocation is their major concern.

57
Demand For Crop Insurance
There probably will be very minimal interest in a crop insurance policy forsod among California producers. While they experience relatively dry weatheryear-round, there have been no indications of significant losses due todrought. There were no disaster assistance reported for California sodgrowers during the period 1988-93.
Ad Hoc Disaster Assistance for Turfgrass Sod
Ad hoc disaster assistance legislation was made available for losses ofcommercially-grown crops in each of the years 1988-93. Ad hoc paymentsprovide an indication of high-loss areas during that period, and may indicatestates and counties that would face relatively high risk under a potentialFCIC sod policy. These data may also suggest the areas where the demand for asod crop insurance policy would be relatively high.
Under the 1988-93 legislation, payments were made under the categories ofparticipating program crops, nonparticipating program crops, sugar, tobacco,peanuts, soybeans, sunflowers, nonprogram crops, ornamentals, and at times,aquaculture. Producers without crop insurance--the case for turfgrass sod--were eligible for payments for losses greater than 40 percent of expectedproduction. If a producer had no individual yield data to use in calculating"expected production," county-level or other data were used as a proxy. Payment rates for sod were based on 65 percent of a 5-year average price,dropping the high and low years.
Disaster assistance payments for sod losses totalled about $8.7 million overthe 1988-93 period. Payments for sod losses peaked at $5.1 million in 1993,and were about $1.2 million in 1990. There were no payments for sod lossesreported in 1988 and 1989. Payments in 1991 and 1992 averaged about $2.4million.
Ad hoc disaster payments for sod losses were scattered over a geographicallybroad area. Thirty-one states received payments in at least one of the sixyears, with ten states, mainly in the South and North Central regions,collecting payments in three of the last four years.
In an ordering of counties, Lincoln County, Missouri ranked first in paymentsfor sod losses, receiving nearly $344,700, all during 1993 as a result offlood damage. The next three counties in the series include: St. LouisCounty, Missouri ($325,700); Platte County, Missouri ($325,500); and St.Charles County, Missouri ($307,900). Over 130 counties received payments inat least one of the six years, mainly due to droughts and floods. Five of thetop-10 counties were located in Missouri, three were in Maryland, and one eachwere in Florida and Tennessee.
By state, the largest payments were made to Missouri growers ($1.6 million),Maryland growers ($1.3 million), and Tennessee growers ($1.1 million). Other

58
states that received at least $300,000 in payments include Florida, Iowa,Wisconsin, Minnesota, Texas, and Kansas.
Ad hoc disaster data can be used to indicate which sod-producing areasreceived large payments relative to their acreage (Table 5). For example,Missouri produced an average of 3,502 acres of sod between 1987-1992, about1.7 percent of the U.S. total. At the same time, ASCS disaster assistancedata indicate that Missouri accounted for 18 percent of U.S. ad hoc disasterpayments made for sod between 1988 and 1993. Maryland's and Tennessee's shareof disaster payments, at about 15 percent and 12 percent, were also largerthan their share of U.S. acreage, at 1.6 percent and 1.0 percent,respectively.
In contrast, Florida, Texas, and Alabama collected a smaller share of ad hocpayments relative to their acreage. Florida accounted for about 25 percent ofaverage U.S. sod acreage over the 1987-1992 period, and collected about 9percent of U.S. ad hoc payments for that crop between 1988 and 1993. Texasaccounted for nearly 10 percent of U.S. sod acreage, and 3.8 percent of adhoc payments for sod. Alabama accounted for nearly 5 percent of U.S. sodacreage, and collected 2.3 percent of total U.S. ad hoc payments made for sod.
Turfgrass Sod Insurance Implementation Issues
Adverse Selection
Adverse selection is not likely to be a major problem in offering turfgrassinsurance. This is because the most serious production perils tend not to befield-specific. Droughts, for example, are a peril cited as a significantreason for losses in several states. Droughts occur over a wide area, and anyone specific field is not likely to be more susceptible to losses than anyother.
One exception may be losses due to flooding. Sod planted in a flood plain ismore likely to experience flooding than that planted at higher elevations.
Setting Reference Prices
FCIC provides reference prices (price elections) for insured crops, whichbecome the basis for assigning values to yield losses. Insured growers electa price guarantee as the basis for indemnity payments.
An in-field value of the sod crop probably represents the most appropriatereference price for purposes of setting price elections because it would avoidreimbursing growers for non-incurred expenses. In the event of a yield loss,growers generally would not incur harvesting and marketing expenses, whichaccount for an estimated 20 to 50 percent of total production costs.
A second reason for selecting an in-field value is that there are no reportedprices available for sod that could be used to develop a market-price based

59
reference price. The in-field reference price would be best estimated as thecost of production, exclusive of harvesting and marketing expenses.
Estimating Production History
Several factors complicate the estimation of a grower's production history. The first is that when clean-cutting a field of sod, the yield is limited to amaximum of 43,560 square feet per harvested acre. Yields of less than thisamount either represent unharvested area or harvesting of low quality sod thatis discarded. The grower has some control over the yield of ribbon-cut sod byaltering the width of undisturbed ribbons left in the field to establish thenext crop.
Another complication in determining yield is the lack of consistency in thegrowing periods among the various species. Some species reach marketablequality in less than a year, while some require a much longer growing period.
A third complexity is that sod may be stored unharvested in the field for upto three years, until a buyer is available. In addition, during periods oflow prices, a grower may decide to keep the field under low maintenance untilmarket conditions improve rather than harvest the field. The availability ofbuyers--and the prices they are willing to pay--determine the yield of sodduring a specific year.
Estimating "Appraised Production"
In general, estimating appraised production (harvestable, but unharvestedyield) is not likely to be an issue in insuring turfgrass sod. In most casesof damage, such as that due to drought, flooding, or frost, loss to a sod cropwill cover the entire field, or at least contiguous areas within the field. In the case of partial damage to sod, the undamaged areas of the field arelikely to yield normally when harvested.
Market Prices and Moral Hazard
Moral hazard due to low market prices is less likely an issue in offering cropinsurance for turfgrass sod than for perishable commodities, such as freshmarket fruits and vegetables. This is because sod can be kept unharvested inthe field for a long period of time. With many fresh fruits and vegetables,growers must find a buyer offering an acceptable price during the short periodof time when their commodity is ready to sell. Growers may lose their entireinvestment if such a buyer is not found. Such a situation makes an insuranceindemnity due to a crop loss an attractive option and creates an incentive formoral hazard.
Because turfgrass growers can keep their sod unharvested for a long period oftime (several years), they are under much less time pressure to harvest on aspecific date. Sod producers, consequently, are less likely than perishable-commodity producers to encounter situations where collecting an insuranceindemnity becomes a more profitable option than maintaining the crop until a

60
buyer is found. For this reason, moral hazard is not likely to be an issue inoffering turfgrass insurance.
Availability of Individual Yield Data
Individual grower yield data do not appear to be readily available. However,certain states have information that may be useful in the process of obtainingand assessing any individual yield data that is obtained. For example, theAlabama Department of Agriculture and Industries maintains a list ofregistered sod producers in the state. Their current list of sod producersalso indicates planted acreage by grass species.
Auburn University, in cooperation with other institutions, conducted a surveyof commercial turfgrass sod producers in Alabama during 1988. The surveyelicited data on the species produced, the size of operations, demographiccharacteristics, and the market outlets used by growers. Detailed informationwere also collected on production, harvesting, and marketing practices in1987. The resulting data were compared with a similar survey conducted in1979. Although yields are not reported for individual growers, county data onthe number of growers, acreage, and unit prices for each grass species may aidin computing a historical yield series for individual growers.
Relevant data are also available from Florida. The University of Florida hasconducted three surveys profiling Florida's turfgrass sod industry, for theyears 1963, 1974, and 1987. An economic comparison of the industry wasconducted using data from these three surveys, and was reported in a 1992publication, "An Economic and Agronomic Profile of Florida's Turfgrass SodIndustry" (Haydu and Cisar). The report includes data on acres planted andharvested by species and by farm size. Another recent economic report waspublished in December 1994, "Contribution of the Turfgrass Industry toFlorida's Economy, 1991/92: A Value Added Approach" (Hodges, et. al.). Thisreport includes data on the cut sod industry's total sales by species, totalacreage by species, and unit prices.
Another source is the American Sod Producers' Association Membership ProfileSurvey, conducted by the Turfgrass Producers' International. Profile surveyinformation is available for 1984, 1988, and 1993
Demand for Insurance
Our assessment is that, although there would be moderate interest amongturfgrass producers in buying crop insurance for sod, participation is likelyto be lower than for most crops. One reason for lower interest among sodgrowers is that most sod is produced with the benefit of irrigation. Althoughdrought was listed as a serious production peril is some areas, widespread useof irrigation provides a large measure of protection in most years. Lossesfrom erosion damage and flooding were also cited as occasional productionperils. The acreage subject to losses from flooding, however, is likely to bequite small.

61
On a regional basis, we judge that participation in a sod insurance programwould be greatest in the North Central states. The basis for this judgementis the large amount of ad hoc disaster assistance payments for sod reportedfor this region over the 1988-93 period. Most of the losses were caused bydrought and floods. In addition, the largest amount of non-irrigated sod islocated in the North Central region. The North Central states accounted fornearly one-quarter of U.S. sod acreage between 1988 and 1993, but collectednearly 39 percent of all disaster assistance paid for sod losses. Disasterassistance payments accounted for 4 percent of the value of sod production inthe North Central states, compared with 2 percent nationally.
There is likely to be a moderate amount of interest in crop insurance for sodin the southern states, partly because the South is where the largest amountof sod is grown. Florida accounted for nearly half of the sod grown in theSouth between 1987 and 1992 and an estimated 25 percent of Florida's acreageis without irrigation and subject, therefore, to drought losses. Some of thelargest disaster payments in the South, however, were paid to sod growers inMaryland and Tennessee. These states are in the transition zone, where grassclimates overlap and sod producers face more weather uncertainties than those further south or north. Warm weather grasses may be killed by extremely coldwinters in this transition area, while extremely hot summers may kill cold-loving grasses.
Interest in crop insurance for sod is likely to be minimal in the westernstates. Except for California, and to a lesser extent Colorado, the westernstates reported relatively small acreages of sod. Further, virtually all sodgrown in the western states is on irrigated land, which minimizes drought as aproduction peril. Although the western states accounted for about 12 percentof the U.S. sod acreage between 1987 and 1992, they received only 0.6 percentof U.S. sod disaster payments.
The small amount of acreage in the Northeast limits the potential demand forinsurance in these states.
Defining "Areas" for the Non-Insured Assistance Program
The non-insured assistance program (NAP) of 1994 Crop Insurance Reform coverscrops that are not currently insured by FCIC--including turfgrass sod--untilthe development of an insurance policy. Under NAP, an "area" must incur atleast a 35-percent yield loss in order to trigger assistance payments. Thedefinition of "areas" for purposes of calculating "area average yield" maydetermine whether or not growers with a qualifying yield loss (50 percent orgreater of the individual average) are eligible for NAP payments.
Defining areas along county lines, or perhaps by climatic regions or zones,would provide a more equitable method for triggering NAP payments than woulddefining areas by state lines. Zones vary by climatic characteristics, whichhelp in turfgrass selection and management--all of which are essential to thequality of sod production.

62
In the minor sod states, area yields may need to be defined along state linesor at least a greater level of aggregation than county lines. In some minorproducing counties there are few growers, and one larger grower's yield mayeffectively determine the county average.

63
References
1993 ASPA Membership Profile Survey. ASPA Turf News. November/December 1993.
American Sod Producers Association. Self-Scoring Method: How to Establish ALawn. Brochure.
Beard, J. B. "Turfgrass Selection: Greater Choice--Greater Challenge."TurfNews. Special issue.
Cockerham, Stephen T. Turfgrass Sod Production. Cooperative ExtensionService. Division of Agriculture and Natural Resources. University ofCalifornia. Publication 21451. 1988.
Dingerson, C. Consolidated Farm Service Agency (CFSA) County Office. AdamsCounty, Illinois. Personal Communication. January 1995.
Duble, Richard L. Commercial Sod Production in Texas. Texas AgriculturalExtension Service. Texas A&M University.
Duble, Richard L. Turfgrass Specialist. Texas Agricultural ExtensionService. Texas A&M University. Personal Communication. January 1995.
Fender, D. H. Executive Director. Turfgrass Producers International. TheTurf Resource Center. Personal Communication. January 1995.
Gibeault, V. A. Turfgrass Specialist. Cooperative Extension Service. University of California. Personal Communication. December 1995.
Haydu, John J. and John L. Cisar. An Economic and Agronomic Profile ofFlorida's Turfgrass Sod Industry. University of Florida. Food and ResourceEconomics Department. Florida Agricultural Extension Stations. EconomicsReport ER92-1. March 1992.
Hodges, A. W., J. J. Haydu, P. J. van Blokland, and A. P. Bell. Contributionof the Turfgrass Industry to Florida's Economy, 1991/92: A Value AddedApproach. University of Florida. Food and Resource Economics Department andFlorida Agricultural Experiment Station. Economics Report ER 94-1. December1994.
Hogdal, John. Minnesota Sod Grower. Personal Communication. January 1995.
Iowa State University. Cooperative Extension Service. Sod Production. Alternative Ag Enterprises from Iowa State University Extension. Pm-1295b. September 1987.
Jensen, B. CFSA County Office. Steele County, Minnesota. PersonalCommunication. January 1995.

64
Klint, K. Executive Director. Minnesota Turf Association. PersonalCommunication. December 1994.
Murphy, J. A. Turfgrass Management Extension Specialist. New JerseyCooperative Extension Service. Rutgers University. Personal Communication. January 1995.
Peacock, C. H. Sod Production and Management. Proceedings, VirginiaTurfgrass-Landscape Conference. Blacksburg, Virginia. Virginia CooperativeExtension Service. December 1990. Pages 81-83.
Peterson, B. Turfgrass Specialist. Southern Experiment Station. Universityof Minnesota. Personal Communication. December 1994.
Quinn, A. CFSA County Office. Matagorda County, Texas. PersonalCommunication. January 1995.
Roberts, J. CFSA County Office. Union County, Florida. PersonalCommunication. January 1995.
Rogers, Walt. "Turf's Role in Today's Multi-use Landscape Designs." Journalof Environmental Turfgrass. Vol. III, No. 1. Spring 1991. Page 6.
Smith, M. The Ortho Problem Solver. Ortho Information Services. San Ramon,California. Third Edition. 1989.
Turner, T. B. Turfgrass Management Professor. Department of Agronomy. University of Maryland. December 1994.
U.S. Department of Agriculture. Agricultural Stabilization and ConservationService. Disaster Assistance Data Files, 1988-93. Compiled by the GeneralAccounting Office.
U.S. Department of Agriculture. Maryland Department of Agriculture. MarylandTurfgrass Survey 1987. Marketing Service Section. July 1987.
U.S. Department of Commerce. Census of Agriculture, 1987. (Including specialruns requested by USDA, ERS.)
U.S. Department of Commerce. Census of Agriculture, 1992. Various Statereports.
Voigt, T. B. Turfgrass Specialist. Department of Horticulture. Universityof Illinois. Personal Communication. December 1994.
Ward, C. Y. Turf Specialist. Extension Division. Auburn University. Personal Communication. January 1995.
Watschke, Thomas L. "Turfgrasses Can Safely Clean Our Water Supplies."TurfNews. Special issue. Page 18.

65
White, Robert W., J.L. Adrian, and R. Dickens. Alabama's Turfgrass-SodIndustry. Alabama Agricultural Experiment Station. Auburn University. Bulletin 610. March 1991.
Wilkinson, H.T. The Sod Process: An Overview. Unpublished Report. October1988.