
Turbulent velocity, sediment motion and particle...
19
Environ Fluid Mech (2015) 15:633-650 DOI 10.1007/sl0652-014-9358-z ORIGINAL ARTICLE CrossMark rbulent velocity, sediment motion and particle trajectories under breaking tidal bores: simultaneous physical measurements Nazanin Khezri · Hubert Chanson Received: 25 November 2013 I Accepted: 1 May 2014 I Published online: 16 May 2014 © Springer Science+Business Media Dordrecht 2014 Abstract A tidal bore is a hydrodynamic discontinuity propagating upstream in an estuarine zone with a nnel shape as the tide starts rising under spring tidal conditions. The transient sediment motion beneath tidal bores was investigated in laboratory under controlled flow conditions by measuring simultaneously the fluid and sediment particle velocities. Although no sediment transport was observed in the initially steady flow and in undular bores, a transient sheet flow motion was observed beneath the breaking bores. The sediment transport was initiated during the passage of the bore roller toe by the large longitudinal pressure gradient rce, and the sediment particles were subjected to large horizontal accelerations. About 5 % of all particles were accelerated in excess of 1 g. The sediments were advected upstream with an average velocity close to the instantaneous fluid velocity. The time evolution of instantaneous particle velocity for each trajectory was analysed, using the starting point of particle trajectory corresponding to the entrainment point, and the end point to the particle stoppage point. The present data provided some quantitative data in terms of force terms acting on sediment particles beneath a tidal bore and their trajectory characteristics. Keywords Tidal bores · Unsteady bed load motion · Transient sheet flow · Turbulence · Physical modelling · Sediment particle transport · Particle trajectory · Breaking waves 1 Introduction A tidal bore is a hydrodynamic discontinuity propagating upstream in an estuarine zone as the tide starts rising under spring tidal conditions in some funnel shaped river mouths [30]. The existence of the tidal bore is associated with a large tidal range amplified by the estuarine bathymetry and a relatively low river discharge to fulfi l momentum considerations [5,21]. The bore ont is a discontinuity of the pressure velocity fields [36], and the flow discontinuities N. Khezri · H. Chanson (µ) School of Civil Engineering, The University of Queensland, Brisbane, QLD 4072, Australia e-mail: h.chanson@uq.edu.au URL http://www.uq.edu.au/�e2hchans/ � Sprin g er
Transcript of Turbulent velocity, sediment motion and particle...

Environ Fluid Mech (2015) 15:633-650 DOI 10.1007/sl0652-014-9358-z
ORIGINAL ARTICLE
Cross Mark
Turbulent velocity, sediment motion and particle
trajectories under breaking tidal bores: simultaneous
physical measurements
Nazanin Khezri · Hubert Chanson
Received: 25 November 2013 I Accepted: 1 May 2014 I Published online: 16 May 2014 © Springer Science+Business Media Dordrecht 2014
Abstract A tidal bore is a hydrodynamic discontinuity propagating upstream in an estuarine
zone with a funnel shape as the tide starts rising under spring tidal conditions. The transient
sediment motion beneath tidal bores was investigated in laboratory under controlled flow
conditions by measuring simultaneously the fluid and sediment particle velocities. Although
no sediment transport was observed in the initially steady flow and in undular bores, a
transient sheet flow motion was observed beneath the breaking bores. The sediment transport
was initiated during the passage of the bore roller toe by the large longitudinal pressure
gradient force, and the sediment particles were subjected to large horizontal accelerations.
About 5 % of all particles were accelerated in excess of 1 g. The sediments were advected
upstream with an average velocity close to the instantaneous fluid velocity. The time evolution
of instantaneous particle velocity for each trajectory was analysed, using the starting point
of particle trajectory corresponding to the entrainment point, and the end point to the particle
stoppage point. The present data provided some quantitative data in terms of force terms
acting on sediment particles beneath a tidal bore and their trajectory characteristics.
Keywords Tidal bores · Unsteady bed load motion · Transient sheet flow · Turbulence ·
Physical modelling · Sediment particle transport · Particle trajectory · Breaking waves
1 Introduction
A tidal bore is a hydrodynamic discontinuity propagating upstream in an estuarine zone as
the tide starts rising under spring tidal conditions in some funnel shaped river mouths [30].
The existence of the tidal bore is associated with a large tidal range amplified by the estuarine
bathymetry and a relatively low river discharge to fulfil momentum considerations [5,21]. The
bore front is a discontinuity of the pressure velocity fields [36], and the flow discontinuities
N. Khezri · H. Chanson (181)School of Civil Engineering, The University of Queensland, Brisbane, QLD 4072 , Australia e-mail: [email protected] http://www.uq.edu.au/�e2hchans/
� Springer

634 Environ Fluid Mech (2015) 15:633--650
Fig. 1 Photographs of breaking tidal bores. a Tidal bore of the Selune River (France) on 19 October 2008 at Pointe du Grouin du Sud, with bore propagation from right to left. b Tidal bore in the northern channel of the Qiantang River (China) on 6 September 2013 near Daquekou, looking upstream at the incoming breaking bore
in stationary bores were illustrated by Hoyt and Sellin [12], Misra et al. [24] and Chachereau and Chanson [4]. Figures 1 and 2 show some breaking tidal bores in the field (Fig. 1) and in laboratory (Fig. 2). The flow properties immediately in front of and behind the bore are linked by the continuity and momentum principles [6,20]. The shape of the bore is closely associated with its Froude number Fr defined as: Fr = (V0 + U) / (g x A0 /B0 )
112 where V0
is the initial flow velocity positive downstream, U is the bore celerity positive upstream, g is the gravity acceleration, and A0 and B0 are respectively the initial flow cross-section area and free-surface width. For 1 < Fr < 1.3-1.6, the bore is undular and its leading edge is a smooth wave followed by a train of free-surface undulations [ 10, 17, 35]. For larger Froude numbers, a breaking tidal bore is observed with a marked roller extending across the whole channel width (Fig. 1). A related process is the tsunami-induced bore. When a tsunami wave
«£l Springer

Environ Fluid Mech (2015) 15:633-650
Fig. 2 Sediment motion beneath a breaking tidal bore in laboratory-flow conditions: So= 0, Q = 0.050m3;s, d0 = 0.141 m, Fr = 1.4, mobile gravel bed-bore front motion from right to left-sequence of three photographs (5.2 fps) with 0.19 s in between-note the ADV unit (red arrow) located at x = 5 m on the left of the photographs
635
propagates in shallow-water rivers, the process is somehow similar to a tidal bore [7,33]. At a smaller scale, swash-induced bores are commonly observed on beaches.
A number of field observations highlighted the bed erosion and sediment convection induced by the upstream propagation of tidal bores in Alaska, China and France [8, 9, 11 , 32]. A series of laboratory experiments were conducted recently with fixed and mobile bed [1 5, 16]. The velocity measurements during tidal bore propagation showed that both normal Reynolds stresses and turbulent kinetic energy (TKE) were on average 10-30% higher on the mobile bed than on the fixed bed, at the same relative bed elevation for the same Froude number, throughout the entire water column [1 5]. An intense transient sheet flow motion of sliding and rolling particles was observed beneath the breaking roller. The forces acting on particle were estimated, albeit from the mean velocity data [ 16].
In the present study, the instantaneous forces acting on the sediment particles were calculated based upon simultaneous measurements of fluid and particle velocities, which was not
~Springer

636 Environ Fluid Mech (2015) 15:633--650
conducted to date. The aim of this study was to characterise the instantaneous forces acting on the gravel particles during a tidal bore and to ascertain the driving processes. Further the particle trajectory characteristics including the time evolution of instantaneous particle velocity were analysed. After a presentation of the methodology, the basic results are detailed and discussed.
2 Study methodology
2.1 Theoretical considerations
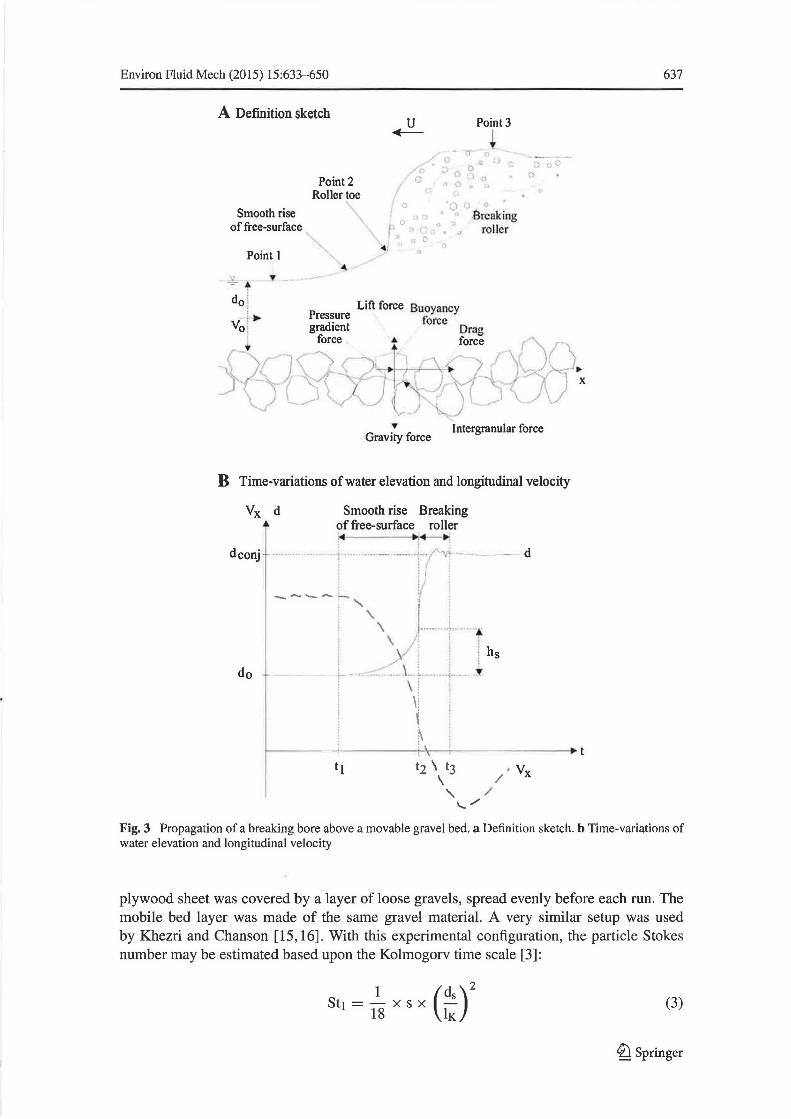
When a bore propagates over a movable bed, the forces acting on each non-cohesive sediment particle encompass the gravity force, the buoyancy force, the drag force, the lift force, the longitudinal pressure gradient, the virtual mass force, the intergranular force resultant, the Magnus force, and the Basset history force (Fig. 3a). For a particle on a horizontal channel bed, Newton's law of motion applied to the single sediment particle in the longitudinal flow direction gives in first approximation:
avs ills X at = Fctrag + Fp + Fvirtual + (Fgrainh + FMagnus + Fsasset (1)
where ms is the individual particle mass, Vs is the horizontal particle velocity component positive downstream. In Eq. (1 ), the forces acting on a particle initially at rest include the drag force Fctrag. the longitudinal pressure gradient force Fp, a virtual mass force Fvirtual, the intergranular force component in the horizontal direction (Fgrain)x and the Basset history force Fsasset. The Basset history force term is small when the particle is initially at rest, and the intergranular force resultant is commonly unknown. The other instantaneous force terms may be estimated as functions of the sediment and fluid flow properties:
avs 1 aP Jr X d3
ills X-=- X Cct X p x(Vx- Vs) X IVx- Vsl X As-- X 6 s at 2 ax (2) ills a(Vx- Vs) + - X Cm X -----s at
where Cct is the drag coefficient, P is the water density, V x is the longitudinal fluid velocity component positive downstream, IV xI is the velocity component magnitude, As is the projected area of particle, aP I axis the longitudinal pressure gradient beneath a tidal bore, X is the longitudinal direction positive downstream, ds is the particle diameter, s is the particle relative density and Cm is an added mass coefficient [16].
Herein the nettotal force (msx 3Vs/at) and each force term listedinEq. (2) were calculated based upon the simultaneous measurements of instantaneous fluid and sediment velocities and instantaneous free-surface elevations. This approach differed from the earlier study of Khezri and Chanson [16] who measured separately the fluid and sediment velocities, thus inferring the force estimates based upon a mean fluid velocity trend, sketched in Fig. 3b.
2.2 Laboratory investigations
New laboratory experiments were conducted in a 12 m long 0.5 m wide flume (Fig. 2). The channel invert was horizontal. The bed consisted of a series of plywood sheets covered by natural blue granite gravels (s = 2.65) sieved between 4.75 and 6.70 mm, glued in resin and covered by a spray gloss surface finish. About x = 5 m, a I m long section of smooth-painted
fl Springer
Environ Fluid Mech (2015) 15:633-650
A Definition sketch u ~
Point3
Smooth rise of free-surface
Point I
J Point 2
Roller toe
/,(g ~ I . 0 .. ,
0 1
.)
Breaking roller
Lift force Buoyancy Pres~ure force gradtent Drag
force • force
() 0 0
0
• Gmvity force
lntergranular force
B Time-variations of water elevation and longitudinal velocity
Vx d Smooth rise Breaking offree-surface roller
do
. ~ ! .................................... -·-- ·i-·
~ J ! i) ' I ---- .... , , L
\/! ~/\ j
~:: - .. - ... \. ; \ l
i \l i '
--- d dconj
t .. -- :.: . j hs
.... L ... _.,
' ~------~--------~~~--------------+t
t2 \ t3 , Vx \ /
" / \... .......
637
Fig. 3 Propagation of a breaking bore above a movable gravel bed. a Definition sketch. b Time-variations of water elevation and longitudinal velocity
plywood sheet was covered by a layer of loose gravels, spread evenly before each run. The mobile bed layer was made of the same gravel material. A very similar setup was used by Khezri and Chanson [15, 16]. With this experimental configuration, the particle Stokes number may be estimated based upon the Kolmogorv time scale [3]:
1 (ldKs)2 Stl =-X s X 18
(3)
fl Springer

638 Environ Fluid Mech (2015) 15:633--650
where s is the relative sediment density and lK is the Kolmogorov length scale. For large particles, Mattioli et al. [22] suggested:
1 (ldKs )4/3 St2 =-X s X 18
(4)
Herein the calculations gave St1 = 4, 700 and St2 = 149 » 1 for which the particles are basically insensitive to the vortex motions and turbulent eddies, while the particles may break the flow eddies [1].
A fast -closing tainter gate was installed at the channel downstream end (x = 11.15 m), where x is the distance from the channel upstream end and positive downstream. The water discharge was supplied by a constant head reservoir and it was measured with an orifice meter designed based upon the British Standards and calibrated on site. The steady flow depths were measured using pointer gauges. The unsteady water depths were recorded non-intrusively using a series of acoustic displacement meters Microsonic™ Mic+25/IU/TC, which were calibrated against the pointer gauges in steady flows. Herein the water depth was measured above the top of the gravel bed using a 25.1 cm2 area semi -circular footing Khezri [ 14].
The instantaneous velocity components were recorded with an acoustic Doppler velocimeter (ADV) Nortek™ Vectrino+ equipped with a side-looking head and located at x=5m. The velocity range was 1.0 rnls and the sampling rate was 200Hz. The translation of the ADV probe in the vertical direction was controlled by a fine adjustment travelling mechanism connected to a Mitutoyo™ digimatic scale unit, with an error of <0.025 mm. For all the measurements, the ADV control volume was located on the channel centreline at relative elevations 0.04 < zld0 < 0.7, where z is the sampling elevation above the bed and d0 the initial flow depth measured at x = 5 m. The post-processing of the ADV signal was limited to a removal of communication errors, although the quality of vertical velocity component V z data was affected by the bed proximity for z < 0.030 m. The sediment particle motion was recorded with a digital HD video camera recorder Sony™ HDR-SR11E/SR12E. Its field of view covered 4.5 < x < 5.5 m. The particle tracking was performed using a frame by frame analysis, for more than 200 particles in about 40 runs. For each experimental run, the video camera and ADV were synchronised mechanically within 0.01-0.05 s. The video image processing was manual to guarantee maximum reliability of the data.
The tidal bore was generated by the rapid closure of the downstream gate. The closure time was between 0.1 and 0.15 sand such a closure time was small enough to have a negligible effect on the bore propagation. For all observations, the initial flow conditions were Q = 0.050m3 js, d0 = 0.140m and V0 = 0.714rnls where Q is the water discharge, and V0
is the initial depth-averaged velocity at x = 5 m. No sediment motion was observed in the initially steady flow. The rapid gate closure generated a tidal bore propagating upstream against the initially steady flow. The bore characteristics were controlled by the gate opening after closure, thus enabling to generate either undular or breaking bores. The simultaneous fluid velocity and sediment motion video recordings were conducted about x = 5 m (i.e. 6.15 m upstream of gate) for a breaking bore, for which the bore celerity was U ~ 0.84 rnls, corresponding to a Froude number (V0 + U) / (g x d0 )
112 = 1.3-1.4. The upstream motion of the bore roller was followed in terms of three characteristic free-surface features, called Points 1, 2 and 3 sketched in Fig. 3. Point 1 referred to the start of the upstream rise in freesurface elevation ahead of the roller, Point 2 was the roller toe or impingement point, and Point 3 corresponded to the maximum surface elevation of the roller (Fig. 3a).
f1 Springer

Environ Fluid Mech (2015) 15:633-650 639
3 Results
3.1 Basic results
Some visual observations were conducted for the same identical initial flow conditions with a range of tidal bores for 1.1 < Fr < 1.5. No sediment motion was seen during the initially steady flow motion nor during the upstream propagation of undular bores (Fr < 1.3). In the breaking tidal bores (Fr > 1.35), a large number of gravel particles were set into motion and advected upstream behind the bore (Fig. 2). Figure 2 presents three photographs during the breaking bore passage at x = 5 m, with 0.19 s between each photograph. The transient sediment motion took place primarily in the form of a sheet flow with bed load transport, as reported by Khezri and Chanson [16]. However, the visual observations highlighted a broad range of upstream sediment motion patterns, ranging from particles with almost no motion to a few saltating gravel particles subjected to some high initial acceleration. Figure 4a, b shows the longitudinal free-surface profile of a breaking bore and the time-variation of the longitudinal velocity data next to the bed (z/d0 = 0.041) at x = 5 m. The former was deduced from the video observations while the latter was measured with the ADV system. Both graphs include the instantaneous measurements and ensemble-averaged median data (Fig. 4a, b). The visual observations showed that the onset of sediment motion was associated primarily, although not always, with the passage of the roller toe (Point 2, Fig. 3). The fluid velocity data indicated a rapid flow deceleration during the bore passage, with a transient fluid recirculation next to the bed (Figs. 3b, 4b). The latter is clearly seen in Fig. 4b with negative longitudinal velocity data for 0 < t - 12 < 3 s where t2 is the absolute time of passage of roller toe above the ADV sampling volume.
The sediment particle trajectories were recorded for each experimental run. Figure 4c shows five trajectories (from start to stop) together with the location of the bore characteristic points (Points 1 to 3, Fig. 3a). Two main types of particle trajectories were observed: (a) some particles were advected rapidly upstream (particles A and C, Fig. 4c), and (b) others were displaced upstream at a lower speed (particles B and E, Fig.4c). Within the experimental flow conditions, the notion of rapid upstream advection would correspond to particles moving at speeds >0.1 m/s. The properties of the sediment particle motion were recorded, including in terms of the maximum and mean gravel particle velocities, maximum acceleration and travel duration. The maximum accelerations of the particles during the bore passage are presented in Fig. 4d. The median maximum acceleration was about 0.5 g, and about 5 % of all particles were subjected to a maximum horizontal acceleration > 1 g. The maximum accelerations were found to occur mostly immediately after the bore toe (t - t2 > 0) with t = t2 corresponding to the roller toe passage (Point 2) as illustrated in Fig. 4c.
The duration of sediment gravel motion was brief during the bore passage and the data are presented in Fig. 5a. About 80% of particle trajectories lasted <0.3 s. The particle average and maximum velocities during the passage of the bore are summarised in Fig. 5b, c. The particle velocities were on average (Vs)mean ~ -0.11 m/s (i.e. (Vs)mean/U ~ -0.13), with the negative sign reAecting the upstream motion of the sediment particles and V being the bore celerity. The maximum particles velocities were -0.21 m/son average, reaching values up to (Vs)max ~ -0.6 m/s (i.e. (Vs)max/U ~ -0.71), larger in amplitude than the transient fluid recirculation. For comparison, the transient negative fluid velocities observed close to the bed were: V x/U ~ -0.25 to -0.45 at z/d0 = 0.08. That is, the transient (negative) fluid and particle velocities were of comparable magnitude.
~Springer

640
0.2 -0.001 g ~
~ et
0.15 -0.002 Cl..
0.1 -0.003 -0.05 0 0.05 0.1 0.15 0.2
x-xz (m)
c 42.8
42.7
42.6
~ 42.5 ~
42.4
42.3
42.2 Point 1
42.1 4.88 4.92 4.96 5 5.04 5.08
x (m)
B
,.-.. en
5 ><
>
D
0.8
0.6
0.4
0.2
0
-0.2
-0.4
-0.6
1.5
0.5
Environ Fluid Mech (2015) 15:633--650
-5 -4 -3 -2
,. T ,.
-1 0 1 2 3 4 5
t-tz (s)
,. ,.
o ~~~~~~~~~~~~
-0.15 -0.05 0.05 0.15 0.25 0.35 0.45
t-tz (s)
Fig. 4 Flow properties and sediment motion beneath a breaking tidal bore-flow conditions: S0 = 0, Q = 0.05 m3 js, d0 = 0.14m, V0 = 0.71 m/s, U = 0.84m/s, Fr = 1.4, x = 5 m, movable boundary bed. a (left) Instantaneous and mean free-surface profile and longitudinal pressure gradient force . b (right) Time-variation of the longitudinal velocity component at z/d0 = 0.041. c (left) Sediment particle trajectories as function of time for an experimental run. d (right) Maximum sediment particle acceleration as a function of the relative bore passage time
3.2 Forces acting on sediment particles
The instantaneous forces acting on the sediment particles were estimated based upon the simultaneous measurements of the free-surface properties, instantaneous velocity components next to the bed and instantaneous particle velocity. While the net force (F = ms x a) acting on each particle, where a = 3Vs/3t is the particle acceleration, was estimated as in Khezri and Chanson [16], the drag and virtual mass force terms were calculated using the instantaneous velocities. The novel contribution herein was the larger data set together with the calculation of the instantaneous forces based upon the instantaneous velocity data. The longitudinal pressure gradient force was deduced from the bore free-surface profile assuming hydrostatic pressure distributions. For completeness, the Boussinesq equation was tested to account for the free-surface curvature following Montes and Chanson [25], and the results showed <5% difference from the hydrostatic pressure estimates at the channel bed.
The time-variation of the pressure gradient force is presented in Figs. 4a and 6, highlighting the large longitudinal pressure force at the roller toe (Point 2). Figure 6 shows the
tfl Springer

Environ Fluid Mech (2015) 15:633--650
A
ll. Q Jl...
c
0.5
0.45
0.4
0.35
0.3
0.25
0.2
0.15
0.1
0.05
0
0.2
0.15
0.1
0.05
Mean-0.21 s, Std-0.07 s
37.6%
0 0.05 0.1 0.15 0.2 0.25 0.3 0.35 0.4 0.45
Duration of particle motion (s)
Mean=0.21 m/s, Std=0.13 m/s
o~~~._._._._~~~~~~
0 0.1 0.2 0.3 0.4 0.5 0.6
Maximum particle velocity (m/s)
641
B Mean-0.11 m/s, Std-0.08 m/s
0.4
r------1
0.3 34.1%
ll. ~ Q 27.9% Jl...
L 0.2
0.1
6.2% o~--~~~~~~~~--~
0 0.05 0.1 0.15 0.2 0.25 0.3
Average particle velocity (m/s)
D Mean=4.45 rnls2, Std=3.07 m/s2
0.25
0.2
ll. ~ 0.15
0.1
0.05
o~._~-L~~~._~~_.~
0 I 2 3 4 5 6 7 8 910
Maximum acceleration of particles (rnls 2)
Fig. 5 Sediment particle motion properties beneath a breaking tidal bore-flow conditions: S0 = 0, Q = 0.05 m3 /s, d0 = 0.14 m, V0 = 0.71 m/s, U = 0.84 m/s, Fr = 1.4, x = 4.5-5.5 m movable boundary bed. a (left) Particle motion duration. b (right) average particle velocity-(V s)mean. c (left) Maximum instantaneous particle ve1ocity-(V s)maK· d (right) Maximum particle acceleration-amaK
instantaneous forces acting on two particles during a same run, with t- t2 = 0 corresponding to the moment when the bore roller toe passed right above the particle. The fluid velocity measurements were synchronised with the video recording, the ADV head being located on the gravel bed with the sampling volume: i.e., z = 5.8 mm above the bed, compared to the median particle size d8 ~ 5. 7 mm.
The full results are summarised in Fig. 7 for more than 200 particles, and a line of best fit was added in Fig. 7a, b. The longitudinal pressure force induced the dominant force term during the bore roller toe passage (Fig. 7) and was mostly responsible for the onset of bed load motion. During the bore passage, the net force was negative before tending to positive values leading to the particle motion stoppage (Fig. 7a). The instantaneous virtual mass force term was non negligible (Fig. 7b). For a majority of particles, the instantaneous drag force was negative during the transient flow recirculation, adding to the pressure gradient force, although for a short duration (Fig. 7c). For a very small number of particles, a relatively large positive drag force was observed, opposing the sediment particle movement (Fig. 7d).
<fl Springer

642
,_.__ z '--' (I) (.) .... 0 ~
- - -• - - F=-m.a - - - Pressure ---e- Drag - - -o- - - Virtual mass
0.001
I 0.0005
0
-0.0005
-0.001
-~ \? : ~ .. ~
-
-----. .. - . ...... ~.r·~ - , '·V -I ,_. I ' ' ,;·
- ~ -I ,. .. ' •'
-0.0015 - , -• -0.002
-0.25 0
t-tz (s)
0.25
,_.__
6 (I) (.) .... &
Environ FluidMech (2015) 15:633--650
-- -· - - F=-m.a - - - Pressure ---e- Drag - - -o- - - Virtual mass
0.001
' 0.0005 1- -
• ,...
' .. -. 0
-0.0005
-----. .. -. ...... ~ •. ' • I ~ / ' ·.{) .
1- , . ' -I
. ' . ' -0.001
-0.0015
' w 1- I -
' t\ 1- -
-0.002 li -0.25 0
t-tz (s)
0.25
Fig. 6 Instantaneous net, pressure gradient, drag and virtual mass forces acting on a sediment particle beneath a breaking tidal bore tor two particles during the same experimental run-flow conditions: S0 = 0, Q = 0.05 m3 fs, d0 = 0.14m, V0 = 0.71 rn/s, U = 0.84rn/s, Fr = 1.4, x = 4.5-5.5m, movable boundary bed
4 Sediment motion and particle velocities
The present data set provided further detailed information on the particle trajectories and diffusion in a rapidly varied flow corresponding to the upstream propagation of a breaking bore over a mobile gravel bed. In total 132 complete particle trajectories were selected and analysed. The data gave some quantitative information on the particle trajectory duration and length, the instantaneous particle velocity and the maximum particle horizontal acceleration. The statistics are summarised in Table 1. The bed particle trajectories were measured with different start point (Xstart) and starting time (Tstard· A first step in the analysis was to shift the trajectories in the x-direction such that all trajectories started from the same point of release (Fig. 8a). The cloud of relative trajectories is shown in Fig. 8a and resembles that for well-established diffusion cases, at least fort- Tstart < 0.25 s. This qualitative observation is confirmed in Fig. 8c where the variance of particle coordinate varied with (t- Tstart) 1.4 1. In a steady flow, such an exponent would correspond to ballistic particle trajectories, compared to an exponent of 0.5 for normal (Gaussian) diffusion [28]. The higher moments, skewness and excess kurtosis, are shown also in Fig. 8c. The data in Fig. 8c significantly deviate from Gaussian values for the entire trajectory duration.
The dispersion and diffusivity of particles were estimated. All the results were expressed in terms of the relative trajectory timet' = t - Tstart· The absolute longitudinal dispersion was calculated as [ 18]:
1 N D(t') = N x ~ (xi(t')- x(t'))
2
l=!
(5)
where D is the absolute dispersion at time t', N is the number of particles at the relative time t' and x is the ensemble average at time t'. Thus the absolute longitudinal dispersion equals the variance of the data sample, and the data are reported in Fig. 9a. Note that the data trend exhibited a sharp drop when the number of particles at timet' dropped below 15. The absolute dispersion of single particles showed a non linear growth without intermediate phase. D varied with time as t' L41 which tended to correspond to a 'ballistic' regime (D ex t'2)
~Springer

Environ Fluid Mech (2015) 15:633-650
A
,-...., 1.0 -('<)
"' "C:I X ~ X OJ) X a. X ,-...., .-
I m '-" '-" -~
c
,-..., \Cl
--<'"> "' "Cl
X ~ X 01) X a. X ,-..., -I <I)
2
0
-1
-2 -1.5
~ -1 ~
a
D -mxa (All) Pressure force
0 a...,
QO
a a a
0 a
-0.5 0.5 1.5 2.5
(t-t2)x(g/d0 )0·5
D Drag force (97%) --- Pressure force
"
3.5
0
0
a
-2~--_.--~~~--._--~----~
-1.5 -0.5 0.5 1.5 2.5 3.5
(t-tz)x(g/d0 )0·5
B 2
,-..., \Cl
---<'"> "' "Cl
X ~ X b!l X 0 a. X ,-..., -I <I) ..._,
-I ..._, ---~
-2 -1.5
D 5
4 ,-..., \Cl
---<'">"' 3 "Cl X
~ 2 b!l X a. X ,-..., -I
~ 0 ..._, r:l:;
-I
-2
f-
f-
f-
f-
f-
-1
643
D Virtual mass force (All) Pressure force
a a
cc a a a a
c 'h r:P c a
a
a
-0.5 0.5 1.5 2.5 3.5
(t-t2)x(g/d0 )0·5
D Drag force (3%) Pressure force
I l e I
-0
a -a
c c c
0 -c -c
a 0 a
c - v--" 0 ° c " a a
• -0 a
a a
I I I I
0 1 2 3 4 5
(t-tz)x(g/d0 )0·5
Fig. 7 Instantaneous dimension1ess forces acting on each sediment particle beneath a breaking tidal boreflow conditions: S0 = 0, Q = 0.05 m3/s, d0 = 0.14 m, V0 = 0.71 m/s, U = 0.84 m/s, Fr = 1.4, x = 4.5-5.5 m, movable boundary bed. (a, Left) Net force: data and best fit line. (b, Right) Virtual mass. (c, Left) Drag force for 97% of particles. (d, Right) Drag force for 3% of particles
in steady and pseudo-steady flows (Fig. 9a) [29]. The present analysis was however limited to relatively short particle travel times, as the number of particles in motion dropped sharply for t' > 0.2 s (Fig. 8a). The absolute diffusivity grew non linearly with time: K ex t'2·1 for t' < 0.2 s. Note however that the notion of absolute dispersion requires a relatively long dispersion time [31] which might not be met in the present study.
The relative dispersion of particle pairs was estimated as:
(6)
~Springer

644 Environ Fluid Mech (2015) 15:633--650
A 7.5
B 0
7 0 0
I I -0.8 6.5 0 0 g
0 6 -1.6 8 3 0 0 5.5 0 § 5
-2.4 0 0 § ..--._ ~ 9 0 ..--._ 0 0
i 0 s ~ -3.2
0
~ u 4.5 0 0 0 0 '-' 4 a t:: 8 s 0 "0 0
" -4 0 5 3.5 ~ 0 d.) 0 0
~ 0 :X: 0 ~ 3 8 $ I -4.8 ~ I a :< 0 :< 0 § 0 0
2.5 s
I I I 0 -5.6
2 0 0 0
0 1.5 I -6.4 0
1 § 0 0 0 -7.2 0
0.5 0 -8
0 0.05 0.1 0.15 0.2 0.25 0.3 0.35 0.4 0.45 -0.45 -0.375 -0.3 -0.225 -0.15 -0.075 0
t-Tstart (s) t-Tend(s)
c D -~ 4 -~ 4 CJ)
0 --Std2 CJ)
--Std2 t:: g ::I 3.5 -- Skewness ] 3.5 - - Skewncs.~ ~ ------ Kurtosis - - - - - - Kurtosis
CJ) CJ) CJ) CJ) d) 3 d) 3 u u :< :< Ill Ill
"' 2.5 .· 2.5 "' CJ) CJ) d) d) = 2 = 2 ~ ..
~ d) ] ~ Cl)
1.5 Cl) 1.5 ..--._ ~
.......... ~ '"" /'\ : '"" / \ 8 s ~
.-~ ~ N
'"" ~ 0.5 ";< 0.5 .:9 I
~ "0
" d.) I 0 ~ 0 :< ;:o 0 0.05 0.1 0.15 0.2 0.25 0.3 0.35 0.4 'B 0 0.05 0.1 0.15 0.2 0.25 0.3 0.35 0.4
c/5 Cl)
t-Tstart (s) Tend-t (s)
Fig. 8 Particle trajectories beneath a breaking tidal bore-flow conditions: S0 = 0, Q = 0.05 m3 js, d0 = 0.14m, V0 = 0.71 rnls, U = 0.84m/s, Fr = 1.4, x = 4.5-5.5 m, movable boundary bed. (a, Left) X-Xstart = f(t-Tstart). (b, Right) X-Xend = f(t-Tend). (c, Left) Time variations of second-order, third order and fourth order moments of particle positions X-Xstart = f(t-Tstart). (d, Right) Time variations of second-order, third order and fourth order moments of particle positions Xend - X = f(Tend - t)
where M is the number of pairs and (xi - Xj) represents the separation between two particles at time t'. The relative diffusivity is defined as:
1 anC2) (t') K(2)(t') = - X ---
2 at' (7)
The data are reported in Fig. 9b. Herein the calculations were conducted based upon the particle trajectories relative to the starting point, and they were restricted to sediment particle pairs which travelled together for a minimum of four time steps (i.e. 0.16s or more). The relative dispersion data indicated a non linear growth about D(2) <X t' 3 for t' < 0.25 s (Fig. 9b ). The findings differed substantially from long term oceanic and wave data [18, 31]. The relative diffusivity increased non linearly with time: K(2) <X t'2·1 fort' < 0.2 s. The results might suggest an enstrophy cascade, observed for example in geophysical flows [19,26].
<f:l Springer

Environ Fluid Mech (2015) 15:633-650
,....._ N a
(..) .._, s:: 0 ...... 00
'"' <!)
0... 00 :.a <!) .... ~ -0 00
.D ~
A Absolute longitudinal dispersion and diffusivity of
single particles
---a-- Absolute dispersion - - Absolute diffusivity
2
1.5
0.5
75
60
45
30
15
0 ~~._--~--~--_.--~----~--~--~o 0 0.05 0.1 0.15 0.2 0.25 0.3 0.35 0.4
t-Tstan (s)
B Relative longitudinal dispersion and diffusivity for particle
pairs beneath a breaking tidal bore with 90% confidence
limits for the dispersion
,....._ N
6
E 5 (..) .._,
---a-- Relative dispersion - - Relative diffusivity
\
\ \ \
0 -30 0 0.05 0.1 0.15 0.2 0.25 0.3 0.35 0.4
t-Tstart (s)
645
Fig. 9 Time-variations of longitudinal dispersion and diffusivity of sediment particles beneath a breaking tidal bore-flow conditions: S0 = 0, Q = 0.05 m3 js, d0 = 0.14 m, V0 = 0.71 m/s, U = 0.84 m/s, Fr = 1.4, x = 4.5-5.5 m, movable boundary bed. a Absolute longitudinal dispersion and diffusivity of single particles. b Relative longitudinal dispersion and diffusivity for particle pairs beneath a breaking tidal bore with 90% confidence limits for the dispersion
~Springer

646 Environ Fluid Mech (2015) 15:633--650
'fodi.Jie 1 Betl parlicle Lrajeclury, velucily autl acceleraliuu slalislics-nuw cuutliliuus: S0 = 0, Q = 0.05 m3 js, d0 = 0.14 m, V0 = 0.71 rn/s, U = 0.84 rn/s, Fr = 1.4, breaking tidal bore, x = 4 .5-5.5 m movable boundary bed
Parameter Mean Median Standard deviation Skewness Excess kurtosis (1) (2) (3) (4) (5) (6)
Tstart - tz (s) 0.0133 0.0067 0.0671 0.3089 -0.5256
Trajectory duration (s) 0.208 0.200 0.070 0.756 0.510
Trajectory length Ls (m) 0.0150 0.0116 0.0110 2.06 5.71
Instantaneous velocity IV sI (rn/s)a 0.0893 0.0732 0.0651 1.65 3.59
Maximum acceleration lamax I 2.64 2.26 1.46 1.475 2.80 (per trajectory) (rnls2)a
tz: Absolute time of passage of roller toe above particle a Particle velocity and acceleration amplitude positive upstream
The instantaneous particle trajectory data set provided some detailed information on the particle velocity statistics (Table 1; Fig. 1 Oa). Figure 1 Oa shows that the PDF of instantaneous particle velocities were skewed to the right (positive skewness). A statistical summary is included in Table 1. The histogram of particle trajectory length is shown in Fig. lOb. The data were skewed towards longer trajectory lengths and the mean value was slightly larger than the most probable value. On average the mean particle trajectory length was about 2.6 median particle sizes, but the data indicated trajectory lengths ranging from <0.5 x ds up to 13 x ds. In the rapidly varied unsteady flow, the particle motion was drastically shorter than observations of bed load motion in steady flows (e.g. [29]).
5 Discussion
The visual observations suggested that some particles were lifted up at the onset of motion before the bed load motion. The lift force on a sediment particle was estimated herein as:
(8)
where the lift coefficient was calculated following Mei [23] (see also [13]). The results indicated that the ratio of lift to relative weight forces was about 0.24 during the steady flow conditions and decreased towards <0.05 during the bore roller propagation. Simply the lift force could not counterbalance the particle's submerged weight. In turn, it is believed that the apparent upward motion of some particles was likely caused by some intergrannular reaction force when the particles were dislodged.
Altogether the present data indicated that the combination of pressure gradient and drag force terms contributed primarily to the sediment sheet flow motion. The finding was validated with over 400 particles, including the data set of Khezri and Chanson [16]. The sediment movements were mostly a transient bed load motion, of relatively short duration, and the instantaneous lift force estimates did not support the occurrence of particle saltation. The gravel particle motion was characterised by large maximum horizontal accelerations (Fig. 5d). At the same time, some distinctive differences were observed between the present study and that of Khezri and Chanson [16] which was limited by some average velocity estimate. In particular the present data indicated that the virtual mass force term was non negligible .
.fl Springer

Environ Fluid Mech (2015) 15:633-650
Fig. 10 Sediment particle velocity and trajectory length PDFs beneath a breaking tidal bore. a PDF of instantaneous particle velocities (positive upstream). b PDF of particle trajectory lengths
~ Cl ~
~ Q ~
A
0.09
0.08 t-
0.07 t-
0.06 t-
0.05 t-
0.04 t-
0.03 t-
0.02
0.01
0 0
0.16
0.14
0.12
0.1
0.08
0.06
0.04
0.02
647
PDF of instantaneous particle velocities (positive upstream)
I I I I I I
---
----
~ -
Jbn _1:
0.05 0.1 0.15 0.2 0.25 0.3 0.35 0.4
IV5l (m/s)
B PDF of particle trajectory lengths
10 20 30 40 50 60 70 80
Ls (mm)
Although the particle-particle collisions were not recorded, the inter-granular force magnitude was deduced from Newton's law of motion applied to individual particles and by testing the validity ofEq. (2). The present findings suggested that the effects of inter-granular forces were possibly the most relevant at the onset of particle motion and during the particle motion stoppage. Focusing on the motion stoppage, the particle trajectories were analysed relative to the end point (Xend) and end time (Tend). The cloud of shifted trajectories is shown in Fig. 8b, and the statistical data of particle coordinate are summarised in Fig. 8d. The variance of particle coordinate varied with (Tend- t)I.OS for Tend- t < 0.2 s.
~Springer

648 Environ Fluid Mech (2015) 15:633--650
6 Conclusion
The transient sediment transport beneath a breaking bore was investigated in laboratory by measuring simultaneously the fluid and sediment motion. The study considered a tidal bore propagating upstream against an initially steady flow with a movable bed consisting of non-cohesive gravel materials, and the findings may be relevant to breaking waves in the swash. There was no sediment transport observed during the initially steady flow, and no gravel motion was recorded beneath undular bores. On the other hand, a characteristic transient sheet flow motion was observed beneath the breaking bores. The data showed that the sediment notion was initiated during the passage of the roller toe, when the discontinuity of the free-surface slope induced a large longitudinal pressure gradient force.
During the laboratory experiments, the free-surface properties, and fluid and sediment velocities, were recorded simultaneously. The particles were subjected to large horizontal accelerations, with 5 % of particles subjected to maximum accelerations larger than 1 g. The particles were advected upstream with an average velocity magnitude comparable to the instantaneous fluid velocity. The analysis of the evolution of ensemble-averaged particle velocity from entrainment onwards, and close to stoppage, indicated that the particle motion for short time scales included two highly unsteady phases corresponding to onset of motion and stoppage. The duration of the acceleration phase and deceleration phase differed between different particles. Some particles were accelerated/decelerated just at the very beginning/end, while others were accelerated/decelerated over a longer period. Beneath the breaking bore, the sediment transport was caused by the longitudinal pressure gradient force complemented by a drag force term during the transient fluid recirculation, although the entire sheet flow motion was brief. The intergrannular forces played possibly a dominant role during the particle motion onset and stoppage.
The present study complemented the earlier study of Khezri and Chanson [16], demonstrating the potential for tidal bores to scour the channel bed and to advect upstream the sediments in a natural estuarine system. The present data provided some quantitative data in terms of various force terms acting on sediment particles beneath a tidal bore. The findings were consistent with a few prototype observations in tidal bores showing that the arrival of the bore front is associated with intense bed material mixing and upstream sediment advection behind the bore front [8, 9,27,32,34]. Future research should consider the effects of bed morphology [2] and take into account the sediment suspension transport.
Acknowledgments The authors thank an anonymous reviewer as well as Dr Pierre Lubin (University of Bordeaux, France) for their helpful comments and advice. They acknowledge the technical assistance of Graham Illidgc, Ahmed lbrahim and Jason Van Der Gevel (The University of Queensland), and the financial support of the University of Queensland and Agence Nationale de la Recherche (Project MASCARET 10-BLAN-0911-01).
References
1. Azimi AH, Zhu DZ, Rajaratnam N (2012) Computational investigation of vertical slurry jets in water. Int J Multiph Flow 47 :94-114
2. Brocchini M (2013) Bore-generated macrovortices on erodible beds. J Fluid Mech 734:486-508 3. Calzavarini E, van der Berg TH, Toschi F, Lohse D (2008) Quantifying micro bubble clustering in turbulent
flow from single-point measurements. Phys Fluids 20(4):040702. doi:10.1063/l.29ll036 4. Chachereau Y, Chanson H (2011) Free surface fluctuations and turbulence in hydraulic jumps. Exp
Thermal Fluid Sci 35(6):896-909. doi:lO.l 016/j.expthermflusci.2011.01.009
.fl Springer

Environ Fluid Mech (2015) 15:633-650 649
5. Chanson H (2011) Tidal Bores, Aegir, Eagre, Mascaret, Pororoca: theory and observations. World Scientific, Singapore
6. Chanson H (2012) Momentum considerations in hydraulic jumps and bores. J Irrig Drain Eng ASCE 138(4):382-385. doi: 10.1061/(ASCE)IR.l943-4774.0000409
7. Chanson H, Lubin P (2013) Mixing and sediment processes induced by Tsunamis propagating upriver in Tsunamis: economic impact, disaster management and future challenges. Nova Science Publishers, Hauppauge NY, USA, T Cai (ed), Chapter 3, pp 65-102
8. Chanson H, Reungoat D, Simon B, Lubin P (2011) High-frequency turbulence and suspended sediment concentration measurements in the Garonne River Tidal Bore. Estuar Coast Shelf Sci 95(2-3):298-306. doi: IO. I016/j .ecss.20ll.09.0\2
9. Chen J, Liu C, Zhang Ch, Walker HJ (1990) Geomorphological development and sedimentation in Qiantang Estuary and Hangzhou Bay. J Coast Res 6(3):559-572
I 0. Favre H ( 1935) Etude Theorique et Experimentale des Ondes de Translation dans les Canaux Decouverts. ('Theoretical and Experimental Study of Travelling Surges in Open Channels'.) Dunod, Paris, France (in French)
11. Greb SF, Archer AW (2007) Soft-sediment deformation produced by Tides in a Meizoseismic Area, Tumagain Arm, Alaska. Geology 35(5):435-438
12. Hoyt JW, Sellin RHJ (1989) Hydraulic jump as 'mixing layer'. J Hydraul Eng ASCE 115(12): 1607-1614 13. Jang JH, Ho H-Y, Yen C-L (2011) Effects of lifting force on bed topography and bed-surface sediment size
in channel bend. J Hydraul Eng ASCE 137(9):911-920. doi: I 0. 1061/(ASCE)HY.\943-7900.0000402 14. Khezri N (2014) Modelling turbulent mixing and sediment process beneath Tidal Bores: physical and
numerical investigations. Ph.D. thesis, School of Civil Engineering, The University of Queensland, Brisbane, Australia
15. Khezri N, Chanson H (2012) Undular and breaking tidal bores on fixed and movable gravel beds. J Hydraul Res IAHR 50(4):353-363. doi: l0.1080/00221686.2012.686200
16. Khezri N, Chanson H (2012) Inception of bed load motion beneath a bore. Geomorphology, voll53-154, pp 39-47 and 2 video movies. doi:l 0.1016/j.geomorph.2012.02.006
17. Koch C, Chanson H (2008) Turbulent mixing beneath an undular bore front. J Coast Res 24(4):999-1007. doi: 10.2112/06-0688.1
18. Lacasce JH, Bower A (2000) Relative dispersion in the subsurface North Atlantic. J Mar Res 58:863-894 19. Lacasce JH, Ohlmann C (2003) Relative dispersion at the surface of the Gulf of Mexico. J Mar Res
61:285-312 20. Liggett JA (1994) Fluid Mechanics. McGraw-Hill, New York, USA 21. Lighthill J (1978) Waves in fluids. Cambridge University Press, Cambridge 22. Mattioli M, Alsina JM, Mancinelli A, Miozzi M, Brocchini M (2012) Experimental investigation of the
nearbed dynamics around a submarine pipeline laying in different types of seabed: the interaction between turbulent structures and particles. Adv Water Resour 48:31-46
23. Mei R (1992) Approximate expression for the shear lift force on a spherical particle at finite Reynolds number. Int J Multiph Flow 18(1):145-147
24. Misra SK, Kirby JT, Brocchini M, Veron F, Thomas M, Kambhamettu C (2008) The mean and turbulent flow structure of a weak hydraulic jump. Phys Fluids 20(3), Paper 035106
25. Montes JS, Chanson H (1998) Characteristics of undular hydraulic jumps. Results and calculations. J Hydraul Eng ASCE 124(2):192-205
26. More) P, Larcheveque M (1974) Relative dispersion of constant-level balloons in the 200-mb general circulation. J Atmos Sci 31:2189-2196
27. Mouaze D, Chanson H, Simon B (2010) Field measurements in the Tidal Bore of the Selune River in the Bay of Mont Saint Michel (September 201 0). Hydraulic model report no. CH8l/10, School of Civil Engineering, The University of Queensland, Brisbane, Australia
28. Nikora V, Head J, Goring D, McEwan I (2001) Diffusion of saltating particles in unidirectional water flow over a rough granular bed. J Phys A Math General 34:L743-L749. doi: l0.1088/0305-4470/34/50/ 103
29. Nikora V, Habersack H, Huber T, McEwan I (2002) On bed particle diffusion in gravel bed flows under weak bed load. Water Resour Res vol 38, no. 6, Paper 1081. doi: 10.1029/200 I WR000513
30. Peregrine DH (1966) Calculations of the development of an undular bore. J Fluid Mech 25:321-330 31. Piattella A, Brocchini M, Mancinelli A (2006) Topographically controlled, breaking-wave-induced
macrovortices. Part 3. The mixing features. J Fluid Mech 559:81-106 32. Reungoal D, Chanson H, Caplain B (20\4) Sediment processes and 11ow reversal in the undularTidal Bore
of the Garonne River (France). Environ Fluid Mech, vol20. doi: 10.1007/sl0652-013-9319-y. (Online first)
.fl Springer
650 Environ Fluid Mech (20 15) 15:633-650
33. Tanaka N, Yagisawa J, Yasuda S (2012) Characteristics of damage due to Tsunami propagation in River channels and overflow of their embankments in Great East Japan earthquake. Int J River Basin Manag 1 0(3):269-279
34. Tessier B, Terwindt JHJ (1994) An example of soft-sediment deformations in an intertidal environmentthe effect of a Tidal Bore. Comptes-Rendus de 1' Academie des Sciences, Serie II, vol 319, no. 2. Part 2, pp 217-233 (in French)
35. Treske A (1994) Undular bores (favre-waves) in open channels-experimental studies. J Hydraul Res IAHR 32(3):355-370
36. Tricker RAR (1965) Bores, breakers, waves and wakes. American Elsevier, New York
<iJ Springer

Environ Fluid Mech (2015) 15:651 DOl 10.1007/s10652-014-9360-5
ERRATUM
Erratum to: Thrbulent velocity, sediment motion and particle trajectories under breaking tidal bores: simultaneous physical measurements
Nazanin Khezri · Hubert Chanson
Published online: 3 June 2014 ©Springer Science+ Business Media Dordrecht 2014
Erratum to: Environ Fluid Mech DOl 10.1007/s10652-014-9358-z
CrossMark
Unfortunately, in the original publication of this article the first author's last name was wrongly captured as Khzeri where it should be Khezri.
The online version of the original article can be found under doi: 10.1007 Is 10652-0 14-9358-z.
N. Khezri · H. Chanson (18:1) School of Civil Engineering, The University of Queensland, Brisbane, QLD 4072, Australia e-mail: [email protected] URL: http://www.uq.edu.au/~e2hchans/
~Springer


![Energy dissipation, flow resistance and gas-liquid ...staff.civil.uq.edu.au/h.chanson/reprints/efm_09d.pdf · Skimming flows are highly aerated [16,30,34]. Through the air–water](https://static.fdocuments.us/doc/165x107/5f5d690d25bc59587928adf8/energy-dissipation-iow-resistance-and-gas-liquid-staffciviluqeduauhchansonreprintsefm09dpdf.jpg)


![Phase-detection probe measurements in high-velocity free ...staff.civil.uq.edu.au/h.chanson/reprints/Felder_Chanson_etfs_2015.pdf · [42], Neal and Bankoff [43]. Such probes have](https://static.fdocuments.us/doc/165x107/5f806c97f3a8d879526dfc54/phase-detection-probe-measurements-in-high-velocity-free-staffciviluqeduauhchansonreprintsfelderchansonetfs2015pdf.jpg)


