Turbulence-induced measurement errors in coherent differential absorption lidar ground systems
7
Turbulence-induced measurement errors in coherent differential absorption lidar ground systems Aniceto Belmonte The presence of atmospheric refractive turbulence makes it necessary to use simulations of beam propa- gation to examine the uncertainty added to the differential absorption lidar (DIAL) measurement process of a practical heterodyne lidar. The inherent statistic uncertainty of coherent return fluctuations in ground lidar systems profiling the atmosphere along slant paths with large elevation angles translates into a lessening of accuracy and sensitivity of any practical DIAL measurement. This technique opens the door to consider realistic, nonuniform atmospheric conditions for any DIAL instrument configuration. © 2006 Optical Society of America OCIS codes: 010.3640, 280.1910, 010.1330, 010.1290, 030.6600. 1. Introduction Simulations of beam propagation in three-dimensional random media were used to study the effects of atmo- spheric refractive turbulence on coherent lidar perfor- mance. The approach provided the tools for analyzing laser radar with general refractive turbulence con- ditions, beam truncation at the telescope aperture, beam-angle misalignment, and realistic transmitter and receiver configurations. The simulation permitted characterization of the heterodyne optical power 1 as well as the effect on lidar performance of the ana- lytically intractable return variance from turbulent fluctuations. 2 The standard simulation technique, in which the atmosphere is modeled as a set of two- dimensional Gaussian random phase screens, 3,4 pro- vided the tools for analyzing heterodyne lidars with general turbulence conditions and arbitrary instru- ment setup. In a first round of simulated measurements, I con- sidered the lidar directed horizontally so it was pos- sible to assume uniform turbulence with range. Most of the time, however, heterodyne lidars are aimed to profile the atmosphere parameters at altitudes well above the atmospheric layer adjacent to the underly- ing surface. Now, the simulation techniques have been extended to the consideration of those nonuni- form turbulence conditions presented when a ground lidar is profiling the atmosphere along vertical paths and slant paths with large elevation angles. 5 The inherent statistic uncertainty of coherent return fluc- tuations is estimated for ground lidar systems profil- ing the atmosphere along slant paths. Also, some measurements of potential importance are differen- tial in nature (depolarization effects, differential ab- sorption, target calibration), entailing comparison of the return power in two channels. In these cases, it is the ratio of received power in two channels that is to be averaged, so independent mean power measure- ments need to be supplemented by knowledge of the power fluctuation statistics. In this study, the outcomes of my analysis illus- trate the relative sensitivity of coherent differential absorption lidar (DIAL) systems, where the error as- sociated with the measurement depends on the esti- mation error of the power received signal. Results will be shown for both 2 and 10 m coherent DIAL systems and, to be concise, here I just exhibit the results of our simulations for range-resolved remote sensing of water-vapor H 2 O and carbon dioxide CO 2 content in the atmosphere. Choosing these tar- get species, although they are most significant in to- day’s atmospheric and climate research programs, is a matter of practicality: Results shown in my figures and any conclusion extracted from them are fully generalizable to any coherent lidar regardless of the molecular species under consideration. The primary objective of this study is to understand turbulence- induced uncertainties in coherent DIAL systems that profile the atmosphere. The simulation technique al- A. Belmonte ([email protected]) is with the Department of Signal Theory and Communications, Technical University of Cata- lonia, Barcelona 08034, Spain. Received 10 April 2006; revised 15 May 2006; accepted 18 May 2006; posted 19 May 2006 (Doc. ID 69859). 0003-6935/06/277097-07$15.00/0 © 2006 Optical Society of America 20 September 2006 Vol. 45, No. 27 APPLIED OPTICS 7097
Transcript of Turbulence-induced measurement errors in coherent differential absorption lidar ground systems
Turbulence-induced measurement errors in coherentdifferential absorption lidar ground systems
Aniceto Belmonte
The presence of atmospheric refractive turbulence makes it necessary to use simulations of beam propa-gation to examine the uncertainty added to the differential absorption lidar (DIAL) measurement processof a practical heterodyne lidar. The inherent statistic uncertainty of coherent return fluctuations in groundlidar systems profiling the atmosphere along slant paths with large elevation angles translates into alessening of accuracy and sensitivity of any practical DIAL measurement. This technique opens the door toconsider realistic, nonuniform atmospheric conditions for any DIAL instrument configuration. © 2006Optical Society of America
OCIS codes: 010.3640, 280.1910, 010.1330, 010.1290, 030.6600.
1. Introduction
Simulations of beam propagation in three-dimensionalrandom media were used to study the effects of atmo-spheric refractive turbulence on coherent lidar perfor-mance. The approach provided the tools for analyzinglaser radar with general refractive turbulence con-ditions, beam truncation at the telescope aperture,beam-angle misalignment, and realistic transmitterand receiver configurations. The simulation permittedcharacterization of the heterodyne optical power1 aswell as the effect on lidar performance of the ana-lytically intractable return variance from turbulentfluctuations.2 The standard simulation technique, inwhich the atmosphere is modeled as a set of two-dimensional Gaussian random phase screens,3,4 pro-vided the tools for analyzing heterodyne lidars withgeneral turbulence conditions and arbitrary instru-ment setup.
In a first round of simulated measurements, I con-sidered the lidar directed horizontally so it was pos-sible to assume uniform turbulence with range. Mostof the time, however, heterodyne lidars are aimed toprofile the atmosphere parameters at altitudes wellabove the atmospheric layer adjacent to the underly-ing surface. Now, the simulation techniques have
been extended to the consideration of those nonuni-form turbulence conditions presented when a groundlidar is profiling the atmosphere along vertical pathsand slant paths with large elevation angles.5 Theinherent statistic uncertainty of coherent return fluc-tuations is estimated for ground lidar systems profil-ing the atmosphere along slant paths. Also, somemeasurements of potential importance are differen-tial in nature (depolarization effects, differential ab-sorption, target calibration), entailing comparison ofthe return power in two channels. In these cases, it isthe ratio of received power in two channels that is tobe averaged, so independent mean power measure-ments need to be supplemented by knowledge of thepower fluctuation statistics.
In this study, the outcomes of my analysis illus-trate the relative sensitivity of coherent differentialabsorption lidar (DIAL) systems, where the error as-sociated with the measurement depends on the esti-mation error of the power received signal. Resultswill be shown for both 2 and 10 �m coherent DIALsystems and, to be concise, here I just exhibit theresults of our simulations for range-resolved remotesensing of water-vapor �H2O� and carbon dioxide�CO2� content in the atmosphere. Choosing these tar-get species, although they are most significant in to-day’s atmospheric and climate research programs, isa matter of practicality: Results shown in my figuresand any conclusion extracted from them are fullygeneralizable to any coherent lidar regardless of themolecular species under consideration. The primaryobjective of this study is to understand turbulence-induced uncertainties in coherent DIAL systems thatprofile the atmosphere. The simulation technique al-
A. Belmonte ([email protected]) is with the Department ofSignal Theory and Communications, Technical University of Cata-lonia, Barcelona 08034, Spain.
Received 10 April 2006; revised 15 May 2006; accepted 18 May2006; posted 19 May 2006 (Doc. ID 69859).
0003-6935/06/277097-07$15.00/0© 2006 Optical Society of America
20 September 2006 � Vol. 45, No. 27 � APPLIED OPTICS 7097
lows us to examine the uncertainty added to theDIAL measurement process because of the presenceof refractive turbulence of a practical heterodyne li-dar profiling the atmosphere along slant paths. Ourapproach makes it possible to consider realistic, non-uniform atmospheric conditions for any practical in-strument configuration.
2. Coherent Differential Absorption Lidar Measurementalong Slant Paths
In DIAL measurements, two lidar pulses of slightlydifferent wavelengths �on and �off are selected suchthat �on corresponds to the absorption line of the spe-cies of interest, while �off is placed in a transparentregion of the species line. The radiation at the non-absorbing wavelength �off provides a reference so thatthe scattering and absorption properties of the atmo-sphere can be separated from those of the absorbinggas. The accuracy of the estimate of average receivedpower at the two wavelengths is actually the criticalparameter in coherent DIAL profiling. Any relativeerror in the power measurement resulting fromatmospheric turbulence will translate as a relativeerror in the estimation of absolute concentration:Fluctuations in the instantaneous power level, whichdo not affect the average power, nonetheless degradethe ability of the system to measure this averagepower.
Atmospheric refractive turbulence produces signalfluctuations affecting heterodyne detection systemsin different ways. On the receiver plane, both aerosolspeckle and refractive turbulence effects define thedegree of coherence of the backscattered radiation tobe matched with the local oscillator. Even underclear-weather conditions, turbulence-induced opticalphase perturbations gradually destroy the spatial co-herence of a laser beam as it propagates through theatmosphere. This loss of spatial coherence limitsthe extent to which laser beams may be mixed on thedetector plane, and hence restricts the received powerlevels and produces severe temporal fading in coher-ent detection systems. The physical interpretation ofthe coherent return fluctuations due to turbulence issomewhat similar to that for speckle fluctuations inthe lidar return. In the latter situation, the averagereturn irradiance is uniform, but at any instantit contains the bright patches known as speckle.Speckle increases the mean-square irradiance (rela-tive to the square of the mean irradiance) and resultsin the excess variance, above that due to shot noise,which is attributed to spatial fluctuations. Althoughthe magnitude of turbulence vanishing is not as largeas that of speckle fading (unity), it is significant un-der almost any atmospheric condition.
Simulations rely on using the DIAL equation6 tocompute the instantaneous, simulated concentration� at range R m for a specific set of atmospheric pa-rameters:
��R, �R� �1
2K�R ln��P�R,�R��, (1)
with �P being the ratio of the received powers fromthe on-line beam Pon and the off-line beam Poff:
�P�R, �R� �Pon�R � �R�2�Poff�R � �R�2�Pon�R � �R�2�Poff�R � �R�2�
. (2)
Here, �R m is the range resolution, � molecule�m3
is the mean concentration measurement betweenranges R � �R�2 and R � �R�2, and the differentialabsorption coefficient K is the remainder on � off,where � �� m2�molecule is the molecular crosssection. Equations (1) and (2) are used to calculatespecies concentration from a single pair of pulses. Inour case, we need to consider heterodyne optical power,i.e., equivalent optical power generating the hetero-dyne receiver signal. It defines the performance of thecoherent lidar in the effective solid angle �COH sr atrange R,
P�R, t� � C exp��2R�R����R��COH�R, t�, (3)
where the calibration constant C W m groups theconversion efficiencies and parameters that describethe various system components, m�1 is the atmo-spheric linear extinction coefficient and � m�1 sr�1 isthe aerosol volume backscatter coefficient. At the in-frared (IR) wavelengths considered in coherent DIAL(2 and 10 �m in this study) molecular backscatter-ing is mostly negligible: The elastically backscatteredlight in the IR region is almost exclusively due to Miescattering from particles. The coherent solid angle�COH or coherent responsivity is expressed in termsof the maximum available solid angle AR�R2 used inincoherent lidars and the system-antenna efficiency s�R, t� that describes the extent to which this valueis degraded.7,8 Here, AR m2 is the aperture of the lidartelescope. From Eq. (2), we can extract that Eq. (1)shows no dependency with the calibration constant C,so the DIAL measurement relies only on the coherentsolid angle �COH.
The results are obvious from Eq. (2) that the accu-racy of the estimate of the average received power atthe two wavelengths is actually the critical parameterin coherent DIAL profiling. Any relative error in thepower measurement resulting from atmospheric tur-bulence will translate as a relative error in the esti-mation of absolute concentration. Fluctuations in theinstantaneous power level degrade the ability of thesystem to measure the average power. To undertakethe estimation of relative error in DIAL concentrationmeasurements, we can relate the normalized varianceof the measured quantity to the normalized variance ofthe power measurement that results from turbulenceindex fluctuations. The calculated error (normalizedstandard deviation) is based on linearized error anal-ysis, which assumes small fluctuations of the variablescompared with their mean values.9 In Eq. (2), the prop-agation of errors associated with the measurement of��R� that depends on the four values of received sig-nal power at the two wavelengths and two range gate
7098 APPLIED OPTICS � Vol. 45, No. 27 � 20 September 2006

positions leads to2
�2�R� �
1
4K2�̄2��R�2�P
2�R, �R�, (4)
where �̄ is the true molecular concentration and �P isthe normalized variance of the ratio of the receivedpowers. The same Eq. (4) that will be used to describeDIAL measurement uncertainty in the presence ofatmospheric turbulence can express speckle effects.
Certainly, the advantage of heterodyne systems inopposition to direct-detection DIAL systems comesabout because of the higher signal-to-noise ratio(SNR)—defined as the average signal power in Eq. (3)divided by the noise power—at the output of the de-tector. However, power measurement errors that re-sult from fluctuations in the instantaneously receivedsignal caused by turbulence have a much stronger ef-fect on coherent detection than on direct-detectionDIAL systems. Although power fluctuations could re-sult from a number of physical mechanisms other thanrefractive turbulence (i.e., aerosol variability, speckle,detection noise, and background noise), they are notthe focus of this analysis and will be neglected. Allthese very relevant issues have been carefully re-viewed elsewhere.10–12 Finally, it is necessary to men-tion that all the results shown in this study willdescribe single-shot uncertainties. For N-independentshots, the standard deviation of my measurementswould be reduced by 1��N. As before, being concernedwith turbulence-induced errors, in this study we willnot consider any temporal averaging of the signalfluctuations.
Theoretical research on the problem accomplishescalculations through considerations of the highermoments of the field and is still difficult. By usingnumerical simulations, we overcome the analyticallimitations and are able to study the effects of atmo-spheric refractive turbulence on coherent lidar perfor-mance in a realistic way.1 By use of the two-beammodel,13 the approach expresses the effective solid an-gle in terms of the overlap integral of the transmitterand the virtual (backpropagated) local oscillator beamsat the target, reducing the problem to one of computingirradiance along the two propagation paths.
Simulation permits the estimation of relative errorin DIAL concentration measurement by relying onusing the DIAL equation (1) to compute the instan-taneous, simulated concentration ��R� for a preciseset of atmospheric turbulence parameters14: Afterrunning sufficient realizations to reduce estimatedstatistical uncertainties, the total standard deviationp of the mean concentration measurement resultingfrom refractive turbulence can be assessed. The mo-lecular concentration values at specific ranges foreach realization are combined to calculate the error.
All simulations used in this study assume nonuni-form turbulence with range, i.e., slant propagationpaths, and use the Hill turbulence spectrum15—witha typical inner scale l0 of 1 cm and a realistic outerscale L0 of the order of 5 m—to describe the spatial
correlation of the phase screens. To accommodate thecharacteristics of the turbulence spectrum, the sim-ulation technique uses a numerical grid of 1024 �1024 points with a 5 mm resolution.1 Transmittedand virtual local oscillator beams were assumed to bematched, collimated, perfectly aligned, Gaussian,and truncated at a telescope aperture of typical di-ameter D � 16 cm. The beam truncation was 1.25(i.e., D � 1.25 � 2�0, where �0 is the 1�e2 beamirradiance radius). This truncation maximizes the co-herent system efficiency in the ideal case of absence ofturbulence.16 Also, on-line and off-line beams are as-sumed coaligned and considered independently, i.e.,power fluctuations at two DIAL wavelengths �on and�off are mostly uncorrelated. Only when using shorttime intervals between the two pulses of a shot pair,the fluctuations of the return power in the two DIALwavelengths will be partially correlated. By gettingan estimator in a short time, the differential nature ofDIAL measurement would take away the effects offluctuations that are correlated for the two wave-lengths.
The turbulence strength is included in the at-mospheric spectrum by means of the well-knownstructure parameter Cn
2. For applications involvingpropagation along a horizontal path, it is customaryto assume that the structure parameter Cn
2 remainsessentially constant. Propagation along a vertical orslant path, however, requires a Cn
2�h� profile modelto describe properly the varying strength of opticalturbulence as a function of altitude h. Althoughseveral different turbulence profile models are upfor consideration, in this study, the well-knownHufnagel–Valley (H–V) model is used to describe allthe considered atmospheric profiles.17 The H–Vmodel is an empirically fitted heuristic model usedextensively in the context of theoretical calcula-tions of beam propagation through the turbulentatmosphere. The Cn
2 profile is described by a plan-etary boundary layer term of the form Cn
2�h� �Cn0
2 exp��h�100�, a tropopause term of the formCn
2�h� � 2.7 � 10�16 exp��h�1500�, and an individ-ual layer term of the form Cn
2�h� � 0.00594�v�27�2
�10�5h�10 exp��h�1000�. Here, altitude h is in meters.This model allows accommodating with easy any lo-cal near-ground turbulence conditions Cn0
2 and anyrms high-altitude wind speed v (pseudowind), the twobasic parameters needed to model the dependency ofturbulence along a slant path. In general, the groundturbulence level has little effect above 1 km altitude,and the wind speed governs the profile behavior pri-marily in the vicinity of 10 km. Although of impor-tance in making temporal calculations, the windspeed is not relevant to our time-independent esti-mations and we will use, without loss of generality,the H–V profile model with a standard v � 21 m�s inall the situations considered in this study. As mainlyconcerned with the influence of turbulence in ground-based lidar systems, we utilize several different real-istic turbulence levels near the ground.
20 September 2006 � Vol. 45, No. 27 � APPLIED OPTICS 7099
To obtain a quantitative estimation of coherentDIAL performance, we must also specify an atmo-spheric model. For the simulated measurements inthis study, we use the Air Force Geophysics Labora-tory (AFGL) U.S. Standard model for temperature,pressure, and H2O content.18 These AFGL model at-mospheres describe expected, mean atmospheric pa-rameters as a function of altitude h. They provide thetrue H2O and CO2 molecular concentrations �̄ weintend to measure with our simulations.
3. Uncertainty in Coherent Differential AbsorptionLidar Measurements
Figures 1–4 below show the normalized standard de-viation (relative error) of DIAL measurement fluctu-ations as a function of range and different levels ofrefractive turbulence Cn
2 for a 2 �m and 10 �m mono-static system. As bistatic lidar configuration tends tobe just slightly more immune to turbulence-inducedpower fluctuations than monostatic arrangements,2most of the notes of this study about DIAL uncer-tainty in monostatic systems will also apply for bi-static situations. Therefore I will synthesize and willnot report bistatic results here.
Several sounding wavelength candidates that arecapable of discerning atmospheric gaseous species con-centrations have been identified for DIAL implemen-tations. In this study, a wavelength selection of laserlines for range-resolved remote sensing of atmosphericconstituents H2O and CO2 by use of the coherent DIALsystems is considered.10–12 I compute the instanta-neous, simulated concentration ��R� as portrayed byEq. (1) for this set of line coefficients, and set the mea-surement uncertainties according to Eq. (4). Line pa-rameters presume a standard atmospheric pressure of760 Torr and a reference temperature of 296 K. Allestimations are just for measurements from a singlepair of pulses of slightly different wavelengths �onand �off.
Heterodyne lidar simulated measurements weretaken with the lidar elevated at angles � ranging from0° to 90°. As a first round of horizontal simulatedmeasurements were already presented elsewhere,14 Ianalyze vertical (90° elevation angle) and slant paths(30° and 60° elevation angles). For profiling purposes,vertical pointing provides the best maximum range Rcapability; however, height resolution (equal to rangeresolution �R times the sine of the elevation angle) islimited by the transmit pulse length. It is usual tolower elevation angles to increase the vertical reso-lution of the measurements. We also illustrate thedependency of measurement uncertainty with rangeresolution.
Figures 1 and 2 show the uncertainties of the DIALcoherent measurements as a function of altitude h ofa realistic monostatic lidar system. The standard de-viation, i.e., relative error, of coherent power fluctu-ations are pictured in the figures for differentmoderate-to-strong refractive turbulence Cn
2 daytimelevels. Two different lidars working at 2 �m (Fig. 1)and 10 �m (Fig. 2) wavelengths, and several propa-
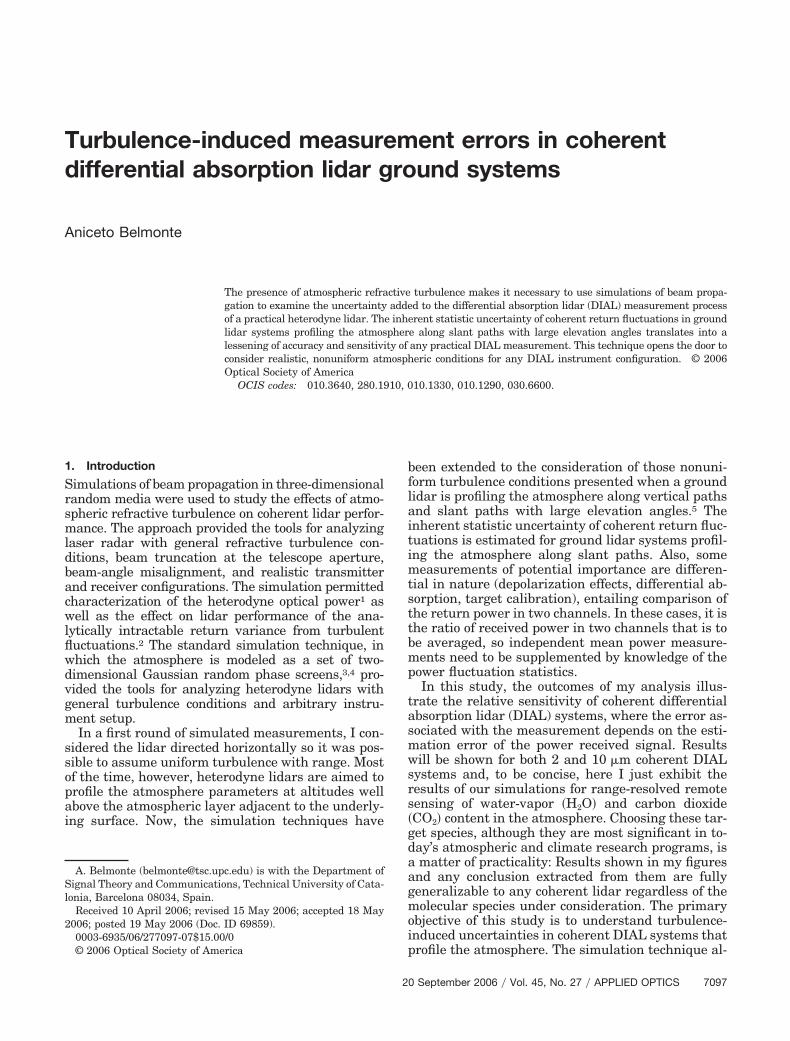
gation paths have been considered in the figures. Formany ranges considered in the figures, the concen-tration measurement relative error is usually belowunity (100% error). When the shortest ranges andstrong turbulence conditions are studied, the mea-surement error can approach a maximum of 1.5 (seeFig. 1, top). Certainly, with ground lidar systems pro-filing the atmosphere along slant paths with largeelevation angles, the accumulated turbulence leveland its effects are smaller. However, in many prac-tical situations, elevation angles are usually smallenough to maximize the number of independent sam-ples for a given altitude resolution.
The structural characteristic of refractive index inthe atmospheric boundary layer essentially decreaseswhen the height h increases. Therefore the main dis-tortions of a laser beam that propagate along a ver-tical �h � R� or a slant �h � R sin �� path occur in the
Fig. 1. (Color online) Turbulence-induced DIAL measurementuncertainty in the measurement of H2O concentration as a func-tion of altitude h for a 2 �m wavelength, 16 cm aperture, monos-tatic lidar system. The laser lines for range-resolved coherentDIAL remote sensing considered here are �on � 2.0988 �m and�off � 2.0989 �m (Ref. 10). The H–V Cn
2�h� profile model withdifferent moderate-to-strong near-ground refractive turbulenceCn0
2 conditions is considered. We used the AFGL U.S. Standardatmosphere model for temperature, pressure, and H2O vapor con-tent. The standard deviations are shown for several vertical andslant propagation paths and a range resolution �R of 300 m.
7100 APPLIED OPTICS � Vol. 45, No. 27 � 20 September 2006
atmospheric layer adjacent to the underlying surface.Consequently, when uncertainty on coherent DIALmeasurements along slant paths is considered in Fig.1, it is apparent that a maximum of the error occursat low altitudes. Roughly, at this altitude just a veryfew scintillation spots fill the beam area on the scat-tering target and, consequently, the so-called averag-ing principle is almost negligible.2,5 For increasedranges, the beam resolves several scintillations, pro-ducing an intense averaging effect: A large number ofbright spot scintillations, caused by either the smallarea of each spot or a large beam area, tend to reducepower fluctuations. For strong-turbulence conditionsand large propagation paths, the size of the laserbeam at the target no longer depends on the trans-mitter aperture. The spot area, and thus the beam-averaging effect, is defined by the turbulence beamspreading. Also, at the same ranges, the beam inten-sity fluctuations saturate, establishing a limit to thecontinuously increasing scintillations that occur inthe weak turbulence regime. These multiple effectssum up to produce part of the decreasing with alti-tude of the measurement uncertainty observed in thefigures.
It is interesting to note, however, that, when strongturbulence �Cn
2 � 10�12 m�2�3� and small elevationangles (30°) are considered in Fig. 1 (top), after ashort decrease, the standard deviation of the turbu-lence fluctuations increases again with altitude. Partof the reason for this effect is likely to be that beamspreading becomes comparatively less importantthan scintillation. In this regime, the saturation ef-fect and the averaging over the reduced beam size areno longer able to compensate for the trend of thefluctuations to increase with the range. A similar, butweakened, effect can also be observed for moderateturbulence levels (Fig. 1, bottom). Still, the intensityof the effect featured in the figures cannot be ex-plained by considering only turbulence effects. Asshown in Eq. (4), the calculated error on DIAL mea-surements is proportional to the normalized varianceof the ratio of the received powers and is inverselyproportional to the true molecular concentration to bemeasured. Clearly, only the power variances dependon refractive turbulence, and they are the main focusof this study. However, we cannot disregard the factthat the measurement of small molecular concentra-tions does have a higher inherent uncertainty thanlarger concentrations do. The C-shaped curve ob-served on the H2O vapor measurement uncertaintyin Fig. 1 has to do with both the true concentrationused in AFGL atmospheric models and the refractiveturbulence close to the ground. Usually, H2O vaporconcentrations tend to decrease with altitude and,consequently, uncertainty tends to increase propor-tionately. However, for lower altitudes, turbulenceeffects momentously reverse this trend, and we ob-serve an increase of the measurement errors withaltitude.
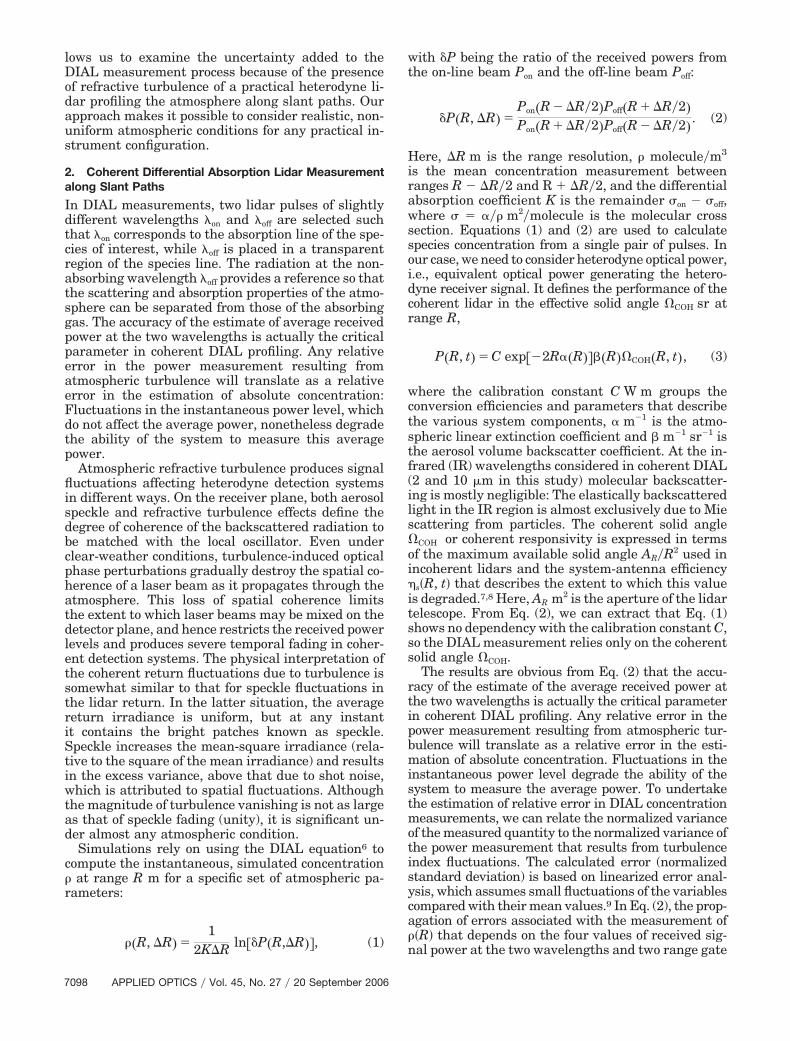
The performance of the 10 �m lidar is shown in Fig.2, in a format similar to that of Fig. 1. Compared withthose of the 2 �m lidar, the turbulence effects areapparently less, but the same physical features canbe observed. As stated in the figures, measurementuncertainty is larger for the 2 �m system (Fig. 1),where we may expect more sensitivity to turbulence,than for the 10 �m lidar (Fig. 2). Roughly, for thesituations considered in this study, concentration rel-ative error for the 10 �m system is 50% less in manycases. When horizontal paths were considered, sur-prisingly the opposite circumstances, i.e., measure-ment uncertainties larger for the 10 �m case than forthe 2 �m situation are observed. This result of thesimulations is explained by considering the fact thatthe beam averaging for the 10 �m system was re-markably smaller as a consequence of larger beamintensity scales in the target plane reducing the abil-ity for leveling signal fluctuations. Now, however,when slant propagation paths are taken into consid-eration, turbulence effects on 2 �m lidars are notalready intense enough to produce averaging phe-nomena able to wipe out an important part of thepower fluctuations. In any case, when 10 �m andstrong turbulence is considered (Fig. 2, top), concen-tration relative errors are still comparable to those
Fig. 2. (Color online) Similar to Fig. 1 but for a 10 �m monostaticlidar (�on � 10.247 �m and �off � 10.264 �m) (Ref. 11). Again, themeasurement error of H2O concentration is shown for several ver-tical and slant paths and a range resolution �R of 300 m.
20 September 2006 � Vol. 45, No. 27 � APPLIED OPTICS 7101

observed for the 2 �m occurrence and similar turbu-lence levels (Fig. 1, top).
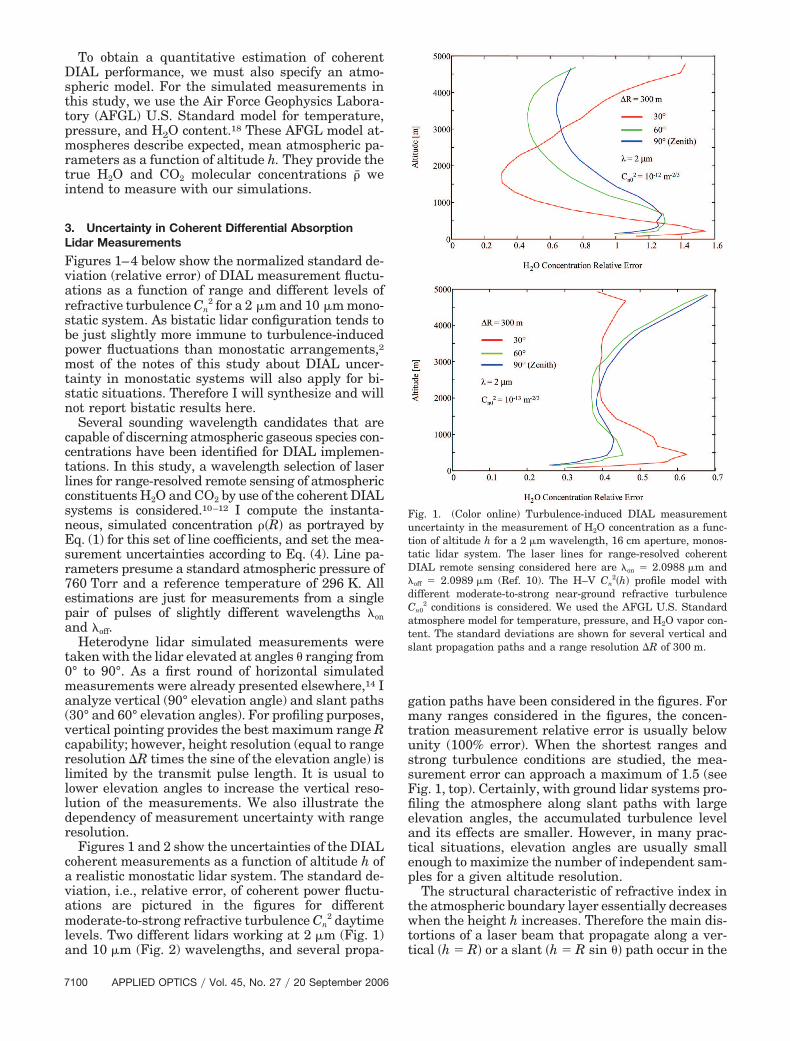
In Fig. 3, H2O concentration relative errors areshown for different DIAL range resolutions �R. Forsharper lidar range resolutions, as the thickness ofthe medium �R decreases, the physical significanceof the correlation terms describing the power fluctu-ations becomes more important (power fluctuationsare correlated along the lidar profiling path becauseof the propagation of beam turbulence effects fromthe plane R to the plane R � �R). Consequently, theimprovement associated with the correlation of thepower estimations in the overall DIAL-measurementaccuracy becomes larger. On the other hand, how-ever, the decrease of the range resolution �R trans-lates into a smaller spatial averaging of turbulencefluctuations. As a result, in spite of the increase of theturbulence correlation effects, in Fig. 3, the relativeerror increases with decreasing �R. For the smallestrange resolution considered in Fig. 3 ��R � 150 m�,the relative error can reach values close to 2. Also, asit can be appreciated in the figure, differences in un-
certainty between 300 and 450 m range resolutions�R are in nearly all situations almost negligible,meaning that the correlation effects are mostly sim-ilar in both cases. That sets a maximum for the lon-gitudinal correlation of the turbulence effects on thelaser beam propagation.
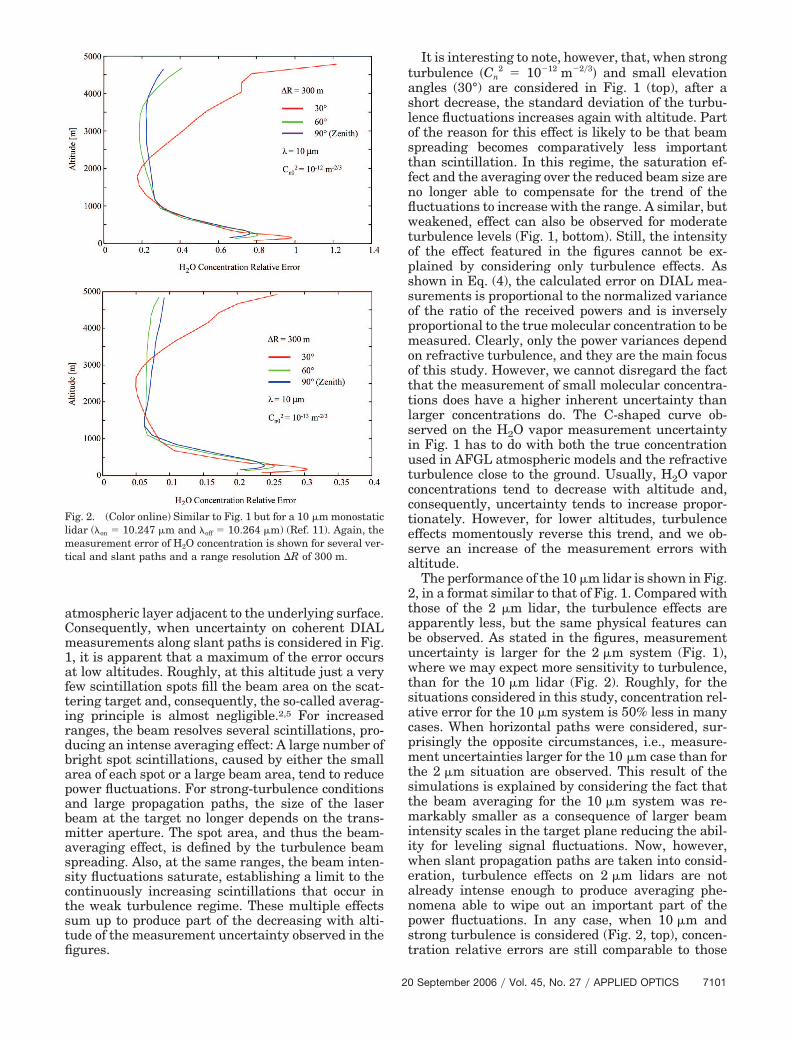
Figure 4 shows range-resolved DIAL measurementerrors of CO2 concentration making it possible tocompare them with previous H2O concentration mea-surement errors. The noticeable differences betweenthe two concentration measurement uncertaintiesare due to the particularities of the chosen line pa-rameters and the concentration levels assumed in theAFGL models used in our simulations. Interestingly,atmospheric CO2 concentration remains virtuallyconstant for any altitude considered in Fig. 4, andbeyond. Consequently, it is not possible to observe inthese curves the characteristic shape we appreciatein some of the other figures. Here, just turbulenceeffects define the features of my results. As refractiveturbulence beyond 1 km altitude is very low, so isthe concentration measurement uncertainty in both
Fig. 3. (Color online) Turbulence-induced DIAL measurementuncertainty in the measurement of H2O concentration as a func-tion of altitude h for a 2 �m wavelength (�on � 2.0988 �m and�off � 2.0989 �m) (Ref. 10), 16 cm aperture, monostatic lidar sys-tem. Once again, we use the H–V Cn
2�h� profile model and theAFGL U.S. Standard atmosphere. Standard deviations are shownfor several range resolutions �R and an elevation angle � of 60°.
Fig. 4. (Color online) Turbulence-induced DIAL measurement uncer-tainty in the measurement of CO2 centration as a function of altitudeh for a 2 �m wavelength 16 cm aperture, monostatic lidar system.Here, �on � 2.0530 �m and �off � 2.0490 �m (Ref. 12). Once again,we use the H–V Cn
2�h� profile model and the AFGL U.S. Standardatmosphere for temperature, pressure, and CO2 content. Standarddeviations are shown for several vertical and slant propagationpaths (top) and different range resolutions �R (bottom).
7102 APPLIED OPTICS � Vol. 45, No. 27 � 20 September 2006

the upper and the lower plots in Fig. 4. Roughly, andaccording to Eq. (4), any other possible wavelengthpair or species concentration will modify the productsof the simulations displayed in the figures. In anycase, the same physical mechanisms considered inFigs. 1–3 can be applied here to explain the uncer-tainty behavior of CO2 concentration measurements.
4. Conclusions
Conducting simulated experiments on coherent DIALdetection involves making measurements that mustthen be analyzed to produce results. As in real sys-tems, these measurements are never perfectly exactbut have some uncertainty or error. The unprevent-able errors on the measurements give rise to unpre-ventable errors on results. This study deals with thehandling of the turbulence-induced errors and how theerrors on the measurements combine and propagatethrough the errors on the DIAL results. The primaryconcern has been to define a simulation technique ableto produce measurement uncertainties similar to thosethat could be found in real instrumentation. Althoughreal measurements acquire errors from many differentsources, and, in general, it results in difficulty in dis-tinguishing them and deciding the most relevantcauses of the imperfections in the measurements, sim-ulated measurements allow us to isolate turbulent ef-fects on coherent DIAL and treat them with detail andindependently.
The study of coherent DIAL lidars by the simulationtechnique has already allowed investigations of pre-cision, differences in concentration estimates, andinstrument sensitivity under different atmosphericconditions and distinctive lidar configurations. The ap-proach allows us to grasp phenomena beyond therange of available analytical theory. The results indi-cate a rather complicated behavior, which is stronglyaffected by atmospheric turbulence conditions and in-strument setups. Both 2 and 10 �m coherent DIALground systems have been considered in this studyand, although the intensity of turbulence effects is inmany cases dissimilar, the general behavior is quiteindependent of the working wavelength. Even thoughturbulence-induced power measurement uncertain-ties are not as large as that of speckle fading, still thispower uncertainty may become a greater problem incoherent DIAL systems owing to the long time con-stant associated with fluctuations and the large spa-tial correlations among power variations.
Using the simulation method to contemplate theeffects of turbulence on airborne and satellite-bornecoherent DIAL lidars is a natural extension of thiswork. Still several important issues regarding thedetails of the beam propagation for this specific set ofproblems must be addressed in advance of consider-ing their simulations. I have avoided discussing all
the matters on the results presented here. They willbe addressed in a subsequent study.
This research was partially supported by the Span-ish Department of Science and Technology MCYTgrant REN 2003-09753-C02-02.
References1. A. Belmonte and B. J. Rye, “Heterodyne lidar returns in
turbulent atmosphere: performance evaluation of simulatedsystems,” Appl. Opt. 39, 2401–2411 (2000).
2. A. Belmonte, “Coherent power measurement uncertaintyresulting from atmospheric turbulence,” Opt. Express 12, 168–175 (2004).
3. J. Martin, “Simulation of wave propagation in random media:theory and applications,” in Wave Propagation in RandomMedia (Scintillation), V. I. Tatarskii, A. Ishimaru, and V.Zavorotny, eds. (SPIE, 1993).
4. A. Belmonte, “Feasibility study for the simulation of beampropagation: consideration of coherent lidar performance,”Appl. Opt. 39, 5426–5445 (2000).
5. A. Belmonte, “Coherent return turbulent fluctuations inground lidar systems profiling along slant paths,” Opt. Express13, 9598–9604 (2005).
6. R. M. Measures, Laser Remote Sensing Fundamentals andApplications (Wiley-Interscience, 1984).
7. B. J. Rye, “Antenna parameters for incoherent backscatterheterodyne lidar,” Appl. Opt. 18, 1390–1398 (1979).
8. R. G. Frehlich and M. J. Kavaya, “Coherent laser radar per-formance for general atmospheric refractive turbulence,” Appl.Opt. 30, 5325–5352 (1991).
9. M. G. Kendall and A. Stuart, Advanced Theory of Statistics,6th ed. (Edward Arnold, 1994).
10. M. J. Kavaya, S. W. Henderson, E. C. Russell, R. M. Huffaker,and R. G. Frehlich, “Monte Carlo computer simulations ofground-based and space-based coherent DIAL water vaporprofiling,” Appl. Opt. 28, 840–851 (1989).
11. R. M. Hardesty, “Coherent DIAL measurement of range-resolved water vapor concentration,” Appl. Opt. 23, 2545–2553(1984).
12. G. J. Koch, A. N. Dharamsi, C. M. Fitzgerald, and J. C.McCarthy, “Frequency stabilization of a Ho:Tm:YLF laser toabsorption lines of carbon dioxide,” Appl. Opt. 39, 3664–3669(2000).
13. B. J. Rye, “Refractive-turbulent contribution to incoherentbackscatter heterodyne lidar returns,” J. Opt. Soc. Am. 71,687–691 (1981).
14. A. Belmonte, “Coherent DIAL profiling in turbulent atmo-sphere,” Opt. Express 12, 1249–1257 (2004).
15. L. C. Andrews, “An analytical model for the refractive-indexpower spectrum and its application to optical scintillation inthe atmosphere,” J. Mod. Opt. 39, 1849–1853 (1992).
16. B. J. Rye and R. G. Frehlich, “Optimal truncation and opticalefficiency of an apertured coherent lidar focused on an inco-herent backscatter target,” Appl. Opt. 31, 2891–2899 (1992).
17. R. R. Beland, “Propagation through atmospheric optical tur-bulence,” in The Infrared and ElectroOptical Systems Hand-book, F. G. Smith, ed. (SPIE, 1993), Vol. 2, Chap. 2.
18. R. W. Fenn, S. A. Clough, W. O. Gallery, R. E. Good, F. X.Kneizys, J. D. Mill, L. S. Rothman, and E. P. Shettle, “Opticaland infrared properties of the atmosphere,” in The Handbookof Geophysics and the Space Environment, A. S. Jursa, ed. (AirForce Geophysics Laboratory, 1985), Chap. 18.
20 September 2006 � Vol. 45, No. 27 � APPLIED OPTICS 7103