Turbine Performance and Air Admission Tests
78
PRINCIPIA RESEARCH CORPORATION CD-ROM MASTER COPY Includes CD-ROM PACIFI CORP I RON GATE PROJECT Turbine Performance and Air Admission Tests Prepared for CH2M HILL Portland, Oregon Revision B December 2008 Prepared by Principia Research Corporation P.O. Box 121693 Nashville, TN 37212 [email protected]
Transcript of Turbine Performance and Air Admission Tests

PRINCIPIARESEARCH
CORPORATION
MASTER COPY Includes CD-ROM MASTER COPY
Includes CD-ROM MASTER COPY
Includes CD-ROM
MASTER COPY Includes CD-ROM MASTER COPY
Includes CD-ROM MASTER COPY
Includes CD-ROM
PPAACCIIFFIICCOORRPP IIRROONN GGAATTEE PPRROOJJEECCTT
TTuurrbbiinnee PPeerrffoorrmmaannccee aanndd
AAiirr AAddmmiissssiioonn TTeessttss
Prepared for
CH2M HILL Portland, Oregon
Revision B
December 2008
Prepared by
Principia Research Corporation P.O. Box 121693
Nashville, TN 37212 [email protected]


Revision History
Rev A October 2008
Initial release.
Rev B December 2008
Final release. All comments from CH2M Hill and PacifiCorp have been incorporated. No substantive changes.


Principia Research Page iii IronG
ateRe
port-
B1.do
cm
PACIFICORP IRON GATE PROJECT TURBINE PERFORMANCE AND AIR ADMISSION TESTS
Table of Contents
1. Overview and Scope ................................................................................................ 1-1 1.1. Overview ......................................................................................................... 1-1 1.2. Description of the Generating Unit ................................................................. 1-1 1.3. Scope of Testing .............................................................................................. 1-2
2. Personnel .................................................................................................................. 2-1
3. Instrumentation ....................................................................................................... 3-1 3.1. General Description ......................................................................................... 3-1 3.2. Data Acquisition .............................................................................................. 3-1 3.3. Instrumentation Installations ........................................................................... 3-1
3.3.1. Inlet Head ................................................................................................. 3-1 3.3.2. Winter-Kennedy Differential Pressure ..................................................... 3-1 3.3.3. Wicket Gate Position ................................................................................ 3-1 3.3.4. Air Flow .................................................................................................... 3-2 3.3.5. Draft Tube Pressure .................................................................................. 3-2 3.3.6. Air Temperature and Relative Humidity .................................................. 3-2 3.3.7. Atmospheric Pressure ............................................................................... 3-2 3.3.8. Water Temperature ................................................................................... 3-2 3.3.9. Generator Output ...................................................................................... 3-2 3.3.10. Total Powerhouse Discharge .................................................................... 3-2 3.3.11. Headwater Elevation ................................................................................. 3-2 3.3.12. Tailwater Elevation................................................................................... 3-2
4. Test Conditions and Procedures ............................................................................ 4-1 4.1. Test Conditions ............................................................................................... 4-1 4.2. Test Procedures ............................................................................................... 4-1
5. Data Reduction Procedures .................................................................................... 5-1 5.1. Linearization .................................................................................................... 5-1 5.2. Turbine Performance Computations ............................................................... 5-1
5.2.1. Winter-Kennedy Flow Rate ...................................................................... 5-1 5.2.2. Turbine Net Head ..................................................................................... 5-1 5.2.3. Generator Efficiency and Loss ................................................................. 5-2 5.2.4. Turbine output .......................................................................................... 5-4 5.2.5. Turbine Efficiency .................................................................................... 5-4 5.2.6. Unit Efficiency ......................................................................................... 5-4
5.3. Air Flow Calculations ..................................................................................... 5-4 5.4. Correction of Efficiency Test Results to Common Head ................................ 5-6
6. Performance and Air Admission Results .............................................................. 6-1 6.1. Winter-Kennedy Flowmeter Calibration ......................................................... 6-1 6.2. Basic Data and Calculations ............................................................................ 6-2

Iron Gate Air Admission Test Revision B December 2008
Principia Research Page iv
6.3. Performance Results ........................................................................................ 6-2 6.4. Air Flow Results.............................................................................................. 6-2
7. Summary and Conclusions ..................................................................................... 7-1
8. References ................................................................................................................ 8-1
List of Tables Table 3.1: Instrumentation ............................................................................................. 3-3 Table 5.1: Constants and Parameters Used in Analyses ................................................ 5-3 Table 6.1: Raw Data ....................................................................................................... 6-5 Table 6.2: Basic Calculations ......................................................................................... 6-6 Table 6.3: Unit and Turbine Efficiency Results ............................................................. 6-7 Table 6.4: Air Flow Results ............................................................................................ 6-8
List of Figures Figure 1.1: Transverse Section Through Unit Centerline ............................................... 1-3 Figure 1.2: Plan View Showing Generating Unit and Bypass Line ................................ 1-4 Figure 3.1: Inlet Head and Winter-Kennedy Piezometer Taps ....................................... 3-4 Figure 3.2: Inlet and Winter-Kennedy Pressure Cell Installation ................................... 3-5 Figure 3.3: Servo Gate Stroke Measurement .................................................................. 3-5 Figure 3.4: Schematic of Bellmouth Inlet ....................................................................... 3-6 Figure 3.5: Bellmouth Inlet ............................................................................................. 3-6 Figure 3.6: Draft Tube Pressure Measurement ............................................................... 3-7 Figure 3.7: Tailwater Measurement ................................................................................ 3-7 Figure 5.1: Generator Efficiency and Loss ..................................................................... 5-3 Figure 6.1: Winter-Kennedy Flowmeter Calibrations .................................................... 6-1 Figure 6.2: Unit Efficiency With and Without Air Admission ....................................... 6-9 Figure 6.3: Turbine Efficiency With and Without Air Admission ............................... 6-10 Figure 6.4: Effect of Air Admission on Unit Efficiency .............................................. 6-11 Figure 6.5: Unit Discharge-Power Curves With and Without Air Admission ............. 6-12 Figure 6.6: Air Flow vs. Generator Power Outut.......................................................... 6-13 Figure 6.7: Air Flow vs. Turbine Discharge ................................................................. 6-14 Figure 6.8: Air-Water Flow Ratio vs. Generator Power Output ................................... 6-15 Figure 6.9: Unit Air-Water Flow Ratio vs. Turbine Discharge .................................... 6-16
Appendices
A. Instrumentation Specifications
B. Calibration Data

Principia Research Page 1-1 IronG
ateRe
port-
B1.do
cm
1. OVERVIEW AND SCOPE
1.1. Overview This report describes performance and air admission testing on the generating unit at PacifiCorp’s Iron Gate Project powerhouse on the Klamath River near Hornbrook, California. These tests were conducted in conjunction with a water quality assessment program conducted by PacifiCorp and the Portland office of CH2M-Hill. Testing took place the week of August 18 - 22, 2008.
This testing is part of a program to evaluate methods for improving the dissolved oxygen DO) in the river downstream of the powerhouse during the low-DO season that runs from summer to early fall. Like many turbines of similar design, the Iron Gate unit is equipped with an air admission system which normally admits air into the draft tube at low wicket gate openings to smooth out rough operation due to cavitation and draft tube swirl. As the induced air travels through the draft tube and into the tailwater, a fraction of the oxygen (and nitrogen) goes into solution, increasing dissolved oxygen (and dissolved nitrogen), providing a potentially low-cost method of improving DO. By configuring the air valve to remain open at all gate openings, the range of potential DO enhancement is increased.
While the initial costs of this type of aeration are typically modest, a potentially significant cost is the loss of generating efficiency and the loss of power.
The objectives of the testing reported here were to determine the effect of air admission on the efficiency of the generating unit, and to quantify the amount of air drawn into the draft tube through the air admission system over a range of turbine flow rates. This report covers only these aspects of the test program and does not present data or conclusions related to the water quality data collection effort conducted concurrent to these tests.
1.2. Description of the Generating Unit A transverse section through the generating unit centerline and a plan view of the unit are shown in Figures 1.1 and 1.2, respectively. The turbine is a vertical-axis Francis-type rated at 25,000 hp under 154 feet of head. At the rated conditions, the generator output is 18.1 MW with a discharge of about 1,550 cfs. The turbine is supplied from an exposed steel penstock connected to the reservoir headworks. At the lower end, the penstock bifurcates (as shown in Figure 1.2), with one leg of the bifurcation supplying the turbine, and the other leg going to a Howell-Bunger valve. This arrangement allows the powerhouse discharge to be controlled or increased beyond what is possible with the turbine alone.
The penstock is equipped with an Accusonic acoustic time-of-flight flowmeter system which measures the entire penstock flow before the bifurcation. Winter-Kennedy flowmeter taps are installed in the turbine spiral case, although they are presently unused. These taps were put into service for these tests and were calibrated against the acoustic flowmeter, allowing the portion of the total flow passing through the turbine to be determined.
The bellmouth inlet for the turbine air admission system is located on the powerhouse wall at the taildeck, and feeds the air piping which connects to the headcover in the wheelpit. The

Iron Gate Air Admission Test Revision B December 2008
Principia Research Page 1-2
air flows from the headcover to the draft tube through holes in the runner crown at the downstream edge of the buckets. Air flow is driven by the vacuum which exists in the draft tube; the strength of the vacuum depends on the flow through the turbine.
The airflow is controlled by a valve which is actuated by a linkage to the gate ring. Between 0 and 38% gate opening, the valve is fully open. At 38% the valve begins closing and is fully closed at gate openings greater than 65%.
1.3. Scope of Testing For these tests, the linkage connecting the air valve to the gate ring was removed, allowing for independent control of the valve position. Turbine testing was performed over a range of gate openings with the air valve fully open and with the air valve fully closed.
Because the total powerhouse discharge is tightly regulated, the range of test conditions possible was limited. On August 20, the turbine efficiency and air admission testing was conducted with the total powerhouse discharge maintained at approximately 1500 cfs, corresponding to a tailwater elevation of about 2171.75 ft. Constant powerhouse flow was achieved by using the Howell-Bunger bypass valve to balance the flow as the turbine was operated at different gate openings.
Testing was conducted at gate openings from 30% to about 85% at 5% increments. 86% was the highest gate opening achievable under the flow constraint of 1500 cfs. Tests over the full operating range were conducted with the air valve open and the air valve closed. Powerhouse and PRC instrumentation monitored the performance of the generating unit and the airflow being admitted to the headcover through the bellmouth inlet at the taildeck.
In addition to the turbine testing described above, air flow was monitored on August 19 when the turbine discharge was a constant 1000 cfs. Turbine performance and air flow were monitored during steady operation on the afternoon of August 21. In-stream water quality monitoring in the river downstream of the powerhouse was being conducted on these days.

Iron Gate Air Admission Test Revision B December 2008
Principia Research Page 1-3 IronG
ateRe
port-
B1.do
cm
Figure 1.1: Transverse Section Through Unit Centerline

Iron Gate Air Admission Test Revision B December 2008
Principia Research Page 1-4
Figure 1.2: Plan View Showing Generating Unit and Bypass Line

Iron Gate Air Admission Test Revision B December 2008
Principia Research Page 2-1
2. PERSONNEL The following personnel had principal responsibilities during the testing. Numerous other support personnel also participated.
Test Personnel Name Title Responsibility
PacifiCorp Norm Etling Maintenance Supervisor Site preparations and coordination Terry Riley Lead Mechanical Engineer Test planning and coordination Linda Prendergast Principal Aquatic Scientist Water quality investigations Larry Castle Operator Unit operations
CH2M-Hill Portland Kenneth Carlson Project Manager Test planning and oversight
Principia Research Corporation Charles Almquist Principal Engineer Test planning and execution


Iron Gate Air Admission Test Revision B December 2008
Principia Research Page 3-1
3. INSTRUMENTATION
3.1. General Description A summary of the instrumentation used is presented in Table 3.1. Most of the instruments were temporarily installed by Principia Research Corporation (PRC) for these tests. These included instruments for determination of inlet pressure, turbine flowrate (Winter-Kennedy differential), wicket gate servomotor stroke, air flow in the vent pipe, draft tube pressure, air temperature, relative humidity, atmospheric pressure, and water temperature. Powerhouse instruments recorded included headwater and tailwater elevation, total powerhouse discharge, and generator power output.
Instrumentation specifications for those instruments supplied by PRC are found in Appendix A. Calibrations for instruments provided by PRC are found in Appendix B.
3.2. Data Acquisition Test data were acquired by a Hewlett-Packard 34970A data acquisition system, located in the office building, and controlled by HP’s Benchlink software. All of the instruments employed 4 – 20 mA current loop outputs. 250 ohm precision resistors were used to convert the 4-20 mA current loops to 1 – 5 V.
3.3. Instrumentation Installations
3.3.1. Inlet Head The locations of the inlet head piezometer taps in the turbine inlet section are shown in Figure 3.1. The four taps are equally spaced around the circumference of the inlet section. The piezometer (pressure) lines from the taps are combined by a manifold located at the piezometer bay at the upstream side of the turbine pedestal. A Rosemount 3051CG gage pressure cell was use to measure the inlet pressure. A photograph of the manifold and pressure cell installation is shown in Figure 3.2.
3.3.2. Winter-Kennedy Differential Pressure The locations of the Winter-Kennedy (W-K) pressure taps in the spiral case are shown in Figure 3.1. The three flowmeter pressure lines were accessed at the piezometer bay. Two Rosemount differential pressure cells were employed, with one cell measuring the R3-R1 differential, and the other measuring the R3-R2 differential, providing two W-K flow measurements. Figure 3.2 shows the installation.
3.3.3. Wicket Gate Position The wicket gate servo stroke was measured using a cable extension transducer (“pull-pot”) mounted on the servomotor at the governor outside the wheel pit. The transducer was attached to a mounting bracket clamped to the servo cylinder housing. The free end of the cable was attached to a pointer on servo shaft. The cable was level and parallel to the axis of motion. A photograph of the installation is shown in Figure 3.3.

Iron Gate Air Admission Test Revision B December 2008
Principia Research Page 3-2
3.3.4. Air Flow Air flow was determined from measurement of the pressure drop from atmospheric at the throat of the bellmouth inlet to the air admission piping located on the downstream wall of the powerhouse. Two pressure taps were installed at the bellmouth throat. These taps were combined by a tee, and the difference between the throat pressure and the atmospheric pressure was measured by a Rosemount 3051C-D1differential pressure cell. A schematic of the bellmouth inlet is shown in Figure 3.4 and a photograph of the installation is shown in Figure 3.5.
3.3.5. Draft Tube Pressure Draft tube pressure was measured by a Rosemount 3051C-D4 differential pressure cell connected to a pressure tap at the exposed section of the draft tube liner near the mandoor. A photograph of the installation is shown in Figure 3.6.
3.3.6. Air Temperature and Relative Humidity Air temperature and relative humidity were measured by an Omega HX-90 transmitter located just inside the door to the powerhouse, near the bellmouth inlet.
3.3.7. Atmospheric Pressure Air pressure was measured by a Rosemount 3051CA absolute pressure transmitter located near the data acquisition equipment in the office building.
3.3.8. Water Temperature Water temperature was measured using a Dwyer 3-wire RTD transmitter immersed in water continuously drawn from a tap on the raw cooling water line near the turbine pedestal.
3.3.9. Generator Output Generator output was obtained from a 4-20 mA analog output on the powerhouse’s Siemens wattmeter located in the control room.
3.3.10. Total Powerhouse Discharge The total powerhouse discharge was obtained from a 4-20 mA analog output on the Accusonic flowmeter located in the office building.
3.3.11. Headwater Elevation Headwater elevation is measured by a submersible pressure cell at the headworks. The instrument reading was obtained from a 4-20 mA analog located in the control room
3.3.12. Tailwater Elevation Tailwater elevation was measured from a temporarily-installed installation provided by PacifiCorp. The measurement was made using a Druck submersible pressure cell suspended in a PVC pipe serving as a stilling well attached to the taildeck near the existing staff gage. The 4-20 output from the pressure cell was recorded by the data acquisition system in the office building. A photograph of the installation is shown in Figure 3.7.

Iron Gate Air Admission Test Revision B December 2008
Principia Research Page 3-3
Table 3.1: Instrumentation
Parameter Location Units Instrument Model
PRC InstrumentationWK flowmeter differential Spiral case in H2O Differential pressure cell Rosemount 3051CWK flowmeter differential Spiral case in H2O Differential pressure cell Rosemount 3051CInlet head Turbine inlet ft H2O Gage pressure cell Rosemount 3051C
Gate position Governor inches Cable extension xducer Celesco PT420-30Air flow differential Bellmouth inlet in H2O Differential pressure cell Rosemount 3051CDraft tube pressure Draft tube liner in H2O Gage pressure cell Rosemount 3051C
Water temperature Cooling water line Deg F RTD Dwyer 650Air temperature Powerhouse entrance Deg F RTD Omega HX-10Relative humidity Powerhouse entrance % RH transducer Omega HX-10Atmospheric pressure Office psia Absolute pressure cell Rosemount 3051CData acquisition Office - Data acquisition system HP34970A
Plant InstrumentationGeneration Control room MW Plant wattmeter SeimensTotal plant discharge Accusonic cabinet cfs Acoustic flowmeter AccusonicForebay elevation Control room feet Submersible press. cell DruckTailwater elevation Taildeck @ staff gage feet Submersible press. cell Druck

Iron Gate Air Admission Test Revision B December 2008
Principia Research Page 3-4
Figure 3.1: Inlet Head and Winter-Kennedy Piezometer Taps

Iron Gate Air Admission Test Revision B December 2008
Principia Research Page 3-5
Figure 3.2: Inlet and Winter-Kennedy Pressure Cell Installation
Figure 3.3: Servo Gate Stroke Measurement

Iron Gate Air Admission Test Revision B December 2008
Principia Research Page 3-6
Figure 3.4: Schematic of Bellmouth Inlet
Figure 3.5: Bellmouth Inlet

Iron Gate Air Admission Test Revision B December 2008
Principia Research Page 3-7
Figure 3.6: Draft Tube Pressure Measurement
Figure 3.7: Tailwater Measurement


Iron Gate Air Admission Test Revision B December 2008
Principia Research Page 4-1
4. TEST CONDITIONS AND PROCEDURES
4.1. Test Conditions The tests described in this report were run in general accordance with ASME PTC 18-2002 [ASME, 2002], the American National Standard test code for hydroturbine testing.
Because the total powerhouse discharge from the Iron Gate project is tightly regulated, the range of test conditions possible was very limited. During the test week the powerhouse discharge was constant at 1000 cfs on August 18 – 19, transitioned to a flow of 1500 cfs early afternoon on August 20, and remained constant at 1500 cfs for the testing on August 20 – 21. The turbine efficiency testing was conducted on the afternoon of August 20 at a total powerhouse discharge of 1500 cfs.
In addition, air flow data, Winter-Kennedy differential pressures, and the total powerhouse discharge measured by the acoustic flowmeter were recorded on August 19 at a powerhouse discharge of 1000 cfs. This gave an additional point for calibrating the Winter-Kennedy flowmeters.
Complete air flow and turbine performance data was also recorded during in-stream water quality surveys conducted on the afternoon of August 21. The powerhouse and turbine discharges were constant during this period.
4.2. Test Procedures The turbine performance and air flow tests on August 20 were performed at a nominal net head of 150 ft. Because the total powerhouse discharge was held constant at 1500 cfs, the tailwater elevation showed very little change during the tests, averaging about 2171.75 ft elevation.
Constant powerhouse flow was achieved by using the Howell-Bunger bypass valve to balance the flow as the turbine was operated at different gate openings. The Winter-Kennedy flowmeter taps in the spiral case were calibrated against the penstock acoustic flowmeter, allowing the portion of the flow passing through the turbine to be directly measured.
Testing was conducted at gate openings from 30% to about 85% at 5% increments. 86% was the highest gate opening achievable under the flow constraint of 1500 cfs. Tests over the full operating range were conducted with the air valve open and the air valve closed. Powerhouse and PRC instrumentation monitored the performance of the generating unit and the airflow being admitted to the headcover through the bellmouth inlet at the taildeck.
The linkage connecting the air valve to the gate ring was disconnected so that the air valve could be operated independently of gate position. The air-on tests were all conducted with air valve fully open.
The general test procedure was as follows:
1. The unit was set to the desired gate opening or power output, with MVARs (Volt-Amps Reactive) held as close to zero as possible. The Howell-Bunger valve

Iron Gate Air Admission Test Revision B December 2008
Principia Research Page 4-2
automatically compensated for the change in turbine flow to maintain the powerhouse discharge at a constant 1500 cfs.
2. Power output was allowed to stabilize, usually taking two to three minutes.
3. Data collection was initiated and continued for a minimum 200 scans of all instruments. All measurement points were scanned once every second.
4. The unit was set to the next desired gate opening, and this procedure was repeated.
Between test runs, preliminary analysis and plotting of the data just acquired were performed to assess the reasonableness and quality of the results.
Iron Gate Air Admission Test Revision B December 2008
Principia Research Page 5-1
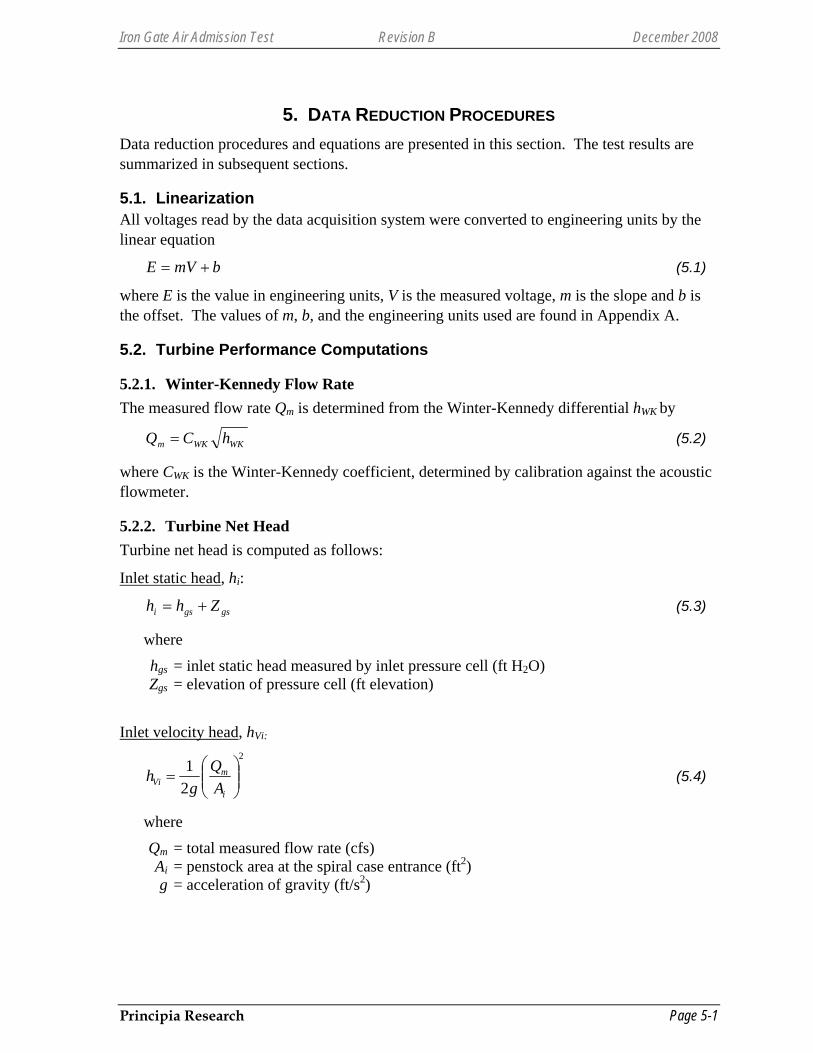
5. DATA REDUCTION PROCEDURES Data reduction procedures and equations are presented in this section. The test results are summarized in subsequent sections.
5.1. Linearization All voltages read by the data acquisition system were converted to engineering units by the linear equation
bmVE += (5.1)
where E is the value in engineering units, V is the measured voltage, m is the slope and b is the offset. The values of m, b, and the engineering units used are found in Appendix A.
5.2. Turbine Performance Computations
5.2.1. Winter-Kennedy Flow Rate The measured flow rate Qm is determined from the Winter-Kennedy differential hWK by
WKWKm hCQ = (5.2)
where CWK is the Winter-Kennedy coefficient, determined by calibration against the acoustic flowmeter.
5.2.2. Turbine Net Head Turbine net head is computed as follows:
Inlet static head, hi:
gsgsi Zhh += (5.3)
where
hgs = inlet static head measured by inlet pressure cell (ft H2O) Zgs = elevation of pressure cell (ft elevation)
Inlet velocity head, hVi:
2
21
⎟⎟⎠
⎞⎜⎜⎝
⎛=
i
mVi A
Qg
h (5.4)
where
Qm = total measured flow rate (cfs) Ai = penstock area at the spiral case entrance (ft2) g = acceleration of gravity (ft/s2)

Iron Gate Air Admission Test Revision B December 2008
Principia Research Page 5-2
Inlet total head, Hi:
Viii hhH += (5.5)
Discharge static head, hd:
dsdsd Zhh += (5.6)
where
hds = pressure measured by tailwater submersible pressure cell (ft H2O) Zgs = elevation of submersible pressure cell (ft elevation)
Discharge velocity head, hVd: 2
21
⎟⎟⎠
⎞⎜⎜⎝
⎛=
d
mVd A
Qg
h (5.7)
Ad = total area at the draft tube opening to the tailrace (ft2)
Discharge total head, Hd:
Vddd hhH += (5.8)
Turbine net head at test conditions, HT:
diT HHH −= (5.9)
Constants and areas used in the above equations are summarized in Table 5.1.
5.2.3. Generator Efficiency and Loss The generator efficiency curve was obtained from PacifiCorp Drawing C-8893. A plot of this curve along with the associated generator loss as a function of generator output is given in Figure 5.1. Generator loss was calculated from generator efficiency by
⎟⎟⎠
⎞⎜⎜⎝
⎛−= 11
GeG PLη
. (5.10)
For ease of computation, the following quadratic curve fit was developed for generator loss: 303554.01019880.61060499.6 424 +×−×= −−
eeg PPL . (5.11)
Graphs of the generator efficiency and derived generator loss are shown in Figure 5.1.

Iron Gate Air Admission Test Revision B December 2008
Principia Research Page 5-3
Table 5.1: Constants and Parameters Used in Analyses
General ParametersLatitude 41.93 deg NDistributor CL elevation 2175.00 2175Water temperature 72 deg FLocal gravity 32.1564 ft/s2
Water density 62.2960 lbm/ft3
Air density 0.0666 lbm/ft3
Sp. Wt. of water in air 62.270 lbf/ft3
Spiral case inlet area 78.53 ft2
Draft tube exit area 220.91 ft2
ElevationsTurbine floor 2183.00 ftInlet pressure cell 2183.13 ftTailwater pressure cell 2170.04 ftDraft tube pressure cell 2165.04 ft
y = 6.60499E‐04x2 ‐ 6.19880E‐04x + 3.03554E‐01
0.0
0.1
0.2
0.3
0.4
0.5
0.6
0.7
0.8
0.9
1.0
93
94
95
96
97
98
0 5 10 15 20
Gen
erator Loss (M
W)
Gen
erator Efficiency (%)
Generator Output (MW)
Iron Gate Generator Efficiency and Loss
Generator Efficiency
Generator Loss
Figure 5.1: Generator Efficiency and Loss

Iron Gate Air Admission Test Revision B December 2008
Principia Research Page 5-4
5.2.4. Turbine output Turbine power output at test conditions is computed from the sum of the measured generator output and the generator losses:
geT LPP += . (5.12)
Note: 1 MW = 1,341 hp.
5.2.5. Turbine Efficiency Turbine efficiency ηt is computed from
( ) Tmc
Thpt HQg
Pρ
η 550= (5.13)
where PThp = turbine output (hp) ρ = density of water (lbm/ft3) gc = gravitational constant = 32.174 Water density is computed from water temperature, station elevation, and station latitude according to equations found in ASME PTC 18 [ASME, 2002]. Note that the term ρ/gc is the water density in terms of slugs.
5.2.6. Unit Efficiency Unit efficiency is defined here as the efficiency of the turbine-generator, from the spiral case inlet to the draft tube exit:
( ) Tmc
e
HQgP
ρη 6.737= (5.14)
5.3. Air Flow Calculations Air flow calculation procedures described here generally follow those found in ASME Fluid Meters [ASME, 1971].
The equation relating the air velocity at the bellmouth inlet to the pressure difference between the inlet throat and the surrounding atmosphere is
2/1
2 ⎟⎟⎠
⎞⎜⎜⎝
⎛ Δ=
aa
pCYVρ
(5.15)
where, in any dimensionally consistent set of units,
Va = air velocity C = nozzle discharge coefficient Y = gas expansion factor Δp = pressure drop at inlet throat ρa = air density outside the bellmouth

Iron Gate Air Admission Test Revision B December 2008
Principia Research Page 5-5
When the velocity is in ft/sec, the pressure drop is in inches of water hw, and the density of air is in lbm/ft3, this equation reduces to
2/1
28.18 ⎟⎟⎠
⎞⎜⎜⎝
⎛=
a
wa
hCYV
ρ (5.16)
Air density is computed from the perfect gas relation:
)67.459(144+
=aa
aa TR
pρ (5.17)
where
Ta = air temperature (deg F) Ra = gas constant for air (53.343) pa = atmospheric pressure (psia) The gas expansion factor can be closely approximated by
a
w
ph
Y 5559.01−= (5.18)
The discharge coefficient is a function the Reynolds Number Re and can be approximated by 3/2Re60.341 −−=C (5.19)
The Reynolds Number is defined by
μρ DVaa=Re (5.20)
where D is the diameter of bellmouth inlet throat (ft) , and μ is the kinematic viscosity of the air (lbm/ft-sec).
The kinematic viscosity of air can be approximated by
aT85 10618.110102.1 −− ⋅+⋅=μ (5.21)
Because the discharge coefficient C used to compute the velocity at the bellmouth throat depends itself on the velocity, the equations above must be solved iteratively for each test.
The air flow Qa (ft3/s) at test conditions is then computed by
4/2DVQ aa π= (5.22)

Iron Gate Air Admission Test Revision B December 2008
Principia Research Page 5-6
Although relative humidity was measured, the effect of moisture on air density is small at the low relative humidities observed during testing, and is neglected in the computations.
5.4. Correction of Efficiency Test Results to Common Head The measured flow rate and turbine power output at the test head is corrected to a common head, Hc, by:
5.0
⎟⎠⎞
⎜⎝⎛
=T
cT H
HQQ (5.23)
5.1
⎟⎠⎞
⎜⎝⎛
=T
cT H
HPP (5.24)
No correction is required for efficiency.

Iron Gate Air Admission Test Revision B December 2008
Principia Research Page 6-1
6. PERFORMANCE AND AIR ADMISSION RESULTS
6.1. Winter-Kennedy Flowmeter Calibration Figure 6.1 shows the calibration of the both of the Winter-Kennedy tap pairs against the acoustic flow meter. Because of the discharge restrictions, only calibrations at 1000 and 1500 cfs were possible. However, when the measured flow is plotted against the square root of the Winter-Kennedy differentials, the resulting points lie along a line passing through the origin, as would be expected. The Winter-Kennedy coefficients are determined to be:
• Tap Pair R3-R1 CWK = 139.76
• Tap Pair R3-R2 CWK = 166.63
The turbine flow rate is calculated from:
WKWKm hCQ = . (6.1)
For analyses of test data, the R3-R1 tap pair was used for the determination of the turbine discharge.
The Winter-Kennedy calibrations show that the Winter-Kennedy taps can be used to determine the portion of the powerhouse flow which is passing through the turbine.
WK Coefficient = 139.76
WK Coefficient = 166.63
0
200
400
600
800
1,000
1,200
1,400
1,600
0 1 2 3 4 5 6 7 8 9 10 11 12
Acou
stic
Flo
wm
eter
(cfs
)
Sqrt WK (in H2O)
Iron GateWinter-Kennedy Flowmeter Calibration
R3-R1
R3-R2
Figure 6.1: Winter-Kennedy Flowmeter Calibrations
Iron Gate Air Admission Test Revision B December 2008
Principia Research Page 6-2
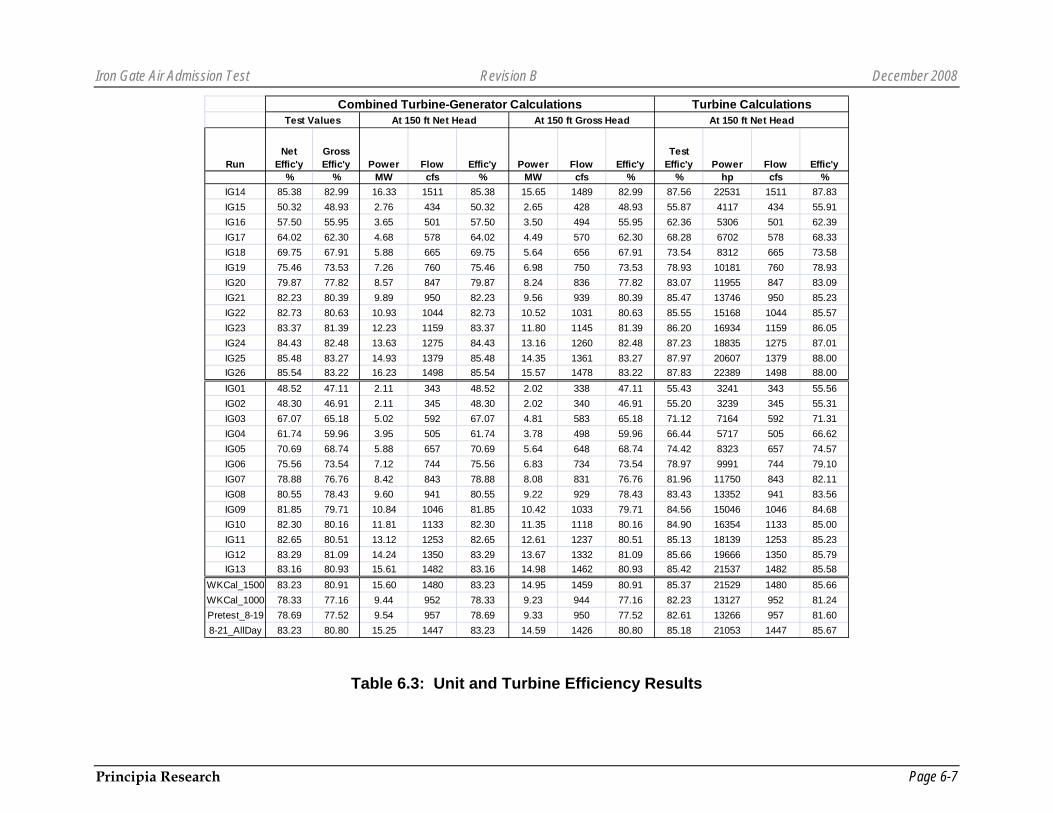
6.2. Basic Data and Calculations Tabular results of the performance and air admission tests are presented in Tables 6.1 – 6.4:
• Table 6.1 Raw Data
• Table 6.2 Basic Calculations
• Table 6.3 Unit and Turbine Efficiency Calculations
• Table 6.4 Air Admission Calculations
The calculations in these tables are based on the data reduction procedures described in Section 5.
6.3. Performance Results Figure 6.2 shows the unit (combined turbine and generator) efficiency as a function of power output for both the air-on and the air-off tests. The effect of air admission on efficiency is typical for units of this type: At lower power outputs, where the unit tends to cavitate and run roughly, the addition of air improves efficiency, by up to about 5%. At about 8 MW generator output (corresponding to a gate opening of about 50%), air admission has no effect on efficiency, and at higher power outputs, air admission causes a drop in efficiency.
The peak unit efficiency occurs at the maximum power output of about 16 MW achieved for these tests. With air on, peak efficiency is 85.5% whereas with air off, it drops to 83.3%, a decrease of 2.2%. The maximum power output at the 1500 cfs limit is reduced by about 0.8 MW.
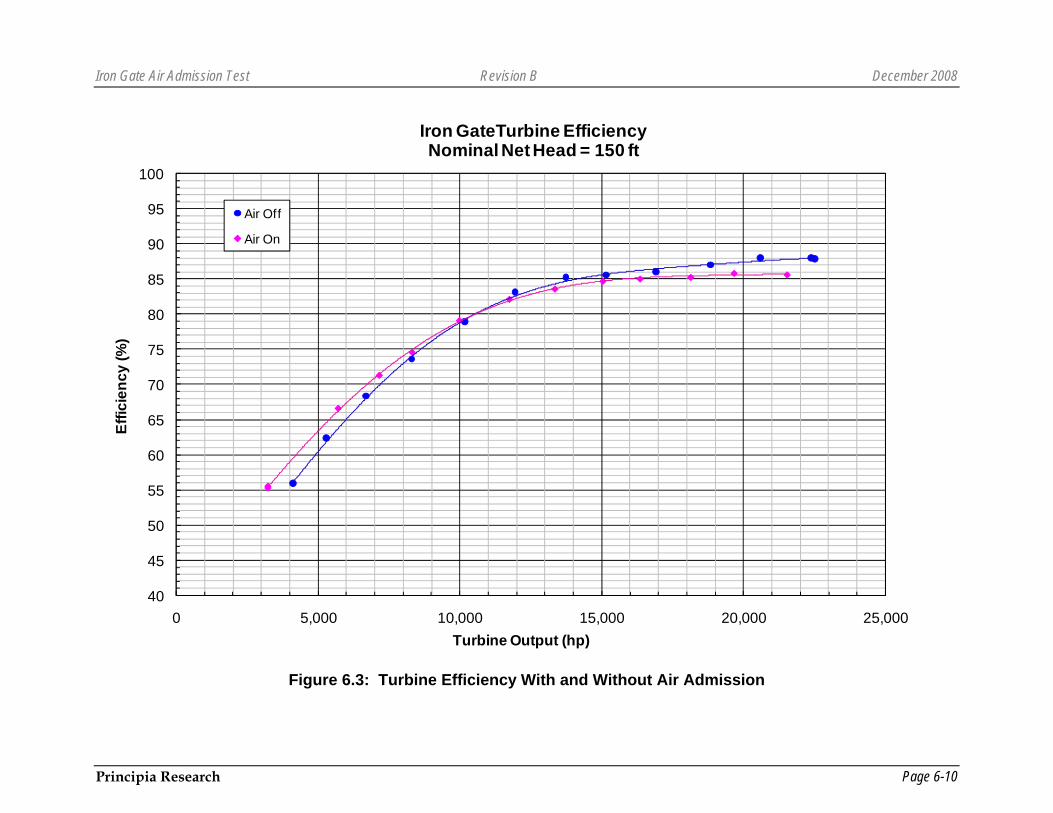
Figure 6.3 presents the same information, but considers the efficiency of the turbine alone. With air off, the peak efficiency is 88.0%, dropping to 85.8% with the air on, again a drop of 2.2%. Air admission reduces the maximum power output at 1500 cfs by about 850 hp or about 0.6 MW.
The effect of air admission on unit efficiency as a function of generator output is shown in Figure 6.4. It is seen that air admission improves efficiency by about 4.6% at 2 MW, dropping to a loss of efficiency of about 2% at 16 MW.
Curves of unit discharge as a function of generator output for the air-on and air-off cases are shown in Figure 6.5. These curves (and the shown curvefit equations) are useful for analysis and operational purposes.
6.4. Air Flow Results Figure 6.6 shows the air flow rate to the turbine plotted against turbine power ouput over the range of test conditions. Figure 6.7 shows the air flow rate plotted against the turbine flow rate. The air flow rate does not vary greatly, ranging from about 25 cfs at the lowest gate opening (30% gate, 260 cfs turbine discharge, 2.1 MW) to a maximum of about 35 cfs at the higher gate openings.
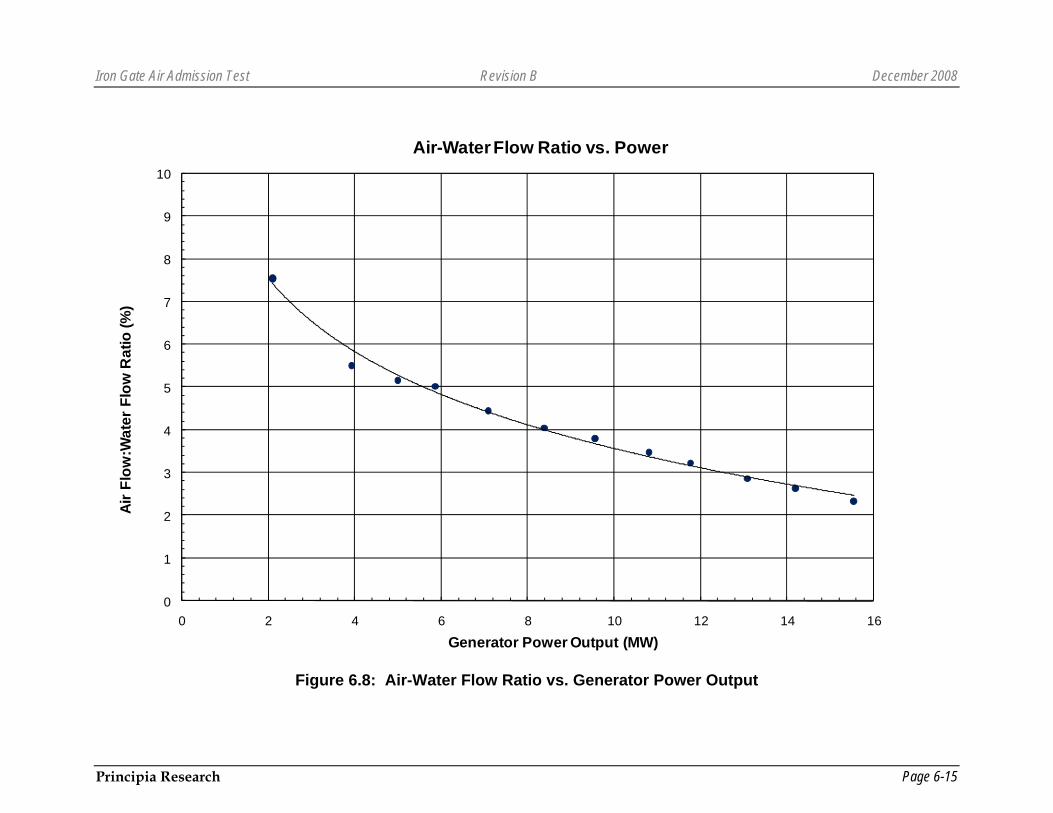
The ratio of air flow to water flow, which is measure of the relative potential for aeration, is shown in Figure 6.8 as a function of generator power, and in Figure 6.9 as a function of turbine flow. The air-water flow ratio is at a maximum at the lowest gate openings, with a

Iron Gate Air Admission Test Revision B December 2008
Principia Research Page 6-3
maximum of about 7.5%, and drops steadily to a value of about 2.4% at the maximum test gate opening.
In general, the 2.4% air-water flow ratio at the higher gate openings is relatively small and may lead to only a modest (but possible significant) increase in dissolved oxygen in the tailrace. The water quality studies conducted in conjunction with the testing reported here will determine the actual improvement observed.


Iron Gate Air Admission Test Revision B December 2008
Principia Research Page 6-5
Raw Data
Run TimeNum
ScansAir
Vent GateAcoustic
FlowPlant MW
W-K R3-R1
W-K R3-R2
Inlet Head
Tail-water
Plant HW
Air Flow
DT Press.
Atm. Press.
Air Temp
Rel. Humidity
Water Temp
PDT in cfs MW in H2O in H2O ft H2O ft ft in H2O ft H2O psia deg F % deg FIG14 8/20/08 16:30 201 Off 6.55 1503 16.25 116.46 81.61 133.15 1.72 2325.59 -0.06 0.43 13.58 86.59 42.33 71.62IG15 8/20/08 16:44 201 Off 19.32 1488 2.76 9.62 7.01 137.82 1.44 2325.60 -0.06 9.25 13.58 86.74 42.74 71.61IG16 8/20/08 16:53 202 Off 18.32 1483 3.64 12.84 9.20 137.79 1.48 2325.61 -0.07 10.11 13.59 86.81 42.65 71.59IG17 8/20/08 17:00 201 Off 17.25 1487 4.68 17.07 12.17 137.61 1.54 2325.61 -0.06 10.82 13.58 87.04 42.71 71.60IG18 8/20/08 17:06 202 Off 16.09 1484 5.87 22.65 16.18 137.45 1.60 2325.61 -0.06 10.77 13.58 87.07 42.50 71.59IG19 8/20/08 17:12 225 Off 14.87 1476 7.26 29.54 21.20 137.29 1.65 2325.62 -0.06 9.60 13.58 86.93 42.39 71.58IG20 8/20/08 17:18 208 Off 13.84 1482 8.57 36.75 26.47 136.97 1.68 2325.62 -0.06 8.04 13.58 86.77 42.66 71.60IG21 8/20/08 17:24 202 Off 12.61 1481 9.93 46.31 33.22 137.06 1.72 2325.62 -0.06 5.06 13.58 86.96 42.47 71.64IG22 8/20/08 17:30 203 Off 11.63 1478 10.93 55.78 39.84 136.19 1.71 2325.62 -0.06 4.90 13.58 86.88 42.56 71.54IG23 8/20/08 17:39 202 Off 10.30 1474 12.26 68.87 48.92 135.89 1.69 2325.63 -0.06 6.30 13.58 86.55 43.30 71.54IG24 8/20/08 17:47 201 Off 9.07 1474 13.68 83.41 59.12 135.36 1.66 2325.64 -0.06 5.45 13.58 86.40 44.14 71.61IG25 8/20/08 17:53 218 Off 7.95 1487 14.92 97.32 68.71 134.36 1.68 2325.64 -0.06 2.68 13.58 86.25 44.31 71.53IG26 8/20/08 18:00 275 Off 6.68 1496 16.18 114.71 80.54 133.42 1.73 2325.65 -0.07 0.30 13.58 86.03 44.57 71.53IG01 8/20/08 14:57 216 On 21.11 1502 2.10 6.03 4.63 137.67 1.36 2325.54 3.48 13.52 13.59 86.13 42.64 71.64IG02 8/20/08 15:03 316 On 21.16 1496 2.10 6.08 4.69 137.70 1.35 2325.54 3.53 13.52 13.58 86.30 42.76 71.63IG03 8/20/08 15:10 201 On 17.04 1505 5.00 17.87 12.78 137.30 1.55 2325.53 4.88 13.48 13.58 86.58 41.84 71.63IG04 8/20/08 15:18 212 On 18.33 1517 3.93 13.04 9.30 137.45 1.50 2325.55 4.04 13.41 13.58 86.80 42.17 71.63IG05 8/20/08 15:26 202 On 16.14 1490 5.87 22.08 15.90 137.24 1.59 2325.55 5.72 9.58 13.58 86.84 42.46 71.61IG06 8/20/08 15:32 203 On 15.01 1477 7.10 28.29 20.31 137.09 1.63 2325.55 5.76 8.21 13.58 86.64 42.87 71.62IG07 8/20/08 15:37 201 On 13.69 1496 8.39 36.29 26.15 136.75 1.68 2325.55 6.14 6.11 13.58 86.48 43.54 71.62IG08 8/20/08 15:44 206 On 12.53 1490 9.57 45.26 32.41 136.44 1.71 2325.56 6.79 4.21 13.58 86.41 43.15 71.61IG09 8/20/08 15:51 211 On 11.28 1480 10.82 55.98 40.01 136.02 1.72 2325.57 7.02 2.45 13.58 86.29 43.10 71.60IG10 8/20/08 15:58 209 On 10.33 1470 11.79 65.65 46.76 135.62 1.72 2325.57 7.12 1.45 13.59 86.46 43.07 71.58IG11 8/20/08 16:06 214 On 9.04 1472 13.10 80.34 56.96 134.99 1.71 2325.57 6.84 0.34 13.58 86.74 43.37 71.61IG12 8/20/08 16:13 207 On 7.98 1465 14.20 93.15 65.78 134.38 1.71 2325.58 6.71 -0.63 13.58 86.90 43.54 71.62IG13 8/20/08 16:22 205 On 6.57 1479 15.56 112.23 78.77 133.50 1.70 2325.59 6.33 -1.73 13.58 86.64 43.37 71.61
WKCal_1500 8/20/08 14:39 153 On 6.56 1475 15.52 111.79 78.61 133.29 1.69 2325.51 6.37 - 13.59 86.36 41.94 71.65WKCal_1000 8/20/08 10:42 98 On 12.70 961 9.61 46.92 33.04 138.01 1.30 2325.45 7.33 - - 83.43 47.49 79.31Pretest_8-19 8/19/08 18:40 138 On 12.65 963 9.72 - - 138.02 1.28 2325.47 7.11 - - 82.50 36.84 72.208-21_AllDay 8/21/08 12:38 1939 On 6.97 1114 15.12 106.59 74.99 133.14 1.68 2325.33 6.48 -1.39 13.63 83.79 40.11 71.73
Table 6.1: Raw Data

Iron Gate Air Admission Test Revision B December 2008
Principia Research Page 6-6
Basic Calculations
RunGate
StrokeGate
StrokeWK41 Flow
WK42 Flow
Flow Used in
Calcs HW ElInlet Vel
Inlet Vel
HeadExit Vel
Exit Vel
Head
Inlet Static Head
Inlet Total Head
Disch Static Head
Disch Total Head
Net Head
Gross Head
Gen Loss
Gen Effic'y
Turbine Output
% in cfs cfs cfs ft ft/s ft ft/s ft ft ft ft ft ft ft MW % hpIG14 85.8 19.80 1508 1505 1508 2325.59 19.21 5.74 6.83 0.72 2316.27 2322.01 2171.75 2172.48 149.53 153.83 0.47 97.20 22,425IG15 30.5 7.03 434 441 434 2325.60 5.52 0.47 1.96 0.06 2320.95 2321.42 2171.47 2171.53 149.89 154.13 0.31 89.99 4,113IG16 34.8 8.02 501 505 501 2325.61 6.38 0.63 2.27 0.08 2320.92 2321.55 2171.52 2171.60 149.95 154.09 0.31 92.16 5,303IG17 39.5 9.10 577 581 577 2325.61 7.35 0.84 2.61 0.11 2320.73 2321.57 2171.58 2171.68 149.89 154.03 0.32 93.69 6,694IG18 44.5 10.26 665 670 665 2325.61 8.47 1.12 3.01 0.14 2320.57 2321.69 2171.63 2171.77 149.92 153.98 0.32 94.79 8,305IG19 49.8 11.48 760 767 760 2325.62 9.67 1.45 3.44 0.18 2320.41 2321.87 2171.68 2171.87 150.00 153.94 0.33 95.60 10,181IG20 54.2 12.51 847 857 847 2325.62 10.79 1.81 3.84 0.23 2320.10 2321.91 2171.71 2171.94 149.97 153.91 0.35 96.11 11,952IG21 59.6 13.74 951 960 951 2325.62 12.11 2.28 4.31 0.29 2320.18 2322.46 2171.75 2172.04 150.42 153.87 0.36 96.48 13,803IG22 63.8 14.72 1044 1052 1044 2325.62 13.29 2.75 4.72 0.35 2319.31 2322.06 2171.75 2172.09 149.97 153.88 0.38 96.68 15,162IG23 69.6 16.04 1160 1165 1160 2325.63 14.77 3.39 5.25 0.43 2319.02 2322.41 2171.73 2172.16 150.25 153.90 0.40 96.88 16,977IG24 74.9 17.28 1276 1281 1276 2325.64 16.25 4.11 5.78 0.52 2318.48 2322.59 2171.69 2172.21 150.38 153.95 0.42 97.03 18,907IG25 79.8 18.39 1379 1381 1379 2325.64 17.56 4.79 6.24 0.61 2317.48 2322.28 2171.72 2172.33 149.95 153.92 0.44 97.13 20,597IG26 85.3 19.66 1497 1495 1497 2325.65 19.06 5.65 6.78 0.71 2316.54 2322.19 2171.76 2172.48 149.72 153.88 0.47 97.20 22,325IG01 22.7 5.23 343 358 343 2325.54 4.37 0.30 1.55 0.04 2320.80 2321.09 2171.40 2171.43 149.66 154.14 0.31 87.33 3,230IG02 22.5 5.19 345 361 345 2325.54 4.39 0.30 1.56 0.04 2320.83 2321.13 2171.38 2171.42 149.71 154.15 0.31 87.33 3,230IG03 40.3 9.30 591 596 591 2325.53 7.52 0.88 2.67 0.11 2320.43 2321.31 2171.59 2171.70 149.61 153.95 0.32 94.04 7,136IG04 34.8 8.01 505 508 505 2325.55 6.43 0.64 2.28 0.08 2320.57 2321.21 2171.54 2171.62 149.59 154.01 0.31 92.67 5,693IG05 44.2 10.20 657 664 657 2325.55 8.36 1.09 2.97 0.14 2320.37 2321.46 2171.62 2171.76 149.69 153.93 0.32 94.79 8,298IG06 49.2 11.34 743 751 743 2325.55 9.47 1.39 3.36 0.18 2320.21 2321.61 2171.66 2171.84 149.77 153.89 0.33 95.53 9,968IG07 54.9 12.65 842 852 842 2325.55 10.72 1.79 3.81 0.23 2319.87 2321.66 2171.72 2171.94 149.71 153.84 0.34 96.05 11,716IG08 59.9 13.82 940 949 940 2325.56 11.97 2.23 4.26 0.28 2319.56 2321.79 2171.75 2172.03 149.76 153.81 0.36 96.39 13,320IG09 65.3 15.06 1046 1054 1046 2325.57 13.32 2.76 4.73 0.35 2319.14 2321.90 2171.76 2172.11 149.79 153.81 0.37 96.66 15,014IG10 69.5 16.02 1132 1139 1132 2325.57 14.42 3.23 5.13 0.41 2318.75 2321.98 2171.76 2172.16 149.82 153.82 0.39 96.81 16,325IG11 75.0 17.30 1253 1258 1253 2325.57 15.95 3.96 5.67 0.50 2318.12 2322.08 2171.74 2172.24 149.83 153.83 0.41 96.97 18,109IG12 79.6 18.36 1349 1351 1349 2325.58 17.18 4.59 6.11 0.58 2317.50 2322.09 2171.74 2172.32 149.77 153.84 0.43 97.07 19,620IG13 85.7 19.77 1481 1479 1481 2325.59 18.85 5.53 6.70 0.70 2316.62 2322.15 2171.74 2172.44 149.71 153.85 0.45 97.17 21,475
W KCal_1500 85.8 19.79 1478 1477 1478 2325.51 18.82 5.51 6.69 0.70 2316.41 2321.92 2171.72 2172.42 149.50 153.79 0.45 97.16 21,421W KCal_1000 59.2 13.65 957 958 957 2325.45 12.19 2.31 4.33 0.29 2321.14 2323.45 2171.33 2171.63 151.82 154.11 0.36 96.40 13,368Pretest_8-19 59.4 13.69 - - 963 2325.47 12.27 2.34 4.36 0.30 2321.14 2323.48 2171.32 2171.61 151.87 154.15 0.36 96.43 13,5148-21_AllDay 84.0 19.38 1443 1443 1443 2325.33 18.37 5.25 6.53 0.66 2316.26 2321.51 2171.72 2172.38 149.13 153.61 0.45 97.14 20,870
Table 6.2: Basic Calculations
Iron Gate Air Admission Test Revision B December 2008
Principia Research Page 6-7
Combined Turbine-Generator Calculations Turbine CalculationsTest Values At 150 ft Net Head At 150 ft Gross Head At 150 ft Net Head
RunNet
Effic'yGross Effic'y Power Flow Effic'y Power Flow Effic'y
Test Effic'y Power Flow Effic'y
% % MW cfs % MW cfs % % hp cfs %IG14 85.38 82.99 16.33 1511 85.38 15.65 1489 82.99 87.56 22531 1511 87.83IG15 50.32 48.93 2.76 434 50.32 2.65 428 48.93 55.87 4117 434 55.91IG16 57.50 55.95 3.65 501 57.50 3.50 494 55.95 62.36 5306 501 62.39IG17 64.02 62.30 4.68 578 64.02 4.49 570 62.30 68.28 6702 578 68.33IG18 69.75 67.91 5.88 665 69.75 5.64 656 67.91 73.54 8312 665 73.58IG19 75.46 73.53 7.26 760 75.46 6.98 750 73.53 78.93 10181 760 78.93IG20 79.87 77.82 8.57 847 79.87 8.24 836 77.82 83.07 11955 847 83.09IG21 82.23 80.39 9.89 950 82.23 9.56 939 80.39 85.47 13746 950 85.23IG22 82.73 80.63 10.93 1044 82.73 10.52 1031 80.63 85.55 15168 1044 85.57IG23 83.37 81.39 12.23 1159 83.37 11.80 1145 81.39 86.20 16934 1159 86.05IG24 84.43 82.48 13.63 1275 84.43 13.16 1260 82.48 87.23 18835 1275 87.01IG25 85.48 83.27 14.93 1379 85.48 14.35 1361 83.27 87.97 20607 1379 88.00IG26 85.54 83.22 16.23 1498 85.54 15.57 1478 83.22 87.83 22389 1498 88.00IG01 48.52 47.11 2.11 343 48.52 2.02 338 47.11 55.43 3241 343 55.56IG02 48.30 46.91 2.11 345 48.30 2.02 340 46.91 55.20 3239 345 55.31IG03 67.07 65.18 5.02 592 67.07 4.81 583 65.18 71.12 7164 592 71.31IG04 61.74 59.96 3.95 505 61.74 3.78 498 59.96 66.44 5717 505 66.62IG05 70.69 68.74 5.88 657 70.69 5.64 648 68.74 74.42 8323 657 74.57IG06 75.56 73.54 7.12 744 75.56 6.83 734 73.54 78.97 9991 744 79.10IG07 78.88 76.76 8.42 843 78.88 8.08 831 76.76 81.96 11750 843 82.11IG08 80.55 78.43 9.60 941 80.55 9.22 929 78.43 83.43 13352 941 83.56IG09 81.85 79.71 10.84 1046 81.85 10.42 1033 79.71 84.56 15046 1046 84.68IG10 82.30 80.16 11.81 1133 82.30 11.35 1118 80.16 84.90 16354 1133 85.00IG11 82.65 80.51 13.12 1253 82.65 12.61 1237 80.51 85.13 18139 1253 85.23IG12 83.29 81.09 14.24 1350 83.29 13.67 1332 81.09 85.66 19666 1350 85.79IG13 83.16 80.93 15.61 1482 83.16 14.98 1462 80.93 85.42 21537 1482 85.58
WKCal_1500 83.23 80.91 15.60 1480 83.23 14.95 1459 80.91 85.37 21529 1480 85.66WKCal_1000 78.33 77.16 9.44 952 78.33 9.23 944 77.16 82.23 13127 952 81.24Pretest_8-19 78.69 77.52 9.54 957 78.69 9.33 950 77.52 82.61 13266 957 81.608-21_AllDay 83.23 80.80 15.25 1447 83.23 14.59 1426 80.80 85.18 21053 1447 85.67
Table 6.3: Unit and Turbine Efficiency Results

Iron Gate Air Admission Test Revision B December 2008
Principia Research Page 6-8
Air Flow Data
Run GateAtm.
pressure Air tempRel.
humidity
Bell-mouth Diff'a l
Bell Coeff Air Vel Air Flow
Air:W ater Ratio
% psia deg F % in H2O - ft/s cfs %IG14 85.8 13.58 86.59 42.33 0.00 0.0 0.0 0.0 0.0IG15 30.5 13.58 86.74 42.74 0.00 0.0 0.0 0.0 0.0IG16 34.8 13.59 86.81 42.65 -0.01 0.0 0.0 0.0 0.0IG17 39.5 13.58 87.04 42.71 0.00 0.0 0.0 0.0 0.0IG18 44.5 13.58 87.07 42.50 0.00 0.0 0.0 0.0 0.0IG19 49.8 13.58 86.93 42.39 0.00 0.0 0.0 0.0 0.0IG20 54.2 13.58 86.77 42.66 0.00 0.0 0.0 0.0 0.0IG21 59.6 13.58 86.96 42.47 0.00 0.0 0.0 0.0 0.0IG22 63.8 13.58 86.88 42.56 0.00 0.0 0.0 0.0 0.0IG23 69.6 13.58 86.55 43.30 0.00 0.0 0.0 0.0 0.0IG24 74.9 13.58 86.40 44.14 0.00 0.0 0.0 0.0 0.0IG25 79.8 13.58 86.25 44.31 0.00 0.0 0.0 0.0 0.0IG26 85.3 13.58 86.03 44.57 -0.01 0.0 0.0 0.0 0.0IG01 22.7 13.59 86.13 42.64 3.54 0.993 131.7 25.9 7.5IG02 22.5 13.58 86.30 42.76 3.59 0.993 132.6 26.0 7.6IG03 40.3 13.58 86.58 41.84 4.94 0.994 155.3 30.5 5.2IG04 34.8 13.58 86.80 42.17 4.10 0.993 141.6 27.8 5.5IG05 44.2 13.58 86.84 42.46 5.78 0.994 167.9 33.0 5.0IG06 49.2 13.58 86.64 42.87 5.82 0.994 168.4 33.1 4.4IG07 54.9 13.58 86.48 43.54 6.20 0.994 173.7 34.1 4.1IG08 59.9 13.58 86.41 43.15 6.85 0.994 182.6 35.8 3.8IG09 65.3 13.58 86.29 43.10 7.08 0.995 185.5 36.4 3.5IG10 69.5 13.59 86.46 43.07 7.18 0.995 186.7 36.7 3.2IG11 75.0 13.58 86.74 43.37 6.90 0.994 183.2 36.0 2.9IG12 79.6 13.58 86.90 43.54 6.77 0.994 181.5 35.6 2.6IG13 85.7 13.58 86.64 43.37 6.39 0.994 176.3 34.6 2.3
W KCal_1500 85.8 13.59 86.36 41.94 6.43 0.994 176.9 34.7 2.4W KCal_1000 59.2 - 83.43 47.49 7.39 0.995 189.5 37.2 3.9Pretest_8-19 59.4 - 82.50 36.84 7.17 0.995 186.6 36.6 3.88-21_AllDay 84.0 13.63 83.79 40.11 6.54 0.994 178.4 35.0 2.4
Table 6.4: Air Flow Results

Iron Gate Air Admission Test Revision B December 2008
Principia Research Page 6-9
40
45
50
55
60
65
70
75
80
85
90
95
100
0 2 4 6 8 10 12 14 16 18 20
Effic
ienc
y (%
)
Generator Output (MW)
Iron Gate Unit EfficiencyNominal Net Head = 150 ft
Air Of f
Air OnNote: Solid lines are derived from power‐discharge curve fits.
Figure 6.2: Unit Efficiency With and Without Air Admission
Iron Gate Air Admission Test Revision B December 2008
Principia Research Page 6-10
40
45
50
55
60
65
70
75
80
85
90
95
100
0 5,000 10,000 15,000 20,000 25,000
Effic
ienc
y (%
)
Turbine Output (hp)
Iron GateTurbine EfficiencyNominal Net Head = 150 ft
Air Off
Air On
Figure 6.3: Turbine Efficiency With and Without Air Admission

Iron Gate Air Admission Test Revision B December 2008
Principia Research Page 6-11
‐5
‐4
‐3
‐2
‐1
0
1
2
3
4
5
0 2 4 6 8 10 12 14 16 18
Effic
ienc
y D
iffer
ence
(%)
Generator Output (MW)
Iron GateEffect of Air Admission on Unit Efficiency
150 ft Net Head
Efficiency Loss
EfficiencyG
ain
Figure 6.4: Effect of Air Admission on Unit Efficiency

Iron Gate Air Admission Test Revision B December 2008
Principia Research Page 6-12
y = ‐1.957694E‐02x4 + 7.670712E‐01x3 ‐9.451585E+00x2 + 1.170690E+02x + 1.672997E+02
y = ‐2.275597E‐02x4 + 9.073744E‐01x3 ‐1.166312E+01x2 + 1.358701E+02x + 1.014074E+02
0
200
400
600
800
1,000
1,200
1,400
1,600
0 2 4 6 8 10 12 14 16 18
Turb
ine
Dis
char
ge (c
fs)
Generator Output (MW)
Iron GateDischarge-Unit Power
150 ft Net Head
Air Off
Air On
Figure 6.5: Unit Discharge-Power Curves With and Without Air Admission

Iron Gate Air Admission Test Revision B December 2008
Principia Research Page 6-13
0
5
10
15
20
25
30
35
40
45
50
0 2 4 6 8 10 12 14 16
Air F
low
(cfs
)
Generator Power Output (MW)
Iron GateAir Flow vs. Power
Figure 6.6: Air Flow vs. Generator Power Outut

Iron Gate Air Admission Test Revision B December 2008
Principia Research Page 6-14
0
5
10
15
20
25
30
35
40
45
50
0 200 400 600 800 1000 1200 1400 1600
Air F
low
(cfs
)
Turbine Discharge (cfs)
Iron GateAir Flow vs. Turbine Discharge
Figure 6.7: Air Flow vs. Turbine Discharge
Iron Gate Air Admission Test Revision B December 2008
Principia Research Page 6-15
0
1
2
3
4
5
6
7
8
9
10
0 2 4 6 8 10 12 14 16
Air F
low
:Wat
er F
low
Rat
io (%
)
Generator Power Output (MW)
Air-Water Flow Ratio vs. Power
Figure 6.8: Air-Water Flow Ratio vs. Generator Power Output

Iron Gate Air Admission Test Revision B December 2008
Principia Research Page 6-16
0
1
2
3
4
5
6
7
8
9
10
0 200 400 600 800 1000 1200 1400 1600
Air F
low
:Wat
er F
low
Rat
io (%
)
Turbine Discharge (cfs)
Iron GateAir-Water Flow Ratio vs. Turbine Discharge
Figure 6.9: Unit Air-Water Flow Ratio vs. Turbine Discharge

Principia Research Page 7-1
7. SUMMARY AND CONCLUSIONS The generating unit at PacifiCorp’s Iron Gate Project powerhouse on the Klamath River has demonstrated that it is capable of drawing air through its air admission system over the entire range of operation. Although testing was conducted only at a total powerhouse discharge of 1500 cfs, this capability will likely be achievable at total powerhouse discharges up to the turbine capacity because the tailwater elevation (which heavily influences the air flow) varies little with powerhouse discharge.
The total air flow rate into the turbine remains relative constant at 25 – 35 cfs over the range of operating conditions. As a result, the air-water flow ratio decreases from a high of about 7.5% at the lowest gate openings to about 2.4 % at the maximum tested gate opening of 86%. Previous experience indicates that the increase in DO due to a 2.4% air-water flow ratio will be modest but measureable. The water quality surveys conducted concurrently with these tests will provide quantification of the DO improvement.
Air admission results in an increase in unit efficiency at gate openings below about 50% and a decrease at larger gate openings. At the maximum tested gate opening of 86%, the loss in efficiency was about 2%. Air admission also results in a decrease in maximum power output of about 0.8 MW.


Iron Gate Air Admission Test Revision B December 2008
Principia Research Page 8-1
8. REFERENCES
1. ASME, Performance Test Code 18 – Hydraulic Turbines, American Society of Mechanical Engineers, New York, 2002.
2. ASME, Fluid Meters, 6th Edition, American Society of Mechanical Engineers, New York, 1971.


IronG
ateRe
port-
B1.do
cm
APPENDICES
A. INSTRUMENTATION SPECIFICATIONS B. CALIBRATION DATA


Appendix A Instrumentation Specifications


User’s Guide
Publication Number 34970-90003 (order as 34970-90101 manual set) Edition 3, March 2003
© Copyright Agilent Technologies, Inc. 1997-2003
For Safety information, Warranties, and Regulatory information,see the pages following the Index.
Agilent 34970AData Acquistion / Switch Unit
Cover Page for Web Version ONLY (User’s Guide)

DC, Resistance, and Temperature Accuracy Specifications
± ( % of reading + % of range ) [1]
Includes measurement error, switching error, and transducer conversion error
Function Range [3] Test Current orBurden Voltage
24 Hour [2]
23 °C ± 1 °C
90 Day
23 °C ± 5 °C
1 Year
23 °C ± 5 °C
Temperature Coefficient /°C 0 °C – 18 °C 28 °C – 55 °C
DC Voltage 100.0000 mV1.000000 V 10.00000 V 100.0000 V 300.000 V
0.0030 + 0.00350.0020 + 0.00060.0015 + 0.00040.0020 + 0.00060.0020 + 0.0020
0.0040 + 0.00400.0030 + 0.00070.0020 + 0.00050.0035 + 0.00060.0035 + 0.0030
0.0050 + 0.00400.0040 + 0.00070.0035 + 0.00050.0045 + 0.00060.0045 + 0.0030
0.0005 + 0.00050.0005 + 0.00010.0005 + 0.00010.0005 + 0.00010.0005 + 0.0003
Resistance [4] 100.0000 Ω1.000000 kΩ10.00000 kΩ100.0000 kΩ1.000000 MΩ10.00000 MΩ100.0000 MΩ
1 mA current source1 mA100 µA10 µA5 µA500 nA500 nA || 10 MΩ
0.0030 + 0.00350.0020 + 0.00060.0020 + 0.00050.0020 + 0.00050.002 + 0.0010.015 + 0.0010.300 + 0.010
0.008 + 0.0040.008 + 0.0010.008 + 0.0010.008 + 0.0010.008 + 0.0010.020 + 0.0010.800 + 0.010
0.010 + 0.0040.010 + 0.0010.010 + 0.0010.010 + 0.0010.010 + 0.0010.040 + 0.0010.800 + 0.010
0.0006 + 0.00050.0006 + 0.00010.0006 + 0.00010.0006 + 0.00010.0010 + 0.00020.0030 + 0.00040.1500 + 0.0002
DC Current34901A Only
10.00000 mA100.0000 mA1.000000 A
< 0.1 V burden< 0.6 V< 2 V
0.005 + 0.010 0.010 + 0.004 0.050 + 0.006
0.030 + 0.0200.030 + 0.0050.080 + 0.010
0.050 + 0.0200.050 + 0.0050.100 + 0.010
0.002 + 0.0020 0.002 + 0.0005 0.005 + 0.0010
Temperature Type Best Range Accuracy [5] Extended Range Accuracy [5]
Thermocouple [6] BEJKNRST
1100°C to 1820°C-150°C to 1000°C-150°C to 1200°C-100°C to 1200°C -100°C to 1300°C 300°C to 1760°C 400°C to 1760°C-100°C to 400°C
1.2°C1.0°C1.0°C1.0°C1.0°C1.2°C1.2°C1.0°C
400°C to 1100°C-200°C to -150°C-210°C to -150°C-200°C to -100°C-200°C to -100°C -50°C to 300°C -50°C to 400°C
-200°C to -100°C
1.8°C1.5°C1.2°C1.5°C1.5°C1.8°C1.8°C1.5°C
0.03°C0.03°C0.03°C0.03°C0.03°C0.03°C0.03°C0.03°C
RTD R0 from 49Ωto 2.1 kΩ
-200°C to 600°C 0.06°C 0.003°C
Thermistor 2.2 k, 5 k, 10 k -80°C to 150°C 0.08°C 0.002°C
[1] Specifications are for 1 hour warm up and 61⁄2 digits[2] Relative to calibration standards[3] 20% over range on all ranges except 300 Vdc and 1 Adc ranges[4] Specifications are for 4-wire ohms function or 2-wire ohms using Scaling to remove the offset. Without Scaling, add 4Ω additional error in 2-wire ohms function.[5] 1 year accuracy. For total measurement accuracy, add temperature probe error. [6] Thermocouple specifications not guaranteed when 34907A module is present
Chapter 9 SpecificationsDC, Resistance, and Temperature Accuracy Specifications
404

DC Measurement and Operating Characteristics
DC Measurement Characteristics [1]
DC VoltageMeasurement Method:
A/D Linearity: Input Resistance: 100 mV, 1 V, 10 V ranges 100 V, 300 V ranges Input Bias Current: Input Protection:
Continuously Integrating, Multi-slope III A/D Converter0.0002% of reading + 0.0001% of range
Selectable 10 MΩ or >10 GΩ10 MΩ ±1%< 30 pA at 25 °C300 V on all ranges
ResistanceMeasurement Method: Offset Compensation:Max. Lead Resistance:
Input Protection:
Selectable 4-wire or 2-wire Ohms,Current source reference to LO inputSelectable on 100Ω, 1 kΩ, 10 kΩ ranges10% of range per lead for 100Ω and1 kΩ ranges. 1 kΩ on all other ranges300 V on all ranges
DC CurrentShunt Resistance:Input Protection:
5Ω for 10 mA, 100 mA; 0.1Ω for 1A.1.5A 250 V fuse on 34901A module
ThermocoupleConversion:Reference Junction Type:Open T/C Check:
ITS-90 software compensationInternal, Fixed, or ExternalSelectable per channel. Open > 5 kΩ
RTD α = 0.00385 (DIN/IEC 751) using ITS-90 software compensation orα = 0.00391 using IPTS-68 softwarecompensation.
Thermistor 44004, 44007, 44006 series
Measurement Noise Rejection 60 Hz (50 Hz) [2]
DC CMRR:
Integration Time200 PLC / 3.33s (4s)100 PLC / 1.67s (2s)20 PLC / 333 ms (400 ms)10 PLC / 167 ms (200 ms)2 PLC / 33.3 ms (40 ms)1 PLC / 16.7 ms (20 ms)< 1 PLC
140 dB
Normal Mode Rejection [3]
110 dB [4]
105 dB [4]
100 dB [4]
95 dB [4]
90 dB 60 dB 0 dB
DC Operating Characteristics [5]
FunctionDCV, DCI, andResistance:
Digits [6] 61⁄261⁄251⁄251⁄241⁄2
Readings/s0.6 (0.5)
6 (5)60 (50)
300600
Additional Noise Error 0% of range 0% of range 0.001% of range 0.001% of range [7]
0.01% of range [7]
Single Channel Measurement Rates [8]
FunctionDCV, 2-Wire Ohms:
Thermocouple:
RTD, Thermistor:
Resolution 61 ⁄2 (10 PLC) 51 ⁄2 (1 PLC) 41 ⁄2 (0.02 PLC)
0.1 °C (1 PLC) (0.02 PLC)
0.01 °C (10 PLC) 0.1 °C (1 PLC) 1 °C (0.02 PLC)
Readings/s6 (5)
57 (47)600
57 (47)220
6 (5)57 (47)
220
Autozero OFF OperationFollowing instrument warm-up at calibration temperature ±1 °Cand < 10 minutes, add 0.0002% range additional error + 5 µV.
Settling ConsiderationsReading settling times are affected by source impedance, low dielectric absorption characteristics, and input signal changes.
[1] 300 Vdc isolation voltage (ch-ch, ch-earth)[2] For 1 kΩ unbalance in LO lead[3] For power line frequency ±0.1%[4] For power line frequency ±1%, use 80 dB. For power line frequency ±3%, use 60 dB. [5] Reading speeds for 60 Hz and (50 Hz) operation; autozero OFF[6] 61⁄2 digits=22 bits, 51 ⁄2 digits=18 bits, 41⁄2 digits=15 bits[7] Add 20 µV for DCV, 4 µA for DCI, or 20 mΩ for resistance[8] For fixed function and range, readings to memory, scaling and alarms off, autozero OFF
9
Chapter 9 SpecificationsDC Measurement and Operating Characteristics
405


www.rosemount.com
Reference Manual 00809-0100-4001, Rev EA
December 2002
Model 3051 Pressure Transmitterwith HART protocol®

Reference Manual00809-0100-4001, Rev EA
December 2002Model 3051
A-2
Stability
±0.125% of URL for 5 years for ±50 °F (28 °C) temperature changes, and up to 1000 psi
(6,9 MPa) line pressure
Dynamic Performance Total Response Time (Td + Tc)
100 ms
Model 3051L—Liquid Level
Reference Accuracy
±0.075% of span
Model 3051H—High Process Temperature
Reference Accuracy
±0.075% of span
Stability
±0.1% of URL for 12 months for Ranges 2 and 3
±0.2% of URL for 12 months for Ranges 4 and 5
DETAILED PERFORMANCE SPECIFICATIONS
For zero-based spans, reference conditions, silicone oil fill, SST materials, Coplanar flange (Model 3051C) or 1/2 in.- 18 NPT (Model 3051T) process connections, digital trim values set to equal range points.
Reference Accuracy Stated reference accuracy includes hysteresis, terminal-based linearity and repeatability.
Model 3051CD Ranges 2–5 and 3051CG
±0.075% of span for spans less than 10:1, accuracy =
Model 3051CD Range 1
±0.10% of span for spans less than 15:1, accuracy =
Model 3051CD Range 0
±0.10% of span for spans less than 2:1, accuracy = ±0.05% of URL
Model 3051T/CA Ranges 1–5
±0.075% of span for spans less than 10:1, accuracy =
Model 3051CA Range 0
±0.075% of span for spans less than 5:1, accuracy =
Model 3051H/3051L
±0.075% of span for spans less than 10:1, accuracy =
Model 3051P
±0.05% of span
0.025 0.005+URL
Span--------------- % of Span±
0.025 0.005+URL
Span--------------- % of Span±
0.0075URL
Span--------------- % of Span±
0.025 0.01+URL
Span--------------- % of Span±
0.025 0.005+URL
Span--------------- % of Span±

Reference Manual 00809-0100-4001, Rev EA
December 2002
A-3
Model 3051
Ambient Temperature Effect per 50 °F (28 °C)
Model 3051CD/CG
Range 2 - 5:±(0.0125% URL + 0.0625% span) from 1:1 to 5:1
±(0.025% URL + 0.125% span) from 5:1 to 100:1
Range 1: ±(0.1% URL + 0.25% span) from 1:1 to 30:1
±(0.147% URL + 0.15% span) greater than 30:1
Range 0: ±(0.25% URL + 0.05% span)
Model 3051CA
Range 1 - 4: ±(0.025% URL + 0.125% span) from 1:1 to 30:1
±(0.035% URL + 0.125% span) from 30:1 to 100:1
Range 0: ± (0.1% URL +0.25% span)
Model 3051P
All ranges: ±(0.006% URL + 0.03% span)
Model 3051H
All ranges: ±(0.025% URL + 0.125% span + 0.35 inH2O)
For spans below 30:1 rangedown:
±(0.035% URL + 0.125% span + 0.35 inH2O)
Model 3051L
See Rosemount Inc. Instrument Toolkit™ software.
Model 3051T
Ranges 2- 4: ±(0.025% URL + 0.125% span) from 1:1 to 30:1
±(0.035% URL + 0.125% span) from 30:1 to 100:1
Range 5: ±(0.1% URL + 0.15% span)
Range 1: ±(0.025% URL + 0.125% span) from 1:1 to 10:1
±(0.05% URL + 0.125% span) from 10:1 to 100:1

Reference Manual 00809-0100-4001, Rev EA
December 2002
A-5
Model 3051
Mounting Position Effects
Model 3051C/P
Zero shifts up to ±1.25 inH2O (3,11 mbar),
which can be calibrated out. No span effect.
Model 3051H
Zero shifts up to ±5 inH2O (127 mmH2O),
which can be calibrated out. No span effect.
Model 3051L
With liquid level diaphragm in vertical plane,
zero shift of up to 1 inH2O (25,4 mmH2O).
With diaphragm in horizontal plane, zero shift of up to 5 inH2O (127 mmH2O)
plus extension length on extended units. All zero shifts can be calibrated out.
No span effect.
Model 3051T/CA
Zero shifts up to 2.5 inH2O (63,5 mmH2O), which can be calibrated out.
No span effect.
Vibration Effect All Models
Measurement effect due to vibrations is negligible except at resonance
frequencies. When at resonance frequencies, vibration effect is less than
±0.1% of URL per g when tested between 15 and 2000 Hz in any axis relative
to pipe-mounted process conditions.
Power Supply Effect All Models
Less than ±0.005% of calibrated span per volt.
RFI Effects All Models
±0.1% of span from 20 to 1000 MHz and for field strength up to 30 V/m.
Shielded cable needed for 30 V/m.
Transient Protection (Option Code T1)
All Models
Meets IEEE Standard 587, Category B
1 kV crest (10 × 1 000 microseconds)
3 kV crest (8 × 20 microseconds)
6 kV crest (1,2 × 50 microseconds)
Meets IEEE Standard 472, Surge Withstand Capability
SWC 2,5 kV crest, 1 MHz wave form
General Specifications:
Response Time: < 1 nanosecond
Peak Surge Current: 5000 amps to housing.
Peak Transient Voltage: 100 V dc.
Loop Impedance: < 25 ohms
Applicable Standards: IEC 801-4, IEC 801-5
NOTE:
Calibrations at 68 °F (20 °C) per ASME Z210.1 (ANSI)

Celesco Transducer Products, Inc.20630 Plummer Street • Chatsworth, CA • 91311
tel: (800) 423-5483 • (818) 701-2750fax: (818) 701-2799
e-mail: [email protected]
www.celesco.com
112
Short to Medium Range
4...20 mA Output
Cable-Extension Position Transducer
PT420The PT420 is available with full-scalemeasurement ranges from 2 to 100inches, providing a 0/4-20 mA feed-back signal that is linearly proportionalto the position of a traveling stainless-steel extension cable. Use the PT420to provide position feedback on hy-draulic cylinders in factories and utili-ties, gate position in fresh or wastewa-ter distribution systems, or valve open-ing in process-related applications.
The PT420 installs in minutes bymounting its base to a fixed surfaceand attaching its cable to the movableobject. The PT420 works without per-fect parallel alignment, and when itsstainless steel cable is retracted, itsheight is less than 5".
Specifications:
Electrical Output:
20 mA
4 mA
full retraction full extensionnormal outputreversed output
Measurement Range Cable Tension Max. Cable Acceleration(Inches) (Ounces, ±30%) (Gravities)
0- 2, -10, -20 12 110- 5, -25, -50 5 20-15, -30 8 30-40 6 40-60 13 40-75 10 30-100 13 2
GENERALFull Stroke Ranges............................. 0-2 to 0- 100 inches, see ordering info.Output Signal ......... 4 - 20 mA (2-wire), 0 - 20 mA (3-wire), see ordering info.Accuracy
2 and 5 Inch Ranges ..................................................... ±0.28% full stroke10, 15, 25 Inch Ranges ................................................... ±0.18% full stroke20, 30 Inch Ranges and Greater ..................................... ±0.15% full stroke
Repeatability ............................. greater of ±0.001 inches or 0.02% full strokeResolution ........................................................................... essentially infiniteMeasuring Cable ........................... 0.019-in. dia. nylon-coated stainless steelCable Fitting .......................................................................... crimp and swivelEnclosure Material ............................ powder coated and anodized aluminumSensor ................................................ plastic-hybrid precision potentiometerWeight ........................................................................................... 2 lbs., max.
ELECTRICALInput Voltage .............................................................................. 12 to 40 VDCInput Current ............................................................................... 20 mA, max.Loop Resistance (Load) ..................... (loop supply voltage - 12 ) / 0.02, max.Circuit Protection .................................................................. 38 mA maximumImpedance ............................................................. 100 MΩ @ 100 VDC, min.Zero and Span Adjustment ......................................................... 2:1 turndownElectrical Connector ........................................................... MS3102E-14S-6PMating Plug (included) ....................................................... MS3106E-14S-6S
ENVIRONMENTALEnclosure Design ............................................................................... NEMA 1Operating Temperature ............................................................ -40o F to 180oFThermal Effects Zero ..................................................................... 0.01% full stroke / oF, max. Span .....................................................................................0.01% / oF, max.Vibration ............................................................ up to 10 G's to 2000 Hz max.
MECHANICAL

tel: (800) 423-5483 • (818) 701-2750fax: (818) 701-2799
113
2.25 (57.12)
"A"
7.50 (190.5)
0.19 (4.8)
1.23 (31.2)
2.29 (58.22)
2.62 (66.5)
2.00 (50.8)
7.00 (177.8)
0.20 (5.1) dia. thru[4 places]
4.00 (101.6)
2.50 (63.5)
Ordering Information / Model Number:
PT420 Short to Medium Range • 4...20 mA Output Signal
Full Stroke Range0002 = 2 inches 0030 = 30 inches0005 = 5 inches 0040 = 40 inches0010 = 10 inches 0050 = 50 inches0015 = 15 inches 0060 = 60 inches0020 = 20 inches 0075 = 75 inches0025 = 25 inches 0100 = 100 inches
A Measuring Cable Tension1 = standard (see MECHANICAL specifications)
NOTE: options 2, 3, and 7 below are available for RE-ORDER only!2 = increased (approx. 4 x standard cable tension, 0.024 inch dia. measuring cable)*3 = high (approx. 8 x standard cable tension, 0.024 inch dia. measuring cable)*7 = decreased (same as standard cable tension)
C Measuring Cable ExitNOTE: options 2, 3, and 4 below are available for RE-ORDER only!
1 = top exit 2 = front exit 3 = rear exit 4 = bottom exit
E Output1 = 4-20 mA, 2-wire, output increasing with cable extension2 = 20-4 mA, 2-wire,output decreasing with cable extension3 = 0-20 mA, 3-wire, output increasing with cable extension4 = 20-0 mA, 3-wire, output decreasing with cable extension
F Electrical Connection1 = 6-pin plastic connector and mating plug2 = terminal strip3 = 6-pin metal connector and mating plug4 = 25 ft. instrumentation cable
* note: mechanical dimensions may vary from outline drawing above
Electrical:
Sensing Circuit
Mating Plug
Electrical Connections
NOISNEMID"A"EGNAR )MM(SEHCNI
"02,"01,"2 )0.43(43.1"05,"52,"5 )8.64(38.1
"03,"51 )6.93(65.1"04 )4.14(36.1
NIERASNOISNEMIDLLA)MM(SEHCNI
erasecnarelot + )mm5.0+(.ni20.0detonesiwrehtosselnu
4...20 mA OUT
12...40 VDC IN
contact view
MS3106E-14S-6S
~ 3.2 in. (81 mm)
5/16" (8 mm) max cable dia.16 AWG max wire size
A
B
CD
E
F
eriw-2 eriw-3
nip-6.nnoc
A CDV04...21 CDV04...21B tuoAm02...4 nommocC tuoAm02...0D dnuorgesacEF
.rtsnielbac
DER CDV04...21 CDV04...21KLB tuoAm02...4 tuoAm02...0THW a/n nommocNRG dnuorgesac a/n
Instrumentation Cable
MULTICONDUCTOR, 24 GA., SHIELDED
~0.2 in. (5 mm) dia.
outline drawing (2 thru 50 inch f.s. ranges)
top
rear
PT420 - - - 11 01order code: A B C D E F G
sample: PT420-0025-111-1110

Home New Products Pressure Flow Air
Velocity Level Temperature Valves Combustion Testing
Data Acquisition Humidity Test
Equipment
Series 650 Temperature Transmitter
4-20 mA signal. Two wire operation. Temperatures from -55° to +180°C.
Catalog Page
Dimensional Enlargement
The Dwyer Series 650 Temperature Transmitter combines low cost with small size making it ideal for a wide variety of HVAC, industrial and commercial multi-point temperature monitoring applications. Non-polarized terminals simplify connection to any 12-35 VDC power supply. Capable of operation with long cable runs, Series 650 Transmitters are well suited for monitoring air or water temperatures at remote locations. Three models are stocked in popular ranges factory calibrated within 0.3% of span. All are linear within 0.25% of span and may be recalibrated within low range and span limits shown in chart. Low Range is temperature corresponding to 4 mA output. Span is temperature difference between Low and High Ranges corresponding to 4-20 mA output signal. Refer to Bulletin E-62 for complete details.
All Series 650 models listed A-325 Duct Mounting Kit with flange, fitting and hardware
Items subject to Schedule B discounts
PHYSICAL DATA Power Supply: 12-35 volts DC Output Signal: 4-20 mA DC Voltage Stability: Output error less than 0.01% of span over the specified supply voltage range Linearity: Within 0.25% of span Thermal Drift: Less than 0.5% of span over ambient temperature range of 0-50°C (32°-122°F) Ambient Operating Temperature (Electronics): 0-70°C (32°-158°F) Maximum Temperature (Probe): 204°C (400°F) Probe Construction: 6" long, 0.25" O.D. Type 304 Stainless Steel Probe Cable Length: 7 feet Initial Calibration: Within 0.3% of span at 20°C (68°F ) ambient
STOCKED MODELS in bold
Consult factory for special ranges calibrated
Model Number
Range As
Stocked
Low Range Limits
Span Limits
Min. Max. Min. Max.
650-1 -23° to +10°C
-32°C
-14°C
24°C 48°C
650-2 -7° to +49°C -12°
C +6°C 37°C
150°C
650-3 0° to +100°C


Hu-30
Hu
*To order, Specify “C” for 4 to 20mA output(s), or “V” for 0-1 Vdc output(s)Ordering Example: HX93C , humidity transmitter with 4-20mA output, with HX92-CALCalibration kit $225 + 65 = $290.
The HX93 transmitter provides remoteor on-site monitoring of relative humidityand temperature. The HX93 outputs alinearized current or voltage signalproportional to the measured humidityor temperature. RH outputs aretemperature compensated. Currentoutput models enable placing of thetransmitter at a remote location virtuallyany distance away from the readout ordatalogging device. HX93 utilizes a thin-film polymer capacitor to sense relativehumidity, and a Platinum 1100 OHMRTD to accurately sense temperature.A stainless steel mesh type filterprotects the sensors, which is easilyremovable for cleaning. Mountingscrews are easily accessible inside therugged, ABS enclosure, which housesand protects the electronics to NEMA13 specifications. An unregulated powersupply providing a voltage of 6-30Vpowers the HX93.
Model HX93
$225
Model TX82BSold Separately,
See Section N for More Details
U 4-20mA or 0-1V OutputU RH and Temperature
OutputU Compact Size for
Mounting VersatilityU Watertight EnclosureU Accurate to 2.5% RH and
0.6°C
SpecificationsInput Voltage Range: 24 Vdc nominal (6 to 30Vdc)MEASURING RANGERH: 3 to 95%Temperature:-20 to 75°C (-4 to 167°F)ACCURACYRH: ±2.5% @75°F with temperaturecoefficient of -.06 RH/°FTemperature: 0.6°C (±1°F)OUTPUTHX93C: 4 to 20mA for 0 to 100% RHand -20 to 75°C (-4 to 167°F)HX93V: 0 to 1Vdc for 0 to 100% RHand -20 to 75°C (-4 to 167°F)RH Temperature Compensation: -20 to 75°C (-4 to 167°F)
RH Time Constant (90% responseat 25°C, in moving air at 1m/s):>10 seconds, 10 to 90% RH;>15 seconds, 90 to 10% RHRepeatability: ±1% RH, 0.5°FHousing: ABS plastic watertightenclosure; meets NEMA 1, 2, 3, 3R,
4, 4X, 5, 12 and 13 specificationsConnections: Liquid-tight nylon withneoprene gland, for 0.09 to 0.265"diameter cable; internal 4-pin terminalblock accepts 14-22 gauge wireDimensions: 3.14" x 3.22" x 2.16"Weight: 8 oz (226.8 grams)
Relative Humidity/Temperature Transmitter
To Order (Specify Model Number)Model No. Price DescriptionHX93(*) $225 Relative Humidity and Temperature TransmitterHX92-CAL 65 Calibration Kit, 11 and 75% RH StandardsPSU-93 40 Unregulated Power Supply, 16 to 23Vdc, 300mA maxTX4-100 28.50 4 conductor shielded transmitter cable (100 ft)CAL-3-Hu 125 NIST Traceable Calibration
USAMADE IN
Works with looppowered indicators!


Appendix B Calibration Data


IronGateCalibrations.xls!N0414 10/18/2008 6:37 PM
Principia Research Corporation
Calibration Record
Cal ID Serial/Tag No Cal Posn Mfr/Model Transducer Type
N0414Standards Used Nominal Range Location/ID
S2801S2803N0404
Project Calibrated For Loop Resistor Cal by Date
Iron Gate August 2008 250 Ohm 0.01% CWA 8/19/2008Statistics
Num Pts 2 Uncertainty - ft H20Slope 49.7791 ft H20/DCV % Uncertainty - %
Intercept -49.3709 ft H20Notes
Calibration Data Calibration CurveRun Standard UUT Pred. Value Deviation % Dev.
ft H20 DCV ft H20 ft H20 % F.S
HP 34970A
RM 3051C G4 Pressure transmitter
GE Druck IPC6 readout Inlet HeadGE Druck 100 psi module
y = 49.779x - 49.371
20.0
40.0
60.0
80.0
100.0
120.0
140.0
160.0
180.0
Stan
dard
Rea
ding
RM 3051C G4M1107
5/5/2008
HSP
ft H20 DCV ft H20 ft H20 % F.S1 0.000 0.9918 0.000 0.000 0.0002 160.000 4.2060 160.000 0.000 0.000
-20.0
0.00.0 0.5 1.0 1.5 2.0 2.5 3.0 3.5 4.0 4.5
Transducer Output

IronGateCalibrations.xls!R2702 10/18/2008 6:37 PM
Principia Research Corporation
Calibration Record
Cal ID Serial/Tag No Cal Posn Mfr/Model Transducer Type
R2702Standards Used Nominal Range Location/ID
S2801S2807N0404
Project Calibrated For Loop Resistor Cal by Date
Iron Gate August 2008 250 Ohm 0.01% CWA 8/19/2008Statistics
Num Pts 2 Uncertainty in H20Slope 49.8815 in H20/DCV % Uncertainty %
Intercept -49.8067 in H20Notes
Calibration Data Calibration CurveRun Standard UUT Pred. Value Deviation % Dev.
in H20 DCV in H20 in H20 % F.S
HP 34970A
RM 3051 CD2 Pressure transmitter
GE Druck IPC6 readout Winter-Kennedy R3-R1GE Druck 30 psi module
y = 49.882x - 49.807
50.0
100.0
150.0
200.0
250.0
Stan
dard
Rea
ding
RM 3051 CD2M1107
5/5/2008
HSP
in H20 DCV in H20 in H20 % F.S1 0.000 0.9985 0.000 0.000 0.0002 200.000 5.0080 200.000 0.000 0.000
0.00.0 1.0 2.0 3.0 4.0 5.0 6.0
Transducer Output

IronGateCalibrations.xls!M1104 10/18/2008 6:37 PM
Principia Research Corporation
Calibration Record
Cal ID Serial/Tag No Cal Posn Mfr/Model Transducer Type
M1104Standards Used Nominal Range Location/ID
S2801S2807N0404
Project Calibrated For Loop Resistor Cal by Date
Iron Gate August 2008 250 Ohm 0.01% CWA 8/19/2008Statistics
Num Pts 2 Uncertainty in H20Slope 37.4466 in H20/DCV % Uncertainty %
Intercept -37.2594 in H20Notes
Calibration Data Calibration CurveRun Standard UUT Pred. Value Deviation % Dev.
in H20 DCV in H20 in H20 % F.S
HP 34970A
RM 3051 CD2 Pressure transmitter
GE Druck IPC6 readout Winter-Kennedy R3-R2GE Druck 30 psi module
y = 37.447x - 37.259
40.0
60.0
80.0
100.0
120.0
140.0
160.0
Stan
dard
Rea
ding
RM 3051 CD2M1107
5/5/2008
HSP
in H20 DCV in H20 in H20 % F.S1 0.000 0.9950 0.000 0.000 0.0002 150.000 5.0007 150.000 0.000 0.000
0.0
20.0
0.0 1.0 2.0 3.0 4.0 5.0 6.0
Transducer Output
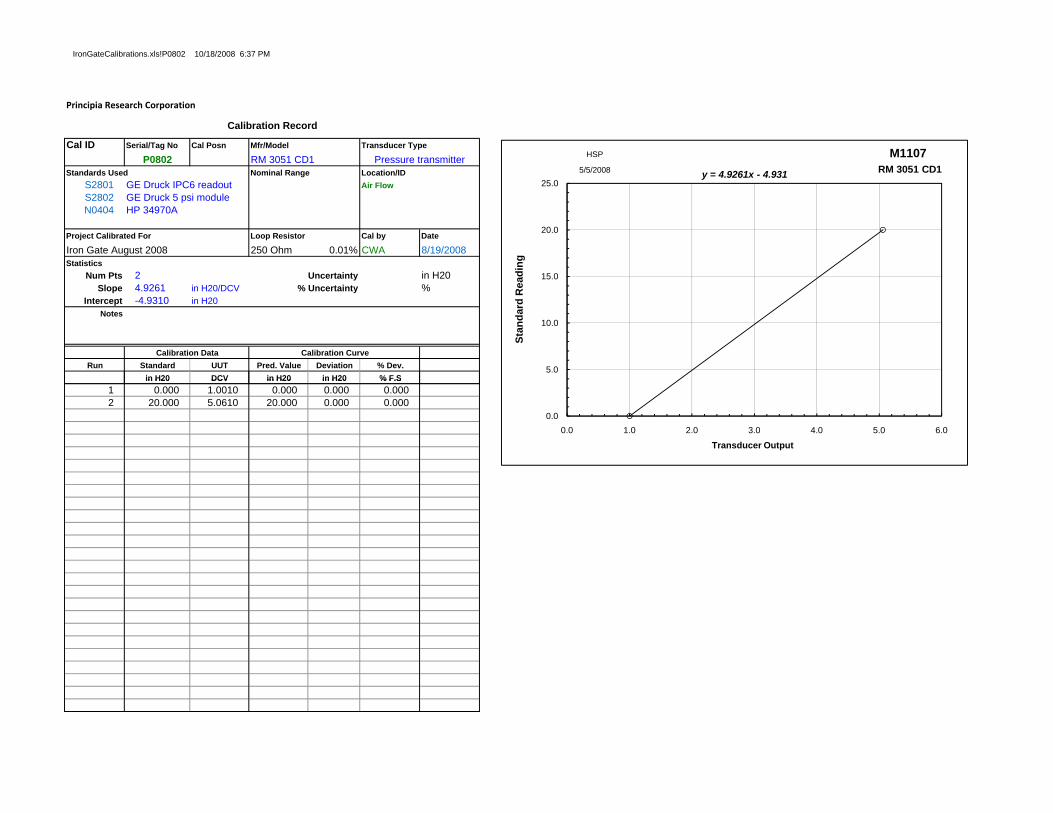
IronGateCalibrations.xls!P0802 10/18/2008 6:37 PM
Principia Research Corporation
Calibration Record
Cal ID Serial/Tag No Cal Posn Mfr/Model Transducer Type
P0802Standards Used Nominal Range Location/ID
S2801S2802N0404
Project Calibrated For Loop Resistor Cal by Date
Iron Gate August 2008 250 Ohm 0.01% CWA 8/19/2008Statistics
Num Pts 2 Uncertainty in H20Slope 4.9261 in H20/DCV % Uncertainty %
Intercept -4.9310 in H20Notes
Calibration Data Calibration CurveRun Standard UUT Pred. Value Deviation % Dev.
in H20 DCV in H20 in H20 % F.S
HP 34970A
RM 3051 CD1 Pressure transmitter
GE Druck IPC6 readout Air FlowGE Druck 5 psi module
y = 4.9261x - 4.931
5.0
10.0
15.0
20.0
25.0
Stan
dard
Rea
ding
RM 3051 CD1M1107
5/5/2008
HSP
in H20 DCV in H20 in H20 % F.S1 0.000 1.0010 0.000 0.000 0.0002 20.000 5.0610 20.000 0.000 0.000
0.00.0 1.0 2.0 3.0 4.0 5.0 6.0
Transducer Output

IronGateCalibrations.xls!M1106 10/18/2008 6:37 PM
Principia Research Corporation
Calibration Record
Cal ID Serial/Tag No Cal Posn Mfr/Model Transducer Type
M1106Standards Used Nominal Range Location/ID
S2801S2807N0404
Project Calibrated For Loop Resistor Cal by Date
Iron Gate August 2008 250 Ohm 0.01% CWA 9/8/2008Statistics
Num Pts 8 Uncertainty 0.023 in H20Slope 62.3701 in H20/DCV % Uncertainty 0.009 %
Intercept -162.0906 in H20Notes
Calibration Data Calibration CurveRun Standard UUT Pred. Value Deviation % Dev.
in H20 DCV in H20 in H20 % F.S
RM 3051 CD2 Pressure transmitter
GE Druck IPC6 readout Draft TubeGE Druck 30 psi moduleHP 34970A
y = 62.37x - 162.09
100 0
-50.0
0.0
50.0
100.0
150.0
200.0
0.0 1.0 2.0 3.0 4.0 5.0 6.0
Stan
dard
Rea
ding
RM 3051 CD2M1107
5/5/2008
HSP
in H20 DCV in H20 in H20 % F.S1 0.000 2.5991 0.016 0.016 0.0062 50.000 3.4002 49.980 -0.020 -0.0083 100.000 4.2018 99.976 -0.024 -0.0104 150.000 5.0040 150.009 0.009 0.0045 0.000 2.5995 0.041 0.041 0.0166 -50.000 1.7976 -49.974 0.026 0.0107 -100.000 0.9950 -100.032 -0.032 -0.0138 0.000 2.5986 -0.016 -0.016 -0.006
-150.0
-100.0
Transducer Output

IronGateCalibrations.xls!S0302 10/18/2008 6:37 PM
Principia Research Corporation
Calibration Record
Cal ID Serial/Tag No Cal Posn Mfr/Model Transducer Type
S0302Standards Used Nominal Range Location/ID
X0002
Project Calibrated For Loop Resistor Cal by Date
Osage Unit 7 / Unit 1 Testing 250 Ohm 0.01% HSP 5/6/2008Statistics
Num Pts 15 Uncertainty 0.006 inSlope -7.4636 in/DCV % Uncertainty 0.021 %
Intercept 37.6105 inNotes
Calibration Data Calibration CurveRun Standard UUT Pred. Value Deviation % Dev.
in DCV in in % F.S
Celesco PT420-30 Pull-pot
Starett steel rule Servo Stroke
y = -7.4636x + 37.611
5 0
10.0
15.0
20.0
25.0
30.0
35.0
Stan
dard
Rea
ding
Celesco PT420-30S0302
5/6/2008
HSP
in DCV in in % F.S1 1.000 4.905 1.001 0.001 0.0052 2.000 4.769 2.016 0.016 0.0543 4.000 4.501 4.016 0.016 0.0554 6.000 4.236 5.998 -0.002 -0.0085 8.000 3.969 7.986 -0.014 -0.0496 10.000 3.702 9.984 -0.016 -0.0557 12.000 3.432 11.996 -0.004 -0.0138 14.000 3.163 14.004 0.004 0.0139 16.000 2.897 15.992 -0.008 -0.027
10 18.000 2.627 18.005 0.005 0.01711 20.000 2.362 19.984 -0.016 -0.05612 22.000 2.092 21.997 -0.003 -0.00913 26.000 1.555 26.003 0.003 0.01114 28.000 1.286 28.012 0.012 0.04015 30.000 1.019 30.007 0.007 0.023
0.0
5.0
0.0 1.0 2.0 3.0 4.0 5.0 6.0
Transducer Output