Tupras London 08
47
Investor Meeting February 200 8
Transcript of Tupras London 08

8/8/2019 Tupras London 08
http://slidepdf.com/reader/full/tupras-london-08 1/47
Investor Meeting
February 2008
8/8/2019 Tupras London 08
http://slidepdf.com/reader/full/tupras-london-08 2/47
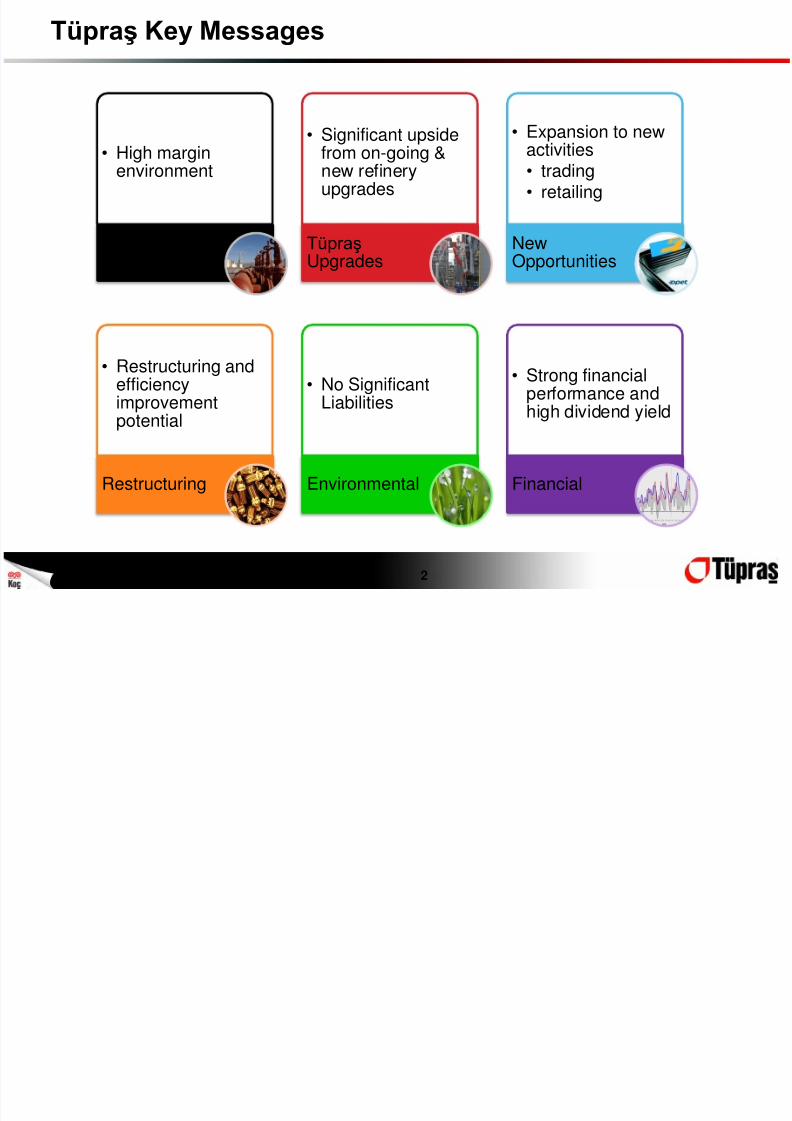
Tüpraş Key Messages
• High marginenvironment
GlobalRefining
Environment
• Significant upsidefrom on-going &new refineryupgrades
TüpraşUpgrades
• Expansion to newactivities• trading• retailing
NewOpportunities
• Restructuring andefficiencyimprovementpotential
Restructuring
• No SignificantLiabilities
Environmental
• Strong financialperformance and
high dividend yield
Financial
2

8/8/2019 Tupras London 08
http://slidepdf.com/reader/full/tupras-london-08 3/47
3

8/8/2019 Tupras London 08
http://slidepdf.com/reader/full/tupras-london-08 4/47
Macro Outlook
Slowdown
•David McCormick - US Treasury
•John Snow – Ex US Treasury•Joseph Stiglitz – Ex World Bank
•Martin Wolf - FT Editor
Recession
•Kenneth Rogoff – Lehman Bros•George Soros - Investor•Sergio Ermotti – Unicredit CEO•Nouriel Roubini - Economist
-2,0
0,0
2,0
4,0
6,0
2007 -1Q 2007 -2Q 2007 -3Q 2007 -4Q 2008 -1Q 2008 -2Q
(%) Quarterly Growth GlobalEUG7USAJap
0
123456789
1011
12
2002 2003 2004 2005 2006 2007 2008
(%) GDP Growth
USA China
India Global
Slowdown or Recession
Forex Trend

8/8/2019 Tupras London 08
http://slidepdf.com/reader/full/tupras-london-08 5/47
Crude Oil
RisingDemandfrom EM
LowDollarValue
Terrorism
(Nigeria,Iraq,
Angola)
War Risk /Embargo
(Iran)
OPECQuotas
ResourceNationalism
High
Prices
5

8/8/2019 Tupras London 08
http://slidepdf.com/reader/full/tupras-london-08 6/47
Margin Environment
Margin Drivers
Growing Global Demand
• Sustainable demand, driven by globaleconomic growth
Regional product shortages supportsstrong margins
• Gasoline in USA & Diesel in Europe
• Margins supported by FOB / CIFdifference
Refineries became more complex & moreinterdependent
• Shutdown in one unit impact wholerefinery
Specifications reduce flexibility
Refinery Capacity Investments
Refinery projects taking longer andcosting more
• Increases in supply capacity are laggingdemand
Credit crunch will hit projects hard
0,0
1,0
2,0
3,0
4,0
5,0
6,0
7,0
8,0
9,0
10,0
Changing Environment
2003-2005 1999-2002
2006 2007
6

8/8/2019 Tupras London 08
http://slidepdf.com/reader/full/tupras-london-08 7/47
Rising Refinery Costs
7

8/8/2019 Tupras London 08
http://slidepdf.com/reader/full/tupras-london-08 8/47
Global Product Consumption & Refining Capacity
40
50
60
70
80
90
100
110
1970 1973 1976 1979 1982 1985 1988 1991 1994 1997 2000 2003 2006 2009 2012 2015
Product ConsumptionProduct Consumption With Low GrowthActual Refining CapacityEstimated Refining Capacity
Source: OGJ, Reuters, Tüpraş
M
i l l i o n b b l / d a y
8

8/8/2019 Tupras London 08
http://slidepdf.com/reader/full/tupras-london-08 9/47
Turkish Oil Products Demand ProjectionBase Case (Million Ton)
0
5
10
15
20
25
30
35
40
45
93 95 99 '00 '06 '07 '10 '15 2020
LPG Naphtha GasolineJet Gas Oil / Diesel Fuel Oil
Asphalt Others ProductionIncld. Ataş
3.53.5
2.52.62.2 2.4
12.2 13.2
4.0 3.4
2.2 2.3
1.9 2.1
5%
-17%
8%
35.4
39.3
7%
31.1 +2,3 %30.5
2006 ∆2007T
9
0.2%
-3%

8/8/2019 Tupras London 08
http://slidepdf.com/reader/full/tupras-london-08 10/47
Turkey’s Imports
Million ton 2005 2006 2007E
Gasoline 0,7 0,8 0,6
Jet Fuel - 0,2 0,2
Gas Oil 4,4 6,0 6,7
Fuel Oil 0,9 0,4 0,6
Total Import 6,0 7,4 8,1
Import Share, %
Turkey 25.3 31.8 34.4
Excluding Tüpraş 24.1 26.1 25.6
Distributors Share 95% 82% 74%
10
Note: Excluding LPG
13%
22%
59%
6%
Gasoline 2006
Israel
Greece
Romania
Other
7%
72%
6%4% 2% 9%
Gasoil / Diesel 2006
FSU Countries
Russia
Greece
Romania
Italy
Other
>90% from the Black Sea
Source: TÜPRAŞ, GDPA & EMRA

8/8/2019 Tupras London 08
http://slidepdf.com/reader/full/tupras-london-08 11/47
Legislation - Petroleum Market Law
• Market Supervised by Energy Markets Regulatory Authority
(EMRA)Regulator
• Pricing set by the market for both refinery gate and pump price• No limit on imports• Refining companies may own distributors
Freedoms
• All market participants needs a licence from EMRA• Refiners should give priority to indigenous crude oil• National inventory requirement of 90 days worth of domestic
sales, with 20 days product stock held by both refiners anddistributors – Draft Law
• Maintain continuous production and supply of refined oil productsas required by the Turkish Armed Forces
Obligations
• The market share of each distributor in the domestic market shallbe limited to 45%Limits
11

8/8/2019 Tupras London 08
http://slidepdf.com/reader/full/tupras-london-08 12/47
Storage Capacity and Compulsory Stock Requirement
Enerji0,4%
Shell5,8%
Bölünmez0,5%
Delta4,1%
Aktaş0,7%
Aytemiz3,0%
Siyam1,6%
Tuta
2,4%
POAŞ11,2%
Altınbaş2,5%
Others2,9%
Balpet0,8%
Total4,3%
Turkuaz0,6%
BP6,3%
Petline0,4%
Opet11,3%
TÜPRAŞ41,1%
Product Storage Capacity in Turkey Storage Capacity of Tüpraş (000’ton)
Crude Oil Product Total
1,700 2,600 4,300
Current Compulsory Stock of TÜPRAŞ(20days)
920 kton
Tüpraş owns 4 times more storagecapacity than its 20 day compulsorystock requirement.
Tüpraş owns 65% of combined crude oil
& product stock capacityTüpraş+ Opet own more than half of
total product storage capacity (52.4%) inTurkey.
12
Source: EMRA

8/8/2019 Tupras London 08
http://slidepdf.com/reader/full/tupras-london-08 13/47
Developments in Turkish Petroleum Sector
2005
• EU• EURO IV
2007
• Turkey• National
MarkerProcess
2008
• Turkey• EURO IV• 1000 ppm• National
CompulsoryStock
2009
• EU• EURO V
• Turkey• EURO V
Expected
Change in Fuel Regulations & Standards: EU and Turkey
1000 ppm: From Jan 1st 2008, all gasoil sold in Turkey will have at maximum 1000 ppm sulphur content
EURO IV: 50 ppm S for gasoline & diesel, aromatics (35%) for gasoline
EURO V: 10 ppm S
10 ppm Diesel already in the market ahead of regulations
National Marker Process introduced in order to prevent illegal trade.
National Compulsory Stock may become an issue in 2008.
13
8/8/2019 Tupras London 08
http://slidepdf.com/reader/full/tupras-london-08 14/4714

8/8/2019 Tupras London 08
http://slidepdf.com/reader/full/tupras-london-08 15/47
TÜPRAŞ Assets
Baku
Ceyhan
Black Sea
Marmara
Mersin
Ankara
İstanbul
Körfez Kırıkkale5.0 mtNC: 5.32 (6.32)
Batman1,1 mtNC:1.83
Kirkuk
P e t r o -
c h e m i c a l s Körfez
100% Share
Capacity: 50 kt
Product: Carbon Black S h i p p i n g
Ditaş
79.98% Share
165 kDWT Crude Tanker
15 kDWT Product Tanker R e t a i l i n g Opet
40% Share
1,280 Retail Sites
850 kM3 Storage
Trading, Lubricants &Bunkering activities
İzmit11.0 mtNC: 7.78
İzmir 11.0 mt
NC: 7.66
Total Capacity: 28.1 Million TonsCurrent Nelson Complexity(NC): 7.08 (7.25)
15

8/8/2019 Tupras London 08
http://slidepdf.com/reader/full/tupras-london-08 16/47
36.5
65.6
249.1
453
43.7
Koç Energy Group Storage Capacities
Aygaz Opet Tüpraş
UnmatchedLogisticsStrength
850.000 M3150.000 M3 5.100.000 M3 100% Coverage of Turkey
16

8/8/2019 Tupras London 08
http://slidepdf.com/reader/full/tupras-london-08 17/47
0,10,4
2004 2005 2006 2007
0,4
2004 2005 2006 2007 1,2 0,9 0,5 0,9
2004 2005 2006 2007
0,10,5
2004 2005 2006 2007
2,3 2,2 2,2 2,1
2004 2005 2006 2007
Russia
Kazakhstan
Iran
S. Arabia
IraqSyria
Italy
Libya
Algeria
Domestic Crude
Azerbaijan
4,8 4,6 4,50,1
2004 2005 2006 2007
5,87,1
6,7
9,1
2004 2005 2006 2007
5,87
8,9 8,9
2004 2005 2006 2007
3,5 3,5 3,5 3,3
2004 2005 2006 2007
0,1 0,1
2004 2005 2006 2007
0,4 0,3 0,2
2004 2005 2006 2007
17
Crude Suppliers of TÜPRAŞ (million ton)

8/8/2019 Tupras London 08
http://slidepdf.com/reader/full/tupras-london-08 18/47
Gross Refining Margin
Improving Margin Premium Investments in yield improvements
Operational optimisation
Bigger domestic market share Better export premiums
18
Drivers of Refining Margin: Advantageous crude supply
Strong purchasing power Flexible crude slate Refineries designed for sour crude Favorable transport costs A strong position in import infrastructure Pipeline links and reduced storage needs
for key customers High exporting ability
Gross Margin
($ / bbl)
Average
1st Q 6M 9M Year
2006
Med Complex 4,8 5,9 5,7 5,3
TÜPRAŞ 3,7 5,4 6,3 5,9Difference -1,1 -0,5 0,6 0,6
2007
Med Complex 5,7 6,5 5,6 5,3
TÜPRAŞ 5,0 7,2 7,1 7,2
Difference -0,7 0,8 1,6 1,9

8/8/2019 Tupras London 08
http://slidepdf.com/reader/full/tupras-london-08 19/47
Crude Processing and Production 12M 2007/2006
0,8 0,81,4 0,9
3,6 4,0
2,2 2,6
7,6 7,1
5,8 5,4
2,22,3
1,01,0
24,6 24,0
0,0
5,0
10,0
15,0
20,0
25,0
30,0
12M 2006 12M 2007
Production Mix (mn ton)
Others
Asphalt
Fuel Oil
Gasoil
Jet / Kero
Gasolines
Naphtha
LPG
60
70
80
90
100
110
J F M A M J J A S O N D
Tüpraş Capacity Utilisation (%)
2004 2005
2006 2007
%93,2
%88,8
%92,4
Annual
-2.5%
19
%91,1
• Crude Volume Optimisation• Maximising capacity ofconversion units
• 25.6 mn tons of crude oilwere processed anddecreased 2.5%
Production
• Processed heavierCrude Oil API 32.1 vs32.5 for 2006
• White ProductionYield 67.5% from67.1% in 2006
Crude

8/8/2019 Tupras London 08
http://slidepdf.com/reader/full/tupras-london-08 20/47
Changing Product Yields
Through investment and
optimisation, yields are becomingmore profitable
Increased Gasoline
More high priced Jet
Asphalt Maximisation 1.410 869
3.612 3.965
0
1.000
2.000
3.000
4.000
5.000
6.000
2006 2007
V o l u m e M T
Gasoline / Naphtha
Gasolines Naphtha
2.156 2.588
7.615 7.118
9.771 9.706
0
2.000
4.0006.000
8.000
10.000
12.000
2006 2007
V o l u m
e M T
Middle Distillate
Jet /Kerosene Gasoil
5.799 5.432
2.220 2.286
0
2.000
4.000
6.000
8.000
10.000
2006 2007
V o l u m
e M T
Fuel Oil / Asphalt
Fuel Oil Asphalt
20

8/8/2019 Tupras London 08
http://slidepdf.com/reader/full/tupras-london-08 21/47
Tüpraş Total Product Sales – 12 Months
kton 2006 2007 Difference
Total Sales 26,137 26,328 191
LPG 1,190 968 -222
Naphtha 1,410 869 -541
Gasolines 3,659 4,047 388
Jet Fuel/Kerosene 2,123 2,556 433Gasoil 50 PPM 2,070 2,215 145
Gasoil 7000 PPM 6,793 6,709 -84
Middle Distillates 10,986 11,480 494
Fuel Oil 5,780 5,691 -89
Asphalt 2,186 2,291 105
Lube Oil 325 308 -17
Other 601 674 73
Record
21
8/8/2019 Tupras London 08
http://slidepdf.com/reader/full/tupras-london-08 22/47
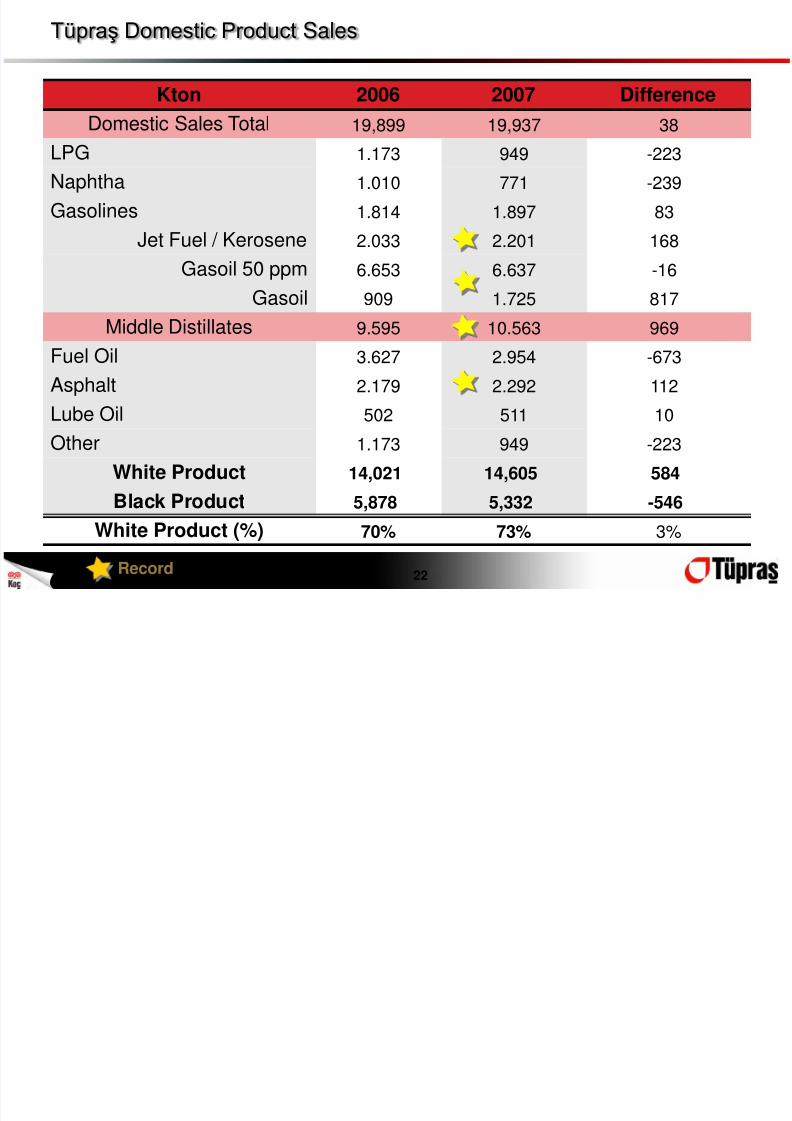
Tüpraş Domestic Product Sales
Kton 2006 2007 Difference
Domestic Sales Total 19,899 19,937 38
LPG 1.173 949 -223
Naphtha 1.010 771 -239
Gasolines 1.814 1.897 83
Jet Fuel / Kerosene 2.033 2.201 168
Gasoil 50 ppm 6.653 6.637 -16Gasoil 909 1.725 817
Middle Distillates 9.595 10.563 969
Fuel Oil 3.627 2.954 -673
Asphalt 2.179 2.292 112
Lube Oil 502 511 10Other 1.173 949 -223
White Product 14,021 14,605 584
Black Product 5,878 5,332 -546
White Product (%) 70% 73% 3%
Record 22
8/8/2019 Tupras London 08
http://slidepdf.com/reader/full/tupras-london-08 23/47
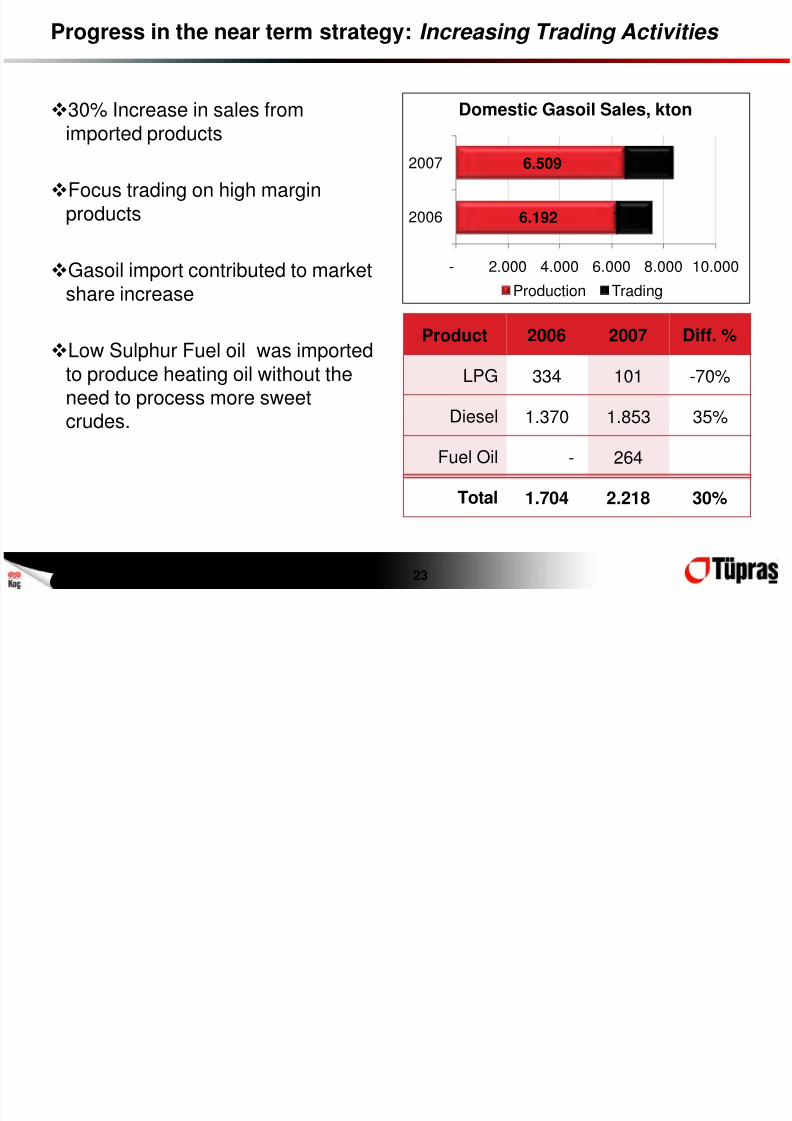
Progress in the near term strategy: Increasing Trading Activities
30% Increase in sales from
imported products
Focus trading on high marginproducts
Gasoil import contributed to marketshare increase
Low Sulphur Fuel oil was importedto produce heating oil without theneed to process more sweet
crudes.
6.192
6.509
1.370
1.853
- 2.000 4.000 6.000 8.000 10.000
2006
2007
Domestic Gasoil Sales, kton
Production Trading
Product 2006 2007 Diff. %
LPG 334 101 -70%
Diesel 1.370 1.853 35%
Fuel Oil - 264
Total 1.704 2.218 30%
23

8/8/2019 Tupras London 08
http://slidepdf.com/reader/full/tupras-london-08 24/47
Tüpraş vs The Market – 2007 /2006
-2,9
4,6 5,3
-4
-2
0
2
4
6
MarketGrowth TupraşGrowth ShareIncrease
Gasoline
7,910,6
1,60
36
9
12
MarketGrowth
TupraşGrowth
ShareIncrease
Gas Oil
6,19,2
2,00
36
9
12
MarketGrowth
TupraşGrowth
ShareIncrease
Automotive Fuels
Tüpraş increased its market sharein automotive products, growingsale faster than the market
Better sales strategy, NationalMarker & targeted discounting allhad an impact
Source: Tüpraş, PetDer Excluding Auto LPG
24

8/8/2019 Tupras London 08
http://slidepdf.com/reader/full/tupras-london-08 25/47
Total Sales By Customers – 12 M 2007
Sales By Customer Group (%)
PetrolRetailers
54,8%
LPGDist.3,5%
Petkim3,4%
Export24,3%
Others2,8%
Asphalt8,7%
Military2,4%
Sales To Petrol Retailers (%)
POAŞ35,7%
Shell19,8%
BP12,3%
OPET12,0%
Others(45)
20,2%
First 4 Distributor’s Share in Total Sales toDistributors = 79.80 %Total Sales: 26,328 kton
25

8/8/2019 Tupras London 08
http://slidepdf.com/reader/full/tupras-london-08 26/47
TÜPRAŞ Exports 12M 2007/2006
40098
1.845 2.151
1.301562
405
470
2.1522.737
135 373
6.238 6.390
0500
1.000
1.500
2.000
2.500
3.000
3.500
4.000
4.500
5.000
5.500
6.000
6.5007.000
12M 2006 12M 2007
Export by Product (kton)
Naphtha Gasoline Gas oilHVGO Fuel Oil Other
2,0
2,8 3,0 3,4
4,6
6,2 6,4
0,3 0,6 0,7 1,01,9
3,03,4
0
2
4
6
8
01 02 03 04 05 06 07
Export By Years
Mn Ton Bn $
Italy14%
Croatia7%
Malta6%
OtherEurope
10%
Greece9%
Singapore15%
South
Africa9%
UAE4%
S. Arabia6%
Other12%
USA
8%
Export by Market
26
USA & Europe > 54%

8/8/2019 Tupras London 08
http://slidepdf.com/reader/full/tupras-london-08 27/47
27

8/8/2019 Tupras London 08
http://slidepdf.com/reader/full/tupras-london-08 28/47
Strategy: Key Parameters
Master PlanInvestment
Restructuring
OperationalExcellence
Profitability Focused
Investment
“ResidiumUpgrading”
Master Plan Investment
Euro V Specifications
Product Yield Improvements
Restructuring
HR Improvements
New Management Techniques
Trading Focus
Operational Excellence Expense Reduction & Profitability
Productivity Improvements
Profitability Focused Investment
Asphalt Maximizasion
Crude / Product Blending
Increased Tank Capacity
Railway Transportation System
Residium Upgrading Project
Fuel Oil Diesel
28

8/8/2019 Tupras London 08
http://slidepdf.com/reader/full/tupras-london-08 29/47
Progress in the near term strategy: Investments
On-Going Investment
May 31st: Izmit CCR onstream July 8th : Izmit HDS onstream
Kırıkkale HDS &CCR 2nd Q 2008
Other Investments Wagon loading facilities in Izmit are
completed
Tank investments to add 1 million M3
capacity (+20%)
8 MW Wind Turbine investment to bemade in Izmir by 2011
220 250
53
123
0
50
100
150
200
250
300
350
400
2006 2007
Million $
New and Other Inv. Master Plan
273
29
373
Including Related Interest Costs

8/8/2019 Tupras London 08
http://slidepdf.com/reader/full/tupras-london-08 30/47
Upside Potential
Products
2005 Actual Production
(2)
After Investment (Max.)
(1)
Difference
(1)-(2)Net
Margin$/ton
Maximum
EBIT
Kton % Kton % Kton Million USD
LPG 764 3.2 1,120 4.5 356 63 22.2
Naptha 1,388 5.8 419 1.7 -969
Gasoline 3,548 14.9 5,837 23.7 2,289 40 91.6
Jet Fuel 2,013 8.4 2,683 10.9 670 50 33.5
Gas Oil 7,566 31.7 7,847 31.8 281 30 235.4
Black Products 8,127 34.0 6,303 25.6 -1,824
Others 484 2.0 457 1.9
Total 23,889 100.0 24,666 100.0 803.2 382.7
Crude Processed 25,494 26,500
Note: Based on Optimal Crude Slate
30
Ü

8/8/2019 Tupras London 08
http://slidepdf.com/reader/full/tupras-london-08 31/47
TÜPRAŞ’s Major Investment Study-Residium Upgrading
W h y R e s i d i u m U p g r a d e ? • Jet-Gasoil demand growth
• Contraction in Fuel Oilmarket
• Alternative to new refineryprojects
• Matching Production todemand• Local trends are
mirrored in globalmarkets
P r o f i t a b
i l i t y • Converts low-value blackproduct to high-value
white products• Increases Tüpraş’s margin
premium over itscompetitors
• Improves long term cashflow & income
• Note: Makes no assumption about refinery margins going forward.
31

8/8/2019 Tupras London 08
http://slidepdf.com/reader/full/tupras-london-08 32/47
32
P fi bili I di 2006 200 (T P )

8/8/2019 Tupras London 08
http://slidepdf.com/reader/full/tupras-london-08 33/47
Profitability Indicators - 2006 /2007 (Tax Purpose)
2006 2007Difference
Amount (%)
Dtd.Brent Price, ($/bbl) 65.1 72.5 7,4 11,4%
Brent vs Tupras Crude Cost, ($/bbl) -4.5 -3.8 0,7 -15,6%
Processed Crude API 32,5 32,1
White Product Yield, (%) 67,1 67,5 0,4%
Med. Complex Margin,($/bbl) 5,30 5,32 0,4%
Tupras Margin,($/bbl) 5,86 7,22 23,2%
Operating Profit, (mn. $) 501 652 151 30%EBITDA, (mn. $) 722 881 159 22%
33
I S 2006/2007 (T P )

8/8/2019 Tupras London 08
http://slidepdf.com/reader/full/tupras-london-08 34/47
Income Statement :2006/2007 (Tax Purpose)
4Q2006
4Q2007 % Diff. Million USD 2006 2007 % Diff.
3.429 4.793 40 Net Sales 14.115 15.838 12
106 243 129 Gross Profit 768 1.081 41
(56) (128) 128 Operating Expenses (267) (429) 61
50 115 130 Operating Profit 501 652 30
25 49 93 Income From Others, (Net) 129 243 88
15 (2) (112) Finance Expenses (11) (15) 37
91 163 79 Profit Before Tax 619 880 42
74 131 76 Net Profit 507 708 40
34
FX Ri k (2007 T P )

8/8/2019 Tupras London 08
http://slidepdf.com/reader/full/tupras-london-08 35/47
FX Risk (2007 Tax Purpose)
Consolidated
Assets
Consolidated
Liabilities
Financial Loans:322
Short TermLoans:74
Payables: 1.909
Stock:1.798
Recievables:267
Cash:
244
+4
35
Fi i l Hi hli ht

8/8/2019 Tupras London 08
http://slidepdf.com/reader/full/tupras-london-08 36/47
Financial Highlights
356279
429
768 769711
769
881
2 0 0 1
2 0 0 2
2 0 0 3
2 0 0 4
2 0 0 5
2 0 0 6
2 0 0 7 / 9 M
2 0 0 7 T a x
EBITDA ( USD Million)
New
One Off
Natural Gas
5,2 5,2 6,18,6
11,114,1 12,1
15,8
2 0 0 1
2 0 0 2
2 0 0 3
2 0 0 4
2 0 0 5
2 0 0 6
2
0 0 7 / 9 M
2 0 0 7 T a x
Revenue ( USD Billion)
154 116 291
491 508 575725 708
2 0 0 1
2 0 0 2
2 0 0 3
2 0 0 4
2 0 0 5
2 0 0 6
2 0 0 7 / 9 M
2 0 0 7 T a x
Net Income ( USD Million)
36
2007 Tax = Results for Tax Purposes
Di id d

8/8/2019 Tupras London 08
http://slidepdf.com/reader/full/tupras-london-08 37/47
Dividends
Tüpraş is a cash generatingcompany, with a good ability togenerate dividends, in addition toinvesting.
In 2006 the dividend yield wasaround %8.5
Tüpraş plans to continue to pay out100% of distributable income
0,0
0,5
1,0
1,5
2,0
2,5
3,0
3,5
2002 2003 2004 2005 2006
Earnings & DividendsYTL/Share
Earnings Per Share Dividend
37
R ti & C t G

8/8/2019 Tupras London 08
http://slidepdf.com/reader/full/tupras-london-08 38/47
Ratings & Corporate Governance
Fitch Rating Comparison
As of January28, 2008
FOREIGNCURRENCY LOCAL CURRENCY
Long-term Long-term National
SOVEREIGN BB (Stab) BB (Stab) -
TÜPRAŞ BB (Stab) BBB-(Stab) AAA (tur) (Stab)
Vestel BB- (Neg) BB- (Neg) -
Hürriyet BB (Stab) BB (Stab) AA (tur) (Stab)
Turkcell BB (Stab) BBB-(Stab) -
Corporate Governance Rating
62,65
88,09
88,31
77,34
79,12
0% 50% 100%
Board
Stakeholders
Transparency
Shareholders
Overall
Rating by Saha Ratings
38
Highlights

8/8/2019 Tupras London 08
http://slidepdf.com/reader/full/tupras-london-08 39/47
Highlights
• Driven by Global Economic GrowthStrong Global Oil Demand
• Increasing costs and project timelinesLagging Refinery Investments
• Sustainable economic growth• Rapid car park growth• Currently low per capita oil consumption
Growing & High PotentialDomestic Market
• 4 well located refineries• Strategically valuable & profitable affiliates
Domestic Monopoly
• Improvements in production mix and efficiencyImproving Operations
• Strengthening competitive position & profitabilityInvestments
• Post privatisation management changes• HR Restructuring
Restructuring Upsides
• Profitable opportunities for further investmentFurther Upgrade Potential
• Strong cash generation ability & improving resultsProfitability
• Strong performance under volatile environmentsSafe Haven
39

8/8/2019 Tupras London 08
http://slidepdf.com/reader/full/tupras-london-08 40/47
Thank you…
The Investor Relations section of our company website has a wealth of constantly
updated information of interest to investors.
www.tupras.com.tr
40

8/8/2019 Tupras London 08
http://slidepdf.com/reader/full/tupras-london-08 41/47
41
TÜPRAŞ Sh h ld S

8/8/2019 Tupras London 08
http://slidepdf.com/reader/full/tupras-london-08 42/47
TÜPRAŞ Shareholder Structure
Koc Holding
75%
Shell
Turkey
0.1%
Aygaz
20%
Opet
3%
Enerji Yatırımları A.Ş.
Free Float
(ForeignInvestor’s
Share: ~85%)
Shell O. Invt.B.V
1.9%
Ditaş79.98%
40.0%
51%
49%
42
The Distribution Business Opet
8/8/2019 Tupras London 08
http://slidepdf.com/reader/full/tupras-london-08 43/47
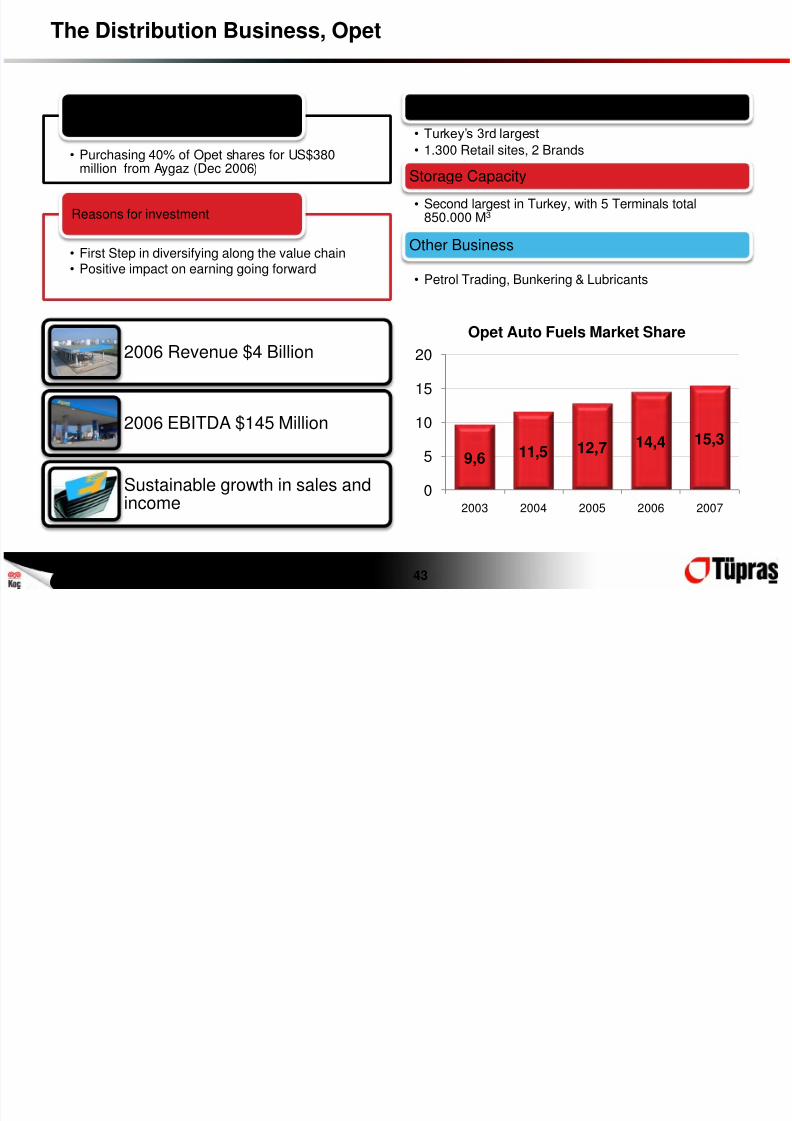
The Distribution Business, Opet
• Purchasing 40% of Opet shares for US$380million from Aygaz (Dec 2006)
Tüpraş entered the retail market
• First Step in diversifying along the value chain• Positive impact on earning going forward
Reasons for investment
Retail Business
• Turkey’s 3rd largest
• 1.300 Retail sites, 2 Brands
Storage Capacity
• Second largest in Turkey, with 5 Terminals total850.000 M3
Other Business
• Petrol Trading, Bunkering & Lubricants
2006 Revenue $4 Billion
2006 EBITDA $145 Million
Sustainable growth in sales andincome
9,6 11,5 12,7 14,4 15,3
0
5
10
15
20
2003 2004 2005 2006 2007
Opet Auto Fuels Market Share
43
Market Share in Retailing 2007/2006

8/8/2019 Tupras London 08
http://slidepdf.com/reader/full/tupras-london-08 44/47
Market Share in Retailing 2007/2006
(1000 M3 )
5.651 5.385
3.677 4.086
2.523 2.841
2.611 2.7761.173
1.2251.945
2.31217.580
18.624
2006 2007
Motor Fuels sales increased by 5.9% y-o-y in 2007
32.1
6.7
14.9
14.3
11.1
20.9
28.9
6.6
14.9
15.3
12.4
21.9
Source: PETDER
POAŞ
Shell
OPET
BP
Total
others
Share,% Share,%5.9%
44
“O ti l E ll P " ith SHELL Gl b l S l ti

8/8/2019 Tupras London 08
http://slidepdf.com/reader/full/tupras-london-08 45/47
“Operational Excellence Program" with SHELL Global Solutions
Operational Excellence Programme (OEP)
Opportunity ConfirmationPhase Implementation Phase
2006 2007 2008 2009 2010 2011 Total
Net Benefit, Mn$ 10 44 75 115 138 378
The program areas for OEP are:
Hydrocarbon Margin
Maintenance and Reliability
Energy and Loss
Operating and Maintenance cost
Health and Safety Environment
Selective De-bottlenecking
45
ISE Relative Performance 2007

8/8/2019 Tupras London 08
http://slidepdf.com/reader/full/tupras-london-08 46/47
ISE Relative Performance 2007
80
90
100
110
120
130
140
150
160
0 4 J a n
1 8 J a n
0 1 F e b
1 5 F e b
0 1 M a r
1 5 M a r
2 9 M a r
1 2 A p r
2 6 A p r
1 0 M a y
2 4 M a y
0 7 J u n
2 1 J u n
0 5 J u l
1 9 J u l
0 2 A u g
1 6 A u g
3 0 A u g
1 3 S e p
2 7 S e p
1 1 O c t
2 5 O c t
0 8 N o v
2 2 N o v
0 6 D e c
2 0 D e c
IMKB-100 Relative Tüpraş Relative
P4646
Disclaimer

8/8/2019 Tupras London 08
http://slidepdf.com/reader/full/tupras-london-08 47/47
Disclaimer
This presentation contains forward-looking statements that reflect the
Company management’s current views with respect to certain future events.Although it is believed that the expectations reflected in these statements are
reasonable, they may be affected by a variety of variables and changes in
underlying assumptions that could cause actual results to differ materially.
Neither Tüpraş nor any of its directors, managers or employees nor any other
person shall have any liability whatsoever for any loss arising from use of this
presentation.