Tunneling in China: The Remarkable Case of Inter-Corporate ...
53
1 Tunneling in China: The Remarkable Case of Inter-Corporate Loans By Guohua Jiang ** Charles M. C. Lee Heng Yue First Draft: October 17 th , 2005 This Draft: May 30 th , 2008 ** Jiang ([email protected] ) and Yue ([email protected] ) are both Associate Professor of Accounting at the Guanghua School of Management, Peking University, Beijing, China; Lee ([email protected] ) is Managing Director and Global Head of Equity Research at Barclays Global Investors (BGI), San Francisco, CA. Please direct comments and/or inquiries to any of the co-authors. We are grateful to Kangtao Ye for sharing his hand collected data on controlling shareholder receivable balances. We also thank seminar participants at U.C. Davis, U. C. Berkeley, Carnegie-Mellon University, BGI, Peking University, Nanjing University, Shanghai University of Finance and Economics, Southwest University of Finance and Economics, Tsinghua University, City University of Hong Kong, and Xiamen University for helpful comments, and the National Natural Science Foundation of China for financial support (approval number 70532002).
Transcript of Tunneling in China: The Remarkable Case of Inter-Corporate ...

1
Tunneling in China: The Remarkable Case of Inter-Corporate Loans
By
Guohua Jiang**
Charles M. C. Lee
Heng Yue
First Draft: October 17th, 2005
This Draft: May 30th, 2008
** Jiang ([email protected]) and Yue ([email protected]) are both Associate Professor of Accounting at the Guanghua School of Management, Peking University, Beijing, China; Lee ([email protected]) is Managing Director and Global Head of Equity Research at Barclays Global Investors (BGI), San Francisco, CA. Please direct comments and/or inquiries to any of the co-authors. We are grateful to Kangtao Ye for sharing his hand collected data on controlling shareholder receivable balances. We also thank seminar participants at U.C. Davis, U. C. Berkeley, Carnegie-Mellon University, BGI, Peking University, Nanjing University, Shanghai University of Finance and Economics, Southwest University of Finance and Economics, Tsinghua University, City University of Hong Kong, and Xiamen University for helpful comments, and the National Natural Science Foundation of China for financial support (approval number 70532002).

2
Tunneling in China: The Remarkable Case of Inter-Corporate Loans
Abstract Recent events in China provide a historical opportunity to study the expropriation of minority shareholders. In this paper, we document the use of inter-corporate loans by controlling shareholders to extract funds from Chinese listed firms. Using accounting information from public sources, we show how tens of billions of RMB were siphoned from hundreds of companies during the 1996 to 2006 period. Specifically, we show the nature and extent of these abuses, evaluate their economic consequences, explore their cross-sectional determinants, and report on the extensive efforts by auditors and regulators that eventually contained this practice. Collectively, our findings shed light on the nature and severity of the tunneling problem in China, and the on-going challenges associated with regulatory reform in the country.
1
I. Introduction
Financial economists are becoming increasingly aware of the severity of agency
problems associated with concentrated shareholdings. Traditionally, the focus of the
agency literature in the U.S. has been on the conflict between firm managers and a
diffused group of shareholders (e.g., Berle and Means (1932) and Jensen and
Meckling (1976)). However, recent international studies show that well dispersed
ownership is relatively rare outside of the U.S. and Japan, and that large block holders
control most European and Asian companies.1 In this broader setting, the central
agency problem is the threat of “tunneling” – i.e., the expropriation of minority
shareholders by the controlling block holder.2
In this study, we report on a form of tunneling that was remarkably widespread among
Chinese firms in the 1996 to 2006 sample period. Specifically, we document the use
of inter-corporate loans by controlling block holders to extract funds from Chinese
listed companies. Our analyses show how tens of billions of RMB were siphoned
from hundreds of Chinese publicly listed companies. We examine the nature and
extent of these loans, evaluate their economic consequences, explore their
cross-sectional determinants, and report on the difficulties faced by auditors and
security regulators in their attempt to bring this practice under containment.3
1 Studies that examine corporate ownership structure in Asia and Europe include: La Porta et al. (1998, 1999), Claessens, Djankov, and Lang (2000), Claessens, Djankan, Fan and Lang (2002), Faccio and Lang (2002), Faccio, Lang and Young (2001), and Johnson et al. (2000). 2 See for example, Shleifer and Vishny (1997), La Porta et al. (1999), Johnson et al. (2000), and Faccio et al. (2001). According to Johnson et al. (2000, page 22), the term tunneling was originally used “to characterize the expropriation of minority shareholders in the Czech Republic (as in moving assets through an underground tunnel).” Such transfers can take many forms, including: advantageous transfer pricing to parties related to the controlling shareholder, excessive executive compensation, loan guarantees, expropriation of corporation opportunities, manipulation of dividend payout rates, and so on. In all these cases, the controlling shareholder, often with the aid of a cooperative management, diverts economic resources from the firm to the detriment of minority shareholders. 3 Later, we describe in detail how the practice of tunneling through inter-corporate loans finally ended in December 2006 after a long series of government rules and directives (see Appendix 5).
2
In many respects, the Chinese market provides a unique opportunity for studying the
tunneling phenomenon. Since re-opening her stock exchanges in the early 1990’s,
over 1,500 Chinese companies have gone public in Shanghai and Shenzhen. Most of
these firms are carve-outs or spin-offs from an existing state-owned enterprise (SOE),
in which the original SOE retains a substantial block holding. As a result, highly
concentrated ownership structure is the norm.4 In addition, shares owned by the block
holder are non-tradable, thus limiting the ownership benefits of price appreciation to
the controlling shareholder, and increasing her incentive to obtain benefits through
other channels.5 These market features, in conjunction with a weak regulatory
system, give rise to an environment highly conducive to tunneling.
Our investigation focuses on inter-corporate loans, a particularly convenient
instrument through which Chinese majority shareholders can achieve their tunneling
ambitions. Typically reported as part of "Other Receivables" (OREC), these loans
represented a large portion of reported assets for many Chinese companies. During
our sample period (we examine annual reports for 1996 to 2004, and stock returns to
2006), OREC averaged 6.5% to 11.8% of total assets for all Chinese listed firms.
For firms in the top decile, OREC averaged 32% of total assets. Moreover, using a
hand collected sample of controlling shareholder receivables from Ye (2006), we
show that a substantial portion of these loans (between 30 to 40% of total OREC in
the top three decile firms) can be directly traced to large block holders or their
affiliates.6
4 As we show later, the percentage of shares controlled by the largest shareholder for the median firm in our sample is 43.6%; the inter-quartile range is 30% to 59%. 5 In July 2005, the Chinese government announced a policy aimed at eventually converting all restricted shares into tradable shares. This program is an attempt to address a key incentive for tunneling. It will take many years to implement and has little bearing on our empirical tests. In the summary section, we discuss the extent to which this policy is likely to affect incentives for tunneling in the future. 6 This figure almost certainly understates the magnitude of the related-party portion of OREC, as many of the affiliates cannot be easily identified with the controlling entity. The problem is exacerbated by

3
We show that companies with large OREC balances exhibit significantly worse future
operating performance, both in terms of lower accounting rates-of-return and higher
likelihood of entering financial distress. In fact, we find that controlling for current
ROA, the level of OREC scaled by total assets (ORECTA) is the single best predictor
of next year’s ROA. Moreover, high ORECTA firms are far more likely to become a
candidate for ST (Special Treatment) status – 14% of the top decile ORECTA firms
attain ST status in two years, compared to an average of less than 2% in the bottom 2
deciles firms.7
In cross-sectional analyses, we show that market participants do not appear to fully
anticipate the negative consequences of these loans. We find that the market uses a
higher implied discount rate in valuing the earnings of High-OREC firms, suggesting
a general awareness of the problem. However, we also find that high-OREC firms
earn lower risk-adjusted returns in the subsequent 12-months, suggesting that the
negative implications of these loans are not fully incorporated into prices in a timely
manner. A hedge portfolio that sells the top decile ORECTA firms and buys the
bottom decile earns over 1% per month over the next 12 months. This result is
robust to various risk adjustments and, consistent with the tunneling hypothesis,
almost all the profits are earned during market downturns.
We also examine several factors that could affect the severity of the agency problem
across firms. Consistent with prior studies on large shareholder incentives (e.g.,
Claessens et al. (2002)), we find that this form of tunneling is most problematic when
the block holder’s controlling right (C) is much larger than her ownership right (O).
Specifically, we show that firms in which the controlling shareholder enjoys the the pyramidal structure of Chinese listed companies, which can obscure related party relationships (see Fan et al. (2005). 7 Chinese listed firms that have two consecutive annual losses (or whose book value becomes negative) receive “Special Treatment” or “ST” status. ST stocks are under various trading and financial restrictions, and if they report one more loss year, they will be delisted.

4
lowest cash flow ownership rights (i.e., firms with large C/O ratios) have the largest
ORECTA balances. We also find that ORECTA balances tend to be bigger for small
firms (SIZE), non-state-owned firms (STATE), and firms registered in regions that are
less economically developed (MARKETIZATION).
As a further analysis, we evaluate the monitoring role of auditors. Allen et al. (2004)
suggest that a weak auditing profession is at least partially to blame for the relatively
sluggish growth of China’s Listed Sector (publicly listed firms). We find, however,
that auditors play a rather active monitoring role. Firms with high-OREC balances
are far more likely to receive a qualified opinion – in fact, the size of a firm’s
ORECTA balance is the single best variable for predicting whether a firm has an
unclean opinion. Moreover, a full 45% of the firms in the highest ORECTA decile
received an unclean opinion. Unfortunately, we find that firms receiving a qualified
opinion in one year exhibit no tendency to reduce their OREC balance in the
following year. These findings point to ineffective enforcement of investor
protection laws, rather than ineffective audits, as the main problem in China.
As a final analysis, we chronicle the extensive regulatory efforts that eventually
forced controlling block holders to repay (or otherwise settle) their debts to listed
companies. In Appendix 5, we summarize the long string of rulings and directives
that were issued between 2004 and 2006 aimed at stopping this practice. These
edicts culminated in a joint statement by eight government ministries in November
2006, threatening personal action against the top management of the controlling
shareholders unless the inter-corporate loans from listed companies are repaid by
December 31, 2006. This unprecedented show of political resolve finally forced the
repatriation of most of the remaining OREC balances – which, even as late as 2006,
amounted to close to 50 billion RMB, and involved over 400 firms.
Our study extends the existing tunneling literature along several lines. First, while
most prior studies focus on documenting the wealth effect of possible tunneling, we

5
provide detailed evidence on how it is actually conducted. Rather than inferring
tunneling effects indirectly, by linking firm valuation with ownership structure, we
develop an explicit empirical measure of tunneling behavior.8 Second, by employing
an empirical metric that is broadly available for all listed firms, our analyses go
beyond specific business groups or clusters of related parties, to document a
market-wide phenomenon of unprecedented scale.9
Third, we establish a cross-sectional link between the magnitude of the tunneling
activity and the severity of the economic consequences for investors. Specifically,
we show that firms with larger ORECTA balances have worse future operating
performance, increased likelihood of financial distress, as well as lower risk-adjusted
returns. To our knowledge this is the first paper to establish such an empirical link.
Fourth, we examine determinants of the level of tunneling, and identify several
cross-sectional factors that are related to the severity of the problem. Some of these
factors are specific to China (e.g. STATE and MARKETIZATION); others extend the
international evidence on incentives for large shareholder tunneling (e.g., BLOCK and
SIZE). Finally, we offer new evidence on the role of auditors and regulators in their
efforts to combat the problem. Specifically, we show that auditors were actively
involved in warning investors, but weak regulatory enforcement prevented serious
reform from taking root until the end of 2006.
8 The earliest international tunneling studies simply discuss tunneling through case studies (e.g., Johnson et al (2000)). Later studies infer the existence of tunneling indirectly, either by linking ownership structure to the market valuation of a firm’s equity (e.g., Bae et al (2002), Bertrand et al (2000), Faccio et al (2001)), or changes in market value during the Asian crises (Lemmon and Lin (2003). None of these studies use a direct empirical measure of tunneling activities. 9 Prior China studies either involve small samples (e.g., Chen and Jian (2005)’s study of dividend payouts) or examine tunneling in the context of earnings management and “propping” behavior (e.g. Liu and Lu (2002), Jian and Wong (2006)). These studies are complementary to ours. In fact, we believe a tunneling perspective is essential in understanding the managerial behavior of Chinese firms, including propping and earnings management. We discuss how our own analyses relate to the existing literature in greater detail in the next section.
6
Overall, our findings provide a portrait of the nature and severity of the tunneling
problem in China, and the on-going challenges associated with regulatory reform in
this major emerging economy. Although the specific form of abuse associated with
inter-corporate loans has been largely eliminated, most of the economic incentives
that gave rise to this tunneling behavior are still in place. Until certain fundamental
tensions associated with concentrated ownership are resolved, we believe the threat of
tunneling will be an on-going problem for Chinese investors and regulators.
The remainder of this paper is organized as follows. Section II provides background
information on the Chinese stock market and relates our analysis to recent academic
studies on corporate governance issues in China. Section III presents our empirical
analysis, including research methodology, data description, and test results. Section
IV concludes with a discussion of the implications of our findings.
II. Institutional Background and Literature Review
II.1 Salient Features of the Chinese Stock Market
In the early 1990s, under a “partial privatization” initiative, the Chinese Government
allowed state owned enterprises (SOEs) to sell a minority portion of ownership to
private investors. This led to the creation of China’s two stock exchanges: Shanghai
(in 1990) and Shenzhen (in 1991). The two markets expanded quickly, so that by the
end of 2004, the number of listed stocks reached 1,377 with a total market capital of
3,706 Billion RMB. Therefore, by virtue of heritage and design, virtually all
Chinese listed firms have concentrated ownership structures that feature a dominant
shareholder.
Common stocks in China are classified into two groups: tradable or non-tradable (also
called negotiable vs. non-negotiable, or transferable vs. non-transferable).10 To
10 After our sample period, and as part of on-going reform, non-tradable shares have been converted into tradable status. As we discuss in the summary section, this recent initiative is unlikely to

7
maintain control in the hands of the state, shares owned by all levels of governments,
all state agencies (such as universities), and state-owned corporations are deemed
State shares, and are non-tradable. In addition, shares owned by a collective
institution (e.g., a township enterprise), or other non-individual legal persons, are
deemed Legal Person (LP) shares, and are also not allowed to trade. The rest of the
shares are tradable, and are sold to individual citizens and institutional investors.11
As of February 2005, non-tradable shares account for 63.51% of all outstanding stock.
Approximately 70% of all non-tradable shares are held by state-owned enterprises.
Because controlling block holders generally cannot trade their stocks, the benefit they
derive from stock price appreciation is limited, thus increasing the incentive for
deriving benefits through other channels (i.e., tunneling). The weak legal and
corporate governance structure in China provides them such opportunities. As
MacNeil (2002) observed, courts in China have a long tradition of protecting State
interests and have little experience with private plaintiff-driven litigation.
The use of corporate loans, in particular, has an aura of legitimacy that other forms of
tunneling do not enjoy. Culturally, the practice is viewed by some as a “family
loan,” in recognition of the sacrifices and benefits extended to the listed company by
its unlisted “affiliates.”12 Practically speaking, an inter-corporate loan is also a
convenient vehicle for transferring funds directly from the listed company to entities
eliminate fundamental agency problems that lead to tunneling behavior. 11 The tradable shares are further subdivided into Tradable-A shares, which are publicly traded among domestic investors, and foreign (B, H, and N) shares. B-shares are available to foreign investors and are traded on the two domestic exchanges, whereas H and N shares have an overseas listing. In this study, the market price of a listed company refers to the price of its Tradable-A shares. 12 To appreciate this point, it is helpful to recognize that the listing process in China is arduous and highly competitive. According to a January 17, 2003 communiqué from China’s National Bureau of Statistics, only 1,160 out of a total of 369,000 state-owned firms were selected for listing. To increase the likelihood of approval, many SOE’s carved out the most profitable and successful portions of their business, and “re-assigned” various administrative burdens – hospitals, non-profitable divisions etc. – to other business units. Thus the idea that the listed firm should “send money home” does not strike some as unreasonable, or inconsistent with cultural expectations.

8
affiliated with the controlling block holder.
II.2. International Evidence
Although the negative effect of large shareholder tunneling is widely discussed, few
studies have provided empirical evidence on its magnitude and impact. The earliest
international tunneling studies simply discuss the problem through illustrative case
studies (e.g., Johnson et al (2000)). Later studies infer the existence of tunneling
indirectly, either by linking ownership structure to the market valuation of a firm’s
equity (e.g., Bae et al (2002), Bertrand et al (2000), Faccio et al (2001)), or changes in
market value during the Asian crises (Lemmon and Lin (2003)).
For example, Bae, Kang and Kim (2002) use evidence from mergers by Korean
business groups to show that controlling shareholders tend to make acquisitions that
enhance the value of other firms in the group, to the detriment of minority
shareholders. In this study, the main analyses involve a comparison of the price paid
in intra group deals to the price paid in a control sample. Similarly, Bertrand, Mehta,
and Mullainanthan (2000) use data on Indian business groups to show the tunneling of
resources by the largest shareholder within one Indian business group. Finally,
Lemmon and Lin (2003) examine the effect of ownership structure on firm value
during the Asian financial crises. They find crisis period stock returns of firms in
which managers have high levels of control rights, but have separated their control
and cash flow ownership, are 10-20 percentage points lower than those of other firms.
In all three studies, the key finding is that a firm’s ownership structure has a
predictable directional effect on firm value, a fact that is consist with insiders’
expropriation of minority shareholders. In each instance, the existence of tunneling
is inferred from the market valuation of a firm’s equity, or changes in market value
during a particular time period (i.e., the Asian crises). In this sense, the evidence is

9
relatively indirect and the ability to conduct detailed analyses of tunneling behavior is
quite limited.
II.3 China Studies
A number of studies have documented weaknesses in China’s legal and financial
system (e.g., see Liu (2005)), and the mitigating effect of regulatory changes. In
particular, Allen et al. (2005) argue that the rapid growth in the Chinese economy is
driven largely by her Private Sector, and that growth in the Listed Sector (publicly
listed firms) has been hampered by poor legal and financial mechanisms. Berkman
et al (2005) provide supporting evidence in the form of an event study of four
regulatory changes intended to improve the protection of minority shareholders from
expropriation from controlling shareholders. Their results show that these new
regulations significantly increased firm value, and that firms with weak governance
benefited more.
Three other studies examine the effect of ownership structure and corporate
governance on firm valuation in different settings. Fan et al. (2007) report that
post-IPO stock returns are lower for firms run by politically-connected CEOs,
suggesting that these CEOs do not enhance firm performance, and rather tend to fulfill
political aims detrimental to shareholder value. Cheung et al. (2006) examine a
sample of related party transactions between Chinese listed firms and their controlling
SOEs. Their evidence suggests that political connections are not typically beneficial
for minority shareholders. In the same spirit, Bai et al. (2003) construct a corporate
governance index using data from firms’ annual reports, and show that investors
generally pay a premium for well-governed firms in China. A consistent theme
across all these studies is that improved governance is valuable in China’s current
emerging economy.

10
Two recent studies have explored the effect of ownership structures on earnings
management. Liu and Lu (2002) document a positive relation between a firm’s
reported accruals and the largest shareholder’s interest in the company, as well as a
CEO entrenchment measure. They interpret this evidence as being consistent with
greater agency problems for companies with powerful shareholder control and CEOs
that have a greater personal interest in the company. Chen et al. (2003) explore the
role of the government in helping to facilitate earnings management in Chinese firms.
Their evidence indicates that local government entities actively assist listed firms in
earnings management through favorable asset-related transfers, so as to meet the
regulation stipulated by the central government.
Two other studies that examine large shareholder incentives to tunnel or prop up the
shares of a company by focusing on transactions with connected entities. In an event
study setting, Peng et al. (2006) show that the market reaction to connected
transaction announcements is negative when the listed firms are in sound financial
condition (supporting the tunneling hypothesis). In contrast, the market reaction to
connected transactions is on average positive when the listed firms are in financial
distress (supporting the notion that the large shareholders sometimes use these
transactions to prop up the value of listed firms). In a similar spirit, Jian and Wong
(2006) provide evidence that corporate insiders use related party transactions to prop
up earnings and tunnel resources from firms. Specifically, they show that these
transactions are used to meet regulatory earnings targets. They also provide some
evidence that more propping leads to more tunneling, and that this relation is stronger
among local government owned firms.
In summary, a number of recent studies have shed light on corporate governance and
earnings management problems in China. To the extent that these studies highlight
China’s weak governance environment, they help us to understand the incentives for
tunneling and earnings manipulation. Our paper is complementary to these studies,

11
in that we demonstrate the importance of a tunneling perspective in understanding
management behavior in China. In fact, we believe the economics of tunneling
provide an essential framework for interpreting many forms of company behavior,
including “propping” and earnings management.13
III, Empirical Analysis
III.1 Sample Description
Our sample consists of 1,377 public companies, listed on the Shanghai and Shenzhen
stock exchanges during the period 1996 to 2004. We use the CCER China Stock
Database, provided by SinoFin Information Services, to obtain fundamental variables,
price and returns information. To be included in our sample, a company must have
been listed for at least one year, and have filed the necessary financial information
required for our analysis. Collectively, as of the end of 2004, our sample of
companies represents 85.6% of the total listed firms (85.2% of the total market
capitalization) in China.14
Table I presents some descriptive statistics for our sample. In total, we have 7,557
firm-year observations. Chinese firms all have December year-ends, and the financial
information for year t is based on fiscal year-end t-1 financial reports. Panel A
reports the log of total assets (SIZE); market capitalization as of the fourth month
after the fiscal year end in millions of RMB (MV); the book-to-market ratio measured
four months after the fiscal year end (BM); total leverage, defined as total liabilities
divided by total assets (LEV); return-on-assets, defined as pre-extraordinary income
divided by total assets (ROA); other receivables in millions RMB (OREC); other 13 For example, both Jian and Wong (2006) and Liu and Lu (2002) find that the pattern of earnings management observed among Chinese firms is consistent with an abiding desire to facilitate large shareholder tunneling. 14 Throughout the paper, market capitalization (MV) refers to the value of tradable shares multiplied by the total number of shares outstanding, both tradable and non-tradable.

12
receivables deflated by total assets (ORECTA); and the percentage of shares
controlled by the largest shareholder (BLOCK). All variables are winsorized at 1%
and 99%.15
Panel A shows that the average market capitalization for our sample is 3.15 billion
RMB (approximate 381 million US dollars, using the prevailing exchange rate of 8.27
during our sample period). Most of these firms traded at a multiple of 2.5 to 5 times
book (BM), and had reported ROA's of between 1% and 6%. Of particular interest is
that most had substantial "Other Receivables" on their balance sheets (ORECTA) –
the inter-quartile range for this variable is between 1.7% and 10.8% of total assets. As
expected, the largest shareholder controls a substantial portion of these firms – the
inter-quartile range for the BLOCK variable is 29.2% to 58.2%.
Panel B reports year-by-year statistics for ORECTA. This panel shows that Other
Receivable as a percent of total assets has been on the decline over the sample period.
As we show later, the decline coincides with a concerted campaign by the China
Securities Regulatory Commission (CSRC) to reduce these loans.16 Nevertheless,
even by the end of 2004, the median firm still reported an "Other Receivable" balance
representing 2.4% of total assets. By definition, these loans are not part of ordinary
business transactions, and a casual survey of the financial footnotes show that they are
typically made to related parties, often associated with the largest shareholder.
However, this account also can contain miscellaneous receivables from parties not
immediately identifiable with the controlling block holder.
Appendix 1 presents a case study that illustrates the problem. The HANQI Group is
the largest shareholder of FENG HUA, holding a bit less than 30% of its shares.
15 All key results are robust to alternative windsorization techniques, including cross-sectional windsorization each year, windorsizing the entire sample, and no windsorization. 16 Appendix 5 shows that the CSRC tried to curb these practices as early as 2001, but its early efforts were largely ignored.
13
From early 2002, the HANQI Group (including its subsidiaries HANQI Real Estate,
and Beijing HANQI) “borrowed” large amounts of money from FENG HUA.
Appendix 1 contains excerpts from FENG HUA's financial statements. To gain a
sense for the magnitude of these borrowing, on December 31, 2002, HANQI’s share
of equity in FENG HUA is RMB 116.21 millions. On that date, it and its subsidiaries
borrowed from FENG HUA a total of 198.6 millions. FENG HUA never recovered
any of the money due from HANQI Group or its subsidiaries. Subsequently, FENG
HUA stock was put into Special Treatment (ST) status as a result of reporting two
consecutive annual losses.17
In terms of financial reporting, the money that large shareholders owe the listed
company is included in a data item called “Other Receivables” (OREC), which in this
instance also included several other large items not directly traceable to HANQI.
Unlike trade receivables, which are separately reported under the customary title of
“Accounts Receivables”, these corporate borrowings are not part of ordinary business
transactions, and are thus separately flagged in the report.
III.2 Large Share Holders and OREC
To better understand the extent to which “other receivables” is used as a vehicle for
large shareholder tunneling, we selected twenty firms from the top decile ranked by
ORECTA as of December 31, 2002, and conducted a more detailed analysis of the
composition of this variable. Appendix 2 presents the “other receivable” balance of
these twenty firms. On average, other receivables account for 40.4% of these firms’
total assets, and 51.4% of gross other receivables are due from the largest
shareholders alone. This evidence indicates a substantial portion of the ORECTA
balance is typically attributable to loans to large shareholders. Interestingly, some of
the economic fallout from large shareholder “borrowings” is also apparent from these
twenty firms: fourteen out of twenty received unclean auditor’s opinion on their 2002 17 Because Chinese firms rarely go into actual bankruptcy, ST status can be regarded as a comparable measure of financial distress.

14
annual reports, and twelve were subsequently “specially treated.” We investigate
these issues in more detail later in the paper.
To further explore the link between large block holders and ORECTA, we secured
hand collected data used by Ye (2006). From financial footnotes, Ye derived Other
Receivables due from controlling shareholders and its affiliated companies for all
manufacturing firms listed in the Shanghai Stock Exchange between 1999 and 2002 (a
sample of 1134 firm-years, or approximately 30% of our full sample during these
years). For each year between 1999 and 2002, we sort all listed Chinese firms
annually into ten deciles based on ORECTA (full sample). We then use the Ye (2006)
data to examine the proportion of OREC in each decile directly traceable to the
majority shareholder and its affiliates.
Appendix 3 reports the number of firm-years in Ye (2006) captured by each ORECTA
decile in our full sample. Column 3 shows that the Ye sample is quite evenly spread
out over our full sample. Column 4 shows that the average ORECTA balance from
the Ye sample also closely approximates the average for the full sample. Columns 5
and 6 report the total gross OREC and the large shareholder gross receivable (LSH
Gross OREC) derived from the Ye (2006) data set, and Column 7 reports LSH
receivable as a percentage of total gross OREC.
Overall, this evidence shows that a substantial portion of OREC is directly traceable
to the largest shareholder and its affiliates, particularly for firms in the high ORECTA
deciles. For example, firms in the top 3 deciles by ORECTA (full sample) have 30
to 40 percent of its OREC balance directly traceable to the majority shareholder or
affiliates. Moreover, the proportion owed by LSH decreases monotonically across
the ORECTA deciles, further indicating that problem of large shareholder tunneling is
also likely to decrease in severity in the lower ORECTA deciles.18 18 To further ascertain the extent to which the Ye (2006) sample is representative of the full sample, we checked a number of other firm characteristics. The details are not reported but are available on

15
As a final check, we compared our OREC measure to the amount of inter-corporate
loans to controlling shareholders reported in an official list of 189 firms identified by
the Shanghai and Shenzhen Stock Exchanges on June 1, 2006. These 189 firms
were flagged by the two exchanges as those in which the problem of controlling
shareholder tunneling is most severe. We collected the amount of OREC from the
2005 annual reports of these 189 firms, and found the Pearson correlation between our
OREC measure and the amount of LSH OREC reported on this official list to be
73.7%. Moreover, 43.75% of these firms were in the highest 2005 ORECTA decile;
81% of these firms belong to the top three deciles, and nearly 90% were in our top
four ORECTA deciles.
Collectively, the evidence thus far strongly suggests that by ranking firms using
ORECTA, we have a good empirical proxy for the degree of inter-corporate lending to
the controlling shareholder and its affiliates. In the following analyses, we aim to
better understand the nature and economic consequences of these loans.
III.3 The Persistence of ORECTA
To better understand the nature of these receivables, we sort firms into ten deciles
based on ORECTA, and trace the evolution of this variable through time. Figure 1A
reports the mean ORECTA for each decile in year t through t+3, and Figure 1B
reports the average decile ranking for the same four-year horizon.
The main result from these analyses is that cross-sectional rankings of firms by
ORECTA tend to be quite persistent over time. In other words, firms with larger
(smaller) "Other Receivable" balances tend to remain in the upper (lower) end of the request. In brief, the Ye firms are not significantly different from the rest of the firm-years in our sample in terms of Size, BM, and ROA. However, the Ye sample shows slightly higher state ownership (34.95% versus 31.55%) and lower ORECTA (7.67% versus 8.88%). In the current context, these differences are likely to understate the extent to which ORECTA is attributable to the majority shareholder and its affiliates in the Ye sample.

16
ORECTA over the next three years. For firms in the highest ORECTA decile in year t,
the average "Other Receivable" in year t+3 is still 20% of total assets.
This evidence is consistent with the long-term nature of the receivables. Specifically,
it suggests that the receivable is a more or less permanent part of the companies'
portfolio of reported assets. Cast in a different light, this evidence shows that listed
Chinese companies are routinely engaged in the practice of extending long-term credit
in large quantities to their largest shareholder.
III.4 Economic Consequences
In this section, we explore the economic consequences of large OREC balances.
Specifically, we examine the implications of large ORECTA balances for firms’ future
operating performance and the likelihood of experiencing financial distress.
Table II Panel A reports the results of a regression in which the dependent variable,
FROA, is the year t+1 return on asset. Independent variables include the current
year return-on-asset (ROA), and a rank variable, R_ORECTA, based on ranking
current year ORECTA of all firms into ten deciles, scaled to be between 0 and 1. In
addition, we use a number of other control variables: LEV is the total liability divided
by total assets, SIZE is log of total assets, NEG is a dummy variable, which takes 1 if
current year net income is negative and 0 otherwise; we also control for firm and year
fixed effects.19 The results show that R_ORECTA has a strong negative relation to
future ROA, after controlling for other variables (T-statistic = -8.5). In other words,
controlling for current ROA, higher ORECTA firms earn lower future ROA. The
difference between top and bottom decile ORECTA firms’ expected ROA is 4.9%.
19 None of the main results are affected if we only control for annual fixed effects (i.e. exclude firm fixed effect indicator variables). Also, we obtain very similar results if we use return-on-sales (ROS) rather than return-on-assets (ROA) as the performance metric in this analysis.

17
In Table II panel B, we use a LOGIT model to estimate the effect of ORECTA on the
probability of firms coming “Special Treated” (attaining ST status) in year t+3. For
this analysis, the dependent variable is a dummy variable, which takes 1 if the firm
was specially treated and 0 otherwise. Independent variables include R_ORECTA and
other control variables for predicting financial distress. ROA is operating income
divided by total assets, ATURN is asset turnover, SG is sales growths from the last
year, OCF is operating cash flow divided by total assets, NONOPERAT is
non-operating income deflated by total assets, and BLOCK is the percentage of shares
held by the largest shareholder. Because we use variables in year t to predict special
treatment in t+3, our sample size in Panel B reduces to 5,668 observations.20
Panel B reports the results of two LOGIT models. In the first regression, we use all
the independent variables except R_ORECTA. The results show that ROA, ATURN,
LEV, OCF, SIZE, and BLOCK all have some incremental power to predict future ST
status. In the second regression, we add R_ORECTA to the model, and find that it
enters the regression with a strongly positive coefficient. In fact, aside from current
year ROA, R_ORECTA is the single most important predictor of subsequent ST
status.
Figure 2 provides a graphic illustration of this result. To construct this figure, we
sort firms annually into ten deciles based on the magnitude of their reported ORECTA.
This figure depicts the proportion of firms in each decile that received ST status two
years after the formation of the deciles. The results show that a high proportion
(14%) of the firms in the top ORECTA decile in year t will receive ST status in year
t+3. This compares to an average of around 4% to 5% for the rest of the sample.
In fact, the next two deciles sorted by ORECTA also exhibit higher than average 20 We predict ST status for year t+3 because firms that attain this status will have reported two consecutive years of losses. We skip two years to avoid a peek-ahead bias. As a robustness check, we also used year t+2 and t+4 ST status as the dependent variable and found similar results.

18
tendency to receive ST status.
Overall, these results show that firms with high ORECTA balances perform worse in
terms of operating performance, and are much more likely to become a candidate for
delisting in future years. In the next section, we examine the extent to which market
prices reflect these adverse consequences.
III.5 Market Pricing and Returns Prediction
Table III presents an analysis of the impact of tunneling on firm valuation. The
dependent variable for this analysis is MVTA, defined as the market value of the firm
at the end of the fourth month after fiscal year end, deflated by total assets. The
independent variables are: BVTA, defined as book value deflated by total assets; ROA,
defined as the return on total assets; R_ORECTA, the scaled decile rank based on
ORECTA (i.e., R_ORECTA=1 for firms in the highest ORECTA decile, and
R_ORECTA=0 for firms in the lowest decile), and ROA_ORECTA, an interaction
term. To compute this last variable we multiply ROA by R_ORECTA. We also
include dummy variables to control for firm and year fixed effects. Because TA
scales all the continuous variables, we are effectively regressing MV on BV and
Earnings, plus two ORECTA-based variables. To the extent that the market applies a
greater discount to the earnings of high-ORECTA firms, we would expect the
coefficient on ROA_ORECTA to be negative.
The results show that this is indeed the case. As expected the coefficients on both
BVTA and ROA are positive. The coefficient on R_ORECTA is, surprisingly, not
significant in Model 1 and reliably positive in Model 3, suggesting that the market
does not generally value high ORECTA firms at a discount. However, the
coefficient on ROA_ORECTA is reliably negative in both Models 2 and 3. Indeed,
the coefficient estimates from Model 2 suggest that for the highest ORECTA decile

19
firms, the market essentially assigns a multiple of zero to reported earnings (12.4 -
14.3). Conversely, for low ORECTA firms, the multiple on earnings is 12.395.
Table IV examines the usefulness of ORECTA in predicting future returns. Panel A
presents future monthly size-adjusted returns (in percentage) for deciles formed on
ORECTA. In each year between 1996 and 2004, we sort firms into ten deciles based
on ORECTA. We then compute future returns begin from May 1 (year t+1) through
April 30 (year t+2). Table values represent the average monthly equal-weighted
size-adjusted returns for each portfolio.21
In panel B, we compute risk-adjusted returns using a Fama-McBeth procedure as
follows: Every month we regress monthly returns on R_ORECTA, R_MV (scaled
decile rank of market value at the end of April (t+1)), R_BM (scaled decile rank of the
Book-to-Market ratio) and R_LEV (scaled decile rank of leverage, defined as total
liability divided by total assets). In total there are 108 months. Panel B reports the
mean of these monthly coefficients and the t-statistics associated with their time-series
variation.
The evidence in both panels supports the view that ORECTA is negatively correlated
with future returns. Panel A shows that low-ORECTA firms generally earn higher
returns than high-ORECTA firms. The pattern is not monotonic across the deciles.
However, the difference in monthly returns between the top and bottom ORECTA
firms is 1.014% per month (T=7.36). Panel B results show that this negative
correlation with future returns is robust to the inclusion of market capitalization (MV),
book-to-market (BM), and leverage (LEV).
Table V examines the consistency of this result year-by-year. Table values represent
returns to a hedge strategy that buys the low-ORECTA decile portfolio and sells the 21 To compute size-adjusted returns, we subtract the average return for the firms in the same size decile each month. Size decile returns are as reported by the CCER database.

20
high-ORECTA portfolio. We use four measures of abnormal returns, adjusting for
different benchmark portfolios. In computing abnormal returns, we use four
different benchmarks to adjust for alternative measures of risk. ARET1 is the hedge
return where each firm’s abnormal return is computed relative to a reference decile
portfolio formed on the basis of its market value of tradable shares (size-adjusted);
ARET2 is abnormal returns relative to portfolios formed on deciles of firm beta
(beta-adjusted); ARET3 is relative to an equal-weighted market index (EW-index);
ARET4 is relative to a value-weighted market index for tradable shares of both the
Shanghai and Shenzhen markets (VW-index). Reported t-statistics are based on the
time-series variation in annual abnormal returns.
Table V shows that high-ORECTA firms consistently underperform low-ORECTA
firms regardless of the benchmark. The spread between the high and low ORECTA
firms is most pronounced in the second half of the sample period (2000 to 2004).
This is not surprising, as the problems engendered by large shareholder tunneling is
brought to light primarily during the post-2000 bear market. During this sub-period,
high-ORECTA firms underperformed low-ORECTA firms by 1.14% to 1.44% per
month, depending on the benchmark.
III.6 Ancillary Tests
In this section, we examine cross-sectional factors that could affect the severity of the
tunneling problem across firms. Our first test is motivated by international evidence
that tunneling is most problematic when the block holder’s controlling right (C) is
much larger than her ownership right (O).22 The intuition is straightforward: as the
C/O ratio increases, the controlling shareholder derives relatively greater benefit from
tunneling activities.
Consistent with this intuition, Claessens et al. (2002) show that firm value across
22 See, for example, Lemmon and Lin (2003) and Claessens et al. (2002).

21
eight Asian economies is increasing in the largest shareholder’s cash-flow ownership
(O), but decreasing in her control rights (C). In the same spirit, Lemmon and Lin
(2003) show that the decline in firm value during the Asian crisis follow a similar
pattern. Because neither study had a direct measure of tunneling, both relied on firm
values (i.e., invoke rational pricing assumptions) to infer this behavior. The use of a
direct empirical proxy for tunneling allows us to provide new evidence on this issue.
Figure 3 illustrates the relationship between ORECTA and BLOCK (the percentage of
shares outstanding held by the largest shareholder). To construct this graph, we sort
firms each year into 10 deciles based on the percentage of common shares held by the
biggest shareholder (BLOCK). We then calculate the median of ORECTA in each
decile. The figure depicts the distribution of ORECTA in each BLOCK decile. The
X-axis is decile rankings based on BLOCK. BLOCK values are on the left Y-axis,
ORECTA values are on the right Y-axis.
Consistent with prior studies on large shareholder incentives, we find that the use of
ORECTA is most pervasive when the block holder’s controlling right (C) is much
larger than her ownership right (O). Specifically, Figure 3 shows that ORECTA
balances are highest when the controlling shareholder holds less than 30% of the
shares. In fact, in the top BLOCK decile (where the controlling shareholder owns
over 70% of the cash-flow rights), ORECTA balances are quite low (close to 2% of
total assets).
Table VI provides a more comprehensive analysis of factors that could affect the
severity of the tunneling problem across firms. The dependent variable in this
analysis is ORECTA. The independent variables are: BLOCK; SIZE (log of total
assets); STATE (a dummy variable that takes the value of one if the largest
shareholder is any level of government or any government-owned institution);
MARKETIZATION (a comprehensive index measuring the development of the
regional market in which the firm is registered (see Fan and Wang (2004)), where
22
higher values indicate greater regional market development; and LAYER (the number
of intermediate layers between the company and its controlling owner through the
longest pyramidal chain (see Fan, Wong, and Zhang (2007)). We also include
industry and year fixed effect dummies.
Model 1 reports the result when only BLOCK and SIZE are included as explanatory
variables. Consistent with the univariate analysis, BLOCK has a strong negative
relation with ORECTA. Model 2 adds STATE and shows that this form of tunneling
is worse when the controlling shareholder is not a state-owned enterprise. Non-state
entities that control listed firms include regional collectives and private entrepreneurs.
Our evidence suggests that, on average, companies controlled by these entities tend to
have larger ORECTA balances.
Model 3 adds MARKETIZATION and shows that the tunneling problem is marginally
attenuated if the firm is located in a more developed region of the country. Finally,
Model 4 shows that the number of layers of ownership in the pyramidal structure is
not related to the level of ORECTA. Overall, the results of these regressions confirm
the earlier finding that BLOCK is strongly negatively correlated with ORECTA. At
the same time, it shows that SIZE, STATE, and MARKETIZATION also contributes
in explaining the degree of tunneling across firms.
Some prior studies (e.g., Allen et al. (2005)) allege that weakness in the audit
profession is at least partially to blame for China’s corporate governance woes. We
attempt to shed some light on this issue by examining a few sample audit reports and
by assessing the large sample relation between audit qualifications and ORECTA
balances. Appendix 4 presents two sample auditor reports that illustrate the range of
language used by auditors to express their concern with firms’ tunneling activities (the
original opinions were in Chinese and available upon request, we provide a translated
version). Case A is a denial of opinion; Case B is a qualified opinion with an

23
explanatory paragraph. In both instances, it is clear that the auditor had serious
reservations about the legitimacy of the “Other Receivables” balance. For our
analyses, both reports are treated as “qualified.”23
In Table VII Panel A, we examine the extent to which ORECTA balances are related
to the likelihood of receiving an audit qualification. In this test, we use a LOGIT
model where the dependent variable, Q, equals 1 if the firm receives a qualified audit
opinion and 0 otherwise. LQ (lagged Q) is the corresponding auditor opinion
variable in the previous year. AR is accounts receivable deflated by total assets.
ORECTA is as defined earlier.
The Model 1 results in Panel A show that ORECTA is highly significant, and
positively correlated with the probability of receiving a qualified opinion. In terms
of its ability to predict the likelihood of a qualified opinion, it is more important than
any other variable, including ROA and LEV. Model 2 shows that, even after
including LQ (lagged Q), ORECTA is still highly significant. Evidently auditors are
well aware ORECTA balances, and are willing to issue unclean opinions for high
ORECTA firms.
Figure 4 offers a graphical depiction of this result. This graph shows that 45% of all
firms in the top ORECTA decile receive unclean opinions. The probability of an
unclean opinion declines almost monotonically across ORECTA deciles, such that
only around 5% of the firms in the lower deciles receive unclean opinions. Once
again, the evidence is consistent with auditors playing a monitoring role with respect
to tunneling activities using corporate loans.
23 Of course, qualified audit opinions could be issued for reasons unrelated to high ORECTA balances. We do not make this distinction in our tests. Rather, we simply examine the extent to which ORECTA balances are related to the likelihood of receiving an audit qualification.

24
As a final test, we examine the effect of a qualified opinion on subsequent tunneling
behavior. Panel B of Table VII reports a regression of ORECTA in year t+1 on
current year ORECTA, and dummy variable Q, as well as other control variables. If
firms curtail their tunneling activities after receiving a qualified opinion, we would
expect the coefficient on Q to be negative. Instead, we find that the Q coefficient is
positive and significant, indicating that firms are more likely to increase their
ORECTA balance after a qualified opinion. This counter-intuitive result could be
due, in part, to the fact that some firms charge an interest balance on the loans. The
interest, which is also typically not repaid, simply increases the outstanding loan
balance. In any event, we find no evidence that firms receiving a qualified opinion
in year t will reduce their use of OREC as a vehicle for tunneling in the next period.
III.7 The Long Road to Regulatory Reform
Thus far our analysis highlights a chronic problem that affected many listed firms in
the Chinese market during the 1996 to 2006 time period. In Appendix 5, we
document the regulatory efforts to curb this abuse. We provide a brief annotated
discussion of these rules and regulations here.
Opening Rounds (Pre-2004)
As we outline in this Appendix, efforts to reduce OREC balances began as early as
2001, when the CSRC issued a (largely ignored) request to listed companies to stop
the practice of lending to controlling shareholders. Coincidentally, 2001 was the
first year that the Chinese stock market showed clear signs of being in a serious
decline (a bear market that would last until 2006).
By August 2003, the CSRC had issued explicit instructions calling for an end to loans

25
by listed companies to controlling shareholders (CSRC Rule 2003-56). In fact, the
same ruling required listed companies to reduce their OREC balances to their
controlling shareholder by 30% per year. This ruling was also largely ignored,
perhaps because the CSRC had no legal means of enforcing punitive action against
the controlling shareholders, most of whom were not publicly listed firms.
The Middle Game (2004-2005)
In January 2004, against the backdrop of a bleak 3-year-old bear market, the State
Council issued Directive 2004-3, titled “On the reform and development of capital
markets.” A section of this directive specifically addresses the problem of tunneling,
and states “we must prevent controlling shareholders from embezzling listed company
assets, and punish those who did.” This directive provided the CSRC a much needed
mandate to take action against controlling shareholders.
In July 27, 2004, recognizing the difficulties most controlling shareholders will have
in making repayments, CSRC proposes “Debt for Equity Swaps”, whereby the
controlling shareholder may (subject to approval) repay the amount owed by
exchanging the loan for their equity position in the listed company.
In June 6, 2005, CSRC Rule 2005-37 spelled out explicit non-compliance penalties.
Perhaps most importantly, the rule states that in 2006, CSRC will disclose the names
of all controlling shareholders who still owe balances of 100 million or more RMB as
of December 31, 2005, as well as the names of the chairperson of the controlling
entity. This is the first time the top person in the controlling entity is implicitly held
personally liable for these funds
In November 1, 2005, with the stock markets still in a swoon, the State Council issued
a Directive on Behalf of CSRC. Broadly titled “On Improving the Quality of Listed
Companies”, this directive acknowledged that the listed companies are in bad shape,
26
and prescribed a sweeping list of changes to corporate governance and disclosure
rules (targeting controlling shareholders). In particular, this directive set December
31, 2006 as a date by which all OREC from controlling entities and their affiliates
must be repaid. Moreover, it states that the top management of controlling
shareholders or colluding firms will be personally punished, if such payments remain
outstanding by the end of 2006.
The End Game (2006)
November 7, 2006, in an unprecedented move, eight government ministries issued a
joint announcement, making it clear that the top management of controlling entities
will be fired from their post and face disciplinary punishment if the December 31,
2006 deadline for repayment is not met. These ministries represent a broad spectrum
of governmental agencies that, collectively, had the power to ensure the top
management of controlling shareholders will be arrested if necessary.
By December 31, 2006, 399 listed companies managed to resolve OREC balances
totaling 39 billion RMB. Another 17 listed companies, with OREC balances totally
9.2 billion RMB, failed to resolve their loans. In 10 out of these 17 companies, top
management of the controlling entity or colluding entities, were arrested – thus
bringing to a close an extraordinary chapter in security regulation history.
IV. Summary
This study documents the widespread use of corporate loans by controlling
shareholders to extract funds from Chinese listed companies. Typically reported as
"Other Receivables" (OREC), these loans represent a substantial portion of the
reported assets of Chinese firms. We show that these loans are of a long-term nature,
and that they are typically made to parties related to the controlling shareholder, and
that they were used extensively to transfer funds out of hundreds of Chinese firms in
the 1996 to 2006 time period.

27
We also find that firms with large OREC-to-total-asset (ORECTA) balances
experience worse future operating performance and are much more likely to become
candidates for delisting. Market participants seem to anticipate these negative
outcomes to some extent, in that the market applies a higher discount rate to the
earnings of high-ORECTA firms. However, the market pricing of this information
appears incomplete, in that high-ORECTA firms still earn negative risk-adjusted
returns over the next 12-months.
Consistent with prior studies, we find this form of tunneling is most severe when the
block shareholder’s controlling right (C) is significantly larger than her ownership
right (O). Specifically, we find that ORECTA balances are highest in firms were the
controlling shareholder’s cash-flow ownership right (O) is less than 40%. As the
controlling shareholder’s ownership right increases, the incentive to tunnel diminishes
and so does ORECTA. We also find that the severity of the tunneling problem is
greater for smaller, non-state-owned firms, particularly if they are located in regions
of the country that are less economically developed.
We also evaluate the monitoring role of auditors. Specifically, we show that the
level of ORECTA is strongly associated with the likelihood of receiving a qualified
audit opinion. In fact, 45% of the firms in the highest ORECTA decile receive a
qualified opinion (compared to less than 5% among low ORECTA firms). However,
firms that receive a qualified opinion in year t show no inclination to reduce their
ORECTA balance in year t+1. These findings show that auditors do play a
monitoring role, but absent effective regulatory enforcement action, unclean audit
opinions alone are insufficient to deter tunneling behavior.
Finally, we document the long and arduous efforts by the CSRC and other regulators
to put an end to this particular form of tunneling. We show that between 2001 and
the end of 2006, numerous rulings, directives and other edicts were issued. These

28
efforts culminated in an unprecedented eight ministry joint statement in November
2006 which threatened personal action against the top management of controlling
shareholders unless all inter-corporate loans from listed companies are repatriated by
December 31, 2006. This unusual show of political resolve finally forced the
repatriation of most of the remaining OREC balances – which, even as late as 2006,
amounted to close to 50 billion RMB, involving over 400 firms.
Overall, our findings provide a portrait of the nature and severity of the tunneling
problem in China, and the on-going challenges associated with regulatory reform in
this major emerging economy. Our evidence shows that this form of tunneling was
pervasive throughout the Chinese Listed Sector, and carries serious economic
consequences for the firms involved. These findings dovetail nicely with
international evidence on the cross-sectional determinants of the incentives for
tunneling – specifically, it is positively correlated with a firm’s C/O ratio. However,
unlike prior studies that infer the degree of tunneling through firm valuation, we
provide an explicit measure and document a tunneling activity of unprecedented scale.
Our analysis is also related to a number of recent studies on corporate governance and
earnings management problems in China. To the extent that these studies highlight
China’s weak governance environment, they help us to understand the incentives for
tunneling and earnings manipulation. Our paper is complementary to these studies,
in that we demonstrate the importance of a tunneling perspective in understanding
management behavior in China. In fact, we believe the economics of tunneling
provide an essential framework for interpreting many forms of company behavior,
including “propping” and earnings management.
Looking ahead, although the specific form of abuse associated with inter-corporate
loan has ceased, the economic incentives that gave rise to this behavior are still intact.
Under China’s recent regulatory reform, controlling shareholders’ holdings have now
largely been converted into tradable status. However, the Chinese government

29
clearly plans to retain control of all state-owned listed companies. At the time of this
writing, Chinese laws restrict both the timing and amount of the sale of controlling
blocks, and analysts project the lower bound on the government’s intended
shareholdings to be between 25% and 60% for Chinese firms in most industries.24
Given these developments, in spite of the considerable progress made to date, we
remain cautious about the resolution of the tunneling problem in China. At least in
the foreseeable future, China’s Listed Sector will continue to be characterized by
concentrated block holdings and dominant controlling shareholders whose benefit
from firm price appreciation will be limited. In fact, most controlling shareholders
will face an even wider gap between their controlling rights (C) and cash ownership
rights (O) – thus potentially increasing tunneling incentives. Until these
fundamental agency issues are resolved, we believe the threat of tunneling will remain
an on-going problem for Chinese investors and regulators.
24 In a May 2006 report, Hualin Securities analyst Fupeng Qi, after analyzing a vast number of regulations, rulings, policy announcements and speeches by government officials, classified listed companies into five groups, and estimated lower bounds on the government’s intended shareholding in listed companies for each: Group 1: Listed companies in industries that are critical to national or economic security, or provide important public goods or services. For this group, the government minimum holding is 60%. Group 2: Listed companies in important energy or natural resources industries, or major high-tech industries. For this group, the minimum government shareholding is 51%. Group 3: Listed firms in agriculture, and manufacturing, no less than 35%. Group 4: Listed firms in highly competitive industries, no less than 25% Group 5: listed firms in retailing and other service industries, no less than 10%. Of course, these estimates only apply to controlling shareholders that are state-owned. However, we have no reason to believe non-state-owned block holders will be any more eager to relinquish their controlling positions.

30
References
Allen, Franklin, Jun Qian, and Meijun Qian. 2005. “Law, Finance, and Economic Growth in China”. Journal of Financial Economics 77, 57-116
Atanasov, Vladimir, 2005. “How much value can blockholders tunnel? Evidence from the Bulgarian mass privatization auctions”. Journal of Financial Economics 76, 191-234.
Bae, Kee-Hong, Jun-Koo Kang and Jin-Mo Kim. 2002. “Tunneling or Value Added? Evidence from Mergers by Korean Business Groups”. Journal of Finance 57, 2695-2740.
Bai, Chong-En, Qiao Liu, Joe Lu, Frank M. Song, and Junxi Zhang. 2004, “Corporate Governance and Market Valuation in China”. Journal of Comparative Economics 32: 599-616
Berkman, Henk, Robert Cole, and Jiang Hu. 2005. “Agency Conflicts, Expropriation and Firm Value: Evidence from Securities-Market Regulation in China”. Working paper, Massey University Albany
Berle, Adolf and Gardiner Means, 1932. The Modern Corporation and Private Property, New York: Macmillan.
Chen, Donghua, and Ming Jian. 2005. “Do Dividend Policies of Chinese Listed Firms Constrain or Facilitate Tunneling?” Working paper, Shanghai University of Finance and Economics
Chen, Xiao, Chi-Wen Jevons Lee, and Jing Li. 2003. “Chinese Tango: Government Assisted Earnings Management”. Working paper, Tulane University
Cheung, Yan-Leung, Lihua Jing, Raghavendra Rau, and Aris Stoutaitis. 2006. “Tunneling, Propping, and Expropriation: Evidence from Connected Party Transactions in Hong Kong”. Journal of Financial Economics 82:343-386
Claessens, Stijn, Simeon Djankov, and Larry Lang. 2000. “The separation of ownership and control in East Asian Corporations”. Journal of Financial Economics 58, 81-112.
Claessens, Stijn, Simeon Djankov, Joseph Fan, and Larry Lang. 2002. “Disentangling the Incentive and Entrenchment Effects of Large Shareholders”. Journal of Finance 57, 2741-2771.
Durnev, Artyom and Han Kim, 2005. “To Steal or Not to Steal: Firm Attributes, Legal Environment, and Valuation”. Journal of Finance 60, 1461-1493.
Faccio, Mara, and Larry Lang. 2002. “The ultimate ownership of Western European corporations”. Journal of Financial Economics 65, 365-395.
Faccio, Mara, Larry Lang, and Leslie Young. 2001. “Dividends and Expropriation”. American Economic Review, Vol. 91, 54-78.
Fan, J., T.J. Wong, and T. Zhang, 2005, The Emergence of Corporate Pyramids in

31
China, working paper, Chinese University of Hong Kong. Fan, Joseph P.H., T.J. Wong, and Tianyu Zhang, 2007, “Politically Connected CEOs,
Corporate Governance, and Post-IPO Performance of China’s Newly Partially Privatized Firms”, Journal of Financial Economics 84, 330-357.
Jensen, M., and W. Meckling, 1976. “Theory of the firm: Managerial behavior, agency costs, and ownership structure”. Journal of Financial Economics 3, 305-360.
Jian, Ming, and T.J. Wong. 2006. “Propping and Tunneling through Related Party Transactions”. Working Paper, The Chinese University of Hong Kong.
Johnson, S., Boone, P., Breach, A., and E. Friedman, 2000, “Corporate governance in the Asian financial Crisis”, Journal of Financial Economic 58, 141-186.
Johnson, S., R. La Porta, A. Shleifer and F. Lopez-de-Silanes. 2000. “Tunneling”, American Economic Review Papers and Proceedings 90, 22-27.
La Porta, Rafael, Florencio Lopez-de-Silanes and Guillermo Zamarripa, 2003, “Related Lending”, Quarterly Journal of Economics 118: 231-268
La Porta, R., F. Lopez-De-Silanes, A. Shleifer, and R. Vishny. 1999. “Corporate ownership around the world”, Journal of Finance 54, 471-517.
Lemmon, Michael and Karl V. Lins. 2003. “Ownership Structure, Corporate Governance, and Firm Value: Evidence from the East Asian Financial Crisis”. Journal of Finance 58, 1445-1468.
Liang Bangzhu, 2006, Controlling Share Borrowing Badly Hurt the Profitability of Listed Companies, Securities Times, April 15.
Liu, Qiao. 2005. “Corporate Governance in China: Current Practices, Economics Effects, and Institutional Determinants”. Working paper, the University of Hong Kong.
Liu, Qiao, and Joe Lu, 2002. “Earnings Management to Tunnel: Evidence from China’s Listed Companies”. Working Paper, University of Hong Kong
MacNeil, I., 2002. “Adaptation and convergence in corporate governance: The case of Chinese listed companies”. Journal of Corporate Law Studies 2, issue 2.
Peng, Winnie, K.C. John Wei, and Zhishu Yang, 2006, “Tunneling or propping: evidence from connected transactions in China”. Working papr, Hong Kong University of Science and Technology.
Roosenboom, Peter, and Willem Schramade. “The Price of Power: Valuing the Controlling Position of Owner-Managers in French IPO Firms”. Working paper, Erasmus University Rotterdam.
Shleifer, Andrei, and Robert Vishny, 1997. “A Survey of Corporate Governance”,

32
Journal of Finance 52, 737-783.
Ye, Kangtao, 2006, Related Party Transactions, Value Relevance of Accounting Information, and Agency Costs, Ph.D. dissertation, Peking University,

33
Appendix 1: FENG HUA: A Case Study in Large Shareholder Tunneling The HANQI Group is the largest shareholder of FENG HUA (stock code: 600615), holding a bit less than 30% of its shares. From early 2002, the HANQI Group (including its subsidiaries HANQI Real Estate, and Beijing HANQI) “borrowed” large amounts of money from FENG HUA. The following table contains excerpts from FENG HUA's financial statements. To gain a sense for the magnitude of these borrowing, on December 31, 2002, HANQI’s share of equity in FENG HUA is RMB 116.21 millions. On that date, it and its subsidiaries borrowed from FENG HUA a total of 198.6 millions. In terms of financial reporting, the money that large shareholders owe the listed company is included in a data item called “Other Receivables” (OREC), which in this instance also included several other large items not directly traceable to HANQI. 52.2 millions RMB were written off on December 31, 2004 because Beijing HANQI no longer existed (bankrupt). FENG HUA was subsequently “specially treated (ST)”. All table values are in millions RMB, except percentages. All data is available on SINA finance website.
Reporting Date
Gross OREC Total Assets
Gross OREC/
Total Assets
Gross OREC from
HANQI Group
Gross OREC from
Beijing HANQI
Gross OREC from
HANQI Real Estate
Total Gross OREC from
HANQI
HANQI’s % in Gross
OREC
Item (1) (2) (1)/(2) (4) (5) (6) (7)=(4)+(5)+
(6) (7)/(3) 2004-12-31 304.4 693.2 44% 122.2 0 31.7 153.9 51% 2004-06-30 308.0 781.2 39% 122.2 52.2 30.0 204.4 66% 2003-12-31 328.4 804.5 41% 122.2 52.2 30.0 204.4 62% 2003-06-30 362.8 940.4 39% 116.5 52.2 30.0 198.6 55% 2002-12-31 342.9 947.6 36% 116.4 52.2 30.0 198.6 58% 2002-06-30 306.2 1078.5 28% 122.0 52.2 30.0 204.2 67% 2001-12-31 189.6 1084.2 17% 52.2 30.0 82.2 43% 2001-06-30 66.0 1193.9 6%
34
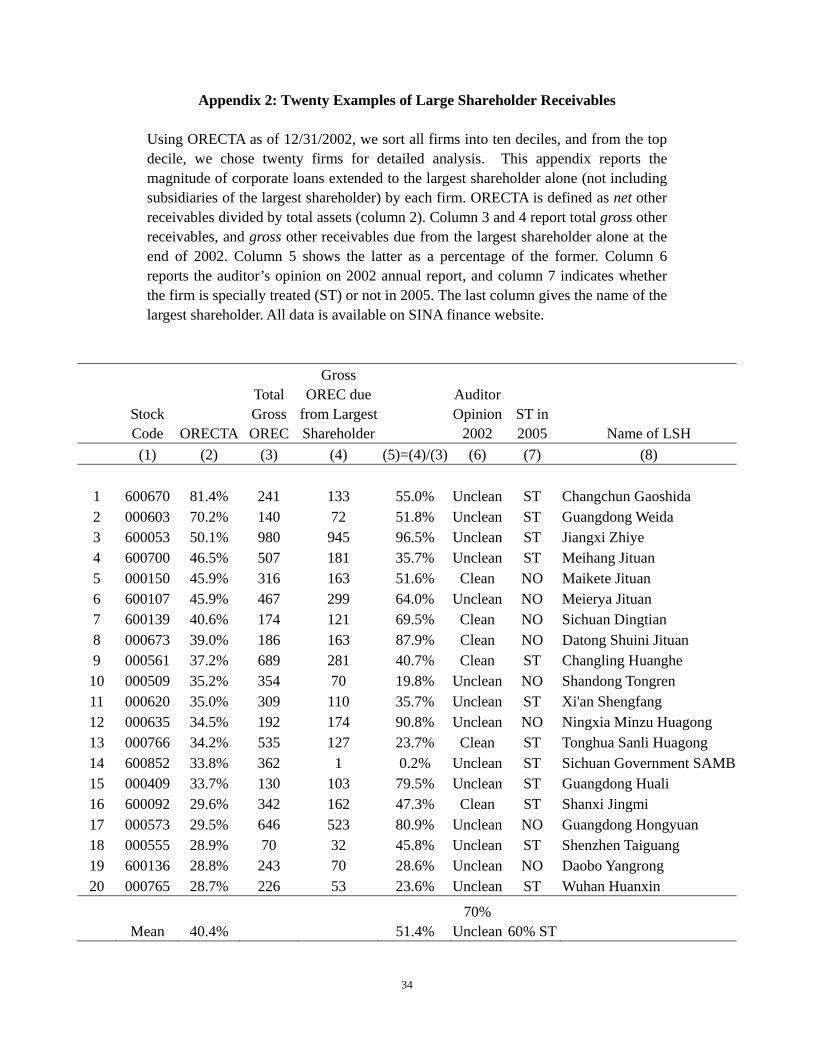
Appendix 2: Twenty Examples of Large Shareholder Receivables
Using ORECTA as of 12/31/2002, we sort all firms into ten deciles, and from the top decile, we chose twenty firms for detailed analysis. This appendix reports the magnitude of corporate loans extended to the largest shareholder alone (not including subsidiaries of the largest shareholder) by each firm. ORECTA is defined as net other receivables divided by total assets (column 2). Column 3 and 4 report total gross other receivables, and gross other receivables due from the largest shareholder alone at the end of 2002. Column 5 shows the latter as a percentage of the former. Column 6 reports the auditor’s opinion on 2002 annual report, and column 7 indicates whether the firm is specially treated (ST) or not in 2005. The last column gives the name of the largest shareholder. All data is available on SINA finance website.
Stock Code ORECTA
Total Gross OREC
Gross OREC due
from LargestShareholder
Auditor Opinion
2002 ST in 2005 Name of LSH
(1) (2) (3) (4) (5)=(4)/(3) (6) (7) (8) 1 600670 81.4% 241 133 55.0% Unclean ST Changchun Gaoshida 2 000603 70.2% 140 72 51.8% Unclean ST Guangdong Weida 3 600053 50.1% 980 945 96.5% Unclean ST Jiangxi Zhiye 4 600700 46.5% 507 181 35.7% Unclean ST Meihang Jituan 5 000150 45.9% 316 163 51.6% Clean NO Maikete Jituan 6 600107 45.9% 467 299 64.0% Unclean NO Meierya Jituan 7 600139 40.6% 174 121 69.5% Clean NO Sichuan Dingtian 8 000673 39.0% 186 163 87.9% Clean NO Datong Shuini Jituan 9 000561 37.2% 689 281 40.7% Clean ST Changling Huanghe 10 000509 35.2% 354 70 19.8% Unclean NO Shandong Tongren 11 000620 35.0% 309 110 35.7% Unclean ST Xi'an Shengfang 12 000635 34.5% 192 174 90.8% Unclean NO Ningxia Minzu Huagong 13 000766 34.2% 535 127 23.7% Clean ST Tonghua Sanli Huagong 14 600852 33.8% 362 1 0.2% Unclean ST Sichuan Government SAMB15 000409 33.7% 130 103 79.5% Unclean ST Guangdong Huali 16 600092 29.6% 342 162 47.3% Clean ST Shanxi Jingmi 17 000573 29.5% 646 523 80.9% Unclean NO Guangdong Hongyuan 18 000555 28.9% 70 32 45.8% Unclean ST Shenzhen Taiguang 19 600136 28.8% 243 70 28.6% Unclean NO Daobo Yangrong 20 000765 28.7% 226 53 23.6% Unclean ST Wuhan Huanxin
Mean 40.4% 51.4% 70%
Unclean 60% ST

35
Appendix 3: The Proportion of Large Shareholder Receivables (LSH Gross OREC) within each ORECTA Decile
This table reports the gross amount of large shareholder receivable as a proportion of total other receivables (OREC) for firms sorted by ORECTA decile. To construct this table, we first sort our full sample of firm-years annually into deciles by ORECTA. We then report aggregate statistics for the Ye (2006) firm-year observations within each ORECTA decile. Ye (2006) hand collected the amount of other receivables due from the controlling shareholder and its affiliates (LSH Gross OREC) for all manufacturing firms listed on the Shanghai Stock Exchange between 1999 and 2002. This table reports the number of Ye observations in each decile, the average ORECTA value, the average LSH Gross OREC value, and LSH Gross OREC expressed as a percentage of total gross OREC.
Full Sample Ye (2006) Sample
ORECTA
Number of Ye
(2006) firm-years in full sample
deciles ORECTATotal Gross
OREC
LSH Gross OREC
(LSH gross /Total
gross) Low 0.56% 139 0.40% 8.38 1.04 6.60%
2 1.62% 156 1.20% 24.40 6.05 14.30% 3 2.74% 115 2.10% 47.15 13.63 16.70% 4 4.01% 112 3.10% 74.66 11.78 15.10% 5 5.37% 103 4.20% 111.16 27.44 19.00% 6 6.99% 95 5.90% 107.58 21.45 22.00% 7 9.13% 104 7.80% 138.67 43.26 24.30% 8 12.10% 105 10.90% 186.06 50.54 30.70% 9 17.22% 109 16.40% 263.91 90.54 30.90%
High 31.97% 96 32.50% 481.44 252.12 42.20%

36
Appendix 4: Two Auditor’s Reports with Unclean Opinion Related to Large Shareholder Tunneling (Author Translation)
Case A: Auditor’s Report Concerning 2004 Annual Report, Shenzhen Heguang Corporation (Stock Code 000864): Denial of Opinion
To the shareholders of Shenzhen Heguang Corporation:
We are entrusted to audit the consolidated balance sheet, income statement and statement of cash flows of Shenzhen Heguang Corporation as of December 31, 2004. It is the responsibility of the management of Shenzhen Heguang Corporation to prepare these accounting statements.
We note that:
1. The controlling shareholder and its related parties are using large amount of funds of Heguang in 2004. By December 31, 2004, the controlling shareholder and it related parties owe Heguang RMB 597,633,000 Yuan, 432% of Heguang’s shareholders’ equity. We cannot make a professional judgment on the probability of collecting from the controlling shareholder and its related parties due to lack of evidence of doing so.
2. Shenzhen Heguang Corporation has a few pending lawsuits and arbitration cases against it, thus faces heavy liability burden in the near future. As footnote 11.1 indicates, the company may not be able to meet these obligations in its normal operation.
Because the above-mentioned matters have significant impact on the company, and we cannot ascertain that it is reasonable to assume the company is a going-concern, we cannot issue an opinion on this financial report.
Beijing Jingdu Accounting Firm
Dengshu Tong, Youye Wang, CPA
Beijing, China April 26, 2005
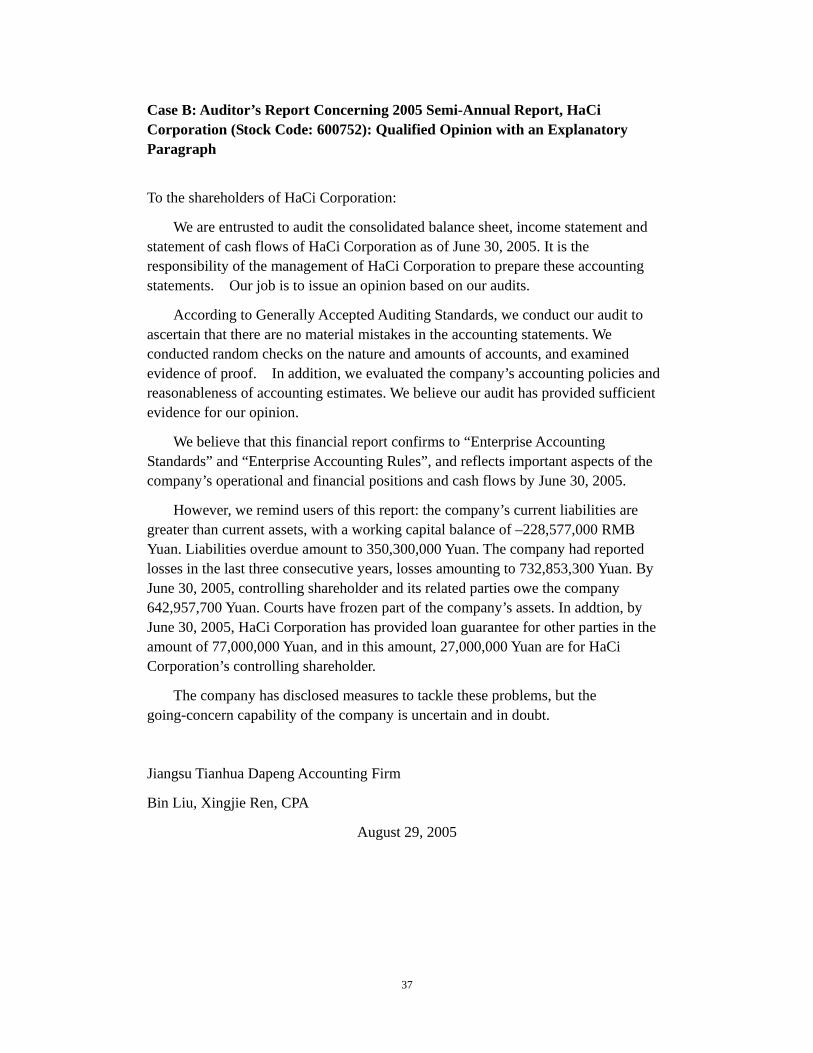
37
Case B: Auditor’s Report Concerning 2005 Semi-Annual Report, HaCi Corporation (Stock Code: 600752): Qualified Opinion with an Explanatory Paragraph
To the shareholders of HaCi Corporation:
We are entrusted to audit the consolidated balance sheet, income statement and statement of cash flows of HaCi Corporation as of June 30, 2005. It is the responsibility of the management of HaCi Corporation to prepare these accounting statements. Our job is to issue an opinion based on our audits.
According to Generally Accepted Auditing Standards, we conduct our audit to ascertain that there are no material mistakes in the accounting statements. We conducted random checks on the nature and amounts of accounts, and examined evidence of proof. In addition, we evaluated the company’s accounting policies and reasonableness of accounting estimates. We believe our audit has provided sufficient evidence for our opinion.
We believe that this financial report confirms to “Enterprise Accounting Standards” and “Enterprise Accounting Rules”, and reflects important aspects of the company’s operational and financial positions and cash flows by June 30, 2005.
However, we remind users of this report: the company’s current liabilities are greater than current assets, with a working capital balance of –228,577,000 RMB Yuan. Liabilities overdue amount to 350,300,000 Yuan. The company had reported losses in the last three consecutive years, losses amounting to 732,853,300 Yuan. By June 30, 2005, controlling shareholder and its related parties owe the company 642,957,700 Yuan. Courts have frozen part of the company’s assets. In addtion, by June 30, 2005, HaCi Corporation has provided loan guarantee for other parties in the amount of 77,000,000 Yuan, and in this amount, 27,000,000 Yuan are for HaCi Corporation’s controlling shareholder.
The company has disclosed measures to tackle these problems, but the going-concern capability of the company is uncertain and in doubt.
Jiangsu Tianhua Dapeng Accounting Firm
Bin Liu, Xingjie Ren, CPA
August 29, 2005

38
Appendix 5: The Long Road to Regulatory Reform The following is a list of rules and regulations specifically related to tunneling through inter-corporate loans Early 2001 – CSRC Requirement As early as 2001, the China Securities Regulatory Commission (CSRC) issued a general requirement that all listed companies collect their “loans” (OREC) to controlling shareholders, but this requirement was widely ignored. August 28, 2003 – CSRC Rule 2003-56 This rule prohibits new loans to the controlling shareholder and sets out specific targets and guidelines for reducing existing OREC balances. Specifically, this rule:
(1) Prohibits listed companies from lending money to controlling shareholders (and their related parties), with or without interest.
(2) Prohibits listed companies from providing loan guarantees for controlling shareholders and their affiliates.
(3) Requires listed companies to reduce the money controlling shareholders obtained from them, directly or indirectly, by 30% every year (starting in 2003). Controlling shareholders are required to repay in cash – unless specifically approved by CSRC.
(4) If this rule is not followed, the management of the controlling entity, if a state agency, would face disciplinary penalty or dismissal; if a non-state agency, may face legal penalty.
Commentary: This rule also was widely ignored, perhaps because the CSRC has no legal authority to implement the penalty provisions against the controlling shareholders, most of whom were not publicly listed firms. January 2004 – State Council Directive 2004-3 The State Council issued a board directive titled “On the reform and development of capital markets”. A section of this directive specifically addresses the problem of tunneling, and states “we must prevent controlling shareholders from embezzling listed company assets, and punish those who did.” Recognizing that a root incentive for tunneling derives from the non-tradable nature of the block holdings, the same directive called for an end to the non-tradable status for the controlling shares. Commentary: State Council Directives are rare – the previous one was the 1992 directive that authorized the re-opening of China’s stock exchanges. This directive provided the CSRC with a much needed mandate to take action against controlling shareholders. July 27, 2004 – CSRC Proposes “Debt for Equity Swaps” The emboldened CSRC began to recognize that many controlling shareholders simply
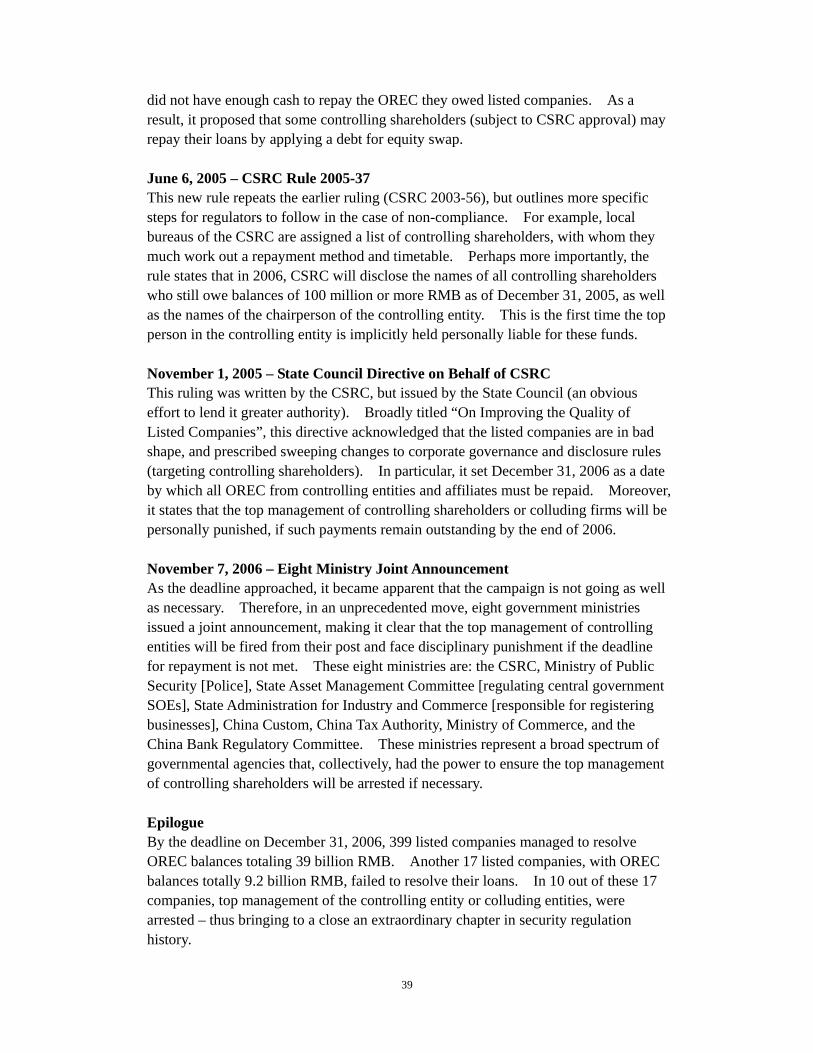
39
did not have enough cash to repay the OREC they owed listed companies. As a result, it proposed that some controlling shareholders (subject to CSRC approval) may repay their loans by applying a debt for equity swap. June 6, 2005 – CSRC Rule 2005-37 This new rule repeats the earlier ruling (CSRC 2003-56), but outlines more specific steps for regulators to follow in the case of non-compliance. For example, local bureaus of the CSRC are assigned a list of controlling shareholders, with whom they much work out a repayment method and timetable. Perhaps more importantly, the rule states that in 2006, CSRC will disclose the names of all controlling shareholders who still owe balances of 100 million or more RMB as of December 31, 2005, as well as the names of the chairperson of the controlling entity. This is the first time the top person in the controlling entity is implicitly held personally liable for these funds. November 1, 2005 – State Council Directive on Behalf of CSRC This ruling was written by the CSRC, but issued by the State Council (an obvious effort to lend it greater authority). Broadly titled “On Improving the Quality of Listed Companies”, this directive acknowledged that the listed companies are in bad shape, and prescribed sweeping changes to corporate governance and disclosure rules (targeting controlling shareholders). In particular, it set December 31, 2006 as a date by which all OREC from controlling entities and affiliates must be repaid. Moreover, it states that the top management of controlling shareholders or colluding firms will be personally punished, if such payments remain outstanding by the end of 2006. November 7, 2006 – Eight Ministry Joint Announcement As the deadline approached, it became apparent that the campaign is not going as well as necessary. Therefore, in an unprecedented move, eight government ministries issued a joint announcement, making it clear that the top management of controlling entities will be fired from their post and face disciplinary punishment if the deadline for repayment is not met. These eight ministries are: the CSRC, Ministry of Public Security [Police], State Asset Management Committee [regulating central government SOEs], State Administration for Industry and Commerce [responsible for registering businesses], China Custom, China Tax Authority, Ministry of Commerce, and the China Bank Regulatory Committee. These ministries represent a broad spectrum of governmental agencies that, collectively, had the power to ensure the top management of controlling shareholders will be arrested if necessary. Epilogue By the deadline on December 31, 2006, 399 listed companies managed to resolve OREC balances totaling 39 billion RMB. Another 17 listed companies, with OREC balances totally 9.2 billion RMB, failed to resolve their loans. In 10 out of these 17 companies, top management of the controlling entity or colluding entities, were arrested – thus bringing to a close an extraordinary chapter in security regulation history.

40
Table I
Descriptive Statistics This table presents firm characteristics for our sample of 7,557 firm-year observations from 1996 to 2004. Our sample includes firms that are listed in China’s stock market for at least one year and have necessary financial information. Chinese firms all have December year-ends and financial information for year t is based on fiscal year-end t-1 financial reports. SIZE is the log of total assets; MV is market capitalizaiton of the stock at the end of the fourth month after the fiscal year end (in million RENMINBI); BM is book-to-market ratio; LEV is leverage, defined as total liabilities divided by total assets; ROA is return on assets; OREC is other receivables (in million RENMINBI); ORECTA is other receivable deflated by total assets; BLOCK is the percentage of shares controlled by the largest shareholder. We have winsorized all variables at 1% and 99%.
Variable N Mean Median Std Dev Q1 Q3
Panel A: Firm Characteristics SIZE 7557 20.966 20.901 0.883 20.363 21.528 MV 7557 3150 2191 3324 1352 3589 BM 7557 0.331 0.276 0.223 0.180 0.421 LEV 7557 0.455 0.455 0.177 0.329 0.581 ROA 7557 0.028 0.034 0.063 0.010 0.058
OREC 7557 123 56 362 21 131 ORECTA 7557 0.081 0.048 0.093 0.017 0.108 BLOCK 7538 0.437 0.426 0.173 0.292 0.582
Panel B: ORECTA by year 1996 287 0.102 0.086 0.079 0.131 0.045 1997 502 0.117 0.093 0.097 0.160 0.046 1998 702 0.111 0.085 0.093 0.157 0.040 1999 804 0.109 0.075 0.108 0.139 0.035 2000 894 0.098 0.059 0.109 0.125 0.025 2001 1007 0.071 0.039 0.087 0.091 0.016 2002 1055 0.065 0.035 0.082 0.081 0.012 2003 1127 0.056 0.029 0.074 0.069 0.010 2004 1179 0.057 0.024 0.082 0.067 0.008

41
Table II Other Receivables as a Predictor of Future Operating Performance and the
Probability of Becoming "Special Treated"
This table examines the economic consequences of large shareholder tunneling. In panel A, we regress FROA, defined as return of assets in year t+1, on ROA of year t, R_ORECTA in year t and other control variables. LEV is total liability divided by total assets, SIZE is log of total assets, NEG is a dummy variable, which takes 1 if current year net income is negative and 0 otherwise. R_ORECTA is a rank variable based on annual ranking of ORECTA into 10 deciles, and is scaled to be between 0 and 1. In panel B, we use a LOGIT model to estimate the effects of ORECTA on the probability of firms becoming “Special Treated” two years later. The dependent variable is a dummy variable, which takes 1 if the firm was specially treated and 0 otherwise. Independent variables include R_ORECTA and other controlling variables for predicting financial distress. ATURN is asset turnover, SG is percentage sales growths from the previous year, OCF is operating cash flow divided by total assets, NONOPERAT is non-operating income deflated by total assets, and BLOCK is the percentage of shares held by the largest shareholder. Because we use variables in year T to predict special treatment status in t+3, our sample size in Panel B reduces to 5,668 observations. Panel A. The Usefulness of ORECTA in Predicting Future ROA
Coefficients T-statistics P-value
INTERCEPT 0.772 6.740 <.0001
ROA 0.301 9.930 <.0001
R_ORECTA -0.049 -8.510 <.0001
LEV 0.020 1.660 0.096
SIZE -0.029 -8.390 <.0001
NEG -0.022 -4.100 <.0001
Fixed Effect Firm and Year
Obs: 7,557
ADJ-R2: 41.41%

42
(Table II Continued)
Panel B: LOGIT model, where the dependent variable is the probability of a firm being in Special Treatment status in Year T+3
Coefficient Chi-Sq P-value Coefficient Chi-Sq P-value
INTERCEPT 2.403 0.004 0.948 0.132 0.000 0.997
R_ORECTA 1.428 26.705 <.0001
ROA -28.787 72.547 <.0001 -26.101 58.431 <.0001
ATURN -1.120 17.798 <.0001 -0.981 13.795 0.000
LEV 1.425 10.337 0.001 1.121 6.173 0.013
SG -0.227 2.712 0.100 -0.213 2.475 0.116
OCF -2.582 7.778 0.005 -1.988 4.500 0.034
NONOPERAT -2.560 0.161 0.688 -3.398 0.292 0.589
SIZE -0.234 7.156 0.008 -0.167 3.520 0.061 BLOCK -1.146 7.769 0.005 -0.838 4.006 0.045
Fixed Effects Industry and Year
Industry and Year
Observations: 5,668
PSEUDO-R2: 4.88% 5.36%

43
Table III The Relation between Other Receivables and Firm Valuation
This table examines whether market prices take into consideration the negative impact of a large ORECTA balance on future operating performance. The dependent variable is MVTA, defined as market value of the firm at the end of fourth month after fiscal year end, deflated by total assets. The independent variables are: BVTA, defined as book value deflated by total assets; ROA, defined as the return on total assets; R_ORECTA, the scaled decile rank of ORECTA (i.e., R_ORECTA=1 for firms in the highest ORECTA decile, and =0 for firms in the lowest decile); and ROA_ORECTA, interaction term computed by multiplying ROA by R_ORECTA. ***, **, and * signify statistical significance at the 1, 5, and10% levels, respectively. All regressions include firm and year fixed effects.
Dependent Variable: MVTA
Model 1 Model 2 Model 3
INTERCEPT 1.600 0.776 0.676
BVTA 2.238 *** 2.295*** 2.301 ***
ROA 4.090 *** 12.395 *** 14.026 ***
R_ORECTA 0.105 0.617 ***
ROA_ORECTA -14.305 *** -16.491 ***
No. of Observations 7,557 7,557 7,557
Adjusted R2 64.92% 66.36 66.63%

44
Table IV The Usefulness of Other Receivables in Returns Prediction
This table examines the usefulness of ORECTA in predicting future returns. Panel A presents future monthly size-adjusted returns (in percentage) for deciles formed on ORECTA. In each year between 1996 and 2004, we sort firms into ten deciles based on ORECTA for year t. Table values represent the average monthly equal-weighted returns for each portfolio, computed from May 1 (year t+1) through April 30 (year t+2). Panel B presents Fama-McBeth cross-sectional regressions of monthly returns on R_ORECTA, R_MV (Market Value), R_BM (Book-to-Market) and R_LEV (total liability divided by total assets). The four independent variables are decile ranks based on annual ranking of ORECTA, MV, BM and LEV, respectively, scaled to be between 0 (lowest decile) and 1 (highest decile). In total there are 108 months. Panel B reports the mean of these monthly coefficients and the t-statistics associated with their time-series variation. Panel A. Returns of Portfolios Based on ORECTA
Group Observations EW-ADJ 1 8978 0.395 2 9039 0.343 3 9065 0.146 4 9051 0.170 5 9016 -0.074 6 9042 0.189 7 9061 -0.096 8 9001 0.008 9 9023 -0.321 10 8825 -0.619
Hedge (1-10) 1.014 T =7.36
Panel B Cross-sectional Regression of Monthly Returns on R_ORECTA and Other Control Variables
Coefficient T-statistics P-value INTERCEPT 0.932 1.191 0.236 R_ORECTA -0.780 -3.221 0.002
R_MV -1.356 -2.404 0.018 R_BM 0.543 1.267 0.208 R_LEV 0.238 1.322 0.189

45
Table V Year-by-year Hedge Returns Adjusted for Different Measures of Risk
This table presents average monthly abnormal returns for a trading strategy that buys an equal-weighted portfolio of firms in the lowest decile of ORECTA and sells an equal-weighted portfolio of firms in the highest decile of ORECTA. Portfolio holdings are rebalanced annually and returns are computed from May 1 (year T+1) through April 30 (year T+2). We present year-by-year results as well as aggregated results for two sub-periods (the bull market of 1996-99, and the bear market of 2000-04). In computing abnormal returns, we use four different benchmarks to adjust for alternative measures of risk. ARET1 is the hedge return where each firm’s abnormal return is computed relative to a reference decile portfolio formed on the basis of its market value of tradable shares (size-adjusted); ARET2 is abnormal returns relative to portfolios formed on deciles of firm beta (beta-adjusted); ARET3 is relative to an equal-weighted market index (EW-index); ARET4 is relative to a value-weighted market index for tradable shares of both the Shanghai and Shenzhen markets (VW-index). Reported t-statistics are based on the time-series variation in annual abnormal returns.
ARET1 ARET2 ARET3 ARET41996 0.406 -0.171 -0.049 -0.049 1997 0.011 -0.271 -0.237 -0.237 1998 0.633 0.444 0.546 0.546 1999 0.091 -0.206 -0.234 -0.236 2000 0.873 0.615 0.624 0.629 2001 1.044 1.341 1.516 1.505 2002 1.226 1.419 1.833 1.924 2003 2.505 2.444 2.528 2.520 2004 0.065 0.514 0.654 0.608
Average 0.685 0.613 0.718 0.721
T-test 2.454 1.909 2.091 2.076
96-99
Bull Market 0.285 -0.051 0.006 0.006 00-04
Bear Market 1.143 1.267 1.431 1.437

46
Table VI The Determinants of ORECTA
In this table we examine the determinants of ORECTA. The dependent variable is ORECTA. The independent variables are: BLOCK, defined as percentage of shares held by the largest shareholder; SIZE, the log of total assets; STATE, a dummy variable which takes value one if the largest shareholder is any level of government or any government-owned institution; MARKETIZATION, a comprehensive index measuring the development of the regional market in which the firm is registered (see Fan and Wang (2004)), where higher values indicate greater regional market development; LAYER, the number of intermediate layers between the company and its controlling owner through the longest pyramidal chain, defined following Fan, Wong and Zhang (2007). ***, **, and * signify statistical significance at the 1, 5, and10% levels, respectively. All regressions include industry and year fixed effects.
Model 1 Model 2 Model 3 Model 4
INTERCEPT 0.440*** 0.479*** 0.485*** 0.482***
BLOCK -0.075*** -0.068*** -0.067*** -0.069***
SIZE -0.017*** -0.019*** -0.014*** -0.013***
STATE -0.013*** -0.019*** -0.018***
MARKETIZATION -0.001* -0.002**
LAYER 0.001
No. of Observations 7,479 6,094 5,960 5,874
Adjusted R2 12.90% 12.87% 13.06% 13.14%
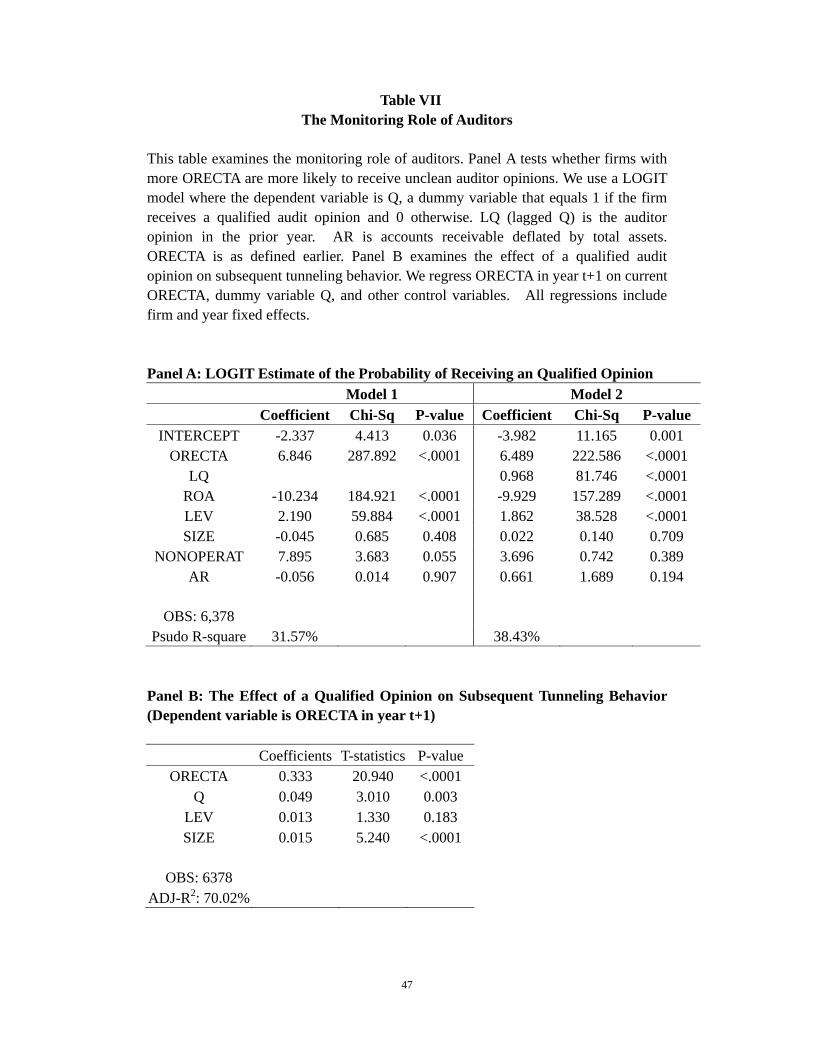
47
Table VII The Monitoring Role of Auditors
This table examines the monitoring role of auditors. Panel A tests whether firms with more ORECTA are more likely to receive unclean auditor opinions. We use a LOGIT model where the dependent variable is Q, a dummy variable that equals 1 if the firm receives a qualified audit opinion and 0 otherwise. LQ (lagged Q) is the auditor opinion in the prior year. AR is accounts receivable deflated by total assets. ORECTA is as defined earlier. Panel B examines the effect of a qualified audit opinion on subsequent tunneling behavior. We regress ORECTA in year t+1 on current ORECTA, dummy variable Q, and other control variables. All regressions include firm and year fixed effects. Panel A: LOGIT Estimate of the Probability of Receiving an Qualified Opinion
Model 1 Model 2 Coefficient Chi-Sq P-value Coefficient Chi-Sq P-value
INTERCEPT -2.337 4.413 0.036 -3.982 11.165 0.001 ORECTA 6.846 287.892 <.0001 6.489 222.586 <.0001
LQ 0.968 81.746 <.0001 ROA -10.234 184.921 <.0001 -9.929 157.289 <.0001 LEV 2.190 59.884 <.0001 1.862 38.528 <.0001 SIZE -0.045 0.685 0.408 0.022 0.140 0.709
NONOPERAT 7.895 3.683 0.055 3.696 0.742 0.389 AR -0.056 0.014 0.907 0.661 1.689 0.194
OBS: 6,378
Psudo R-square 31.57% 38.43% Panel B: The Effect of a Qualified Opinion on Subsequent Tunneling Behavior (Dependent variable is ORECTA in year t+1)
Coefficients T-statistics P-value ORECTA 0.333 20.940 <.0001
Q 0.049 3.010 0.003 LEV 0.013 1.330 0.183 SIZE 0.015 5.240 <.0001
OBS: 6378
ADJ-R2: 70.02%
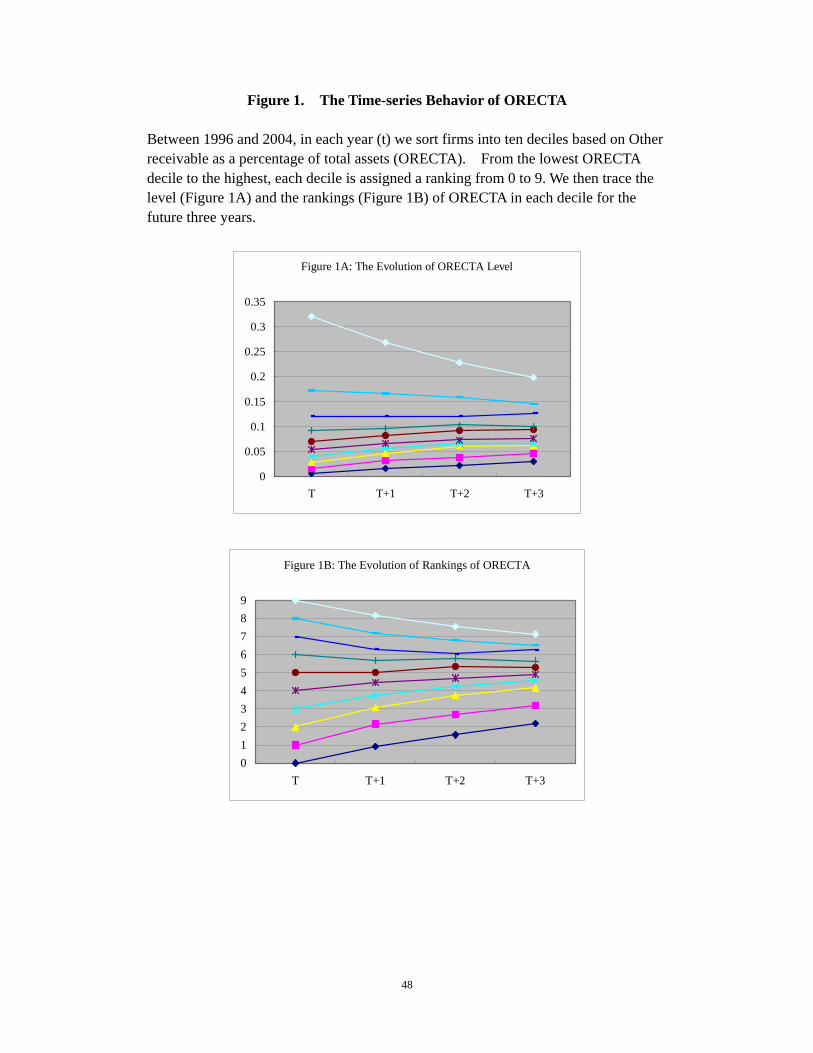
48
Figure 1. The Time-series Behavior of ORECTA
Between 1996 and 2004, in each year (t) we sort firms into ten deciles based on Other receivable as a percentage of total assets (ORECTA). From the lowest ORECTA decile to the highest, each decile is assigned a ranking from 0 to 9. We then trace the level (Figure 1A) and the rankings (Figure 1B) of ORECTA in each decile for the future three years.
Figure 1A: The Evolution of ORECTA Level
0
0.05
0.1
0.15
0.2
0.25
0.3
0.35
T T+1 T+2 T+3
Figure 1B: The Evolution of Rankings of ORECTA
0123456789
T T+1 T+2 T+3

49
Figure 2. The Proportion of Firms in each ORECTA Decile that attains ST (Special Treatment) status in two years
Chinese listed firms that have had two consecutive annual losses (or whose book value becomes negative) receive “Special treatment" or "ST” status. ST stocks are under various trading and financial restrictions, and if an ST stock reports one more loss year, it will be delisted. Because Chinese firms rarely go bankrupt, ST can be regarded as an equivalent financial distress metric. Between 1996 and 2004, we sort firms annually into ten deciles based on the magnitude of their reported ORECTA (other receivables as a percentage of total assets). This figure depicts the proportion of firms in each decile that received ST status two years after the formation of the deciles. That is, we form the portfolios in year t, and observe whether this firm is specially treated in year t+3.
% of ST firms in Ten ORECTA Deciles
0.000.020.040.060.080.100.120.140.16
1 2 3 4 5 6 7 8 9 10

50
Figure 3. The Relation between BLOCK and ORECTA This graph examines the relation between ownership structure and the extent of tunneling using ORECTA. Prior literature suggests that the incentives for tunneling will be most acute when a blockholder’s cashflow ownership (C) is much lower than her controlling ownership (O). To test this hypothesis, we sort firms annually into 10 deciles based on BLOCK, the percentage of common shares held by the biggest shareholder (a proxy for C). We then compute the median ORECTA in each decile (the line graph), as well as the average BLOCK value (the bar graph). The X-axis is decile rankings based on BLOCK. Numerical values for BLOCK are reported in the left side of the graph; numerical values for ORECTA are reported on the right.
The Relation between BLOCK and ORECTA
0.0
0.1
0.2
0.3
0.4
0.5
0.6
0.7
0.8
1 2 3 4 5 6 7 8 9 10
0.00
0.01
0.02
0.03
0.04
0.05
0.06
0.07
0.08
0.09
BLOCK ORECTA

51
Figure 4: The Relation between ORECTA and the Probability of Firms Receiving an Unclean Auditor Opinion Each year, firms are sorted into ten deciles based on ORECTA. We then calculate the percentage of firms within each group that received a qualified opinion in the accompanying audit report.
The Probability of Firms Receiving an Unclean Auditor Opinionfor ORECTA Deciles
0.000.050.100.150.200.250.300.350.400.450.50
1 2 3 4 5 6 7 8 9 10