Tunnel Vision - International Council of Ophthalmology · Tunnel Vision The Economic Impact of...
108
Tunnel Vision The Economic Impact of Primary Open Angle Glaucoma - A Dynamic Economic Model Centre for Eye Research Australia
Transcript of Tunnel Vision - International Council of Ophthalmology · Tunnel Vision The Economic Impact of...
Tu n n e l V i s i o n The Economic Impact of
Primary Open Angle Glaucoma -
A Dynamic Economic Model
Centre for Eye Research Australia Centre for Eye Research Australia
Tu
nn
el V
isio
n The Eco
nom
ic Impact o
f Primary O
pen Angle G
laucom
a - A D
ynamic Eco
nom
ic Mo
del
This report was prepared jointly by the Centre for Eye Research Australia and Access Economics Pty Limited.
We acknowledge particularly the expert input and prior research of
Professor Hugh Taylor AC Centre for Eye Research Australia and University of Melbourne
Professor Jonathan Crowston Centre for Eye Research Australia and University of Melbourne
Associate Professor Jill Keeffe OAM Centre for Eye Research Australia and University of Melbourne
Ms Lynne Pezzullo Access Economics Pty Ltd
Ms Penny Taylor Access Economics Pty Ltd
Mr Peter Moore Access Economics Pty Ltd
Acknowledgments and Disclaimer
While every effort has been made to ensure the accuracy of this document, the uncertain nature of economic data, forecasting and analysis means that Access Economics Pty Limited is unable to make any warranties in relation to the information contained herein. Access Economics Pty Limited, its employees and agents disclaim liability for any loss or damage which may arise as a consequence of any person relying on the information contained in this document.
Publication of this work has been made possible by an unrestricted grant from Allergan who had no part in the direction or findings contained in this report.
Centre for Eye Research Australia, University of Melbourne, Australia, February 2008.
Centre for Eye Research Australia Tu n n e l V i s i o n
Weih L, Van Newkirk M, McCarty C, Taylor H (1998) “Patterns of glaucoma medication use in urban and rural Victoria” Australian and New Zealand Journal of Ophthalmology, 26[Suppl]: S12 S15.
Weinand F, Althen F (2006) “Long term clinical results of SLT in the treatment of POAG” Eur J Ophthalmology, 16: 100-4.
Weinreb RN, Khaw PT (2004) “Primary open-angle glaucoma” The Lancet, 363: 1711-20.
Weinreb RN, Friedman DS, Fechtner RD, Cioffi GA, Coleman AL, Girkin CA, Liebmann JM, Singh K, Wilson MR, Wilson R, Kannel WB (2004) “Perspective: Risk Assessment in the Management of Patients with Ocular Hypertension” American Journal of Ophthalmology, 138[3]: 458-67.
Wensor M, McCarty C, Stanislavsky Y, Livingston P, Taylor H (1998) “The prevalence of glaucoma in the Melbourne Visual Impairment Project” Ophthalmology, 105: 733-9.
Wilson MR, Coleman AL, Fei Yu, Sasaki IF, Kim MH (2002) “Depression in patients with glaucoma as measured by self-reported surveys” Ophthalmology, 105[5]: 1018-22.
Wolfs RC, Klauver CC, Ramrattan RS, van Duijin CM, Hofman A, de Jong PT (1998) “Genetic risk of primary open-angle glaucoma. Population based familial aggregation study” Arch Ophthal, 116: 1640-45.
Zahari M, Mukesh B, Rait J, Taylor H, McCarty C (2006) “Progression of visual field loss in open angle glaucoma in the Melbourne Visual Impairment Project” Clinical and Experimental Ophthalmology, 34: 20–6.
Zeiter JH, Shin DH (1994) “Diabetes in primary open-angle glaucoma patients with inferior visual field defects” Graefes Archive for Clinical & Experimental Ophthalmology, 232[4]: 205-10.
Zghal I, Jeddi A, Hadj Alouane WB, Malouche N, Ayed S, Gaigi S (2000) “Primary open-angle glaucoma and diabetes [French]” Tunisie Medicale, 78[8-9]: 518-21.
Zwerling C, Sprince NL, Davis CS, Whitten PS, Wallace RR, Herringa SG (1998) “Occupational injuries among older workers with disabilities: a prospective cohort study of the Health and Retirement Survey, 1992 to 1994” American Journal of Public Health, 88: 1691-16.
11. References
The Economic Impact of Primary Open Angle Glaucoma - A Dynamic Economic Model 105
1The Economic Impact of Primary Open Angle Glaucoma - A Dynamic Economic Model
Main heading to go here
EXECUTIVE SUMMARY 7
1. Background 10
2. Primary Open Angle Glaucoma 11
3. Risk Factors 13
3.1 Intraocular pressure 133.2 Age 153.3 Cup-to-disc ratio 163.4 Central corneal thickness 163.5 Family history and genetics 173.6 Ethnicity 173.7 Diabetes mellitus 183.8 Other potential risk factors 19
4. Epidemiology 20
4.1 Definition of disease stage 204.2 Remission 204.3 Mortality 204.4 Population 214.5 Progression 214.6 Prevalence and incidence 294.7 Disease stages defined 33
5. Treatment 34
5.1 Medication 345.2 Laser treatment 395.3 Conventional surgery (trabeculectomy) 415.4 Prevalence estimates for each treatment group 435.5 Treatment efficacy 445.6 Side effects 50
6. Disease Costs 55
6.1 Discount rates 556.2 The cost to quality of life and wellbeing 566.3 Health system costs 606.4 Indirect costs 686.5 Deadweight losses 69
7. Summary of Model Parameters 70
8. The Model 73
9. Intervention Scenarios 76
9.1 The base case 769.2 Improved diagnosis rate 809.3 Change in the treatment protocol (Primary laser) 839.4 Research and development 879.5 Combinations 89
Contents

Tu n n e l V i s i o nCentre for Eye Research Australia
10. Appendix 1: Meta-Analysis - Falls and Hip Fractures 92
10.1 Fixed-effects versus random-effects 92
10.2 Heterogeneity 92
10.3 Forest plots 93
10.4 Publication bias 96
10.5 Additional supportive literature 97
11. References 98
FiguresFigure 1.1: Peripheral visual field loss in POAG 10
Figure 2.1: The glaucoma continuum 11
Figure 2.2: Healthy optic nerve 12
Figure 2.3 Glaucomorous optic nerve 12
Figure 3.1: Goldmen tonometery 14
Figure 3.2: Demographic distribution of glaucoma, Australians over 40 15
Figure 3.3: Cup-To-Disk ratio 16
Figure 3.4: Corneal thickness 17
Figure 3.5: Pseudoexfoliation pupil margin 19
Figure 4.1: Schematic of the level of impairment for definite glaucoma 29
Figure 4.2: Original prevalence rates 30
Figure 4.3: Smoothed prevalence rates (moving average across three age groups) 31
Figure 5.1: Glaucoma medication dispensed by year and type of script(% of total scripts) 35
Figure 5.2: MBS Trabeculoplasty Procedures, 1994-2005 40
Figure 5.3: Trabeculectomy 41
Figure 5.4: MBS Total of Trabeculectomy Procedures, 1994-2005 42
Figure 8.1: Main Menu 73
Figure 8.2: Options Sheet 74
Figure 8.3: Model Design 75
Figure 9.1: Prevalence OHT and POAG, base case 77
Figure 9.2: Value burden of disease due to POAG ($m), base case 78
Figure 9.3: Impact of increased diagnosis rates on DALYs(a) 82
Figure 9.4: Impacts of increased diagnosis rates on treatment costs 82
Figure 9.5: Cost Effectiveness Plane - Increase Diagnosis Rate(a) 83
Figure 9.6: Cost-savings resulting from a protocol change(a) 85
Figure 9.7: Burden of Disease 85
Figure 9.8: Decline in DALYs from new efficacious treatment 88
Contents
2
The Economic Impact of Primary Open Angle Glaucoma - A Dynamic Economic Model
Main heading to go here
3
Figure 9.9: Treatment costs with new treatment costing $1000 per person per year 88
Figure 9.10: Reduction in DALYs, combined interventions 90
Figure 9.11: Treatment costs, combined interventions 91
Figure 9.12: Total costs, combined scenarios 91
Figure 9.13: Cost effectiveness plane, Combined Scenarios(a) 91
Figure 10.1: Annotated Forest Plot (Random Effects Model) for Visual 94Impairment and Falls
Figure 10.2: Annotated Forest Plot (Random Effects Model) Glaucome/VFL and Falls 95
Figure 10.3: Annotated Forest Plot (Random Effects Model) for Visual Impairmentand Hip Fractures 95
TablesTable 1.1: Disease stage 7
Table 3.1: Significant risk factors for OHT progression to glaucoma,identified by the OHTS 14
Table 3.2: Hazard ratios for development of POAG from OHT 14
Table 3.3: Risk factors for glaucoma progression, identified by the earlymanifest glaucoma trial 15
Table 3.4: Association Between Diabetes Mellitus and Glaucoma 19
Table 4.1: Relative risk of mortality by stage of Visual Impairment 21
Table 4.2: Natural progression rates (cumulative probability) 15 year period 25
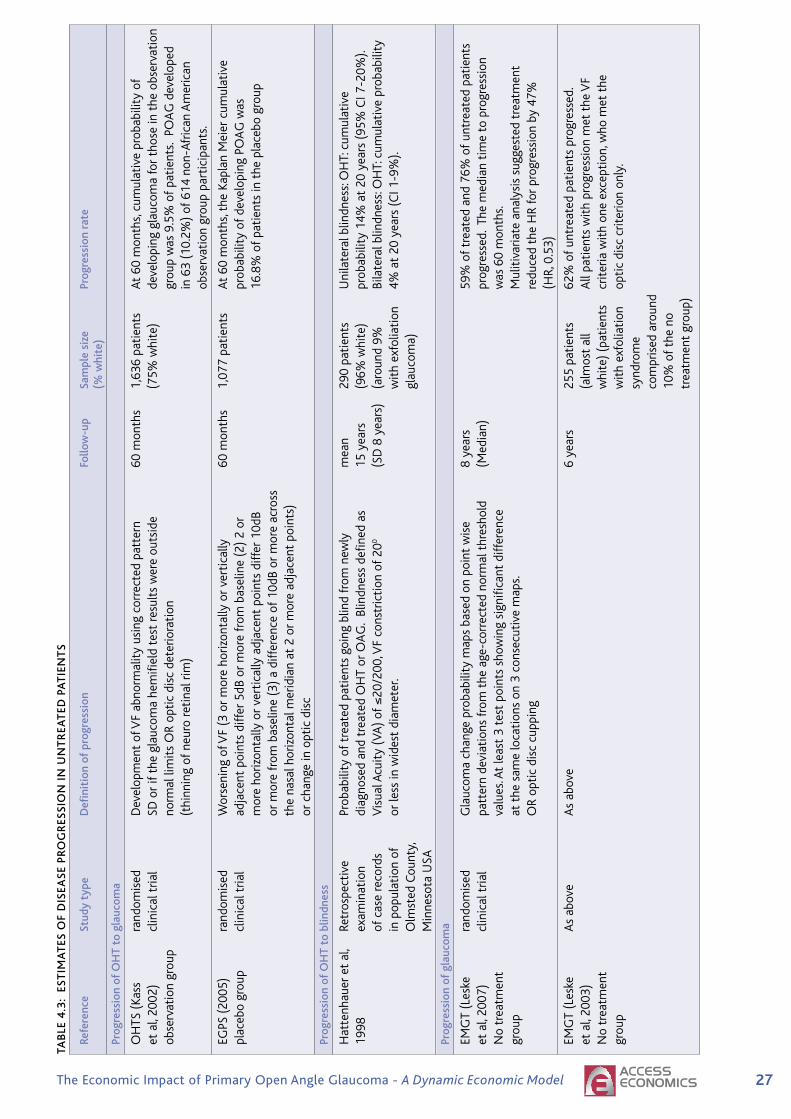
Table 4.3: Estimates of disease progression in untreated patients 27
Table 4.4: Definitions of level of impairment for definite glaucoma 29
Table 4.5: OHT and Glaucoma prevalence rates 30
Table 4.6: Incidence and prevalence of ocular hypertension (% of age group) 32
Table 4.7: Proportion of people with glaucoma by age and severity (%),smoothed (moving average across three age groups) 32
Table 4.8: Disease Stage 33
Table 5.1: IOP lowering medications 35
Table 5.2: Proportion of each drug class by state, 2005 36
Table 5.3: Number of medications taken in combination 37
Table 5.4: Trabeculectomy - MBS services processed by jurisdiction by year 42
Table 5.5: Incidence and treatment failure rate for each stage of treatmentfrom dismod II 44
Table 5.6: Progression rates (cumulative probability) in treated patients (15 year period) 46
Table 5.7: Studies of the efficacy of laser treatment 47
Table 5.8: Success rates for trabeculectomy 49
Table 5.9: Medication side effects 50
Table 5.10: Risk of COPD (% of Population), 2001 51
Table 5.11: Health System Cost of COPD ($ per Person), 2005 52
Contents

4 Tu n n e l V i s i o nCentre for Eye Research Australia
Table 5.12: Trabeculectomy Side-Effects 53
Table 5.13: Prevalence of Cataract (% of Population) 54
Table 5.14: Health System Cost of Cataract ($ per Person), 2005 54
Table 6.1: AIHW Disability Weightings 59
Table 6.2: Health Costs by Who Bears the Cost, 2004-05 60
Table 6.3: Cost of Medication per Person per Annum 61
Table 6.4: Total Cost of Trabeculoplasty Per Treatment 61
Table 6.5: Total Cost of Trabeculectomy Per Treatment 62
Table 6.6: Probability of Residing in an Aged Care facility, 2004-05 63
Table 6.7: Increased Risk of Falls From Visual impairment 64
Table 6.8: Meta-Analysis, Falls (Random Effects Model) 64
Table 6.9: Relative Risk of an accidental fall by Severity 65
Table 6.10: Risk of Accidental Fall (% of Population), 2001 65
Table 6.11: Health System Cost of an Accidental Fall ($ per Person), 2005 66
Table 6.12: Depression and Vision Loss 67
Table 6.13: Risk of Depression (% of Population), 2001 67
Table 6.14: Health System Cost of Depression ($ per Person), 2005 68
Table 6.15: Indirect Costs ($ per annum), 2005 69
Table 7.1 Prevalence of OHT and POAG 70
Table 7.2 Severity of visual impairment — initial proportional split 71
Table 7.3: Modelled treatment assumptions 71
Table 7.4: Modelled treatment costs $ 2005 (including side-effects and adverse events) 72
Table 7.5: Other modelled variables 72
Table 9.1: Prevalence of OHT and POAG, base case (number of people) 77
Table 9.2: Costs of POAG, 2005 and 2025, base case 78
Table 9.3 Base case (standard treatment) net present value of DALYs and costs 78
Table 9.4 Comparison of prevalence of OHT and POAG with original andsmoothed data 79
Table 9.5 Net present value of DALYs and costs, sensitivity analysis on OHTPrevalence and incidence for those aged 80+ years 79
Table 9.6: Model Results – Increased Diagnosis Rate, Net present value 2005 to 2025 81
Table 9.7: Model Results – Protocol Change – Trabeculoplasty as primary treatment 84
Table 9.8: Sensitivity Analysis - A conservative approach to surgery failure rates 86
Table 9.9: Model Results – Research and Development - showing the impact ofnew treatment to reduce progression by 50% and 75% 89
Table 9.10: Model Results - Combined Scenarios 90
Table 10.1: Fixed Effects and Random Effects, Meta-Analysis Results 92
Table 10.2: Heterogeneity within the Combined Studies 93
Table 10.3: Measures of Publication Bias 96
Table 10.4: Non-quantitative supporting literature 97
Contents

5The Economic Impact of Primary Open Angle Glaucoma - A Dynamic Economic Model
Main heading to go here
ABS Australian Bureau of Statistics
AGIS Advanced Glaucoma Intervention Study
AIHW Australian Institute of Health and Welfare
ALT Argon Laser Trabeculoplasty
AMD Age related macular degeneration
AWE Average Weekly Earning
BMES Blue Mountains Eye Study
CERA Centre for Eye Research Australia
CI Confidence interval
EDS Early Disease Stage
CIGTS Collaborative Initial Glaucoma Treatment Study
CNTGS Collaborative Normal Tension Glaucoma Study
COPD Chronic Obstructive Pulmonary Disease
DALYs Disability adjusted life years
DRG Diagnosis Related Group
EGPS European Glaucoma Prevention Study
EMGT Early Manifest Glaucoma Trial
GLT, GLTFU Glaucoma Laser Trial, Glaucoma Laser Trial Follow Up
HAP Hodapp-Anderson-Parrish grading system for disease stage
IOP Intraocular pressure
mm Hg Millimetres of mercury, Measure of intraocular pressure.
MBS Medicare Benefits Schedule
MMC Mitomycin C - an anti fibrotic drug which inhibits scarring.
MVIP Melbourne Visual Impairment Project
OHT Ocular hypertension
OHTS Ocular Hypertension Treatment Study
OR Odds ratio
POAG Primary Open Angle Glaucoma
PR Prevalence Ratio
Pseudoexfoliation Pseudoexfoliation syndrome is a systemic condition characterised byglaucoma/ the production and progressive accumulation of pseudoexfoliative pseudoexfoliation material in many ocular tissues. Glaucoma occurs more commonly insyndrome eyes with this syndrome than in those without it. Exfoliative glaucoma
has a more rapid clinical course and worse prognosis than primaryopen-angle glaucoma.
RR Relative risk
SD Standard deviation
SLT Selective Laser Trabeculoplasty
VA Visual acuity
VF Visual field - the ability to detect objects to either side, or above or below, the direction of vision. It is measured in terms of degrees fromthe point of fixation, for example, <10 degree field means that the person can only see in a visual field of less than 10 degrees radius fromthe point of fixation (CERA 2004).
VFL Visual field loss
Glossary and Acronyms

6 Tu n n e l V i s i o nCentre for Eye Research Australia

7The Economic Impact of Primary Open Angle Glaucoma - A Dynamic Economic Model
Main heading to go here
Access Economics was commissioned by the Centre for Eye Research Australia (CERA) toconstruct a dynamic model of primary open angle glaucoma (POAG) in Australia, to informpolicy development in relation to this serious source of visual impairment and blindness.
The model is based on data from a wide variety of sources, and an intensive literature reviewinformed the estimation of parameters, such as risk factors for POAG, natural progression of thedisease, treatment efficacy, quality of life, and comorbid conditions (falls and depression).
• Intraocular pressure (IOP) was identified as the only modifiable risk factor for thedevelopment and progression of POAG. Current medical and surgical treatments are centredon reducing IOP and maintaining it at lower levels.
• Age, cup-to-disc ratio and central corneal thickness are non-modifiable risk factorsfor glaucoma.
• Studies of links between POAG and diabetes mellitus have shown mixed results, so diabeteswas not incorporated in the modelling. As future studies are completed this association willbecome better understood.
• Studies of family history suggest it is an apparent non-modifiable risk factor, but support foran association is not strong possibly because of ascertainment bias.
The incidence, prevalence and mortality associated with POAG and the incidence and prevalenceof ocular hypertension (OHT) were based on data from the Melbourne Visual ImpairmentProject (MVIP) and the Blue Mountains Eye Study (BMES) and use of the DISMOD II model,and based on severity of visual impairment (with severity splits based on MVIP and BMESdata). Disease stages are defined in Table 1.1. Demographic groups within the population areprojected on the basis of Access Economics Dynamic model population by gender and year ofage projections to 2025.
TABLE 1.1: DISEASE STAGE
Disease stage Description Visual Visual field acuity loss (VFL)
No POAG No visual impairment (OHT or normal tension)
Early Disease Stage Definite or Probable Better And No VFL (EDS) Glaucoma. No visual than 6/12 impairment but changes to optic nerve and/or retinal nerve fibre layer
Mild Definite Glaucoma with mild <6/12 Or Any loss of visual impairment visual field (VF)
Moderate Definite Glaucoma with <6/18 Or <20o field moderate visual impairment
Severe Definite Glaucoma with severe <6/60 Or <10o field or profound visual impairment
Executive Summary
Australian health care cost of glaucoma in 2005 was $342 million.
The total annual cost of glaucoma in 2005 was $1.9 billion.
The total cost is expected to increase to $4.3 billion by 2025.

8 Tu n n e l V i s i o nCentre for Eye Research Australia
In studies of glaucoma, disease progression is not always measured in terms of vision loss. Clinical studies often use a combination of changes in VF, IOP and optic disc as indicators ofprogression. Further, definitions of vision loss vary across researchers, and different researchershave developed different grading systems to measure progression. The application of progressionrates from the literature therefore proved too problematic. Initially, the approach was to applythe progression rates from the Weinreb et al, (2004) synthesis in the modelling. Unfortunately,it was not possible to match the Weinreb et al, (2004) rates with the available incidence andprevalence data from the MVIP and BMES to obtain sensible projections. To overcome theseproblems natural progression rates were derived from prevalence data from the MVIP and BMESto achieve sensible projections and mindful of the approach used to synthesise progressionrates in Weinreb et al, (2004). This led to annual progression rates that are for the most partsubstantially higher than expected so more research and population data — particularly bystage of visual impairment for POAG — are clearly required.
The progression rates for people with treated glaucoma are half of those for untreatedglaucoma, in line with the literature on treatment efficacy (key clinical trials such as the EarlyManifest Glaucoma Trial EMGT and the Ocular Hypertension Treatment Study (OHTS)) and themethodology from Weinreb et al, (2004). (For treatment efficacy, Weinreb et al, (2004) usedthe results from the OHTS and the EMGT as the only trials which compared treatment with notreatment.)
Treatment failure rates are around 4% of patients per annum failing medication (consistentwith Australian data on rates of trabeculoplasty), 50% of patients per annum failing lasertherapy (consistent with the literature on the efficacy of laser treatment) and 50% of patientsper annum failing surgery (a conservative estimate which is higher than the literature butsensitivity analysis provided in the report shows it makes little difference to the results).Remission was modelled as nil, with relative risks for mortality depending on vision loss(1.67 for mild POAG, 2.34 for moderate POAG and 3.01 for severe POAG decreasing in linewith older age).
The costs of POAG include:
• health system costs — derived from data from the Australian Institute for Health and Welfare, Medicare fees and the Department of Health and Ageing National HospitalCosts Data Collection. Health cost data are also included in the model in relation to thecosts of falls and depression that are associated with vision loss from POAG.
• Indirect costs — including productivity losses (lower than average employment rates ofpeople with visual impairment). Productivity losses are low since POAG generally affectsolder people. Carer costs and the costs of aids and equipment and deadweight losses basedon CERA’s research and previous Access Economics calculations are also included.
• Loss of wellbeing (measured as the burden of disease — Disability Adjusted LifeYears (DALYs).
The model itself is constructed on a user-friendly Excel platform to enable ease of policysimulations. Three scenarios were analysed in relation to the base case. The results reportedhere are calculated for smoothed prevalence rates and reflect the net present value of costs andbenefits over the period 2005 to 2025.
A dynamic model of POAG was developed
to inform policy development on an
ongoing basis.
Executive Summary
The savings from a new treatment will
depend on the annual treatment cost.
Initial laser trabeculoplasty gives significant
cost savings.
Increasing the rate of diagnosis to 80% would cost $80,189
per DALY.
Centre for Eye Research Australia

9The Economic Impact of Primary Open Angle Glaucoma - A Dynamic Economic Model
• The first scenario reflects an improvement in diagnostic methods. More than 50% ofindividuals with glaucoma in the developed world are unaware they have the disease(Quigley, 1996). In a population based study (the MVIP), Wensor et al, (1998) found that50% of those with definite POAG had not been diagnosed previously, and Wong et al, (2004)examined MVIP data and found that 59% of definite cases of OAG were undiagnosed inpeople who had visited an eye care provider in the previous year. Even at zero additionalcosts (ie. no additional costs of educating clinicians) and improved diagnosis rates of 70%,80% and 90%, the modelling suggests that these scenarios are cost effective but relativelyexpensive, at between $153,000 to $167,000 per DALY avoided. Improved diagnosis ratesare associated with a rise in health system costs as more people are treated. However, theburden of disease (DALYs) falls.
• The second scenario is a change in the treatment protocol, with laser replacing medicationas first line therapy. The Glaucoma Laser Trial (GLT) showed that Argon Laser Therapy wasas efficacious as timolol (prostaglandins and Selective Laser Therapy were not in use atthat time). However, Argon Laser Trabeculoplasty (ALT) was not commonly adopted as aprimary treatment because of concern about side effects and the reduced efficacy of repeatALT treatments. More recent evidence for the effectiveness of laser treatments as a primarytherapy include the EMGT, Nagar et al, (2005), and McIlraith et al, (2006). The modellingshows that changing the treatment protocol (based on the assumption that current lasertreatments are as efficacious as medication) is cost saving, reflecting the assumption thatprimary laser would be provided alone whereas as a second line treatment (as per currentapproaches), laser and medication are provided together. Even tripling the cost of lasertrabeculoplasty or increasing it five fold (from $724 to $3,622) to account for the possibilityof side effects (and assuming these don’t affect quality of life), a change in the treatmentprotocol remains cost saving.
• The final scenario modelled a new potential therapy to delay progression (for exampleavailability of a neuroprotectant drug that protects by means other than IOP lowering ).The model allows for a new therapy that reduces the progression of glaucoma by a further50% or 75% over and above the reduction in progression from current treatments tobe analysed. Cost effectiveness depends on the cost per person per annum of the newtreatment. At treatment costs of $1,000 per person per annum, new treatments arecost saving. New treatments remain cost effective and relatively cheap at $5,000 perdiagnosed patient per annum ($44,700/DALY avoided if progression is delayed by 50% overthe base case and $23,400/DALY avoided if progression is delayed by 75% over the basecase). At $10,000 per diagnosed patient per annum, new treatments are still cost effectivebut become relatively expensive ($114,400/DALY avoided and $71,914/DALY avoidedrespectively).
The POAG dynamic model enables rapid comparison of the cost-effectiveness of various interventions for the disease and is a valuable tool for ongoing policy formulation and best practice treatment to address visual impairment and blindness from POAG.
1 Memantine is used for Alzheimers disease and in phase III trials for glaucoma at the time of writing.
Executive Summary

10 Tu n n e l V i s i o nCentre for Eye Research Australia
Access Economics Pty Limited was commissioned by the Centre for Eye ResearchAustralia (CERA) to:
1. Construct a dynamic model of primary open angle glaucoma (POAG) in Australia,that encompassed prevalence, incidence, risk factors, health and indirect financial costs,treatment options and measures of wellbeing; and
2. Document the model and report on the impacts over the period 2005-2025 of:
< better detection of POAG;
< a change in treatment protocol; and
< a potential new therapy to delay disease progression.
A similar model was previously developed to examine the impact of a number of newtreatments modes on age-related macular degeneration: a quit smoking program; new researchthat delays progression; and a new therapy that enhances treatment efficacy (CERA 2006).The model has the capacity to be adapted to incorporate other sources of visual impairmentin the future, such as diabetic retinopathy, cataract, and refractive error.
This project follows on from earlier reports2:
• Clear Insight: The Economic Impact and Cost of Vision Loss in Australia (CERA 2004);
• Investing in Sight: Strategic Interventions to Prevent Vision Loss in Australia(CERA 2005); and
• Centrally Focused: The Impact of Age-related Macular Degeneration, A Dynamic Economic Model (CERA 2006).
Due to the technical nature of the modelling, this report assumes familiarity with theterminology used in these previous reports.
This report is structured as follows:
• Description of POAG;
• Epidemiology of the disease (including remission, mortality, progression of the disease whenuntreated and incidence and prevalence);
• Treatment of the disease (including a description of the conventional treatment steps, theirside effects and efficacy);
• The costs of the disease (including its impact on quality of life, the health system costs,productivity costs and other indirect costs);
• Description of the Model, its structure and user interface; and
• Discussion of the scenarios that the model can be used to analyse.
1. Background
Glaucoma causes characteristic loss of peripheral vision and optic nerve changes.
2 Available online at www.cera.org.au.
Figure 1.1: Peripheral visual field loss in POAG.

Main heading to go here
11The Economic Impact of Primary Open Angle Glaucoma - A Dynamic Economic Model
2. Primary Open Angle Glaucoma
Moderate glaucoma is characterised by loss of peripheral vision and sparing of central vision.
Glaucoma is a progressive, neurodegenerative disease that causes accelerated loss of optic nerve neurons. Initial changes to the optic nerve and retina are asymptomatic and oftenundetectable with current diagnostics (Weinreb et al, 2004). Glaucoma can be described as acontinuum (Figure 2.1) where undetectable disease progresses to asymptomatic disease withoptic nerve and visual field (VF) change, and finally to symptomatic visual impairment andblindness.
FIGURE 2.1: THE GLAUCOMA CONTINUUM
Source: reproduced from Weinreb et al, (2004).
Box 1: Vision loss from POAG
Central vision is the detailed vision people use to read and recognize faces, whileperipheral vision is the side vision that is used for navigating obstacles in the environment(like doorways and coffee tables) and for detecting oncoming vehicles from a side street.The diagnosis of glaucoma is often made late in the disease course, because early stages ofglaucoma are usually asymptomatic. Moderate glaucoma is characterised by loss ofperipheral vision and sparing of central vision. Patients often fail to notice peripheral visionloss until it has progressed towards the centre of vision.
Source: Reproduced from Kwon et al (2007), A patient’s guide to glaucoma, http://www.medrounds.org/glaucoma-guide/2006/02/table-of-contents-patients-guide-to.html, accessed 4 May 2007
In advanced glaucoma central vision may be lost.
1 in 10 Australians over 80 will develop glaucoma.

12 Tu n n e l V i s i o nCentre for Eye Research Australia
There are several different types of glaucoma: primary open angle, angle closure, congenitaland secondary glaucoma. Primary open angle glaucoma (POAG) is the most common worldwideand the topic of this report (Box 2). POAG is characterised by3:
• open anterior-chamber angles;• loss of neuroretinal rim and nerve fibre layer defects;• VF abnormality;• adult onset; and• absence of other known mechanisms.
While many POAG patients present with elevated intraocular pressure (IOP), a significantnumber of patients with POAG do not have detectable IOP elevation. Elevated IOP is a riskfactor for glaucoma and not necessarily an integral part of the disease.
Box 2: Primary Open Angle Glaucoma
Glaucoma is a degenerative disease of the optic nerve that can lead to vision loss andblindness. The optic nerve comprises over a million nerve fibres (axons) that connect theretina with the brain. In the front of the eye is a space called the anterior chamber -clear fluid (aqueous humour) flows in to this space and leaves the chamber at the anglewhere the cornea and iris meet. When the aqueous humour reaches the angle, it flowsthrough a meshwork and leaves the eye. Increased IOP occurs when there is increasedresistance to outflow.
Elevated intraocular pressure is a risk
factor for glaucoma although not
necessarily an integral part of the
disease.
2. Primary Open Angle Glaucoma
3 American Academy of Ophthalmology (2005).
Figure 2.2: Healthy optic nerve Figure 2.3: Glaucomorous optic nerve
Centre for Eye Research Australia

13The Economic Impact of Primary Open Angle Glaucoma - A Dynamic Economic Model
Not all cases of glaucoma have an endpoint of unilateral or bilateral blindness. There isconsiderable variation in the risk of progression across patients (Weinreb et al, 2004). Thissection discusses the current theory on the risk factors associated with glaucoma. Moreresearch is needed to fully establish the role and impact of these.
3.1: INTRAOCULAR PRESSURE
IOP is a measurement of the fluid pressure within the eye. IOP is determined by aqueoushumour flow into and out of the anterior chamber (the space between the lens and cornea.This fluid is produced in the ciliary body and flows through the pupil and the trabecularmeshwork or through non-trabecular pathways, commonly called uveoscleral pathways.The balance between the production and outflow of aqueous humour controls the IOP.
The normal range for IOP is between 10 and 21 millimetres of mercury (mm Hg) with anaverage of 16 mm Hg, but average IOP varies across populations. High IOP for populations isusually defined as being greater than two standard deviations (SDs) from the population mean.IOPs that are within the normal population range may still be too high for individual patients.
Increased IOP is a risk factor for the development and progression of POAG. However, thelevel of IOP that causes nerve damage varies between individuals. A certain proportion of thosewith elevated IOP (ocular hypertension or OHT) will develop glaucoma. However, a significantproportion of those with POAG do not appear to have increased IOP.
A univariate and multivariate analysis completed by the Ocular Hypertension Treatment Study(OHTS) showed that for the OHTS population, every 1mm Hg increase in mean IOP level wasassociated with a 10% increased risk of progression from OHT to glaucoma (Table 3.1) (Gordon,Beiser and Brandt et al, 2002). The OHTS Group and the European Glaucoma PreventionStudy Group et al, (2007) confirmed that IOP is a risk factor for the development of POAG inuntreated individuals with OHT (Table 3.2).
3. Risk Factors
Intraocular pressure is a measurement of the fluid pressure within the eye.
Intraocular pressure is a risk factor for glaucoma.
A significant proportion of glaucoma patients have IOPs in the normal range.

�� Tu n n e l V i s i o nCentre for Eye Research Australia
Inaliteraturereviewofprogressionrates,Friedmanetal,(2004)alsofoundthatIOPwasariskfactorforprogressionofglaucoma(Table3.3).Inparticular,theEMGTfoundthattheriskofdeteriorationoftheopticnerveinapopulationofpatientswithPOAGdecreasedby10%foreach1mmHgreductioninIOP(forexample,Leskeetal,2003).JayandMurdoch(1993)alsofoundprogressionwasfasterwithhigherIOP.
IOPiscurrentlytheonlytreatableriskfactorthathasbeenidentifiedtodelayprogressionofglaucoma.CurrentmedicalandsurgicaltreatmentsarecentredonreducingIOPandmaintainingitatlowerlevels.
TABLE 3.1: SIGNIfICANT RISK fACTORS fOR OhT PROGRESSION TO GLAUCOMA,
IDENTIfIED BY ThE OhTS
hazard Ratio (95% Confidence Interval - CI)
Putative Predictive factor Univariate Multivariate
Age(perdecade) 1.43(1.19-1.71) 1.22(1.01-1.49)
Blackrace 1.59(1.09-2.32) 0.98(0.65-1.46)*
Sex(male) 1.87(1.31-2.67) 1.42(0.98-2.05)*
Heartdisease 2.11(1.23-3.62) 1.71(0.95-3.09)*
IOP(permmHg) 1.11(1.04-1.18) 1.10(1.04-1.17)
Cornealthickness(per40mmthinner)(seesection3.4) 1.88(1.55-2.29) 1.71(1.40-2.09)
PatternSD(per0.2dBgreater)(seeBox3) 1.36(1.16-1.60) 1.27(1.06-1.52)
Horizontalcup-to-discratio(per0.1larger)(seesection3.3) 1.25(1.14-1.38) 1.27(1.14-1.40)
Verticalcup-to-discratio(per0.1larger)(seesection3.3) 1.32(1.19-1.46) 1.32(1.19-1.47)
*Notsignificantatp<=0.05.mm=micrometer.dB=decibels.Source:reproducedfromGordon,BeiserandBrandtetal,(2002).
TABLE 3.2: hAZARD RATIOS fOR DEVELOPMENT Of POAG fROM OhT
Source:OcularHypertensionTreatmentStudyGroupandtheEuropeanGlaucomaPreventionStudyGroupetal,(2007).
3. Risk factors
IOP is currently the only treatable
risk factor that has been identified to
delay progression of glaucoma.
Figure3.1:Goldmentonometery
In the following example, we estimate the 5-year risk of de-veloping POAG for a 55-year-old male whose baseline IOPs forright and left eyes are 22 and 26 mmHg; vertical C/D ratios, 0.4and 0.4; CCT measurements, 532 and 548 �m; and PSDs, 2.2 and2.2 dB. Means of the values for the right and left eyes are averagedfor each eye-specific predictor and the points are summed (Table6) to estimate the 5-year risk of developing POAG. The sum ofpoints for this theoretical patient is 11, which yields an estimated5-year risk of developing POAG of 20% (Table 6). The estimatedrisk for this same patient from the Cox proportional hazards modelis 16.9%.
Discussion
Using data from the OHTS observation group, we devel-oped a multivariate model that identified baseline older
age, higher IOP, larger vertical C/D ratio, thinner centralcorneal measurement, and greater PSD as predictive fac-tors for the development of POAG in ocular hypertensiveindividuals. When the generalizability of the OHTSmodel was tested by applying it to data from the placebogroup of the EGPS, the same predictive factors wereidentified. The hazard ratios for the predictive factorswere very similar in the separate models, the pooledmodel, as well as recently published models by Medeiroset al22 and the EGPS Group.23 Thus, the OHTS predictivemodel, including CCT, has been replicated in a Europeansample and a separate U.S. sample. The pooled OHTS–EGPS sample has a large number of participants andlarge number of POAG end points, which yield greaterstability of the hazard ratios and narrower CIs forpredictions.
Table 5. Univariate and Multivariate Hazard Ratios (HRs) and 95% Confidence Intervals (CIs) for the Development of POAGin the Pooled OHTS and EGPS Control Groups
Baseline Variables
Model
Univariate Final Multivariate
nNo. ofEvents HR
95% LowerCI
95% UpperCI P Value n
No. ofEvents HR
95% LowerCI
95% UpperCI P Value
Age (decade) 1312 165 1.41 1.20 1.65 �0.0001 1123 154 1.26 1.06 1.50 0.0072Male gender 1312 165 1.23 0.91 1.67 0.1772Mean IOP per mmHg* 1312 165 1.10 1.03 1.17 0.0052 1123 154 1.09 1.03 1.17 0.0067Mean CCT per 40 �m thinner 1128 156 2.16 1.81 2.59 �0.0001 1123 154 2.04 1.70 2.45 �0.0001Mean vertical C/D ratio per
0.1 larger1311 165 1.21 1.12 1.32 �0.0001 1123 154 1.19 1.09 1.31 0.0001
Mean PSD per 0.2 dB greater 1308 163 1.12 1.04 1.21 0.0019 1123 154 1.13 1.04 1.24 0.0065History of heart disease 1312 165 1.62 1.00 2.61 0.0488Mean deviation defect per 0.1
dB greater1308 163 0.93 0.81 1.06 0.2799
History of high blood pressure 1312 165 1.14 0.83 1.56 0.4300History of migraine 1312 165 0.90 0.51 1.58 0.7073Current use systemic
�-blockers1309 165 0.99 0.49 2.01 0.9736
Current use systemiccalcium-channel blockers
1309 165 1.00 0.61 1.66 0.9876
Myopia ��1 D sphericalequivalent
1312 165 0.89 0.64 1.25 0.5108
CCT � central corneal thickness; CID � cup-to-disc; D � diopters; dB � decibels; IOP � intraocular pressure; PSD � pattern standard deviation.*Eye-specific variables are the mean of right and left eyes for each participant.
Table 6. A Point System for Estimating an Ocular Hypertensive Patient’s 5-Year Risk of Developing PrimaryOpen-Angle Glaucoma (POAG)
Baseline Predictor
Points for Baseline Predictor
0 1 2 3 4
Age (yrs) �45 45 to �55 55 to �65 65 to �75 �75Mean IOP (mmHg)* �22 22 to �24 24 to �26 26 to �28 �28Mean CCT (�m)* �600 576–600 551–575 526–550 �525Mean vertical cup-to-disc ratio by contour* �0.3 0.3 to �0.4 0.4 to �0.5 0.5 to �0.6 �0.6Mean PSD (dB)* �1.8 1.8 to �2.0 2.0 to �2.4 2.4 to �2.8 �2.8
Sum of points 0–6 7–8 9–10 11–12 �12Estimated 5-yr risk of POAG �4.0% 10% 15% 20% �33%
CCT � central corneal thickness; dB � decibels; IOP � intraocular pressure; PSD � pattern standard deviation.*Eye-specific variables are the mean of right and left eyes.
OHTS Group and EGPS Group � Validated Prediction Model for POAG
7
ARTICLE IN PRESS
Centre for Eye Research Australia

��The Economic Impact of Primary Open Angle Glaucoma - A Dynamic Economic Model
TABLE 3.3: RISK fACTORS fOR GLAUCOMA PROGRESSION, IDENTIfIED BY ThE EARLY
MANIfEST GLAUCOMA TRIAL
hazard Ratio (95% CI)
Baseline factors Univariate Multivariate
Age(≥68,<68years*) 1.42(1.01-1.98)† 1.47(1.04-2.09)†
IOP(≥21,<21mmHg*) 1.67(1.19-2.35)‡ 1.70(1.18-2.43)‡
PatternSD(≤-4,>-4*) 1.46(1.04-2.05)† 1.58(1.10-2.28)†
Pseudoexfoliation(yes,no*) 3.15(1.93-5.15)§ 2.22(1.31-3.74)‡
Botheyeseligible(yes,no*) 1.92(1.34-2.75)§ 1.96(1.36-2.82)§
Post Baseline factors ||
InitialchangeinIOPat3months(permmHg) 0.90(0.86-0.94)§
IOPatfirstfollow-upvisit(permmHg ) 1.11(1.06-1.17)§
MeanIOPatallfollow-upvisits(permmHg ) 1.13(1.07-1.19)§
Percentofvisitswithdischaemorrhage(per% )(a) 1.02(1.01-1.03)§
*Referencecategoryformultivariateanalysis;†P≤0.05;‡P<0.005;§P<0.001;||AdjustedforbaselineIOP,pseudoexfoliation,numberofeligibleeye,meandeviationandage.
(a)Haemorrhagesorbleedingaroundtheopticnervecanindicateongoingdamagetotheopticnerveandinadequatecontrolofglaucoma.
Source:reproducedfromLeskeetal,(2003)
�.�:AGE
Theprevalenceofglaucomaincreasesmarkedlywithage(Figure3.2).Intheirliteraturereviewofprogressionrates,Friedmanetal,(2004)foundthattherewasstrongevidenceofalinkbetweenolderageandtheriskofprogressionfromOHTtoglaucoma(Table3.1)andforprogressionofglaucoma(Table3.3).TheOHTSGroupandtheEuropeanGlaucomapreventionStudyGroupetal,(2007)confirmedthatage(bydecade)isasignificantriskfactorforprogressionfromOHTtoglaucoma(Table3.2).
fIGURE 3.2: DEMOGRAPhIC DISTRIBUTION Of GLAUCOMA, AUSTRALIANS OVER 40
Source:Taylor(2001)
The prevalence of glaucoma increases markedly with age.
Undiagnosed
Diagnosed
Perc
ent
10%
8%
6%
4%
2%
0%
Age40-49 50-59 60-69 70-79 80-89 90+
3. Risk factors
The cost of eye care will continue to increase as the population ages.

�� Tu n n e l V i s i o nCentre for Eye Research Australia
�.�:CUP-TO-DISCRATIO
Theopticdiscistheregionoftheeyewherethenervefibresconvergetoformtheopticnerveandexitthebackoftheeyeintotheorbit.Theopticcupisthecentreportionoftheopticdiscandissmallerbycomparison.The loss of optic nerve cells causes the cup to become larger relativetotheopticdisc,increasingthecup-to-discratio.4Thecuptodiscratiocomparesthediameterofthecuptotheentirediameteroftheopticdisc.Thecup-to-discratioisoftenmeasuredbothintheverticalandhorizontalpositiontoestimatetheamountofcuppingandamountofopticnervedamage.Thecuptodiscratioalsoincreasesinnon-glaucomatousnerveswithincreasingdiscdiameter(Crowstonetal,2004).
Largecup-to-discratioshavebeenidentifiedasabaselineriskfactorfordiseaseprogressionwithvaluesof>0.4and≥0.5associatedwithanincreasedriskofprogression.TheunivariateanalysiscompletedintheOHTSshowsthattheriskofglaucomaissignificantlyincreasedwithincreasesincup-to-discratios(Table3.1)asdidtheOHTSGroupandtheEuropeanGlaucomapreventionStudyGroupetal,(2007)(Table3.2).However,largercup-to-discratiosinocularhypertensivepatientsmaybeanindicationofearlystructuraldamageandthereforeserveasadiseasemarkerratherthanariskfactor.
fIGURE 3.3: CUP-TO-DISK RATIO
Cup-to-diskratioreferstotheratioofthecupdiametertotheverticaldiscdiameter.
Source:http://hubnet.buffalo.edu/ophthalmology/site/Home/Physical_Exam/Cup-to-Disc_ratio_normal_.jpgaccessedSeptember2006
�.�:CENTRALCORNEALTHICKNESS
AthincentralcorneahasbeenshowntohaveastrongassociationwiththeprogressionfromocularhypertensiontoPOAG(Table3.1andTable3.2).Thisrelationshiphasbeenexplainedbythepossibilitythatlowcornealthicknessmaybeassociatedwithstructuraldifferencesintheopticnervearchitecturethatpredisposetothedevelopmentofglaucoma.AnotherexplanationisthatmeasurementofIOPisaffectedbythethicknessofthecornea.Inthickercorneas,thetrueIOPislowerthanthemeasuredIOP.Ontheotherhand,inthinnercorneas,thetrueIOPishigherthanthemeasuredIOP.IntheOHTS,thinnercorneaswereassociatedwithahigherriskofdiseaseprogression(Gordonetal,2002).
A thin central cornea has been shown to
have an independent association with the
progression from ocular hypertension
to POAG
4Axonsfromtheopticnerveformtheopticrim.Centralexcavation(thecup)isfreefromopticnerveaxons.Theneuroretinalrimthinsfocallyordiffuselyduetoaxonlossinglaucoma.Thisleadstoenlargementofthecupinrelationtotheopticnerve(increasingthecuptodiscratio).
3. Risk factors
Centre for Eye Research Australia

��The Economic Impact of Primary Open Angle Glaucoma - A Dynamic Economic Model
fIGURE 3.4: CORNEAL ThICKNESS
Source:UniversityofIllinoisEyeandEarInfirmaryPositions,TheEyeDigest,http://www.agingeye.net/mainnews/glaucomapachymetry.php
�.�:FAMILYHISTORYANDGENETICS
first-degree relatives of individuals with primary open-angle glaucoma have up to an eight-fold increase in the risk of developing the diseasecomparedtothegeneralpopulation(Wolfsetal,1998;Tielschetal,1994).Weihetal,(2001)foundthat,inmultivariatelogisticregressionmodelsandadjustedforage,thestrongestriskfactorforglaucomawasafamilyhistoryofglaucoma(OddsRatio-OR3.5,95%CI:1.9to6.7).Friedmanetal,(2004)ontheotherhandconcludedthatstrongsupportforanassociationbetweenfamilyhistoryandprogressionfromOHTtoPOAGislacking,reflectingthatmanystudiesofthelinkbetweenfamilyhistoryandPOAGmaybeaffectedbyascertainmentbiasduetopoorrecallorlackofknowledgeoffamilyhistory.Forexample,McNaughtetal,(2000)foundthat27%ofpreviouslydiagnosedPOAGpatientswereunawareoftheirpositivefamilyhistory,suggestingthatahigherpercentageofadultPOAGmaybeinheritedthanhithertoreported.
POAGhasanapparentcomplexormultifactorialaetiology(WeinrebandKhaw,2004).Thechromosomallocationsofseveralgenesthatcanindependentlycausethediseasehavebeenmapped.More than 43 different glaucoma gene mutationshavebeenreportedinopen-angleglaucomapatients,andseverallargestudieshavesuggestedthatasagroupthesemutationsareassociated with 3-4% of patients withtheconditioninpopulationsworldwide(Fingertetal,2002).TheglaucomageneatGLC1Alocus(myocilin)hasbeenshowntobeassociatedwithbothjuvenileandadult-onsetprimaryopen-angleglaucoma(Sheffieldetal,1993;Stoneetal,1997;Alwardetal,1998;Fingertetal,1999;Polanskyetal,2000;Clarketal,2001).Thelowattributableriskportionofgeneticfactorsindicatesthatnon-geneticfactorsplayaninfluentialroleinthedevelopmentandprogressionofglaucoma.
�.�:ETHNICITY
Ethnicityhasbeenproposedasariskfactorinmanystudies.Inparticular,AmericanbasedstudieshavenotedahigherprevalenceandrateofprogressioninAfrican-Americanpopulations.ResultsfromtheOHTSsuggestthattheAfrican-Americanraceitselfdoesnotincreasetheriskofglaucomaprogressionbutreflectsahigherprevalenceofotherriskfactorswithinthatpopulation.AfricanAmericanstendtohavethinnercorneas,higherIOPandlargercuptodiscratiosonaveragethanCaucasians(Friedmanetal,2004).
3. Risk factors
POAG has a complex, multifactorial aetiology.
first degree relatives of OAG patients have an 8-fold increased risk of developing glaucoma.
Corneal thickness
�� Tu n n e l V i s i o nCentre for Eye Research Australia
�.�:DIABETESMELLITUS
TheOHTSshowedthatdiabetesmellitusmayprotectagainstprogressionfromOHTtoPOAG-(hazardratio0.37inmultivariateanalysis,p<0.05)-however,thepeoplewithdiabetesenrolledinthestudywerecarefullyselected(thosewithdiabeticretinopathywereexcluded)andmayrepresentanunusuallyhealthydiabeticpopulation(OHTSGroup;EuropeanGlaucomaPreventionStudyGroupetal,2006).
Twoglaucomamanagementtrialsshowedalinkbetweenthelikelihoodofglaucomaprogressionandthepresenceofdiabetesmellitus(theAdvancedGlaucomaInterventionStudy(AGIS,2002)andtheCollaborativeInitialGlaucomaTreatmentStudy-CIGTS(Lichteretal,2001)),whilemanyothershaveeitherexcludedindividualswithdiabetesornotexaminedanyrelationships(Friedmanetal,2004).
Populationbasedstudiesaswellasretrospectiveandprospectivecohortstudiesalsoprovidemixedresults(seeTable3.4)-includingpopulationbasedstudiesinAustralia.WhileMitchelletal(1997)foundanincreasedprevalenceofglaucomaforthosewithdiabetes(OR=2.12)andOHT(OR=1.86),astudybyWeihetal,(2001)foundthatwithadjustmentforage,therewasnosignificantdifferenceintheprevalenceofglaucomaamongthosewithdiabetesandthosewithout(resultsfordiabetesnotpresentedinthearticle).
VariationsinthedefinitionofPOAGmayexplainsomeofthedifferentfindings(deVoogdetal,2006).Forexample,deVoogdetal,(2006)notethatarevisionintheirdefinitionofPOAGledtoarevisionintheresultsfromtheRotterdamEyeStudy-fromaninitiallysignificantrelativerisk(RR)oftheprevalenceofPOAGinparticipantswithdiabetesmellitusof3.11(95%CI1.12to8.66)toanon-significantRRof1.40(95%CI0.96to2.03)(DeVoogdetal,2006:1830).DeVoogdetal,(2006)alsonotedthattheresultsfromthemetaanalysisbyBonovasetal(2004)(seeTable3.4)werebasedonpreviousworkfromtheRotterdamEyeStudywhichhasbeenrevisedbasedonanewdefinitionofPOAG5.
The association between POAG and
Diabetes is not clear.
3. Risk factors
5TheresultschangedfromaninitiallysignificantRRoftheprevalenceofPOAGinparticipantswithdiabetesmellitusof3.11(95%CI1.12to8.66)toanon-significantRRof1.40(95%CI0.96to2.03).(DeVoogdetal,2006:1830).
Over 40 gene mutations have been
reported in POAG.
Centre for Eye Research Australia

��The Economic Impact of Primary Open Angle Glaucoma - A Dynamic Economic Model
TABLE 3.4: ASSOCIATION BETWEEN DIABETES MELLITUS AND GLAUCOMA
Source Details Assoc.
Bonovasetal,2004* Statisticallysignificantassociationassumingarandomeffects 3 model(OR=1.50,95%CI1.16to1.93)orfixedeffectsmodel (OR=1.27,95%CI1.10to1.45)
deVoogdetal,2006† RRofincidentopen-angleglaucomawithdiabeteswas0.82 x (95%CI0.33to2.05)
Dielemansetal,1996† Associationbetweennewlydiagnoseddiabetesmellitusandhighlevelsof 3 bloodglucosewithhigh-tensionglaucoma,OR=3.11(95%CI,1.12to8.66)
Kleinetal,1994§ Open-angleglaucomaincreasedwithage-relateddiabetes ?^ (4.2%versus2.0%,inpeoplewithdiabetesversuspeoplewithout)
Weihetal,2001 Withadjustmentforage,morepeoplewithselfreporteddiabetes x hadpossible,probablyordefiniteglaucoma(12/230,5.2%)than thosewithoutdiabetes(175/4392,2.5%)butthedifferencewas notstatisticallysignificant(chisqtest,1df=0.86,p=0.36)
Mitchelletal,1997‡ PrevalenceofglaucomaandOHTincreasedinpeoplewithdiabetes 3 OR=2.12,95%CI1.18to3.79)(OHT:OR=1.86,95%CI1.09to3.20)
Tielschetal,1995# DiabeteswasnotassociatedwithPOAG(OR=1.03,95%CI0.85to1.25)
Pasqualeetal,2006 Type2diabeteswasassociatedtoPOAGinwomenwitha 3 RR=1.82(95%CI,1.23to2.70)
Zghaletal,2000 volutionofopen-angleglaucomaindiabetesdidnot x significantlydifferenttopeoplewithoutdiabetes
Buddeetal,1998 Patientswithorwithoutdiabetesdidnotsignificantly x differinthemorphologyoftheopticdisc
Zeiteretal,1994 Peoplewithprimaryopen-angleglaucomaandpredominantly 3 inferiorVFdefectsinoneorbotheyesaremorelikelytohavediabetes
*-Meta-analysis;†-RotterdamStudy;§-BeaverDamEyeStudy;‡-BMES;#-BaltimoreEyeSurvey^Theseresultswereobtainedfromthestudyabstract.Itwasunclearwhetheragewascontrolledinthiscomparison,thereforetheresultcannotbedeterminedtobeeithersupportiveonnon-supportiveofanassociation.
Withsuchmixedresults,theassociationbetweendiabetesmellitusandglaucomahasnotbeenmodelledhere.Asfuturestudiesarecompletedthisassociationwillbecomebetterunderstoodandcanthusbeincludedinmodellingsomeindirectinterventionscenariossuchasimproveddiagnosisofdiabetesandbetterglycemiccontrol.
�.�:OTHERPOTENTIALRISKFACTORS
Anumberofotherpotentialriskfactorshavebeenhighlightedincluding:• migraine:theOHTSshowedapositiveassociationalthoughnotstatisticallysignificant;• myopia(nearsightedness);• hyperopia(farsightedness);• pseudoexfoliation:foundtobeamajorriskfactorforprogressionintheEMGTwhich
includedasmallnumberofpatientswiththiscondition;• outflowfacility:conflictingresultsfromprogressionstudies;• malegender;• opticdischaemorrhage;• sleepapnoea;and• peripheralvasospasm6.
Ingeneral,thelimitednumberofstudiesinwhichtheseadditionalsuspectedriskfactorswereevaluateddoesnotsupportfirmconclusionsconcerningtheirrelativeimportance.
3. Risk factors
6Aperipheralvasospasmisacontractionofabloodvessel—reducingitsinternaldiameterandbloodflow—intheouterpartofthevisualfield.
Figure3.5:Pseudoexfoliationpupilmargin.
20 Tu n n e l V i s i o nCentre for Eye Research Australia
The effect of the disease and its treatment on a patient’s health
and quality of life is a key outcome
for measuring the economic impact
of disease.
In this section, the characteristics of the disease are discussed - remission, mortality, progressionand finally, prevalence and incidence. Estimates of prevalence and incidence were modelledbased on Melbourne Visual Impairment Project (MVIP) and BMES data and knowledge ofremission, and mortality drawn from the literature. Progression rates were modelled based onthe literature, previous modelling work and taking into account the available data on prevalenceand incidence by age and visual impairment.
The key outcome for measuring the economic impact of disease is the effect of the disease andits treatment on a patient’s health and quality of life. For eye disease, the key outcome is visionloss. Deterioration in vision is a fundamental determinant of the costs of glaucoma (particularlyindirect costs such as participation in the workforce, need for care and vision aids, as well asquality of life). In the case of glaucoma, however, non-vision, physiological changes (changes inIOP or optic disc for example) may also determine treatment, and therefore health system costs. While the costs of the disease are measured and incurred by individuals, diagnosis and qualityof life depend on the interrelationship between vision in each eye. In some patients, glaucomamay affect only one eye. If it affects both eyes, disease severity and progression in each eye candiffer, so there is often a better eye and a worse eye. Further, eyes that were originally “better”may become the “worse” eye over time. While a diagnosis of glaucoma is based on the worst eye, quality of life - on the other hand - is determined by the best eye (Brown, 1999, Kobeltet al, 2006:369).
4.1: DEFINITION OF DISEASE STAGE
There are five disease stages in the model which are discussed and defined throughout the textbelow. For ease of reference, a summary of the disease stages is provided in Table 4.8.
4.2: REMISSION
Currently there is no natural remission in open angle glaucoma (to either no disease oran earlier stage of the disease), nor any current treatments that improve VF or acuity.Consequently the remission rate for every stage of the disease is nil.
4.3: MORTALITY
General population mortality rate forecasts are from the Access Economics Demographic Model(AE-DEM) of the Australian population (see Section 4.4 for more information).
The rate of mortality from glaucoma is assumed to be determined by the person’s level of visualimpairment — people do not die from glaucoma itself but from associated complications suchas higher rates of accidental falls, isolation and depression (which are implicit in the calculationof the RR of mortality). McCarty et al, (2001) estimated that visual impairment (best correctedvisual acuity of <6/12) was associated with a significantly increased risk of mortality (ORadjusted for age, sex, country of birth, smoking, hypertension and arthritis of 2.34), whichconverted to a RR is 2.15.
The RRs of mortality from vision loss by disease stage used in the model are loosely based onMcCarty et al (2001)7 and fall with age as per Table 4.1.
4. Epidemiology
7 2.34 plus 0.67 (the difference between 1 and 1.67 or between 1.67 and 2.34).

21The Economic Impact of Primary Open Angle Glaucoma - A Dynamic Economic Model
Main heading to go here
The impact of disease on vision determines the impact on health and quality of life.
TABLE 4.1: RELATIVE RISK OF MORTALITY BY STAGE OF VISUAL IMPAIRMENT
Age OHT/EDS Mild Moderate Severe
40-44 1.00 1.67 2.33 3.00
45-49 1.00 1.67 2.33 3.00
50-54 1.00 1.67 2.33 2.99
55-59 1.00 1.66 2.32 2.98
60-64 1.00 1.66 2.31 2.95
65-69 1.00 1.65 2.29 2.91
70-74 1.00 1.64 2.26 2.85
75-79 1.00 1.62 2.20 2.75
80-84 1.00 1.59 2.11 2.59
85-89 1.00 1.53 1.98 2.37
90+ 1.00 1.45 1.79 2.06
Source: Loosely based on McCarty et al, (2001).
The aetiological fraction for mortality due to glaucoma (as opposed to the number ofpeople who died) is 1.27% based on the same techniques used in CERA (2004: 37) but usingupdated data.
4.4: POPULATION
Forecasts of the Australian population are from AE-DEM which uses a combination of fertility,mortality and migration rates to project the future Australian population. Base fertility andmortality profiles for each age and gender (for mortality) are sourced from ProductivityCommission (2005), and adjust over time to match the projection for the total value. Migrationrates are projected in line with the assumptions in the Australian Bureau of Statistics (ABS)publications: Australian Demographic Statistics (catalogue number 3101.0) and OverseasArrivals and Departures (catalogue number 3401.0), with adjustments for changes to Australia’smigration program and to reflect the latest actual migration (international and interstate) results.
4.5: PROGRESSION
For this dynamic study, a key parameter is the rate at which POAG causes vision to deteriorate(the rate of disease progression). The impact of disease on vision determines the impact on health and quality of life. Unfortunately, in studies of glaucoma, disease progression is notalways measured in terms of vision loss. Clinical studies often use a combination of changes inVF, IOP and optic disc as indicators of progression. As IOP is the focus of treatment, treatmentefficacy is generally measured according to its impact on IOP. Further, definitions of vision loss vary across researchers.
4. Epidemiology
�� Tu n n e l V i s i o nCentre for Eye Research Australia
Measuring and grading glaucomatous vision lossMeasuringtheprogressionofVFLinglaucomaiscomplex(seeBox3foranexplanationofthemethodoftestingVF).
• Glaucomatouschangeneedstobeisolatedfromotherfactorssuchaschangesinlensopacityduetocataract,orphysiologicalchangeduetoageing.
• Therecanbesubstantialmeasurementvariability(causedforexamplebylossoffixation),andthereisalearningeffect,bothofwhichneedtobeaccommodatedwhenexaminingpatients.
• Glaucomatousvisiondeteriorationisveryslow.Evenwhenachangeinfieldisdetectedviaperimetry,thepatientmaynotnoticeanyvisionloss.ClinicalstudieshavefoundthatonlyasubsetofpatientswithOHTdevelopglaucoma,andofthese,asmallproportionlosefunctionalvisionduringthecourseoftheirlifetime.
Further,differentresearchershavedevelopeddifferentgradingsystemstomeasureprogression.Forexample,theAGIS,EMGTandCIGTSalluseddifferentgradingsystemstomeasureprogression.OthergradingsystemsincludethosedevelopedbyAnderson,Blumenthal,andHodapp-Anderson-Parrish(HAP).
Differentgradingsystemsshowdifferentratesofprogressioninthesamepopulation(Zaharietal,2006,Wilsonetal,2002).Thereisnogoldstandard,soitisdifficulttocompareprogressionratesderivedfromstudiesusingdifferentmethodologies(Katzetal,1999).ComparisonsofprogressionratessuggestthatratesproducedusingtheAGISmethodmightrepresentalowerboundinjudgingprogression,andtheCIGTSandEMGTmethodsproducerelativelysimilarresults(Katzetal,1999,Wilsonetal,2002,Zaharietal,2006).
Weinrebetal,(2004)developedamethodologyforovercomingthisproblem(section4.5.1.).
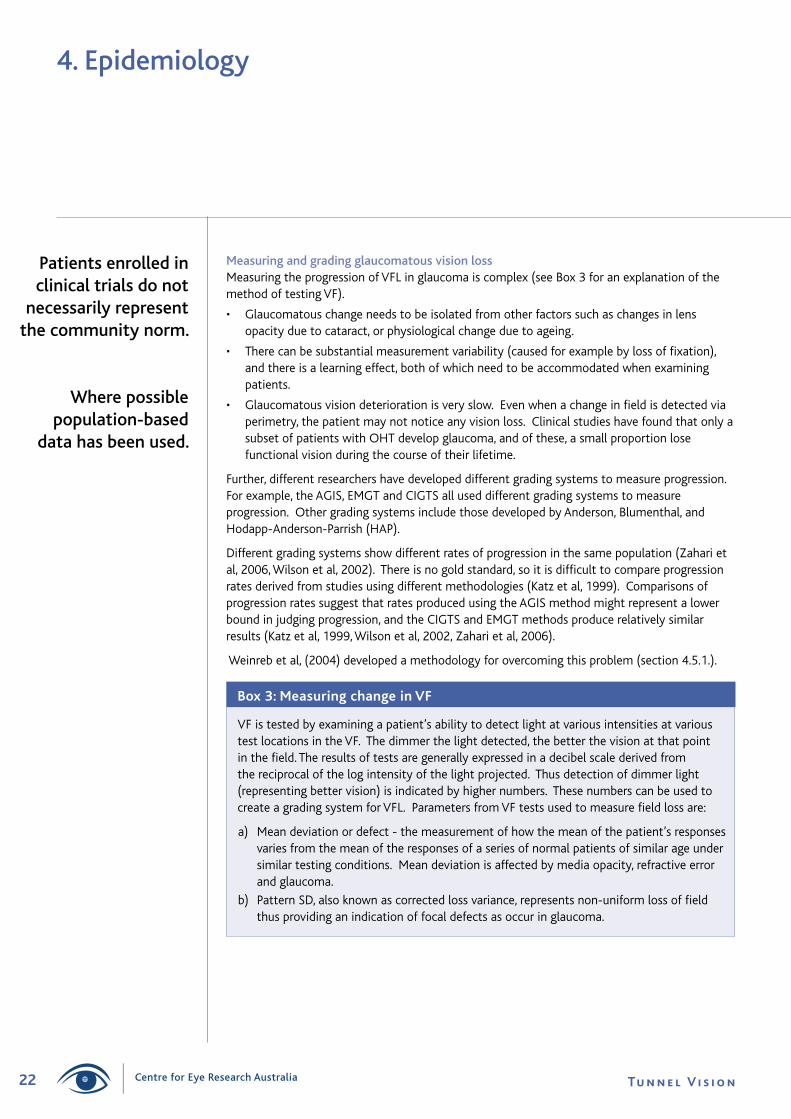
Box�:MeasuringchangeinVF
VFistestedbyexaminingapatient’sabilitytodetectlightatvariousintensitiesatvarioustestlocationsintheVF.Thedimmerthelightdetected,thebetterthevisionatthatpointinthefield.Theresultsoftestsaregenerallyexpressedinadecibelscalederivedfromthereciprocalofthelogintensityofthelightprojected.Thusdetectionofdimmerlight(representingbettervision)isindicatedbyhighernumbers.ThesenumberscanbeusedtocreateagradingsystemforVFL.ParametersfromVFtestsusedtomeasurefieldlossare:
a) Meandeviationordefect-themeasurementofhowthemeanofthepatient’sresponsesvariesfromthemeanoftheresponsesofaseriesofnormalpatientsofsimilarageundersimilartestingconditions.Meandeviationisaffectedbymediaopacity,refractiveerrorandglaucoma.
b)PatternSD,alsoknownascorrectedlossvariance,representsnon-uniformlossoffieldthusprovidinganindicationoffocaldefectsasoccuringlaucoma.
4. Epidemiology
Patients enrolled in clinical trials do not
necessarily represent the community norm.
Where possible population-based
data has been used.

��The Economic Impact of Primary Open Angle Glaucoma - A Dynamic Economic Model
4. Epidemiology
The importance of study population characteristics in selecting progression rates for modelling
Ideally,inselectingprogressionratesformodelling,dataneedtobedrawnfromstudiesthatarebasedonpopulationswithsimilarcharacteristicstothatbeingmodelled.Asnotedinsection3,anumberoffactorscanaffectprogressionratesincludingage,IOP,centralcornealthicknessandcuptodiscratio,orAfricanAmericanorigin(forexample).Inaddition,patientswithpseudoexfoliationsyndromeandpigmentaryglaucomaareoftenincludedtogetherwithPOAGpatientsinstudiesoftreatmentefficacyanddiseaseprogression.Whiletheidealwouldinvolverecalculationoftheresultswheretheinclusionofthesepatientshasamaterialimpactontheprogressionestimates,thereportedresultsoftenprecludere-calculationexcludingtheseparticipants.
Further,theparametersselectedforthemodellingneedtoreflectthelikelyoutcomesofadministeringtherapyinthecommunity,ratherthansimplyreplicatingthetrials.Progressionratesbasedonestimatesfromclinicaltrialsdonotnecessarilyreflecttheexperienceinthecommunity.Those enrolled in clinical trials often do nothavediseaseriskprofilesorhealthserviceutilisationhabitsthatrepresent the average or community ‘norm’.Asanexample,Hensonetal,(2006)suggestedthatglaucomaprogressionratesfoundinretrospectivestudiestendtobehigherthanratesderivedfromprospectivestudiesbecausepatientswillingtoenrolinprospectivestudiesmaybemoreconcernedabouttheirconditionandarelikelytobemoreattentive,demandingandcompliantwiththeirtherapythanaverage.
Constant or variable linear progression
Somestudieshavefoundthatprogressionratesspeedupasdamageworsens(forexample,Martusetal,2005),whileothershavefoundtheopposite(eg.Raskeretal2000).Thereisalsosomeevidencethatprogressionisepisodicratherthanconstant,forexample,Kwonetal,(2001)foundthataround25%patientsshowednon-lineardiseaseprogression.
4.5.1: NATURAL (UNTREATED) PROGRESSION
Dataondiseaseprogressioninuntreatedpatientsisavailablefromtheplaceboorobservationarmsofclinicaltrials(withtheprovisoabovethattheexperienceofparticipantsinclinicaltrialsmaynotmatchthatofthecommunityatlarge).Inaddition,JayandMurdoch(1993)estimateduntreatedprogressionandWilsonetal,(2002)examineduntreatedprogressioninblackpatients.ThesestudiesaresummarisedinTable4.3.Despiteexaminingprogressionratesintreatedpatients,Hattenhaueretal,(1998)isincludedinthetableforthereasonsoutlinedbelow.ThedatainthetablesuggestthefollowingnaturalpopulationprogressionratesforOhT to POAG(notingthatthedistinctionbetweenOHTandglaucomaisbasedonclinicianobservationofclinicalsignsaswellasinmostcasesdetectionofVFL):
• DatafromtheOHTSsuggestprogressionratesforwhitepatientsof2%peryear.Forallparticipants,theratewasjustunder2%peryear.
• DatafromtheEGPSsuggestannualprogressionratesforOHTtoPOAGofaround3.4%.

�� Tu n n e l V i s i o nCentre for Eye Research Australia
4. Epidemiology
DatafromTable4.3suggestthefollowingprogression rates for POAG(notingthatprogressionisdefinedindifferentwaysasperthediscussionabove):
• FortheEMGT,themostrecentdata(Leskeetal,2007)suggestannualprogressionratesofbetween9and10%,whereasLeskeetal,(2003)foundannualprogressionratesofjustover10%.
• FromWilsonetal(2002),progressiontoatleastunilateralblindnessinblackpatientswas1.6%peryearaccordingtotheAGIScriteria,and3.5%accordingtotheCIGTScriteria.
• DatafromtheCNTGSsuggestanannualprogressionrateof6.6%.
Weinrebetal,(2004)synthesisedtheseresultsbymodellingtheriskofblindnessinpatientswithOHTusingtheOHTS,Hattenhaueratal,(1998),andWilsonetal,(2002).TheselectedendpointwasunilateralblindnessasanindicatoroftheseverityofVFdeteriorationthatcanbecomparedacrossdifferentstudies.Weinrebetal,(2004)assumedthatprogressionratesfromOHTtoblindnesscanbeestimatedbyaddingthetimereportedforprogressionofOHTtoglaucomafromonestudywiththetimereportedforprogressionfromglaucomatoblindnessinanotherstudy(Weinrebetal,2004:462).Inaddition,progressionwasassumedtobelinear(Weinrebetal,2004:462).ProgressionratesfromHattenhaueretal,(1998)werealsouseddespiteostensiblybeingbasedontreatedpatients.Weinrebetal,(2004)arguedthatthetreatmentregimensintheHattenhauerpopulation—basedonpatientsnewlydiagnosedwithPOAGbetween1965and1980—maynotreflectcurrentorevenrecenttherapyandthusthesepatientscouldbeconsideredonlypartiallytreated—oruntreated.TheHattenhaueretal(1998)progressionratesmightalsobeerroneouslyhighbecauseoflackofdataonothercausesofvisionloss,thusWeinrebetal,(2004:465)usedtheseasanupperbound.TheestimatesoftheprobabilityofapatientwithOHTdevelopingglaucomaandfinallybecomingblindinoneeyeover15yearscalculatedbyWeinrebetal,(2004)were:
• 1.5%—OHTSandWilsonetal,(2002)AGIS;
• 2.6%—OHTSandHattenhaueretal,(1998);
• 3.3%—OHTSandWilsonetal,(2002)CIGTS;and
• 10.5%—Hattenhaueretal,(1998).
ResultsfromtheEGPS(2005)werenotavailablefortheWeinrebanalysis.IfthesearesubstitutedfortheOHTS,thecalculatedprobabilitiesare:2.7%,4.5%,5.9%and10.5%respectively.
ItisworthnotingthattherelativevalueofHattenhaueretal,(1998)isthatthedataweredrawnfromadatabaseofmedicalrecordsforallsourcesofmedicalcareusedbythelocalpopulationofOlmstedCounty(USA).Asapopulationbasedstudy,theresultsareprobablymorereflectiveofexperienceinthecommunity.Bycomparison,longitudinalstudiesofmedicalrecordsfromspecificmedicalcentresmaybebiasedbecauseofthetypesofpatientspresentingtotheclinic,orbecauseofthetreatmentapproachattheclinic(forexample,treatmentmaybemoreaggressive).
Centre for Eye Research Australia
��The Economic Impact of Primary Open Angle Glaucoma - A Dynamic Economic Model
TwoexamplesofratesmarkedlylowerthanthoseofHattenhaueretal,(1998)arebelow:
• Chen(2003)examinedrecordsfor186patients,(82%white),diagnosedwithPOAGin1975orlaterandwhopresentedtoatertiaryreferralclinic(UniversityofWashingtonMedicalCentre).Heestimatedthattheprobabilityofprogressionfromglaucomatounilateralblindnessat15yearswas14.6%(95%CI7.6-21.6)andtobilateralblindnesswas6.4%(95%CI0-14.4).
• Similarly,Kwonetal,(2001)studied40eyesof40patientsfollowedataUniversityclinicsince1972withPOAGandfoundthataround13%ofeyeswerelegallyblindafter15years,noting,however,thattheselectionofpatientsmayhavebeenbiasedtowardsthosewithworseglaucoma.
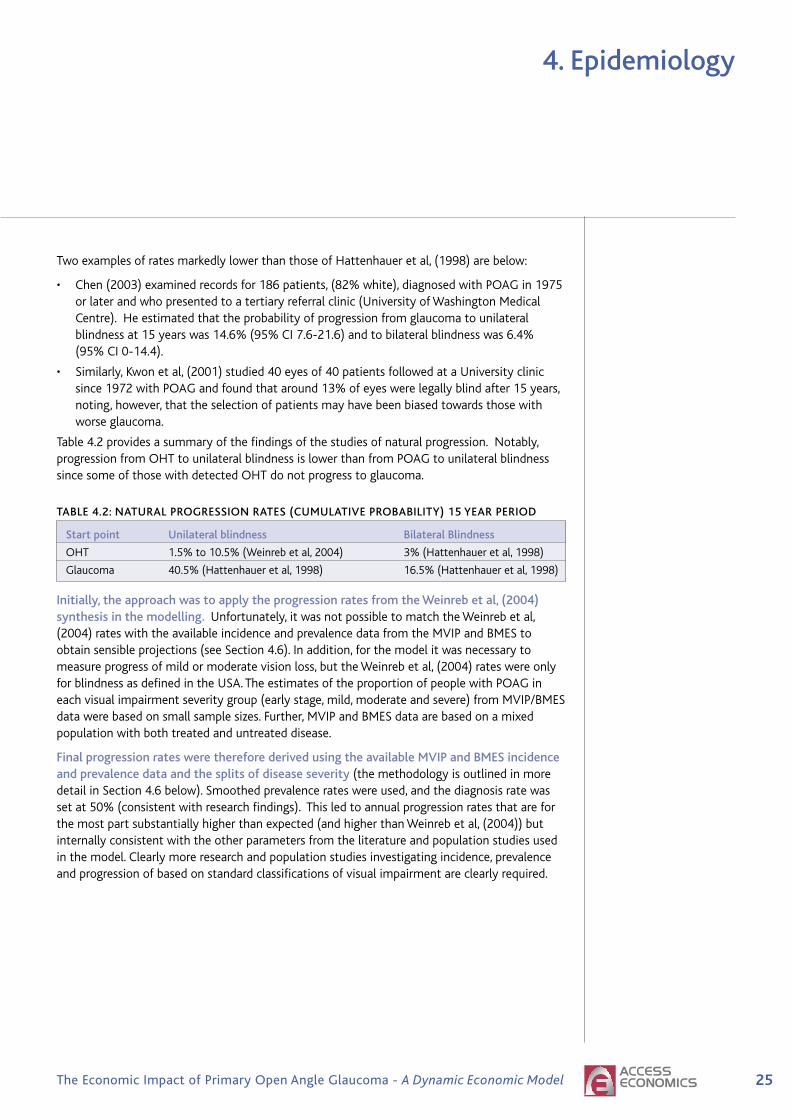
Table4.2providesasummaryofthefindingsofthestudiesofnaturalprogression.Notably,progressionfromOHTtounilateralblindnessislowerthanfromPOAGtounilateralblindnesssincesomeofthosewithdetectedOHTdonotprogresstoglaucoma.
TABLE 4.2: NATURAL PROGRESSION RATES (CUMULATIVE PROBABILITY) 15 YEAR PERIOD
Start point Unilateral blindness Bilateral Blindness
OHT 1.5%to10.5%(Weinrebetal,2004) 3%(Hattenhaueretal,1998)
Glaucoma 40.5%(Hattenhaueretal,1998) 16.5%(Hattenhaueretal,1998)
Initially, the approach was to apply the progression rates from the Weinreb et al, (2004) synthesis in the modelling. Unfortunately,itwasnotpossibletomatchtheWeinrebetal,(2004)rateswiththeavailableincidenceandprevalencedatafromtheMVIPandBMEStoobtainsensibleprojections(seeSection4.6).Inaddition,forthemodelitwasnecessarytomeasureprogressofmildormoderatevisionloss,buttheWeinrebetal,(2004)rateswereonlyforblindnessasdefinedintheUSA.TheestimatesoftheproportionofpeoplewithPOAGineachvisualimpairmentseveritygroup(earlystage,mild,moderateandsevere)fromMVIP/BMESdatawerebasedonsmallsamplesizes.Further,MVIPandBMESdataarebasedonamixedpopulationwithbothtreatedanduntreateddisease.
final progression rates were therefore derived using the available MVIP and BMES incidence and prevalence data and the splits of disease severity(themethodologyisoutlinedinmoredetailinSection4.6below).Smoothedprevalencerateswereused,andthediagnosisratewassetat50%(consistentwithresearchfindings).Thisledtoannualprogressionratesthatareforthemostpartsubstantiallyhigherthanexpected(andhigherthanWeinrebetal,(2004))butinternallyconsistentwiththeotherparametersfromtheliteratureandpopulationstudiesusedinthemodel.Clearlymoreresearchandpopulationstudiesinvestigatingincidence,prevalenceandprogressionofbasedonstandardclassificationsofvisualimpairmentareclearlyrequired.
4. Epidemiology

�� Tu n n e l V i s i o nCentre for Eye Research Australia
Insummaryandforthepurposesofmodelling,the annual natural progression rates are:
• OHTtoEDS:31.2%oftheOHTpopulationperannum(markedlyhigherthanstudiessuggest)8;
• NormotensivetoEDS:approximateaverageof0.22%oftheAustralianpopulationperannum;
• EDStoMild:1.5%ofthosewithPOAGperannum(intherangeofwhatstudiessuggest);
• MildtoModerate:85.0%(markedlyhigherthanstudiessuggest);and
• Moderatetosevere:30.0%(markedlyhigherthanstudiessuggest).
4. Epidemiology
8Whilethisnumberappearshigh,itisimportanttonotethattheprevalenceofOHTwasonlyrecordedforindividualsthatwere40yearsandoverandasdiscussedearlierinSection2theaetiologyofPOAGresemblesthatofacontinuum.Itisthereforeverylikelythat,byonlyincludingpeopleagedover40yearsofage,thetotalprevalenceofOHTisbeingunderestimated.
Centre for Eye Research Australia
��The Economic Impact of Primary Open Angle Glaucoma - A Dynamic Economic Model
TAB
LE 4
.3:
EST
IMA
TES
Of
DIS
EASE
PR
OG
RES
SIO
N I
N U
NT
REA
TED
PA
TIE
NT
S
Re
fere
nce
Stud
y ty
pe
Defi
niti
on o
f pr
ogre
ssio
n fo
llow
-up
Sam
ple
size
Pr
ogre
ssio
n ra
te
(%
whi
te)
Pr
ogre
ssio
n of
Oh
T to
gla
ucom
a
O
HTS
(Ka
ss
rand
omis
ed
Dev
elop
men
tof
VF
abno
rmal
ity
usin
gco
rrec
ted
patt
ern
60m
onth
s1,
636
pati
ents
A
t60
mon
ths,
cum
ulat
ive
prob
abili
tyo
f
et
al,
2002
)
clin
ical
tria
lSD
or
ifth
egl
auco
ma
hem
ifiel
dte
str
esul
tsw
ere
outs
ide
(7
5%w
hite
)de
velo
ping
gla
ucom
afo
rth
ose
int
heo
bser
vati
on
ob
serv
atio
ngr
oup
no
rmal
lim
its
OR
opti
cdi
scd
eter
iora
tion
gr
oup
was
9.5
%o
fpa
tien
ts.
POA
Gd
evel
oped
(thi
nnin
gof
neu
ror
etin
alr
im)
in6
3(1
0.2%
)of
614
non
-Afr
ican
Am
eric
an
obse
rvat
ion
grou
ppa
rtic
ipan
ts.
EG
PS(
2005
)
rand
omis
ed
Wor
seni
ngo
fVF
(3o
rm
ore
horiz
onta
llyo
rve
rtic
ally
60
mon
ths
1,07
7pa
tien
ts
At
60m
onth
s,th
eKa
plan
Mei
erc
umul
ativ
e
plac
ebo
grou
pcl
inic
alt
rial
adja
cent
poi
nts
diff
er5
dBo
rm
ore
from
bas
elin
e(2
)2
or
prob
abili
tyo
fde
velo
ping
PO
AG
was
mor
eho
rizon
tally
or
vert
ical
lya
djac
ent
poin
tsd
iffer
10d
B
16
.8%
of
pati
ents
int
hep
lace
bog
roup
orm
ore
from
bas
elin
e(3
)a
diff
eren
ceo
f10
dBo
rm
ore
acro
ss
th
ena
salh
oriz
onta
lmer
idia
nat
2o
rm
ore
adja
cent
poi
nts)
orc
hang
ein
opt
icd
isc
Pr
ogre
ssio
n of
Oh
T to
blin
dnes
s
H
atte
nhau
ere
tal
,Re
tros
pect
ive
Prob
abili
tyo
ftr
eate
dpa
tien
tsg
oing
blin
dfr
omn
ewly
m
ean
290
pati
ents
U
nila
tera
lblin
dnes
s:O
HT:
cum
ulat
ive
19
98
exam
inat
ion
diag
nose
dan
dtr
eate
dO
HT
orO
AG
.Bl
indn
ess
defin
eda
s15
yea
rs
(96%
whi
te)
prob
abili
ty1
4%a
t20
yea
rs(
95%
CI7
-20%
).
of
cas
ere
cord
sV
isua
lAcu
ity
(VA
)of
≤20
/200
,VF
cons
tric
tion
of
200
(SD
8y
ears
)(a
roun
d9%
Bi
late
ralb
lindn
ess:
OH
T:c
umul
ativ
epr
obab
ility
in
pop
ulat
ion
of
orle
ssin
wid
est
diam
eter
.
wit
hex
folia
tion
4%
at
20y
ears
(C
I1-9
%).
O
lmst
edC
ount
y,
glau
com
a)
Min
neso
taU
SA
Prog
ress
ion
of g
lauc
oma
EM
GT
(Les
ke
rand
omis
ed
Gla
ucom
ach
ange
pro
babi
lity
map
sba
sed
onp
oint
wis
e8
year
s
59%
of
trea
ted
and
76%
of
untr
eate
dpa
tien
ts
et
al,
2007
)
clin
ical
tria
lpa
tter
nde
viat
ions
fro
mt
hea
ge-c
orre
cted
nor
mal
thr
esho
ld
(Med
ian)
prog
ress
ed.
The
med
ian
tim
eto
pro
gres
sion
No
trea
tmen
t
va
lues
.At
leas
t3
test
poi
nts
show
ing
sign
ifica
ntd
iffer
ence
w
as6
0m
onth
s.
gr
oup
at
the
sam
elo
cati
ons
on3
con
secu
tive
map
s.
Mul
itiv
aria
tea
naly
sis
sugg
este
dtr
eatm
ent
O
Rop
tic
disc
cup
ping
re
duce
dth
eH
Rfo
rpr
ogre
ssio
nby
47%
(H
R,0
.53)
EM
GT
(Les
ke
As
abov
eA
sab
ove
6ye
ars
255
pati
ents
62
%o
fun
trea
ted
pati
ents
pro
gres
sed.
eta
l,20
03)
(a
lmos
tal
lA
llpa
tien
tsw
ith
prog
ress
ion
met
the
VF
No
trea
tmen
t
whi
te)
(pat
ient
scr
iter
iaw
ith
one
exce
ptio
n,w
hom
ett
he
gr
oup
wit
hex
folia
tion
op
tic
disc
crit
erio
non
ly.
sy
ndro
me
com
pris
eda
roun
d
10%
of
the
no
tr
eatm
ent
grou
p)

�� Tu n n e l V i s i o nCentre for Eye Research Australia
TAB
LE 4
.3:
EST
IMA
TES
Of
DIS
EASE
PR
OG
RES
SIO
N I
N U
NT
REA
TED
PA
TIE
NT
S co
nti
nu
ed
Re
fere
nce
Stud
y ty
pe
Defi
niti
on o
f pr
ogre
ssio
n fo
llow
-up
Sam
ple
size
Pr
ogre
ssio
n ra
te
(%
whi
te)
Pr
ogre
ssio
n of
gla
ucom
a
A
GIS
(N
ouri-
Lo
ngit
udin
al
Com
pare
dpo
intw
ise
linea
rre
gres
sion
,8
year
s15
6ey
eso
f15
6V
isua
lfiel
dpr
ogre
ssio
nat
8y
ears
was
Mah
davi
et
al,
inte
rven
tion
stu
dy
Gla
ucom
ach
ange
pro
babi
lity
map
san
d
pati
ents
de
tect
edin
35%
,31%
,and
22%
of
pati
ents
2007
)
AG
ISp
rogr
essi
onc
riter
ia.
byp
oint
wis
elin
ear
regr
essi
on,G
lauc
oma
Cha
nge
Prob
abili
tyA
naly
sis,
and
the
AG
ISm
etho
d,
resp
ecti
vely
.
C
NTG
Sgr
oup
pros
pect
ive
Wor
seni
ngo
fan
exi
stin
gV
Fde
fect
,5
year
s14
5ey
es,1
45
At
5ye
ars,
33%
of
the
untr
eate
dgr
oup
(1
998)
ra
ndom
ised
ap
pear
ance
of
new
VF
defe
cts
ora
new
pati
ents
pr
ogre
ssed
.Th
em
ean
tim
eto
pro
gres
sion
int
his
N
otr
eatm
ent
clin
ical
tria
lth
reat
to
cent
ralv
isua
lfixa
tion
.
gr
oup
was
1,6
95(
±14
3)d
ays.
Whe
nth
eda
ta
gr
oup
wer
ead
just
edfo
rca
tara
ct,a
tth
ree
year
s,
40
%o
fpa
tien
tsin
the
con
trol
arm
exp
erie
nced
vi
sion
loss
,and
at
5ye
ars,
60%
exp
erie
nced
vi
sion
loss
Pr
ogre
ssio
n of
gla
ucom
a to
blin
dnes
s
W
ilson
et
re
tros
pect
ive
U
sed
AG
ISa
ndC
IGTS
to
grad
epr
ogre
ssio
n10
yea
rs
205
pati
ents
C
umul
ativ
epr
obab
ility
of
reac
hing
end
-sta
ge
al
(20
02)
stud
y-
clin
ical
(1
00%
bla
ck)
dise
ase
ina
tle
ast
one
eye
from
dia
gnos
is
A
llun
trea
ted.
ex
amin
atio
n
wit
hgl
auco
ma
was
abo
ut1
6%b
yA
GIS
of
pat
ient
sat
crit
eria
and
was
35%
by
CIG
TS.
two
poin
tsin
ti
me
inS
tLu
cia
W
est
Indi
es.
H
atte
nhau
ere
t
Retr
ospe
ctiv
ePr
obab
ility
of
trea
ted
pati
ents
goi
ngb
lind
from
new
ly
mea
n29
0pa
tien
ts
Gla
ucom
ato
uni
late
ralb
lindn
ess:
al,(
1998
)ex
amin
atio
nof
di
agno
sed
and
trea
ted
OH
Tor
OA
G.
Blin
dnes
s15
yea
rs
(96%
whi
te)
cum
ulat
ive
prob
abili
ty5
4%a
t20
yea
rs
case
rec
ords
in
defin
eda
sVA
of≤2
0/20
0,V
Fco
nstr
icti
on
(SD
8y
ears
)
(95%
CI4
2-72
%).
popu
lati
ono
f
of2
00 or
less
inw
ides
tdi
amet
er.
Gla
ucom
ato
bila
tera
lblin
dnes
s:
O
lmst
edC
ount
y,
cu
mul
ativ
epr
obab
ility
22%
M
inne
sota
USA
at2
0ye
ars
(CI8
-38%
).
Ja
yan
d
Cas
ese
ries
Mea
nra
teo
fVFL
inu
ntre
ated
PO
AG
est
imat
edb
y
177
For
pres
sure
sof
21
to2
5m
mH
g,u
ntre
ated
Mur
doch
of
pat
ient
sco
mpa
ring
the
mea
nag
eat
pre
sent
atio
nof
pat
ient
s
pati
ents
di
seas
eis
like
lyt
opr
ogre
ssf
rom
ear
lyfi
eld
(1
993)
w
ith
new
ly
wit
hea
rlyr
elat
ive
VFL
wit
hth
em
ean
age
oft
hose
ch
ange
sto
end
sta
gein
an
aver
age
of1
4.4
year
s.
diag
nose
dw
hop
rese
nted
wit
hab
solu
tefi
eld
loss
wit
hin
The
sam
ein
terv
alfo
rpr
essu
res
of2
5to
30
mm
PO
AG
fiv
ede
gree
sof
fixa
tion
.
H
gw
as6
.5y
ears
and
for
pres
sure
sov
er3
0m
m
Hg,
2.9
yea
rs.
Centre for Eye Research Australia

��The Economic Impact of Primary Open Angle Glaucoma - A Dynamic Economic Model
4. Epidemiology
�.�:PREVALENCEANDINCIDENCE
Asforeshadowedpreviously,theincidenceandprevalenceestimatesusedinthemodelarederivedfrombothMVIP9andBMESdata.
• Dataforpersonswereused,ratherthanbygendertoensurethelargestsamplesizepossible.Noconsistentgenderdifferencesarereportedinglaucomaincidence,prevalenceofseveritystudies.
• TheEDSgroupisbasedonMVIPdataforpeoplewithprobableordefiniteglaucoma.Thisstagelackedvisionlossbydefinitionandsothediagnosishadbeenmadeonopticdiscchangesorapreviousdiagnosisofglaucoma.TheotherstagesofPOAGarebasedoncombinedMVIPandBMESdataforpeoplewithdefiniteglaucoma.
• Thedataweredisaggregatedintodegreeofvisualimpairment,withVImeasuredusingacombinationofVAandVFloss(seedefinitionsandschematicinTable44andFigure4.1).TheVAcategoriesarecreatedfromthebest-presentedVAdata,andVFL(constriction)categoriesarecreatedfromPatternDeviationdata.
• Forthisanalysis,severeandprofoundwerecombined.
• IncidenceandprevalenceofOHTisbasedonMVIPdataforthosewithIOP≥21mmHgusingtonopenmeasurements.
• TheprogressionratesbetweenthestagesofglaucomahavebeenpreviouslydescribedinSection4.5.1.
TABLE 4.4: DEfINITIONS Of LEVEL Of IMPAIRMENT fOR DEfINITE GLAUCOMA
VA VfL
EDS/None Betterthan6/12 AND NoVFL
MildImpairment <6/12 OR AnylossofVF
ModerateImpairment <6/18 OR <20ofieldloss
SevereorprofoundImpairment <6/60 OR <10ofieldloss
fIGURE 4.1: SChEMATIC Of ThE LEVEL Of IMPAIRMENT fOR DEfINITE GLAUCOMA
for both OhT and POAG an increase in prevalence is observable with age, althoughthistailsoffforOHT,asprogressiontoglaucomabecomesmorelikelyandtherebytreatmentstoreduceIOP(Table4.5).AsmallnumberofindividualswererecordedintheoldestagegroupforpeoplewithOHT,whichresultedinaprevalencerateestimateofzero.ItispossiblethatoncepeoplereachacertainagewithoutcontractingOHTorglaucoma,theyareunlikelyevertodevelopit,however,thismayalsoresultfromthesmallsamplesize(Table4.5).
Loss of visual acuity and visual field affect quality of life.
Visual Acuity No Loss
Some VF
Loss
VF <20 - !10
degrees
VF <10 - !5
degrees
VF <5
degrees
VA <3/60 or worse
VA <6/60 - !3/60 Severe
VA <6/18 - !6/60 Moderate
VA <6/12 - !6/18 Mild
VA <6/6 - !6/12 None
VA !6/6
Visual Field Loss
9SeeforexampleMukeshetal,(2002),Wensoretal(1998)andWeihetal,(2001).

�0 Tu n n e l V i s i o nCentre for Eye Research Australia
TABLE 4.5: OhT AND GLAUCOMA PREVALENCE RATES
OhT prevalence - Glaucoma prevalence - Original (%) (%)
Age Males females Original Smoothed
0-39 0.00 0.00 0.00 0.00
40-44 0.13 0.13 0.00 0.07
45-49 0.13 0.13 0.22 0.14
50-54 0.31 0.31 0.21 0.60
55-59 0.31 0.31 1.45 0.94
60-64 0.37 0.37 1.50 2.29
65-69 0.37 0.37 4.22 3.46
70-74 0.49 0.49 5.30 5.51
75-79 0.49 0.49 6.85 5.78
80-84 0.00 0.00 6.19 6.74
85-89 0.00 0.00 9.09 9.66
90+ 0.00 0.00 18.18 20.66
Source:specialrequestfromCERAbasedonMVIPandBMES
DISMODIIwasusedtocalculateincidenceandprevalencebyageforOHTandPOAG.Anumberofstepsweretaken.
First,glaucoma prevalence data from the MVIP and BMES database were smoothed by taking a moving average across three age groups to remove prevalence fluctuations between age-cohorts.Whilethedynamicmodelallowstheusertoswitchbetweentheoriginalprevalenceratesandthesmoothedprevalencerates,thesmootheddataispreferredformodellingpurposes,asthetrendsfollowamorelogicalpathway.
ThedifferencesbetweentheoriginalprevalenceratesandthesmoothedratesareshowninFigure4.2andFigure4.3.
fIGURE 4.2: ORIGINAL PREVALENCE RATES
4. Epidemiology
Economic impact of primary open angle glaucoma Commercial-in-Confidence
26
FIGURE 4-2: ORIGINAL PREVALENCE RATES
0-39 40-44 45-49 50-54 55-59 60-64 65-69 70-74 75-79 80-84 85-89 90-94 95+
0%
2%
4%
6%
8%
10%
12%
14%
16%
18%
20%
EDS
Mild
Moderate
Severe
FIGURE 4-3: SMOOTHED PREVALENCE RATES (MOVING AVERAGE ACROSS THREE AGE GROUPS)
0-39 40-44 45-49 50-54 55-59 60-64 65-69 70-74 75-79 80-84 85-89 90-94 95+
0%
5%
10%
15%
20%
25%
30%
35%
40%
EDS
Mild
Moderate
Severe
Second, raw OHT prevalence estimates (based on a special data request from the MVIP
database) were then run through DISMOD II (assuming no remission) and the resulting totalprevalence numbers formed the denominator for the progression rate in step three.
A progression rate from OHT to glaucoma was calculated by dividing half the number of
incident cases of glaucoma by total prevalence of OHT. This was justified by findings from the
Early Manifest Glaucoma Trial where 52% of glaucoma cases identified through populationscreening had an IOP <21mmHg (Grodum et al, 2002). This resulted in a progression rate of
Centre for Eye Research Australia

��The Economic Impact of Primary Open Angle Glaucoma - A Dynamic Economic Model
4. Epidemiology
fIGURE 4.3: SMOOThED PREVALENCE RATES
(MOVING AVERAGE ACROSS ThREE AGE GROUPS)
Second,rawOHTprevalenceestimates(basedonaspecialdatarequestfromtheMVIPdatabase)werethenrunthroughDISMODII(assumingnoremission)andtheresultingtotalprevalencenumbersformedthedenominatorfortheprogressionrateinstepthree.
AprogressionratefromOHTtoglaucomawascalculatedbydividinghalfthenumberofincidentcasesofglaucomabytotalprevalenceofOHT.ThiswasjustifiedbyfindingsfromtheEarlyManifestGlaucomaTrialwhere52%ofglaucomacasesidentifiedthroughpopulationscreeninghadanIOP<21mmHg(Grodumetal,2002).Thisresultedinaprogressionrateofapproximately31.2%perannum.Asnotedearlier,thisnumberappearshighandmoreresearchanddataareneeded.ItisalsoimportanttonotethattheprevalenceofOHTwasonlyrecordedforindividualsthatwere40yearsandoverandasdiscussedearlierinSection2theaetiologyofPOAGresemblesthatofacontinuum.Itisthereforepossiblethat,byonlyincludingpeopleagedover40yearsofage,thetotalprevalenceofOHTmaybeunderestimated.
TheincidenceofearlystagePOAGfromnormotensiveAustralianswasthenestimatedusingDISMODII,withanapproximateannualincidencerateof0.22%oftheAustralianpopulation.
IncidenceandprevalenceratesforOHTwerethenrecalculatedusingtheratesofprogressionfromOHTtoearlystagePOAG,aswellasanORofmortalityof1.TheresultingoutputisshowninTable4.6.WhileOHTamongstthoseinolderagegroupswaszerointheoriginaldata(Table4.4),thisislikelyafunctionofthesmallsamplesizeandsoprevalenceratesofthoseaged80orolderhavebeenassumedthesameasthoseaged75-79years.The results of sensitivity analysis of maintaining the incidence and prevalence of OhT for those aged 80 or over at zero are presented in Chapter 9, Section 9.1.2.
Basedontheprevalenceofglaucomausingthesmoothedrates,theproportionofpeoplewithineachdiseasestagebyageisshowninTable4.7.
Economic impact of primary open angle glaucoma Commercial-in-Confidence
26
FIGURE 4-2: ORIGINAL PREVALENCE RATES
0-39 40-44 45-49 50-54 55-59 60-64 65-69 70-74 75-79 80-84 85-89 90-94 95+
0%
2%
4%
6%
8%
10%
12%
14%
16%
18%
20%
EDS
Mild
Moderate
Severe
FIGURE 4-3: SMOOTHED PREVALENCE RATES (MOVING AVERAGE ACROSS THREE AGE GROUPS)
0-39 40-44 45-49 50-54 55-59 60-64 65-69 70-74 75-79 80-84 85-89 90-94 95+
0%
5%
10%
15%
20%
25%
30%
35%
40%
EDS
Mild
Moderate
Severe
Second, raw OHT prevalence estimates (based on a special data request from the MVIP
database) were then run through DISMOD II (assuming no remission) and the resulting totalprevalence numbers formed the denominator for the progression rate in step three.
A progression rate from OHT to glaucoma was calculated by dividing half the number of
incident cases of glaucoma by total prevalence of OHT. This was justified by findings from the
Early Manifest Glaucoma Trial where 52% of glaucoma cases identified through populationscreening had an IOP <21mmHg (Grodum et al, 2002). This resulted in a progression rate of

�� Tu n n e l V i s i o nCentre for Eye Research Australia
4. Epidemiology
TABLE 4.6: INCIDENCE AND PREVALENCE Of OCULAR hYPERTENSION (% Of AGE GROUP)
Prevalence - Original Incidence - DISMOD II Prevalence - DISMOD II Age Males females Males females Males females
0-39 0.00 0.00 0.00 0.00 0.00 0.00
40-44 0.13 0.13 0.02 0.02 0.08 0.08
45-49 0.13 0.13 0.03 0.03 0.15 0.15
50-54 0.31 0.31 0.05 0.05 0.23 0.23
55-59 0.31 0.31 0.08 0.08 0.30 0.30
60-64 0.37 0.37 0.11 0.11 0.35 0.35
65-69 0.37 0.37 0.13 0.13 0.39 0.39
70-74 0.49 0.49 0.14 0.14 0.44 0.44
75-79 0.49 0.49 0.15 0.15 0.49 0.49
80-84 0.49 0.49 0.15 0.15 0.49 0.49
85-89 0.49 0.49 0.15 0.15 0.49 0.49
90+ 0.49 0.49 0.15 0.15 0.49 0.49
Source:AccessEconomicsandMVIP
TABLE 4.7: PROPORTION Of PEOPLE WITh GLAUCOMA BY AGE AND SEVERITY (%),
SMOOThED (MOVING AVERAGE ACROSS ThREE AGE GROUPS)
EDS Mild Moderate Severe
0-39 0.0 0.0 0.0 0.0
40-44 100.0 0.0 0.0 0.0
45-49 100.0 0.0 0.0 0.0
50-54 100.0 0.0 0.0 0.0
55-59 100.0 0.0 0.0 0.0
60-64 95.1 0.2 1.7 2.9
65-69 94.3 0.4 2.8 2.6
70-74 92.5 0.5 3.7 3.3
75-79 88.6 1.2 8.4 1.8
80-84 84.4 1.7 11.5 2.5
85-89 78.0 2.2 15.1 4.8
90+ 70.6 1.1 7.7 20.6
Centre for Eye Research Australia

��The Economic Impact of Primary Open Angle Glaucoma - A Dynamic Economic Model
�.�
:DIS
EASE
STA
GES
DEF
INED
TAB
LE 4
.8:
DIS
EASE
STA
GE
D
isea
se s
tage
D
escr
ipti
on
VA
VfL
M
orta
lity
(RR
) Pr
ogre
ssio
n R
ate
(unt
reat
ed)#
N
oPO
AG
N
ovi
sual
impa
irmen
t
1~
31.2
%pa
*O
HT
toP
OA
G
(O
HT
orn
orm
alt
ensi
on)
~
0.2
2%o
fAus
tral
ians
to
POA
G
(n
orm
oten
sive
)
Ea
rlyd
isea
ses
tage
(PO
AG
)D
efini
teo
rPr
obab
leG
lauc
oma.
Be
tter
A
nd
No
VFL
1
1.5%
pa
No
visu
alim
pairm
ent
but
chan
ges
th
an6
/12
too
ptic
ner
vea
nd/o
rre
tina
M
ild
Defi
nite
Gla
ucom
aw
ith
mild
<
6/12
O
rA
nylo
sso
fVF
1.67
85
.0%
pa
visu
alim
pairm
ent
M
oder
ate
Defi
nite
Gla
ucom
aw
ith
mod
erat
e
<6/
18
Or
<20
o fie
ld
2.34
30
.0%
pa
visu
alim
pairm
ent
Se
vere
and
pro
foun
dBl
indn
ess
(Aus
tral
ian
and
<
6/60
O
r<
10o
field
3.
01
na
WH
Od
efini
tion
s)
RR=
Rel
ativ
eris
k,iP
OA
G=
Inci
denc
eof
PO
AG
,pO
HT
=P
reva
lenc
eof
OH
T
*Th
epr
ogre
ssio
nof
peo
ple
wit
hO
HT
tom
ildg
lauc
oma
has
been
cal
cula
ted
usin
gha
lfth
ein
cide
nce
rate
of
POA
Gd
ivid
edb
yth
epr
eval
ence
rate
of
OH
T

34 Tu n n e l V i s i o nCentre for Eye Research Australia
Current treatment regimens centre on the only known treatable risk factor for glaucoma - intraocular pressure (IOP). Management is directed at establishing and maintaining targetsfor reducing IOP. No level of IOP is safe for every patient. In general, the initial target aims toachieve a 20-50% reduction from the initial pressure at which damage occurred.
Patients with a lower than average risk of glaucoma (<5%) could be observed and monitoredwithout treatment. For those patients who are at moderate risk of glaucoma (5% to 15%),a well-informed patient can decide with his or her physician whether to treat or not.In patients with a higher than average risk (>15%), treatment for all should be considered(Weinreb et al, 2004).
Clinicians attempt to achieve IOP reductions and control glaucoma by stepping patients throughthe following course of treatment:
1) Medication;
2) laser therapy (ALT or Selective Laser Trabeculoplasty (SLT) and medication combined;and finally
3) surgery.
The treatment pattern in most cases is the same regardless of the stage at which the diseaseis diagnosed - that is, patients presenting with both early stage disease and severe diseasecommence treatment with medication. Occasionally, laser (if compliance is likely to be poor)or surgery (if medical therapy is likely to fail or not be tolerated) are used as first line therapy.The side effects of treatment are discussed later in Section 5.6.
5.1: MEDICATION
Medication is the first stage of treatment, usually in a topical form (eye drops), but an oral formalso exists. A range of medications are available for the reduction of IOP, summarised in Table5.1. Prostaglandin analogues and beta (β)-adrenergic antagonists are the most frequently used,with topical prostaglandins now the drug of choice in Australia - Lumigan (bimatoprost), Xalatan(latanoprost), Travatan (travoprost). The proportions of medication types used have shifted overtime, particularly since the introduction of prostaglandin analogues in 1997 (Figure 5.1). Basedon MVIP data, Weih et al (1998) found that the most common glaucoma medications used were(β)-adrenergic antagonists (63%), followed by sympathomimetics (18%) and cholinergic agents(16%). The authors also noted the shift to (β)-adrenergic antagonists and away from the use ofpilocarpine over the previous 20 years.
Medications reduce the amount of aqueous humour being produced and/or increase the outflowof aqueous humour from the eye. This can be via the conventional outflow pathway throughthe trabecular meshwork or by the non-conventional outflow pathway (uveo-scleral outflowpathway). Some medications do both.
A topical medication can enter the blood supply through the naso-lacrimal drainage systemleading to systemic side-effects (ie. side effects in the rest of the body as well as the eye).Systemic side-effects can be reduced substantially with the use of punctal occlusion and gentleeye lid closure for more than two minutes. Side effects are discussed in Section 5.6.
5. Treatment
Current treatment regimens centre
on the only known treatable risk factor
for glaucoma - intraocular pressure
(IOP).
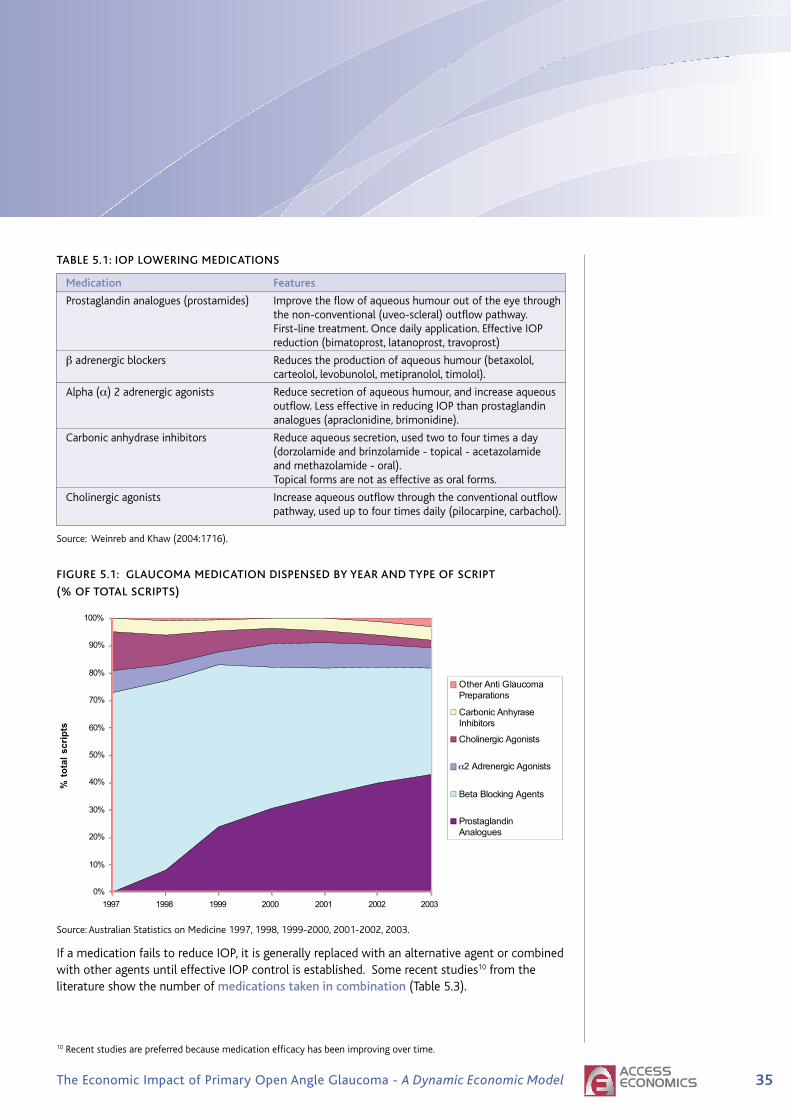
35The Economic Impact of Primary Open Angle Glaucoma - A Dynamic Economic Model
Main heading to go here
TABLE 5.1: IOP LOWERING MEDICATIONS
Medication Features
Prostaglandin analogues (prostamides) Improve the flow of aqueous humour out of the eye through the non-conventional (uveo-scleral) outflow pathway. First-line treatment. Once daily application. Effective IOP reduction (bimatoprost, latanoprost, travoprost)
β adrenergic blockers Reduces the production of aqueous humour (betaxolol, carteolol, levobunolol, metipranolol, timolol).
Alpha (α) 2 adrenergic agonists Reduce secretion of aqueous humour, and increase aqueous outflow. Less effective in reducing IOP than prostaglandin analogues (apraclonidine, brimonidine).
Carbonic anhydrase inhibitors Reduce aqueous secretion, used two to four times a day (dorzolamide and brinzolamide - topical - acetazolamide and methazolamide - oral). Topical forms are not as effective as oral forms.
Cholinergic agonists Increase aqueous outflow through the conventional outflow pathway, used up to four times daily (pilocarpine, carbachol).
Source: Weinreb and Khaw (2004:1716).
FIGURE 5.1: GLAUCOMA MEDICATION DISPENSED BY YEAR AND TYPE OF SCRIPT
(% OF TOTAL SCRIPTS)
Source: Australian Statistics on Medicine 1997, 1998, 1999-2000, 2001-2002, 2003.
If a medication fails to reduce IOP, it is generally replaced with an alternative agent or combinedwith other agents until effective IOP control is established. Some recent studies10 from theliterature show the number of medications taken in combination (Table 5.3).
0%
10%
20%
30%
40%
50%
60%
70%
80%
90%
100%
1997 1998 1999 2000 2001 2002 2003
%to
tals
crip
ts
Other Anti GlaucomaPreparations
Carbonic AnhyraseInhibitors
Cholinergic Agonists
2α Adrenergic Agonists
Beta Blocking Agents
ProstaglandinAnalogues
5. Treatment
10 Recent studies are preferred because medication efficacy has been improving over time.

�� Tu n n e l V i s i o nCentre for Eye Research Australia
Ingeneral,mostpatientsaretakingtwoormoremedicationsbythetimetheyareconsideredinneedoflasertreatmentorsurgery.Formodelling,thetotalcostsofmedicationsusedweredividedbythenumberofpeopleaffected(thisisexplainedinsection6.3.2).Theproportionofeachmedicationtypedispensedwastakenintoaccountinthecalculationfortotalmedicationcosts,withsimilarproportionsofmedicationsreportedbystateandterritory.
TABLE 5.2: PROPORTION Of EACh DRUG CLASS BY STATE, 2005
Prostaglandin b-blocker Carbonic a2 Cholinergic Anhydrase Adrenergic Agonist Inhibitor Agent
NSW 51.2 26.2 12.4 7.2 3.0
VIC 53.6 24.2 12.5 7.5 2.3
QLD 55.4 26.4 10.4 4.6 3.3
SA 54.2 28.9 8.5 5.8 2.6
WA 52.9 29.0 10.2 5.9 2.0
TAS 54.2 29.5 9.5 5.2 1.8
ACT 56.2 22.6 14.3 4.4 2.4
NT 61.8 19.6 11.3 5.5 1.7
Source:PBSItemdatabase.
5. Treatment
Centre for Eye Research Australia

��The Economic Impact of Primary Open Angle Glaucoma - A Dynamic Economic Model
5. Treatment
TABLE 5.3: NUMBER Of MEDICATIONS TAKEN IN COMBINATION
Source Number medications in combination
OHTS(Kassetal,2002) SeeBox4foradescriptionoftheOHTS.At60months,inthe medicationgroup,39.7%ofparticipantswerereceivingtwoor moremedicationsand9.3%werereceivingthreeormore.
WeinandandAlthen(2006) Nonrandomisedprospectivenon-comparativeclinicalstudyof 52eyesof52patientsoftheeffectofSLTasanadjunctivetreat mentoneyeswithadvancedglaucomatousdamage.Patients wereincludediftheyhaduncontrolledIOP(≥20mmHg)onmaxi mumtolerablemedicaltherapy,orhadfailedpreviousALT. Patientshadalonghistoryofglaucomatreatmentandweresent forfurthertreatmenttothehospitalandsomaybeconsidered tohaveglaucomathatismoredifficulttocontrol.Theaverage numberofhypotensivemedicationstakenincombinationprior totreatmentwas2.5.
Damjietal,(2006)(a) InCanada,176eyesof152patientswereincludedina randomisedclinicaltrialcomparingALTandSLTintermsoftheir abilitytolowerIOPinpatientswithOAG.Patientsweregiven laseriftheyhaduncontrolledIOP(≥16mmHg),wereon maximummedicaltherapyorhadfailedprevious180/360ALT (>6monthspreviously),wereover18andhadtwosightedeyes. PatientswereexcludediftheyhadadvancedVFdefectwithin 10degreesoffixation,orhadpreviousglaucomasurgery. Themeannumberofmedicationspretreatmentwas2.4for ALTpatientsand2.6forSLTpatients.
Fontanaetal,(2006)(a) 292eyesand225patientswereincludedinaretrospective cohortstudyofphakicpatientswithOAGwhounderwentinitial trabeculectomywithadjunctiveMitomycinC(MMC)between August1997andDecember2003.Eyesthathadundergone previoussurgeryforcataractorglaucomawereexcluded. 97%ofeyeswerereceivingmedicaltreatmentbeforesurgery withameanof2.7medications(SD±1.0).
Ehrnroothetal,(2002)(a) InFinland,aretrospectiveevaluationofpatientsundergoing trabeculectomywithoutantimetaboliteswasconducted. IndicationsfortrabeculectomywereuncontrolledIOPdespite maximaltoleratedmedicationanddiseaseprogression.Priorto surgery,POAGpatientshadbeenonglaucomamedicationfora mean(±SD)of7.8(±5.6)years.Around2%ofpatientswereon zeromedication,12-15%ononemedication,55-64%ontwo medications,20-29%onthreemedications.Around55%were onoralmedications.
(a)Theremaybeselectionbiasinthesestudiesandthereforeahigherrateofprescribing.
5.1.1: COMPLIANCE AND PERSISTENCE WITh MEDICATIONS
Thedefinitionsofadherence,complianceandpersistenceinthissectionaredrawnfromthejournalarticlesthemselves.Definitionsandmethodsofmeasurementdifferacrossstudies.
Adequate treatment of glaucoma and preservation of vision requires adherence to therapy (Schwartz,2005;Chen,2003),althoughtheexactrelationshipbetweencomplianceand
�� Tu n n e l V i s i o nCentre for Eye Research Australia
progressionofdiseasehasnotbeenquantified(Olthoffetal,2005).Studiesindicate relatively poor adherence to therapy in one-third or more of patients,dependingonthemedicationsused(AAO,2005:13).
• Nordstrometal,(2005)calculatedthedurationofcontinuoustreatmentwiththeinitiallyprescribedmedication(definedinthearticleaspersistence)andtheprevalenceofuseoftheinitialmedicationatvarioustimepoints(definedinthearticleasadherence)fromhealthinsuranceclaimsdata.Claimsfrom3,623peoplewithnewlydiagnosedglaucomaandfrom1,677glaucomasuspectswereexamined.Fourdrugclasseswereincluded:beta-blockers,alpha-agonists,carbonicanhydraseinhibitors,andprostaglandinanalogs.Nearlyhalfofthosewhohadfilledaglaucomaprescriptiondiscontinuedalltopicalhypotensivetherapywithinsixmonths,and37%hadrefilledtheirinitialmedicationat3yearsafterthefirstdispensing.Prostaglandinswereassociatedwithbetterpersistenceandbetteradherencethanotherdrugs.Patientswithdiagnosedglaucomaweremorelikelytoadheretotreatmentthanglaucomasuspects.
• Schwartz(2005)conductedaliteraturereviewofresearchpublishedbetween1980andOctober2004oncomplianceandpersistencewithtreatmentbypatientswithPOAGorOHT.Compliancewasdefinedastheextenttowhichpatients’behaviourscorrespondedwithprovidersrecommendations.Schwartz(2005)foundthatnon-complianceratesof25%werecommonlyreported.Usingelectronicmonitoring(themostaccuratemethodofestimatingpatientcompliance),non-complianceratesrangedfrom14%to24%.Persistenceover12months(thetotaltimeontherapy)wasaround25%(rangingfrom20%to64%).
• Olthoffetal,(2005)conductedaliteraturereviewofarticlespublishedfrom1970toFebruary2004oncompliancewithglaucomamedications.(POAGaswellasothertypesofglaucomawereincluded.)Compliancewasdefinedasthedegreeofcorrespondencebetweentheprescribedtreatmentregimeandthepatient’sactualdosinghistory.Theproportionofpatientswhodeviatedfromtheirprescribedmedicationregimenrangedfrom5%to80%(thefigureof5%camefromastudyonPOAGpatients).30%ofpatientsforwhomtimololwasprescribeddeviatedfromtheirtreatmentregimen.
• Tsai(2006)undertookaliteraturereviewofarticlespublishedonMedlineduringthe18monthstoOctober2005andfoundthatnon-adherence(extentofdisagreementbetweentheprescribedmedicalregimenandactualpatientpractice)tomedicinalregimensinpatientswithglaucomavariedfrom24%to59%.
• Reardonetal,(2004)examinedpatientpersistenceusingrecordsfromamanagedcaredatabaseintheUS.PatientshadinitiatedmonotherapybetweenJuly1996andJune2002withbetaxolol,bimatoprost,brimonidine,dorzolamide,latanoprost,timolol,ortravoprost.Thenumberofpatientsincludedintheanalysiswas28,741.Discontinuationwasdefinedasnofurtherindexdrug(monotherapydrug)refill90days(ifdispensedonebottle)or180days(ifdispensedtwobottles)afterthelastprescriptionfill.Persistencewasdefinedasthenumberofdaysfromdispensedatetodiscontinuationdateorchangeofmedicationdate(whicheverisearlier).Latanoprostwasthereferencegroupagainstwhichdiscontinuationdateswerecompared.At12months,33%ofpatientswerepersistingwithlatanoprost(hadnotdiscontinued);and19%ofthosetreatedwithotherocularhypotensiveshadnotdiscontinued.Thedifferencebetweenlatanoprostandotheragentswassignificant(p<0.001).Inthepopulation(28,741patientsonmonotherapy),thethreemostfrequentlyprescribeddrugsweretimolol(43%),latanoprost(33%)andbrimonidine(18%).Relativelyfewpatientswereprescribedeithertravoprostorbimatoprost(1%ofpatientsforeach).
5. Treatment
Ongoing adherence with daily glaucoma
drops is a major problem.
Centre for Eye Research Australia
��The Economic Impact of Primary Open Angle Glaucoma - A Dynamic Economic Model
5. Treatment
Meta-analysisisnotusefulinsynthesisingtheresultsofthesestudiesbecauseofthedifferencesindefinitionsandmethodsofmeasurement.However,compliance rates of 75% seem a reasonable assumption, with persistence rates of 33% for latanoprost and 19% for other medications at 12 months(basedonReardonetal,2004).ThemedicationcostestimatesusedinthemodellingarecalculatedbasedonthecostsofdispensedmedicationsforPOAGinAustralia,andsoimplicitlyincludepersistence.
�.�:LASERTREATMENT
ThosewhoseIOPisnotcontrolledonmedicationareconsideredforlasertherapy.Twotypesoflasertherapyareavailable,forthereductionofIOP,butvaryinusagedependingonthestateinwhichglaucomahasprogressed.
• Lasertrabeculoplastyisthemainformoftreatment.
• LaserdiodecyclophotocoagulationisrarelyusedinPOAGandnotthereforeincludedinmodelling.
LASER TRABECULOPLASTY
Lasertrabeculoplastyaimsto improve outflow through the trabecular meshwork. Itisusuallyperformedundertopicalanesthesia.Therearetwotypesoftrabeculoplasty.Argon Laser Trabeculoplasty (ALT)wasdevelopedseveraldecadesago.ItwasfollowedmorerecentlybythedevelopmentofSelective Laser Trabeculoplasty (SLT). WhilethereissomeevidencethattherearefewersideeffectswithSLT(LatinaanddeLeon2005),thisremainsunproveninarandomisedclinicaltrialsetting.Forthepurposesofthisstudy,theefficacyofALTandSLTareconsideredthesame.StudieshaveshownequivalencyofSLTtoALTinpatientsinwhommaximalmedicaltherapyhasbeenunsuccessful(McIlraithetal,2006,Juzychetal,2004andDamjietal,2006).
Thelaseriseitherappliedtoallofthetrabecularmeshworkatonce(360degrees)ortojusthalf(180degrees).Thereisnoconsensusaboutwhichapproachispreferable,butwhere180degreelaserisundertakenfirstandglaucomaremainsuncontrolled,afurther180degreetreatmentwillbeconductedonthepreviouslyuntreatedsegmentofthetrabecularmeshwork.
Thepressureloweringeffectoflaserdiminishesovertime(Feldmanetal,1991).Repeatlaser(anyALTofthetrabecularmeshworkafteracomplete360degreeALT(Feldmanetal,1991))iscontroversial.RepeatALThasamarkedlyreducedeffectcomparedwithinitiallaser11andisassociatedwithanincreaseintheriskofanadverseriseinIOP.
DatafromtheMedicareBenefitsSchedule(MBS)forlasertrabeculoplastyarepresentedinFigure5.2.ThedataareforMBSitemnumber42782(definedaseachtreatmenttooneeyetoamaximumoffourtreatmentstothateyeinatwoyearsperiod)12.TheMBSfeeforitemnumber42782fromthe1November2006ScheduleisA$398.65.
11Forexample,Feldmanetal,(1991)concludedthatrepeatALTwasnotgenerallyeffectiveforthelongtermcontrolofOAG.Intheirstudy,repeatALTwassuccessfulin21%ofeyesatoneyear,and5%ofeyesat48months.Richteretal,(1987)foundthatIOPcontrolwassuccessfulin33%ofeyesoneyearafterrepeatALTandinonly14%ofeyesafter1.75years.Bothstudiesdefinedsuccessasa3mmHgorgreaterdecreaseinIOPtolessthan22mmHgandnofurthersurgicalintervention.
12MBSitemnumber42783(Lasertrabeculoplasty–eachtreatmentto1eyewhereitcanbedemonstratedthata5thorsubsequenttreatmenttothateye(includinganytreatmentstowhichitem42782applies)isindicatedina2yearperiod)isextremelyrarelyused—oneprocedurerecordedagainstthisitemnumberin2002,threeproceduresrecordedin2003andnegativeoneprocedurein2005.Otherwisezeroproceduresfortherestoftheperiodbetween1994and2006.
Laser trabeculoplasty aims to improve outflow through the trabecular meshwork.

�0 Tu n n e l V i s i o nCentre for Eye Research Australia
TheMedicaredatainFigure5.2includeonlyprocedurescoveredbyMedicare—ie.theyexcludeproceduresundertakenonpublicpatients(bothadmittedandnon-admitted)inpublichospitals(fundedbythehospital)andproceduresoncompensablepatients(forexample,fundedbyworkerscompensationorganisations).13However,ingeneral,trabeculoplastiesareundertakenatadoctor’spracticeandadmittedpatienthospitalproceduresrepresentanexception.Hence,forthemodelling,theMedicaredataareassumedtoadequatelyrepresentthenumberoftrabeculoplastyproceduresundertakeninAustralia.
ThenumberofMBSproceduresfellfrom16,809in1996,to6,201in2003,beforeincreasingagainto11,113in2006.Thisprobablyreflectstosomeextentgreateruseofprostaglandinanalogueswhichreplacedordelayedtrabeculoplastyprocedures.ItmayalsoreflecttheincreaseduseofSLToverALT.
Itisestimatedthathalfthepeoplethatreceiveatrabeculoplastyprocedurehavetwo180degreetreatmentswhiletheremaininghalfreceiveone(personalcommunication,ProfessorJonathanCrowston15thMay2007).Thecostsoftrabeculoplastyhavebeenadjustedupwardsby1.5inthemodelaccordingly(seeSection6.3.2).
fIGURE 5.2: MBS TRABECULOPLASTY PROCEDURES, 1994-2005
Source:MedicareAustraliastatistics,MBSitemnumber42782(Lasertrabeculoplasty-eachtreatmentto1eye,toamaximumof4treatmentstothateyeina2yearperiod).
13TheAustralianHealthCareAgreementsspecifythataneligiblepatientpresentingatapublichospitaloutpatientdepartmentwillbetreatedfreeofchargeasapublicpatientunless:(a)thereisathirdpartypaymentarrangementwiththehospitalorQueenslandtopayforsuchservices;or(b)thepatienthasbeenreferredtoanamedmedicalspecialistwhoisexercisingarightofprivatepracticeandthepatientchoosestobetreatedasaprivatepatient.AustralianHealthCareAgreementbetweentheCommonwealthofAustraliaandtheStateofQueensland,2003-08,http://www.health.qld.gov.au/publications/aust_hlth_care_agreement/Queensland.pdfaccessed7May2007.
5. Treatment
0
2,000
4,000
6,000
8,000
10,000
12,000
14,000
16,000
18,000
1994 1995 1996 1997 1998 1999 2000 2001 2002 2003 2004 2005 2006
Year
Nu
mb
er
of
pro
ced
ure
s
Centre for Eye Research Australia

��The Economic Impact of Primary Open Angle Glaucoma - A Dynamic Economic Model
LASER DIODE CYCLOPhOTOCOAGULATION
Cyclodiodelaserlightisdirectedtopassthroughthesurfaceoftheeyeandbehindtheiristoaffecttheciliarybodyinorderto reduce the production of aqueous humourandthereforedecreasetheIOPwithintheeye.Thistechniqueisusedforrefractorycasesthatdon’trespondtoconventionaltreatment.Notmanyoftheseproceduresareundertakeneachyear.Forthefinancialyears2004-05and2005-06,MedicareAustraliadatasuggestthat,respectively,137and145cyclodestructiveproceduresforintractableglaucomawereperformed(itemnumbers42770and42771).TheseproceduresarerarelyusedforPOAGandsonotincludedinthemodel.
�.�:CONVENTIONALSURGERY(TRABECULECTOMY)
If medical and laser therapies fail, surgery is performed. Trabeculectomyisperformedunderlocalorgeneralanaesthesiaandcreatesanalternativepathwayfortheoutflowofaqueoushumour.Atinyportionofthetrabecularmeshworkorsurroundingtissueisremoved,andasmallflapinsertedtoproduceapassagewayfromtheanteriorchamberoftheeyetoa“pocket”betweentheconjunctivaandsclera.Asmallblister(filteringbleb)isformedundertheupperlid,calledatrabeculectomybleb.
fIGURE 5.3: TRABECULECTOMY14
Insomecases,scartissuedevelopsandpreventstheoperationfromworking.Incasesthoughttobeatincreasedriskofscarformation,thesurgeonmaygivethepatientantifibrotics-drugstoinhibitscaringsuchas5-fluoracil or MMC to reduce scarring andimprovetheoutcomesofsurgery.
Aswithtrabeculoplasty,itisdifficulttoestimatethetotalnumberofproceduresundertakenforPOAGeachyear.Medicaredatadonotincludeproceduresundertakenonpublicpatientsinpublichospitals
(admittedornon-admitted).Hospitaldataincludebothpublicandprivateadmittedpatientsarethereforethemorereliableinthecaseoftrabeculectomy.
ThetotalnumberoftrabeculectomyproceduresforpeoplewithPOAGduringtheperiodof200405hasbeensourcedfromtheAustralianInstituteofHealthandWelfare(AIHW)asaspecialdatarequest.
• ThetotalnumberofproceduresforICD-10-codesH401andH409(whichrelatetopatientswithPOAGandUnspecifiedGlaucoma)havebeenincludedinthemodelling.Fortheperiod200405,1,683trabeculectomyprocedureswereperformed.Ofthese,583procedureswereperformedinapublichospitalwhile1,060wereperformedinaprivatehospital.
14InternationalGlaucomaAssociationwebsite,accessed10thMay2007http://www.glaucoma-association.com/nqcontent.cfm?a_id=382&=fromcfc&tt=article&lang=en&site_id=176
5. Treatment

�� Tu n n e l V i s i o nCentre for Eye Research Australia
Somepatientshavemorethanonetrabeculectomy.ItisnotpossibletodeterminetheextentofrepeatsurgeryfromtheAIHWdata.TheMBSdatasuggestthataround1,435trabeculectomyprocedureswereundertakenin2004-05,with212repeatoperationsinthesameyear(Table5.4)andwhile1302filteringoperationswereundertakenin2005-06,therewerealso230repeatoperations.Repeattrabeculectomieswerealsohighercost(Table5.4).Thecostsoftrabeculectomyinthemodelhavebeenadjustedupwardsaccordinglybasedonthesefiguresbysummingthetwoyearstofindthatrepeatsmadeup16%offilteringoperationsandcost25%morewhichsuggeststhecostoftrabeculectomiesneedstobeadjustedupwardsbyaround20%(seeSection6.3.2).
TABLE 5.4: TRABECULECTOMY — MBS SERVICES PROCESSED BY JURISDICTION BY YEAR
(Anaes.)Meanstheserviceattractsananaesthetic.(Assist.)Medicarebenefitsarepayableunderitem51300forassistancerenderedatanyoperationidentifiedbytheword“Assist.”forwhichthefeedoesnotexceedthefeethresholdspecifiedintheitemdescriptor,orataseriesorcombinationofoperationsidentifiedbytheword“Assist.”forwhichtheaggregateSchedulefeethresholdspecifiedintheitemdescriptorhasnotbeenexceeded.
Source:MedicareAustraliastatistics,FeesbasedonMBS1November2006.
AtimeserieswasnotavailablefromtheAIHW,butMedicaredatasuggestthatthenumberofinitialMBStrabeculectomyprocedures(item42746)hasfallenfrom3,996in1996to1,246in2006(Figure5.4).Thisprobablyresultsfromtheflowoneffectoftheintroductionofprostaglandinanalogueeyedrops(discussedearlier),whichhaveimprovedIOPcontrolanddelayedtheneedfordownstreamtreatments.
fIGURE 5.4: MBS TOTAL Of TRABECULECTOMY PROCEDURES, 1994-2005
Source:MedicareAustraliastatistics,MBSitemnos.42746(Filteringoperationforglaucoma)and42749(Filteringoperationforglaucoma,wherepreviousfilteringoperationhasbeenperformed).
Decreasing rates of surgery reflect better
medical treatment.
Economic impact of primary open angle glaucoma Commercial-in-Confidence
38
trabeculectomy procedures were undertaken in 2004-05, with 212 repeat operations in the
same year (Table 5-4) and while 1302 filtering operations were undertaken in 2005-06, there
were also 230 repeat operations. Repeat trabeculectomies were also higher cost (Table 5-4).
The costs of trabeculectomy in the model have been adjusted upwards accordingly based onthese figures by summing the two years to find that repeats made up 16% of filtering
operations and cost 25% more which suggests the cost of trabeculectomies needs to be
adjusted upwards by around 20% (see Section 6.3.2).
TABLE 5-4: TRABECULECTOMY — MBS SERVICES PROCESSED BY JURISDICTION BY YEAR
Item No. Description Fee ($) Year NSW VIC QLD SA WA Tas ACT NT Total
2004-05 559 337 234 110 118 57 20 0 1,435
2005-06 513 311 232 81 117 36 9 3 1,302
2004-05 77 62 36 17 10 4 5 1 212
2005-06 77 62 49 17 17 6 1 1 230
42749
Filtering operation for glaucoma, where
previous filtering operation has been
performed (Anaes.) (Assist.) 1056.55
42746Filtering operation for glaucoma (Anaes.)
(Assist.)843.85
(Anaes.) Means the service attracts an anaesthetic. (Assist.) Medicare benefits are payable under item 51300 forassistance rendered at any operation identified by the word "Assist." for which the fee does not exceed the fee
threshold specified in the item descriptor, or at a series or combination of operations identified by the word "Assist."for which the aggregate Schedule fee threshold specified in the item descriptor has not been exceeded.
Source: Medicare Australia statistics, Fees based on MBS 1 November 2006.
A time series was not available from the AIHW, but Medicare data suggest that the number of
initial MBS trabeculectomy procedures (item 42746) has fallen from 3,996 in 1996 to 1,246 in
2006 (Figure 5-4). This probably results from the flow on effect of the introduction of
prostaglandin analogue eye drops (discussed earlier), which have improved IOP control anddelayed the need for downstream treatments.
FIGURE 5-4: MBS TOTAL OF TRABECULECTOMY PROCEDURES, 1994-2005
0
500
1,000
1,500
2,000
2,500
3,000
3,500
4,000
4,500
1994 1995 1996 1997 1998 1999 2000 2001 2002 2003 2004 2005 2006
Year
Nu
mb
er
of
pro
ce
du
res
42746 42749
Source: Medicare Australia statistics, MBS item nos. 42746 (Filtering operation for glaucoma) and 42749 (Filtering
operation for glaucoma, where previous filtering operation has been performed).
5. Treatment
Centre for Eye Research Australia

��The Economic Impact of Primary Open Angle Glaucoma - A Dynamic Economic Model
5. Treatment
DRAINAGE IMPLANTS
Inpatientsforwhomtrabeculectomyislikelytofailbecauseofinflammationorscarring,adrainagedeviceisimplanted(calledaglaucomadrainagedevice)tocreateadrainagepathway.Variousdevicesexist(eg.Moltenovalves).DrainageimplantsarerarelyusedinPOAG,butaremorecommonlyusedinsecondaryglaucoma.
• DatafromtheAIHWhospitalmorbiditydatabasefor2004-05suggestthat136aqueousshuntinsertion15procedureswererecordedforglaucoma.
• Forthefinancialyears2004-05and2005-06,MedicareAustraliadatasuggestthat,respectively,57and70Moltenovalveinsertionswereperformed(itemnumber42752).Theseproceduresarerelativelyexpensive—theMBSfeeforthe1November2006was$1,182.75.
Sincetheyarerelativelyrareinprimaryopenangleglaucomapatients,theseproceduresarenotincludedinthemodel.
�.�:PREVALENCEESTIMATESFOREACHTREATMENTGROUP
Asnotedearlier,oncediagnosedwithPOAG,patientsgenerallyfollowastandardtreatmentprotocol.Theprotocolisindependentoftheseverityofthediseasestageatdiagnosis.Patientsusuallycommencewithmedicationswhethertheyhaveseverediseaseorearlystagedisease.
Initially,DismodIIwasusedtomodeltheprogressionfromonetreatmentphasetothenext,byusingthetotalnumberofpeoplenewlydiagnosedwithPOAGin2005astheincidencerateforthemedicationtreatmentphase,thetotalnumberoftrabeculoplastyproceduresastheindicatoroftreatmentfailureforthemedicationgroup,andthetotalnumberoftrabeculectomyproceduresasanindicatoroftreatmentfailureforthetrabeculoplastygroup(theoverallRRofmortalityof1.18–theweightedaverageRRofmortalityfromallprevalentseveritygroups–wasappliedinthemodellingforeachtreatmentphase).
Inthecaseoftrabeculoplasty,thetotalnumberofMBSproceduresneededtobescaleddowntoreflect‘first-time’procedures.Asnotedearlier,itisestimatedthathalfofthepeopleinthetrabeculoplastytreatmentphasereceivetwo180degreetreatmentswhiletheotherhalfreceiveone.Thetotalnumberoftrabeculoplastyprocedureswasscaleddownby1.5accordingly.
DismodIIwasalsoinitiallyusedtomodeltheremainingtreatmentphases(Table5.5)toensurethattheflowthrougheachphasewasinternallyvalidandreflectedthenumberofproceduresoccurringinpractice.
However,thesemodelledrateswerenotconsistentwiththeliteratureonfailureratesforlasertherapyandsurgery.Inparticular,anumberofstudiesoutlinedinTable5.7andTable5.8suggestedfailureratesforlaserandsurgerywereoftheorderof50%(withfailuredefinedasthepatientrequiringfurthertreatment).failure rates applied in the model are therefore:
• 50% per year for laser trabeculoplasty (consistent with Weinand and Althen 2006); and
• 50 % for trabeculectomy. While this is a very conservative estimate — higher than the literature — sensitivity analysis shows that it makes little difference to the results. Sensitivity analysis is presented in Section 9.3.3
15ICD10AMcode42752.

�� Tu n n e l V i s i o nCentre for Eye Research Australia
TABLE 5.5: INCIDENCE AND TREATMENT fAILURE RATE fOR EACh STAGE Of TREATMENT
fROM DISMOD II.
Age Group Incidence of Medication Medication Trabeculoplasty Trabeculectomy (% of population in each failure rates (% of failure rates failure rates age group) those on medication
40-44 0.02 4.3% 3.2% 2.0%
45-49 0.05 4.3% 3.2% 2.0%
50-54 0.07 4.3% 3.2% 2.0%
55-59 0.10 4.3% 3.2% 2.0%
60-64 0.12 4.3% 3.2% 2.0%
65-69 0.14 4.3% 3.2% 2.0%
70-74 0.17 4.3% 3.2% 2.0%
75-79 0.22 4.3% 3.2% 2.0%
80-84 0.26 4.3% 3.2% 2.0%
85-89 0.32 4.3% 3.2% 2.0%
90+ 0.35 4.3% 3.2% 2.0%
�.�:TREATMENTEFFICACY
ForthereasonsoutlinedearlierinSection4.5,manyofthestudiesoftreatmentefficacy(ie.theimpactoftreatmentcomparedwithalternativesincludingnotreatment)aredifficulttoapplytoacosteffectivenessstudybecauseprogressionisnotdefinedconsistentlyandbecauseofthenatureoftheendpointsselected.ThemajorclinicaltrialsoftreatmentefficacyareoutlinedinBox4.
Box�:Majorclinicaltrialsofglaucomatreatmentefficacy
TheOcular hypertension Treatment Study (OhTS) intheUSAexaminedpatientswho,atentrytothetrial,hadOHT,butnoevidenceofglaucomatousdamage.Enrolmentendedin1996.1,636participantswererandomisedeithertoobservation,ortoreceivetreatmentwithcommerciallyavailabletopicalhypotensivemedicationsusedsinglyorincombination.TheaimoftreatmentwastoachieveatargetIOPof24mmHgorlessandaminimum20%reductioninIOP.ProgressionwasdefinedaseitherthedevelopmentofaVFdefectordeteriorationintheopticdisc.
TheEuropean Glaucoma Prevention Study (EGPS) enrolled1,081patientsbetween1997and1999inBelgium,Germany,ItalyandPortugal.ParticipantshadOHT,butnormalVFandopticdisc.Patientswererandomisedtotreatmentwithdorzolamide(topicalcarbonicanhydraseinhibitor)oraplacebo.Participantsandinvestigatorswerebothmasked.TheaimwastoreduceIOP,buttheprotocoldidnotspecifyatargetIOPreduction.EndpointswerechangesinVFand/ortheopticdisc.
AtentryintheCollaborative Normal Tension Glaucoma Study (CNTGS),145patientsfromspecialtycentresintheUSAhadnormalIOP,butopticdiscabnormalitiesandVFdefects.Participantswererandomlyassignedtotreatmentornotreatment.ProgressionwasbasedonachangeintheVForachangeintheopticnerveappearance.Inthetreatmentgroup,theaimwastoreduceeyepressureby30%in6monthsusingeyedrops,laserand/orfilteringsurgery.
5. Treatment
Centre for Eye Research Australia

��The Economic Impact of Primary Open Angle Glaucoma - A Dynamic Economic Model
5. Treatment
TheEarly Manifest Glaucoma Trial (EMGT)wasconductedinSweden,andincluded255participantsscreenedbetween1992and1997.Atentry,patientswerenewlydiagnosedwithVFdefects,butwerepreviouslyuntreated.PatientswithadvancedVFdefectswereexcludedfromentry.Participantswererandomisedtoeither360olasertreatment(ALT)plusbetaxololhydrochloride(topicalbetablocker)ornoinitialtreatment.Theaimwastoevaluatetheeffectofimmediatetreatmentcomparedwithnoinitialtreatmentorlatertreatment.ProgressionwasbasedonnewVFdefectoropticdiscdeteriorationorboth.
TheCollaborative Initial Glaucoma Treatment Study (CIGTS)wasconductedintheUSA.Enrolmenttookplacebetween1993and1997.607patientswithnewlydiagnosedglaucoma,withlimitedornopriortreatment,IOPof20mmHgorgreaterandevidenceofopticnervedamageand/orVFLinoneorbotheyeswereenrolled.Participantswererandomisedtoinitialtrabeculectomy(withorwithout5-fluorouacil)ortopicalmedication(topicalbeta-blocker,followedbyanalternatesingletopicaltherapeuticagent,dualtopicaltherapy,tripletopicaltherapy,analternatecombinationoftripletopicaltherapyandoptionaladditionaltopicalandororalmedications).Furthertreatment,ifconsiderednecessary,followedstandardtreatmentpatterns(variouscombinationsofALT,medicationsandtrabeculectomy).ProgressionwasbasedonchangesinVF.
TheGlaucoma Laser Trial (GLT)andtheGlaucoma Laser Trial follow Up (GLTfU) StudywereconductedintheUSA.TheGLT(271participants)endedin1989,butaproportionofGLTpatients(203participants)werethenobservedaspartoftheGLTFUfrom1990to1993.ParticipantsintheGLTwerenewlydiagnosedwithPOAGandhadanIOPofatleast22mmHgineacheyeplusoneof:aVFdefect,orcertainOHTandcuptodiscratiocharacteristics.OneeyeofeachpatientwasrandomisedtoALTandtheothereyetotimolol.EndpointswereVFandIOP.
TheAdvanced Glaucoma Intervention Study (AGIS)conductedintheUSAfocusedonthosewhosediseasewasnolongercontrolledbymedication.Between1988and1992,591patientswereenrolled.Atentry,patientshadconsistentlyelevatedIOP,opticdiscrimdeteriorationandaVFdefectscorebasedontheAGISgradingsystemofbetween1and1616.Patientsweregivenadifferentsequenceofinterventionsineacheye—inoneeye,thesequencewasALT,trabeculectomy,trabeculectomy;intheothereye,thesequencewastrabeculectomy,ALT,trabeculectomy.ThegoalwastoreduceIOPtolessthan18mmHg.TheprimaryoutcomevariableintheAGISwastheaveragepercentofeyeswithadecreaseofvision(eitherVForVA).
OtherstudiesfocussinginparticularontheefficacyoflasertreatmentandtrabeculectomyadministeredtopatientsfollowingfailureofmaximumtolerablemedicationtocontrolthediseasegenerallyfocusontheimpactoftreatmentonIOPandtheneedforadditionalintervention.VeryfewmeasuretheeffectoftreatmentonVF.Thestudieshavedifferentendpointsanddefineprogressiondifferently.Somearenotbasedonintenttotreat.SomeexamplesofstudiesoftheefficacyoftrabeculoplastyareoutlinedinTable5.7andexamplesofstudiesoftheefficacyoftrabeculectomyareoutlinedinTable5.8.
16AGISVFdefectscoresrangefrom0(nodefect)to20(advancedglaucoma).Iftheeyehasinsufficientvisionforapatienttocountfingersat30cm,theVFdefectscoreisrecordedas20.
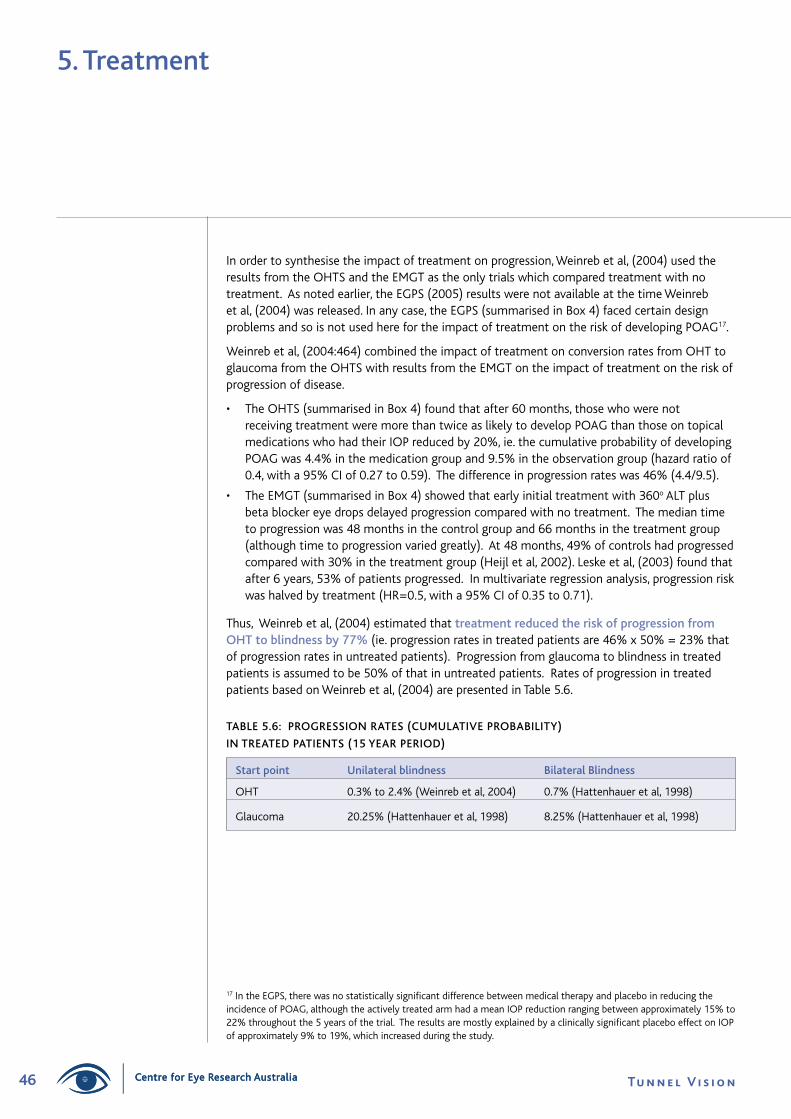
�� Tu n n e l V i s i o nCentre for Eye Research Australia
Inordertosynthesisetheimpactoftreatmentonprogression,Weinrebetal,(2004)usedtheresultsfromtheOHTSandtheEMGTastheonlytrialswhichcomparedtreatmentwithnotreatment.Asnotedearlier,theEGPS(2005)resultswerenotavailableatthetimeWeinrebetal,(2004)wasreleased.Inanycase,theEGPS(summarisedinBox4)facedcertaindesignproblemsandsoisnotusedherefortheimpactoftreatmentontheriskofdevelopingPOAG17.
Weinrebetal,(2004:464)combinedtheimpactoftreatmentonconversionratesfromOHTtoglaucomafromtheOHTSwithresultsfromtheEMGTontheimpactoftreatmentontheriskofprogressionofdisease.
• TheOHTS(summarisedinBox4)foundthatafter60months,thosewhowerenotreceivingtreatmentweremorethantwiceaslikelytodevelopPOAGthanthoseontopicalmedicationswhohadtheirIOPreducedby20%,ie.thecumulativeprobabilityofdevelopingPOAGwas4.4%inthemedicationgroupand9.5%intheobservationgroup(hazardratioof0.4,witha95%CIof0.27to0.59).Thedifferenceinprogressionrateswas46%(4.4/9.5).
• TheEMGT(summarisedinBox4)showedthatearlyinitialtreatmentwith360oALTplusbetablockereyedropsdelayedprogressioncomparedwithnotreatment.Themediantimetoprogressionwas48monthsinthecontrolgroupand66monthsinthetreatmentgroup(althoughtimetoprogressionvariedgreatly).At48months,49%ofcontrolshadprogressedcomparedwith30%inthetreatmentgroup(Heijletal,2002).Leskeetal,(2003)foundthatafter6years,53%ofpatientsprogressed.Inmultivariateregressionanalysis,progressionriskwashalvedbytreatment(HR=0.5,witha95%CIof0.35to0.71).
Thus,Weinrebetal,(2004)estimatedthattreatment reduced the risk of progression from OhT to blindness by 77%(ie.progressionratesintreatedpatientsare46%x50%=23%thatofprogressionratesinuntreatedpatients).Progressionfromglaucomatoblindnessintreatedpatientsisassumedtobe50%ofthatinuntreatedpatients.RatesofprogressionintreatedpatientsbasedonWeinrebetal,(2004)arepresentedinTable5.6.
TABLE 5.6: PROGRESSION RATES (CUMULATIVE PROBABILITY)
IN TREATED PATIENTS (15 YEAR PERIOD)
Start point Unilateral blindness Bilateral Blindness
OHT 0.3%to2.4%(Weinrebetal,2004) 0.7%(Hattenhaueretal,1998)
Glaucoma 20.25%(Hattenhaueretal,1998) 8.25%(Hattenhaueretal,1998)
17IntheEGPS,therewasnostatisticallysignificantdifferencebetweenmedicaltherapyandplaceboinreducingtheincidenceofPOAG,althoughtheactivelytreatedarmhadameanIOPreductionrangingbetweenapproximately15%to22%throughoutthe5yearsofthetrial.TheresultsaremostlyexplainedbyaclinicallysignificantplaceboeffectonIOPofapproximately9%to19%,whichincreasedduringthestudy.
5. Treatment
Centre for Eye Research Australia

��The Economic Impact of Primary Open Angle Glaucoma - A Dynamic Economic Model
TAB
LE 5
.7:
STU
DIE
S O
f T
hE
EffI
CA
CY
Of
LASE
R T
REA
TM
ENT
So
urce
A
ppro
ach
Defi
niti
on o
f pr
ogre
ssio
n O
utco
me
Gla
ucom
aLa
serT
rial
Rese
arch
Gro
up(
1995
)
Wei
nand
and
Alt
hen
(200
6)
Dam
jiet
al,
(200
6)
Juzy
che
tal
,(20
04)
GLT
=2
71n
ewly
dia
gnos
edP
OA
Gp
atie
nts
wit
hno
his
tory
of
topi
calo
rsy
stem
ica
nti-
glau
com
am
edic
atio
nus
ew
ithi
nth
epr
evio
us6
mon
ths
wer
een
rolle
d19
841
987
and
then
rea
sses
sed
1989
.M
edia
nfo
llow
upw
as3
.5y
ears
.
The
GLT
follo
w-u
pst
udy
=2
03o
fth
eor
igin
alG
LT
pati
ents
con
tinu
eda
ndw
ere
reas
sess
ed1
990-
1993
.M
edia
nfo
llow
-up
was
7y
ears
The
aim
was
to
com
pare
ALT
(2
1800
trea
tmen
ts
spac
ed4
wee
ksa
part
)w
ith
0.5%
tim
olol
as
first
lin
etr
eatm
ent
for
new
lyd
iagn
osed
PO
AG
.Ea
ch
pati
ent
rece
ived
bot
htr
eatm
ents
,one
to
each
eye
.
Non
-ran
dom
ised
,pro
spec
tive
,non
-com
para
tive
,cl
inic
alc
ase
serie
sof
52
eyes
of
52p
atie
nts.
Impa
cto
f18
0de
gree
SLT
as
adju
ncti
vet
reat
men
ton
eye
sw
ith
adva
nced
gla
ucom
atou
sda
mag
e.
Rand
omis
edc
linic
alt
rial.
Prim
ary
outc
ome
was
th
eIO
Plo
wer
ing
effe
cto
fSL
Tco
mpa
red
wit
hA
LT
at1
2m
onth
s.C
ompa
red
180
degr
eeA
LTa
ndS
LT
int
erm
sof
IOP
low
erin
gin
pat
ient
sw
ith
OA
G.
Pati
ents
rec
eive
dla
ser
trea
tmen
tif
they
had
un
cont
rolle
dIO
P,w
ere
onm
axim
alm
edic
al
ther
apy
orh
adfa
iled
prev
ious
ALT
.
Retr
ospe
ctiv
e(n
onra
ndom
ised
)ch
art
revi
ew.
Com
pare
d18
0de
gree
ALT
wit
hSL
Tin
pat
ient
sw
ith
unco
ntro
lled
OA
G.
Mea
nch
ange
inIO
P,V
A,V
Fan
dop
tic
disc
wer
eas
sess
ed
byc
linic
ians
(su
bjec
tive
ass
essm
ent)
.Fi
elds
judg
ed
ques
tion
able
wer
eco
nsid
ered
unc
hang
ed.
IfIO
Pin
crea
sed
afte
rSL
Tan
dth
epa
tien
tre
quire
dfu
rthe
rtr
eatm
ent
(med
ical
,las
ero
rsu
rgic
al)
the
trea
tmen
tw
as
cons
ider
edt
oha
vefa
iled.
Succ
ess
defin
eda
sm
eeti
nga
llof
the
follo
win
gcr
iter
ia:
1)a
red
ucti
ono
f≥2
0%o
fpr
e-tr
eatm
ent
IOP
at
one
yea
rpo
stt
reat
men
t.
2)n
oad
diti
onal
med
icat
ions
nee
ded
over
bas
elin
e.
3)n
oad
diti
onal
gla
ucom
asu
rgic
alt
reat
men
tne
eded
.
Succ
ess
defin
eda
s:
(1)
IOP
redu
ctio
nof
3m
mH
gor
mor
ew
itho
uta
ddit
iona
lm
edic
atio
nso
rad
diti
onal
gla
ucom
asu
rger
yor
(2)
sam
eas
crit
erio
n(1
)bu
tth
eIO
Pre
duct
ion
was
20%
or
mor
eof
the
pre
tre
atm
ent
IOP.
Whi
let
hed
iffer
ence
sbe
twee
nA
LTa
ndm
edic
atio
nw
ere
not
larg
e,t
her
esul
tss
ugge
stt
hatA
LTis
at
leas
tas
ben
efici
ala
sst
arti
ngt
reat
men
tw
ith
tim
olol
.O
ver
the
cour
seo
fth
eG
LT
and
the
GLT
follo
w-u
pst
udy,
the
eye
str
eate
din
itia
llyw
ith
ALT
ha
dlo
wer
IOP,
bet
terV
Fan
dbe
tter
opt
icd
isk
stat
ust
han
thei
rfe
llow
eye
str
eate
din
itia
llyw
ith
topi
cm
edic
atio
n.
Kapl
anM
eier
sur
viva
lana
lysi
sre
veal
eda
one
yea
rsu
cces
sra
te
of6
0%,t
wo
year
suc
cess
rate
of
53%
,thr
eey
ear
succ
ess
rate
of
44%
and
four
yea
rsu
cces
sra
teo
f44
%.
The
prop
orti
ono
fey
est
hat
achi
eved
at
leas
t20
%lo
wer
ing
ofIO
Pou
tto
one
yea
rw
ass
imila
rbe
twee
nth
etw
ogr
oups
(5
9.7%
SLT
(n=
43)
and
60.3
%A
LT(n
=48
)).
At
one
year
aft
er
trea
tmen
t82
%o
fey
esin
the
SLT
gro
upw
ere
mai
ntai
ned
on
the
sam
enu
mbe
rof
med
icat
ions
and
18%
had
add
edo
ne
med
icat
ion.
Int
heA
LTg
roup
69%
of
eyes
rem
aine
don
the
sa
me
num
ber
ofm
edic
atio
nsa
nd2
9%r
equi
red
one
addi
tion
al
med
icat
ion.
In
the
ALT
gro
up,p
erip
hera
lant
erio
rsy
nech
iae
form
edin
1.2
%(
1/87
),A
LTt
reat
men
toc
curr
edw
ithi
non
eye
ar
in5
.7%
(5/
87)
SLT
trea
tmen
toc
curr
edw
ithi
non
eye
arin
4.6
%
(4/8
7)a
ndt
rabe
cule
ctom
yoc
curr
edw
ithi
non
eye
arin
8%
(7
)pa
tien
ts.I
nth
eSL
Tgr
oup
the
equi
vale
ntp
ropo
rtio
nsw
ere:
1.
1%(1
/89)
,3.4
%(3
/89)
6.7
%(6
/89)
and
9%
(8/8
9).
ALT
and
SLT
sim
ilarly
eff
ecti
vein
dec
reas
ing
IOP
ate
ach
follo
w-
upt
ime
com
pare
dw
ith
the
pre-
trea
tmen
tIO
P.S
LTs
ucce
ss
rate
sat
one
,thr
eea
ndfi
vey
ears
wer
e:6
8%,4
6%a
nd3
2%b
ycr
iter
ion
(1)
and
58%
,38%
and
31%
by
crit
erio
n(2
).Eq
uiva
lent
A
LTs
ucce
ssra
tes
wer
e54
%,3
0%a
nd3
1%b
ycr
iter
ion
(1)
and
46%
,23%
and
13%
by
crit
erio
n(2
).

�� Tu n n e l V i s i o nCentre for Eye Research Australia
TAB
LE 5
.7:
STU
DIE
S O
f T
hE
EffI
CA
CY
Of
LASE
R T
REA
TM
ENT
co
nti
nu
ed...
So
urce
A
ppro
ach
Defi
niti
on o
f pr
ogre
ssio
n O
utco
me
Shin
glet
one
tal
,(19
93)
Retr
ospe
ctiv
est
udy
in1
18e
yes
of9
3
pati
ents
of
360
degr
eeA
LT.
Clin
ical
crit
eria
for
succ
ess
incl
uded
no
prog
ress
ive
opti
cne
rve
dam
age
org
lauc
omat
ousV
FL,n
ola
ser
retr
eatm
ent
org
lauc
oma
surg
ical
inte
rven
tion
and
fina
lIO
Pof
less
th
ano
req
ualt
o19
mm
Hg
and
atle
ast
3mm
Hg
belo
wt
he
pre-
trea
tmen
tle
vel
The
prob
abili
tyo
fre
mai
ning
suc
cess
fulu
pto
ten
yea
rsw
as
32%
for
all9
3ey
es.C
umul
ativ
epr
obab
ility
of
succ
ess
was
77
%a
fter
one
yea
r,40
%a
fter
five
yea
rsa
nd3
2%a
fter
ten
ye
ars.
The
high
est
prob
abili
tyo
ffa
ilure
was
int
hefi
rst
year
w
ith
acu
mul
ativ
efa
ilure
rate
of
23%
.In
subs
eque
nty
ears
th
epr
obab
ility
of
failu
rew
asa
ppro
x5%
to
9%p
ery
ear.
Life
ta
ble
anal
ysis
of
the
60e
yes
wit
hPO
AG
dis
clos
eda
sim
ilar
prob
abili
tyo
fre
mai
ning
suc
cess
fulu
pto
ten
yea
rso
f31
%.
Age
or
prev
ious
IOP
did
not
sign
ifica
ntly
aff
ect
succ
ess
rate
s.Pr
obab
ility
suc
cess
giv
ens
urvi
valf
oro
ney
ear
was
64%
aft
er
five
year
san
d42
%a
fter
ten
yea
rs.I
fa
pati
ent
was
suc
cess
ful
atfi
vey
ears
,pro
babi
lity
ofr
emai
ning
suc
cess
fula
tte
nye
ars
was
65%
.
Spae
tha
ndB
aez
(199
2)Re
tros
pect
ive
reco
rdr
evie
wo
f10
9ey
eso
f78
pa
tien
ts.
ALT
was
em
ploy
eda
sa
subs
titu
tefo
rtr
abec
ulec
tom
y.E
ithe
r18
0de
gree
or
360
degr
ee
trea
tmen
tsw
ere
appl
ied.
ALT
was
con
side
red
asu
cces
sw
hen
nofi
ltra
tion
sur
gery
w
asr
equi
red
ora
failu
rew
hen
surg
ery
was
req
uire
d.Su
bseq
uent
sur
gery
bec
ame
nece
ssar
yin
32%
of
alle
yes
wit
hon
eye
aro
fALT
.By
five
year
s,65
%o
fal
leye
sha
dfa
iled
(ie.
35%
eye
sst
illc
onsi
dere
dsu
cces
sful
).Fo
rey
esw
ith
POA
G,
19.3
%o
fey
esfa
iled
(80%
suc
cess
)af
ter
one
year
,and
56.
7%
had
faile
dby
yea
rfiv
e(ie
.suc
cess
rate
at
five
year
sof
43.
3%).
Centre for Eye Research Australia

��The Economic Impact of Primary Open Angle Glaucoma - A Dynamic Economic Model
TAB
LE 5
.8:
SUC
CES
S R
AT
ES f
OR
TR
AB
ECU
LEC
TOM
Y
So
urce
A
ppro
ach
Defi
niti
on o
f Vf
prog
ress
ion
and
defi
niti
on o
f su
cces
s Su
cces
s ra
tes
Edm
unds
et
al,2
001
Surv
eyo
fop
htha
lmol
ogis
tsin
the
UK.
Mai
nre
ason
fo
rsu
rger
y:F
ailu
reo
fm
edic
atio
nto
con
trol
IOP
in
57.1
%c
ases
;VF
dete
riora
tion
in2
6.5%
of
case
s.Pr
ogre
ssiv
eop
tic
disc
cha
nges
,int
oler
ance
of
med
icat
ion
and
non-
com
plia
nce
wer
eal
sor
easo
ns
for
surg
ery.
145
4pa
tien
ts(
96%
whi
te)
(Clin
ical
ou
tcom
eda
tafo
rth
evi
sit
clos
est
too
ney
ear
follo
win
gsu
rger
yw
ere
avai
labl
efo
r12
40c
ases
—
85.
3%).
1298
had
PO
AG
Defi
niti
ono
fsu
cces
sof
sur
gery
was
defi
ned
asa
nIO
Pat
one
yea
rfo
llow
ing
trab
ecul
ecto
my
ofle
sst
han
two
third
sth
epr
eope
rati
veIO
P(a
sm
easu
red
whe
nlis
ting
th
epa
tien
tfo
rsu
rger
y).S
econ
dary
mea
sure
sof
suc
cess
w
ere
anIO
Ple
sst
han
21m
mH
ga
ndV
Fst
abili
tya
ton
eye
ar.Q
ualifi
eds
ucce
ssw
asif
the
pat
ient
was
on
post
op
anti
glau
com
am
edic
atio
n.
Afte
ron
eye
ar,u
nqua
lified
suc
cess
was
ach
ieve
din
66.
6%o
fca
ses
(823
cas
es).
Aq
ualifi
eds
ucce
ss(
incl
udin
gpa
tien
tso
nm
edic
atio
n)w
asa
chie
ved
in7
1%o
fca
ses
(878
).In
ter
ms
of
achi
evin
gan
IOP
<21
mm
Hg,
the
unq
ualifi
eds
ucce
ssra
tew
as
84%
and
the
qua
lified
suc
cess
rate
92%
.An
IOP
<16
mm
Hg
was
ach
ieve
din
54.
6%o
fca
ses.
Parc
Ce
tal
,200
1Re
tros
pect
ive
popu
lati
onb
ased
.Res
ults
rep
orte
dhe
refo
r49
pat
ient
sw
hou
nder
wen
tco
nven
tion
al
filtr
atio
npr
oced
ures
.
VF
scor
eda
ccor
ding
to
the
8st
age
Qui
gley
sca
le.
Succ
essf
ulc
ontr
olo
fIO
Pw
asc
onsi
dere
dIO
P<
21m
mH
gw
ith
orw
itho
uta
ntig
lauc
oma
med
icat
ion
ora
red
ucti
on
ofa
tle
ast
33%
ifp
reop
erat
ive
IOP
was
<21
mm
Hg.
The
succ
ess
rate
of
IOP
cont
rola
sca
lcul
ated
by
Kapl
anM
eier
an
alys
isw
as8
0%a
ton
eye
arp
ost-
oper
atio
n,6
4%a
tth
ree
year
spo
sto
pera
tion
.Kap
lan
Mei
era
naly
sis
show
edt
he
cum
ulat
ive
prob
abili
tyo
fbl
indn
ess18
was
22%
at
five
year
san
d46
%a
tte
nye
ars
post
-ope
rati
vea
nd5
4%p
roba
bilit
yof
sur
gery
at
15
year
saf
ter
filtr
atio
n.
Font
ana
He
tal
,200
6Re
tros
pect
ive
coho
rts
tudy
of
phak
icp
atie
nts
wit
hO
AG
who
und
erw
ent
init
ialt
rabe
cule
ctom
yw
ith
adju
ncti
veM
MC
.IO
Pde
emed
by
the
trea
ting
phy
sici
ant
obe
ass
ocia
ted
wit
ha
high
ris
kof
gla
ucom
apr
ogre
ssio
nan
dgl
auco
mat
ous
wor
seni
ngo
fth
eV
For
opt
icd
isc.
292
eye
s22
5pa
tien
ts(
73%
Cau
casi
an)
Crit
eria
for
succ
ess:
(A)
final
IOP≤
18m
mH
gan
don
eof
th
efo
llow
ing:
≥20
%r
educ
tion
of
IOP
ora
red
ucti
ono
f2
med
icat
ions
wit
hfin
alIO
Pre
quire
dto
be
less
tha
nor
equ
alt
oba
selin
eIO
Pif
base
line
IOP≤
18.
(B)
Fin
al
IOP≤
15a
ndo
neo
fth
efo
llow
ing:
≥25
%r
educ
tion
of
IOP
ora
red
ucti
ono
f2
med
icat
ions
wit
hfin
alIO
Pre
quire
dto
be
less
tha
nor
equ
alb
asel
ine
IOP
ifba
selin
eIO
P≤15
.(C
)Fi
nalI
OP≤
12a
ndo
neo
fth
efo
llow
ing:
≥30
%r
educ
tion
in
IOP
ora
red
ucti
ono
f2
med
icat
ions
wit
hfin
alIO
Pre
quire
dto
be
less
tha
nor
equ
alt
oba
selin
eIO
Pif
base
line
IOP≤
12.
Kapl
anM
eier
suc
cess
rate
sat
firs
tan
dth
irdy
ears
aft
erfo
llow
-up
:A8
5%(±
2%)
and
62%
(±4%
),B
84%
(±2%
)an
d56
%(±
4%).
C7
9%(±
2%)
and
45%
(±
4%)
O’B
rart
De
tal
,200
4Ra
ndom
ised
clin
ical
tria
lcom
parin
gtr
abec
ulec
tom
yw
ith
visc
ocan
alos
tom
y.
(Res
ults
for
trab
ecul
ecto
my
only
rep
orte
dhe
re).
Ant
imet
abol
ites
use
das
per
sta
ndar
dpr
acti
ce
for
pati
ents
at
high
ris
kof
dra
inag
efa
ilure
.U
ncon
trol
led
prim
ary
ors
econ
dary
OA
Go
nm
axim
ally
tol
erat
edm
edic
atio
n.5
0ey
es(
16e
yes
Cau
casi
an,2
9ey
esb
lack
),45
pat
ient
s
Succ
essf
uld
rain
age
defin
eda
san
IOP
of≤
21m
mH
gw
itho
uta
ntig
lauc
omat
ous
med
icat
ions
A
t12
mon
ths,
the
prop
orti
ono
fsu
cces
sful
eye
sw
as9
1%w
ith
trab
ecul
ecto
my.
At
the
last
follo
w-u
pvi
sit
(mea
n20
mon
ths)
co
mpl
ete
succ
ess
was
see
nin
68%
aft
ert
rabe
cule
ctom
y.
18D
efini
tion
of
blin
dnes
sus
edin
thi
sst
udy:
cor
rect
edV
Ao
f20
/200
or
wor
sea
ndo
rVF
cons
tric
tion
to
20d
egre
eso
rle
ssin
its
wid
est
diam
eter
.

�0 Tu n n e l V i s i o nCentre for Eye Research Australia
�.�:SIDEEFFECTS
5.6.1: MEDICATIONS
Topicalanti-glaucomamedications can result in an array of side effects,rangingfromminorimpactssuchaseye-lashelongationanddarkeningoftheiristomajorimpactssuchascardiovascularevents(Table5.9).
TABLE 5.9: MEDICATION SIDE EffECTS
Medication Side effect
Prostaglandinanalogues(prostamides) Browndiscolouringoftheiris,lengtheninganddarkeningof eyelashes,ocularirritationandredness,macularoedemaor iritisinsusceptiblepatients.
badrenergicblockers Ocularirritationanddryeyes.Contraindicatedinpatients withbradycardia,heartblock,heartfailure,asthmaor obstructiveairwaydisease.Canhavesubstantial cardiovascularandrespiratoryside-effects,especially intheelderly.
Alpha(a)2adrenergicagonists Redeyeandocularirritation,centralnervoussystem effectsandrespiratoryarrestinyoungchildren,allergic conjunctivitis,sedation,cautionadvisedinpatientswith cerebralorcoronaryinsufficiency,Raynaud’sdisease, posturalhypotension(dizzyspells),hepatic(liverfailure) orrenalimpairment.
Carbonicanhydraseinhibitors Topicalformshavefewsideeffects,howeveroralforms maycausetransientmyopia,nausea,diarrhoea,lossof appetiteandtaste,parasthesiae,lassitude,renalstones andhaematologicalproblems.
Cholinergicagonists Substantialocularside-effectsincludingblurringofvision duetothesmallpupilandinducedmyopia,ciliaryspasm leadingtoheadachesespeciallyinyoungerpatients. Cataractsandiris-lensadhesionsinthelong-term.
Prostaglandinandb-blockersarethemostfrequentlyusedantiglaucomamedicationsinAustralia.
• Thesideeffectprofileforprostaglandinmedicationsisrelativelyminor.Topicalprostaglandinsarerapidlybrokendowninthebloodstreamasaresult,systemicsideeffectsarerare.Ocularsideeffectscanincludeconjunctivalhyperemia,increasedirispigmentationandpigmentationoftheperiocularskinaswellaslengtheningoftheeyelashes.Becausetheyarerare,nosideeffectsforprostaglandinsareincludedinthemodelling.
• Moresignificantsideeffectsarepossibleforpatientstakingb-blockers.Twotypesoftopicalb-blockersarecommerciallyavailable,nonselective(timolol,levobunolol,metipranololandcarteolol)andcardioselective(betaxolol),(BrooksandGillies,1992).TheIOPloweringabilityofthenonselectiveb-blockersisgreaterthanthecardioselectivebblockers,providingagreatertreatmentefficacy,althoughthesideeffectprofilemaybemoresignificantinthenonselectivebblockermedicationgroup.Thesesideeffectsinclude:stinging,achingorrednessintheeyesafterusingdrops;dryeyesandforeignbodysensation(thefeelingofaforeignbodyintheeye);bradycardia(slowheartbeat);spasmsofthetubesleadingto
5. Treatment
Prostaglandin analogues are the
most frequently used anti glaucoma
medications in Australia.
Centre for Eye Research Australia

��The Economic Impact of Primary Open Angle Glaucoma - A Dynamic Economic Model
thelungs(bronchospasmorasthma);heartfailureduetothebuildupoffluid;depression;confusion;fatigue,dizzinessandinabilitytotolerateexercise;and/orreducedlibido.Bronchospasmcanexacerbateasthmaandchronicobstructivepulmonarydisease(COPD)whilebradycardiacanexacerbatecongestiveheartfailure19.Prolongeduseoftopicalb-blockershasalsobeenlinkedtodepression,moodalterations,memoryloss,hallucinations,decreasedlibidoaswellasimpotence.
Themostsignificantsideeffect(whichhasbeenincludedinthedynamicmodelling)associatedwithbblockersisCOPD.ApopulationbasedcohortstudyconductedintheUK,examiningwhethertopicalbblockersareassociatedwithexcessrespiratorydiseaseinelderlypatientsnotconsideredtobeatexcessrisk(Kirwanetal,2002)showedahigherriskofrespiratorydiseasethanwouldnormallybeexpected.Ahazardratiousedinthemodelof2.29(95%CI1.71to3.07)wasproducedforpeopletreatedwithbblockerstoreceiveafirst-timemedicaltreatmentforreversibleairwaysobstruction,althoughthisriskceasestobesignificantafterthefirstyearoftreatmentwithtopicalbblockers.TheriskofCOPDforapersonnotbeingtreatedwithtopicalbblockersisassumedtobeequaltotheprevalenceofCOPDinthegeneralpopulation.
TABLE 5.10: RISK Of COPD (% Of POPULATION), 2001
Age Males females Persons
0-4 0.00 0.00 0.00
5-14 0.00 0.00 0.00
15-24 0.05 0.01 0.03
25-34 0.44 0.22 0.33
35-44 1.15 0.57 0.86
45-54 2.61 1.06 1.84
55-64 5.71 2.08 3.92
65-74 10.42 3.61 6.91
75-84 14.22 5.26 9.01
85+ 16.01 6.37 9.35
AllAges 2.51 1.09 1.80
Source:AIHWspecialrequest.
ThecostofCOPDperpersonisbasedonAIHWdata,indexedto2005dollars(Table5.11).
19www.agingeye.net/glaucoma/glaucomadrugtreatment.php
5. Treatment
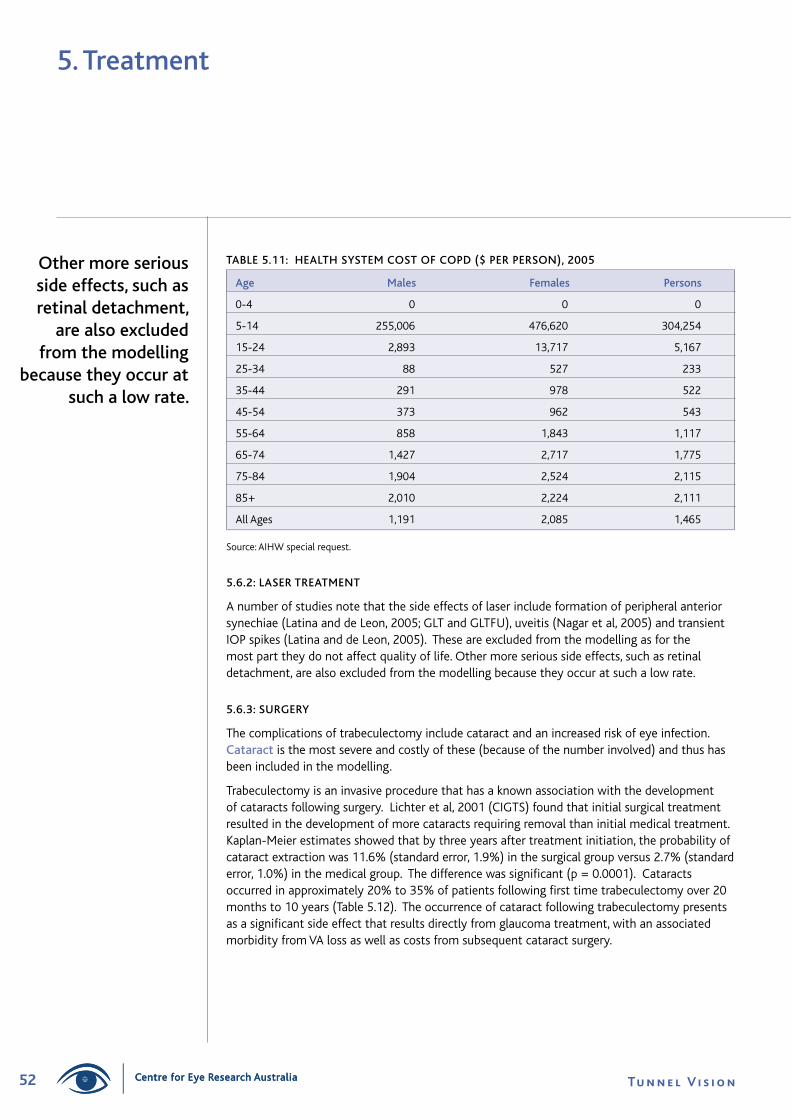
�� Tu n n e l V i s i o nCentre for Eye Research Australia
TABLE 5.11: hEALTh SYSTEM COST Of COPD ($ PER PERSON), 2005
Age Males females Persons
0-4 0 0 0
5-14 255,006 476,620 304,254
15-24 2,893 13,717 5,167
25-34 88 527 233
35-44 291 978 522
45-54 373 962 543
55-64 858 1,843 1,117
65-74 1,427 2,717 1,775
75-84 1,904 2,524 2,115
85+ 2,010 2,224 2,111
AllAges 1,191 2,085 1,465
Source:AIHWspecialrequest.
5.6.2: LASER TREATMENT
Anumberofstudiesnotethatthesideeffectsoflaserincludeformationofperipheralanteriorsynechiae(LatinaanddeLeon,2005;GLTandGLTFU),uveitis(Nagaretal,2005)andtransientIOPspikes(LatinaanddeLeon,2005).Theseareexcludedfromthemodellingasforthemostparttheydonotaffectqualityoflife.Othermoreserioussideeffects,suchasretinaldetachment,arealsoexcludedfromthemodellingbecausetheyoccuratsuchalowrate.
5.6.3: SURGERY
Thecomplicationsoftrabeculectomyincludecataractandanincreasedriskofeyeinfection.Cataractisthemostsevereandcostlyofthese(becauseofthenumberinvolved)andthushasbeenincludedinthemodelling.
Trabeculectomyisaninvasiveprocedurethathasaknownassociationwiththedevelopmentofcataractsfollowingsurgery.Lichteretal,2001(CIGTS)foundthatinitialsurgicaltreatmentresultedinthedevelopmentofmorecataractsrequiringremovalthaninitialmedicaltreatment.Kaplan-Meierestimatesshowedthatbythreeyearsaftertreatmentinitiation,theprobabilityofcataractextractionwas11.6%(standarderror,1.9%)inthesurgicalgroupversus2.7%(standarderror,1.0%)inthemedicalgroup.Thedifferencewassignificant(p=0.0001).Cataractsoccurredinapproximately20%to35%ofpatientsfollowingfirsttimetrabeculectomyover20monthsto10years(Table5.12).Theoccurrenceofcataractfollowingtrabeculectomypresentsasasignificantsideeffectthatresultsdirectlyfromglaucomatreatment,withanassociatedmorbidityfromVAlossaswellascostsfromsubsequentcataractsurgery.
Other more serious side effects, such as retinal detachment,
are also excluded from the modelling
because they occur at such a low rate.
5. Treatment
Centre for Eye Research Australia

��The Economic Impact of Primary Open Angle Glaucoma - A Dynamic Economic Model
5. Treatment
TABLE 5.12: TRABECULECTOMY SIDE-EffECTS
Source Incidence of Cataract following Trabeculectomy Timeframe
Edmundsetal, Cataractsdevelopedin20.2%ofeyesfollowingsurgery. *Cross-sectional 1999 survey
Parcetal,2001 Probabilityofcataractsurgeryatfiveyears(aftersurgery) 5,10and was15%andattenyearswas37%.Nostatistical 20years differencebetweenpatientsandtherestofthecohort at20years.
Fontanaetal, Cataractextractionoccurredin35%ofeyesfollowing 36months 2006 trabeculectomy.
AGIS TheRRofcataractfollowingfirsttrabeculectomywas 10years 1.78.WhencomplicationsoccurredinsurgerytheRR= 2.04andwhentheydidnotoccurRR=1.47.
Ehrnroothetal, Cataractsurgerywascompletedin35%ofeyes 3.5years 2002 followingtrabeculectomyduringthefollowupperiod (mean3.5years).
Ehrnroothetal, Cataractsurgerywascompletedin34.8%ofeyes. 3.5years 2005
O’Brartetal, Cataractformationwassimilarbetweenthe 20months 2004 trabeculectomyandviscocanalostomygroups.
*Edmundsetal,1999isacrosssectionalsurveyoftrabeculectomypatientsintheNationalHealthServiceintheUK.Notimeframewasprovidedinthissurveybetweentrabeculectomyandcataractoccurrence
ThemajorityofstudiesshowninTable5.12measuretheincidencerateofcataractdevelopmentorsurgeryfollowingafirsttimetrabeculectomy.Thesemeasuresdonottakeintoaccounttherateofcataractdevelopmentorsurgeryinpeopleofanidenticaldemography.Ifanincidentrateofbetween20%and35%fromthesestudieswereusedtheincreasedmorbidityandhealthsystemcostwouldbeoverestimated.
TheAGISstudyontheotherhandmeasuredtheRRofcataractfollowingtrabeculectomy.People that undergo a first time trabeculectomy procedure have a 78% increased chance of developing a cataract (RR=1.78)accordingtoAGIS.Thisincreasedriskisappliedinthemodeltopeoplethathaveundergoneatrabeculectomyprocedure,withtheriskofcataractforapersonthathasnotundergonethisprocedureassumedtobeequaltotheprevalenceofcataractinthegeneralpopulation.
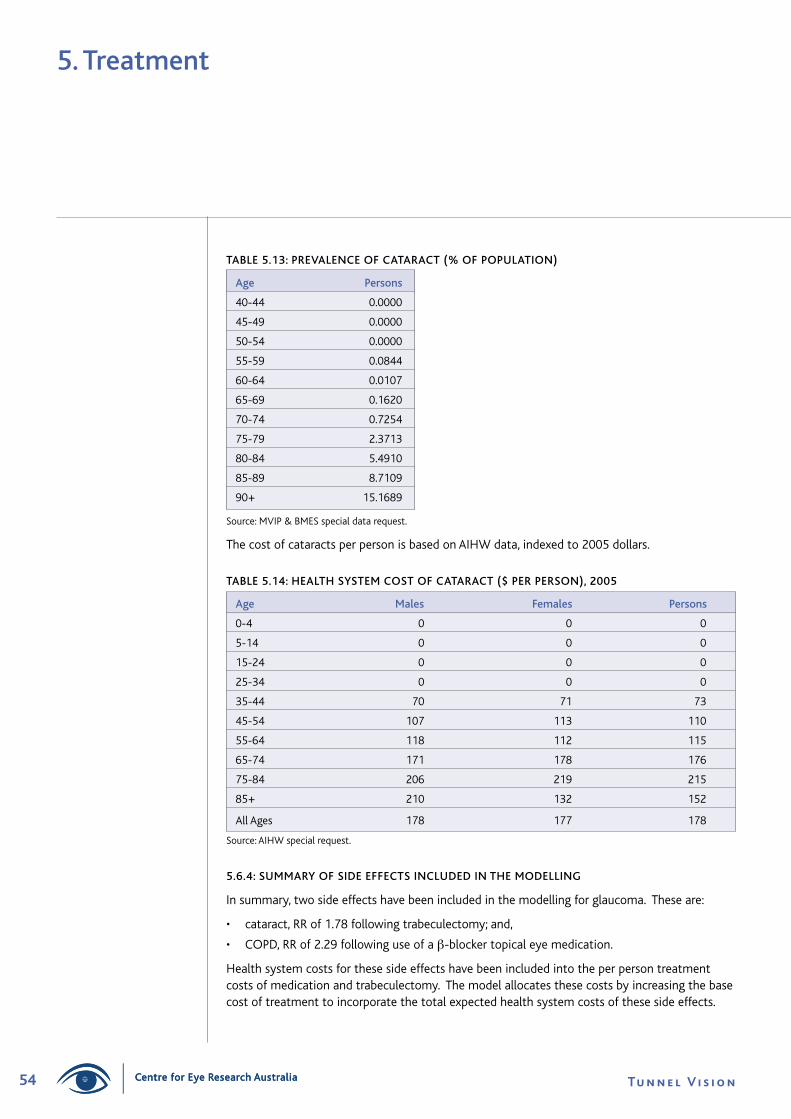
�� Tu n n e l V i s i o nCentre for Eye Research Australia
5. Treatment
TABLE 5.13: PREVALENCE Of CATARACT (% Of POPULATION)
Age Persons
40-44 0.0000
45-49 0.0000
50-54 0.0000
55-59 0.0844
60-64 0.0107
65-69 0.1620
70-74 0.7254
75-79 2.3713
80-84 5.4910
85-89 8.7109
90+ 15.1689
Source:MVIP&BMESspecialdatarequest.
ThecostofcataractsperpersonisbasedonAIHWdata,indexedto2005dollars.
TABLE 5.14: hEALTh SYSTEM COST Of CATARACT ($ PER PERSON), 2005
Age Males females Persons
0-4 0 0 0
5-14 0 0 0
15-24 0 0 0
25-34 0 0 0
35-44 70 71 73
45-54 107 113 110
55-64 118 112 115
65-74 171 178 176
75-84 206 219 215
85+ 210 132 152
AllAges 178 177 178
Source:AIHWspecialrequest.
5.6.4: SUMMARY Of SIDE EffECTS INCLUDED IN ThE MODELLING
Insummary,twosideeffectshavebeenincludedinthemodellingforglaucoma.Theseare:
• cataract,RRof1.78followingtrabeculectomy;and,
• COPD,RRof2.29followinguseofab-blockertopicaleyemedication.
Healthsystemcostsforthesesideeffectshavebeenincludedintotheperpersontreatmentcostsofmedicationandtrabeculectomy.Themodelallocatesthesecostsbyincreasingthebasecostoftreatmenttoincorporatethetotalexpectedhealthsystemcostsofthesesideeffects.
Centre for Eye Research Australia

55The Economic Impact of Primary Open Angle Glaucoma - A Dynamic Economic Model
Main heading to go here5. Treatment
The calculation of disease costs over time is discussed in this section, including:
• the impact of glaucoma on a patient’s quality of life (wellbeing);
• the health system costs of glaucoma; and
• the indirect costs of glaucoma (including the impact on employment, the need for informaland paid formal care, the impact on the paid employment of informal carers, aids andequipment, and the economic costs of welfare payments).
However, first, discount rates are discussed, as the model is dynamic and calculates theeconomic impact of glaucoma in net present value terms over time (2005 to 2025).
6.1: DISCOUNT RATES
Choosing an appropriate discount rate for present valuations in cost analysis is a subject of some debate, and can vary depending on which future income or cost stream is beingconsidered. There is a substantial body of literature, which often provides conflicting advice, onthe appropriate mechanism by which costs should be discounted over time, properly taking intoaccount risks, inflation, positive time preference and expected productivity gains.
The absolute minimum option that one can adopt in discounting future income and costs isto set future values in current day dollar terms on the basis of a risk free assessment about thefuture (that is, assume the future flows are similar to the certain flows attaching to a long termGovernment bond).
Wages should be assumed to grow in dollar terms according to best estimates for inflation andproductivity growth. In selecting discount rates for this project, we have thus settled upon thefollowing as the preferred approach.
• Positive time preference: We use the long term nominal bond rate of 5.8% pa (from recenthistory) as the parameter for this aspect of the discount rate. (If there were no positive timepreference, people would be indifferent between having something now or a long way off inthe future, so this applies to all flows of goods and services.)
• General Inflation: The Reserve Bank has a clear mandate to pursue a monetary policy thatdelivers 2 to 3% inflation over the course of the economic cycle. This is a realistic longer rungoal and we therefore endorse the assumption of 2.5% pa for this variable. (It is importantto allow for inflation in order to derive a real (rather than nominal) rate.)
• Productivity growth: The Commonwealth Government’s Intergenerational report assumedproductivity growth of 1.7% in the decade to 2010 and 1.75% thereafter. We suggest1.75% for the purposes of this analysis.
• Health Inflation: Health cost inflation from 2005 onwards is assumed to be 3.2%, based onestimates of increases in health expenditure from the AIHW estimates that health inflationin the eight years to 2004-05 has been around 3.2% per annum (AIHW 2006). This rate ispartially general price inflation and partially productivity growth. To be on the conservativeside, productivity growth in the health sector is assumed to be equal to generalproductivity growth.
6. Disease Costs
Glaucoma hassignificant social and economic costs.

�� Tu n n e l V i s i o nCentre for Eye Research Australia
Therearethendifferent discount rates that should be applied:
• Todiscountincomestreamsoffutureearnings,thediscountrateis:
5.8-2.5-1.75=1.55%
• Todiscounthealthcosts,thediscountrateis:
5.8-(3.2-1.75)-1.75=2.6%
• Todiscountotherfuturestreams(healthylife)thediscountrateis:
5.8–2.5=3.3%
Whiletheremaybesensibledebateaboutwhetherhealthservices(orothercostswithahighlabourcomponentintheircosts)shouldalsodeductproductivitygrowthfromtheirdiscountrate,wearguethatthesecostsgrowinrealtermsovertimesignificantlyasaresultofotherfactorssuchasnewtechnologiesandimprovedquality,andwecouldreasonablyexpectthistocontinueinthefuture.
�.�:THECOSTTOQUALITYOFLIFEANDWELLBEING
6.2.1: DISEASE WEIGhTS
Asnotedabove,the impact of treatment on a patient’s health and quality of life is of primary importanceinmodellingtheeconomicimpactofdisease.Inthisstudy,eachstageintheprocessofvisionlossneedstobematchedwithautilityweight(apatient’smeasureofhisorherqualityoflife)reflectingthelossofqualityoflifeexperiencedatthatpointintheprogressionofthedisease.ThisisverydifficultforPOAGbecause:
• changesinIOPdonoteasilytranslateintoahealthbenefitforpatients(Kobeltetal,2006,Hymanetal,2005,Jampeletal,2002andMillsetal,2001);and
• thereisnoagreeddiseasestagingsystembasedonvisionloss(seeSection4.5).Thevariousvisiongradingsystemscannotbeeasilytranslatedintoaquantifiableimpactonqualityoflife.
Thereisagrowingliteraturethatattemptstomeasuretheimpactofglaucomaonqualityoflife,althoughthelackofaconsistentdiseasestagingsystemremainsaproblemindrawingconclusionsfromthesestudies.Theliteraturesuggeststhatduringtheearlystagesofdisease,glaucomahaslittleimpact,withquality of life deteriorating over time, particularly in the later stages of the disease. Someexamplesareasfollows.20
1) Kobeltetal,(2006)undertookacrosssectionalpilotstudytotestwhetherutilitiesfordifferentlevelsofVFdefectcouldbeassessedusingageneralquestionnairesuchastheEQ5D.UtilityweightsdevelopedusingtimetradeoffunderlietheEQ5D.InSweden,199patientswithOHTorPOAGweregroupedaccordingtosixstagesofvisionlossbasedonVFdefectsintheworsteye.ThediseasestageswereadaptedfromtheHAPscale—fromnodefect(OHT)toendstagediseasewhereVFmeasurementwasdifficultornolongerpossible.Theauthorsfoundthatutilitywasstronglycorrelatedwithoverallvision,andpatientswithsevereglaucomatousdamagehavesignificantlylowerutility.However,whileutilitydecreasedwithincreasingglaucomatousdamage,thedifferencebetweenthestageswasnotstatisticallysignificantwhencontrollingforco-morbidity.When17outlierswereremoved,utilityscoresforpatientswithsevereglaucomatousdamageweresignificantlyworse.Patientsinstage5hadameanutilityof0.71(autilitylossof0.29),comparedto
6. Disease Costs
20Foranexplanationofthelinearratingscale,standardgamble,timetrade-off,persontrade-offandEQ-5D,seeMathersetal,(1999:10).
Centre for Eye Research Australia
��The Economic Impact of Primary Open Angle Glaucoma - A Dynamic Economic Model
0.88instage1andameanof0.84(autilitylossof0.16)instages2.4.Thesamplesizewassmallandthenumberofpatientswithmoderatetoseverebilateralvisionlosswaslimited,however,theresultswereconsistentwithotherstudies(Kobeltetal,2006).
2) Jampeletal,(2002)examinedhow191glaucomapatients’and46glaucomasuspects’ratingoftheirvisioncorrelatedwithEstermanbinocularVFtestingandothervisualfunctiontests.TheyfoundthatutilityvaluesthatpatientsassigntotheirvisiondonotcorrelatewellwithEstermanresultsandsuggestedthiswasbecause,“there may not be a close relationship between visual function and patient perception of that function, especially when the vision loss is mild ... Perhaps early visual field loss really does not affect patient assessment of their vision and in fact is more of an all or none phenomenon with patients only noticing marked visual field loss.” (Ontheotherhand,appropriatetestsmaynothavebeendeveloped.)Alinearratingscaleandtimetradeoffwereusedtogaugethepreferencesofpatientswithglaucomaforvisualstates.Basedonthelinearratingscale,glaucomapatientsratedtheirvisionas0.72andsuspectsratedtheirvisionas0.71(ona0to1scale).Blindglaucomapatients(withaVAnobetterthancountingfingersinthebettereyeandwhohadbeenblindfor10years)ratedtheirvisualstateas0.54.Glaucomapatientsandsuspectsassignedavalueof0.38and0.34respectivelytototalblindness.Timetradeoffresultswerelessinformativeasfewwerewillingtogiveuptimeforimprovedvision.
3) AUKstudy(Brownetal,2001)usedatimetradeoffandastandardgambletomeasureutilityassociatedwithblindnessfrom65patientswithvariousvisiondiseasesincludingglaucoma,cataract,agerelatedmaculardegeneration(AMD)anddiabeticretinopathy.Autilityvalueof1.0indicatesastateofperfecthealthwhereasautilityvalueof0indicatesdeath.Participantsweregroupedaccordingtovariousmeasuresofblindnessasfollows:
b) totallyblind:15patientswithnolightperceptioninatleastoneeyeandwhowereaskedtoassumeascenarioofnolightperceptioninthesecondeyeaswell;
c) somelightperception:17patientswithlightperceptiontocountingfingersinthebetterseeingeye;
d) justoverthelineforlegalblindness:33patientswith20/200-20/400visioninthebetterseeingeye.
Thetimetradeoffresultssuggestedutilityvaluesforeachgroupof(a)0.26QALYs(95%CI0.19to0.33);(b)0.47QALYs(95%CI0.33to0.61);and(c)0.65QALYs(95%CI0.58to0.72).Thus patients with no light perception in one eye who were presented with the same scenario in the second eye as well were willing to trade almost 3 out of every 4 years of remaining life in return for perfect vision in each eye. Thosewithlightperceptiontocountingfingerswouldtradeapprox1of2remainingyearsandthosewith20/200-20/400wouldtradeapprox1of3remainingyears.
Thestandardgambleutilityresultsweresubstantiallyhigher:(a)0.32(95%CI0.2to0.44);(b)0.60(95%CI0.46to0.74);and(c)0.80(95%CI0.73to0.87).However,theauthorssuggestedthestandardgambleresultsoverestimateriskaversionbecauseparticipantshavedifficultyunderstandingthisapproach.
Notably,inblindpatients,utilityimprovedovertimesuggestingadaptationtoblindness(thereweresignificantdifferencesbetweenthoseblindforlessthanoneyearandthoseblindformorethanoneyear)andtheworsethevisioninthebettereye,thelowertheutility.Brownetal,(2001)concludedthat:
6. Disease Costs
Vision loss has a very significant impact on the quality of life that is highly valued.

�� Tu n n e l V i s i o nCentre for Eye Research Australia
There is a wide range of utility values associated with legal blindness … the preservation of even small amounts of vision in patients with legal blindness is critically important to their wellbeing and functioning in life. (Brown et al, 2001:327)
AIHWWEIGHTS
The choice of disease weights is very important.Iftheutility(QALY)weightsassociatedwithvisionlossaretooloworthedisabilityweights(DisabilityAdjustedLifeYears-DALYs)aretoohigh,theresultswilloverestimatethecosteffectivenessofinterventions(andviceversa).Previousmodelsinthisseries(seetheBackground—Section1ofthisreport)appliedthedisabilityweightsusedbytheAIHWintheirlossofwellbeingstudy(Mathersetal,1999,Table6.1).Theseweightsaredrawnfroma Dutch study that used a person trade off methodtoestimateweightsfor53diseases,includingtheestimationofweightsfor175diseasestages,sequelaeandseveritylevels(citedinMathersetal,1999:11).TheDutchweightsarebasedondiseasestagesdefinedasfollows(Mathersetal,1999:159):
• Milddisease:Somedifficultywithnewspaper,nodifficultyrecognisingfacesat4m;
• Moderatedisease:Greatdifficultynewspaper,somedifficultyrecognisingfacesat4m;and
• Severedisease:Unabletoreadnewspaperorrecognisefacesat4m.
WhileitisdifficulttorelatethesedefinitionstostagesofVFLinthestudiesoutlinedabove,andspecificallytoadiseasesuchasglaucomawhichinitiallyaffectsmid-peripheralVF,theAIHWweightsarenotinconsistentwiththepreviousliteraturereview—notingthattheAIHWweightsreflectdisabilityweights(DALYs)ratherthanutilityweights(QALYs).
• ManypatientswithOHTortheclinicalsignsofglaucomadonotexperiencevisionlossforseveralyears.Thusthereisnolossofutilityduringearlystagediseaseandthedisabilityweightis0.0.
• TheAIHW(Dutch)weightformoderatediseaseliesbelowthelowestweightforseverediseasefoundintheliteraturereview(0.17comparedwith0.26).However,ifglaucomareallyonlyaffectsqualityoflifeinthelatterstagesofdisease,thenthedisabilityweightsformildandmoderatediseasemightbetoohigh.
• LegalblindnessinAustraliaisdefinedasVAof<6/60inthebettereyewithcorrection(spectacles)oraVFoflessthan10degreesorboth(CERA2004:11).Totalblindnessreferstopeoplewhoareunabletoseelight.TheseareencompassedintheAIHWweightforseverediseasewhichis0.43(comparedwiththerangeofestimatesof0.26tomorethan0.6inthestudiesoutlinedabove).
The AIhW disease weights will be used here. Theyaredrawnfromastudyofanumberofdiseasesandcomparisonwithotherdiseasesandinterventionsisimportantforbudget/resourceallocationdecisions.Inaddition,itisalsopreferabletouseweightsfromthesamestudysothatthesamemethodologyhasbeenusedandthesetofweightsisinternallyconsistent.TheAIHWweightsarealsoconsistentwiththepreviousmodelsdevelopedbyCERAandsoallowforeasycomparisonsacrossthese.
BasicAIHWweightsareonlyforthediseaseanddonottakeintoaccountco-morbidities.Glaucomaisassociatedwithbothaccidentalfallsanddepression.AccidentalfallsanddepressionarediscussedbelowinSections6.3.4and6.3.5.Thediseaseweightsarenotadditive—addingtheweightsforapersonwithsevereglaucomaandseveredepressionresultsinaweightgreaterthan1whichisnotintuitivelypossible.
Many patients with OhT or the clinical
signs of glaucoma do not experience vision loss for several years.
6. Disease Costs
Centre for Eye Research Australia

��The Economic Impact of Primary Open Angle Glaucoma - A Dynamic Economic Model
Consequently,thefollowingformulaeareused:
whereWisthedisabilityweight,VI
denotestheseverityofvisualimpairment(EDS,Mild,ModerateorSevere),
DEPdenotesdepressionand
FALLdenotesafall.TheAIHWweighting
foraccidentalfallsis0.141andfordepressionis0.223basedon20%ofglaucomasuffersexperiencingmilddepressionwithaweightingof0.140and5%ofglaucomasuffersexperiencingmoderatetosevererdepressionwithaweightingof0.555(seeSection6.3.5fortheevidencebasisforcomorbiddepression)(seeMathersetal,1999,forthederivationoftherespectivedisabilityweights).
TABLE 6.1: AIhW DISABILITY WEIGhTINGS
EDS Mild Moderate Severe
Glaucomaonly 0.000 0.020 0.170 0.430
Glaucomaandaccidentalfalls 0.141 0.158 0.287 0.510
Glaucomaanddepression 0.223 0.239 0.335 0.557
Glaucoma,accidentalfallsanddepression 0.333 0.346 0.446 0.620
CERAWEIGHTS
CERAweightsarealsoavailableforusewithinthemodel.ThesearenotcorrelatedwithseverityofdiseasebasedonafindingfromresearchduringthedevelopmentoftheVisQoL,thetooltoderivevision-relatedutilities.Therewasnosignificantdifferencebetweenmild,moderateandseverevisionloss.TheCERAQALYweightforvisualimpairmentof0.83(utilitylossorDALYof0.17)appliestoalllevelsofvisualimpairmentandisconsistentwithresultsfromtheVIPsuggestingthat,withcancer,blindnessisthemostfearedhealthcondition.NoadditionaladjustmentforfallsanddepressionaremadeifCERAweightsareused.Itshouldbenotedthatusingthesamedisabilityweightforalllevelsofseverityofglaucomareducesthebenefitsofslowingprogressionofglaucoma.
6.2.2: PLACING A DOLLAR VALUE ON ThE LOSS Of WELLBEING
LossofwellbeingisestimatedusingDALYsandapplyingthelowerboundVSLof$3.7milliontoyieldthe estimated value of a life year of $162,561 (CERA, 2004).
DEPVIVIDEPVI WWWW !"+= )1(,
FALLVIVIFALLVI WWWW !"+= )1(,
FALLDEPVIDEPVIFALLDEPVI WWWW !"+= )1( ,,,,
6. Disease Costs

�0 Tu n n e l V i s i o nCentre for Eye Research Australia
�.�:HEALTHSYSTEMCOSTS
Thehealthsystemcostsofglaucomaarecategorisedanddiscussedinthissectionasfollows:
• thecostofmonitoringanindividualwithglaucoma(notincludingtreatmentcosts);
• thecostsoftreatmentforPOAG;
• theincreasedlikelihoodofbeingadmittedtoanagedcarefacilityandtheassociatedcosts;
• thecostsassociatedwithanincreasedlikelihoodoffallsandhipfractures;and
• thecostsassociatedwithanincreasedlikelihoodofdepression.
DataonthehealthsystemcostsofPOAGarefromaspecialrequestfromtheAIHW.Themostrecentdataforexpenditurebydiseaseareforthefinancialyear2000-01andhavebeenfactoredupforhealthinflation.BasedonestimatesofincreasesinhealthexpenditurefromtheAIHW,healthinflationinthelasteightyearsto2004-05hasbeenaround3.2%perannum(AIHW2006).
TheAIHWincludeonly87.5%(AIHW2005)oftotalrecurrenthealthexpenditureintheirestimatesofexpenditurebydiseaseandinjury,referredtoas‘allocated’healthexpenditure.The‘unallocated’remainderincludescapitalexpenditures,expenditureoncommunityhealth(excludingmentalhealth),publichealthprograms(exceptcancerscreening),healthadministrationandhealthaidsandappliances—thecodingfortheseareasofexpendituredoesnotallowallocationbydiseasecategory.Toensurecomprehensiveness,theseaspectsofhealthsystemcostshavebeenincorporatedbymultiplyingtheAIHW‘allocated’expenditureestimatesby1.143(=1/0.875).Factoringuptheallocatedexpenditureinthiswaymeansthatcareneedstobetakentoavoiddoublecounting.Forexample,manyaidsandappliancecostsareprovidedbycommunityprograms(ratherthangovernmentprograms),andarenotincorporatedintheAIHWexpenditure.
Theproportionofhealthcostsbornebythegovernment(68.2%)andtheindividual(19.0%)isbasedonAIHW(2006:30).
TABLE 6.2: hEALTh COSTS BY WhO BEARS ThE COST, 2004-05
federal State/Territory Private health Individuals Other Total Government Government Insurance
% 45.6% 22.6% 6.5% 19.0% 6.3% 100.0%
Source:AIHW(2006:30).
6.3.1: ThE COST Of MONITORING AN INDIVIDUAL WITh GLAUCOMA
Thecostofmonitoringanindividualwithglaucomain2005—notincludingmedical,laserandsurgicaltreatmentsis$649perpersonperyear.Thiswascalculatedbyadjustingthetotalhealthcostsforglaucoma($148.3min2000-01)inthefollowingways:
• adjustforthechangeinthepopulationbetween2000-01and2005;
• includeunallocatedhealthexpenditure(factoredupby1.143);
• indexspendingto$2005(healthinflationof2.6%pa);and
• removeexpenditureontreatment(medication,laserandsurgery)andagedcare;
• dividebythenumberofpeoplereceivingtreatmentin2005.
6. Disease Costs
Overall, individuals still pay 19% of
health costs.
Centre for Eye Research Australia

��The Economic Impact of Primary Open Angle Glaucoma - A Dynamic Economic Model
6. Disease Costs
6.3.2: COST Of TREATMENT
Medication
ThecostestimateswerederivedusingdatafromtheDepartmentofHealthandAgeingwebpublicationAustralian Statistics on Medicines 2005,andAustralianMedicareBenefitsSchedulefees.Thetotalcostofanti-glaucomamedicationsfor2005isinTable6.3,andisdividedbythetotalnumberofpeoplereceivingmedicationin2005(ie.thenumberofpeoplewithdiagnosedPOAGin2005estimatedinthedynamicmodel)toderivethecostofmedicationperpersonperannum.
TABLE 6.3: COST Of MEDICATION PER PERSON PER ANNUM
TotalCostofAnti-glaucomaMedications $99,694,643
TotalNo.ofPeopleonMedication 103,820
CostofMedicationperPerson $960
Source:AustralianStatisticsonMedicines2005andAccessEconomicsEconomicModeloftheImpactofPrimaryOpenAngleGlaucoma.
Thecostofthesideeffectsofmedicationswereaddedtothecostofmedicationsperperson.TheORofCOPDfollowingtheuseofatopicalbeta-blockerappliedtotheaverageriskofCOPDinTable510is2.29andthecostofCOPDperpersonisinTable5.11.ThetotalcostofmedicationwithsideeffectsincludedbyageandgenderisinTable7.1.
Trabeculoplasty
Thecostofatrabeculoplastyisappliedinthemodelonceatthepointwhenapatienttransitionsintothe‘laser’treatmentphase.To account for people that have more than one trabeculoplasty procedure, the cost calculated inTable6.4is inflated by 1.5 in the modelling calculations (see Section 5.2). ThecostofthisprocedureisbasedonthetreatmentfeeintheMBSforthetreatmentaswellasthecostoftheanaesthesiaservice(Table6.5).Basedonclinicaladviceforthisreport,thecostofanassistanthasnotbeenincluded.
TABLE 6.4: TOTAL COST Of TRABECULOPLASTY PER TREATMENT
MBS Code Description Cost
42782 LaserTrabeculoplasty–eachtreatmentto1eye,toamaximum $398.65 of4treatmentstothateyeina2yearperiod(Anaes.)(Assist.)
20140 Initiationofmanagementofanaesthesiaforproceduresoneyes, $84.25 notbeingaservicetowhichanotheriteminthisgroupapplies (5basicunits)
Total $482.90
Source:MBSBook,1November2006
Medication costs on average: $960.80 per person per year.
Trabeculoplasty costs on average $482.90.

�� Tu n n e l V i s i o nCentre for Eye Research Australia
6. Disease Costs
Trabeculectomy
Aswithtrabeculoplasty,thecostofatrabeculectomyisappliedinthemodelonce,whenthepersonmovesintothe‘surgery’treatmentphase.To account for people that have a second trabeculectomy procedure, the total cost of surgery in Table6.6is scaled up by 1.2 to $4,122.50.
Thecostofthisprocedureisbasedontheaveragediagnosisrelatedgroup(DRG)costfortrabeculectomy,weightedforpublicandprivatehospitals,fromtheNationalHospitalCostDataCollection.ThecodethatrelatestotrabeculectomyproceduresisDRGC15AGlaucomaandComplexCataractProcedures.ThetotalcostsofprivatehospitaltrabeculectomyproceduresareinTable6.5.
TABLE 6.5: TOTAL COST Of TRABECULECTOMY PER TREATMENT
Total Cost No. of Procedures Weighted Average
PrivateHospital $3,027 656 0.3993
PrivateFreeStandingHospital $3,027 404 0.2459
PublicHospital $4,178 583 0.3548
$3,435.42
Source:PersonalCommunication(MarcFoley,EarandEyeHospital);NationalHospitalCostDataCollectionRound9PublicHospitalCostsandAIHWspecialdatarequest
6.3.3: AGED CARE
Visual impairment compounds the presence of other disabling conditions,leadingtoanincreasedlikelihoodofutilisinginstitutionalisedagedcare.UsingBMESdata,Wangetal,(2003)foundaRRofpermanentnursinghomeadmission—afteradjustingfornon-cognitivefactorsthatpredictednursinghomeplacement—forpeoplewithbestcorrectedvisualimpairment(≤6/12)agedover40years,of1.8(95%CI1.1–2.9).InthismodelforpeoplewithEDStheRRofbeinginanagedcarefacilityisassumedtobeunity,whileforMild,ModerateandSeverevisualimpairmenttheRRofbeinginanagedcarefacilityisbasedonalinearadjustment,withmoderatevisualimpairmentasthemidpoint:
• 1.4formild;
• 1.8formoderate;and
• 2.2forseverevisualimpairment.
TheRRisappliedtothegeneralpopulationofbeinginanagedcarefacility,andtheaveragecostperyearof$52,800,fromtheAccessEconomicsAgedCareDynamicCohortModel.
Centre for Eye Research Australia
Trabeculectomysurgery cost on average $3435.

��The Economic Impact of Primary Open Angle Glaucoma - A Dynamic Economic Model
6. Disease Costs
TABLE 6.6: PROBABILITY Of RESIDING
IN AN AGED CARE fACILITY, 2004-05
Age % of Population
0-54 0.0002
55-59 0.02
60-64 0.14
65-69 0.29
70-74 0.60
75-79 1.40
80-84 3.40
85-89 8.51
90+ 25.40
Source:AccessEconomicsAgedCareDynamicCohortModel
6.3.4: fALLS AND hIP fRACTURES
Itiswellestablishedthatolderpeopleareatahigherriskoffalls,approximatelyhalfofwhichresultinaninjury.Manystudieshaveexaminedthefactorsunderlyingtheincreasedpropensityoffallsintheelderlyandseveralhavefoundasignificantlinkbetweenfallsandvisionloss.Elderlyindividualsprogressivelyrelyonvisualfeedbacktomaintainbalancewithincreasingagebecauseproprioceptivefeedback,musculoskeletalstrengthandoftenvestibularfunctiondeclinewithage(Ramrattanetal,2001).Thedeteriorationofvisualfunctioncoupledwiththelossofothersensoryfunctionsresultinthehigher risk of falls in elderly visually impaired people.
Theriskofafallhasbeenlinkedtomanydifferentmeasuresofvisualimpairment.ThemajorityofstudiescomparetheriskoffallstoVAoranothermeasureofvisualimpairmentwithveryfewstudiesexaminingthelinksbetweenglaucomaandfalls.Ofthesmallnumberofstudieslinkingglaucomaandfallssomeusedtheconsumptionofnon-miotictopicaleyemedicationsasaproxyforVFL,whileonlyonestudyconductedadiagnostictesttodeterminethepresenceofglaucomaandtheextentofVFL.
Ameta-analysisoftheavailableliteraturethatexaminedtherelationshipbetweenvisualimpairmentandtheriskofanaccidentalfallwasconducted(Table6.10).Additionalsupportivearticleswerefoundduringtheliteraturesearches,butcouldnotbeincludedduetoalackofquantitativeinformation.ThesearticlesarelistedandsummarisedinAppendix1,Table10.4.ArandomeffectsmodelhasbeenappliedtothedatainTable6.7andTable6.8,withstudiesthatusedVFLandglaucomaproxiesormeasuresevaluatedseparately.
Older people with vision impairment are at a higher risk of falls, approximately half of which result in an injury.
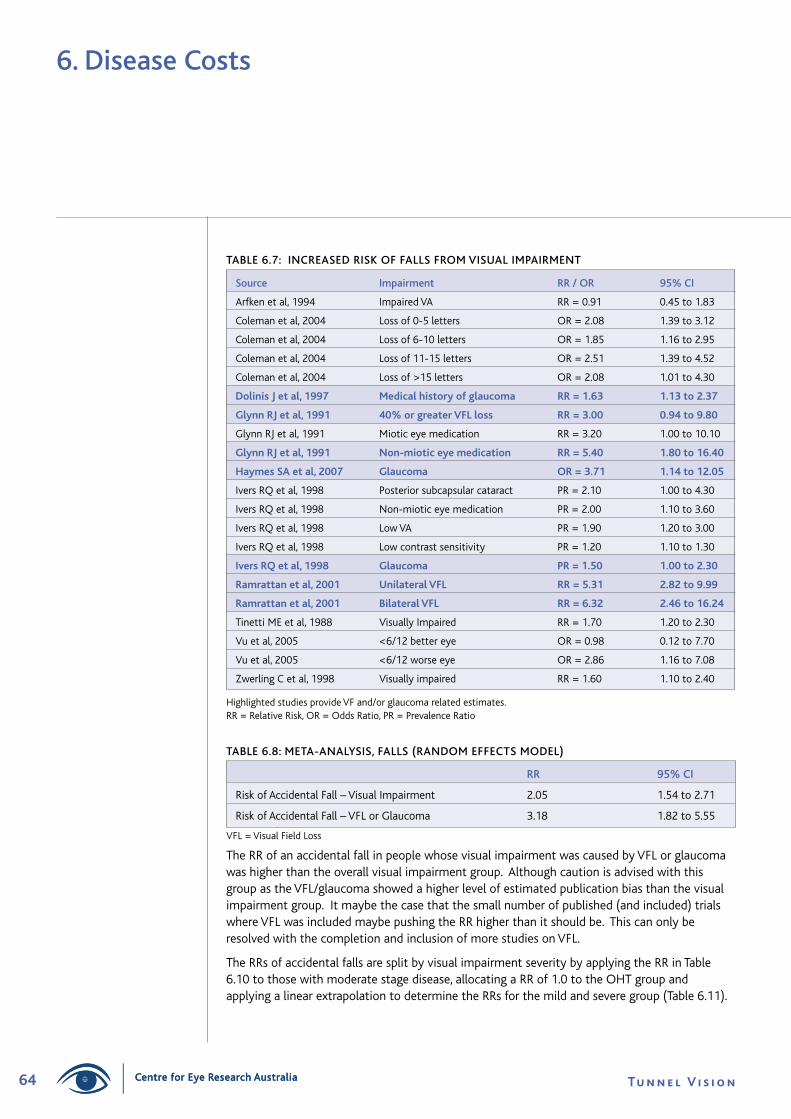
�� Tu n n e l V i s i o nCentre for Eye Research Australia
6. Disease Costs
TABLE 6.7: INCREASED RISK Of fALLS fROM VISUAL IMPAIRMENT
Source Impairment RR / OR 95% CI
Arfkenetal,1994 ImpairedVA RR=0.91 0.45to1.83
Colemanetal,2004 Lossof0-5letters OR=2.08 1.39to3.12
Colemanetal,2004 Lossof6-10letters OR=1.85 1.16to2.95
Colemanetal,2004 Lossof11-15letters OR=2.51 1.39to4.52
Colemanetal,2004 Lossof>15letters OR=2.08 1.01to4.30
DolinisJetal,���� Medicalhistoryofglaucoma RR=�.�� �.��to�.��
GlynnRJetal,���� �0%orgreaterVFLloss RR=�.00 0.��to�.�0
GlynnRJetal,1991 Mioticeyemedication RR=3.20 1.00to10.10
GlynnRJetal,���� Non-mioticeyemedication RR=�.�0 �.�0to��.�0
HaymesSAetal,�00� Glaucoma OR=�.�� �.��to��.0�
IversRQetal,1998 Posteriorsubcapsularcataract PR=2.10 1.00to4.30
IversRQetal,1998 Non-mioticeyemedication PR=2.00 1.10to3.60
IversRQetal,1998 LowVA PR=1.90 1.20to3.00
IversRQetal,1998 Lowcontrastsensitivity PR=1.20 1.10to1.30
IversRQetal,���� Glaucoma PR=�.�0 �.00to�.�0
Ramrattanetal,�00� UnilateralVFL RR=�.�� �.��to�.��
Ramrattanetal,�00� BilateralVFL RR=�.�� �.��to��.��
TinettiMEetal,1988 VisuallyImpaired RR=1.70 1.20to2.30
Vuetal,2005 <6/12bettereye OR=0.98 0.12to7.70
Vuetal,2005 <6/12worseeye OR=2.86 1.16to7.08
ZwerlingCetal,1998 Visuallyimpaired RR=1.60 1.10to2.40
HighlightedstudiesprovideVFand/orglaucomarelatedestimates.RR=RelativeRisk,OR=OddsRatio,PR=PrevalenceRatio
TABLE 6.8: META-ANALYSIS, fALLS (RANDOM EffECTS MODEL)
RR 95% CI
RiskofAccidentalFall–VisualImpairment 2.05 1.54to2.71
RiskofAccidentalFall–VFLorGlaucoma 3.18 1.82to5.55
VFL=VisualFieldLoss
TheRRofanaccidentalfallinpeoplewhosevisualimpairmentwascausedbyVFLorglaucomawashigherthantheoverallvisualimpairmentgroup.AlthoughcautionisadvisedwiththisgroupastheVFL/glaucomashowedahigherlevelofestimatedpublicationbiasthanthevisualimpairmentgroup.Itmaybethecasethatthesmallnumberofpublished(andincluded)trialswhereVFLwasincludedmaybepushingtheRRhigherthanitshouldbe.ThiscanonlyberesolvedwiththecompletionandinclusionofmorestudiesonVFL.
TheRRsofaccidentalfallsaresplitbyvisualimpairmentseveritybyapplyingtheRRinTable6.10tothosewithmoderatestagedisease,allocatingaRRof1.0totheOHTgroupandapplyingalinearextrapolationtodeterminetheRRsforthemildandseveregroup(Table6.11).
Centre for Eye Research Australia
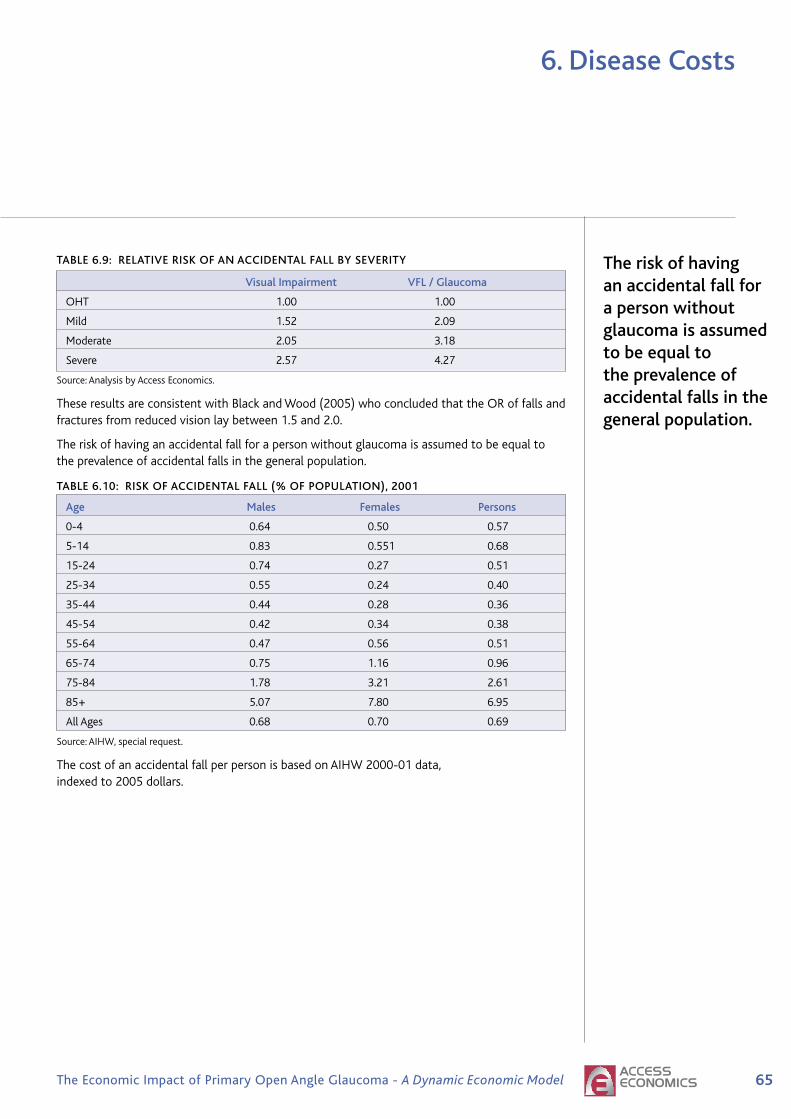
��The Economic Impact of Primary Open Angle Glaucoma - A Dynamic Economic Model
6. Disease Costs
TABLE 6.9: RELATIVE RISK Of AN ACCIDENTAL fALL BY SEVERITY
Visual Impairment VfL / Glaucoma
OHT 1.00 1.00
Mild 1.52 2.09
Moderate 2.05 3.18
Severe 2.57 4.27
Source:AnalysisbyAccessEconomics.
TheseresultsareconsistentwithBlackandWood(2005)whoconcludedthattheORoffallsandfracturesfromreducedvisionlaybetween1.5and2.0.
Theriskofhavinganaccidentalfallforapersonwithoutglaucomaisassumedtobeequaltotheprevalenceofaccidentalfallsinthegeneralpopulation.
TABLE 6.10: RISK Of ACCIDENTAL fALL (% Of POPULATION), 2001
Age Males females Persons
0-4 0.64 0.50 0.57
5-14 0.83 0.551 0.68
15-24 0.74 0.27 0.51
25-34 0.55 0.24 0.40
35-44 0.44 0.28 0.36
45-54 0.42 0.34 0.38
55-64 0.47 0.56 0.51
65-74 0.75 1.16 0.96
75-84 1.78 3.21 2.61
85+ 5.07 7.80 6.95
AllAges 0.68 0.70 0.69
Source:AIHW,specialrequest.
ThecostofanaccidentalfallperpersonisbasedonAIHW2000-01data,indexedto2005dollars.
The risk of having an accidental fall for a person without glaucoma is assumed to be equal to the prevalence of accidental falls in the general population.

�� Tu n n e l V i s i o nCentre for Eye Research Australia
TABLE 6.11: hEALTh SYSTEM COST Of AN ACCIDENTAL fALL ($ PER PERSON), 2005
Age Males females Persons
0-4 8,829 8,071 8,505
5-14 7,718 12,166 9,363
15-24 8,307 7,967 8,218
25-34 7,324 8,394 7,655
35-44 7,522 9,905 8,455
45-54 8,861 12,613 10,561
55-64 11,291 11,011 11,140
65-74 13,660 14,224 14,012
75-84 14,659 11,464 12,375
85+ 15,246 12,381 13,025
AllAges 9,737 11,500 10,643
Source:AIHW,specialrequest.
6.3.5: DEPRESSION
StudiesexaminingthelossofVAandlinkstotheonsetofdepressivestatehaveshownahigherRRofsufferingdepressionincomparisontothegeneralpopulation.Thesedonotnecessarilyrelatetoopenangleglaucoma—studiesforPOAGarerequired.
Onestudy,however,reportedthatglaucomadoesnotsharethesameRRassociationasothervisualimpairments.Wilsonetal,(2002)reportedthatthereisnoassociationbetweendepressionandVAlevel,VFseverityortheuseoftopicalbblockersinpeoplewithglaucoma.Howeverthisstudywasconductedonasmallnumberofpatientsandreliedonselfreportedsurveys.
Prevalenceratesofdepressioninelderlyvisuallyimpairedpopulationsareestimatedtorangebetween25%45%(Burmedietal,2002).Withinthegeneralelderlypopulation,lessthan20%havemilddysphoriawithlessthan5%sufferingfromseveredepression.Comparingrisksfromthesestudies,theRRofdepressionislikelytobeintheorderof35%/10%=3.5timeshigher.SummaryresultsfromthesestudieslinkingvisionimpairmentarepresentedinTable6.12.
6. Disease Costs
Depression occurs three times more
commonly in those with vision loss.
Centre for Eye Research Australia
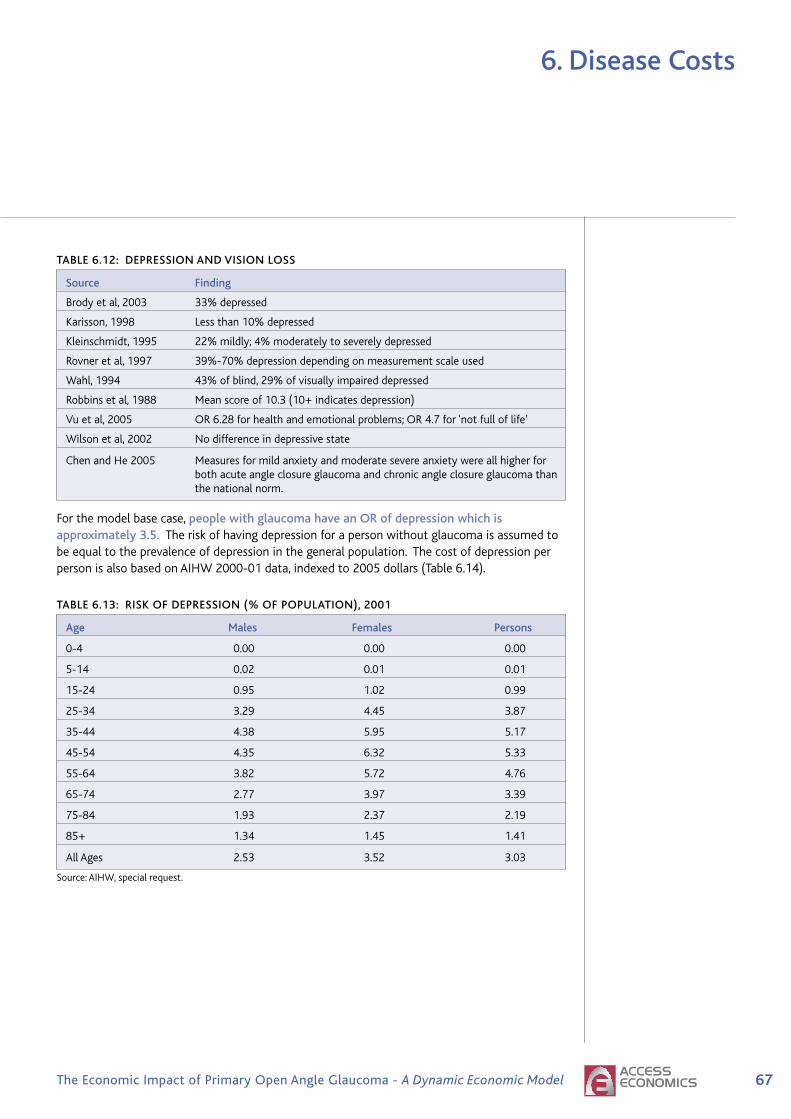
��The Economic Impact of Primary Open Angle Glaucoma - A Dynamic Economic Model
6. Disease Costs
TABLE 6.12: DEPRESSION AND VISION LOSS
Source finding
Brodyetal,2003 33%depressed
Karisson,1998 Lessthan10%depressed
Kleinschmidt,1995 22%mildly;4%moderatelytoseverelydepressed
Rovneretal,1997 39%-70%depressiondependingonmeasurementscaleused
Wahl,1994 43%ofblind,29%ofvisuallyimpaireddepressed
Robbinsetal,1988 Meanscoreof10.3(10+indicatesdepression)
Vuetal,2005 OR6.28forhealthandemotionalproblems;OR4.7for‘notfulloflife’
Wilsonetal,2002 Nodifferenceindepressivestate
ChenandHe2005 Measuresformildanxietyandmoderatesevereanxietywereallhigherfor bothacuteangleclosureglaucomaandchronicangleclosureglaucomathan thenationalnorm.
Forthemodelbasecase,people with glaucoma have an OR of depression which is approximately 3.5. Theriskofhavingdepressionforapersonwithoutglaucomaisassumedtobeequaltotheprevalenceofdepressioninthegeneralpopulation.ThecostofdepressionperpersonisalsobasedonAIHW2000-01data,indexedto2005dollars(Table6.14).
TABLE 6.13: RISK Of DEPRESSION (% Of POPULATION), 2001
Age Males females Persons
0-4 0.00 0.00 0.00
5-14 0.02 0.01 0.01
15-24 0.95 1.02 0.99
25-34 3.29 4.45 3.87
35-44 4.38 5.95 5.17
45-54 4.35 6.32 5.33
55-64 3.82 5.72 4.76
65-74 2.77 3.97 3.39
75-84 1.93 2.37 2.19
85+ 1.34 1.45 1.41
AllAges 2.53 3.52 3.03
Source:AIHW,specialrequest.

�� Tu n n e l V i s i o nCentre for Eye Research Australia
TABLE 6.14: hEALTh SYSTEM COST Of DEPRESSION ($ PER PERSON), 2005
Age Males females Persons
0-4 0 0 0
5-14 18,544 75,852 36,831
15-24 2,793 5,659 4,250
25-34 1,555 2,296 1,983
35-44 1,346 1,831 1,627
45-54 1,634 1,870 1,774
55-64 1,799 2,167 2,017
65-74 2,657 3,610 3,233
75-84 5,872 9,304 8,033
85+ 17,672 12,551 14,052
AllAges 1,915 2,632 2,334
Source:AIHW,specialrequest.
�.�:INDIRECTCOSTS
Theindirectcostsofglaucomacanincludeareducedlikelihoodofemployment,theneedforformalaswellasinformalpersonalcare(andtheassociatedimpactontheemploymentofinformalcarers),aidsandequipment,andtheeconomiccostsofwelfarepayments.Manyoftheseindirect costs are related to the level of visual impairment rather than glaucoma per se,andarethereforesimilartotheindirectcostsassociatedwithothereyediseasessuchasAMD.
EMPLOYMENT
Glaucomaoverwhelminglyaffectstheelderlysoveryfewpeoplewithseverevisualimpairmentarelikelytobeemployed.Forthepurposesofmodelling,peoplewithEDSareassumedtohaveanORofbeingemployedofunity,whileforMild,ModerateandSeverevisualimpairmenttheORofbeingemployedisbasedonalinearadjustmentoftheORcontainedinCERA(2004:66),withmoderatevisualimpairmentasthemidpoint:
• 0.75formild;
• 0.5formoderate;and
• 0.25forseverevisualimpairment.
TheRRsareappliedtothegeneralemploymentratesbyagefromABS(2005)andtheAverageWeeklyEarnings(AWE)ratesfromABS(2004),indexedto2005dollars.
OThER INDIRECT COSTS
Otherindirectcostsperperson(suchastheimpact on employment of informal carers, formal care costs, aids and modifications, and other indirect costs)wereextractedfromtheMVIPdatabaseforthosepeoplewithVAloss(indirectcostsforpeoplewithoutvisualimpairmentareassumedtobenil).DuetohighSDsinthedata,themeanindirectcostsacrossalllevelsofvisualimpairmentwereused,insteadofindirectcostsbymild,moderateandseverevisualimpairment.
6. Disease Costs
Glaucoma overwhelmingly
affects the elderly - fewer people
with severe visual impairment are likely
to be employed.
Centre for Eye Research Australia
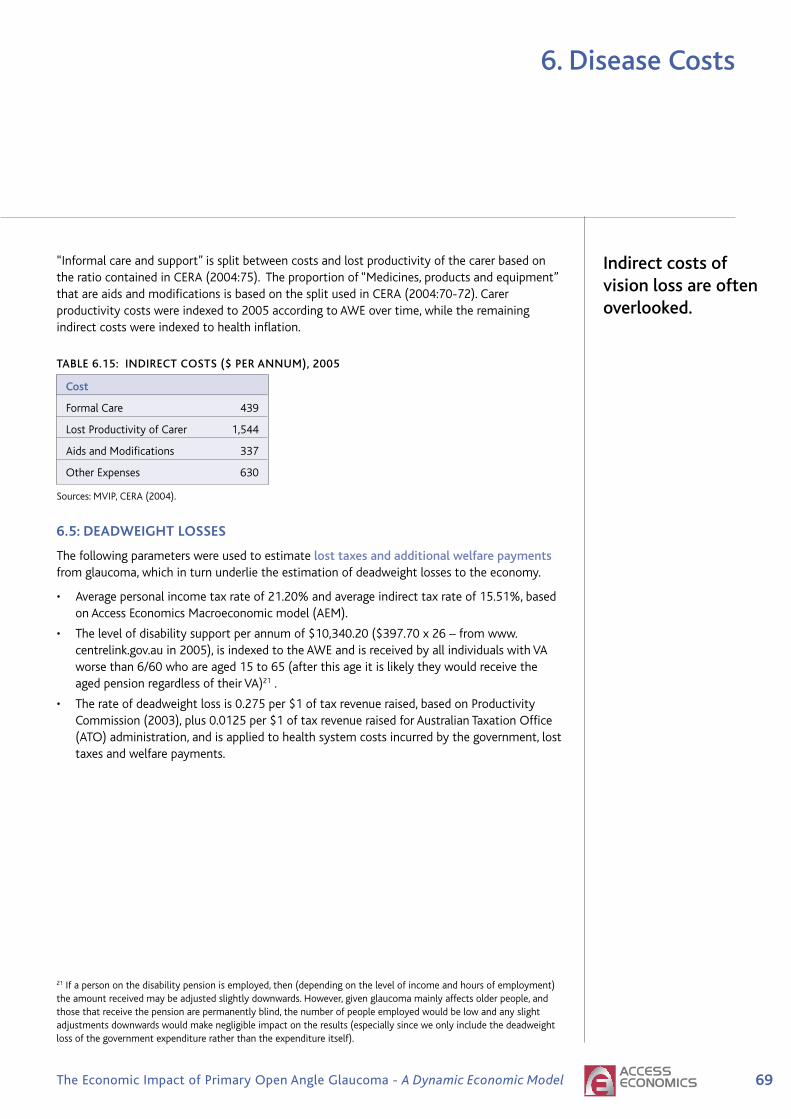
��The Economic Impact of Primary Open Angle Glaucoma - A Dynamic Economic Model
6. Disease Costs
“Informalcareandsupport”issplitbetweencostsandlostproductivityofthecarerbasedontheratiocontainedinCERA(2004:75).Theproportionof“Medicines,productsandequipment”thatareaidsandmodificationsisbasedonthesplitusedinCERA(2004:70-72).Carerproductivitycostswereindexedto2005accordingtoAWEovertime,whiletheremainingindirectcostswereindexedtohealthinflation.
TABLE 6.15: INDIRECT COSTS ($ PER ANNUM), 2005
Cost
FormalCare 439
LostProductivityofCarer 1,544
AidsandModifications 337
OtherExpenses 630
Sources:MVIP,CERA(2004).
�.�:DEADWEIGHTLOSSES
Thefollowingparameterswereusedtoestimatelost taxes and additional welfare paymentsfromglaucoma,whichinturnunderlietheestimationofdeadweightlossestotheeconomy.
• Averagepersonalincometaxrateof21.20%andaverageindirecttaxrateof15.51%,basedonAccessEconomicsMacroeconomicmodel(AEM).
• Thelevelofdisabilitysupportperannumof$10,340.20($397.70x26–fromwww.centrelink.gov.auin2005),isindexedtotheAWEandisreceivedbyallindividualswithVAworsethan6/60whoareaged15to65(afterthisageitislikelytheywouldreceivetheagedpensionregardlessoftheirVA)21.
• Therateofdeadweightlossis0.275per$1oftaxrevenueraised,basedonProductivityCommission(2003),plus0.0125per$1oftaxrevenueraisedforAustralianTaxationOffice(ATO)administration,andisappliedtohealthsystemcostsincurredbythegovernment,losttaxesandwelfarepayments.
21Ifapersononthedisabilitypensionisemployed,then(dependingonthelevelofincomeandhoursofemployment)theamountreceivedmaybeadjustedslightlydownwards.However,givenglaucomamainlyaffectsolderpeople,andthosethatreceivethepensionarepermanentlyblind,thenumberofpeopleemployedwouldbelowandanyslightadjustmentsdownwardswouldmakenegligibleimpactontheresults(especiallysinceweonlyincludethedeadweightlossofthegovernmentexpenditureratherthantheexpenditureitself).
Indirect costs of vision loss are often overlooked.

70 Tu n n e l V i s i o nCentre for Eye Research Australia
This section summarises the parameters used in the model.
• Modelled prevalence rates are in Table 7.1.
• Initial severity of visual impairment splits are in Table 7.2.
• Modelled treatment assumptions are in Table 7.3.
• The costs of treatment including the expected health system costs of side-effects andadverse events are in Table 7.4. There is also a cost of monitoring those who are diagnosedwith POAG at $649 per patient per year.
• The Sections explaining the other parameters used within the model are listed in Table 7.5.
TABLE 7.1: PREVALENCE OF OHT AND POAG
OHT POAGAge Males Females Males Females
0-4 0% 0% 0.0% 0.0%
5-9 0% 0% 0.0% 0.0%
10-14 0% 0% 0.0% 0.0%
15-19 0% 0% 0.0% 0.0%
20-24 0% 0% 0.0% 0.0%
25-29 0% 0% 0.0% 0.0%
30-34 0.00% 0.00% 0.00% 0.0%
35-39 0.02% 0.02% 0.00% 0.00%
40-44 0.08% 0.08% 0.07% 0.07%
45-49 0.15% 0.15% 0.14% 0.14%
50-54 0.23% 0.23% 0.60% 0.60%
55-59 0.30% 0.30% 0.94% 0.94%
60-64 0.35% 0.35% 2.29% 2.29%
65-69 0.39% 0.39% 3.46% 3.46%
70-74 0.44% 0.44% 5.51% 5.51%
75-79 0.49% 0.49% 5.78% 5.78%
80-84 0.49% 0.49% 6.74% 6.74%
85-89 0.49% 0.49% 9.66% 9.66%
90+ 0.49% 0.49% 20.66% 20.66%
Source: BMES and MVIP data
7. Summary of Model Parameters

71The Economic Impact of Primary Open Angle Glaucoma - A Dynamic Economic Model
Main heading to go here7. Summary of Model Parameters
TABLE 7.2: SEVERITY OF VISUAL IMPAIRMENT — INITIAL PROPORTIONAL SPLIT
Age EDS Mild Moderate Severe
0-4 0% 0% 0% 0%
5-9 0% 0% 0% 0%
10-14 0% 0% 0% 0%
15-19 0% 0% 0% 0%
20-24 0% 0% 0% 0%
25-29 0% 0% 0% 0%
30-34 0% 0% 0% 0%
35-39 0% 0% 0% 0%
40-44 100.0% 0.0% 0.0% 0.0%
45-49 100.0% 0.0% 0.0% 0.0%
50-54 100.0% 0.0% 0.0% 0.0%
55-59 100.0% 0.0% 0.0% 0.0%
60-64 95.1% 0.2% 1.7% 2.9%
65-69 94.3% 0.4% 2.8% 2.6%
70-74 92.5% 0.5% 3.7% 3.3%
75-79 88.6% 1.2% 8.4% 1.8%
80-84 84.4% 1.7% 11.5% 2.5%
85-89 78.0% 2.2% 15.1% 4.8%
90+ 70.6% 1.1% 7.7% 20.6%
Source: BMES and MVIP data
TABLE 7.3: MODELLED TREATMENT ASSUMPTIONS
Treatment efficacy Compliance Treatment Incidence (reduction in and failure rates progression of visual impairment)
Medication 50% Inherent in the data See Table 5.5 and calculation (total costs of medications for POAG in 2005 divided by prevalence of diagnosed POAG)
Trabeculoplasty 50% 100% 50% of patients fail each year
Trabeculectomy 50%# 100% 50% of patients fail each year
#Based on equivalence between medication and trabeculectomy demonstrated in CIGTS.

72 Tu n n e l V i s i o nCentre for Eye Research Australia
7. Summary of Model Parameters
TABLE 7.4: MODELLED TREATMENT COSTS $ 2005
(INCLUDING SIDE-EFFECTS AND ADVERSE EVENTS)
Medication (a) Trabeculoplasty (b) Trabeculectomy (c) Male Female Male Female
40-44 964.58 967.45 724.35 4122.50 4122.50
45-49 972.82 973.42 724.35 4122.50 4122.50
50-54 972.82 973.42 724.35 4122.50 4122.50
55-59 1023.46 1009.71 724.35 4122.58 4122.58
60-64 1023.46 1009.71 724.35 4122.51 4122.51
65-69 1152.08 1086.79 724.35 4122.72 4122.73
70-74 1152.08 1086.79 724.35 4123.47 4123.51
75-79 1309.53 1131.53 724.35 4126.31 4126.55
80-84 1309.53 1131.53 724.35 4131.33 4131.88
85-89 1375.39 1143.02 724.35 4136.77 4131.47
90+ 1375.39 1143.02 724.35 4147.35 4138.12
Calculation of these estimates is explained in Section 6.3.2. a) Cost of anti-glaucoma medications plus the costs ofthe risk of COPD. b) Cost of trabeculoplasty adjusted upwards by 1.5 to account for people who have a second lasertreatment. c) Trabeculectomy adjusted upwards by 1.2 to account for people who have a second trabeculectomy andalso adjusted upwards in the older age groups to account for the increasing risk of cataract surgery as a side effect.
TABLE 7.5: OTHER MODELLED VARIABLES
Item Reference
Disability weights Table 6.1, page 59
Health System Costs Page 60
Aged Care Table 6.6, page 63
Accidental Falls Table 6.9, Table 6.10 and Table 6.11, pages 65 to 66
Depression Table 6.13 and Table 6.14, pages 67 to 68
Employment Page 66
Other Indirect Costs Table 6.15, page 69
Deadweight losses Page 69
Other indirect costs include formal care, lost productivity of carers, aids and modifications and other expenses.

73The Economic Impact of Primary Open Angle Glaucoma - A Dynamic Economic Model
8. The Model
The model was built in Microsoft Office Excel 2003 which ensures portability. The model canbe navigated by clicking on the relevant button on the Main Menu (see Figure 8.1) or by clickingon the sheet tabs at the bottom of the window. In order to access and view the sheets with theparameters and the model’s workings, click the Show/Hide Parameter Sheets button.
Prevalence rates are assumed to be the number of people with the disease at the start of theyear. During the year people are treated, progress, or die, with the impacts of these pathways onprevalence rates occurring at the start of the following year (see Figure 8.3 for a diagram of themodel’s logical structure).
To select scenarios, click on the User Options sheet button (see Figure 8.2). To view output, clickthe Cost-effectiveness Analysis, PopChart, CostChart or CE-PlaneChart buttons.
FIGURE 8.1: MAIN MENU
Cost effectiveness analysis can be conducted comparing various scenarios with the base case.To set the base case, tick the “No new intervention (Standard treatment)” box on theOptions sheet.
Three treatment phases are modelled, consistent with the current treatment regimen:medication, laser (trabeculoplasty) and surgery (trabeculectomy). The order in which thesetreatments is applied can be switched in the “Select intervention” and “Select interventiondetail” windows on the options sheet.

�� Tu n n e l V i s i o nCentre for Eye Research Australia
8. The Model
fIGURE 8.2: OPTIONS ShEETCost effectiveness analysis can be
conducted by running various scenarios of
current treatment and comparing with
the base case.
Economic impact of primary open angle glaucoma Commercial-in-Confidence
72
FIGURE 8-2: OPTIONS SHEET
Centre for Eye Research Australia

��The Economic Impact of Primary Open Angle Glaucoma - A Dynamic Economic Model
fIG
UR
E 8
.3:
MO
DEL
DES
IGN
Not
e:D
iabe
tes
has
been
rep
rese
nted
as
atr
eata
ble
risk
fact
orfo
rpr
imar
yop
en-a
ngle
gla
ucom
a,h
owev
ers
ince
the
evi
denc
efo
rth
isr
elat
ions
hip
ism
ixed
(Se
ctio
n3.
7)it
has
not
bee
nin
clud
edin
the
mod
ellin
gat
thi
sst
age.
8. The Model
The model incorporates data on the costs of OAG and known risk factors, the prevalence and incidence and associated mortality, progression rates and the response to treatment.
Inp
uts
:
mo
difia
ble
pa
ram
ete
rsIn
cid
en
ce
Tre
atm
en
t
co
sts
Re
se
arc
hIO
P (
OH
T)
Me
dic
atio
nB
urd
en
of
Dis
ea
se
Tre
ata
ble
Dia
be
tes
Tra
be
cu
lop
lasty
(la
se
r)
He
alth
syste
m
co
sts
Un
tre
ata
ble
Ag
eT
rab
ecu
lecto
my
(su
rge
ry)
Pro
du
ctivity &
Ind
ire
ct
co
sts
Cu
p-t
o-D
isc R
atio
CE
A
Ou
tpu
ts:
Ce
ntr
al C
orn
ea
l
Th
ickn
ess
Fa
mily
His
tory
Mo
rta
lity
Ge
ne
tics
Eth
nic
ity
Se
ve
re V
I
Ra
tes o
f
pro
gre
ssio
n
an
d r
em
issio
n
Ris
k f
acto
rsO
HT
(N
o V
I)
Ea
rly D
ise
ase
Sta
ge
(No
VI)
Ea
rly D
ise
ase
Sta
ge
(No
VI)
Mild
VI
Mo
de
rate
VI
Ra
tes o
f
pro
gre
ssio
n
an
d r
em
issio
n
Tre
atm
en
t o
ptio
ns a
nd
Effic
acy
Un
tre
ate
d P
reva
len
ce
by s
eve
rity
Tre
ate
d P
reva
len
ce
by s
eve
rity
OH
T (
No
VI)
Su
mm
ary
tab
les &
ch
art
s
Mild
VI
Mo
de
rate
VI
Se
ve
re V
I

76 Tu n n e l V i s i o nCentre for Eye Research Australia
The model has been adapted so that users can test the economic impact of changes to currenttreatment patterns. The scenarios are as follows:
• the base case (No new intervention (standard treatment));
• an increase in the rate at which POAG is diagnosed (to 70%, 80% or 90%);
• a change in the treatment protocol (using laser trabeculoplasty as the primary treatmentinstead of medication, with medication becoming the second treatment phase and surgerythe third phase);
• research to delay progression (by 50% or 75%); and
• combination scenarios — an increase in the rate at which POAG is diagnosed from 50% to80% together with:
- A change in the treatment protocol; or
- The introduction of a new treatment to delay progression by a further 50%.
9.1: THE BASE CASE
The base case scenario can be set to either the current situation (no new intervention/standardtreatment) or an other intervention which can be chosen using the “Select intervention” and“Select intervention detail” from the “Options” sheet.
9.1.1: TO RUN A BASE CASE …
To select the current situation (No new intervention (Standard treatment)) as the base case for comparison:
• tick the “No new intervention (Standard treatment)” box on the “Options” sheet (note: it willtake a little while to reset all the parameters to reflect the current situation).
• Select frequency every year.
• click the “Set as Base Case” button.
In brief, the base case parameters are: a POAG diagnosis rate of 50%, treatment regimen ofmedication first, followed by laser and then finally by surgery, and an impact of treatment(treatment efficacy) of a 50% reduction in the progression of visual impairment. The previouschapters explain the base case in more detail.
If you wish to chose another scenario as the base case (for example, increased diagnosis rates),you must first un-tick the “No new intervention (Standard treatment)” box. Then choose anintervention from the “Select Intervention” box and the “Select Intervention Detail” box.Then click the “Set as Base Case” button.
9.1.2: RESULTS
If current standard treatments continue for the next 20 years, and no new intervention scenariosare applied:
• the prevalence of OHT in Australia will increase from 26,000 people in 2005, to 41,000people in 2025;
• the prevalence of POAG in Australia will increase over the same period from 208,000 people to 379,000; and
9. Intervention Scenarios

77The Economic Impact of Primary Open Angle Glaucoma - A Dynamic Economic Model
Main heading to go here
• the prevalence of visual impairment from POAG in Australia is expected to grow from 24,000 people in 2005 to 52,000 people in 2025 (Table 9.1).
The prevalence estimates here vary somewhat from those in Clear Insight, (CERA 2004) thatused age and gender specific prevalence rates from the MVIP and BMES, with visual impairmentbased on loss of VA. This analysis also uses data from the combined MVIP/BMES data set,but for persons rather than by gender, and measuring visual impairment measured using acombination of VA and VF.
Figure 9.1 shows a steady increase in the prevalence of POAG from 2005 and 2025, driven by anageing population.
TABLE 9.1: PREVALENCE OF OHT AND POAG, BASE CASE (NUMBER OF PEOPLE)
2005 2025
OHT 25,986 40,004
POAG
Early stage 183,530 326,659
Mild stage 1,872 3,667
Moderate stage 12,914 26,047
Severe stage 9,312 22,613
POAG (all stages) 207,628 378,985
Visual Impairment from POAG 24,098 52,327
Prevalence (Total OHT & POAG) 233,614 419,989
Source: Access Economics/CERA dynamic model
FIGURE 9.1: PREVALENCE OHT AND POAG, BASE CASE
The health system costs of glaucoma in 2005 were $355 million and the total annual cost ofglaucoma in 2005 was $1.9 billion. In real dollar terms, these costs are expected to increase to$784 million and $4.3 billion respectively by 2025 (Table 9.2). The net present value of DALYsand other costs of POAG are depicted in Table 9.3.
The total cost of glaucoma will increase in 2005 to $1.92 billion, and $4.3 billion in 2025.
9. Intervention Scenarios
Prevalence (diagnosed and undiagnosed)

78 Tu n n e l V i s i o nCentre for Eye Research Australia
TABLE 9.2: COSTS OF POAG, 2005 AND 2025, BASE CASE
2005 2025
DALYs 6,940 15,592
YLD 6,678 15,184
YLL 262 408
Burden of Disease Costs ($) 1,043,713,812 2,325,613,694
Health System Costs ($) 355,121,086 783,978,738
Comorbid Health Costs ($) 166,419,635 423,192,582
Treatment Costs ($) 188,701,450 360,786,156
Productivity Costs ($) 60,406,596 130,614,278
Other Indirect Costs ($) 109,422,685 240,987,552
Total Costs ($) 1,923,785,265 4,265,173,000
TABLE 9.3: BASE CASE (STANDARD TREATMENT) NET PRESENT VALUE OF DALYS AND COSTS
Net present value 2005 to 2025
DALYs 155,150
Burden of Disease Costs ($ million) 23,896
Health System Costs ($ million) 8,759
Comorbid Health Costs ($million) 4,505
Treatment Costs ($million) 4,254
Productivity Costs ($ million) 1,665
Other Indirect Costs ($million) 2,695
Total Costs ($million) 37,015
The value of the burden of disease due to POAG over time is depicted in Figure 9.2.
FIGURE 9.2: VALUE OF BURDEN OF DISEASE DUE TO POAG ($M), BASE CASE
Sensitivity analysis — zero prevalence and incidence of OHT among those aged 80 and over
9. Intervention Scenarios
Over half the costs of glaucoma relate to
loss of well being.
0
500
1,000
1,500
2,000
2,500
2005 2010 2015 2020 2025
Mil
lio
ns
Burden of Disease Costs
Centre for Eye Research Australia

��The Economic Impact of Primary Open Angle Glaucoma - A Dynamic Economic Model
9. Intervention Scenarios
9.1.3: SENSITIVITY ANALYSIS — ZERO PREVALENCE AND INCIDENCE Of OhT AMONG
ThOSE AGED 80 AND OVER
Asnotedearlier,prevalencedataweresmoothedinpartbecauseofthesmallsamplesizesintheoriginaldataset.UnsmoothedoriginaldatashowedzeroprevalenceratesforOHTamongthoseaged80yearsorover.TheimpactofusingsmoothedratherthanoriginaldataispresentedinTable9.4andTable9.5.ThetotalcostsofPOAGareslightlylower(Table9.5).
TABLE 9.4: COMPARISON Of PREVALENCE Of OhT AND POAG WITh ORIGINAL AND
SMOOThED DATA
Original OhT prevalence Smoothed OhT data (Zero OhT prevalence prevalence data and incidence for those aged 80 years or over)
�00� �0�� �00� �0��
PrevalenceOHTandPOAG 227,827 406,840 233,614 419,989
PrevOHT 23,684 36,340 25,986 41,004
PrevearlystagePOAG 180,149 318,477 183,530 326,659
PrevMildPOAG 1,826 3,550 1,872 3,667
PrevModeratePOAG 12,871 25,918 12,914 26,047
PrevSeverePOAG 9,297 22,555 9,312 22,613
TABLE 9.5: NET PRESENT VALUE Of DALYS AND COSTS, SENSITIVITY ANALYSIS ON OhT
PREVALENCE AND INCIDENCE fOR ThOSE AGED 80+ YEARS
Net present value Net present value 2005 to 2025 2005 to 2025
Zero OhT prevalence and Smoothed data incidence for those aged 80 years or over
DALYs 154,656 155,150
BurdenofDiseaseCosts($million) 23,836 23,896
HealthSystemCosts($million) 8,636 8,759
ComorbidHealthCosts($million) 4,474 4,505
TreatmentCosts($million) 4,162 4,254
ProductivityCosts($million) 1,660 1,665
OtherIndirectCosts($million) 2,666 2,695
TotalCosts($million) 36,798 37,015

�0 Tu n n e l V i s i o nCentre for Eye Research Australia
�.�:IMPROVEDDIAGNOSISRATE
Morethan50%ofthoseindevelopedcountrieswithglaucomaareunawaretheyhavethedisease(Quigley,1996).Inapopulationbasedstudy(theMVIP),Wensoretal,(1998)foundthat50%ofthosewithdefinitePOAGhadnotbeendiagnosedpreviously,andWongetal,(2004)examinedthepresenceofundiagnosedOAGinpeoplewhohadvisitedaneyecareproviderinthepreviousyearusingVisualImpairmentProjectdatafromMelbourneandruralcommunitiesinVictoria.Theyfoundthat81%ofpossiblecases,72%ofprobablecasesand59%ofdefinitecasesofOAGwerepreviouslyundiagnosed.Ofthe115participantswithprobableordefiniteOAG,72(63%)werepreviouslyundiagnosed.Oftheseundiagnosedprobableanddefinitecases,35(49%)hadvisitedaneyecareproviderwithintheprevious12monthperiod.The35undiagnosedpatientswerecomparedwith43diagnosedpatientswhohadvisitedanoptometristorophthalmologistorbothintheprevious12months.Thetypeofeyeprofessionalseen,andthepresenceofVFdefectsweretheonlystatisticallysignificantvariablesbetweenthediagnosedandundiagnosedglaucomagroups.
DiagnosisratesforPOAGcouldbeimprovedby:
1) atthecurrentdiagnosisthreshold,enhancingthequalityofcarebyensuringophthalmologistsincludetheappropriateVFtestswhenexaminingpatients’eyes;
2) carefulexaminationoftheopticdiscinallpatientsregardlessofIOP;and
3) improvingthefocusonfamilyhistorysincepeoplewithafamilyhistoryofglaucomahaveahigherchanceofdevelopingPOAG.
Underthebasecasescenario,50%ofpeoplewithPOAGarediagnosedandtreated.Underthisscenario,theimpactofincreasingtheproportionofpeoplediagnosedwithPOAGto(i)70%,(ii)80%and(iii)90%canbeassessed.Nocostshavebeenaddedtothemodeltoallowforeducationofclinicians.
Underthisscenariotheonlyparameterthatisvariedistherateatwhichpeoplearediagnosed.ThecostsandbenefitsthatresultfromthisanalysisreflectmorepeoplereceivingtreatmenttoslowprogressionofPOAG.
9.2.1: TO RUN ThIS INTERVENTION ThROUGh ThE MODEL …
• Tickthe“NonewIntervention(Standardtreatment)”boxandclickonthe“SetasBaseCase”buttontoensurethecurrentsituationisthecomparator.
• Un-tickthe“NonewIntervention(Standardtreatment)”boxandmakesurethatthe“Frequency–EveryYear”boxisticked.
• OntheOptionssheet,choose“ImprovedDiagnosisRate”intheSelectInterventionboxand“DiagnosisRate70%”,or“DiagnosisRate80%”,or“DiagnosisRate90%”intheSelectInterventionDetailbox.
• Thenclickthe“SetasScenario1”button,torunthenewscenario.
• Asecondscenariocanbeevaluatedbyreselectingfromthe“SelectIntervention”and“SelectInterventionDetail”windows.Thenclickthe“SetasScenario2”button,torunthenewscenario.
• ClickCompareScenarios(CEA).
9. Intervention Scenarios
At present, 50% of people with POAG are
undiagnosed.
Centre for Eye Research Australia
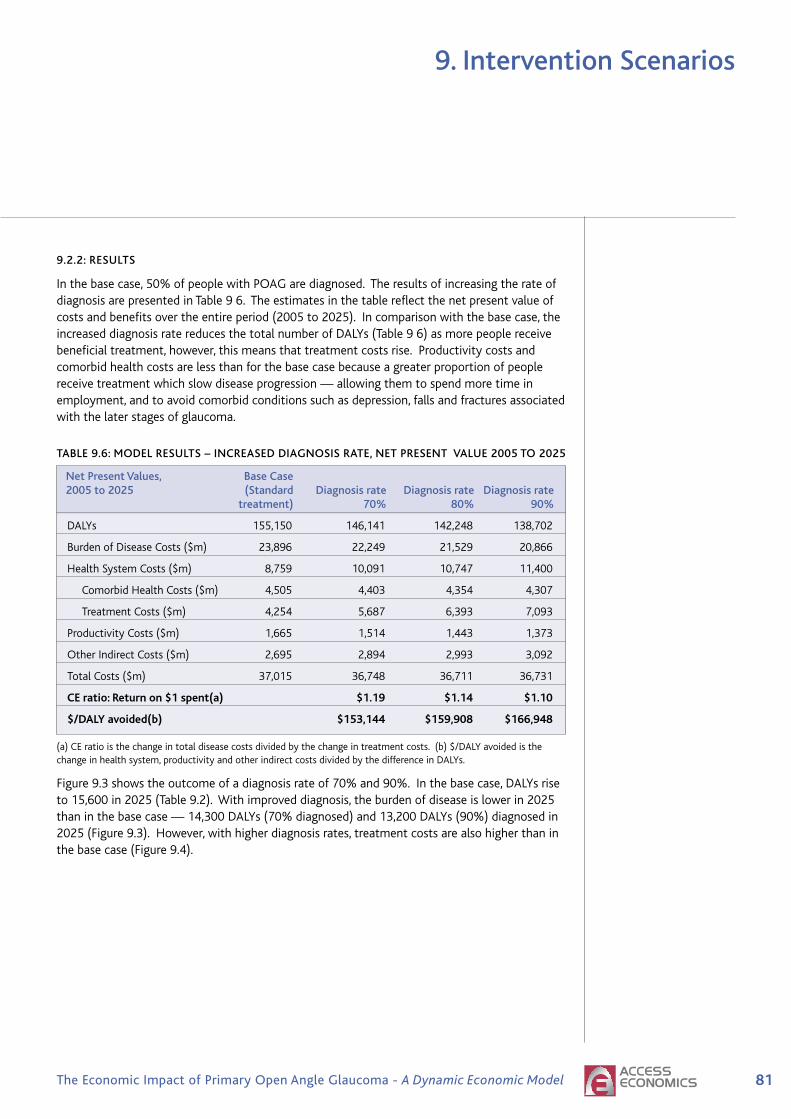
��The Economic Impact of Primary Open Angle Glaucoma - A Dynamic Economic Model
9. Intervention Scenarios
9.2.2: RESULTS
Inthebasecase,50%ofpeoplewithPOAGarediagnosed.TheresultsofincreasingtherateofdiagnosisarepresentedinTable96.Theestimatesinthetablereflectthenetpresentvalueofcostsandbenefitsovertheentireperiod(2005to2025).Incomparisonwiththebasecase,theincreaseddiagnosisratereducesthetotalnumberofDALYs(Table96)asmorepeoplereceivebeneficialtreatment,however,thismeansthattreatmentcostsrise.Productivitycostsandcomorbidhealthcostsarelessthanforthebasecasebecauseagreaterproportionofpeoplereceivetreatmentwhichslowdiseaseprogression—allowingthemtospendmoretimeinemployment,andtoavoidcomorbidconditionssuchasdepression,fallsandfracturesassociatedwiththelaterstagesofglaucoma.
TABLE 9.6: MODEL RESULTS – INCREASED DIAGNOSIS RATE, NET PRESENT VALUE 2005 TO 2025
Net Present Values, Base Case 2005 to 2025 (Standard Diagnosis rate Diagnosis rate Diagnosis rate treatment) 70% 80% 90%
DALYs 155,150 146,141 142,248 138,702
BurdenofDiseaseCosts($m) 23,896 22,249 21,529 20,866
HealthSystemCosts($m) 8,759 10,091 10,747 11,400
ComorbidHealthCosts($m) 4,505 4,403 4,354 4,307
TreatmentCosts($m) 4,254 5,687 6,393 7,093
ProductivityCosts($m) 1,665 1,514 1,443 1,373
OtherIndirectCosts($m) 2,695 2,894 2,993 3,092
TotalCosts($m) 37,015 36,748 36,711 36,731
CEratio:Returnon$�spent(a) $�.�� $�.�� $�.�0
$/DALYavoided(b) $���,��� $���,�0� $���,���
(a)CEratioisthechangeintotaldiseasecostsdividedbythechangeintreatmentcosts.(b)$/DALYavoidedisthechangeinhealthsystem,productivityandotherindirectcostsdividedbythedifferenceinDALYs.
Figure9.3showstheoutcomeofadiagnosisrateof70%and90%.Inthebasecase,DALYsriseto15,600in2025(Table9.2).Withimproveddiagnosis,theburdenofdiseaseislowerin2025thaninthebasecase—14,300DALYs(70%diagnosed)and13,200DALYs(90%)diagnosedin2025(Figure9.3).However,withhigherdiagnosisrates,treatmentcostsarealsohigherthaninthebasecase(Figure9.4).

�� Tu n n e l V i s i o nCentre for Eye Research Australia
9. Intervention Scenarios
fIGURE 9.3: IMPACT Of INCREASED DIAGNOSIS RATES ON DALYS(A)
fIGURE 9.4: IMPACTS Of INCREASED DIAGNOSIS RATES ON TREATMENT COSTS
TherelativecosteffectivenessofeachscenarioisdepictedinFigure9.5.Thebasecaseisrepresentedattheorigin.EffectivenessismeasuredasthetotalnumberofDALYsavoidedandcostsaretotalcosts(excludingthevalueoftheburdenofdisease).
• Atzeroadditionalcosts(ie.noadditionalcostsofeducatingcliniciansinordertoimprovediagnosisrates),improveddiagnosisratesfrom50%to70%,80%and90%,are costeffective at between $153,000 and $167,000 per DALY avoided.
• Ifeducatingclinicianswerecostly,thesescenarioswouldbecomelesscosteffective.
Economic impact of primary open angle glaucoma Commercial-in-Confidence
80
diagnosed in 2025 (Figure 9-3). However, with higher diagnosis rates, treatment costs are
also higher than in the base case (Figure 9-4).
FIGURE 9-3: IMPACT OF INCREASED DIAGNOSIS RATES ON DALYS(A)
DALYs
0
2,000
4,000
6,000
8,000
10,000
12,000
14,000
16,000
18,000
2005 2010 2015 2020 2025
Base Case (Standard treatment)
Diagnosis rate 70%
Diagnosis rate 90%
FIGURE 9-4: IMPACTS OF INCREASED DIAGNOSIS RATES ON TREATMENT COSTS
Treatment Costs
0
100,000,000
200,000,000
300,000,000
400,000,000
500,000,000
600,000,000
700,000,000
2005 2010 2015 2020 2025
Base Case (Standard treatment)
Diagnosis rate 70%
Diagnosis rate 90%
The relative cost effectiveness of each scenario is depicted in Figure 9-5. The base case is
represented at the origin. Effectiveness is measured as the total number of DALYs avoided
and costs are total costs (excluding the value of the burden of disease).
At zero additional costs (ie. no additional costs of educating clinicians in order to improve
diagnosis rates), improved diagnosis rates from 50% to 70%, 80% and 90%, are costeffective at between $153,000 and $167,000 per DALY avoided.
If educating clinicians were costly, these scenarios would become less cost effective.
Increasing the diagnosis rate to 80% would cost $160,000/DALY.
Centre for Eye Research Australia

��The Economic Impact of Primary Open Angle Glaucoma - A Dynamic Economic Model
9. Intervention Scenarios
fIGURE 9.5: COST EffECTIVENESS PLANE – INCREASE DIAGNOSIS RATE(A)
(a)EffectivenessmeasuredasDALYsavoided.Costsreflecthealthsystem,productivityandotherindirectcosts.(CosteffectivenessismeasuredasthecostperDALYavoided.ThevalueoftheburdenofdiseaseisexcludedfromthecostestimateinthenumeratorsincethisisrepresentedbyDALYsavoidedinthedenominator).
�.�:CHANGEINTHETREATMENTPROTOCOL(PRIMARYLASER)
Asnotedabove,inbrief,thebasecaseparametersare:aPOAGdiagnosisrateof50%,treatmentregimenofmedicationfirst,followedbylaserandthenfinallybysurgery,failureratesformedicationof4.3%ofpatientsperannum,50%forlasertrabeculoplastyand50%fortrabeculectomy,andanoverallimpactoftreatmentonvision(treatmentefficacy)ofa50%reductionintheprogressionofvisualimpairment.Underthisscenario—“Changeinthetreatmentprotocol”—laserreplacestopicalmedicationasfirstlinetherapyfrom2005onwardssothatpatientsbegintreatmentwithalasertrabeculoplasty,thenfollowwithmedicationandfinallytrabeculectomy.
Treatmentcost-savingsarepossiblefromthisscenario,asmedicationisnolongerrequiredincombinationwithlasertreatment.Underthebasecase,ontheotherhand,wherelaserissecondlinetherapy,itiscombinedwithmedication.
TheGLT(whichcomparedtwo180degreeALTtreatmentswithtimolol)showedthatALTwasatleastasefficaciousasmedicationasaninitialtreatmentforglaucoma(GlaucomaLaserTrialResearchGroup,1995).However,ALTwasnotcommonlyadoptedasaprimarytreatmentbecauseofconcernaboutsideeffectsandthereducedefficacyofrepeatALTtreatments.Inaddition,atthetimeoftheGLT,prostaglandinswerenotinuseastopicalmedicationsforglaucoma(asMcIlraithetal,(2006)noted).Evidencefortheeffectivenessoflasertreatmentsasaprimarytherapyinclude:
• TheEMGT,arandomisedclinicaltrialcomparingALTandmedicationwithnotreatment,foundthat,whenadjustedforcensoringandothercovariates,progressionriskwashalvedbytreatment.After6years,theHRwas0.5(95%CI0.35to0.71).
• Nagaretal,2005,whoconductedarandomisedprospectivestudycomparing360degreeselectivelasertherapy(SLT)with0.005%latanoprostatnight,foundnodifferencesinmeanVFdefectsbetweengroupsafter12months.
• McIlraithetal,2006,inanon-randomisedpilotstudyof100eyesnewlydiagnosedPOAGandOHTin61patients,andcomparing180degreeSLTwithlatanoprost,foundthatthetwotreatmentswereequallyefficaciousinreducingIOPinover12months.
Commercial-in-Confidence Economic impact of primary open angle glaucoma
81
FIGURE 9-5: COST EFFECTIVENESS PLANE – INCREASE DIAGNOSIS RATE(A)
Diagnosis rate 70%
Diagnosis rate 90%
0
500,000,000
1,000,000,000
1,500,000,000
2,000,000,000
2,500,000,000
3,000,000,000
0 2,000 4,000 6,000 8,000 10,000 12,000 14,000 16,000 18,000
Effectiveness
Co
sts
(a) Effectiveness measured as DALYs avoided. Costs reflect health system, productivity and other indirect costs.
(Cost effectiveness is measured as the cost per DALY avoided. The value of the burden of disease is excludedfrom the cost estimate in the numerator since this is represented by DALYs avoided in the denominator).
9.3 CHANGE IN THE TREATMENT PROTOCOL (PRIMARYLASER)
As noted above, in brief, the base case parameters are: a POAG diagnosis rate of 50%,
treatment regimen of medication first, followed by laser and then finally by surgery, failurerates for medication of 4.3% of patients per annum, 50% for laser trabeculoplasty and 50% for
trabeculectomy, and an overall impact of treatment on vision (treatment efficacy) of a 50%
reduction in the progression of visual impairment. Under this scenario — “Change in thetreatment protocol” — laser replaces topical medication as first line therapy from 2005
onwards so that patients begin treatment with a laser trabeculoplasty, then follow with
medication and finally trabeculectomy.
Treatment cost-savings are possible from this scenario, as medication is no longer required incombination with laser treatment. Under the base case, on the other hand, where laser is
second line therapy, it is combined with medication.
The GLT (which compared two 180 degree ALT treatments with timolol) showed that ALT wasat least as efficacious as medication as an initial treatment for glaucoma (Glaucoma Laser
Trial Research Group, 1995). However, ALT was not commonly adopted as a primary
treatment because of concern about side effects and the reduced efficacy of repeat ALT
treatments. In addition, at the time of the GLT, prostaglandins were not in use as topicalmedications for glaucoma (as McIlraith et al, (2006) noted). Evidence for the effectiveness of
laser treatments as a primary therapy include:
The EMGT, a randomised clinical trial comparing ALT and medication with no treatment,found that, when adjusted for censoring and other covariates, progression risk was
halved by treatment. After 6 years, the HR was 0.5 (95% CI 0.35 to 0.71).
Nagar et al, 2005, who conducted a randomised prospective study comparing 360degree selective laser therapy (SLT) with 0.005% latanoprost at night, found no
differences in mean VF defects between groups after 12 months.

�� Tu n n e l V i s i o nCentre for Eye Research Australia
9. Intervention Scenarios
• Sanfilippo(1999)citedresearchsuggestingALTwasmoreefficaciousthatpilocarpine.TwoyearsuccessrateswhenassessingIOPwere63%and44%fortheALTandpilocarpinegroupsrespectively.ItwasfoundthatALTgaveasignificantlybetterpreservationoftheVFthanpilocarpine.Throughregressionanalysisthe‘timelefttoblindness’fortheALTgroupwas31yearsandforthepilocarpine-treatedgroup,12years(assumingalineardecay)(SanfilippoP,1999).
9.3.1: TO RUN ThIS INTERVENTION ThROUGh ThE MODEL …
• Toensureyoustartwitha“blankpage”,ontheOptionssheet,clickthescenarioresetbuttons.• Tickthe“Nonewintervention(Standardtreatment)”box• Selectfrequencyeveryyear• clickonthe“SetasBaseCase”button(sothatstandardtreatmentisthecomparator).• Un-tickthe“Nonewintervention(Standardtreatment)”box.• Makesurethatthe“Frequency–EveryYear”boxisticked.• OntheOptionssheets,choose“ChangeTreatmentProtocol”intheSelectInterventionbox
and“Primarylasertrabeculoplasty”intheSelectInterventionDetailbox.Thenclickthe“SetasScenario1”button,torunthenewscenario.
• ClickCompareScenarios(CEA).
9.3.2: RESULTS
TheresultsarepresentedinTable9.7.Thechangeintreatmentprotocoliscost-saving(consistentwiththehypothesisabove).Thereislittleimpactontheresultsifthecostoflaseristripledorincreasesfivefoldtoaccountforthecostofsideeffects(assumingthesecanbefixedrelativelyquicklysothereisnoimpactonthepatient’squalityoflife)(Table9.7).
Figure9.6showsthatthecost-savingsassociatedwiththenewprotocolincreaseovertimeasmorepeoplearediagnosedandtreatedforPOAGbecauseofpopulationageing.TheburdenofdiseaseisdepictedinFigure9.7.
TABLE 9.7: MODEL RESULTS – PROTOCOL ChANGE – TRABECULOPLASTY AS PRIMARY TREATMENT
Net Present Standard Primary Standard Primary Standard Primary Values Laser treatment treatment Laser treatment Laser ($724) ($2,173) ($3,622)
DALYs 155,150 155,974 155,150 155,974 155,150 155,974
BurdenofDisease 23,896 24,095 23,877 24,070 23,858 24,046Costs($m)
HealthSystem 8,759 8,392 8,865 8,548 8,971 8,703Costs($m)
ComorbidHealth 4,505 4,519 4,505 4,519 4,505 4,519 Costs($m)
TreatmentCosts($m) 4,254 3,873 4,360 4,029 4,465 4,184
ProductivityCosts($m) 1,665 1,671 1,665 1,671 1,665 1,671
OtherIndirectCosts($m) 2,695 2,628 2,715 2,658 2,736 2,689
TotalCosts($m) 37,015 36,787 37,122 36,948 37,230 37,109
CEratio:Returnon $0.�0 $0.�� $0.�� $�spent(a) Cost- Cost- Cost- $/DALYavoided Saving Saving Saving
(a)Definedasthedifferenceinindirectcostsbetweenprimarylaserandthebasecaseforeveryadditionaldollarspentontreatment.
Centre for Eye Research Australia
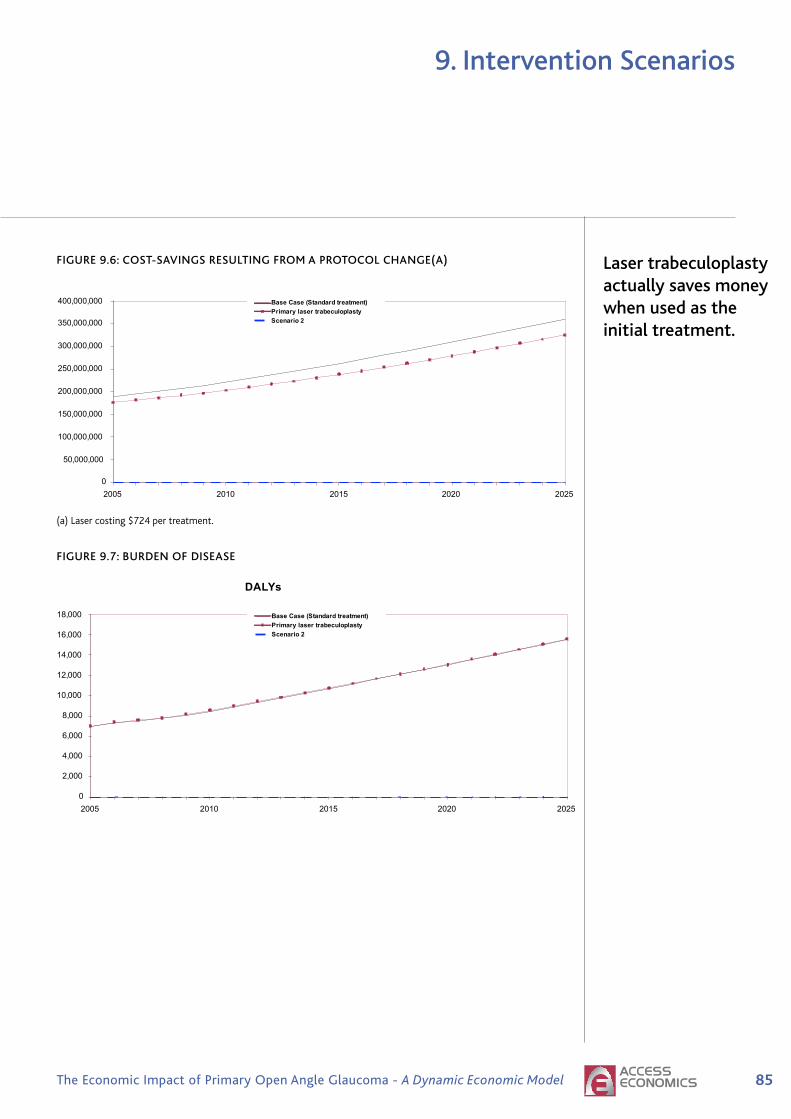
��The Economic Impact of Primary Open Angle Glaucoma - A Dynamic Economic Model
9. Intervention Scenarios
fIGURE 9.6: COST-SAVINGS RESULTING fROM A PROTOCOL ChANGE(A)
(a)Lasercosting$724pertreatment.
fIGURE 9.7: BURDEN Of DISEASE
Economic impact of primary open angle glaucoma Commercial-in-Confidence
84
FIGURE 9-7 BURDEN OF DISEASE
DALYs
0
2,000
4,000
6,000
8,000
10,000
12,000
14,000
16,000
18,000
2005 2010 2015 2020 2025
Base Case (Standard treatment)
Primary laser trabeculoplasty
Scenario 2
9.3.3 SENSITIVITY ANALYSIS— THE IMPACT OF THE CONSERVATIVE
APPROACH TO SURGERY FAILURE RATES
Taking a conservative approach to the surgery failure rate doesn’t substantively affect theresults because treatment efficacy is measured according to whether a patient is treated or not
rather than the particular treatment the patient receives. In other words, all treated patients
(no matter what order they receive treatments) experience a reduction in progression of visualimpairment by 50% compared with people who have undiagnosed POAG. Taking a
conservative approach to the surgery failure rate means that more patients progress more
quickly to medications — bringing forward the costs of medications for those patients andleading to higher health system cost estimates (Table 9-8) . Repeat surgery may also be
performed. Based on MBS data surgery is performed at a rate of 1.2 and costs have been
factored accordingly.
Commercial-in-Confidence Economic impact of primary open angle glaucoma
83
TABLE 9-7: MODEL RESULTS – PROTOCOL CHANGE — TRABECULOPLASTY AS PRIMARY
TREATMENT
Net PresentValues
Standardtreatment
PrimaryLaser($724)
Standardtreatment
PrimaryLaser
($2,173)
Standardtreatment
PrimaryLaser
($3,622)
DALYs 155,150 155,974 155,150 155,974 155,150 155,974
Burden ofDiseaseCosts ($m) 23,896 24,095 23,877 24,070 23,858 24,046
HealthSystemCosts ($m) 8,759 8,392 8,865 8,548 8,971 8,703
ComorbidHealth Costs($m) 4,505 4,519 4,505 4,519 4,505 4,519
TreatmentCosts ($m) 4,254 3,873 4,360 4,029 4,465 4,184
ProductivityCosts ($m) 1,665 1,671 1,665 1,671 1,665 1,671
Other IndirectCosts ($m) 2,695 2,628 2,715 2,658 2,736 2,689
Total Costs($m) 37,015 36,787 37,122 36,948 37,230 37,109
CE ratio:Return on $1spent(a) $0.40 $0.47 $0.57
$/DALYavoided
Cost-Saving
Cost-Saving
Cost-Saving
(a) Defined as the difference in indirect costs between primary laser and the base case for every additional dollarspent on treatment.
FIGURE 9-6: COST-SAVINGS RESULTING FROM A PROTOCOL CHANGE(A)
Treatment Costs
0
50,000,000
100,000,000
150,000,000
200,000,000
250,000,000
300,000,000
350,000,000
400,000,000
2005 2010 2015 2020 2025
Base Case (Standard treatment)
Primary laser trabeculoplasty
Scenario 2
(a) Laser costing $724 per treatment.
Laser trabeculoplasty actually saves money when used as the initial treatment.

�� Tu n n e l V i s i o nCentre for Eye Research Australia
9. Intervention Scenarios
9.3.3: SENSITIVITY ANALYSIS — ThE IMPACT Of ThE CONSERVATIVE APPROACh
TO SURGERY fAILURE RATES
Takingaconservativeapproachtothesurgeryfailureratedoesn’tsubstantivelyaffecttheresultsbecausetreatmentefficacyismeasuredaccordingtowhetherapatientistreatedornotratherthantheparticulartreatmentthepatientreceives.Inotherwords,alltreatedpatients(nomatterwhatordertheyreceivetreatments)experienceareductioninprogressionofvisualimpairmentby50%comparedwithpeoplewhohaveundiagnosedPOAG.Takingaconservativeapproachtothesurgeryfailureratemeansthatmorepatientsprogressmorequicklytomedications—bringingforwardthecostsofmedicationsforthosepatientsandleadingtohigherhealthsystemcostestimates(Table9.8).Repeatsurgerymayalsobeperformed.BasedonMBSdatasurgeryisperformedatarateof1.2andcostshavebeenfactoredaccordingly.
TABLE 9.8: SENSITIVITY ANALYSIS — A CONSERVATIVE APPROACh TO SURGERY
fAILURE RATES
Net Present Standard Primary Laser Standard Primary Laser Values treatment ($724) treatment ($724)
Laser failure rate 50%, Laser failure rate 50%, surgery failure rate 50% surgery failure rate 10%
DALYs 155,150 155,974 155,150 155,974
BurdenofDiseaseCosts($m) 23,896 24,095 23,950 24,144
HealthSystemCosts($m) 8,759 8,392 8,468 8,128
ComorbidHealthCosts($m) 4,505 4,519 4,505 4,519
TreatmentCosts($m) 4,254 3,873 3,963 3,609
ProductivityCosts($m) 1,665 1,671 1,665 1,671
OtherIndirectCosts($m) 2,695 2,628 2,638 2,576
TotalCosts($m) 37,015 36,787 36,721 36,520
CEratio:Returnon$�spent(a) $0.�0 $0.��
$/DALYavoided Cost-Saving Cost-Saving
(a)Definedasthedifferenceinindirectcostsbetweenprimarylaserandthebasecaseforeveryadditionaldollarspentontreatment.
Centre for Eye Research Australia

��The Economic Impact of Primary Open Angle Glaucoma - A Dynamic Economic Model
9. Intervention Scenarios
�.�:RESEARCHANDDEVELOPMENT
ThisscenariolooksatthepossiblereturnsfromnewtreatmentsthatmightbedevelopedtofurtherslowtheprogressionofPOAG.OnepossibleexamplecurrentlyunderinvestigationmightbeneuroprotectionwiththedrugMemantine(anNMDA22-receptorantagonistcurrentlyusedforAlzheimersdisease).MemantineiscurrentlyinphaseIIItrialsforglaucomaandatthetimeofwritingtreatmentefficacyresultswerenotavailable.
Themodelallowsfortwopossiblenewtreatmentefficacyoptions—thenewtherapyreducestheprogressionofglaucomabyafurther50%or75%overandabovethereductioninprogressionfromcurrenttreatments.ItisassumedthatthehypotheticaltreatmentisgiventoeachpersonbeingtreatedforPOAG,regardlessoftheirtreatmentstage.The new therapy is taken continuously over the patient’s remaining life. Thetreatmentisaddedtocurrenttreatmentsratherthansubstitutingforthem.Inthismodel,theannualcostperpersonforthistreatmenthasbeensetat$1,000regardlessofefficacy.
9.4.1: TO RUN ThIS INTERVENTION ThROUGh ThE MODEL …
• Toensureyoustartwitha“blankpage”,ontheOptionssheet,clicktheresetbuttons.
• OntheOptionssheets,choose“ResearchandDevelopment”intheSelectInterventionboxand“R&DReducesProgression(50%)”,or“R&DReducesProgression(75%)”.
• Tickthe“NonewIntervention(StandardTreatment)”boxandclickonthe“SetasBaseCase”buttontosetthecurrentsituationasthebasecomparator.
• Un-tickthe“NonewIntervention(StandardTreatment)”boxandmakesurethatthe“Frequency–EveryYear”boxisticked.Thenclickthe“SetasScenario1”button,torunthenewscenario.
• ClickCompareScenarios(CEA).
9.4.2: RESULTS
Theresultsofintroducingtwonewtherapiesthatreduceprogressionby50%andby75%overthebasecasearepresentedinTable9.8.Comparedwiththebasecase,thenetpresentvalueofDALYs,productivitycostsandcomorbidcostsarelower.Theresultsreflectthebenefitsofdelayingprogression,allowingpeopletoremaininwork,andexperiencefewercomorbidconditionsthatareassociatedwiththelaterstagesofglaucoma.ThedeclineinDALYsovertimeassociatedwithdelayingprogressionby50%and75%overthebasecaseisdepictedinFigure9.8.
22N-methyl-D-aspartate
The impact of new treatments to reduce progression was examined.
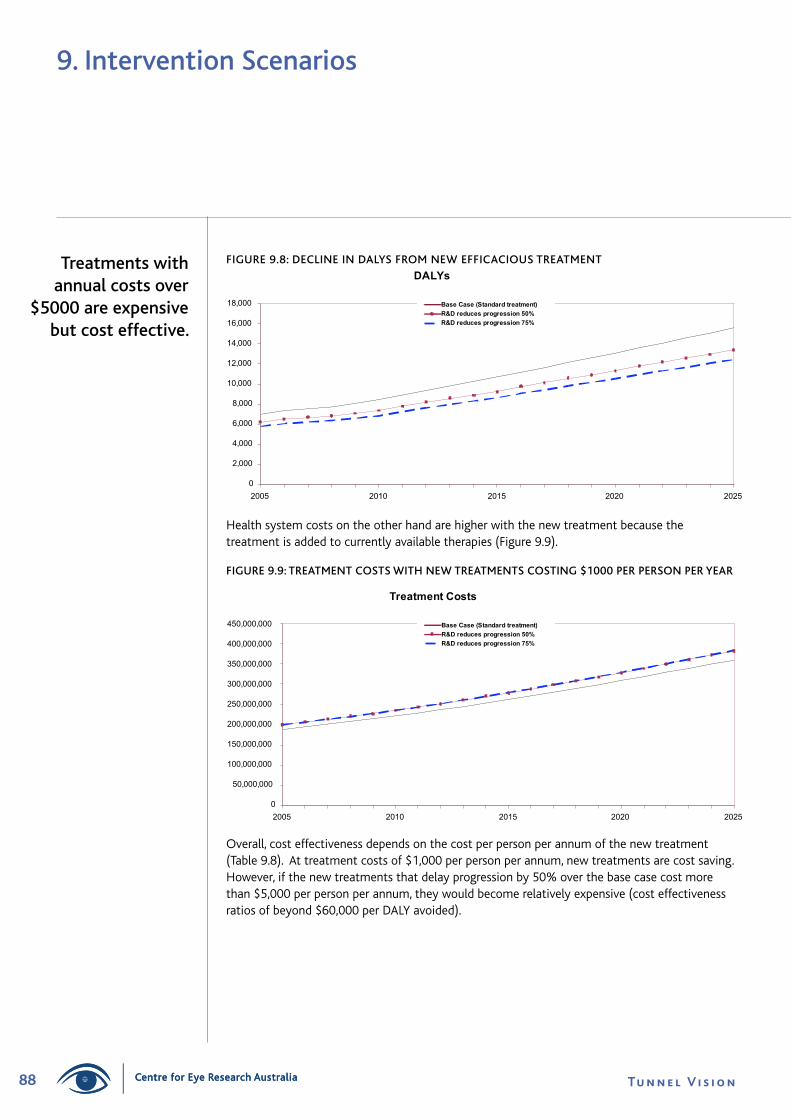
�� Tu n n e l V i s i o nCentre for Eye Research Australia
9. Intervention Scenarios
Treatments with annual costs over
$5000 are expensive but cost effective.
fIGURE 9.8: DECLINE IN DALYS fROM NEW EffICACIOUS TREATMENT
Healthsystemcostsontheotherhandarehigherwiththenewtreatmentbecausethetreatmentisaddedtocurrentlyavailabletherapies(Figure9.9).
fIGURE 9.9: TREATMENT COSTS WITh NEW TREATMENTS COSTING $1000 PER PERSON PER YEAR
Overall,costeffectivenessdependsonthecostperpersonperannumofthenewtreatment(Table9.8).Attreatmentcostsof$1,000perpersonperannum,newtreatmentsarecostsaving.However,ifthenewtreatmentsthatdelayprogressionby50%overthebasecasecostmorethan$5,000perpersonperannum,theywouldbecomerelativelyexpensive(costeffectivenessratiosofbeyond$60,000perDALYavoided).
Economic impact of primary open angle glaucoma Commercial-in-Confidence
86
Tick the “No new Intervention (Standard Treatment)” box and click on the “Set as Base
Case” button to set the current situation as the base comparator.
Un-tick the “No new Intervention (Standard Treatment)” box and make sure that the
“Frequency – Every Year” box is ticked. Then click the “Set as Scenario 1” button, to runthe new scenario.
Click Compare Scenarios (CEA).
9.4.2 RESULTS
The results of introducing two new therapies that reduce progression by 50% and by 75% overthe base case are presented in Table 9-9. Compared with the base case, the net present
value of DALYs, productivity costs and comorbid costs are lower. The results reflect the
benefits of delaying progression, allowing people to remain in work, and experience fewer
comorbid conditions that are associated with the later stages of glaucoma. The decline inDALYs over time associated with delaying progression by 50% and 75% over the base case is
depicted in Figure 9-8.
FIGURE 9-8: DECLINE IN DALYS FROM NEW EFFICACIOUS TREATMENT
DALYs
0
2,000
4,000
6,000
8,000
10,000
12,000
14,000
16,000
18,000
2005 2010 2015 2020 2025
Base Case (Standard treatment)
R&D reduces progression 50%
R&D reduces progression 75%
Health system costs on the other hand are higher with the new treatment because the
treatment is added to currently available therapies (Figure 9-9).
Commercial-in-Confidence Economic impact of primary open angle glaucoma
87
FIGURE 9-9 TREATMENT COSTS WITH NEW TREATMENTS COSTING $1000 PER PERSON PER YEAR
Treatment Costs
0
50,000,000
100,000,000
150,000,000
200,000,000
250,000,000
300,000,000
350,000,000
400,000,000
450,000,000
2005 2010 2015 2020 2025
Base Case (Standard treatment)
R&D reduces progression 50%
R&D reduces progression 75%
Overall, cost effectiveness depends on the cost per person per annum of the new treatment(Table 9-9). At treatment costs of $1,000 per person per annum, new treatments are costsaving. However, if the new treatments that delay progression by 50% over the base casecost more than $5,000 per person per annum, they would become relatively expensive (costeffectiveness ratios of beyond $60,000 per DALY avoided).
Centre for Eye Research Australia
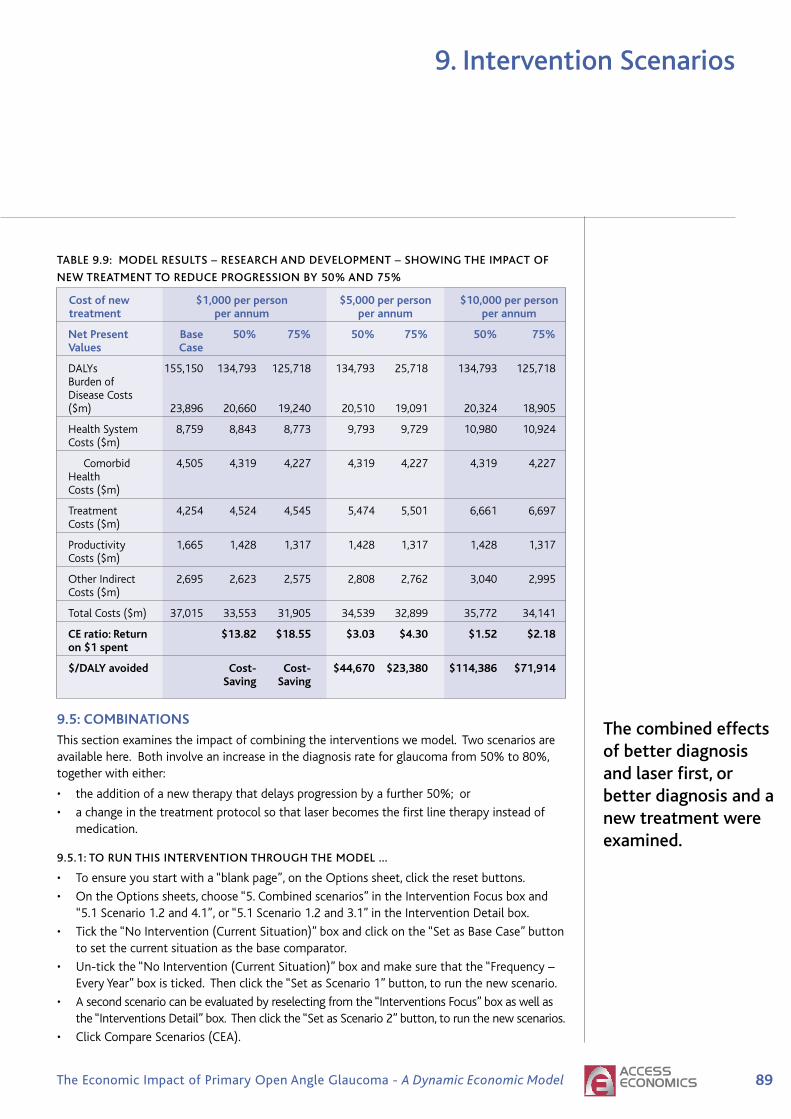
��The Economic Impact of Primary Open Angle Glaucoma - A Dynamic Economic Model
9. Intervention Scenarios
TABLE 9.9: MODEL RESULTS – RESEARCh AND DEVELOPMENT – ShOWING ThE IMPACT Of
NEW TREATMENT TO REDUCE PROGRESSION BY 50% AND 75%
Costofnew $�,000perperson $�,000perperson $�0,000perperson treatment perannum perannum perannum
NetPresent Base �0% ��% �0% ��% �0% ��% Values Case
DALYs 155,150 134,793 125,718 134,793 25,718 134,793 125,718 Burdenof DiseaseCosts ($m) 23,896 20,660 19,240 20,510 19,091 20,324 18,905
HealthSystem 8,759 8,843 8,773 9,793 9,729 10,980 10,924 Costs($m)
Comorbid 4,505 4,319 4,227 4,319 4,227 4,319 4,227 Health Costs($m)
Treatment 4,254 4,524 4,545 5,474 5,501 6,661 6,697 Costs($m)
Productivity 1,665 1,428 1,317 1,428 1,317 1,428 1,317 Costs($m)
OtherIndirect 2,695 2,623 2,575 2,808 2,762 3,040 2,995 Costs($m)
TotalCosts($m) 37,015 33,553 31,905 34,539 32,899 35,772 34,141
CEratio:Return $��.�� $��.�� $�.0� $�.�0 $�.�� $�.�� on$�spent
$/DALYavoided Cost- Cost- $��,��0 $��,��0 $���,��� $��,��� Saving Saving
�.�:COMBINATIONS
Thissectionexaminestheimpactofcombiningtheinterventionswemodel.Twoscenariosareavailablehere.Bothinvolveanincreaseinthediagnosisrateforglaucomafrom50%to80%,togetherwitheither:
• theadditionofanewtherapythatdelaysprogressionbyafurther50%;or
• achangeinthetreatmentprotocolsothatlaserbecomesthefirstlinetherapyinsteadofmedication.
9.5.1: TO RUN ThIS INTERVENTION ThROUGh ThE MODEL …
• Toensureyoustartwitha“blankpage”,ontheOptionssheet,clicktheresetbuttons.
• OntheOptionssheets,choose“5.Combinedscenarios”intheInterventionFocusboxand“5.1Scenario1.2and4.1”,or“5.1Scenario1.2and3.1”intheInterventionDetailbox.
• Tickthe“NoIntervention(CurrentSituation)”boxandclickonthe“SetasBaseCase”buttontosetthecurrentsituationasthebasecomparator.
• Un-tickthe“NoIntervention(CurrentSituation)”boxandmakesurethatthe“Frequency–EveryYear”boxisticked.Thenclickthe“SetasScenario1”button,torunthenewscenario.
• Asecondscenariocanbeevaluatedbyreselectingfromthe“InterventionsFocus”boxaswellasthe“InterventionsDetail”box.Thenclickthe“SetasScenario2”button,torunthenewscenarios.
• ClickCompareScenarios(CEA).
The combined effects of better diagnosis and laser first, or better diagnosis and a new treatment were examined.

�0 Tu n n e l V i s i o nCentre for Eye Research Australia
9. Intervention Scenarios
Economic impact of primary open angle glaucoma Commercial-in-Confidence
90
FIGURE 9-10: REDUCTION IN DALYS, COMBINED INTERVENTIONS
DALYs
0
2,000
4,000
6,000
8,000
10,000
12,000
14,000
16,000
18,000
2005 2010 2015 2020 2025
Base Case (Standard treatment)
Diagnosis rate 80% and R&D
reduces progression 50%
Diagnosis rate 80% and primary
laser trabeculoplasty
Treatment costs increase over time (driven by an ageing population and an increase in theproportion of people with POAG who are diagnosed from 50% in the base case to 80% in each
of the combined scenarios) (Figure 9-11). The pattern of total costs over time are shown inFigure 9-12.
FIGURE 9-11: TREATMENT COSTS, COMBINED INTERVENTIONS
Treatment Costs
0
100,000,000
200,000,000
300,000,000
400,000,000
500,000,000
600,000,000
700,000,000
2005 2010 2015 2020 2025
Base Case (Standard treatment)
Diagnosis rate 80% and R&D
reduces progression 50%
Diagnosis rate 80% and primary
laser trabeculoplasty
9.5.2: RESULTS
TheresultsofthecombinedscenariosarereflectedinTable9.10.BothscenariosreducethetotalDALYscomparedwiththebasecase(Table9.10).
TABLE 9.10: MODEL RESULTS – COMBINED SCENARIOS
Net Present Base Case Diagnosis rate Diagnosis rate Values standard 80% and 80% and treatment R&D reduces primary laser progression 50% trabeculoplasty
DALYs 155,150 121,220 149,999
BurdenofDiseaseCosts($m) 23,896 18,184 21,752
HealthSystemCosts($m) 8,759 10,921 10,156
ComorbidHealthCosts($m) 4,505 4,132 4,367
TreatmentCosts($m) 4,254 6,789 5,789
ProductivityCosts($m) 1,665 1,133 1,448
OtherIndirectCosts($m) 2,695 2,918 2,882
TotalCosts($m) 37,015 33,157 36,237
CEratio:Returnon$�spent $�.�� $�.��
$/DALYavoided $��,�0� $���,���
TheimprovementstototalDALYsincreaseoverthedurationofthemodel(Figure9.10)withtheincreasedbenefitfromthefirstScenariobecomingmoreprominentovertime.
fIGURE 9.10: REDUCTION IN DALYS, COMBINED INTERVENTIONS
Treatmentcostsincreaseovertime(drivenbyanageingpopulationandanincreaseintheproportionofpeoplewithPOAGwhoarediagnosedfrom50%inthebasecaseto80%ineachofthecombinedscenarios)(Figure9.11).ThepatternoftotalcostsovertimeareshowninFigure9.12.
Treatment costs increase over time
because of an ageing population and
an increase in the proportion of people with POAG who are
diagnosed from 50% in the base case to 80% in each of the
combined scenarios.
Centre for Eye Research Australia

��The Economic Impact of Primary Open Angle Glaucoma - A Dynamic Economic Model
9. Intervention Scenarios
Thecosteffectiveness(relativetothebasecase)ofthetwoscenariosisshowninFigure9.13.Thebasecaseisrepresentedattheorigin.
fIGURE 9.13: COST EffECTIVENESS PLANE, COMBINED SCENARIOS(A)
(a)EffectivenessmeasuredasDALYsavoided.Costsreflecthealthsystem,productivityandotherindirectcosts.(CosteffectivenessismeasuredasthecostperDALYavoided.ThevalueoftheburdenofdiseaseisexcludedfromthecostestimateinthenumeratorsincethisisrepresentedbyDALYsavoidedinthedenominator).
Combining better diagnosis rates with a hypothetical new therapy to further reduce progression is more cost effective than combining better diagnosis rates with primary trabeculoplasty.
fIGURE 9.11: TREATMENT COSTS, COMBINED INTERVENTIONS
fIGURE 9.12: TOTAL COSTS, COMBINED SCENARIOS
Economic impact of primary open angle glaucoma Commercial-in-Confidence
90
FIGURE 9-10: REDUCTION IN DALYS, COMBINED INTERVENTIONS
DALYs
0
2,000
4,000
6,000
8,000
10,000
12,000
14,000
16,000
18,000
2005 2010 2015 2020 2025
Base Case (Standard treatment)
Diagnosis rate 80% and R&D
reduces progression 50%
Diagnosis rate 80% and primary
laser trabeculoplasty
Treatment costs increase over time (driven by an ageing population and an increase in theproportion of people with POAG who are diagnosed from 50% in the base case to 80% in each
of the combined scenarios) (Figure 9-11). The pattern of total costs over time are shown inFigure 9-12.
FIGURE 9-11: TREATMENT COSTS, COMBINED INTERVENTIONS
Treatment Costs
0
100,000,000
200,000,000
300,000,000
400,000,000
500,000,000
600,000,000
700,000,000
2005 2010 2015 2020 2025
Base Case (Standard treatment)
Diagnosis rate 80% and R&D
reduces progression 50%
Diagnosis rate 80% and primary
laser trabeculoplasty
Commercial-in-Confidence Economic impact of primary open angle glaucoma
91
FIGURE 9-12: TOTAL COSTS, COMBINED SCENARIOS
Total Costs
0
500,000,000
1,000,000,000
1,500,000,000
2,000,000,000
2,500,000,000
3,000,000,000
3,500,000,000
4,000,000,000
4,500,000,000
2005 2010 2015 2020 2025
Base Case (Standard treatment)
Diagnosis rate 80% and R&Dreduces progression 50%Diagnosis rate 80% and primarylaser trabeculoplasty
The cost effectiveness (relative to the base case) of the two scenarios is shown in Figure 9-13.The base case is represented at the origin.
FIGURE 9-13: COST EFFECTIVENESS PLANE, COMBINED SCENARIOS(A)
Diagnosis rate 80% and R&Dreduces progression 50%
Diagnosis rate 80% andprimary laser trabeculoplasty
0
500,000,000
1,000,000,000
1,500,000,000
2,000,000,000
2,500,000,000
0 5,000 10,000 15,000 20,000 25,000 30,000 35,000 40,000Effectiveness
Cos
ts
(a) Effectiveness measured as DALYs avoided. Costs reflect health system, productivity and other indirect costs.(Cost effectiveness is measured as the cost per DALY avoided. The value of the burden of disease is excludedfrom the cost estimate in the numerator since this is represented by DALYs avoided in the denominator).

92 Tu n n e l V i s i o nCentre for Eye Research Australia
10. Appendix 1: Meta-Analysis - Falls and Hip Fractures
Section 6.3.4 presents the results of a meta analysis of literature that examined the increasedlikelihood of an accidental fall and hip fracture with a visual impairment as well as specific VFLor glaucoma impairment. The list of articles used in the meta-analysis is presented in Table 10.4,Table 6.7 and Table 6.8. From those lists, studies that reported the risks of an accidental fall orhip fracture as an OR were excluded, due to their technical incompatibility with RR (as well as alack of data to accurately convert the ORs into RRs).
Meta-analysis refers to the statistical analysis of analyses, where the results of multiple trials arecombined to estimate an overall effect size. A number of studies have been published examiningthe impact that visual impairment has on the risk of an accidental fall and/or hip fracture. Theresults of these studies have been combined to estimate an overall RR of an accidental fall forpeople that have a visual impairment.
10.1: FIXED-EFFECTS VERSUS RANDOM-EFFECTS
An inverse variance methodology has been used to weight the study trials for both the fixedeffects and random effects models23. The results of which are presented in Table 10.1.
TABLE 10.1: FIXED EFFECTS AND RANDOM EFFECTS, META-ANALYSIS RESULTS
Accidental Falls Hip Fractures Visual Impairment VFL / Glaucoma
No. of Studies 13 6 9
Weighting Method, Inverse variance Inverse variance Inverse variance FE RE Inverse variance + τ Inverse variance + τ Inverse variance + τ
Fixed Effects 1.33 (1.24 – 1.43) 2.52 (1.92 – 3.30) 1.43 (1.25 – 1.64) (95% CI)
Random Effects 2.05 (1.54 – 2.71) 3.18 (1.82 – 5.55) 1.46 (1.24 – 1.73) (95% CI)
The studies that specifically examined VFL/Glaucoma are a subset of the visual impairmentgroup of studies. Overall the RR of an accidental fall was higher for people with glaucoma(or VFL) than people with any type of visual impairment and the RR of an accidental fall ishigher than the RR of a hip fracture.
For all three groups, the RR of an accidental fall is greater in the random effects model than thefixed effects model. This indicates that heterogeneity exists between the combined studies.The presence of heterogeneity is not unexpected as the studies incorporated into the meta-analysis include different definitions, measures and severity criteria for visual impairment.
10.2: HETEROGENEITY
Heterogeneity between studies can be problematic when using a fixed effects model (whichassumes that the studies used to determine the treatment effect have the same criteria). In thisinstance the studies use a variety of different visual impairment, severity and other criteria andit is not unexpected that (as seen in Table 10.1) heterogeneity exists. Table 10.2 displays a seriesof statistical tests that estimate the presence of heterogeneity within the meta-analysis.
23 An inverse variance plus tau weighting method has been used for the random effects model.

93The Economic Impact of Primary Open Angle Glaucoma - A Dynamic Economic Model
Main heading to go here10. Appendix 1: Meta-Analysis - Falls and Hip Fractures
TABLE 10.2: HETEROGENEITY WITHIN THE COMBINED STUDIES
Accidental Falls Hip Fractures Visual Impairment VFL / Glaucoma
Fixed Effects
Q-statistic 55.11 17.44 9.66
p-value (two-tailed) <0.0001 0.0037 0.2894
H-statistic (95% CI) 2.14 (1.65 – 2.78) 1.87 (1.23 – 2.85) 1.10 (1.00 – 1.57)
I2-statistic (95% CI) 78.22% 71.33% 17.22%
(63.23% - 87.10%) (33.42% - 87.66%) (0.00% - 59.21%)
Random Effects
τ2-statistic 0.1630 0.3191 0.0110
• Q statistic: is the main analysis of heterogeneity and tests whether the assumption that allof the effect sizes are estimating the same population is reasonable. The test statistic has achi-square distribution with k-1 degrees of freedom. If the test is rejected, the distributionof effect sizes is assumed to be heterogeneous.
• H-statistic: describes the relative excess in Q over its degrees of freedom. Whenconsidering a regression of a standardised treatment effect on the standard error, the slopeof an unweighted least squares regression line corresponds with the fixed effect pooledvalue. The H statistic is the residual SD from this regression. A low H statistic means highconsistency among study results.
• I2-statistic: describes the percentage of total variation across studies that cannot beattributed to chance or sampling error and varies between 0% and 100%. In the case ofconsistent study results, the I2 is 0 or very low. P-values and CI’s can be used to describe thecompatibility of the data-based statistic with a null-hypothesis.
• τ2-statistic: is an estimate of the between study variance. The τ-value is used in therandom effects model as an addition to the inverse variance study weight.
The statistical tests for heterogeneity presented in Table 10.2 indicate that heterogeneityis present in the results of the accidental falls studies, however heterogeneity for studiesexamining the relationship between visual impairment and falls is small.
The random effects methodology of meta-analysis has been used to control for this inter studyheterogeneity, for each interest group. The results are presented in the following section.
10.3: FOREST PLOTS
Figure 10.1, Figure 10.2 and Figure 10.3 display the forest plots of each study group using arandom effects meta-analysis methodology. The effect size of each trial is represented by thered square with a black line indicating the 95% CI. The size of the red square for each trialindicates the relative weight applied to each study result (using an inverse variance plus tau)weighting methodology. This gives studies with lower standard errors higher weights, as resultswith more accurate estimations are assumed to provide better estimations of the true effectsize. The overall effect size is displayed at the bottom of the figure as a grey diamond with ahorizontal line providing the 95% CI.

�� Tu n n e l V i s i o nCentre for Eye Research Australia
10. Appendix 1: Meta-Analysis - falls and hip fractures
fIG
UR
E 1
0.1
: A
NN
OTA
TED
fO
RES
T P
LOT
(R
AN
DO
M E
ffEC
TS
MO
DEL
) fO
R V
ISU
AL
IMPA
IRM
ENT
AN
D f
ALL
S
Centre for Eye Research Australia
Econ
omic
impa
ct o
f prim
ary
open
ang
le g
lauc
oma
Com
mer
cial
-in-C
onfid
ence
94
FIG
UR
E1
0-1
:A
NN
OT
AT
ED
FO
RE
ST
PL
OT
(RA
ND
OM
EF
FE
CT
SM
OD
EL)
FO
RV
ISU
AL
IMP
AIR
ME
NT
AN
DF
AL
LS
Ex
po
se
dC
on
tro
lW
eig
ht
As
so
cia
tio
nm
ea
su
re
Stu
dy
IDY
ea
rA
M[e
]/S
E[e
]A
M[c
]/S
E[c
](%
)w
ith
95
%C
I
Arf
ken
eta
l1
99
4-0
.09
43
/0.3
57
9-0
.09
43
/0.3
57
94
.03
%|
0.9
1(0
.45
13
to1
.83
51
)
Gly
nn
RJ
eta
l(1
)1
99
11
.09
86
/0.5
98
1.0
98
6/0
.59
83
.95
%|
3(0
.92
91
to9
.68
66
)
Gly
nn
RJ
eta
l(2
)1
99
11
.16
32
/0.5
89
91
.16
32
/0.5
89
94
.03
%|
3.2
(1.0
06
9to
10
.16
98
)
Gly
nn
RJ
eta
l(3
)1
99
11
.68
64
/0.5
63
71
.68
64
/0.5
63
74
.28
%|
5.4
(1.7
89
to1
6.2
99
7)
Ive
rsR
Qe
tal(
1)
19
98
0.7
41
9/0
.37
21
0.7
41
9/0
.37
21
6.8
3%
|2
.1(1
.01
27
to4
.35
47
)
Ive
rsR
Qe
tal(
2)
19
98
0.6
93
1/0
.30
25
0.6
93
1/0
.30
25
8.0
9%
|2
(1.1
05
5to
3.6
18
1)
Ive
rsR
Qe
tal(
3)
19
98
0.6
41
9/0
.23
38
0.6
41
9/0
.23
38
9.4
6%
|1
.9(1
.20
17
to3
.00
42
)
Ive
rsR
Qe
tal(
4)
19
98
0.1
82
3/0
.04
26
0.1
82
3/0
.04
26
12
.49
%|||
|1
.2(1
.10
38
to1
.30
45
)
Ive
rsR
Qe
tal(
5)
19
98
0.4
05
5/0
.21
25
0.4
05
5/0
.21
25
9.8
9%
|1
.5(0
.98
91
to2
.27
49
)
Ra
mra
ttan
eta
l(1
)2
00
11
.66
96
/0.3
22
71
.66
96
/0.3
22
77
.71
%|
5.3
1(2
.82
12
to9
.99
43
)
Ra
mra
ttan
eta
l(2
)2
00
11
.84
37
/0.4
81
51
.84
37
/0.4
81
55
.21
%|
6.3
2(2
.45
98
to1
6.2
38
4)
Tin
etti
ME
eta
l1
98
80
.53
06
/0.1
66
0.5
30
6/0
.16
61
0.8
1%
||||
1.7
(1.2
27
9to
2.3
53
5)
Zw
erl
ing
Ce
tal
19
98
0.4
7/0
.19
90
.47
/0.1
99
10
.16
%|||
|1
.6(1
.08
32
to2
.36
34
)
ME
TA
-AN
AL
YS
IS:
10
0%
||||||
||||||
||||||
||||||
|||||
2.0
46
6(1
.54
49
to2
.71
12
)
0.1
11
01
00
RR
(lo
gs
ca
le)
Fo
res
tp
lot
-R
R(I
V+
t)

��The Economic Impact of Primary Open Angle Glaucoma - A Dynamic Economic Model
10. Appendix 1: Meta-Analysis - falls and hip fractures
fIG
UR
E 1
0.2
: A
NN
OTA
TED
fO
RES
T P
LOT
(R
AN
DO
M E
ffEC
TS
MO
DEL
) fO
R G
LAU
CO
MA
/VfL
AN
D f
ALL
S
Com
mer
cial
-in-C
onfid
ence
Econ
omic
impa
ct o
f prim
ary
open
ang
le g
lauc
oma 95
FIG
UR
E1
0-2
:A
NN
OT
AT
ED
FO
RE
ST
PL
OT
(RA
ND
OM
EF
FE
CT
SM
OD
EL)
FO
RG
LA
UC
OM
A/V
FL
AN
DF
AL
LS
Ex
po
se
dC
on
tro
lW
eig
ht
As
so
cia
tio
nm
ea
su
re
Stu
dy
IDY
ea
rA
M[e
]/S
E[e
]A
M[c
]/S
E[c
](%
)w
ith
95
%C
I
Gly
nn
RJ
eta
l(1
)1
99
11
.09
86
/0.5
98
1.0
98
6/0
.59
81
9.6
3%
||||
3(0
.92
91
to9
.68
66
)
Gly
nn
RJ
eta
l(3
)1
99
11
.68
64
/0.5
63
71
.68
64
/0.5
63
71
2.6
6%
||||
5.4
(1.7
89
to1
6.2
99
7)
Ive
rsR
Qe
tal(
2)
19
98
0.6
93
1/0
.30
25
0.6
93
1/0
.30
25
19
.63
%|||
|2
(1.1
05
5to
3.6
18
1)
Ive
rsR
Qe
tal(
5)
19
98
0.4
05
5/0
.21
25
0.4
05
5/0
.21
25
22
.13
%|||
|||||
1.5
(0.9
89
1to
2.2
74
9)
Ra
mra
ttan
eta
l(1
)2
00
11
.66
96
/0.3
22
71
.66
96
/0.3
22
71
9.0
4%
||||
5.3
1(2
.82
12
to9
.99
43
)
Ra
mra
ttan
eta
l(2
)2
00
11
.84
37
/0.4
81
51
.84
37
/0.4
81
51
4.6
3%
||||
6.3
2(2
.45
98
to1
6.2
38
4)
ME
TA
-AN
AL
YS
IS:
10
0%
||||||
||||||
||||||
||||||
|||||
3.1
82
9(1
.82
46
to5
.55
23
)
0.1
11
01
00
RR
(lo
gs
ca
le)
Fo
res
tp
lot
-R
R(I
V+
t)
Econ
omic
impa
ct o
f prim
ary
open
ang
le g
lauc
oma
Com
mer
cial
-in-C
onfid
ence
96
FIG
UR
E1
0-3
:A
NN
OT
AT
ED
FO
RE
ST
PL
OT
(RA
ND
OM
EF
FE
CT
SM
OD
EL)
FO
RV
ISU
AL
IMP
AIR
ME
NT
AN
DH
IPF
RA
CT
UR
ES
Ex
po
se
dC
on
tro
lW
eig
ht
As
so
cia
tio
nm
ea
su
re
Stu
dy
IDY
ea
rA
M[e
]/S
E[e
]A
M[c
]/S
E[c
](%
)w
ith
95
%C
I
Cu
mm
ing
sS
Re
tal(
1)
19
95
0.3
36
5/0
.16
37
0.3
36
5/0
.16
37
8.9
9%
||||
1.4
(1.0
15
7to
1.9
29
8)
Cu
mm
ing
sS
Re
tal(
2)
19
95
0.2
62
4/0
.10
34
0.2
62
4/0
.10
34
33
.51
%|||
||||||
|||1
.3(1
.06
14
to1
.59
22
)
Da
rge
nt-
Mo
lina
Pe
tal(
1)
19
96
0.6
41
9/0
.26
43
0.6
41
9/0
.26
43
8.9
9%
|1
.9(1
.13
18
to3
.18
96
)
Da
rge
nt-
Mo
lina
Pe
tal(
2)
19
96
0.6
93
1/0
.30
95
0.6
93
1/0
.30
95
6.8
1%
|2
(1.0
90
5to
3.6
68
)
Fe
lso
nD
Te
tal(
1)
19
89
0.5
48
1/0
.21
74
0.5
48
1/0
.21
74
12
.48
%|||
|1
.73
(1.1
29
7to
2.6
49
3)
Fe
lso
nD
Te
tal(
2)
19
89
0.7
74
7/0
.28
57
0.7
74
7/0
.28
57
7.8
5%
|2
.17
(1.2
39
6to
3.7
98
7)
Ra
mra
ttan
eta
l(1
)2
00
1-0
.15
08
/0.3
18
-0.1
50
8/0
.31
86
.49
%|
0.8
6(0
.46
11
to1
.60
39
)
Ra
mra
ttan
eta
l(2
)2
00
10
.12
22
/0.4
15
60
.12
22
/0.4
15
63
.96
%|
1.1
3(0
.50
04
to2
.55
19
)
Ra
mra
ttan
eta
l(3
)2
00
1-0
.49
43
/1.0
24
6-0
.49
43
/1.0
24
60
.69
%|
0.6
1(0
.08
19
to4
.54
44
)
ME
TA
-AN
AL
YS
IS:
10
0%
||||||
||||||
||||||
||||||
|||||
1.4
6(1
.23
53
to1
.72
56
)
0.0
10
.11
10
RR
(lo
gs
ca
le)
Fo
res
tp
lot
-R
R(I
V+
t)
fIG
UR
E 1
0.3
: A
NN
OTA
TED
fO
RES
T P
LOT
(R
AN
DO
M E
ffEC
TS
MO
DEL
) fO
R V
ISU
AL
IMPA
IRM
ENT
AN
D h
IP f
RA
CT
UR
ES

�� Tu n n e l V i s i o nCentre for Eye Research Australia
10. Appendix 1: Meta-Analysis - falls and hip fractures
�0.�:PUBLICATIONBIAS
Publicationbiaspresentsasauniqueproblemformeta-analyses.Whiletheinclusionandexclusionofstudiescanimpartsomecontroloverpublicationbias,thepotentialforitsexistenceisstillpresentwithstudiesshowinganeffectmorelikelytobepublishedthanstudiesthatshownoeffectatall.Tosomeextentpublicationbiaswillalwaysbepresentwithinameta-analysis,theproblemisthentoestimatehowlargeandwhateffecttheproblemhasontheresult.
TABLE 10.3: MEASURES Of PUBLICATION BIAS
Accidental falls hip fracture Visual Impairment VfL / Glaucoma
Model RandomEffects RandomEffects RandomEffects
WeightingMethod IV+τ IV+τ IV+τ
OriginalOutcome 2.05(1.54–2.71) 3.18(1.82–5.55) 1.46(1.24–1.73) (95%CI)
EffectAssessment
RegressionModel Egger Egger Egger
Intercepts(95%CI) 2.22(1.17–3.27) 3.44(-1.11–7.99) 0.22(-1.65–2.09)
p-value(two-tailed) 0.0007 0.1036 0.7884
Sensitivity
Trim-and-fillmethod L0 L0 L0
Numberofimputed 5 0 0 studies
Resultingoutcome (1.55(1.18–2.02) 3.18(1.82–5.55) 1.46(1.24–1.73) 95%CI)
Aswithheterogeneityafewstatisticaltestshavebeendevelopedtoexaminetheextentofpotentialpublicationbiaswithinameta-analysis(Table10.3).Twomainstatisticaltestsareappliedtotheresults,theseare:
• Egger’s small study effects:Aformaltestforpublicationbias.Thetestinvolvesregressionofthez-scoresupontheinverseofthestandarderrorandtheinterceptoftheregressionlineisusedtomeasureasymmetry(aroundthestandardisedpooledvalue,0)whichisregardedasasignofpublicationbias.
• Trim-and-fill method: usesfunnelplotsymmetryasanindicatorforpublicationbiasandestimatesthenumberofstudiesthathavenocounterpartontheothersideofthesymmetryaxis.Thesestudiesareremoved(trimmed)andanewsymmetry-axisiscalculated.Theprocedureisrepeateduntilthereisnoasymmetryfound.Finally,thetrimmedstudiesareputbackinthefunnelplottogetherwithhypotheticalcounterpartsandnewcombinedempiricalvaluescanbecalculatedwithbothoriginalandimputedstudiesincluded.
Thep-valueforstudiesexaminingaccidentalfallsandvisualimpairmentislessthan5%indicatingthatpublicationbiasispresentwithinthismeta-analyses,whilepublicationbiasfortheVFL/Glaucomaandhipfracturestudiesappearstoolow(pvaluesaregreaterthan5%).Theeffectofthispublicationbiascanbeseenwiththetrim-and-fillmethod,whichindicatesthatthetreatmenteffectshouldhaveaRRofapproximately1.55forpeoplewithavisualimpairment.
To some extent publication bias will
always be present within a meta-
analysis, the problem is then to estimate
how large and what effect the bias has on
the result.
Centre for Eye Research Australia
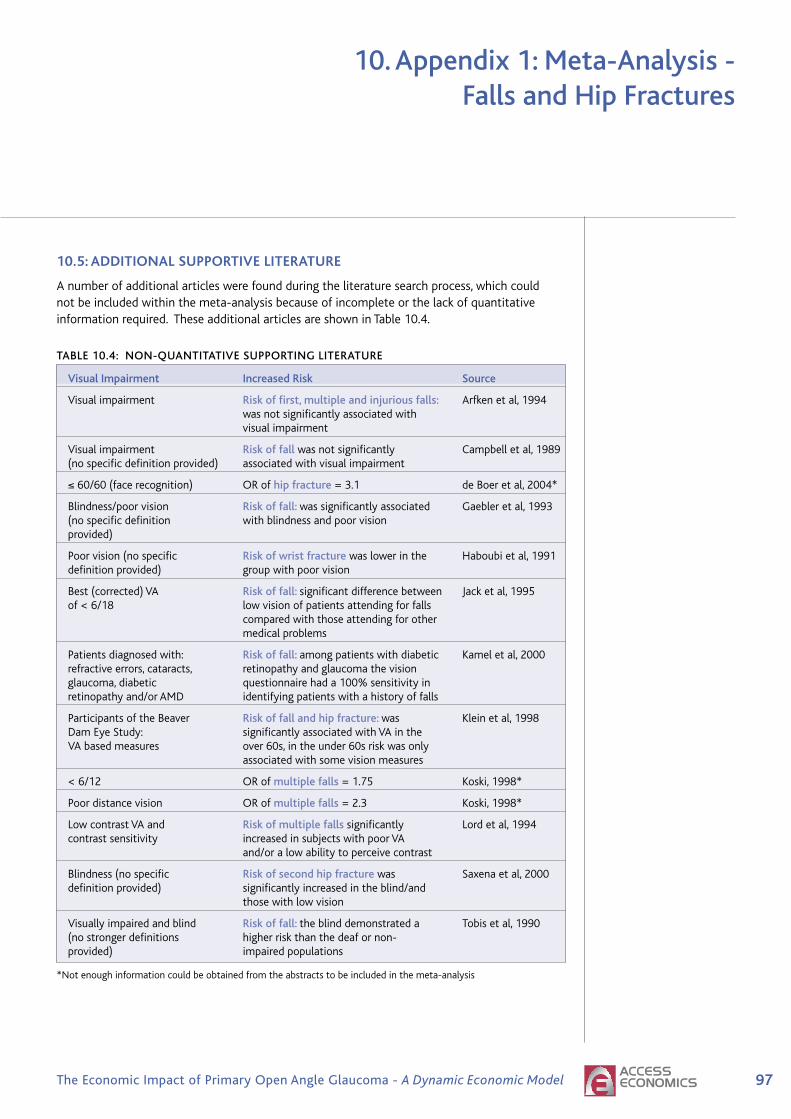
��The Economic Impact of Primary Open Angle Glaucoma - A Dynamic Economic Model
10. Appendix 1: Meta-Analysis - falls and hip fractures
�0.�:ADDITIONALSUPPORTIVELITERATURE
Anumberofadditionalarticleswerefoundduringtheliteraturesearchprocess,whichcouldnotbeincludedwithinthemeta-analysisbecauseofincompleteorthelackofquantitativeinformationrequired.TheseadditionalarticlesareshowninTable10.4.
TABLE 10.4: NON-QUANTITATIVE SUPPORTING LITERATURE
Visual Impairment Increased Risk Source
Visualimpairment Risk of first, multiple and injurious falls: Arfkenetal,1994 wasnotsignificantlyassociatedwith visualimpairment
Visualimpairment Risk of fallwasnotsignificantly Campbelletal,1989 (nospecificdefinitionprovided) associatedwithvisualimpairment
≤60/60(facerecognition) ORofhip fracture=3.1 deBoeretal,2004*
Blindness/poorvision Risk of fall: wassignificantlyassociated Gaebleretal,1993 (nospecificdefinition withblindnessandpoorvision provided)
Poorvision(nospecific Risk of wrist fracturewaslowerinthe Haboubietal,1991 definitionprovided) groupwithpoorvision
Best(corrected)VA Risk of fall: significantdifferencebetween Jacketal,1995 of<6/18 lowvisionofpatientsattendingforfalls comparedwiththoseattendingforother medicalproblems
Patientsdiagnosedwith: Risk of fall: amongpatientswithdiabetic Kameletal,2000 refractiveerrors,cataracts, retinopathyandglaucomathevision glaucoma,diabetic questionnairehada100%sensitivityin retinopathyand/orAMD identifyingpatientswithahistoryoffalls
ParticipantsoftheBeaver Risk of fall and hip fracture: was Kleinetal,1998 DamEyeStudy: significantlyassociatedwithVAinthe VAbasedmeasures over60s,intheunder60sriskwasonly associatedwithsomevisionmeasures
<6/12 ORofmultiple falls=1.75 Koski,1998*
Poordistancevision ORofmultiple falls=2.3 Koski,1998*
LowcontrastVAand Risk of multiple falls significantly Lordetal,1994 contrastsensitivity increasedinsubjectswithpoorVA and/oralowabilitytoperceivecontrast
Blindness(nospecific Risk of second hip fracturewas Saxenaetal,2000 definitionprovided) significantlyincreasedintheblind/and thosewithlowvision
Visuallyimpairedandblind Risk of fall: theblinddemonstrateda Tobisetal,1990 (nostrongerdefinitions higherriskthanthedeafornon- provided) impairedpopulations
*Notenoughinformationcouldbeobtainedfromtheabstractstobeincludedinthemeta-analysis

98 Tu n n e l V i s i o nCentre for Eye Research Australia
11. References
Access Economics (2005) Business Outlook, June.
The AGIS Investigators (2002) “The Advanced Glaucoma Intervention Study (AGIS): 12. BaselineRisk Factors for Sustained Loss of Visual Field and Visual Acuity in Patients With AdvancedGlaucoma” Am J Ophthalmol, 134:499-512.
Australian Institute of Health and Welfare (2006), Health expenditure Australia 2004–05, Healthand Welfare Expenditure Series No. 28, Cat No HWE 35, Canberra.
Australian Institute of Health and Welfare (2005a) Statistics on Drug Use in Australia, 2004, Drug Statistics Series No. 15, Cat No PHE 62, June.
Australian Institute of Health and Welfare (2005b) Health system expenditure of disease and injury in Australia, 2000-01, Health and Welfare Expenditure Series No 21, Second edition,Cat No HWE 28, Canberra.
Alward WL, Fingert JH, Coote MA, Johnson AT, Lerner SF, Junqua D, Durcan FJ, McCartney PJ,Mackey DA, Sheffield VC, Stone EM (1998) “Clinical features associated with mutations inthe chromosome 1 open-angle glaucoma gene (GLC1A)” N Engl J Med, 338: 1022-27
American Academy of Ophthalmology (2005) Preferred Practice Pattern: Primary Open-Angle Glaucoma, American Academy of Ophthalmology, The Eye MD Association.
Arfken CL, Lach HW, McGee S, Birge SJ, Miller JP (1994) “Visual acuity, visual disabilities andfalling in the elderly” J Aging Health, 4: 38-50.
Australian Bureau of Statistics (2005) Australian Labour Market Statistics, ABS CatNo 6105.0, July.
Australian Bureau of Statistics (2004) Employee Earnings, Benefits and Trade Union Membership, ABS Cat No 6310.0, August.
Black A, Wood J (2005) “Vision and Falls: Review” Clinical experimental Optometry,88[4]: 212-22.
Bonovas S, Peponis V, Filioussi K (2004) “Diabetes mellitus as a risk factor for primary open-angle glaucoma: a meta-analysis” Diabetic Medicine, 21[6]: 609-14.
Brody BL, Gamst AC, Williams RA et al (2001) “Depression, visual acuity, comorbidity anddisability associated with age-related macular degeneration” Ophthalmology, 108[10]:1893-901.
Brooks ANV, Gillies WE (1992) “Ocular β-blockers in glaucoma management” Drugs and Aging, 3: 208-11.
Brown G (1999) “Vision and Quality of Life” Trans Am Ophthalmol Soc, 97: 473-511.
Brown M, Brown G, Sharma S, Kistler J, Brown H (2001) “Utility values associated with blindnessin an adult population” Br J Ophthalmology, 85: 327-331.
Budde WM, Jonas JB (1998) “No effect of diabetes mellitus on the morphology of the opticnerve papilla in primary open angle glaucoma [German]” Klinische Monatsblatter fur Augenheilkundle, 212[1]: 37-9.
Burmedi D, Becker S, Heyl S, Wahl HW, Himmelsbach L (2002) “Emotional and socialconsequences of age-related low vision” Visual Impairment Research, 4[I]: 47-71.

99The Economic Impact of Primary Open Angle Glaucoma - A Dynamic Economic Model
Main heading to go here11. References
Campbell AJ, Michael JB, Spears GS (1989) “Risk factors for falls in a community-basedprospective study of people 70 years or older” J Gerentol, 44: M112-17.
Centre for Eye Research Australia (2004) Clear Insight: The Economic Impact and Cost of Vision Loss in Australia, prepared by Access Economics, published by Centre for Eye ResearchAustralia, Melbourne.
Centre for Eye Research Australia (2005) Investing in Sight: Strategic Interventions to Prevent Vision Loss in Australia, prepared by Access Economics, published by Centre for Eye ResearchAustralia, Melbourne.
Centre for Eye Research Australia (2006) Centrally Focussed: The Impact of Age related Macular Degeneration, A Dynamic Economic Model, prepared by Access Economics, published by theCentre for Eye Research Australia, Melbourne.
Chen P (2003) “Blindness in patients with treated open angle glaucoma” Ophthalmology,110: 726-33.
Chen P, HE XG (2005) “Mental status and personality characteristics of patients suffering fromacute or chronic glaucoma” Zhongguo Linchuang Kangfu, 9: 58-60.
Clark AF, Kawase K, English-Wright S et al (2001) “Expression of the glaucoma gene myocilin(MYOC) in the human optic nerve head” FASEB J, 15: 1251-53.
Coleman AL, Stone K, Ewing S et al (2004) “Higher risk of multiple falls among elderly womenwho lose visual acuity” Ophthalmology, 111: 857-62.
Crowston J, Hopley C, Healey P, Lee A, Mitchell P (2004) “The effect of optic disc diameter onvertical cup to disc ratio percentiles in a population based cohort: the Blue Mountains EyeStudy” Br J Ophthalmology, 88: 766-70.
Cummings SR, Nevitt MC, Browner WS et al (1995) “Risk factors for hip fracture in whitewomen. Study of Osteoporotic Fractures Research Group” New England Journal of Medicine, 332: 767-73.
Damji K, Bovell A, Hodge W, Rock W, Shah K, Buhrman R, Pan I (2006) “Selective LaserTrabeculoplasty v ALT: Results from a one year randomised clinical trial” [online], Br JOphthalmol, Published Online First: 9 August 2006. doi:10.1136/bjo.2006.098855.
Dargent-Molina P, Favier F, Grandjean H et al (1996) “Fall-related factors and risk of hip fracture:the EPIDOS prospective study” Lancet, 348: 145-9.
de Boer MR, Pluijm SM, Lips P, et al (2004) “Different aspects of visual impairment as risk factorsfor falls and fractures in older men and women” Journal of Bone and Mineral Research, 19: 1539-47.
de Voogd S, Ikram MK, Wolfs RC, Jansonius NM, Witteman JC, Hofman A, de Jong PT (2006)“Is diabetes mellitus a risk factor for open-angle glaucoma? The Rotterdam Study”Ophthalmology, 113[10]: 1827-31.
Dielemans I, de Jong PT, Stolk R, Vingerling JR, Grobbee DE, Hofman A (1996) “Primary open-angle glaucoma, intraocular pressure, and diabetes mellitus in the general elderly population.The Rotterdam study” Ophthalmology, 103[8]: 1271-5.
Dolinis J, Harrison JE, Andrews GR (1997) ”Factors associated with falling in older Adelaideresidents” Aust N Z J Public Health, 21: 462-8.
�00 Tu n n e l V i s i o nCentre for Eye Research Australia
11. References
EdmundsB,ThompsonJR,SalmonJF,WormaldRP(1999);ThenationalsurveyoftrabeculectomyIIIEarlyandlatecomplications;EyeMay200216(3):297-303
EdmundsB,ThompsonJ,SalmonJ,WormaldR(2001)“ThenationalsurveyoftrabeculectomyIIVariationsinoperativetechniqueandoutcome”Eye,15:441-8.
EhrnroothP,PuskaP,LehtoI,LaatikainenL(2002)“LongtermoutcomeoftrabeculectomyintermsofIOP” Acta Ophthalmologica Scandinavia,80:267-71.
EhrnroothP,PuskaP,LehtoI,LaatikainenL(2005)“Progressionofvisualfielddefectsandvisuallossintrabeculectomizedeyes”Graefe’s Arch Clin Exp Ophthalmol, 243:741-7.
EuropeanGlaucomaPreventionStudyGroup(2005)“ResultsoftheEuropeanGlaucomaPreventionStudy”Ophthalmology,112:366-75.
FeldmanR,KatzJ,SpaethG,CrapottaJ,FahmyI,MoonesA(1991)“Long-termefficacyofrepeatargonlasertrabeculoplasty”Ophthalmology,98:1061-5.
FelsonDT,AndersonJJ,HannanMTetal(1989)“Impairedvisionandhipfracture.TheFraminghamStudy”Journal of the American Geriatric Society,37:495-500.
FingertJH,HeonE,LiebmannJMetal(1999)“Analysisofmyocilinmutationsin1703glaucomapatientsfromfivedifferentpopulations”Hum Mol Genet,8:899-905.
FingertJH,StoneEM,SheffieldVC,AlwardWL(2002)“Myocilinglaucoma”Surv Ophthalmol,15:1251-53.
FontanaH,Nouri-MahdaviK,LumbaJ,RalliM,CaprioloJ(2006)“TrabeculectomywithMitomycinC,OutcomesandriskfactorsforfailureinphakicOAG”Ophthlamology,113:930-6.
FriedmanDS,WilsonMR,LiebmannJM,FechtnerRD,WeinrebRD(2004)“AnEvidence-basedAssessmentofRiskFactorsfortheProgressionofOcularHypertensionandGlaucoma”Am J Ophthalmol, 138:S19-S31.
GaeblerS(1993)“Predictingwhichpatientwillfallagain…andagain” J Adv Nurs,18:1895-902.
GlaucomaLaserTrialResearchGroup(1995)“GlaucomalasertrialandglaucomalasertrialfollowupstudyNo7results”Am J Ophthalmol,120:718-31.
GlynnRJ,SeddonSM,KrugJetal(1991)“Fallsinelderlypatientswithglaucoma”Arch Ophthalmol, 109:205-10.
GordonM,BeiserJ,BrandtJetal,fortheOcularHypertensionTreatmentStudyGroup(2002)“TheOcularHypertensionTreatmentStudy:baselinefactorsthatpredicttheonsetofprimaryopen-angleglaucoma”Arch Ophthalmol,120:714-20.
GrissoJA,KelseyJL,StromBL,etal(1991)“Riskfactorsforfallsasacauseofhipfractureinwomen.TheNortheastHipFractureStudyGroup”N Engl J Med,324:132631.
GrødumK,HeijlA,BengtssonB.A(2002)“Acomparisonofglaucomapatientsidentifiedthroughmassscreeningandinroutineclinicalpractice”Acta Ophthalmol Scand.80(6):627-31
HaboubiNY,HudsonPR(1991)“FactorsassociatedwillColles’fractureintheelderly”Gerontology,37:335-8.
Centre for Eye Research Australia

�0�The Economic Impact of Primary Open Angle Glaucoma - A Dynamic Economic Model
11. References
HattenhauerMG,JohnsonDH,IngHH,HermanDC,HodgeDO,YawnBP,ButterfieldLC,GrayDT(1998)“TheProbabilityofBlindnessfromOpen-angleGlaucoma”Opthalmology,105:2099-104.
HaymesSA,LeBlancRP,NicolelaMT,ChiassonLA,ChauhanBC(2007)“RiskofFallsandMotorVehicleCollisionsinGlaucoma”Invest Ophthalmol VisSci,48:1149-15.
HeijlA,LeskeC,BengtssonB,HymanL,BengtssonB,HusseinM(2002)“Reductionofintraocularpressureandglaucomaprogression,ResultsfromtheEarlyManifestGlaucomaTrial”Arch Ophthalmol, 120:126879.
HensonD,ShambhuS(2006)“RelativeRiskofProgressiveGlaucomatousVisualFieldLossinPatientsEnrolledandNotEnrolledinaProspectiveLongitudinalStudy” Arch Ophthalmol,124:1405-8.
HymanL,KomaroffE,HeijlA,Bengtsson,LeskeC(2005)“Treatmentandvisionrelatedqualityoflifeintheearlymanifestglaucomatrial”Ophthalmology,112:150513.
IversRQ,CummingRG,MitchellP,etal(1998)“Visualimpairmentandfallsinolderadults:theBlueMountainsEyeStudy” J Am Geriatr Soc,46:58-64.
IversRQ,NortonR,CummingRG,etal(2000)“Visualimpairmentandriskofhipfracture”American Journal of Epidemiology,152:633-9.
JackCI,SmithT,NeohC,etal(1995),PrevalenceoflowvisioninelderlypatientsadmittedtoanacutegeriatricunitinLiverpool:elderlypeoplewhofallaremorelikelytohavelowvision,Gerontology;41:280-5
JampelH,SchwartzA,PollackI,AbramsD,WeissH,MillerR(2002)“Glaucomapatients’assessmentoftheirvisualfunctionandqualityoflife”Journal of Glaucoma, 11:154-63.
JayJ,MurdochJ(1993)“Therateofvisualfieldlossinuntreatedprimaryopenangleglaucoma”British Journal of Ophthalmology,77:176-8.
JuzychM,ChopraV,BanittM,HughesB,KimC,GoulasM,ShinD(2004)“ComparisonofLong-termOutcomesofSelectiveLaserTrabeculoplastyversusArgonLaserTrabeculoplastyinOpen-AngleGlaucoma”Ophthalmology,111:1853–59.
KamelHK,GuroRS,ShareeffM(2000)“Theactivitiesofdailyvisionscale:ausefultooltoassessfallriskinolderadultswithvisionimpairment” J Am Geriatr Soc,48:1474-7.
KarlssonJS(1998)“Self-reportsofpsychologicaldistressinconnectionwithvariousdegreesofvisualimpairment”Journal of Visual Impairment & Blindness,92[7]:483-90.
KassMA,HeuerDK,HigginbothamEJetal(2002)“TheOcularHypertensionTreatmentStudy:arandomisedtrialdeterminesthattopicalocularhypotensivemedicationdelaysorpreventstheonsetofprimaryopen-angleglaucoma”Arch Ophthalmol,120:701-13.
KatzJ,CongdonN,FriedmanD(1999)“Methodologicalvariationsinestimatingapparentprogressivevisualfieldlossinclinicaltrialsofglaucomatreatment” Arch Ophthalmol,117:1137-42.
KirwanJF,NightingaleJA,BunceC,WarmaldR(2002)“bBlockersforglaucomaandexcessriskofairwaysobstruction:populationbasedcohortstudy”BMJ,325:1396-7.
�0� Tu n n e l V i s i o nCentre for Eye Research Australia
KleinBE,KleinR,JensenSC(1994)“Open-angleglaucomaandolder-onsetdiabetes.TheBeaverDamEyeStudy”Ophthalmology,101[7]:1173-7.
KleinBEK,KleinR,LeeKE,etal(1998)“Performance-basedandself-assessedmeasuresofvisualfunctionasrelatedtohistoryoffalls,hipfractures,andmeasuredgaittime:theBeaverDamStudy”Ophthalmology,105:160-4.
KleinschmidtJJ,TrunnellEP,ReadingJC,WhiteGL(1995)“Theroleofcontrolindepression,anxietyandlifesatisfactionamongvisuallyimpairedolderadults”Journal of Health Education,26[1]:26.
KobeltG,JonssonB,BergstromA,ChenE,LindenC,AlmA(2006)“Cost-effectivenessanalysisinglaucoma:whatdrivesutility?ResultsfromapilotstudyinSweden”Acta Ophthalmol Scand, 84[3]:363-71.
KoskiK,LuukinenH,LaippalaPetal(1998)“Riskfactorsformajorinjuriousfallsamongthehome-dwellingelderlybyfunctionalabilities.Aprospectivepopulation-basedstudy”Gerontology,44:232-8.
KwonY,FingertJ,GreenleeE(2006)“Apatient’sguidetoglaucoma”[online],Availablefrom:http://www.medrounds.org/glaucoma-guide/2006/02/table-of-contents-patients-guide-to.html[accessed4May2007].
KwonY,KimC,ZimmermanB,AlwardW,HayrethS(2001)“Rateofvisualfieldlossandlong-termvisualoutcomeinprimaryopen-angleglaucoma”Am J Ophthalmol,132:47-56.
LatinaM,deLeonJ(2005)“Selectivelasertrabeculoplasty”Ophthalmol Clin North Am,18:40919.
LeskeMC,HeijlA,HusseinM,BengtssonB,HymanL,KomaroffEfortheEarlyManifestGlaucomaTrialGroup(2003)“Factorsforglaucomaprogressionandtheeffectoftreatment,Theearlymanifestglaucomatrial”Arch Ophthalmol,121:48-56.
LichtensteinMJ,GriffinMR,CornellJE,etal(1994)“RiskFactorsforhipfracturesoccurringinthehospital”Am J Epidemiol, 140:830-8.
LichterP,MuschD,GillespieB,GuireK,JanzN,WrenP,MillsR,andtheCIGTSStudyGroup(2001)“InterimclinicaloutcomesintheCollaborativeInitialGlaucomaTreatmentStudycomparinginitialtreatmentrandomizedtomedicationsorsurgery”Ophthalmology,108:194353.
LordSR,WardJA,WilliamsP,etal(1994)“Physiologicalfactorsassociatedwithfallsinoldercommunity-dwellingwomen”J Am Geriatr Soc,42:1110-14.
MartusP,StrouxA,BuddeW,MardinC,KorthM,JonasJ(2005)“PredictiveFactorsforProgressiveOpticNerveDamageinVariousTypesofChronicOpen-angleGlaucoma”Am J Ophthalmol,139:999–1009.
MathersC,VosT,StevensonC(1999) The loss of well being and injury in Australia,TheAustralianInstituteofHealthandWelfare,CatNoPHE17,Canberra.
McCartyC,NanjanM,Taylor,H(2001)“Visionimpairmentpredicts5yearmortality”British Journal of Ophthalmology, 85[3]:3226.
McIlraithI,StrasfeldM,ColevG,HutnikC(2006)“SelectiveLaserTrabeculoplastyasInitialandAdjunctiveTreatmentforOpen-AngleGlaucoma”J Glaucoma,15:124-30.
11. References
Centre for Eye Research Australia

�0�The Economic Impact of Primary Open Angle Glaucoma - A Dynamic Economic Model
McNaughtAI,AllenJG,HealeyDL,CooteMA,WongTL,CraigJE,GreenCM,RaitJL,MackeyDA(2000)“Accuracyandimplicationsofareportedfamilyhistoryofglaucoma:experiencefromtheGlaucomaInheritanceStudyinTasmania”Arch Ophthalmol,118:900-4.
MillsR,JanzN,WrenP,GuireK,CIGTSStudyGroup(2001)“CorrelationofvisualfieldwithqualityoflifemeasuresatdiagnosisintheCollaborative.InitialGlaucomaTreatmentStudy(CIGTS)”Journal of Glaucoma, 10:192-8.
MitchellP,SmithW,CheyT,HealeyPR(1997)“Open-angleglaucomaanddiabetes:theBlueMountainsEyeStudy,Australia”Ophthalmology,104[4]:712-8.
MukeshB,McCartyC,RaitJ,TaylorH(2002)“Fiveyearincidenceofopenangleglaucoma,thevisualimpairmentproject”Ophthalmology,109:104751.
NagarM,OgunyomadeA,O’BrartD,HowesF,MarshallJ(2005)“ArandomisedprospectivestudycomparingSLTwithlatanoprostforthecontrolofIOPinOHTandOAG”Br J Ophthalmol, 89:1413-7.
NordstromBL,FriedmanDS,MozaffariE,QuigleyHA,WalkerAM(2005)“Persistenceandadherencewithtopicalglaucomatherapy”Am J Ophthalmol,140:598-606.
OcularHypertensionTreatmentStudyGroup,EuropeanGlaucomaPreventionStudyGroup,GordonMO,TorriV,MigliorS,BeiserJA,FlorianiI,MillerJP,GaoF,AdamsonsI,PoliD,D’AgostinoRB,KassMA(2007)“Validatedpredictionmodelforthedevelopmentofprimaryopen-angleglaucomainindividualswithocularhypertension”Ophthalmology,114[1]:10-9.
OlthoffC,SchoutenJ,vandeBorneB,WebersC(2005)“Noncompliancewithocularhypotensivetreatmentinpatientswithglaucomaorocularhypertension”Ophthalmology,112:953-61.
PasqualeLR,KangJH,MansonJE,WillettWC,RosnerBA,HankinsonSE(2006)“Prospectivestudyoftype2diabetesmellitusandriskofprimaryopen-angleglaucomainwomen”Ophthalmology,113[7]:1081-6.
PolanskyJR,FaussDJ,ZimmermanCC(2000)“RegulationofTIGR/MYOCgeneexpressioninhumantrabecularmeshworkcells”Eye,14:503-14.
ProductivityCommission(2003)Evaluation of the Pharmaceutical Industry Investment Program,ResearchReport,AusInfo,Canberra.
ProductivityCommission(2005)Economic Implications of an Ageing Australia,April.
QuigleyH(1996)“Numberofpeoplewithglaucomaworldwide”Br J Ophthalmol,80:389-93.
RamrattanRS,WolfsRCW,Panda-JonasS,JonasJB,BakkerD,PolsHA,HofmanA,deJongPTVM(2001)“PrevalenceandCausesofVisualFieldLossintheElderlyandAssociationwithImpairmentinDailyFunctioning”Arch Ophthalmol,119:1788-94.
RaskerM,denEndenA,BakkerD,HoyngP(2000)“Rateofvisualfieldlossinprogressiveglaucoma”Arch Ophthalmol,118:481-8.
ReardonG,SchwartzG,MozaffariE(2004)“Patientpersistencywithtopicalocularhypotensivetherapyinamanagedcarepopulation”Am J Ophthalmology,137:S3-S12.
RichterC,ShingletonB,BellowsR,HutchinsonB,JacobsonL(1987)“RetreatmentwithArgonLaserTrabeculoplasty”Ophthalmology,94:1085-9.
11. References

�0� Tu n n e l V i s i o nCentre for Eye Research Australia
RobbinsHG,McMurrayNE(1988)“Psychologicalandvisualfactorsinlowvisionrehabilitationofpatientswithage-relatedmaculopathy” Journal of Vision Rehabilitation, 2:11-21.
RovnerBW,Shmuely-DulizkiY(1997)“Screeningfordepressioninlow-visionelderly” Int J Geriatr Psychiatry, 12[9]:955-9.
SanfilippoP(1999)“Areviewofargonandselectivelasertrabeculoplastyasprimarytreatmentsofopen-angleglaucoma”Clinical and Experimental Optometry, 82[6]:225-9.
SaxemaP,ShankarJ(2000)“Contralateralhipfractures–canpredisposingfactorsbedetermined?”Injury,31:421-4.
SchwartzG(2005)“Complianceandpersistencyinglaucomafollow-uptreatment”Current Opinion in Ophthalmology, 16:114-21.
SheffieldVC,StoneEM,AlwardWLetal(1993)“Geneticlinkageoffamilialopenangleglaucomatochromosome1q21-q31”Nat Genet,4:47-50.
ShingletonB,RichterC,DharmaS,TongL,BellowsR,HutchinsonT,GlynnR(1993)“Longtermefficacyofargonlasertrabeculoplasty”Ophthalmology,100:1324-9.
SpaethG,BaezK(1992)“Argonlasertrabeculoplastycontrolsonethirdofcasesofprogressiveuncontrolledopenangleglaucomafor5years”Arch Ophthalmology,110:491-4.
StoneEM,FingertJH,AlwardWLetal(1997)“Identificationofagenethatcausesprimaryopenangleglaucoma”Science,275:668-70.
TaylorH(2001) Eye care for the community, CentreforEyeResearchAustralia.
TielschJM,KateJ,SommerA,QuigleyHA,JavittJC(1994)“TheBaltimoreEyeSurvey”Arch Ophthmol, 112:69-73.
TielschJM,KatzJ,QuigleyHA,JavittJC,SommerA(1995)“Diabetes,intraocularpressure,andprimaryopen-angleglaucomaintheBaltimoreEyeSurvey”Ophthalmology,102[1]:48-53.
TinettiME,SpeechleyM,GinterRN(1988)“Riskfactorsforfallingamongelderlypersonslivinginthecommunity”N Engl J Med,319:1701-6.
TobisJS,BlockM,SteinhausDC,etal(1990)“Fallingamongthesensoriallyimpairedelderly”Arch Phys Med Rehabil,71:144-7.
TsaiJC(2006)“Medicationadherenceinglaucoma:approachesforoptimizingpatientcompliance”Current Opinion in Ophthalmology,17:190-5.
VuHTV,KeeffeJE,McCartyCA,TaylorHR(2005)“ImpactofUnilateralandBilateralVisionLossonQualityofLife”British Journal of Ophthalmology,89:360-3.
WahlHW(1994)“Seeinginthedark:limitedvisionintheagedasaprototypical“environmentallyrelevant”lossincompetence” Z Gerontol, 27[6]:399-409.
WangJJ,MitchellP,CummingR,SmithW(2002)“VisualimpairmentandnursinghomeplacementinolderAustralians:theBlueMountainsEyeStudy”Opthalmic Epidemiology, 10[1]:3-13.
WeihL,MukeshN,McCartyC,TaylorH(2001)“Prevalenceandpredictorsofopenangleglaucoma,resultsfromthevisualimpairmentproject”Ophthalmology,108:1966-72.
11. References
Centre for Eye Research Australia

This report was prepared jointly by the Centre for Eye Research Australia and Access Economics Pty Limited.
We acknowledge particularly the expert input and prior research of
Professor Hugh Taylor AC Centre for Eye Research Australia and University of Melbourne
Professor Jonathan Crowston Centre for Eye Research Australia and University of Melbourne
Associate Professor Jill Keeffe OAM Centre for Eye Research Australia and University of Melbourne
Ms Lynne Pezzullo Access Economics Pty Ltd
Ms Penny Taylor Access Economics Pty Ltd
Mr Peter Moore Access Economics Pty Ltd
Acknowledgments and Disclaimer
While every effort has been made to ensure the accuracy of this document, the uncertain nature of economic data, forecasting and analysis means that Access Economics Pty Limited is unable to make any warranties in relation to the information contained herein. Access Economics Pty Limited, its employees and agents disclaim liability for any loss or damage which may arise as a consequence of any person relying on the information contained in this document.
Publication of this work has been made possible by an unrestricted grant from Allergan who had no part in the direction or findings contained in this report.
Centre for Eye Research Australia, University of Melbourne, Australia, February 2008.
Centre for Eye Research Australia Tu n n e l V i s i o n
Weih L, Van Newkirk M, McCarty C, Taylor H (1998) “Patterns of glaucoma medication use in urban and rural Victoria” Australian and New Zealand Journal of Ophthalmology, 26[Suppl]: S12 S15.
Weinand F, Althen F (2006) “Long term clinical results of SLT in the treatment of POAG” Eur J Ophthalmology, 16: 100-4.
Weinreb RN, Khaw PT (2004) “Primary open-angle glaucoma” The Lancet, 363: 1711-20.
Weinreb RN, Friedman DS, Fechtner RD, Cioffi GA, Coleman AL, Girkin CA, Liebmann JM, Singh K, Wilson MR, Wilson R, Kannel WB (2004) “Perspective: Risk Assessment in the Management of Patients with Ocular Hypertension” American Journal of Ophthalmology, 138[3]: 458-67.
Wensor M, McCarty C, Stanislavsky Y, Livingston P, Taylor H (1998) “The prevalence of glaucoma in the Melbourne Visual Impairment Project” Ophthalmology, 105: 733-9.
Wilson MR, Coleman AL, Fei Yu, Sasaki IF, Kim MH (2002) “Depression in patients with glaucoma as measured by self-reported surveys” Ophthalmology, 105[5]: 1018-22.
Wolfs RC, Klauver CC, Ramrattan RS, van Duijin CM, Hofman A, de Jong PT (1998) “Genetic risk of primary open-angle glaucoma. Population based familial aggregation study” Arch Ophthal, 116: 1640-45.
Zahari M, Mukesh B, Rait J, Taylor H, McCarty C (2006) “Progression of visual field loss in open angle glaucoma in the Melbourne Visual Impairment Project” Clinical and Experimental Ophthalmology, 34: 20–6.
Zeiter JH, Shin DH (1994) “Diabetes in primary open-angle glaucoma patients with inferior visual field defects” Graefes Archive for Clinical & Experimental Ophthalmology, 232[4]: 205-10.
Zghal I, Jeddi A, Hadj Alouane WB, Malouche N, Ayed S, Gaigi S (2000) “Primary open-angle glaucoma and diabetes [French]” Tunisie Medicale, 78[8-9]: 518-21.
Zwerling C, Sprince NL, Davis CS, Whitten PS, Wallace RR, Herringa SG (1998) “Occupational injuries among older workers with disabilities: a prospective cohort study of the Health and Retirement Survey, 1992 to 1994” American Journal of Public Health, 88: 1691-16.
11. References
The Economic Impact of Primary Open Angle Glaucoma - A Dynamic Economic Model 105

Tu n n e l V i s i o n The Economic Impact of
Primary Open Angle Glaucoma -
A Dynamic Economic Model
Centre for Eye Research Australia Centre for Eye Research Australia
Tu
nn
el V
isio
n The Eco
nom
ic Impact o
f Primary O
pen Angle G
laucom
a - A D
ynamic Eco
nom
ic Mo
del


![Tunnel Vision - International Union of Operating Engineers ... · launch pit for the SR-99 tunnel project in Seattle, Washington. [photo] ... 14 Tunnel Vision ... greg Lalevee, eleventh](https://static.fdocuments.us/doc/165x107/5af507e57f8b9a9e598d7bd5/tunnel-vision-international-union-of-operating-engineers-pit-for-the-sr-99.jpg)