TUNING THE THERMO-MECHANICAL RESPONSE AND CELL …
156
TUNING THE THERMO-MECHANICAL RESPONSE AND CELL MORPHOLOGY OF POROUS SHAPE MEMORY POLYMER SCAFFOLDS FOR ENDOVASCULAR OCCLUSION DEVICES A Dissertation by SAYYEDA MARZIYA HASAN Submitted to the Office of Graduate and Professional Studies of Texas A&M University in partial fulfillment of the requirements for the degree of DOCTOR OF PHILOSOPHY Chair of Committee, Duncan J. Maitland Committee Members, Karen L. Wooley Melissa A. Grunlan Balakrishna Haridas Head of Department, Anthony Guiseppi-Elie May 2016 Major Subject: Biomedical Engineering Copyright 2016 Sayyeda Marziya Hasan
Transcript of TUNING THE THERMO-MECHANICAL RESPONSE AND CELL …

TUNING THE THERMO-MECHANICAL RESPONSE AND CELL MORPHOLOGY
OF POROUS SHAPE MEMORY POLYMER SCAFFOLDS FOR ENDOVASCULAR
OCCLUSION DEVICES
A Dissertation
by
SAYYEDA MARZIYA HASAN
Submitted to the Office of Graduate and Professional Studies of
Texas A&M University
in partial fulfillment of the requirements for the degree of
DOCTOR OF PHILOSOPHY
Chair of Committee, Duncan J. Maitland
Committee Members, Karen L. Wooley
Melissa A. Grunlan
Balakrishna Haridas
Head of Department, Anthony Guiseppi-Elie
May 2016
Major Subject: Biomedical Engineering
Copyright 2016 Sayyeda Marziya Hasan

ii
ABSTRACT
Shape memory polymers are a class of smart materials that have the capability to
transition from a mechanically programmed secondary shape to their original shape.
This unique shape change behavior is useful for medical applications such as sutures and
self-expanding stents. Polyurethane SMP foams have been studied as an implantable
material for embolic applications due to their high surface area to volume ratio, known
biocompatibility, and tunable mechanical properties. Passive actuation of SMP foam in
physiological conditions is dependent on factors such as hydrophobicity and transition
temperature of the polymer, which affect plasticization by water and shape recovery.
This research focuses on altering the chemical structure of the foam matrix to
control the glass transition temperature (Tg) and actuation time. Incorporation of nano-
fillers into the foam matrix was used to induce radio-opacity and enhance mechanical
properties such as toughness and tensile strength. Further, the effect of filler
concentration and dispersion within the liquid phase on mechanical toughness was
evaluated. Lower filler concentrations yielded nanocomposites with improved
mechanical properties and thermal stability, with tunable actuation profiles and shape
recovery.
Control over the cell morphology was achieved by synthesizing a siloxane-glycol
amphiphile to serve as a foaming surfactant. Changes in foam morphology and cell size
due to changes in chemical structure and concentration of the surfactant were studied.
This work provided enhanced control over the foam morphology and the chemical,

iii
thermal, and mechanical properties of the SMP foam for use in medical applications,
specifically as vascular embolic agents.

iv
DEDICATION
To my wonderful family, who supported me through all my endeavors and
encouraged me to achieve my goals despite the setbacks.
v
ACKNOWLEDGEMENTS
I would like to thank my committee chair, Dr. Duncan Maitland for his support
and guidance throughout the course of my research. He was instrumental to my success
in the Biomedical Device Laboratory and my growth as a scientist. His mentoring style
allowed me to learn from my mistakes and think critically to solve problems. Dr.
Maitland always been available to answer my questions, listened to my concerns, and
when when he couldn’t help me right away, guided me in the right direction. Dr.
Maitland always treated me like a peer which was refreshing and allowed me to build
my confidence as a researcher. He accepted me into his lab, despite my short comings,
and mentored me to become an independent thinker and a self-possessed individual.
I would also like to acknowledge my committee members Dr. Melissa Grunlan,
Dr. Karen Wooley, and Dr. Balakrishna Haridas for their extended technical support
throughout my research. I would specifically like to thank Dr. Grunlan for her time and
feedback on designing my experimental protocol for surfactant synthesis and
troubleshooting the product purification step to improve my yield.
I would like to extend my appreciation to the laboratory for synthetic-biological
interactions and its director, Dr. Karen Wooley, for providing the key instrumentation I
needed for the mechanical evaluation of my materials. Additionally, I would like to
thank the collaborators for this work, Fang Zhou, from the Characterization Facility at
the University of Minnesota, who acquired all of the TEM images necessary for this
work. Thanks also go to my collaborators at Lawrence Livermore National Laboratory,
specifically Dr. Thomas Wilson and Dr. Jennifer Rodriguez. Dr. Wilson has been an

vi
academic mentor to me since my arrival at the Biomedical Device Laboratory. He has
provided valuable advice to me that allowed me to gain a better understanding of my
research and the scientific process. Dr. Jennifer Rodriquez has been my dear friend and
colleague. Her support and persistence gave me the confidence to pursue my Ph.D. and
her technical input aided my progress in all my research goals. I also want to extend my
gratitude to the Laboratory for Biological Mass Spectrometry at Texas A&M University
and Dr. Yohannes Rezenom and Vanessa Santiago for their technical support in
acquiring mass spectrometry data that was crucial to my project. My thanks goes out to
Dr. Jeffery Raymond for guiding me through the basics of research during my first
semester as a graduate student. Additionally, I would like to thank Dr. Tiffany Gustafson
and Julie Grinde for acquiring X-ray images of my polymer samples at the Texas
Institute of Preclinical Studies.
My peers at the Biomedical Device Laboratory also deserve my gratitude for all
of their help and support throughout my time at Texas A&M. Special thanks to Rachael
Muschalek, Nicole Rivera, Landon Nash, Anthony Boyle, Todd Landsman, Alexa
Easley, Garrett Harmon, Jane Fredrick, Harrison Emery for their time and effort spent
brainstorming new ideas, assisting me with new experimental setup, and being a good
friend over the years.
I would like to thank my undergraduate mentors at Texas Lutheran University,
Dr. John McClusky and Dr. William Davis, for getting me interested in chemistry and
polymer science. Their encouragement and mentorship allowed me to realize my
interests and helped me recognize my career goals.

vii
Finally, thanks to my mother and father, Gulshan Hasan and Sayed Shameem
Hasan, for inspiring me to pursue a career in a STEM field. Their hard work and
sacrifice has given me a chance to achieve my dreams and provided an example for me
to follow for my professional and personal life. My sisters, Sayyeda Tooba Hasan and
Sayyeda Ayesha Hasan, supported all my decisions and have motivated me to be the best
version of myself. I would also like to recognize my wonderful friends Brian Ramirez,
Jessica Unterberger, Chelsea Cruz, Stephen Gutierrez, and Jonathan Eagle for their
patience and love throughout the years, along with their unwavering confidence in me,
that provided the platform I needed to progress in life.

viii
NOMENCLATURE
Al2O3 Aluminum oxide
CDCl3 Deuterated chloroform
CO2 Carbon dioxide
D Dispersion parameter
DCTB trans-2-[3-(4-t-Butylphenyl)-2-methyl-2-propenylidene]malono-
nitrile
DI H2O Deionized water
DMA Dynamic mechanical analysis
DSC Differential scanning calorimetry
E’ Dynamic shear storage modulus
E” Dynamic shear loss modulus
FOW foam-over-wire
FTIR Fourier transform infrared
GDC Gugleilmi detachable coil
HDI Hexamethylene diisocyanate
H’NMR Proton nuclear magnetic resonance
HPED N,N,N’,N’-Tetrakis(2-hydroxypropyl)ethylenediamine
ICP-MS Inductively coupled plasma mass spectrometry
IPDI Isophorone diisocyanate
ISAT International Subarachnoid Aneurysm Trial
KBr Potassium bromide

ix
KTFA potassium trifluoroacetate
MALDI Matrix-assisted laser desorption ionization
NCO Isocyanate
Nitinol Nickel-titanium alloy
OH Hydroxyl
PDMS poly(dimethylsiloxane)
PEG Polyethylene glycol
Pt platinum(0)-1,3-divinyl-1,1,3,3-tetramethyldisiloxane complex
Rh tris(triphenylphosphine)rhodium(I) chloride
RO H2O Reverse osmosis water
SAH Subarachnoid hemorrhage
SEM Scanning Electron Microscopy
SiO2 Silicon dioxide
SMP Shape memory polymer
TEA Triethanolamine
TEM Transmission electron microscopy
TGA Thermogravimetric analysis
Tg Glass transition temperature
TMHDI trimethyl-1,6-hexamethylene diisocyanate, 2,2,4- and 2,4,4-
mixture
TS 1,1,1,3,5,5,5-heptamethyltrisiloxane
Ttrans Transition temperature

x
W Tungsten
X.D. X-ray density

xi
TABLE OF CONTENTS
Page
ABSTRACT .......................................................................................................................ii
DEDICATION .................................................................................................................. iv
ACKNOWLEDGEMENTS ............................................................................................... v
NOMENCLATURE ....................................................................................................... viii
TABLE OF CONTENTS .................................................................................................. xi
LIST OF FIGURES ........................................................................................................ xiii
LIST OF TABLES .........................................................................................................xvii
CHAPTER I INTRODUCTION ........................................................................................ 1
1.1 Shape memory polymers (SMPs) ........................................................................... 1
1.2 Fabrication of SMP foams ...................................................................................... 3
1.3 Use of SMP foams in medical devices ................................................................... 6
1.4 SMP foams for neurovascular aneurysm occlusion ............................................. 10
CHAPTER II CHEMICAL MODIFICATION OF SMP FOAMS TO CONTROL
THERMO-MECHANICAL PROPERTIES .................................................................... 14
2.1 Introduction .......................................................................................................... 14
2.2 Materials and methods ......................................................................................... 16
2.3 Results and discussion .......................................................................................... 24
2.4 Conclusions .......................................................................................................... 38
CHAPTER III INCORPORATING TUNGSTEN NANOPARTICLES TO INDUCE
RADIOPACITY ............................................................................................................... 40
3.1 Introduction .......................................................................................................... 40
3.2 Materials and methods ......................................................................................... 44
3.3 Results and discussion .......................................................................................... 51
3.4 Conclusions .......................................................................................................... 63
CHAPTER IV USE OF NANOPARTICLES TO MODIFY MECHANICAL
PROPERTIES AND SHAPE MEMORY BEHAVIOR .................................................. 64

xii
4.1 Introduction .......................................................................................................... 64
4.2 Materials and methods ......................................................................................... 66
4.3 Results and discussion .......................................................................................... 72
4.4 Conclusions .......................................................................................................... 90
CHAPTER V DEVELOPMENT OF SILOXANE-POLYETHYLENE GLYCOL
SURFACTANTS TO CONTROL SMP FOAM MORPHOLOGY ................................ 91
5.1 Introduction .......................................................................................................... 91
5.2 Materials and methods ......................................................................................... 94
5.3 Results and discussion ........................................................................................ 104
5.4 Conclusions ........................................................................................................ 118
CHAPTER VI CONCLUSIONS ................................................................................... 120
6.1 Summary ............................................................................................................ 120
6.2 Significane of work ............................................................................................ 121
6.3 Challenges and future directions ........................................................................ 124
REFERENCES ............................................................................................................... 127
xiii
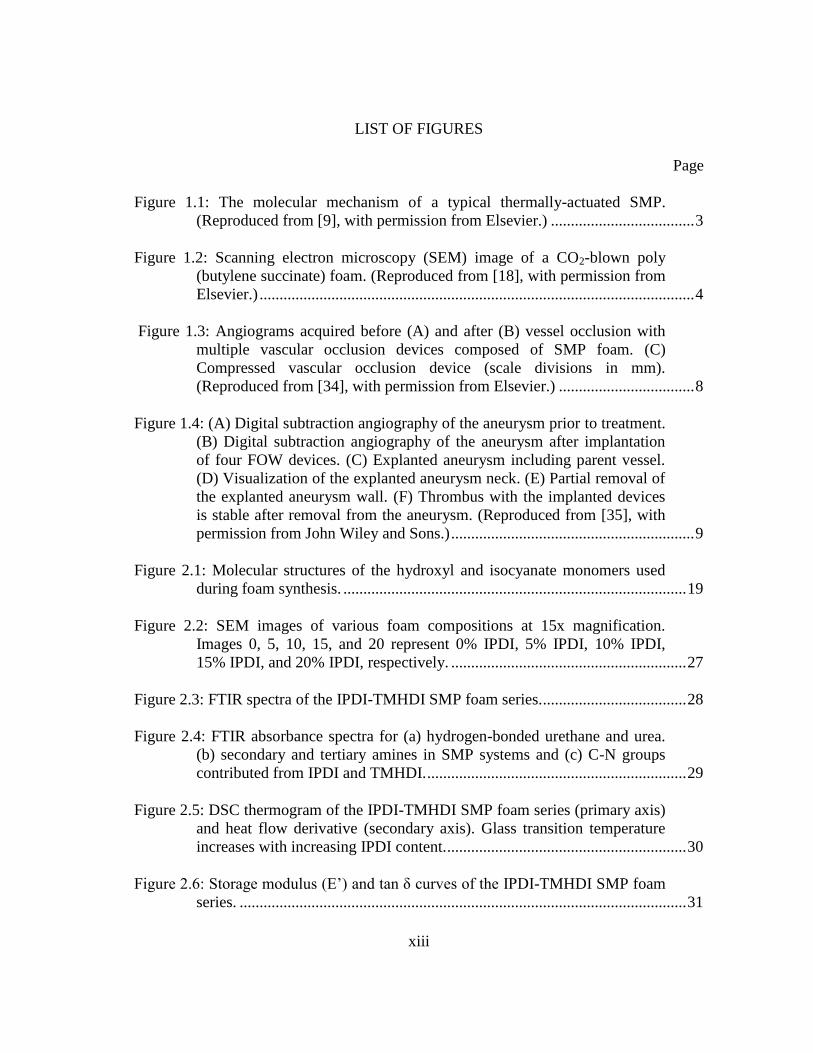
LIST OF FIGURES
Page
Figure 1.1: The molecular mechanism of a typical thermally-actuated SMP.
(Reproduced from [9], with permission from Elsevier.) .................................... 3
Figure 1.2: Scanning electron microscopy (SEM) image of a CO2-blown poly
(butylene succinate) foam. (Reproduced from [18], with permission from
Elsevier.) ............................................................................................................. 4
Figure 1.3: Angiograms acquired before (A) and after (B) vessel occlusion with
multiple vascular occlusion devices composed of SMP foam. (C)
Compressed vascular occlusion device (scale divisions in mm).
(Reproduced from [34], with permission from Elsevier.) .................................. 8
Figure 1.4: (A) Digital subtraction angiography of the aneurysm prior to treatment.
(B) Digital subtraction angiography of the aneurysm after implantation
of four FOW devices. (C) Explanted aneurysm including parent vessel.
(D) Visualization of the explanted aneurysm neck. (E) Partial removal of
the explanted aneurysm wall. (F) Thrombus with the implanted devices
is stable after removal from the aneurysm. (Reproduced from [35], with
permission from John Wiley and Sons.) ............................................................. 9
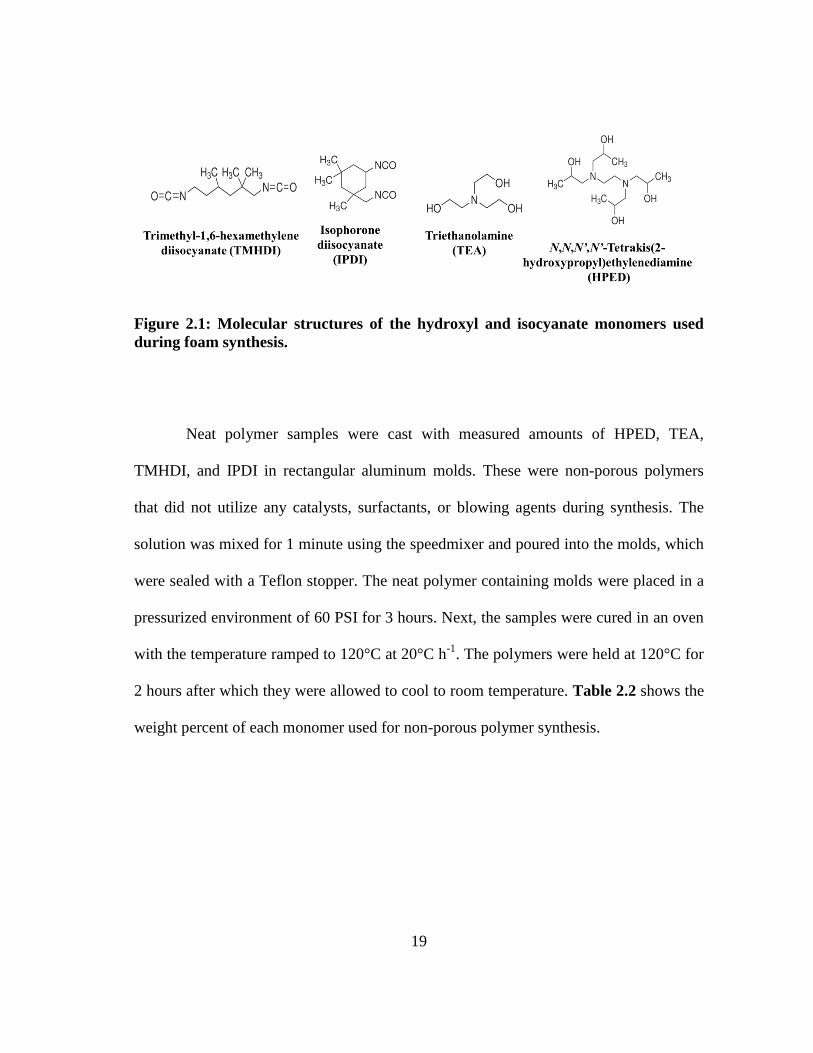
Figure 2.1: Molecular structures of the hydroxyl and isocyanate monomers used
during foam synthesis. ...................................................................................... 19
Figure 2.2: SEM images of various foam compositions at 15x magnification.
Images 0, 5, 10, 15, and 20 represent 0% IPDI, 5% IPDI, 10% IPDI,
15% IPDI, and 20% IPDI, respectively. ........................................................... 27
Figure 2.3: FTIR spectra of the IPDI-TMHDI SMP foam series. .................................... 28
Figure 2.4: FTIR absorbance spectra for (a) hydrogen-bonded urethane and urea.
(b) secondary and tertiary amines in SMP systems and (c) C-N groups
contributed from IPDI and TMHDI. ................................................................. 29
Figure 2.5: DSC thermogram of the IPDI-TMHDI SMP foam series (primary axis)
and heat flow derivative (secondary axis). Glass transition temperature
increases with increasing IPDI content. ............................................................ 30
Figure 2.6: Storage modulus (E’) and tan δ curves of the IPDI-TMHDI SMP foam
series. ................................................................................................................ 31
xiv
Page
Figure 2.7: Actuation of the SMP foam depicted by a decay in E’ in (a) 37°C and
(b) 50°C PBS bath. ........................................................................................... 35
Figure 2.8: Volume expansion images for 0 IPDI, 10 IPDI, and 20 IPDI
respectively. As IPDI content increases in the foams, the shape recovery
to full expansion decreases. .............................................................................. 36
Figure 2.9: Molecular geometries and solvent interaction for (a) TEA(IPDI)3 and
(b) TEA(TMHDI)3. The chains are more tightly packed due to restricted
movement from IPDI in (a) while appear to have free rotation due to the
linear backbone of TMHDI in (b). .................................................................... 37
Figure 3.1: SEM images of the SMP nanocomposites at 10-11x magnification. b)
TEM images of the SMP nanocomposties showing filler aggregates. ............. 54
Figure 3.2: Pore sizes in the axial and transverse direction of SMP foams with
increasing W content. ....................................................................................... 55
Figure 3.3: a) X-ray density of the SMP foams with increasing W content. b)
Design of the frame mounted with crimped SMP foam over nitinol wire.
c) X-ray image of the SMP foams through porcine jaw. d) X-ray image
of the SMP foams through porcine neck. Panels a) and b) were acquired
via collaboration with the Laboratory for Synthetic-Biologic Interactions
using a Bruker In-Vivo Xtreme multimodal preclinical imaging system.
Panels c) and d) were acquired via collaboration with Texas Institute of
Preclinical Studies using a Philips Allura Xper FD 20 C-arm System............. 56
Figure 3.4: Mechanical properties of the SMP foams with increasing W content. .......... 59
Figure 3.5: Actuation time of the SMP foams with increasing W content. ..................... 60
Figure 4.1: TEM images of various SMP nanocomposites at 10x magnification. ........... 75
Figure 4.2: Average aggregate diameter (a) and nearest neighbor distance (b) for
the selected nanoparticles. ................................................................................ 77
Figure 4.3: Actuation profiles of a) Al2O3, b) SiO2, and c) W nanocomposites in
50°C RO water. Original diameter of all foam cylinders was 4000 μm. .......... 79

xv
Page
Figure 4.4: Weight (%) versus temperature (°C) curves for a) Al2O3, b) SiO2 and c)
W nanocomposites. Al2O3 and SiO2 nanocomposites had increased
thermal stability, as indicated by an increase in thermal degradation
temperature, while W nanocomposites had minimal thermal
improvement. .................................................................................................... 82
Figure 4.5: Mechanical properties of SMP foams. a) Ultimate tensile strength
(kPa), b) toughness (J·m-3
) and c) strain at break (%) of SMP
nanocomposites compared to non-loaded foams. ............................................. 84
Figure 4.6: Particlulate count of SMP nanocomposites and control. a) Threshold:
6000 particles ≥10 μm. b) Threshold: 600 particles ≥25 μm. All
particulate testing was conducted in compliance with USP 788. ..................... 86
Figure 4.7: Leachable analysis of various concentrations of a) Al2O3 b) SiO2 and c)
W nanoparticles from SMP foams over 16 days. ............................................. 88
Figure 5.1: Hydrosilyation reaction schematic of a) trisiloxane and b)
poly(dimethylsiloxane) hydride terminated with poly(ethylene glycol)
allyl methyl ether (n = 8 or 25). ........................................................................ 96
Figure 5.2: 1H NMR spectra of the siloxane-PEG surfactants. a) TS-PEG (n = 8 or
25) and b) PDMS-PEG (n = 8 or 25). ............................................................. 105
Figure 5.3: Transmission FTIR spectra of the four siloxane-PEG surfactants. a)
TS-based and b) PDMS-based surfactants with key peaks highlighting
siloxane and PEG coupling. ............................................................................ 106
Figure 5.4: MALDI spectra of the surfactants showing shifts in molecular weights
due to siloxane-PEG coupling. a) TS-PEG(350), b) TS-PEG(1100), c)
PDMS-PEG(350), and d) PDMS-PEG(1100). ............................................... 109
Figure 5.5: SEM images of SMP foams with varying pore sizes based on
surfactant type. a) 100 HDI TS-PEG(350), b) 100 HDI TS-PEG(1100),
c) 100 HDI PDMS-PEG(350), d) 100 HDI PDMS-PEG(1100), and e)
100 TM PDMS-PEG(1100). ........................................................................... 112
Figure 5.6: Pore size and strut thickness of SMP foams fabricated using the
siloxane-PEG surfactants. a) TS-PEG(350), b) TS-PEG(1100), c)
PDMS-PEG(350), and d) PDMS-PEG(1100). ............................................... 114
xvi
Page
Figure 5.7: Micrographs of SMP foams with varying strut thickness based on
surfactant type and concentration. a) TS-PEG(350), b) TS-PEG(1100), c)
PDMS-PEG(350), and d) PDMS-PEG(1100). ............................................... 116
Figure 5.8: Actuation profiles of SMP foams synthesized with siloxane-PEG
surfactants. ...................................................................................................... 117
xvii
LIST OF TABLES
Page
Table 2.1: Composition of foams using trimethylhexamethylene diisocyanate
(TMHDI) and isophorone diisocyanate (IPDI) for the isocyanate
component of the urethane foam. Three foam batches were synthesized
and the average weight percent was determined for all batches. ...................... 18
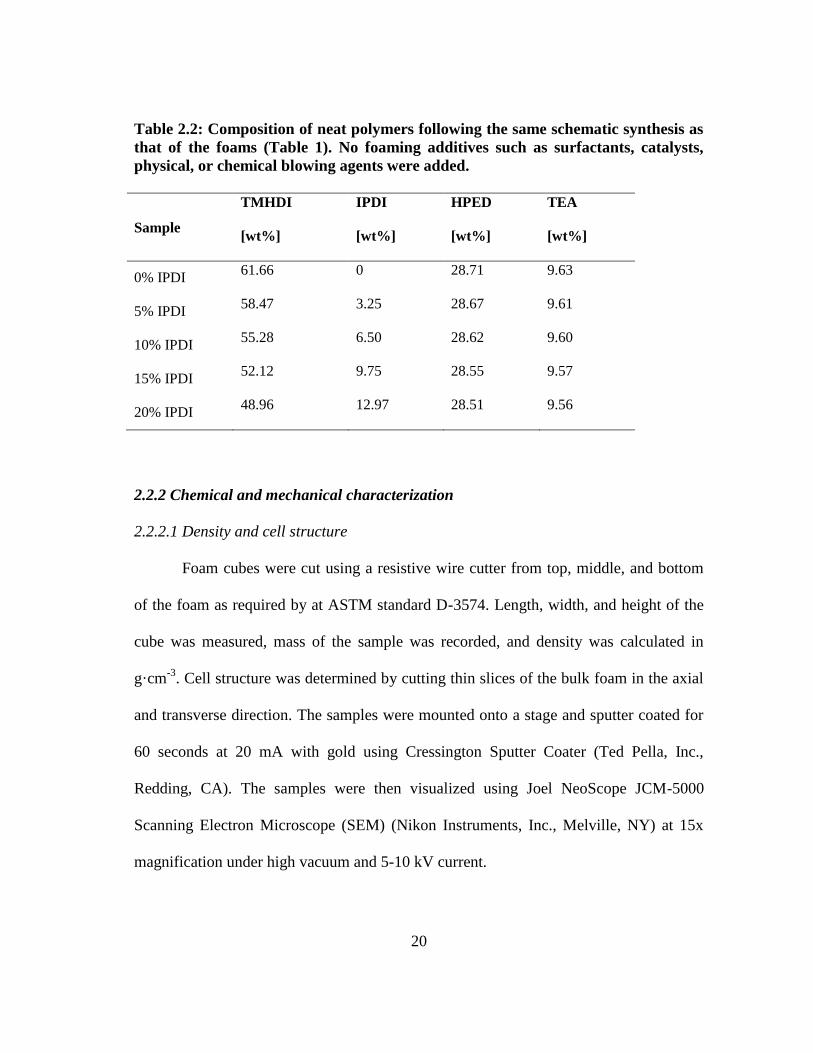
Table 2.2: Composition of neat polymers following the same schematic synthesis
as that of the foams (Table 1). No foaming additives such as surfactants,
catalysts, physical, or chemical blowing agents were added. ........................... 20
Table 2.3: Summary of key physical properties of various foam compositions. ............. 25
Table 2.4: Summary of the foam properties related to actuation and working time. ....... 33
Table 3.1: Composition of foams using 100% trimethylhexamethylene
diisocyanate (TMHDI) for the isocyanate component of the urethane
foam and increasing volume percent concentration of W nanoparticles.
Three foam batches were synthesized and the average weight percent of
the monomers and volume percent of tungsten nanoparticles was
determined for all batches. ................................................................................ 47
Table 3.2: Key physical and thermal properties of the SMP foam nanocomposites........ 53
Table 3.3: Key mechanical properties of the SMP foam nanocomposites. ...................... 58
Table 4.1: Physical properties of the SMP foam nanocomposites. The SMP
consisted of 67 mol% HPED, 33 mol% TEA, and 100 mol% TMHDI. .......... 73
Table 4.2: Dispersion parameter values of the SMP nanocomposites.............................74
Table 4.3: Volume expansion (%) and volume recovery of various SMP
nanocomposites. ................................................................................................ 81
Table 5.1: Composition of foams synthesized with 100% HDI and 100% TMHDI
with various surfactant types and concentrations. .......................................... 101
Table 5.2: Rheological and surface tension properties of the various siloxane-PEG
surfactants. ...................................................................................................... 107
Table 5.3: Key physical properties of SMP foams synthesized using siloxane-PEG
surfactants. ...................................................................................................... 110
1
CHAPTER I
INTRODUCTION
1.1 Shape memory polymers (SMPs)
Shape memory polymers (SMPs) are “smart” materials that have the capability of
shape change from a programmed secondary shape to a primary shape upon the input of
an external stimulus such as heat, light, or electricity. 1-3
For thermal actuation, the
polymer can be synthesized in a primary shape, heated above its transition temperature
and mechanically programmed into a secondary shape. 4 Once cooled below the
transition temperature, the material will remain in the secondary shape until it is heated
again to return to its original shape. 4 Shape fixity occurs when the polymer chains are
forced to align into conformations with net orientation versus equilibrium random
conformations and cooled below the actuation transition to restrict chain mobility. 5
Entropic recovery so that the polymer chains may once more achieve random orientation
then drives the return to original shape. 5 Due to this shape memory behavior, SMPs
have a wide range of uses in medical and industrial applications such as vascular stents,
occlusion devices, and self-controlled actuators. 1, 6
Since their discovery in the 1980’s, shape memory polymers (SMPs) have
become widely used in applications that require innovative materials. 7, 8
The active
shape change response of SMPs has been harnessed to develop smart, stimuli-responsive
Parts of this chapter were reprinted from “Porous Shape Memory Polymers: Design and
Applications,” by Sayyeda M. Hasan, Landon D. Nash, Duncan J. Maitland, Journal of
Polymer Science Part B: Polymer Physics 2016. Copyright (2016) John Wiley and Sons.

2
systems that have utility in a wide range of applications including biomedical, aerospace,
textiles, and robotics. 8 The term “shape memory” was first coined by Vernon in 1941,
however it was not until the 1960’s when crosslinked polyethylene was used to develop
heat-shrinkable tubes and films. 9, 10
Over the last two decades, the growing interest in
SMPs has facilitated commercial applications of these materials in textiles and smart
customer products. 10
SMPs consist of net points, which are a part of the stable polymer network, and
reversible switching segments. 2, 11
Net points are responsible for the original shape
while the switching segments provide the secondary shape and allow for shape change to
occur. 12
As shown in figure 1.1, a thermally-actuated SMP can be programmed, via
external stress, into a secondary shape after being heated above the transition
temperature of the switching segments. 9 The new shape can be set by cooling at a
constant load. The new shape is at a higher energy state because the new orientation of
the polymer chains decreases the entropy of the system. However, the rigidity of the
polymer chains below the transition temperature prevents the polymer from relaxing to
the lower energy primary shape. However, when heated above the transition
temperature, the programmed SMP returns to its original shape due to entropic recovery
of the net points. 5, 9
In addition to ambient changes in temperature, this shape change
can be triggered by different stimuli such as light, magnetic field, pH, solvent, and
electricity and is dependent on the polymer type and incorporation of additives such as
nanoparticles. 4, 12

3
Figure 1.1: The molecular mechanism of a typical thermally-actuated SMP.
(Reproduced from [9], with permission from Elsevier.)
1.2 Fabrication of SMP foams
1.2.1 Gas blowing
Although gas blowing is traditionally used to create commercial polymer foams
for thermal and mechanical insulation, the use of this fabrication technique has
significantly increased in the medical industry. 13, 14
Regardless of the desired application or foaming process being used, cell
nucleation and growth of bubbles is important for the development of pores. 15, 16
Bubbles can be generated using three different methods: chemical, physical, and
biological blowing. Chemical blowing agents generate gas due to a chemical reaction

4
while physical blowing agents cause bubble formation as a result of mechanical action or
phase transitions. 16
Biological agents are usually bacterial species that generate gas as a
result of their metabolic functions. 16
Carbon dioxide (CO2) and other volatile solvents
are typical blowing agent due to their low critical point, non-flammability, and non-
toxicity. 15, 17
Figure 1.2 shows a typical SEM image of foam blown using CO2. 18
Figure 1.2: Scanning electron microscopy (SEM) image of a CO2-blown poly
(butylene succinate) foam. (Reproduced from [18], with permission from Elsevier.)
Gas foaming can be divided into two classes. The first class occurs when a liquid
phase turns to vapor as a result of pressure drop or a temperature rise. 16
Singhal et al.
developed SMP foams that utilized gas blowing to achieve solid polyurethane foams.
This polymer system was chemically crosslinked during foaming to maintain the pore
5
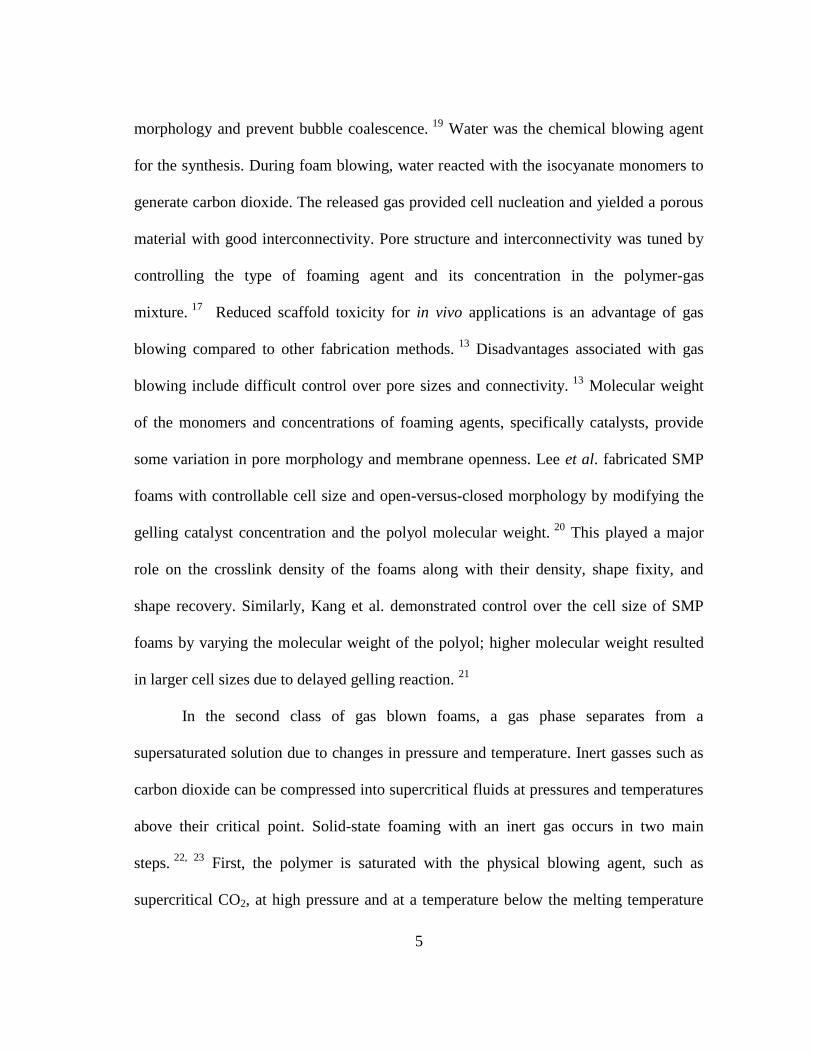
morphology and prevent bubble coalescence. 19
Water was the chemical blowing agent
for the synthesis. During foam blowing, water reacted with the isocyanate monomers to
generate carbon dioxide. The released gas provided cell nucleation and yielded a porous
material with good interconnectivity. Pore structure and interconnectivity was tuned by
controlling the type of foaming agent and its concentration in the polymer-gas
mixture. 17
Reduced scaffold toxicity for in vivo applications is an advantage of gas
blowing compared to other fabrication methods. 13
Disadvantages associated with gas
blowing include difficult control over pore sizes and connectivity. 13
Molecular weight
of the monomers and concentrations of foaming agents, specifically catalysts, provide
some variation in pore morphology and membrane openness. Lee et al. fabricated SMP
foams with controllable cell size and open-versus-closed morphology by modifying the
gelling catalyst concentration and the polyol molecular weight. 20
This played a major
role on the crosslink density of the foams along with their density, shape fixity, and
shape recovery. Similarly, Kang et al. demonstrated control over the cell size of SMP
foams by varying the molecular weight of the polyol; higher molecular weight resulted
in larger cell sizes due to delayed gelling reaction. 21
In the second class of gas blown foams, a gas phase separates from a
supersaturated solution due to changes in pressure and temperature. Inert gasses such as
carbon dioxide can be compressed into supercritical fluids at pressures and temperatures
above their critical point. Solid-state foaming with an inert gas occurs in two main
steps. 22, 23
First, the polymer is saturated with the physical blowing agent, such as
supercritical CO2, at high pressure and at a temperature below the melting temperature

6
of the polymer. During this step, the Tg of the polymer decreases allowing the material to
become rubbery. In the second step, the pressure within the system is decreased to
promote a shift in the thermodynamic equilibrium. If the polymer is in the rubbery state,
oversaturation of CO2 will lead to instantaneous nucleation and cell growth. Once the
CO2 evaporates out of the system, the polymer will return to the glassy state, leaving
behind a porous structure. These supercritical fluids simultaneously possess fluid
characteristics, namely density, and gas properties such as compressibility and mass
diffusion, 24
which collectively enable supercritical fluids to solvate polymer networks.
Once the supercritical pressure conditions are removed, the dissolved gas expands and
blows the polymer into a porous structure. The lack of residual solvents, catalysts, and
surfactants make supercritical fluids attractive for creating porous structures for
biomedical and tissue engineering applications. 25
Supercritical carbon dioxide has been
used to create porous structures from blends of thermoplastic polyurethane and
polylactic acid. Because the foam formation occurs below the thermal transition, these
scaffolds have a dynamic, contractible porous structure that is proposed for drug delivery
systems and wound dressings. 26
1.3 Use of SMP foams in medical devices
Recent studies have supported the thrombogenic nature of the porous SMP foam
morphology. Numerical simulations for the embolization of a patient specific basilar
artery aneurysm using SMP foam revealed thrombogenic hemodynamics. 27
Blood
within the SMP foam had fluid residence times several orders of magnitude greater than
the untreated anatomy. This increase in fluid residence and the decrease in fluid shear
7
rates imparted by the foam collectively contribute to thrombus forming conditions.
These observations are further supported by an in-vitro study by Muschenborn et al,
which compared the permeability of reticulated SMP foams to traditional embolic coils.
When considering only fluid dynamics, the increased form factor and decreased
permeability of embolic SMP foams when compared to coils suggest that SMP foam
would create better flow stagnation for eventual thrombus formation. 28
Several material formulations have been proposed to improve on the clinical
implementation of SMP embolic foams. Many embolic foam devices require delivery
through a catheter, requiring a delayed expansion profile to prevent the embolic foam
from expanding prematurely and binding within the catheter lumen. The metric of
“working time” defines the amount of time that a device can be exposed to the aqueous
environment of a delivery catheter before it can no longer be delivered or retracted from
the target anatomy. Working time can be increased by controlling the bulk material
hydrophobicity through monomer selection. Using different stoichiometric amounts of
hydrophobic diisocyanate monomers can successfully control the rate of moisture
plasticization for embolic foams, leading to controlled working times. 29, 30
The majority of reported embolic SMP foams are designed to be permanent
biostable implants. 19, 31
Although these permanent foams have demonstrated excellent
healing responses in-vivo, 32
certain tissue engineering applications motivate the
development of degradable tissue scaffolds that can be entirely replaced with native
tissue. With that goal in mind, Singhal et al. successfully developed SMP embolic foams
with tunable degradation profiles. 33
This was achieved by incorporating hydrolysable
8
polyester segments into the foam using polycaprolactone triol. These degradable foams
have morphologies and thermo-mechanical properties comparable to non-degradable
SMP scaffolds. Similar to working time, the degradation rate of these scaffolds can be
tailored by altering the bulk hydrophobicity through diisocyanate monomer selection.
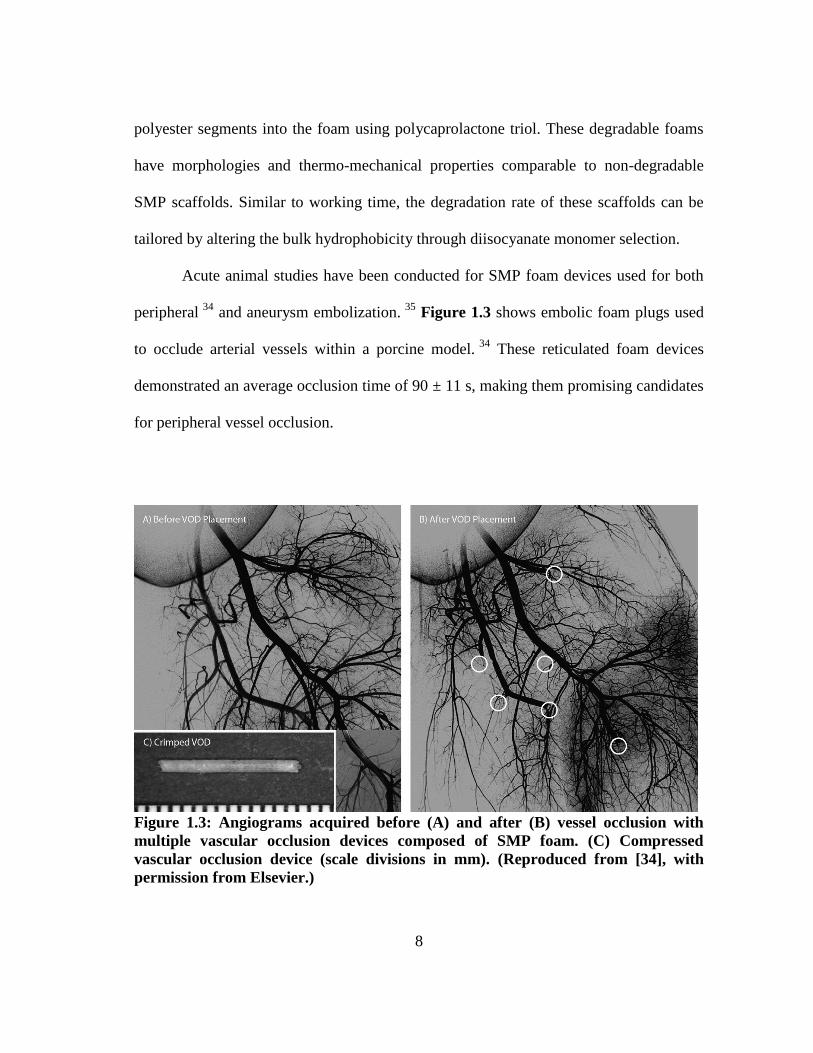
Acute animal studies have been conducted for SMP foam devices used for both
peripheral 34
and aneurysm embolization. 35
Figure 1.3 shows embolic foam plugs used
to occlude arterial vessels within a porcine model. 34
These reticulated foam devices
demonstrated an average occlusion time of 90 ± 11 s, making them promising candidates
for peripheral vessel occlusion.
Figure 1.3: Angiograms acquired before (A) and after (B) vessel occlusion with
multiple vascular occlusion devices composed of SMP foam. (C) Compressed
vascular occlusion device (scale divisions in mm). (Reproduced from [34], with
permission from Elsevier.)
9
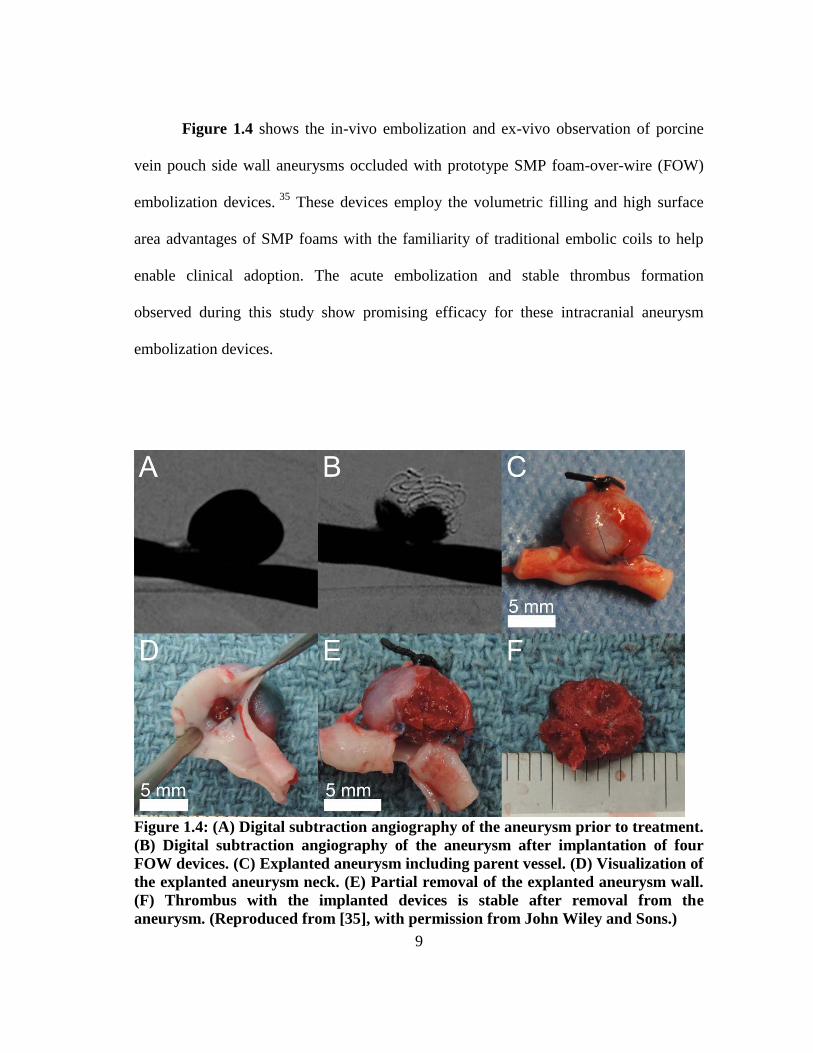
Figure 1.4 shows the in-vivo embolization and ex-vivo observation of porcine
vein pouch side wall aneurysms occluded with prototype SMP foam-over-wire (FOW)
embolization devices. 35
These devices employ the volumetric filling and high surface
area advantages of SMP foams with the familiarity of traditional embolic coils to help
enable clinical adoption. The acute embolization and stable thrombus formation
observed during this study show promising efficacy for these intracranial aneurysm
embolization devices.
Figure 1.4: (A) Digital subtraction angiography of the aneurysm prior to treatment.
(B) Digital subtraction angiography of the aneurysm after implantation of four
FOW devices. (C) Explanted aneurysm including parent vessel. (D) Visualization of
the explanted aneurysm neck. (E) Partial removal of the explanted aneurysm wall.
(F) Thrombus with the implanted devices is stable after removal from the
aneurysm. (Reproduced from [35], with permission from John Wiley and Sons.)
10
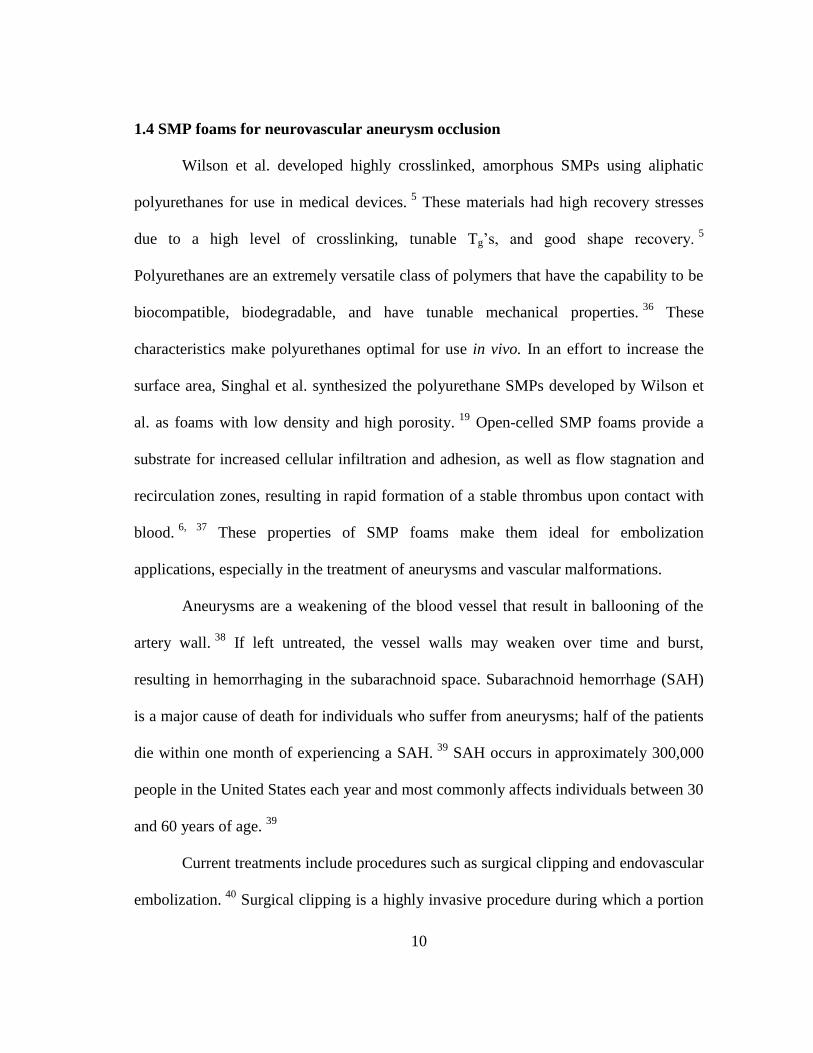
1.4 SMP foams for neurovascular aneurysm occlusion
Wilson et al. developed highly crosslinked, amorphous SMPs using aliphatic
polyurethanes for use in medical devices. 5 These materials had high recovery stresses
due to a high level of crosslinking, tunable Tg’s, and good shape recovery. 5
Polyurethanes are an extremely versatile class of polymers that have the capability to be
biocompatible, biodegradable, and have tunable mechanical properties. 36
These
characteristics make polyurethanes optimal for use in vivo. In an effort to increase the
surface area, Singhal et al. synthesized the polyurethane SMPs developed by Wilson et
al. as foams with low density and high porosity. 19
Open-celled SMP foams provide a
substrate for increased cellular infiltration and adhesion, as well as flow stagnation and
recirculation zones, resulting in rapid formation of a stable thrombus upon contact with
blood. 6, 37
These properties of SMP foams make them ideal for embolization
applications, especially in the treatment of aneurysms and vascular malformations.
Aneurysms are a weakening of the blood vessel that result in ballooning of the
artery wall. 38
If left untreated, the vessel walls may weaken over time and burst,
resulting in hemorrhaging in the subarachnoid space. Subarachnoid hemorrhage (SAH)
is a major cause of death for individuals who suffer from aneurysms; half of the patients
die within one month of experiencing a SAH. 39
SAH occurs in approximately 300,000
people in the United States each year and most commonly affects individuals between 30
and 60 years of age. 39
Current treatments include procedures such as surgical clipping and endovascular
embolization. 40
Surgical clipping is a highly invasive procedure during which a portion

11
of the skull is removed while the patient is under anesthesia and a small metal clip is
placed on the aneurysm neck to stop blood flow. This method is effective in preventing
future bleeding and reopening of the aneurysm, however, long hospital stays and high
procedural costs are a major disadvantage. 40
Alternatively, endovascular embolization is
a minimally invasive procedure that was first introduced in 1990 in the form of
Guglielmi Detachable Coils (GDCs). 41
This technique involves delivering platinum
coils to the aneurysm space, via catheter, to cause thrombus formation and subsequently
treat the aneurysm. 41
However, treatment with GDCs has shown to have incomplete
thrombus formation which leads to recanalization (15%), poor occlusion, and a renewed
risk of aneurysm rupture. 42, 43
The International Subarachnoid Aneurysm Trial (ISAT)
conducted in 2002 showed treatment with GDCs resulted in 18% fatality, notably
because of rebleeding of the aneurysm after treatment and parent-vessel occlusion from
the embolic devices. 42
HydroCoil, an alternative product introduced in 2002, consists of
an expandable and resorbable acrylic hydrogel around a platinum coil to serve as a
space-filling agent and promote improved occlusion. 44
Although these coils had better
packing of the aneurysm lumen compared to GDCs (72% verses 32%), procedural
complications of device delivery failure and aneurysm rupture during treatment was still
a major concern. 45
1.4.1 Rationale for increasing the hydrophobicity of SMP foams
Endovascular occlusion using SMP foams would provide better occlusion and
thrombosis compared to current treatments such that they are more volume filling which
results in stable occlusion and minimized recanalization. 38, 46
One drawback of this

12
approach includes premature actuation of the foam in the catheter under aqueous
conditions. 46
Singhal et al. studied the effect of water plasticization of the actuation time
of SMP foam along with their biocompatibility. 19, 38
Increasing polymer hydrophobicity
changed the water plasticization rate of the foam Tg from 1 to 10 minutes, decreasing the
rate of foam actuation and likelihood of premature expansion within the delivery
catheter. 47
This is important for clinical applications that require long working times for
device delivery and positioning via catheter, where premature SMP actuation would
cause the device to lodge in the catheter and prevent delivery of the device, which would
add to the total operation time and cost. Thus, achieving increased hydrophobicity to
further reduce the rate of actuation was a major focus for the first section of this research
proposal.
1.4.2 Rationale behind using fillers in SMP foams
Polyurethane SMP foams lack the ability to intrinsically attenuate x-rays, which
is a major disadvantage for their use in endovascular delivery of medical devices using
x-ray fluoroscopy. 38, 48
Rodriguez et al. dispersed tungsten microparticles into the foam
matrix to achieve radio-opacity. 38
The SMP composites had sufficient visibility via x-
ray fluoroscopy, along with improved mechanical properties, to enable endovascular
delivery. However, the microparticles only allowed up to 4% by volume loading in the
foam matrix before the foams coalesced during the curing process. Nanoparticle use as
fillers, instead, has the potential to achieve higher loading concentrations and better
dispersion in the foams compared to microparticles, enabling utilization of smaller, less
dense devices that are still visible using x-ray.

13
1.4.3 Rationale behind using silicone surfactants during foaming
Silicone surfactants have been used in polyurethane foam synthesis since the
1950’s and their ability to stabilize cell structure has been well documented. 49-51
The
surface activity of the surfactant allows for pore stabilization during foam rising and
controls the rate of open versus closed cells in the bulk foam. 49
The effect of the
chemical structure of the surfactant on foam morphology is a critical aspect of
reproducible foam synthesis using gas blowing technique. The use of commercial
surfactants has two significant drawbacks for the manufacture of medical SMP foams.
First, they are only available in bulk amounts that far exceed the demand for
manufacturing small batches of foam medical devices. The surplus of surfactant
compounded with limited shelf life (18 months) results in excessive waste. Second, the
current synthesis uses a surfactant from a sole source supplier, making the material
dependent on a chemical with questionable long term availability and unknown
constituents. Further, two or more surfactants are used during foam synthesis due to the
different properties provided by each component. Synthesizing a customized surfactant
would eliminate utilization of surfactant combinations, bulk waste generation, and
provide a stable surfactant source for long term material synthesis.

14
CHAPTER II
CHEMICAL MODIFICATION OF SMP FOAMS TO CONTROL THERMO-
MECHANICAL PROPERTIES
2.1 Introduction
Shape-memory polymers (SMPs) are considered smart materials because they
have the capability of switching between a primary and a secondary shape due to
thermo-mechanical memory. 12, 52-59
The SMP can be synthesized into a primary shape;
when heated above a transition temperature (Ttrans) an SMP can be programmed via
mechanical stimulus and set into a secondary shape during cooling. 3, 52-55
Upon the input
of an external stimulus, such as heat, the material will actuate to its original shape, thus
demonstrating shape-memory behavior. 60, 61
Our group focuses on developing
polyurethane shape-memory polymers, specifically, as foams for their potential
application in an embolic vascular device for aneurysm treatment. 56-58
A recent review
of alternative porous/foam SMP strategies in biomedical applications, such as scaffolds,
sponges, and drug-delivery platforms, are elucidated elsewhere. 62
Aneurysms are a weakening of the blood vessel wall that result in ballooning of
the area. 12, 63
They affect about 3 to 5 million people in the United States and up to
300,000 people suffer from a ruptured aneurysm each year. 63
Aneurysm rupture results
in a subarachnoid hemorrhage which can lead to severe disability or even death. 64, 65
Reprinted with permission from “Effects of Isophorone Diisocyanate on the Thermal and Mechanical
Properties of Shape-Memory Polyurethane Foams,” by Sayyeda M. Hasan, Jeffery E. Raymond, Thomas
S. Wilson, Brandis K. Keller, Duncan J. Maitland, Macromolecular Chemistry and Physics 2014, 215 (24),
2420-2429. Copyright (2014) John Wiley and Sons.

15
Current endovascular treatments, such as Guglielmi Detachable Coils, are effective
though they have limitations that result in aneurysm rupture and recanalization. 65, 66
We
aim to develop a shape-memory polymer foam embolic device that would be deliverable
via catheter to the aneurysm space and would provide better occlusion and healing than
the current treatments. We selected a polyurethane chemistry approach to SMP foam
generation, as urethanes are well-known for their biocompatibility, versatility, and
tunable mechanical properties. 36, 67-71
Previously, our group has developed aliphatic
shape-memory polyurethane foams for use in embolic devices; however, a prominent
issue with these systems has been the depression of the glass transition temperature (Tg)
in aqueous environments. 57
Water molecules serve as plasticizing agents, enabling
mobility of the polymer chains at reduced temperature. It has been shown that the effect
in urethanes is due to interference of water with inter-chain hydrogen bonding. 57, 72-74
This causes a significant decrease in the Tg, which results in premature foam actuation
and a reduction in working time for the device. 75
In order to deliver the foam from the
catheter to the aneurysm the foam must maintain its secondary, programmed shape for a
considerable length of time to ensure ease/completion of delivery. However, water
plasticization may cause the foams to actuate too quickly in the catheter, presenting a
hurdle in foam-over-wire delivery. Singhal et al. synthesized SMP foams using various
combinations of hexamethylene diisocyanate (HDI), trimethyl hexamethylene
diisocyanate (TMHDI), hydroxypropylethylenediamine (HPED) and triethanolamine
(TEA) to achieve a similar goal of increasing working time of the embolic device;
16
however, those efforts attained ca. ten minutes of working time before the SMP foam
began to actuate. 57
The goal our research in this study was to elongate the working time beyond ten
minutes by further increasing the hydrophobicity and glass transition, hence the
actuation rate of the SMP foams, by incorporating isophorone diisocyanate (IPDI) into
the foam chemistry. In this paper we develop ultra-low density SMP foams and
determine their chemical and mechanical properties, as well as, study their actuation
times in an aqueous environment (range: 4 min. to > 20 min.).
2.2 Materials and methods
2.2.1 Synthesis and post-processing
N,N,N’,N’-Tetrakis(2-hydroxypropyl)ethylenediamine (HPED, 99%; Sigma-
Aldrich Inc.), triethanolamine (TEA, 98%; Sigma-Aldrich Inc.), trimethyl-1,6-
hexamethylene diisocyanate, 2,2,4- and 2,4,4- mixture (TMHDI, TCI America Inc.),
isophorone diisocyante (IPDI, 98%; Sigma-Aldrich Inc.), DC 198 (Air Products and
Chemicals, Inc.), DC 5943 (Air Products and Chemicals, Inc.), T-131 (Air Products and
Chemicals, Inc.), BL-22 (Air Products and Chemicals, Inc), Enovate 245fa Blowing
Agent (Honeywell International, Inc.) and deionized (DI) water ( > 17 M Ω cm purity;
Millipore water purifier system; Millipore Inc.), Phosphate Buffered Saline (1X)
(0.0067M PO4) (HyClone Laboratories, Inc) were used as received.
SMP foam was synthesized using the three-step protocol mentioned in previous
work. 56, 57
First, an isocyanate (NCO) prepolymer was synthesized with appropriate
molar ratios of HPED, TEA, TMHDI, and IPDI. These prepolymers were allowed to

17
react for 2 days with a temperature ramp from room temperature to 50°C and back to
room temperature. Next, a hydroxyl (OH) mixture was blended with the remaining
molar equivalants of HPED and TEA. This mixture also contained DI water, and
catalysts. Finally, the NCO prepolymer and the OH mixture were combined in the foam
cup along with surfactants, DC 198 and DC 5943, and Enovate. This mixture was
allowed to mix in a FlackTek speedmixer (FlackTek, Inc., Landrum, SC) and poured in
the foam bucket. The foam was allowed to cure at 90°C for 20 minutes before being
allowed to cool down to room temperature for further processing. Table 2.1 shows the
weight percent of each component used for foam synthesis and Figure 2.1 shows the
corresponding molecular structure of each monomer.
Post-processing for the foam consisted of mechanically crimping the foams by
heating them to 90°C and compressing them using the Carver Press (Carver, Inc.,
Wabash, IN). Once cooled, the foams were acid etched using 0.1N HCl for 2 hours,
under sonication. After this step, the foams were sonicated in isopropyl alcohol (IPA) for
two 15 minute cycles. The foams were then washed with a 20:80 Contrad:Reverse
Osmosis (RO) water solution for four 15 minute cycles. Finally, the Contrad solution
was rinsed out of the foams and they were sonicated in RO water for two 15 minute
cycles. The foams were allowed to dry overnight at 50°C under vacuum before
characterization.

18
Table 2.1: Composition of foams using trimethylhexamethylene diisocyanate (TMHDI) and isophorone diisocyanate
(IPDI) for the isocyanate component of the urethane foam. Three foam batches were synthesized and the average
weight percent was determined for all batches.
Sample
TMHDI
[wt%]
IPDI
[wt%]
HPED
[wt%]
TEA
[wt%]
Water
[wt%]
T-131
[wt%]
BL-22
[wt%]
DC 198
[wt%]
DC 5943
[wt%]
Enovate
[pph]
0% IPDI
66.78
± 0.5
0
17.10
± 0.03
5.74
± 0.02
2.35
± 0.01
0.26
± 0.001
0.64
± 0.005
2.54
± 0.02
4.59
± 0.02
14.89
± 0.01
5% IPDI
63.62
± 1
3.54
± 0.5
17.08
± 0.2
5.33
± 1
2.39
± 0.100
0.26
± 0.01
0.64
± 0.05
2.55
± 0.01
4.59
± 0.02
14.91
± 0.2
10% IPDI
59.82
± 0.05
7.04
± 0.01
17.03
± 0.01
5.72
± 0.01
2.34
± 0.01
0.26
± 0.001
0.64
± 0.001
2.56
± 0.01
4.59
± 0.02
14.95
± 0.02
15% IPDI
56.37
± 0.05
10.52
± 0.01
17.01
± 0.02
5.71
± 0.02
2.34
± 0.01
0.26
± 0.002
0.64
± 0.005
2.54
± 0.05
4.60
± 0.01
14.98
± 0.03
20% IPDI
53.74
± 0.01
14.20
± 0.01
16.23
± 0.01
5.45
± 0.01
2.34
± 0.02
0.26
± 0.002
0.64
± 0.005
2.57
± 0.01
4.58
± 0.01
15.06
± 0.03
19
Figure 2.1: Molecular structures of the hydroxyl and isocyanate monomers used
during foam synthesis.
Neat polymer samples were cast with measured amounts of HPED, TEA,
TMHDI, and IPDI in rectangular aluminum molds. These were non-porous polymers
that did not utilize any catalysts, surfactants, or blowing agents during synthesis. The
solution was mixed for 1 minute using the speedmixer and poured into the molds, which
were sealed with a Teflon stopper. The neat polymer containing molds were placed in a
pressurized environment of 60 PSI for 3 hours. Next, the samples were cured in an oven
with the temperature ramped to 120°C at 20°C h-1
. The polymers were held at 120°C for
2 hours after which they were allowed to cool to room temperature. Table 2.2 shows the
weight percent of each monomer used for non-porous polymer synthesis.
20
Table 2.2: Composition of neat polymers following the same schematic synthesis as
that of the foams (Table 1). No foaming additives such as surfactants, catalysts,
physical, or chemical blowing agents were added.
Sample
TMHDI
[wt%]
IPDI
[wt%]
HPED
[wt%]
TEA
[wt%]
0% IPDI 61.66 0 28.71 9.63
5% IPDI 58.47 3.25 28.67 9.61
10% IPDI 55.28 6.50 28.62 9.60
15% IPDI 52.12 9.75 28.55 9.57
20% IPDI 48.96 12.97 28.51 9.56
2.2.2 Chemical and mechanical characterization
2.2.2.1 Density and cell structure
Foam cubes were cut using a resistive wire cutter from top, middle, and bottom
of the foam as required by at ASTM standard D-3574. Length, width, and height of the
cube was measured, mass of the sample was recorded, and density was calculated in
g·cm-3
. Cell structure was determined by cutting thin slices of the bulk foam in the axial
and transverse direction. The samples were mounted onto a stage and sputter coated for
60 seconds at 20 mA with gold using Cressington Sputter Coater (Ted Pella, Inc.,
Redding, CA). The samples were then visualized using Joel NeoScope JCM-5000
Scanning Electron Microscope (SEM) (Nikon Instruments, Inc., Melville, NY) at 15x
magnification under high vacuum and 5-10 kV current.
21
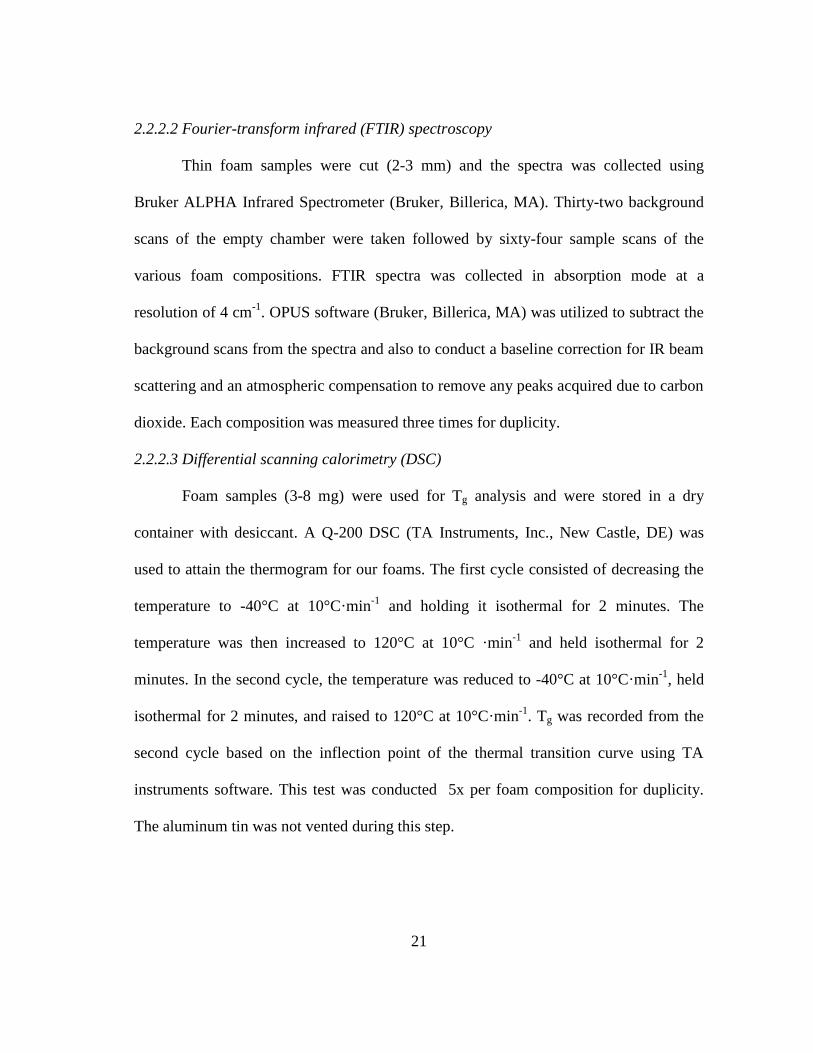
2.2.2.2 Fourier-transform infrared (FTIR) spectroscopy
Thin foam samples were cut (2-3 mm) and the spectra was collected using
Bruker ALPHA Infrared Spectrometer (Bruker, Billerica, MA). Thirty-two background
scans of the empty chamber were taken followed by sixty-four sample scans of the
various foam compositions. FTIR spectra was collected in absorption mode at a
resolution of 4 cm-1
. OPUS software (Bruker, Billerica, MA) was utilized to subtract the
background scans from the spectra and also to conduct a baseline correction for IR beam
scattering and an atmospheric compensation to remove any peaks acquired due to carbon
dioxide. Each composition was measured three times for duplicity.
2.2.2.3 Differential scanning calorimetry (DSC)
Foam samples (3-8 mg) were used for Tg analysis and were stored in a dry
container with desiccant. A Q-200 DSC (TA Instruments, Inc., New Castle, DE) was
used to attain the thermogram for our foams. The first cycle consisted of decreasing the
temperature to -40°C at 10°C·min-1
and holding it isothermal for 2 minutes. The
temperature was then increased to 120°C at 10°C ·min-1
and held isothermal for 2
minutes. In the second cycle, the temperature was reduced to -40°C at 10°C·min-1
, held
isothermal for 2 minutes, and raised to 120°C at 10°C·min-1
. Tg was recorded from the
second cycle based on the inflection point of the thermal transition curve using TA
instruments software. This test was conducted 5x per foam composition for duplicity.
The aluminum tin was not vented during this step.

22
2.2.2.4 Dynamic mechanical thermal analysis (DMA)
DMA of the foam compositions were conducted to determine changes in Tg as a
function of storage modulus. Dynamic temperature sweeps, ranging from 25°C to
150°C, were conducted on the dry foam compositions using Triton Technology (TT)
DMA (Mettler Toledo International, Inc., Columbus, OH). The frequency was set to 1
Hz, dynamic force to 0.1N, and the ramp rate to 1°C·min-1
. Cylindrical foam samples
with diameters of 6 mm and a heights of 5 mm were used. Data points were collected
every 20 seconds. Dynamic shear storage modulus (E’), dynamic shear loss modulus
(E”), and tan δ (E”/ E’) was recorded using the Titron Laboratory software (Mettler
Toledo International, Inc., Columbus, OH). The peak of the tan δ curve and the
inflection point of E’ indicated Tg for the dry foam samples.
2.2.3 Characterization of hydrophobicity and foam actuation
2.2.3.1 Contact angle
Hydrostatic contact angle measurements on neat polymer samples were done
using KSV CAM-2008 Contact Angle Analyzer (KSV Instruments, Ltd., Helsinki,
Finland). A 5 μL drop of DI water was placed on the sample surface. The drop was
allowed to reach equilibrium for 60 seconds and the contact angle was measured using
an Attension Tensometer and the Attension Theta software package (Biolin Scientific,
Stockholm, Sweden). Contact angles were collected (n = 3) and the average was
presented as the water contact angle for each neat polymer composition.

23
2.2.3.2 Phase transition rates in water
Foam samples (3-8 mg) were submerged in RO water at 50°C for 5 minutes to
allow full plasticization. After the samples were removed from water, they were pressed
dry with Kim Wipes (Kimberly-Clark Professionals, Roswell, GA), weighed, and placed
in an aluminum pan sealed with an aluminum lid that was vented. Q-200 DSC was used
to cool the samples to -40°C, hold them isothermal for 2 minutes, and heat them to 80°C
at 10°C·min-1
. TA instruments software was used to generate the thermogram and
acquire the Tg, after water plasticization, using the average inflection point of the
thermal transition of multiple measurements (n = 5).
2.2.3.3 Immersion DMA
Cylindrical foam samples with a diameter of 6 mm and a height of 5 mm were
used in this procedure. The samples were crimped using the Carver Press to a height of
0.8 mm. TT DMA was used to collect the kinetic thermogram of various foam
compositions at 37°C and 50°C. For each temperature, the samples were submerged in a
PBS bath, to mimic physiological osmolarity (pH = 7), and changes in storage modulus
(E’) were recorded using the TT DMA software. The frequency was set to 1.0 Hz,
dynamic force to 0.1N, and each run was carried out for 20 minutes. This test was
conducted in triplicate per foam composition. The inflection point between E’onset and
E’end corresponded to the actuation time for the sample.
2.2.3.4 Volume recovery and expansion
Cylindrical foam samples with a diameter of 6 mm and a height of 1 cm were
cut. A 203.20 μm diameter nickel-titanium (Nitinol) wire (NDC, Fremont, CA) was

24
inserted through the center of the sample along its length to serve as a stabilizer. The
foam samples were radially compressed to their smallest possible diameter using ST
150-42 stent crimper (Machine Solutions, Flagstaff, AZ) by heating the material to
100°C, holding it isothermal for 15 minutes, and programming the foams to the crimped
morphology. Initial foam diameter was measured and recorded for each sample using
Image J software (NIH, Bethesda, MD). The foams were placed in a water bath at 50°C,
removed after 20 minutes, and allowed to cool to room temperature. The final diameter
of the samples was measured and recorded using Image J software. Volume expansion
was calculated using Equation 2.1 and volume recovery was calculated using Equation
2.2.
(𝑉𝑜𝑙𝑢𝑚𝑒 𝑒𝑥𝑝𝑎𝑛𝑠𝑖𝑜𝑛 = (Recovered diameter
Compressed diameter)
2
) (2.1)
(𝑉𝑜𝑙𝑢𝑚𝑒 𝑟𝑒𝑐𝑜𝑣𝑒𝑟𝑦 = (Recovered diamater
Original diameter)
2
∗ 100%) (2.2)
2.3 Results and discussion
2.3.1 Chemical and mechanical characterization
2.3.1.1 Density and cell structure
The measured foam densities are provided in Table 2.3. Multiple foam batches
maintained ultra-low densities which were consistently ca. 12.5 mg·cm-3
. With batch-to-
batch standard deviations ranging from 0.1 to 0.3 mg·cm-3
, our method allows for
reproducible synthesis of uniform-celled SMP foams.
Analysis of the foam morphology with SEM revealed homogenous cells
throughout different compositions, as depicted by Figure 2.2. It was evident that each

25
foam composition consists of both open and closed-cell pores and mixed open and
closed-cell pores. This would effectively provide initial reticulation of the foam and aid
the removal of surfactants and catalysts during the cleaning process. Furthermore the
uniform cross-linked foam network suggests good shape memory behavior as explained
by Singhal et al. 56, 57
Table 2.3: Summary of key physical properties of various foam compositions.
2.3.1.2 FTIR
Selected FTIR spectral regions for the various foam compositions are presented
in Figure 2.3. The hydrogen-bonded urethane C=O stretch (1698 cm-1
) confirms a
polyurethane system, (Figure 2.4a). 76, 77
A small amount of hydrogen-bonded urea can
be observed on the urethane C=O shoulder (1647 cm-1
) due to the reaction of isocyanates
with water during the foaming step (Figure 2.4a). 76
The amine a broad stretch (centered
at 3330 cm-1
) represents a combination of secondary and tertiary amine and is readily
Composition Density (g·cm-3
) Dry Tg (°C) T'onset (°C) T'1/2 (°C) Tan δmax (°C)
0% IPDI 0.0122 ± 0.0002 62 ± 1 55 ± 2 70 ± 2 105 ± 2
5% IPDI 0.0119 ± 0.0002 64 ± 0.5 61 ± 1 78 ± 2 111 ± 1
10% IPDI 0.0129 ± 0.0005 65 ± 0.5 65 ± 2 81 ± 3 118 ± 2
15% IPDI 0.0132 ± 0.0001 67 ± 0.2 71 ± 1 88 ± 2 125 ± 2
20% IPDI 0.0122 ± 0.0001 71 ± 2 76 ± 0.5 92 ± 2 131 ± 1

26
observed in all systems (Figure 2.4b). 77
The C-H peaks around 1465 cm-1
indicate a
strong presence of methyl groups contributed from TMHDI and IPDI in each foam
composition (Figure 2.3). 57
Lastly, the C-N peak (1307 cm-1
) is indicative of both IPDI
and TMHDI incorporation into the matrix (Figure 2.4c). The C-N stretch (normally 1020
to 1250 cm-1
) is shifted to higher wavenumbers near-by methyl constituencies
contributing to higher energy requirements for excitation. There is an initial C-N
shoulder observed for 0 IPDI, however and increase in the peak intensity with additional
IPDI incorporation implies slightly higher reaction efficiency than TMHDI in these
formulations.
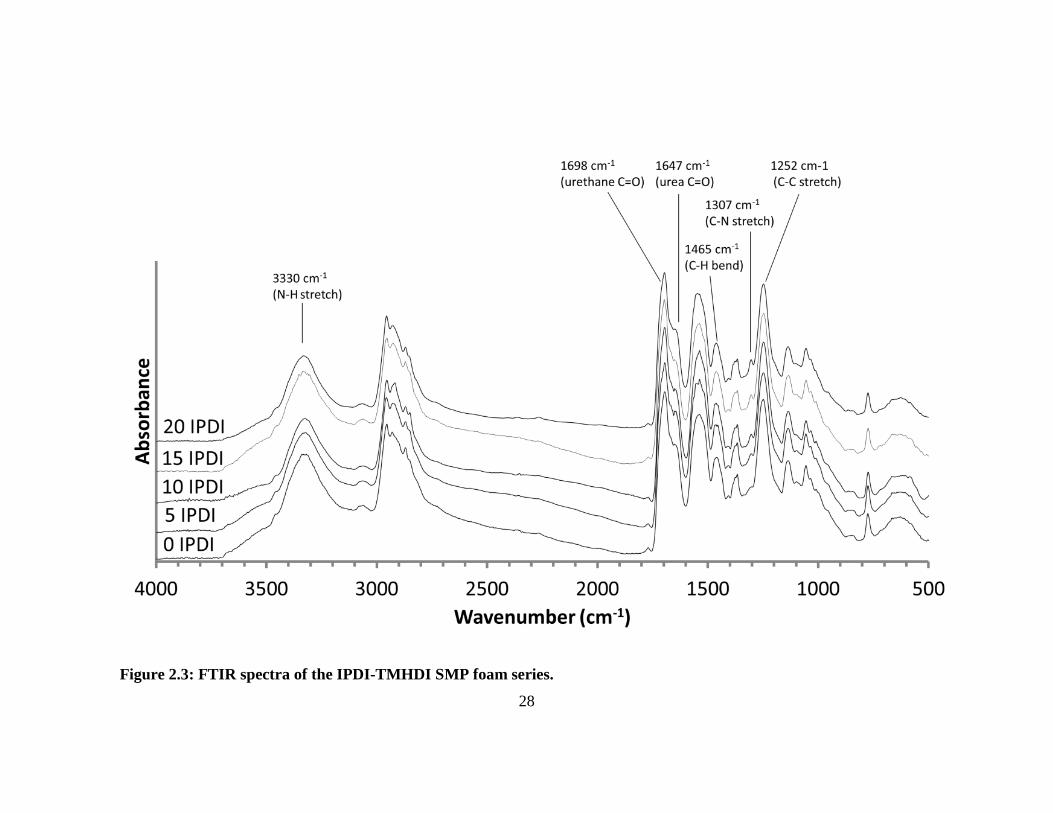
2.3.1.3 DSC
Thermal analysis of the foams shows an increase in Tg with higher IPDI content
(Table 2.3 and Figure 2.5). The shift in Tg is significant from 62°C for the 100%
TMHDI control to 71 °C for 20% IPDI, which has the highest concentration of IPDI in
the series. The increase in Tg is due to the increase in foam stiffenss provided by the
ring moiety of IPDI. Figure 2.5 shows the shift in Tg with increasing IPDI content. This
indicates that the matrix is more constrained with additional IPDI content, delaying
thermal actuation temperatures (e.g. Tg), which is reasonable given the sterics of the
IPDI ring in comparison to semi-linear TMHDI. 78, 79

27
Figure 2.2: SEM images of various foam compositions at 15x magnification. Images
0, 5, 10, 15, and 20 represent 0% IPDI, 5% IPDI, 10% IPDI, 15% IPDI, and 20%
IPDI, respectively.
28
Figure 2.3: FTIR spectra of the IPDI-TMHDI SMP foam series.

29
Figure 2.4: FTIR absorbance spectra for (a) hydrogen-bonded urethane and urea.
(b) secondary and tertiary amines in SMP systems and (c) C-N groups contributed
from IPDI and TMHDI.
30
Figure 2.5: DSC thermogram of the IPDI-TMHDI SMP foam series (primary axis)
and heat flow derivative (secondary axis). Glass transition temperature increases
with increasing IPDI content.
2.3.1.4 DMA
Thermal analysis of the foams using DMA provided relationships between glass
transition temperatures as IPDI content that are comparable to the DSC findings (Figure
2.6). Maximum softening rate temperatures (E’1/2) increased from 70°C to 91°C when
transitioning from 0% IPDI to 20% IPDI. A transition from 105°C to 130°C for tan δmax
was similarly observed with increased IPDI content, Table 2.3.

31
Figure 2.6: Storage modulus (E’) and tan δ curves of the IPDI-TMHDI SMP foam
series.
2.3.2 Characterization of hydrophobicity and foam actuation
2.3.2.1 Contact angle
Hydrostatic contact angles of the neat/non-porous polymer networks (Table 2.4)
make evident that hydrophobicity (e.g. contact angle) is increasing with IPDI content. 80,
81 Ultimately the increase in contact angle (76° 98°) with increased IPDI content
indicates that the constrained, ring containing moiety is significantly reducing the rate
of water intercalation into the matrix and is an appropriate formulation component for
tuning kinetics from solvent plasticization.

32
2.3.2.2 Phase transition rates in water
For all of the SMP formulations investigated, actuation can be induced by
conventional thermal means (heat to Tg) or at lower temperatures with moisture based
plasticization. 57
Wet Tg’s (from DSC) are provided in Table 2.4. For our entire array of
foam compositions there is a significant decrease in Tg after exposure to RO water when
compared to dry foams. For example, there is a drop in Tg from 62°C to 30°C for the
control (0% IPDI) upon introduction to water. For the remaining foams containing IPDI,
there is a trend of higher transition temperature as we increase the IPDI content, even
after exposure to water. This displays that the hydrophobicity and increased steric
restrictions to movement introduced with IPDI incorporation can successfully allow for
application-tailored glass transition temperatures in the range of 30-57°C.
33
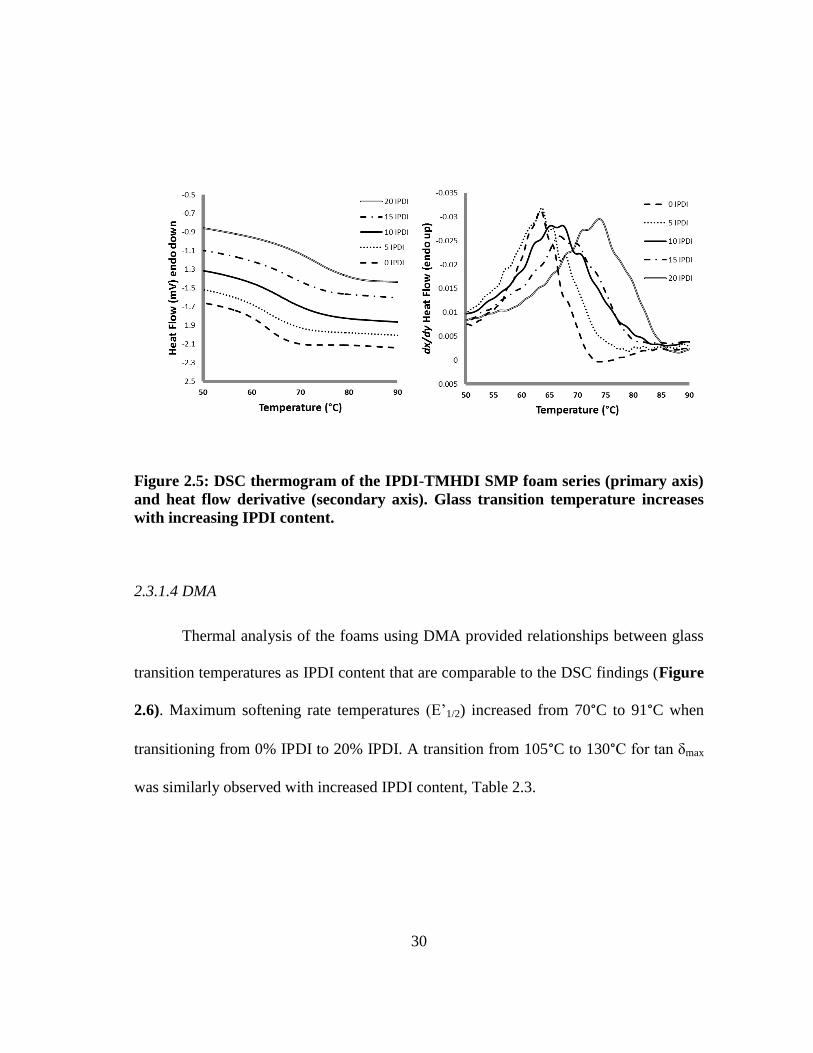
Table 2.4: Summary of the foam properties related to actuation and working time.
Composition
Dry Tg
(°C)a
Wet Tg
(°C)
Contact
angle (°)
Volume Expansion
(x)
Volume Recovery
(%)
Working time at
37°C (sec)b
Working time at
50°C (sec)b
0% IPDI 62 ± 1
30 ± 1 76 ± 1 66 ± 8 148 ± 25 246 ± 33 54 ± 20
5% IPDI 64 ± 0.5
33 ± 1 80 ± 1 57 ± 9 105 ± 9 333 ± 59 58 ± 9
10% IPDI 65 ± 0.5
39 ± 3 84 ± 0.3 46 ± 8 88 ± 7 > 1200 81 ± 25
15% IPDI 67 ± 0.2
53 ± 1 94 ± 1 46 ± 8 87 ± 5 > 1200 135 ± 23
20% IPDI 71 ± 2
57 ± 0.5 98 ± 0.3 39 ± 8 83 ± 23 > 1200 135 ± 22
a Tg dry reproduced from Table 2.3 for comparative purposes.
b Working time defined as the time when the foam is exposed to an aqueous environment the catheter to the time when it is no longer
retractable.

34
2.3.2.3 Immersion DMA
The working times derived from immersion DMA are shown in Table 2.4. The
range of working times are 5 minutes, for 0 IPDI, to no actuation in 37°C PBS as IPDI
concentrations are increased in the SMP foams (Figure 2.7). The decay in storage
modulus was the indicator for actuation and for foam compositions above 5 IPDI, there
was no decay in E’ during the 20 minute kinetic run. This displays that at body
temperature the higher 10 IPDI, 15 IPDI and 20 IPDI foams will yield a working time
greater than 20 minutes, though analysis at 50°C indicates rapid actuation for all systems
Overall, the foams with higher IPDI content yielded a longer working time due to
delayed actuation, though all systems are readily actuated in 50°C water.
2.3.2.4 Volume recovery and expansion
The volume recovery of the foams can be readily observed in Figure 2.8. The
control samples of 0 IPDI experienced ca. 66-fold volume expansion upon submersion
in 70°C RO water and higher IPDI compositions had volume expansions below 50-fold,
Table 2.4. These results indicate that a degree of constraint exists with increased IPDI
content, both in terms of ultimate compression above Tg and recovery, which is
reasonable given the mechanical and hydrophobicity trends in our systems. Despite a
decreased volume expansion, all foam samples recovered to 80%+ in water, Table 2.4.
In terms of application, we envision these systems as application-tunable materials
where one may select from 5% to 15% content based on working time needs. Also a
fortuitous finding in terms of application, all systems have actuation times ca. 1-2 min.
at 50°C; this means that, should a surgical application require rapid foam expansion after

35
placement/working time considerations are met, a rapid warm water actuation is
possible.
Figure 2.7: Actuation of the SMP foam depicted by a decay in E’ in (a) 37°C and
(b) 50°C PBS bath.

36
Figure 2.8: Volume expansion images for 0 IPDI, 10 IPDI, and 20 IPDI
respectively. As IPDI content increases in the foams, the shape recovery to full
expansion decreases.
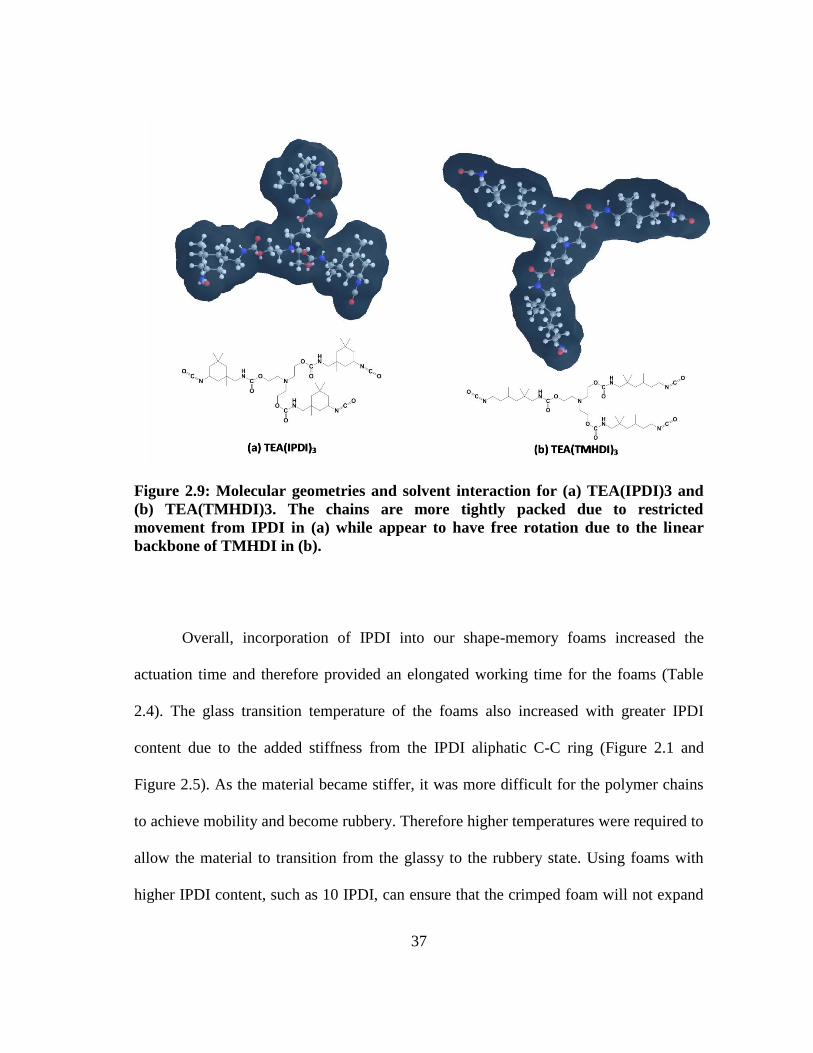
An ad hoc assessment of surface availability was made using ChemDraw 13 for
MM2 energy minimized 3D renderings of the space filling models of various monomer
couplings. Given the differences observed in thermal, mechanical, kinetic and recovery
response of these systems despite the similar empirical formulas of the system
precursors, it is reasonable to have an ad hoc discussion of TMHDI and IPDI availability
to when linked to TEA. Energy minimized structures of TEA bound to TMHDI versus
IPDI revealed significantly different solvent availability (Figure 2.9). Image 2.9a
displays a urethane structure composed of TEA and IPDI that has a lower availability to
the ternary amine and the urethane linkages (e.g. the non-aliphatic, polar regions of the
structure) than that of the TEA and TMHDI structure (Figure 2.9b). In brief, the
constrained nature of the IPDI cyclohexyl moiety does not allow the free rotation of the
bonds along a methylene backbone (as in TMHDI) and enforce limited expansion, even
with some water association at the polar regions.
37
Figure 2.9: Molecular geometries and solvent interaction for (a) TEA(IPDI)3 and
(b) TEA(TMHDI)3. The chains are more tightly packed due to restricted
movement from IPDI in (a) while appear to have free rotation due to the linear
backbone of TMHDI in (b).
Overall, incorporation of IPDI into our shape-memory foams increased the
actuation time and therefore provided an elongated working time for the foams (Table
2.4). The glass transition temperature of the foams also increased with greater IPDI
content due to the added stiffness from the IPDI aliphatic C-C ring (Figure 2.1 and
Figure 2.5). As the material became stiffer, it was more difficult for the polymer chains
to achieve mobility and become rubbery. Therefore higher temperatures were required to
allow the material to transition from the glassy to the rubbery state. Using foams with
higher IPDI content, such as 10 IPDI, can ensure that the crimped foam will not expand

38
immediately at physiological temperature while being delivered through the catheter.
However, passive actuation will eventually occur once the foam has been deployed in
the aneurysm (Figure 2.7). One tradeoff to consider is the percent volume recovery for
the foam. Clearly, 10 IPDI only yields 46% volume recovery at 70°C, which indicates
that the foam will passively actuate even slower at physiological temperature as shown
in Table 2.4. However, upon reaching full actuation, the volume expansion of 88% will
ensure full occlusion of the aneurysm space (Figure 2.8). Additionally, the
computational solvent interaction images (Figure 2.9) suggest poor solvent interaction
for urethanes synthesized with IPDI compared to TMHDI which supports decreased
volume recovery of the foams in water. Nevertheless, the higher working time will be
beneficial during foam delivery and the shape filling properties of the foam will be
advantageous to promote occlusion and block blood flow to the aneurysm.
2.4 Conclusions
We have successfully synthesized shape-memory polymer foams with slower
actuation times by incorporating isophorone diisocyanate (IPDI) into the foam matrix.
The foams containing 10% IPDI remain crimped during the twenty minute test interval
at physiological temperature, thus providing sufficient working time for the foam to be
delivered to the aneurysm site without premature actuation in the catheter. Additionally,
these systems showed rapid actuation (1-2 min.) under warmed water conditions that
may serve as a potential for rapid actuation as surgical conditions require. Higher IPDI
content for the foams also resulted in an increased glass transition temperature and foam
hydrophobicity which helps elongate the working time and delay water plasticization of
39
the material. One drawback of delayed actuation was the decrease in volume recovery of
the foam; however, all systems displayed total volume expansion to 80%+ of the pre-
crimped state. We discuss these effects in terms of the molecular effects of IPDI
incorporation, such as poor solvent interaction, decreased subunit mobility and the
resultant mechanical, thermal and hydrophilic response.

40
CHAPTER III
INCORPORATING TUNGSTEN NANOPARTICLES TO INDUCE
RADIOPACITY
3.1 Introduction
Polymers have been utilized as medical implants for the last 30 years with much
success. 48, 82
Some natural and synthetic polymers are known to be biocompatible,
indicating their ability to perform with appropriate host response for biomedical
applications. 82
These biocompatible polymers, commonly referred to as polymeric
biomaterials, are known to have a wide range of applications due to their wide
availability, ease of manufacturing, and tunable mechanical and thermal properties. 82, 83
Some of the most common biomaterials include polyethylene (PE), polyurethane (PU),
polytetrafluoroethylene (PTFE), polymethylmethacrylate (PMMA), poly(lactic acid)
(PLA), and poly(glycolic acid) (PGA). 82, 83
, which currently have found uses as
biodegradable sutures and fixation screws. While these materials can be fabricated into
complex shapes and are available in a wide range of compositions, most tend to have
low tensile strength and Young’s modulus for applications that require mechanical
robustness, such as orthopedic implants. 82
Additionally, polymers have similar
properties to that of soft tissue, limiting their radiological detectability. 82, 84
Most
polymeric materials lack radiopacity because their elements possess low electron density
Reprinted with permission from “Tungsten-loaded SMP foam nanocomposites with inherent radiopacity
and tunable thermo-mechanical properties,” by Sayyeda M. Hasan, Garrett Harmon, Fang Zhou, Jeffery E.
Raymond, Tiffany P. Gustafson, Thomas S. Wilson, Duncan J. Maitland, Polymers for Advanced
Technologies 2015. Copyright (2015) John Wiley and Sons.

41
and low specific gravity. 48, 85, 86
Several steps have been taken to improve radiopacity of
polymers by incorporating heavy-metal fillers as physical mixtures, attaching heavy-
metal salts to the polymer backbone via chelation, and by covalently binding radiopaque
elements to monomers prior to their polymerization. 48, 85
Radiopaque polymeric blends consisted of heavy metal fillers physically mixed
into the polymer matrix thus imparting radiopacity to the whole system due to the high
Z-element nature of the filler. 85
Most commonly used fillers for this technique include
iodine, barium, bismuth, zircon, and tantalum. 48, 86-90
While successful radiopacity was
achieved, the composites generally suffered from reduced mechanical properties due to
heterogeneous dispersion of the radiopaque filler from phase separation of metal fillers
from resins. 48
This resulted in aggregate formation that ultimately caused crack
formation and propagation in the polymer matrix leading to leakage of the radiopaque
filler. 85
Chithambara et al. synthesized radiopaque microspheres by dispersing tantalum
within a polymer matrix synthesized using toluene diisocyanate and poly(tetramethylene
glycol). 87
Their findings proved the microspheres to be radiopaque with potential as
radiopaque embolization agents. 87
However, higher filler loadings resulted in greater
aggregates within the polymer, inducing particle size variability. 87
Barium has also been used to impart radiopaque properties for a variety of
medical devices, including denture materials. 91-93
In one study, barium fluoride (BaF2),
at 30 wt %, was used to develop denture material due to its satisfactory radiopacity and
minimal discoloration of the material overall. 91
However, BaF2 leaching occurred within
42
seven days causing the filler to infiltrate the surrounding tissue. This induced toxicity
and altered the mechanical properties of the material. 91
Radiopaque polymer salt complexes were developed to improve homogeneity
and reduce gradual filler leaching. 85, 94
A heavy metal salt was complexed to an
appropriate polymer ligand via chelation resulting in a homogenous system with
polymeric and ionic character. 48
The polymers used for this technique were ionic,
meaning they had a charged polar section to bind to cations and a non-polar section
which would allow solubilization in non-polar media. 85
Polymer salt complexes were
advantageous because they result in limited heavy metal release and constant radiopacity
due to entrapment of the salt in a complex network. 94
However, the binding of the salt to
the polymer ligand was a result of non-covalent interactions which could easily be
disrupted in acidic aqueous conditions, similar to some physiological conditions. 85
Additionally, the halogenated functional groups in these systems may degrade via
hydrolysis and result in potentially toxic leachables. 85
Radiopaque polymerized monomers were also used to impart radiopacity to
polymers by synthesizing radiopaque monomers that could covalently be incorporated
into the polymer backbone. 86, 95, 96
This technique resulted in homogenous, non-
leachable materials that retained similar mechanical properties to that of the non-
radiopaque parent polymer. 48, 85
However, a major disadvantage of utilizing these
systems is the high production cost, which may not be practical for all medical
applications. 85
43
In this work, the authors developed radiopaque composite materials using shape
memory polymers (SMPs) for their use as biomedical implants. Thermally actuated
shape memory polymers are a special class of materials that are capable of switching
between a primary and a secondary shape upon a heat stimulus. 4, 5, 43, 47, 97
These
versatile materials are used for a wide range of applications such as biomaterials,
textiles, and automotive. 1, 6
Hasan et al. developed aliphatic polyurethane/urea SMP
foams for embolic occlusion applications due to their ability to retain a programmed
shape and passively actuate inside the body over a given time. 98
Previously synthesized
SMP foams have proven to rapidly occlude aortic aneurysms and the resulting clot is
stable up to 90 days. 38, 46
These SMP foams can further be utilized for a neurovascular
occlusion device due to their ultra-low density, which allows for the material to be
crimped to a small geometry and delivered to the aneurysm via catheter. 46
X-ray visualization of the device, however, is a challenge, because the
polyurethane SMP material has a density similar to soft tissue and cannot be observed
during x-ray fluoroscopy. 38
Therefore delivery of the foam to the aneurysm in a safe and
reliable manner is a significant challenge, as guidance by x-ray contrast cannot be used.
The purpose of this work was to introduce radiopacity to the foam using heavy metal
nanoparticles, which can be incorporated into the polymer using physical mixing.
Tungsten has been used as a radiopaque agent previously for embolic coils with much
success. 38, 99-102
Kampmann et al. studied tungsten biocompatibility in human subjects
showing minimal inflammatory response invoked by the radiopaque coils. 99
Additionally, Peuster et al. evaluated in vitro cytotoxic effects of tungsten on various

44
human cells. Their studies concluded that while tungsten may be elevated in the blood
serum, there were no cytotoxic effects on the local tissue. 100
Based on the established biocompatibility of tungsten, Rodriguez et al.
synthesized SMP foams for embolic applications with tungsten microparticles to induce
x-ray visualization and achieved sufficient opacity with foam geometries up to 6 mm
diameter cylinders. 38
While the SMP microcomposites were visible under x-ray
fluoroscopy, radiopacity was highly dependent on the diameter of the foam cylinders.
Larger diameter cylinders would limit the accessibility of the embolic devices to
peripheral blood vessels only therefore small geometry radiopaque materials need to be
developed for neurovascular applications. Additionally, high filler loading disrupted
foam synthesis. Previously, 4% by volume was the maximum tungsten loading that
could be achieved with microparticles which would also require the use of large
geometry foam cylinders for visualization. This study aims to increase filler loading by
using nanoparticles, allowing for improved particle dispersion resulting in visualization
of smaller geometry materials for neurovascular devices that require radiopacity through
soft and hard tissue. The materials developed by Hasan et al. had optimal actuation
profiles of 5 to 10 minutes for device delivery and served as the core chemistry for this
research.
3.2 Materials and methods
N,N,N’,N’-Tetrakis(2-hydroxypropyl)ethylenediamine (HPED, 99%; Sigma-
Aldrich Inc., St. Louis, MO), triethanolamine (TEA, 98%; Sigma-Aldrich Inc., St. Louis,
MO), trimethyl-1,6-hexamethylene diisocyanate, 2,2,4- and 2,4,4- mixture (TMHDI,
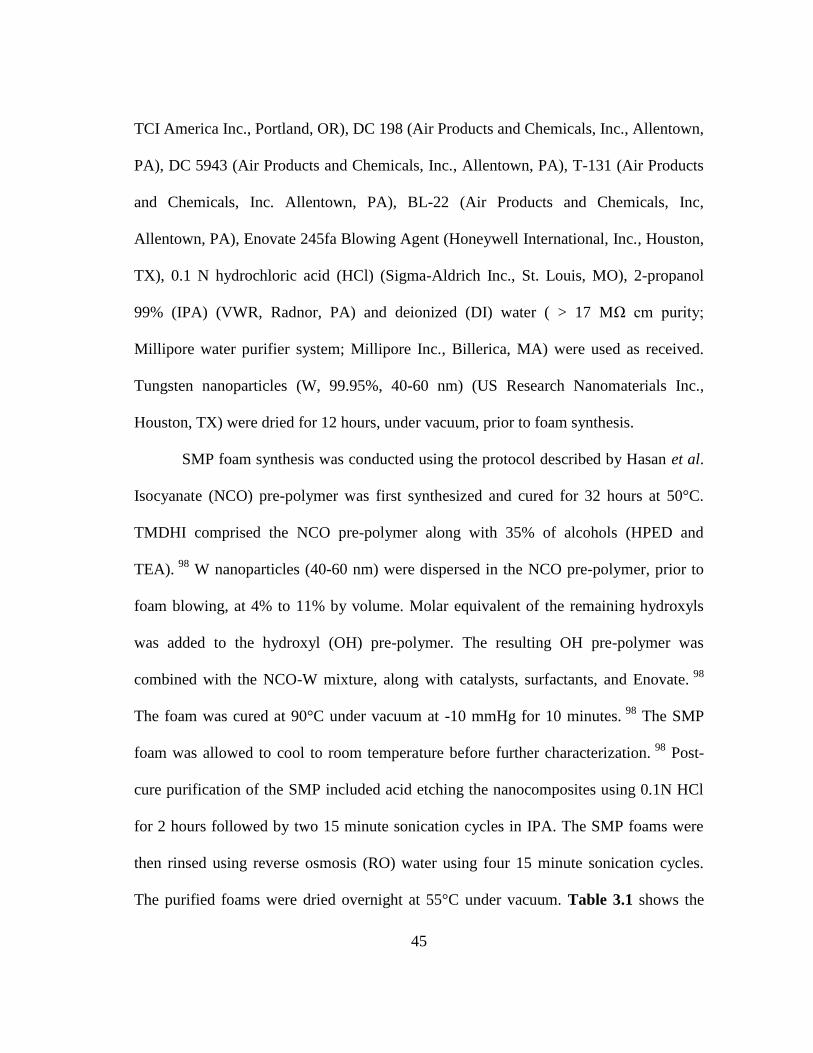
45
TCI America Inc., Portland, OR), DC 198 (Air Products and Chemicals, Inc., Allentown,
PA), DC 5943 (Air Products and Chemicals, Inc., Allentown, PA), T-131 (Air Products
and Chemicals, Inc. Allentown, PA), BL-22 (Air Products and Chemicals, Inc,
Allentown, PA), Enovate 245fa Blowing Agent (Honeywell International, Inc., Houston,
TX), 0.1 N hydrochloric acid (HCl) (Sigma-Aldrich Inc., St. Louis, MO), 2-propanol
99% (IPA) (VWR, Radnor, PA) and deionized (DI) water ( > 17 MΩ cm purity;
Millipore water purifier system; Millipore Inc., Billerica, MA) were used as received.
Tungsten nanoparticles (W, 99.95%, 40-60 nm) (US Research Nanomaterials Inc.,
Houston, TX) were dried for 12 hours, under vacuum, prior to foam synthesis.
SMP foam synthesis was conducted using the protocol described by Hasan et al.
Isocyanate (NCO) pre-polymer was first synthesized and cured for 32 hours at 50°C.
TMDHI comprised the NCO pre-polymer along with 35% of alcohols (HPED and
TEA). 98
W nanoparticles (40-60 nm) were dispersed in the NCO pre-polymer, prior to
foam blowing, at 4% to 11% by volume. Molar equivalent of the remaining hydroxyls
was added to the hydroxyl (OH) pre-polymer. The resulting OH pre-polymer was
combined with the NCO-W mixture, along with catalysts, surfactants, and Enovate. 98
The foam was cured at 90°C under vacuum at -10 mmHg for 10 minutes. 98
The SMP
foam was allowed to cool to room temperature before further characterization. 98
Post-
cure purification of the SMP included acid etching the nanocomposites using 0.1N HCl
for 2 hours followed by two 15 minute sonication cycles in IPA. The SMP foams were
then rinsed using reverse osmosis (RO) water using four 15 minute sonication cycles.
The purified foams were dried overnight at 55°C under vacuum. Table 3.1 shows the

46
weight percent of each component used in foam blowing. 3 foams batches were
synthesized and characterized for duplicity. Foams with 11% W loading were not
reproducible and therefore their thermo-mechanical properties were not characterized.
3.2.1 Density and porosity
Density measurements were conducted on foam blocks acquired from the top,
middle, and bottom section of the foam. Mass of the foam block was recorded and
length, width, and height values were measured three times using a digital caliper.
Porosity was calculated using Equation 3.1. Density of the non-porous neat polymer was
calculated without accounting for foaming agents such as catalysts, surfactants, DI
water, and Enovate.
𝑃𝑜𝑟𝑜𝑠𝑖𝑡𝑦 (%) = (𝜌𝑛𝑒𝑎𝑡− 𝜌𝑓𝑜𝑎𝑚
𝜌𝑛𝑒𝑎𝑡) ∗ 100 (Eq. 3.1)
3.2.2 SEM and pore sizes
Cell structure was determined by cutting thin slices of the bulk foam in the axial
and transverse direction. The samples were mounted onto a stage and sputter coated for
60 seconds at 20 mA with gold using Cressington Sputter Coater (Ted Pella, Inc.,
Redding, CA). The samples were then imaged using Joel NeoScope JCM-5000 Scanning
Electron Microscope (Nikon Instruments, Inc., Melville, NY) at 10-13x magnification
under high vacuum and 5-10 kV current. Pore sizes were calculated by measuring the
cell diameter, using Image J software (NIH, Bethesda, MD), in the axial and transverse
direction for each SEM image.
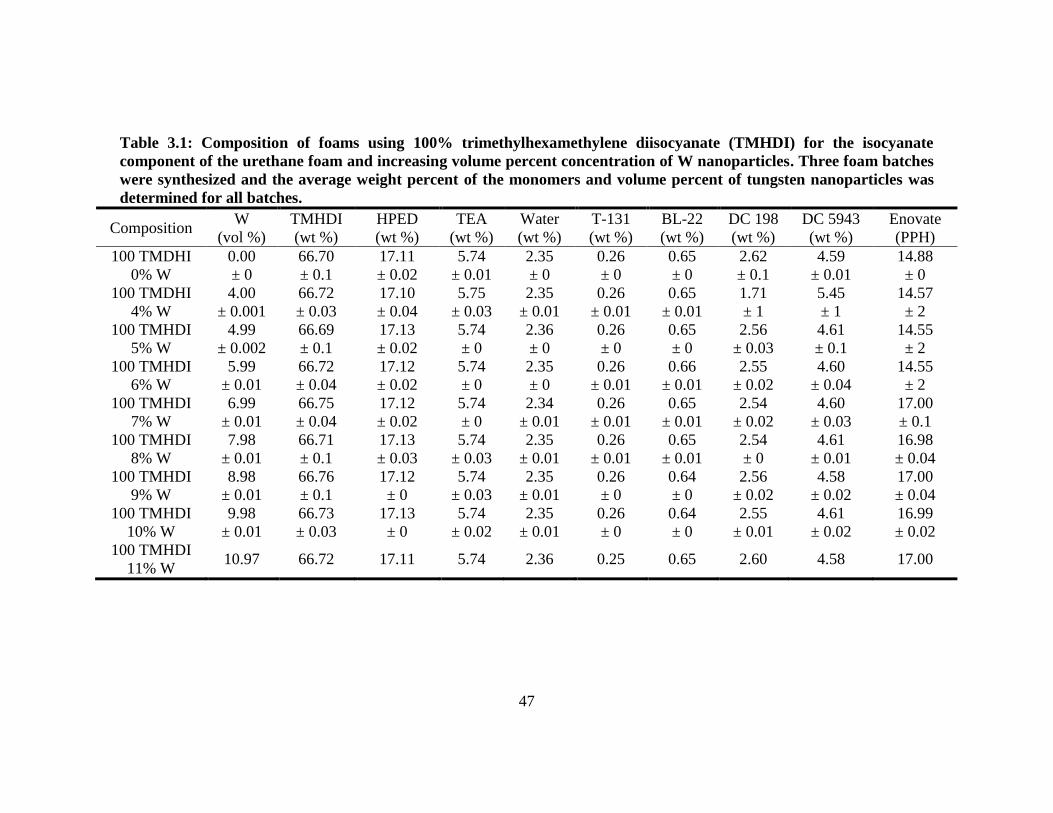
47
Table 3.1: Composition of foams using 100% trimethylhexamethylene diisocyanate (TMHDI) for the isocyanate
component of the urethane foam and increasing volume percent concentration of W nanoparticles. Three foam batches
were synthesized and the average weight percent of the monomers and volume percent of tungsten nanoparticles was
determined for all batches.
Composition W
(vol %)
TMHDI
(wt %)
HPED
(wt %)
TEA
(wt %)
Water
(wt %)
T-131
(wt %)
BL-22
(wt %)
DC 198
(wt %)
DC 5943
(wt %)
Enovate
(PPH)
100 TMDHI
0% W
0.00
± 0
66.70
± 0.1
17.11
± 0.02
5.74
± 0.01
2.35
± 0
0.26
± 0
0.65
± 0
2.62
± 0.1
4.59
± 0.01
14.88
± 0
100 TMDHI
4% W
4.00
± 0.001
66.72
± 0.03
17.10
± 0.04
5.75
± 0.03
2.35
± 0.01
0.26
± 0.01
0.65
± 0.01
1.71
± 1
5.45
± 1
14.57
± 2
100 TMHDI
5% W
4.99
± 0.002
66.69
± 0.1
17.13
± 0.02
5.74
± 0
2.36
± 0
0.26
± 0
0.65
± 0
2.56
± 0.03
4.61
± 0.1
14.55
± 2
100 TMHDI
6% W
5.99
± 0.01
66.72
± 0.04
17.12
± 0.02
5.74
± 0
2.35
± 0
0.26
± 0.01
0.66
± 0.01
2.55
± 0.02
4.60
± 0.04
14.55
± 2
100 TMHDI
7% W
6.99
± 0.01
66.75
± 0.04
17.12
± 0.02
5.74
± 0
2.34
± 0.01
0.26
± 0.01
0.65
± 0.01
2.54
± 0.02
4.60
± 0.03
17.00
± 0.1
100 TMHDI
8% W
7.98
± 0.01
66.71
± 0.1
17.13
± 0.03
5.74
± 0.03
2.35
± 0.01
0.26
± 0.01
0.65
± 0.01
2.54
± 0
4.61
± 0.01
16.98
± 0.04
100 TMHDI
9% W
8.98
± 0.01
66.76
± 0.1
17.12
± 0
5.74
± 0.03
2.35
± 0.01
0.26
± 0
0.64
± 0
2.56
± 0.02
4.58
± 0.02
17.00
± 0.04
100 TMHDI
10% W
9.98
± 0.01
66.73
± 0.03
17.13
± 0
5.74
± 0.02
2.35
± 0.01
0.26
± 0
0.64
± 0
2.55
± 0.01
4.61
± 0.02
16.99
± 0.02
100 TMHDI
11% W 10.97 66.72 17.11 5.74 2.36 0.25 0.65 2.60 4.58 17.00
48
3.2.3 Transmission electron microscopy (TEM)
A small piece (2mm x 4mm) of the sample was cut and embedded in the flat
mold with Polybed 812 (Polysciences, Inc., Warrington, PA) and polymerized at 60°C,
overnight. The sample resin block was sectioned at room temperature, using Leica UC6
microtome (Leica Microsystems, Wetzlar, Germany) and DiATOME diamond knives
(DiATOME, Hatfield, PA). Ultra-thin sections (70 nm) were examined by JEOL
1200EX II electron microscopy (Jeol, Peabody, MA).
3.2.4 X-ray imaging
An opacity frame was developed by mounting filler-loaded foam samples onto a
clear polycarbonate sheet. 2 mm foam cylinders were threaded over an 89 μm diameter
nickel-titanium (Nitinol) wire (NDC, Fremont, CA). A Guglielmi Detachable Coil
(GDC) (Boston Scientific, Marlborough, MA) used as the control for this experiment
because it is a platinum coil which is considered the current gold standard for aneurysm
treatment. The opacity frame was placed under a porcine head and imaged using a
Philips Allura Xper FD 20 C-arm System (Koninklijke Philips N.V., Amsterdam,
Netherlands) at 63 kV and 382 mA through soft and hard tissue. Images of the opacity
frame were collected under porcine jaw and neck for evaluating foam visibility at
multiple sites compared to the control.
3.2.5 X-ray density (X.D.)
X-ray images of the opacity frame were acquired on a Bruker In-Vivo Xtreme
multimodal preclinical imaging system (Bruker BioSpin Corp., Billerica, MA) outfitted
with a 4 MP back-thinned, back-illuminated 4MP CCD detector. X-rays were collected
49
with an exposure time of 1.0 s, where the f-stop = 1.40, FOV = 153.0 mm, vertical and
horizontal resolution = 377 ppi and X-ray energy = 45 KVP. Images were edited using
Bruker molecular imaging software. The background was subtracted using an
illumination correction reference. To quantify the x-ray density for each sample, a
length of 0.50 cm was selected along each sample in the X-ray image as the region of
interest. Greater than 70 pixels of X-ray density (X.D.) were taken within the region of
interest for each foam utilizing Bruker Molecular Imaging Software (Bruker BioSpin
Corp., Billerica, MA). From these measurements, a mean and standard deviation of the
X.D. was calculated.
3.2.6 DSC
The glass transition temperature (Tg) of the foams (n=5) was determined under
dry and wet conditions. For dry Tg, foam samples (3-8 mg) were used which were stored
in a dry container with desiccant, prior to analysis. A Q-200 DSC (TA Instruments, Inc.,
New Castle, DE) was used to attain the thermogram for our foams. The first cycle
consisted of decreasing the temperature to -40°C at 10°C·min-1
and holding it isothermal
for 2 minutes. The temperature was then increased to 120°C at 10°C·min-1
and held
isothermal for 2 minutes. In the second cycle, the temperature was reduced to -40°C at
10°C·min-1
, held isothermal for 2 minutes, and raised to 120°C at 10°C·min-1
. Tg was
recorded from the second cycle based on the inflection point of the thermal transition
curve using TA instruments software (TA Instruments, Inc., New Castle, DE). The
aluminum tin was not vented during this step. For wet Tg, foam samples (3-8 mg) were
submerged in RO water at 50°C for 5 minutes to allow full plasticization. After the

50
samples were removed from water, they were pressed dry with Kim Wipes (Kimberly-
Clark Professionals, Roswell, GA), weighed, and placed in an aluminum pan sealed with
an aluminum lid that was vented. Q-200 DSC was used to cool the samples to -40°C,
hold them isothermal for 2 minutes, and heat them to 80°C at 10°C·min-1
. TA
instruments software (TA Instruments, Inc., New Castle, DE) was used to generate the
thermogram and acquire the Tg, after water plasticization, using the average inflection
point of the thermal transition.
3.2.7 Tensile testing
Uniaxial tensile loading tests were carried out using an Insight 30 Material Tester
(MTS Systems Corporation, Eden Prairie, MN) at a constant strain rate of 5 mm/min at
room temperature. 10 foam samples with (L= 25mm, W= 15mm, H= 3mm) were cut
from the bulk material. Wood tabs were secured on each end of the foam, using epoxy,
to prevent sample deformation in the grips during testing. Tensile strength (kPa),
Young’s modulus (kPa), toughness (J·m-3
) and strain at break (%) were determined per
sample using the stress-strain curve.
3.2.8 Actuation studies
Cylindrical foam samples (n=3) with a diameter of 2 mm and a height of 1 cm
were cut. A 203.20 μm diameter nickel-titanium (Nitinol) wire (NDC, Fremont, CA) was
inserted through the center of the sample along its length to serve as a stabilizer. The
foam samples were radially compressed to their smallest possible diameter using ST
150-42 stent crimper (Machine Solutions, Flagstaff, AZ) by heating the material to
100°C, holding it isothermal for 15 minutes, and programming the foams to the crimped

51
morphology. Initial foam diameter was measured and recorded for each sample using
Image J software. The foams were placed in a water bath at 37°C and images were taken
at 30 seconds, 1 minute and every minute thereafter till 15 minutes, followed by one
image every 5 minutes thereafter till 30 minutes. Foam diameter was measured, at each
time point, using Image J software. The foams were then placed in a 70°C RO water
bath, removed after 20 minutes, and allowed to cool to room temperature. The final
diameter of the samples was measured and recorded using Image J software. Percent
volume recovery was calculated using Equation 3.2 and volume expansion was
calculated using Equation 3.3.
% 𝑉𝑜𝑙𝑢𝑚𝑒 𝑅𝑒𝑐𝑜𝑣𝑒𝑟𝑦 = (𝑅𝑒𝑐𝑜𝑣𝑒𝑟𝑒𝑑 𝑑𝑖𝑎𝑚𝑒𝑡𝑒𝑟
𝑂𝑟𝑖𝑔𝑖𝑛𝑎𝑙 𝑑𝑖𝑎𝑚𝑒𝑡𝑒𝑟)
2
∗ 100 (Eq. 3.2)
𝑉𝑜𝑙𝑢𝑚𝑒 𝐸𝑥𝑝𝑎𝑛𝑠𝑖𝑜𝑛 = (𝑅𝑒𝑐𝑜𝑣𝑒𝑟𝑒𝑑 𝑑𝑖𝑎𝑚𝑒𝑡𝑒𝑟
𝐶𝑜𝑚𝑝𝑟𝑒𝑠𝑠𝑒𝑑 𝑑𝑖𝑎𝑚𝑒𝑡𝑒𝑟)
2
(Eq. 3.2)
3.3 Results and discussion
3.3.1 Density and porosity
Foam density increased markedly, from 0.013 to 0.060 g·cm-3
, with greater W
incorporation due to the added mass within the foam struts per block, Table 3.2. All
compositions, however, maintained low densities, indicative of the foams retaining high
surface area to volume ratios. SMP nanocomposites containing 10%W had significantly
lower density than 9%W foams due to changes in pore sizes which are discussed in the
next section. Neat polymer density also increased with W addition (Table 3.2), from 1.0
to 3.0 g·cm-3
, indicating the material became heavier with filler content without variation
from foaming agents. Porosity calculations (Table 3.2) showed high porosity (> 98%)
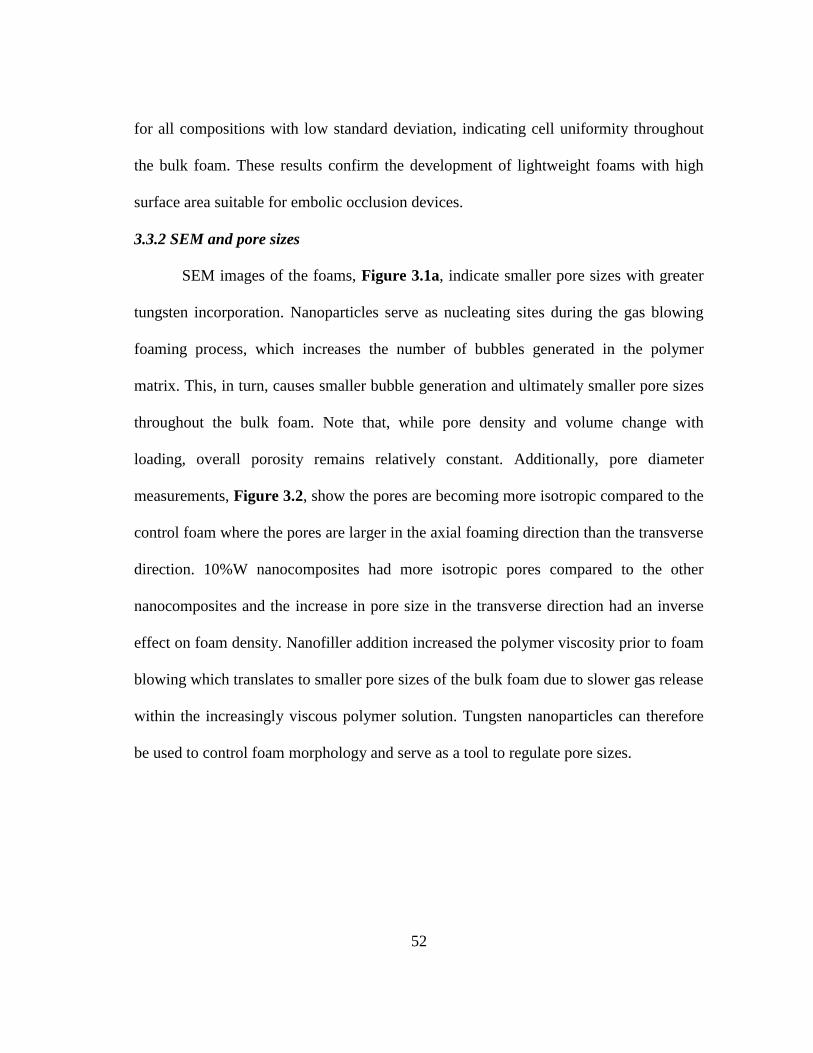
52
for all compositions with low standard deviation, indicating cell uniformity throughout
the bulk foam. These results confirm the development of lightweight foams with high
surface area suitable for embolic occlusion devices.
3.3.2 SEM and pore sizes
SEM images of the foams, Figure 3.1a, indicate smaller pore sizes with greater
tungsten incorporation. Nanoparticles serve as nucleating sites during the gas blowing
foaming process, which increases the number of bubbles generated in the polymer
matrix. This, in turn, causes smaller bubble generation and ultimately smaller pore sizes
throughout the bulk foam. Note that, while pore density and volume change with
loading, overall porosity remains relatively constant. Additionally, pore diameter
measurements, Figure 3.2, show the pores are becoming more isotropic compared to the
control foam where the pores are larger in the axial foaming direction than the transverse
direction. 10%W nanocomposites had more isotropic pores compared to the other
nanocomposites and the increase in pore size in the transverse direction had an inverse
effect on foam density. Nanofiller addition increased the polymer viscosity prior to foam
blowing which translates to smaller pore sizes of the bulk foam due to slower gas release
within the increasingly viscous polymer solution. Tungsten nanoparticles can therefore
be used to control foam morphology and serve as a tool to regulate pore sizes.

53
Table 3.2: Key physical and thermal properties of the SMP foam nanocomposites.
W
(vol %)
ρfoam
(g·cm-3
)
ρneat
(g·cm-3
)
Porosity
(%)
Dry Tg
(°C)
Wet Tg
(°C)
Volume Recovery
(%)
Volume Expansion
(x)
0% W 0.013 ± 0.001 1.0 ± 0.02 99 ± 0.1 58 ± 2 34 ± 1 108 ± 24 63 ± 14
4% W 0.033 ± 0.004 1.8 ± 0.03 98 ± 0.2 63 ± 1 28 ± 1 82 ± 15 21 ± 4
5% W 0.041 ± 0.000 2.0 ± 0.04 98 ± 0.0 65 ± 1 35 ± 0 89 ± 19 29 ± 11
6% W 0.045 ± 0.002 2.2 ± 0.04 98 ± 0.1 67 ± 0 38 ± 1 93 ± 17 41 ± 8
7% W 0.045 ± 0.004 2.4 ± 0.05 98 ± 0.2 66 ± 1 39 ± 1 94 ± 19 36 ± 11
8% W 0.054 ± 0.009 2.6 ± 0.05 98 ± 0.4 67 ± 1 41 ± 0 99 ± 13 35 ± 7
9% W 0.060 ± 0.011 2.8 ± 0.06 98 ± 0.4 66 ± 1 41 ± 1 105 ± 17 32 ± 10
10% W 0.048 ± 0.003 3.0 ± 0.06 98 ± 0.1 68 ± 1 41 ± 1 98 ± 16 36 ± 10
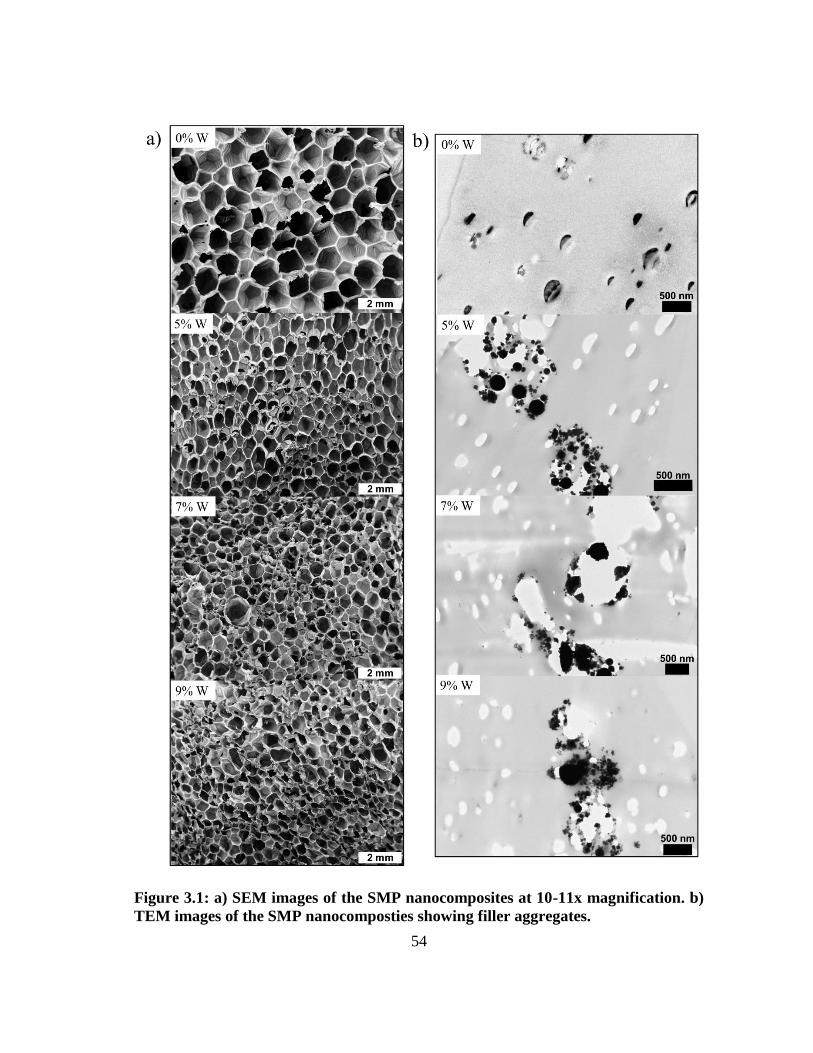
54
Figure 3.1: a) SEM images of the SMP nanocomposites at 10-11x magnification. b)
TEM images of the SMP nanocomposties showing filler aggregates.

55
Figure 3.2: Pore sizes in the axial and transverse direction of SMP foams with
increasing W content.
3.3.3 TEM
Incorporation of W nanoparticles into the SMP system resulted in aggregate
formation at the nanoscale even at low concentrations, Figure 3.1 b. TEM image of the
control (0%W) foam shows nanopores within the polymer struts which indicate the
occurrence of these defects as a part of the foaming process rather than as a result of
filler incorporation. However, 5%W, 7%W, and 9%W composites have filler aggregates

56
in the polymer struts that imply poor dispersion of the nanoparticles with physical
mixing.
3.3.4 X-ray imaging
Sufficient x-ray visibility was achieved for SMP nanocomposites with W loading
greater than 6%, Figure 3.3. Crimped foams attenuated x-rays through soft and hard
tissue of the porcine head at various locations, suggesting acceptable visibility through
qualitative analysis.
Figure 3.3: a) X-ray density of the SMP foams with increasing W content. b) Design
of the frame mounted with crimped SMP foam over nitinol wire. c) X-ray image of
the SMP foams through porcine jaw. d) X-ray image of the SMP foams through
porcine neck. Panels a) and b) were acquired via collaboration with the Laboratory
for Synthetic-Biologic Interactions using a Bruker In-Vivo Xtreme multimodal
preclinical imaging system. Panels c) and d) were acquired via collaboration with
Texas Institute of Preclinical Studies using a Philips Allura Xper FD 20 C-arm
System

57
3.3.5 X-ray density (X.D.)
Quantitative evaluation of foam visibility was conducted via X.D. analysis
(Figure 3.3). With increasing W loading, the crimped SMP attenuates x-ray more
effectively, increasing from 0.8 to 1.2 at 45 KV. For SMP foams with greater than 6%
W, average X.D. was larger than the GDC control (0.9). Filler addition successfully
imparted radiopacity to the polymer system such that it will allow for use of smaller
foam diameters without compromising x-ray visibility.
3.3.6 DSC
Thermal characterization of the foams revealed increasing transition
temperatures with greater W loading (Table 3.2). Dry Tg of the SMP foams increased by
10°C while wet Tg increased by 7°C with higher filler content. Nanoparticle
incorporation restricted polymer mobility at the molecular level and increased the
number of physical crosslinks within the SMP network. The addition of these physical
crosslinks requires greater heat input for the polymer to transition from the glassy to the
rubbery state therefore shifting the Tg towards higher temperatures. This finding serves
as a method for tuning thermal properties of the system for other applications that
require a specific actuation temperature.
3.3.7 Tensile testing
Increasing W concentration in SMP foams changed mechanical properties
compared to the control (Table 3.3, Figure 3.4). An increase in Young’s modulus can
be observed, from 2600 ± 200 kPa to 10100 ± 400 kPa, for 4%W foams, indicating
greater material stiffness. However, higher filler content resulted in decreasing stiffness
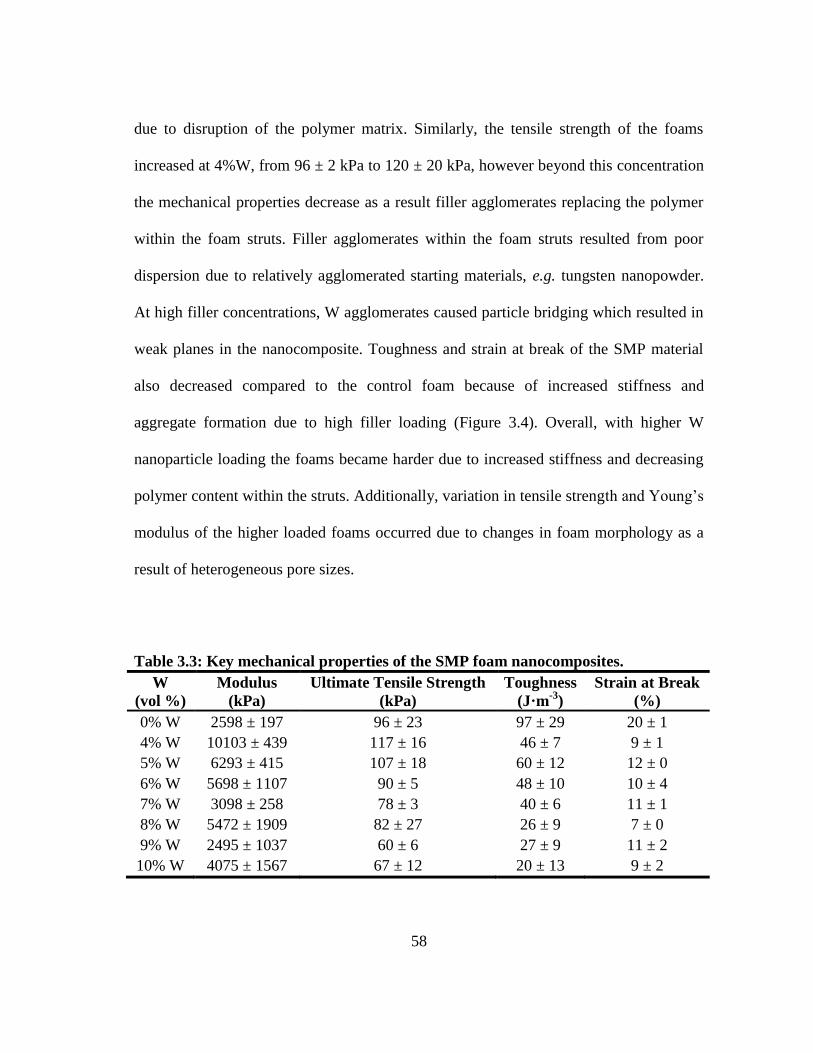
58
due to disruption of the polymer matrix. Similarly, the tensile strength of the foams
increased at 4%W, from 96 ± 2 kPa to 120 ± 20 kPa, however beyond this concentration
the mechanical properties decrease as a result filler agglomerates replacing the polymer
within the foam struts. Filler agglomerates within the foam struts resulted from poor
dispersion due to relatively agglomerated starting materials, e.g. tungsten nanopowder.
At high filler concentrations, W agglomerates caused particle bridging which resulted in
weak planes in the nanocomposite. Toughness and strain at break of the SMP material
also decreased compared to the control foam because of increased stiffness and
aggregate formation due to high filler loading (Figure 3.4). Overall, with higher W
nanoparticle loading the foams became harder due to increased stiffness and decreasing
polymer content within the struts. Additionally, variation in tensile strength and Young’s
modulus of the higher loaded foams occurred due to changes in foam morphology as a
result of heterogeneous pore sizes.
Table 3.3: Key mechanical properties of the SMP foam nanocomposites.
W
(vol %)
Modulus
(kPa)
Ultimate Tensile Strength
(kPa)
Toughness
(J·m-3
)
Strain at Break
(%)
0% W 2598 ± 197 96 ± 23 97 ± 29 20 ± 1
4% W 10103 ± 439 117 ± 16 46 ± 7 9 ± 1
5% W 6293 ± 415 107 ± 18 60 ± 12 12 ± 0
6% W 5698 ± 1107 90 ± 5 48 ± 10 10 ± 4
7% W 3098 ± 258 78 ± 3 40 ± 6 11 ± 1
8% W 5472 ± 1909 82 ± 27 26 ± 9 7 ± 0
9% W 2495 ± 1037 60 ± 6 27 ± 9 11 ± 2
10% W 4075 ± 1567 67 ± 12 20 ± 13 9 ± 2
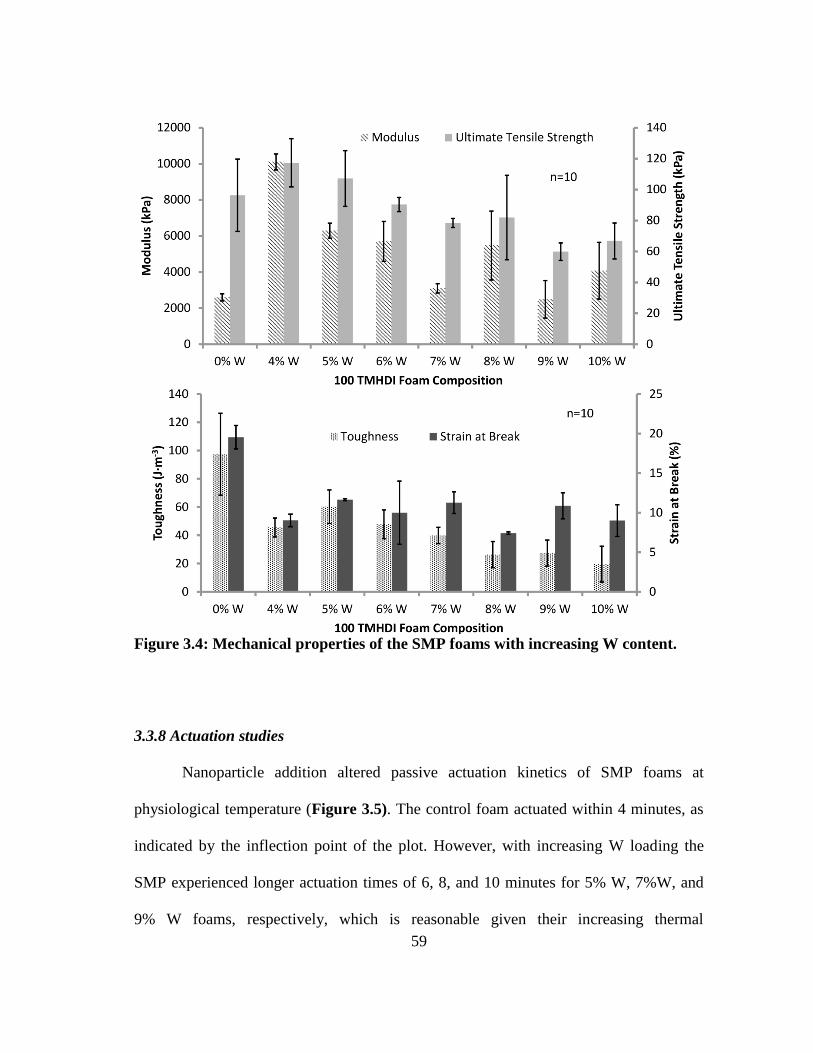
59
Figure 3.4: Mechanical properties of the SMP foams with increasing W content.
3.3.8 Actuation studies
Nanoparticle addition altered passive actuation kinetics of SMP foams at
physiological temperature (Figure 3.5). The control foam actuated within 4 minutes, as
indicated by the inflection point of the plot. However, with increasing W loading the
SMP experienced longer actuation times of 6, 8, and 10 minutes for 5% W, 7%W, and
9% W foams, respectively, which is reasonable given their increasing thermal

60
transitions. Volume recovery (Table 3.2) of the foams remained greater than 80% for all
foams, however, considerably less than the control foam due to increased molecular
restrictions on the network mobility. Similarly, volume expansion of the foams
decreased with W addition, from 63x ± 14 to 21x ± 4, for the control foams and 4% W
loaded foams, respectively.
Figure 3.5: Actuation time of the SMP foams with increasing W content.

61
SMP foam nanocomposites were synthesized with inherent radiopacity by
incorporating W nanoparticles within the polymer matrix during OH premix synthesis.
W is a high Z number element which allowed it to effectively attenuate x-rays and
impart visibility to SMP foams through soft and hard tissue. A smaller foam geometry
was used for neurovascular applications, therefore higher filler loading was required to
make the foams radiopaque. W concentrations greater than 6% resulted in sufficient
foam visibility, when crimped, and had greater X.D. compared to the GDC control.
Additionally, the SMP foams maintained their low density and high porosity, making
them desirable for aneurysm occlusion devices due to their large volume expansion and
high surface area. W nanoparticles served as a tool for controlling viscosity of the foam
mixture and provided nucleation sites, which resulted in smaller and more isotropic
pores with greater filler loading. This finding is critical for controlling the overall foam
morphology and serves as a platform for material development for new medical
applications that require specific pore sizes in polyurethane scaffolds. Filler dispersion
improved significantly with nanoparticle content compared to the microcomposites
developed by Rodriguez et al. W nanoparticles dispersion within the foam matrix was
more homogeneous, compared to W microparticles, as seen by the lack of filler
agglomerates within the struts and the foam membranes in the SEM images (Figure
3.1a). However, filler aggregation still occurred on the nanoscale (Figure 3.1b),
indicating the need for further optimization of nanoparticle mixing into the foam matrix.
Thermal characterization of the foams showed increasing transition temperature,
under dry and wet conditions, for foams with W loading greater than 5%. The
62
nanoparticles restricted network mobility, thereby increasing polymer stiffness, and
required higher temperature for the polymer to transition from the glassy to rubbery
state. W addition provided greater control over the thermal properties of the SMP
system. This functions as a potential tool for further tuning of the foams and prevention
of premature water plasticization of foams in the catheter during device delivery.
Similarly, passive actuation time of the foams increased with filler addition due to
slower foam plasticization by water. Fortuitously, W nanoparticles have potential use
providing greater control over the actuation kinetics of SMP foams, similar to altering
the chemical backbone as studied by Hasan et al., to achieve longer working times for
clinical applications. Volume recovery and expansion of the SMP foams decrease with
greater W loading. However, the foams recover to 80% of their original diameter and
expand up to 40x their original volume, maintaining their efficacy for aneurysm
occlusion.
Lastly, mechanical properties of the SMP nanocomposites diminished with filler
addition due to a large percentage of the polymer strut being replaced by W. While
nanoparticles increased material stiffness and strength up to 4% W loading, an opposite
effect was observed on toughness and strain-to-failure at all concentrations. W is
traditionally used in low concentrations to develop mechanically robust composites,
therefore lower toughness was expected for high filler concentration. Furthermore, the
foams were tested below Tg. This could have a negative effect on mechanical properties
as, above Tg, the rubbery polymer would align around the filler particles and provide
higher toughness and strain-to-failure response. Additionally, increasing the crosslink
63
density of the material due to filler loading would further lower material toughness and
strain at break.
3.4 Conclusions
In conclusion, radiopaque SMP foam nanocomposites were developed with high
W loading, up to 10% by volume, and high porosity for aneurysm occlusion
applications. W nanoparticles successfully introduced radiopacity of the foams, using x-
ray fluoroscopy, and made the device visible during transcatheter delivery and
deployment within the aneurysm. Additionally, thermal properties of the composites
were controlled by filler content with greater W concentrations resulting in higher Tg.
Actuation profiles of the SMP composites were tailored with filler content due to
increased stiffness which delayed actuation and mechanical properties were modified
compared to unloaded foams. The new SMP nanocomposites provide a greater control
over device visibility and actuation kinetics compared to the previously developed SMP
systems by Rodriguez et al. and Hasan et al. Nanoparticles afforded uniform filler
dispersion and minimal foam destabilization compared to microparticles. Nanoparticles
also served as a nucleating agent during foam synthesis and resulted in smaller cell sizes
with increasing filler loading. Overall, the SMP foams have comparable radiopacity to
current GDC coils and variable thermo-mechanical properties that make them optimal
for use as embolic agents for neurovascular applications.

64
CHAPTER IV
USE OF NANOPARTICLES TO MODIFY MECHANICAL PROPERTIES
AND SHAPE MEMORY BEHAVIOR
4.1 Introduction
Shape-memory polymers (SMPs) are materials that have the ability to switch
between a primary and a secondary shape upon the input of an external stimulus, such as
heat, electrical impulse, or change in pH. 2, 12, 103
The SMPs utilized in the current study
can be synthesized in a primary shape, heated above their glass transition temperature
(Tg), and programmed into a secondary shape. Upon cooling, the material will maintain
this secondary geometry until the system is exposed to a thermal stimulus, allowing the
SMP to recover to its original shape. This thermo-responsive nature can be harnessed to
develop devices for embolization of cerebral aneurysms. 19, 33, 47, 98
We previously
fabricated SMP foams that demonstrate rapid, stable aneurysm occlusion, comparable to
the Guglielmi Detachable Coils, which are the current gold standard. 104
Additionally,
SMP foam-over-wire devices can be implanted in an aneurysm via minimally invasive
surgery through the femoral artery. Passive actuation of the foam under physiological
conditions results in stable clot formation, which is replaced by inert scar tissue over 3-6
weeks. 38
The healed aneurysm has potential for minimizing the chance of recanalization
Reprinted with permission from “Modification of Shape Memory Polymer Foams Using Tungsten,
Aluminum Oxide, and Silicon Dioxide Nanoparticles,” by Sayyeda M. Hasan, Robert S. Thompson, Adam
L. Nathan, Andrew C. Weems, Fang Zhao, Mary Beth Browning Monroe, Duncan J. Maitland, RSC
Advances 2016, 6, 918-927. Reproduced by permission of The Royal Society of Chemistry (2016).
65
and clot migration into the parent vessel due to the restored endothelial tissue at the
aneurysm neck. 38
While our SMP foams have significant advantages over current treatments, a
potential drawback could occur from the ultra-low density of the porous polymer system,
resulting in foam shearing and particulate generation during device fabrication and
implantation. Particle generation after implantation is especially hazardous and can
cause unintended ischemia and small vessel occlusion, both of which are negative side
effects of this treatment. Additionally, the SMP foam may fracture during device
delivery through tortuous vasculature, which may result in device failure. Developing
tougher, wear-resistant polymer systems could mitigate foam fracture and particulate
generation while preserving device function during processing and handling.
Nanofillers have been used to improve mechanical properties of various polymer
composites. 105-108
Most composites only require small filler concentrations to achieve
drastic improvements in mechanical toughness and strength. 109
The nanoparticles act as
physical crosslinks within the polymer network, which limit chain mobility, but improve
shock absorption and tear resistance. 110
Silica (SiO2) nanoparticles have been used to
improve the mechanical and thermo-mechanical properties of epoxy resins as well as to
control their viscosity. 111
Alumina (Al2O3) has also been utilized in various polymer
composites and ceramics to increase hardness and toughness. 112
This inert nanofiller is
known to improve load-bearing capabilities of implantable biomaterials while
maintaining excellent biocompatibility. 113
Tungsten nanoparticles have previously been
used by our group to impart radiopacity to SMP foams. High filler loading decreases
66
mechanical toughness due to disruption of the polymer matrix, 114
but other groups have
reported that low concentrations of tungsten improve the mechanical properties of
composites. 115
Tungsten coils have been extensively tested for biocompatibility in
human and animal subjects, with minimal toxic indications. 99-101
The goal of this research was to develop SMP foams with reinforcing nanofillers
to improve mechanical properties. Aluminum oxide (Al2O3), silicon dioxide (SiO2) and
tungsten (W) nanoparticles were used due to their pre-established use in medical
implants and their contribution to developing tough, wear-resistant materials.
4.2 Materials and methods
4.2.1 Materials
N,N,N’,N’-Tetrakis(2-hydroxypropyl)ethylenediamine (HPED, 99%; Sigma-
Aldrich Inc., St. Louis, MO), triethanolamine (TEA, 98%; Sigma-Aldrich Inc., St. Louis,
MO), trimethyl-1,6-hexamethylene diisocyanate, 2,2,4- and 2,4,4- mixture (TMHDI;
TCI America Inc., Portland, OR), DC 198 (Air Products and Chemicals, Inc., Allentown,
PA), DC 5943 (Air Products and Chemicals, Inc., Allentown, PA), T-131 (Air Products
and Chemicals, Inc. Allentown, PA), BL-22 (Air Products and Chemicals, Inc,
Allentown, PA), Enovate 245fa Blowing Agent (Honeywell International, Inc., Houston,
TX), 2-propanol 99% (IPA; VWR, Radnor, PA) and deionized (DI) water (> 17 MΩ cm
purity; Millipore water purifier system, Millipore Inc., Billerica, MA) were used as
received. Tungsten standard for AAS (1000 mg/L; Sigma Aldrich Inc., St. Louis, MO),
aluminium standard for ICP (1000 mg/L; Sigma Aldrich Inc., St. Louis, MO), and

67
silicon standard for ICP (1000 mg/L; Sigma Aldrich Inc., St. Louis, MO) were mixed
into nitric acid (70% purity, 99.999% trace metal basis; Sigma Aldrich Inc., St. Louis,
MO) before characterization. Tungsten nanoparticles (W, 99.95%, 40-60 nm; US
Research Nanomaterials Inc., Houston, TX), aluminum oxide nanoparticles (Al2O3,
alpha, 99+%, 80 nm, hydrophilic; US Research Nanomaterials Inc., Houston, TX), and
silicon dioxide nanoparticles (SiO2, 98+%, 60-70 nm, amorphous; US Research
Nanomaterials Inc., Houston, TX) were dried for 12 hours under vacuum prior to use in
foam synthesis.
4.2.2 Synthesis and characterization of SMP nanocomposites
4.2.2.1 General procedure for SMP foam synthesis
SMP foams were synthesized with nanoparticles using the procedure described
by Hasan et al. 114
Isocyanate (NCO) pre-polymer was synthesized with appropriate
molar ratios of HPED, TEA, and TMHDI, with a 35 wt% hydroxyl (OH) content.
Nanoparticles were physically mixed into the NCO pre-polymer at the appropriate
concentrations prior to foam blowing. A OH mixture was prepared with the remaining
molar equivalent of HPED and TEA. During foam blowing, foaming agents, including
catalysts, surfactants, DI H2O, and Enovate, were mixed with the NCO-prepolymer and
the OH mixture using a FlackTek speedmixer (FlackTek, Inc., Landrum, SC). The
resulting foams were cured at 90°C for 20 minutes. The SMP foam nanocomposites
were cooled to room temperature (21 ± 1°C) before further characterization. Post-cure
purification of the SMP foams included sonication in IPA or reverse osmosis (RO) water

68
in 15 minute cycles. The purified foams were dried overnight at 55°C under vacuum.
Table 4.1 shows the chemical components and filler concentrations of the SMP
nanocomposites characterized in this study.
4.2.2.2 Density and porosity
SMP foam density (n=3) was quantified using foam blocks from the top, middle,
and bottom section of the foam, as required by ASTM standard D-3574. Foam block
mass was measured and recorded, and length, width, and height values were measured
three times using a digital caliper. Porosity was calculated using Equation 4.1. Density
of the non-porous neat polymer was calculated without contribution from foaming
agents, such as catalysts, surfactants, DI water, and Enovate.
𝐏𝐨𝐫𝐨𝐬𝐢𝐭𝐲 (%) = (𝝆𝐧𝐞𝐚𝐭− 𝝆𝐟𝐨𝐚𝐦
𝝆𝐧𝐞𝐚𝐭) ∗ 𝟏𝟎𝟎 (Eq. 4.1)
4.2.2.3 Filler dispersion
A small sample section (2 mm x 4 mm) was cut and embedded into a flat mold
with Polybed 812 (Polysciences, Inc., Warrington, PA), which was then polymerized at
60°C for 24 hours. The sample resin block was sectioned under ambient conditions,
using a Leica UC6 microtome (Leica Microsystems, Wetzlar, Germany) and DiATOME
diamond knives (DiATOME, Hatfield, PA). Ultra-thin sections (70 nm) were examined
by JEOL 1200EX II electron microscopy (Jeol, Peabody, MA). Transmission electron
microscope (TEM) images were processed and analyzed using Image J software (NIH,
Bethesda, MD) to quantify average particle diameter (nm) and nearest neighbor distance

69
(nm). The dispersion parameter (D) was quantified using the average particle area (μ)
and the standard deviation of the particle area (σ), as shown in Equation 4.2. 116
𝐃 =𝟎.𝟐
√𝟐𝛑·
𝝁
𝝈 (Eq. 4.2)
4.2.2.4 Thermal analysis
The glass transition temperature (Tg) under wet and dry conditions was evaluated
for each SMP foam composition (n=5). For dry Tg, 3-8 mg foam samples were cut and
stored in a dry container with desiccant prior to analysis. A Q-200 DSC (TA
Instruments, Inc., New Castle, DE) was used to obtain the thermogram for each
composition. In the first cycle, the temperature was decreased to -40°C at 10°C·min-1
and held isothermally for 2 minutes. The temperature was then increased to 120°C at
10°C·min-1
and held isothermally for 2 minutes. In the second cycle, the temperature
was reduced to -40°C at 10°C·min-1
, held isothermally for 2 minutes, and raised to
120°C at 10°C·min-1
. Tg was recorded from the second cycle using the inflection point
of the thermal transition curve analyzed with TA instruments software (TA Instruments,
Inc., New Castle, DE). The aluminum pan was not vented during this step. For wet Tg, 3-
8 mg foam samples were submerged in RO water at 50°C for 5 minutes to allow full
plasticization. After the samples were removed from water, they were pressed dry with
Kim Wipes (Kimberly-Clark Professionals, Roswell, GA), weighed, and placed in an
aluminum pan sealed with a vented aluminum lid. Q-200 DSC was used to cool the
samples to -40°C and hold them isothermally for 2 minutes. The samples were then
heated to 80°C at 10°C·min-1
. TA instruments software (TA Instruments, Inc., New

70
Castle, DE) was used to generate the thermogram and acquire the Tg after water
plasticization using the average inflection point of the thermal transition.
4.2.2.5 SMP foam actuation
Cylindrical foam samples (n=3) were prepared with a diameter of 4 mm and a
height of 10 mm. A 203.20 μm diameter nickel-titanium (Nitinol) wire (NDC, Fremont,
CA) was threaded through the center of the sample along its length to serve as a
stabilizer. The foam samples were radially crimped to their smallest possible diameter
using an ST 150-42 stent crimper (Machine Solutions, Flagstaff, AZ) by heating the
material to 100°C, holding it isothermally for 15 minutes, and programming the foams to
the crimped morphology. Initial foam diameter was measured for each sample and SMP
foam composition using Image J software (NIH, Bethesda, MD). The foams were placed
in a water bath at 50°C, and images were taken at 30 seconds, 1 minute, each minute
thereafter up to 15 minutes, and every 5 minutes up to 30 minutes. Foam diameter was
measured at each time point using Image J. Percent volume recovery (%) was calculated
using Equation 4.3, and volume expansion was calculated using Equation 4.4.
% Volume Recovery = (Recovered diameter
Original diameter)
2
∗ 100 (Eq. 4.3)
Volume Expansion = (Recovered diameter
Compressed diameter)
2
(Eq. 4.4)
4.2.2.6 Thermal stability
Thermal stability of the SMP nanocomposites was determined using
thermogravimetric analysis (TGA). 15-20 mg samples (n=3) were prepared from the

71
cleaned foams. An alumina pan was used to hold all samples and tared before each run.
The samples were heated from 25°C to 600°C at 10°C·min-1
under nitrogen flow of 50
mL·min-1
using a TGA Q 50. At 600°C, the gas was switched to air flow at 50 mL·min-1
,
and the samples were heated to 800°C. The thermograms were evaluated using TA
Universal Analysis software, and percent mass loss (%) versus temperature (°C) curves
were graphed for each nanocomposite.
4.2.2.7 Mechanical analysis
Uniaxial tensile loading tests were conducted to determine tensile strength (kPa),
toughness (J·m-3
) and strain at break (%) of all nanocomposites. The tests were carried
out using an Insight 30 Material Tester (MTS Systems Corporation, Eden Prairie, MN)
at a constant strain rate of 5 mm·min-1
at room temperature. Ten foam samples per foam
composition (L= 25 mm, W= 15 mm, H= 3 mm) were cut from the bulk material. Wood
tabs were secured on each end of the foam using epoxy to prevent sample deformation in
the grips during testing. The resulting stress-strain curves were used to evaluate the
mechanical properties of SMP nanocomposites.
4.2.2.8 Particulate analysis
Evaluation of particulate content was conducted in accordance with USP 788, a
guidance document for particulate matter in injections. The particulate levels were
measured using the light obscuration method with ChemTrac PC5000 (Chemtrac Inc.,
Norcross, GA). Foam cylinders (n=5) with 8 mm diameter and 3 cm length were cut
from each SMP nanocomposite. The samples were tumbled 20x in 100 mL DI water,

72
and the resulting suspension was processed with the particle counter to acquire a particle
count for each composition. Due to the high sensitivity of the particle counter, baseline
counts were taken prior to each experiment.
4.2.2.9 Leachable analysis.
Inductively coupled plasma mass spectrometry (ICP-MS) was used to determine
the concentration of extractable metals from SMP composites. Approximately 1 g of
SMP composite foams were completely immersed in 500 mL of RO water at 37°C. At 1,
4, 8, 12 and 16 days, the solute was removed and concentrated down to approximately
30 mL. After removal, another 500 mL was added to the samples. To prepare samples
for ICP, 150 µL of nitric acid was added to each extraction, and standard solutions
ranging from 0.1 ppb to 100 ppm were used to generate standard curves for silicon,
aluminium and tungsten, respectively. Analysis was performed using a Perkin Elmer
DRCII ICP-MS (Perkin Elmer, Waltham, Massachusetts). The concentration of each
respective extractable was determined and subtracted from the total concentration of
leachables per sample.
4.3 Results and discussion
4.3.1 Density and porosity
All SMP nanocomposites maintained ultra-low densities and high porosity
(>98%) which allow the foam to be compressed to small configurations, Table 4.1.
There was minimal variation in densities with changing filler type and concentration,
indicating uniformity in the foam morphology. The foam density for all compositions

73
remained close to that of the control, within the range 0.012-0.017 g·cm-3
, and a neat
density of approximately 1 g·cm-3
was obtained for the control and all nanocomposites.
These results indicate that the fillers do not have a drastic effect on foam cell uniformity
at the low concentrations employed in these studies.
Table 4.1: Physical properties of the SMP foam nanocomposites. The SMP
consisted of 67 mol% HPED, 33 mol% TEA, and 100 mol% TMHDI.
Composition ρfoam
(g·cm-3
)
ρneat
(g·cm-3
)
Porosity
(%)
Dry Tg
(°C)
Wet Tg
(°C)
Control 0.015 ± 0.001 1.019 99 58 ± 2 34 ± 1
0.5% Al2O3 0.016 ± 0.001 1.024 98 63 ± 3 36 ± 1
1% Al2O3 0.014 ± 0.001 1.024 99 64 ± 1 35 ± 1
2% Al2O3 0.015 ± 0.001 1.029 99 64 ± 2 36 ± 1
3% Al2O3 0.013 ± 0.001 1.039 99 63 ± 1 35 ± 1
4% Al2O3 0.012 ± 0.001 1.049 99 62 ± 1 36 ± 1
5% Al2O3 0.015 ± 0.001 1.022 99 62 ± 1 35 ± 1
0.5% SiO2 0.013 ± 0.001 1.026 99 68 ± 2 36 ± 2
1% SiO2 0.013 ± 0.001 1.032 99 65 ± 1 35 ± 1
2% SiO2 0.017 ± 0.001 1.023 98 65 ± 1 35 ± 1
0.5% W 0.017 ± 0.001 1.027 98 59 ± 3 36 ± 1
1% W 0.013 ± 0.001 1.034 99 60 ± 1 37 ± 1
2% W 0.014 ± 0.001 1.042 99 58 ± 1 38 ± 0
3% W 0.013 ± 0.001 1.050 99 56 ± 1 36 ± 1
4.3.2 Filler dispersion
Dispersion of the nanoparticles was heavily dependent on the concentration and
filler type. Table 4.2 shows the dispersion parameter (D) values for a range of
nanocomposites. Higher D values were indicative of better particle dispersion with fewer
aggregates. 116
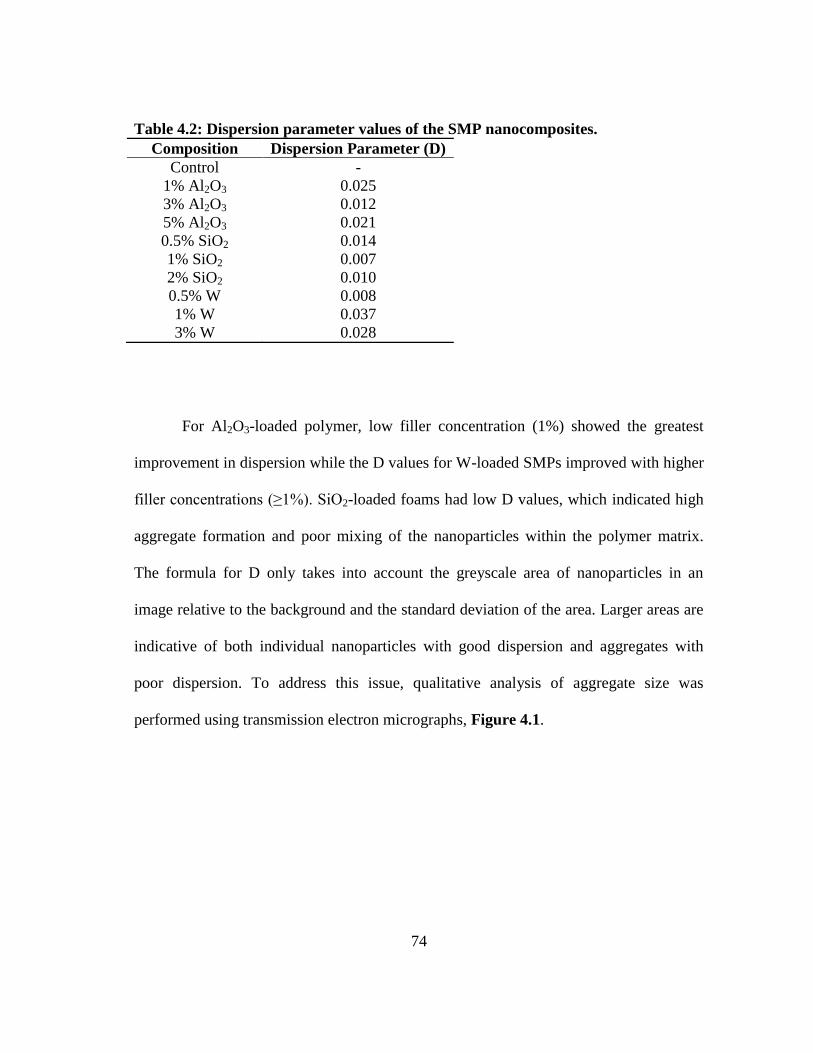
74
Table 4.2: Dispersion parameter values of the SMP nanocomposites.
Composition Dispersion Parameter (D)
Control -
1% Al2O3 0.025
3% Al2O3 0.012
5% Al2O3 0.021
0.5% SiO2 0.014
1% SiO2 0.007
2% SiO2 0.010
0.5% W 0.008
1% W 0.037
3% W 0.028
For Al2O3-loaded polymer, low filler concentration (1%) showed the greatest
improvement in dispersion while the D values for W-loaded SMPs improved with higher
filler concentrations (≥1%). SiO2-loaded foams had low D values, which indicated high
aggregate formation and poor mixing of the nanoparticles within the polymer matrix.
The formula for D only takes into account the greyscale area of nanoparticles in an
image relative to the background and the standard deviation of the area. Larger areas are
indicative of both individual nanoparticles with good dispersion and aggregates with
poor dispersion. To address this issue, qualitative analysis of aggregate size was
performed using transmission electron micrographs, Figure 4.1.
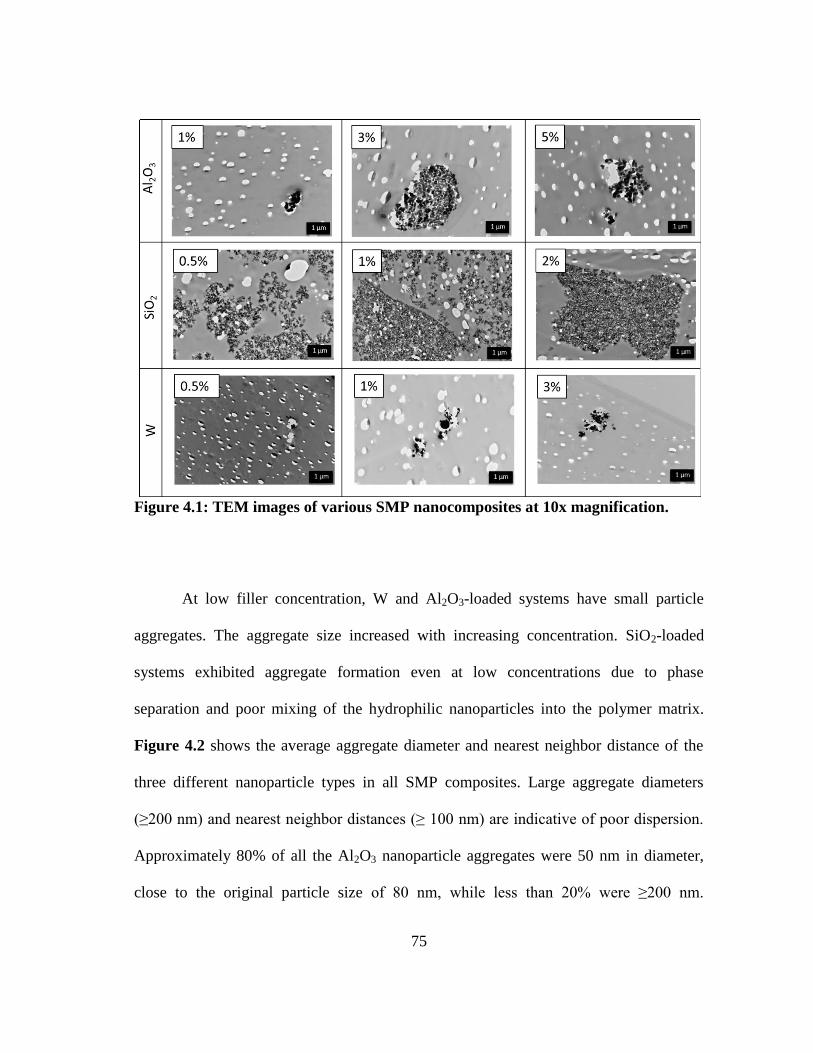
75
Figure 4.1: TEM images of various SMP nanocomposites at 10x magnification.
At low filler concentration, W and Al2O3-loaded systems have small particle
aggregates. The aggregate size increased with increasing concentration. SiO2-loaded
systems exhibited aggregate formation even at low concentrations due to phase
separation and poor mixing of the hydrophilic nanoparticles into the polymer matrix.
Figure 4.2 shows the average aggregate diameter and nearest neighbor distance of the
three different nanoparticle types in all SMP composites. Large aggregate diameters
(≥200 nm) and nearest neighbor distances (≥ 100 nm) are indicative of poor dispersion.
Approximately 80% of all the Al2O3 nanoparticle aggregates were 50 nm in diameter,
close to the original particle size of 80 nm, while less than 20% were ≥200 nm.

76
Furthermore, approximately 80% of all Al2O3 nanoparticles had a nearest neighbor
distance of ≤100 nm, while approximately 20% were farther apart than 1000 nm. These
results suggest uniform dispersion of Al2O3 within the various SMP composites.
Comparatively, ~40% of all the SiO2 and W aggregates were 50 nm, while the remaining
aggregates (~60%) were ≥200 nm. These larger aggregates indicate non-homogenous
dispersion, as the original particle size was 40-60 nm and 60-70 nm for W and SiO2,
respectively. All compositions experienced filler agglomeration, as shown by the
aggregate size of ≥500 nm; however Al2O3-loaded nanocomposites had the least
aggregate formation. Nearest neighbor distance for all SiO2 and W-loaded foams was
within 100-1000 nm, suggesting poor filler dispersion within the polymer matrix.
Overall, Al2O3 served as the better filler with uniform dispersion and reduced aggregate
formation compared to W and SiO2.

77
Figure 4.2: Average aggregate diameter (a) and nearest neighbor distance (b) for
the selected nanoparticles.

78
4.3.3 Thermal transitions and foam actuation
Filler addition had minimal effect on the dry thermal transitions of the W and
Al2O3 nanocomposites as indicated by differential scanning calorimetry (DSC), Table
4.1. These foams had glass transition temperatures (Tg’s) within 5°C of the control foam.
However, 0.5% SiO2-loaded foams showed a 10°C increase in Tg, suggesting restricted
chain mobility due to an increase in the physical net points of the polymer. The wet Tg’s
of all nanocomposites were similar to that of the control due to increased chain
flexibility upon water plasticization of the polymer system.
Actuation kinetics of the SMP nanocomposites were dependent on the
concentration and filler type. Figure 4.3 shows changes in foam diameter upon exposure
to heat in an aqueous environment. For Al2O3 nanocomposites, the foams underwent
faster actuation (< 5 minutes) with higher filler loadings (>3%), compared to the control,
as indicated by the inflection point of the curves. The Al2O3-loaded SMP systems also
showed greater diameter recovery with increased filler content. Similarly, W
nanocomposites had faster actuation profiles and greater diameter recovery for the
higher-loaded foams, as indicated by a 3 minute actuation time with 3% W versus an 8
minute actuation time for the control. Increasing filler content resulted in more physical
crosslinks in the system to serve as net points that play a critical role in SMP shape
recovery and shape memory. Entropic recovery of SMPs is dependent on the net points
within the system hence, increasing net points and good nanoparticle/polymer bonding
allowed for greater material recovery and expansion. 117, 118
Within the SiO2-loaded
nanocomposites, the fastest actuation was observed with 0.5% filler. At higher

79
concentrations (>1%), diameter recovery and shape memory of the composite decreased.
Due to its reduced molar mass, relatively high numbers of SiO2 nanoparticles were
required to achieve similar weight compositions to that of to Al2O3 and W, which
disrupted the polymer matrix and limited mobility at the nanoscale.
Figure 4.3: Actuation profiles of a) Al2O3, b) SiO2, and c) W nanocomposites in
50°C RO water. Original diameter of all foam cylinders was 4000 μm.

80
Volume recovery (%) and volume expansion (x) of the nanocomposites, Table
4.3, support the variations in shape memory behavior observed as a result of particle
type and concentration. Higher filler content SMP foams had greater shape recovery
relative to the uncompressed geometry and higher volume expansion compared to the
compressed foam. Low concentration (0.5%) W-loaded foams had a volume recovery of
53 ± 16% and volume expansion of 35 ± 16x. Increased filler concentration (3%)
resulted in greater recovery (96 ± 20%) and expansion (47 ± 17x). Similarly, Al2O3-
loaded foams had an increase in volume recovery from 23 ± 5% to 82 ± 13% at 0.5%
and 5% loadings, respectively. SiO2-loaded foams had the greatest volume recovery and
expansion for 0.5% at 77 ± 27% and 43 ± 11x, respectively. Bonding of SiO2 to the
polymer was decreased due to differences in hydrophobicity of the two components,
resulting in aggregate formation within the SMP foam. The presence of aggregates
disrupted the polymer matrix and resulted in lower shape recovery and longer actuation
times. Higher SiO2 filler loading restricted chain mobility and disrupted polymer-
polymer interactions, causing a diminished shape memory effect, as demonstrated by the
actuation profiles.

81
Table 4.3: Volume expansion (%) and volume recovery of various SMP
nanocomposites.
Composition Volume
Recovery (%)
Volume
Expansion (x)
Control 32 ± 5 18 ± 1
0.5% Al2O3 23 ± 5 17 ± 6
1% Al2O3 75 ± 12 27 ± 5
2% Al2O3 68 ± 13 41 ± 6
3% Al2O3 66 ± 12 36 ± 7
4% Al2O3 58 ± 11 33 ± 7
5% Al2O3 82 ± 13 42 ± 12
0.5% SiO2 77 ± 27 43 ± 11
1% SiO2 52 ± 16 31 ± 10
2% SiO2 40 ± 12 22 ± 6
0.5% W 53 ± 16 35 ± 16
1% W 45 ± 6 26 ± 7
2% W 83 ± 15 57 ± 7
3% W 96 ± 20 47 ± 17
4.3.4 Thermal stability and mechanical properties
Thermal characterization of the nanocomposites using TGA suggested improved
thermal stability of the SMP systems with the addition of Al2O3 and SiO2 fillers. Figure
4. 4 shows weight change (%) as a function of temperature for all SMP nanocomposites.
Al2O3 nanocomposites exhibited greater thermal stability with the addition of
nanoparticles, as compared to the control foam. The thermal decomposition temperature
of the alumina composites increased by 30°C, as shown by the midpoint of the weight
change curve, indicating improved thermal sensitivity of the polymer system. Silica-
loaded composites had a filler concentration-dependent increase in thermal
decomposition temperature. The control (unloaded) foam experienced decomposition at
300°C, which increased to 350°C with the 2% SiO2 nanocomposites. A 50°C increase in

82
thermal decomposition temperature is indicative of improved thermal resistance. W-
loaded SMP systems had minimal change in thermal stability compared to the control,
suggesting the requirement of higher filler loading to achieve thermally-resistive
nanocomposites.
Figure 4.4: Weight (%) versus temperature (°C) curves for a) Al2O3, b) SiO2 and c)
W nanocomposites. Al2O3 and SiO2 nanocomposites had increased thermal
stability, as indicated by an increase in thermal degradation temperature, while W
nanocomposites had minimal thermal improvement.

83
Mechanical analysis of the foams revealed improved toughness and composite
strength at low filler concentrations. Figure 4.5 shows ultimate tensile strength,
toughness, and strain at break for nanocomposites with the three fillers. SMP foams with
0.5% Al2O3 had the highest tensile strength (127 kPa) and toughness (347 J·m-3
)
compared to the control, which had a tensile strength and toughness of 84 kPa and 230
J·m-3
, respectively. Improved strength and toughness can be attributed to the
nanoparticle/polymer bonding where increased bonding results in greater mechanical
stability. 119, 120
The interactions between Al2O3 and the SMP allowed for the generation
of physical net points that resisted mechanical deformation more effectively than the
control systems. Additionally, 0.5% Al2O3-loaded foams had the highest strength and
toughness compared to all other nanocomposites. Higher concentrations (≥ 2%) of Al2O3
resulted in decreased strain at break compared to the control and other nanocomposite
systems. SiO2 and W-loaded foams had improved mechanical properties compared to the
control. In general, higher nanoparticle concentrations resulted in decreased strength and
toughness. However, toughness improved from 217 J·m-3
to 302 J·m-3
as SiO2
concentration increased from 0.5% to 1%.These results indicate that filler incorporation
into the SMP systems improved mechanical properties by reinforcing the polymer
matrix. Filler particles serve as physical crosslinks that improve thermal stability and
toughness of the composites, which is beneficial for the development of viable
biomedical implants. Furthermore, the nanocomposites were more resistant to tear
compared to control foams, indicating their potential for improved resilience to fracture
and shearing during device processing.
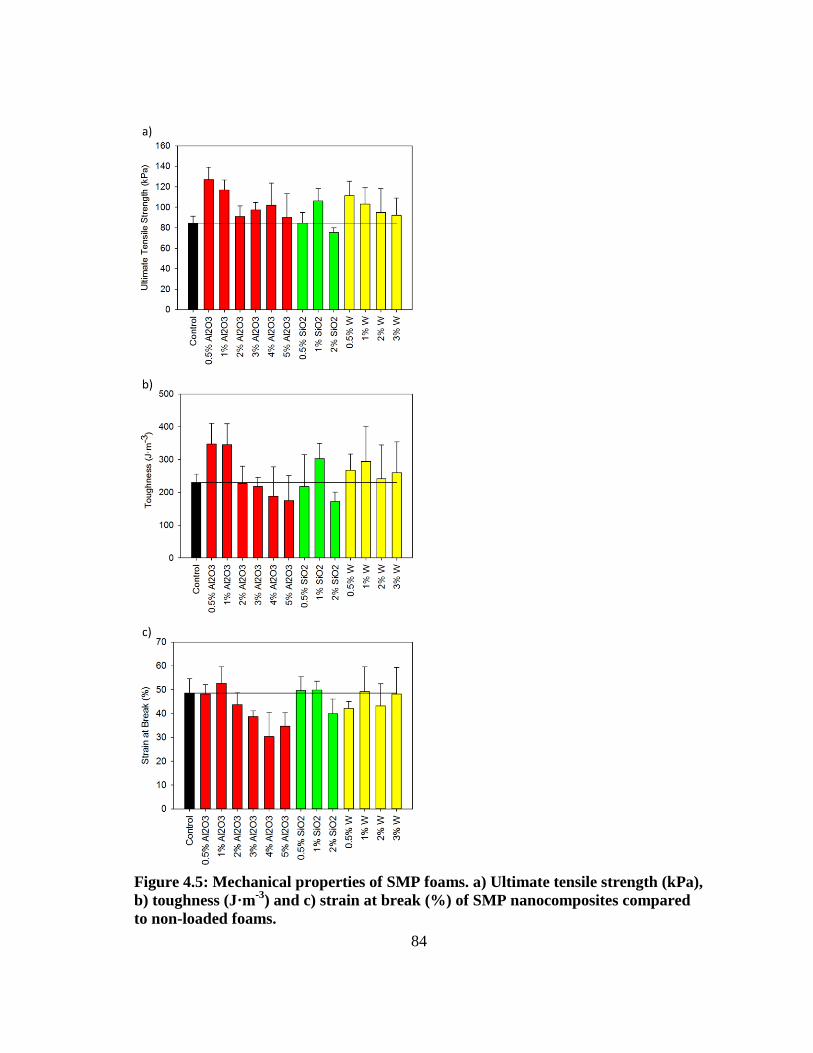
84
Figure 4.5: Mechanical properties of SMP foams. a) Ultimate tensile strength (kPa),
b) toughness (J·m-3
) and c) strain at break (%) of SMP nanocomposites compared
to non-loaded foams.

85
4.3.5 Particulates and leachables
Quantification of particulate matter is shown in Figure 4.6. Particulate analysis
of the nanocomposites indicated that the particulate levels were below the limits stated in
USP 788 for particles >10 μm and >25 μm. 121
Specifically, the limit for particles >10
μm is 6000, and the maximum value from any nanocomposite was 812 ± 201. Similarly,
the maximum value recorded for particles >25 μm was well below the threshold value of
600. This data indicates that there is minimal risk of producing dangerous levels of
emboli in the parent vessel of the aneurysm. Figure 4.6 shows that SiO2 nanocomposites
exhibited a general increase in particulate generation as weight percentage was
increased, while W and Al2O3 nanocomposites showed no discernible trend in
particulate generation for all size ranges. When compared to the control, the 0.5%
nanocomposites had lower or equivalent counts of particulates >10 μm. Assuming that
low particulate generation is associated with less brittle fracture and improved
mechanical properties, the results in Figure 4.6a agree with those in Figure 4.5a. For
both the Al2O3 and W nanocomposites, 0.5% concentrations resulted in increased
ultimate tensile strength and reduced particulates ≥10 μm (271 ± 61 and 340 ± 90 for
Al2O3 and W, respectively) compared to the control (360 ± 50). At low concentrations,
the nanoparticles provided mechanical reinforcement to the polymer system and yielded
comparable particulate counts to that of the control foams for particles ≥10 μm and ≥25
μm. Conversely, increased filler concentration lowered material toughness and resulted
in larger particulate counts.

86
Figure 4.6: Particlulate count of SMP nanocomposites and control. a) Threshold:
6000 particles ≥10 μm. b) Threshold: 600 particles ≥25 μm. All particulate testing
was conducted in compliance with USP 788.
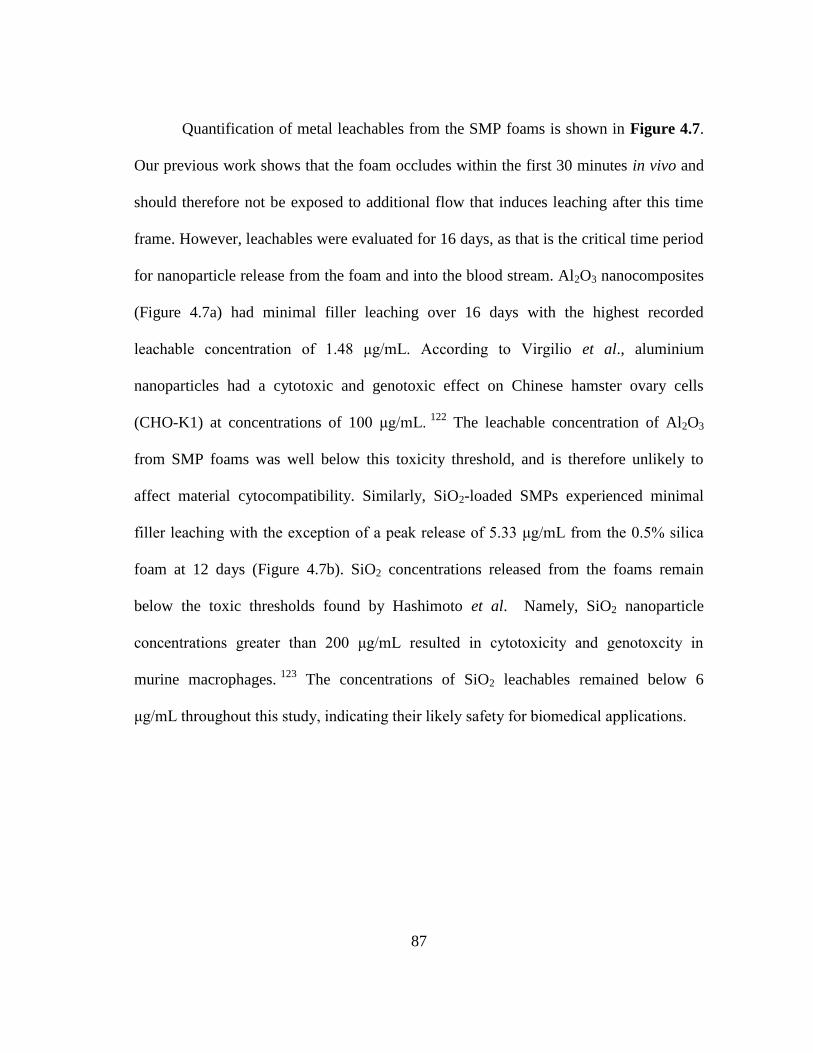
87
Quantification of metal leachables from the SMP foams is shown in Figure 4.7.
Our previous work shows that the foam occludes within the first 30 minutes in vivo and
should therefore not be exposed to additional flow that induces leaching after this time
frame. However, leachables were evaluated for 16 days, as that is the critical time period
for nanoparticle release from the foam and into the blood stream. Al2O3 nanocomposites
(Figure 4.7a) had minimal filler leaching over 16 days with the highest recorded
leachable concentration of 1.48 μg/mL. According to Virgilio et al., aluminium
nanoparticles had a cytotoxic and genotoxic effect on Chinese hamster ovary cells
(CHO-K1) at concentrations of 100 μg/mL. 122
The leachable concentration of Al2O3
from SMP foams was well below this toxicity threshold, and is therefore unlikely to
affect material cytocompatibility. Similarly, SiO2-loaded SMPs experienced minimal
filler leaching with the exception of a peak release of 5.33 μg/mL from the 0.5% silica
foam at 12 days (Figure 4.7b). SiO2 concentrations released from the foams remain
below the toxic thresholds found by Hashimoto et al. Namely, SiO2 nanoparticle
concentrations greater than 200 μg/mL resulted in cytotoxicity and genotoxcity in
murine macrophages. 123
The concentrations of SiO2 leachables remained below 6
μg/mL throughout this study, indicating their likely safety for biomedical applications.
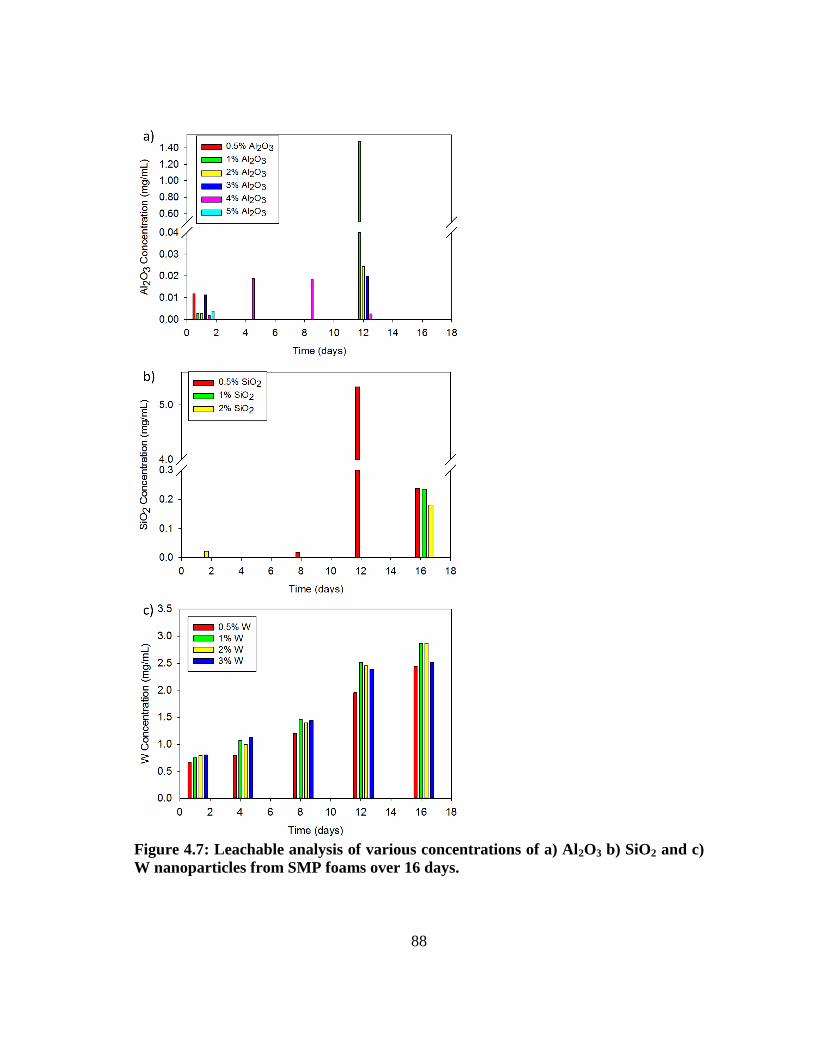
88
Figure 4.7: Leachable analysis of various concentrations of a) Al2O3 b) SiO2 and c)
W nanoparticles from SMP foams over 16 days.

89
W nanoparticles were increasingly released over 16 days with the maximum
concentration of 2.87 μg/mL (Figure 4.7c). Hussain et al. evaluated the cytotoxic effects
of W nanoparticles on rat liver cells. Nanoparticle concentrations below 100 μg/mL had
minimal effects on mitochondrial function and cellular morphology. 124
W release from
SMP foams are therefore unlikely induce cytotoxicity at the low concentrations recorded
here (< 3 μg/mL). While the leachable analysis is promising, further biocompatibility
studies are required with various cell types and animal models to fully understand the
effects of each of the three fillers on the metabolic activity of cells and their
accumulation in various organs.
The SMP nanocomposites developed in this study would serve as porous
polymer scaffolds for a foam-over-wire neurovascular embolic device. The
nanocomposites demonstrated tunable thermo-mechanical properties with minimal filler
leaching and particulate generation, well below the accepted threshold values, making
them optimal for implantable devices. Due to the low particulate count for all
nanocomposites, there is minimal risk of downstream embolization of the parent vessel
after foam-over-wire device deployment. Additionally, all nanocomposites maintained
their ultra-low densities and high porosities for large volumetric filling of the aneurysms
along with controllable actuation profiles that provide another degree of control over
device specification. Overall, these nanocomposites serve as a platform for device
design for neurovascular embolization and have strong indications as implantable
biomaterials.

90
4.4 Conclusions
SMP foams were fabricated with three different filler types (Al2O3, SiO2, W) at
varied concentrations to achieve tunable shape recovery, mechanical properties, and
thermal stability. Higher filler concentrations resulted in increased aggregate formation
in the polymer; however, the foams maintained the ultra-low density and high porosity
required for volumetric occlusion. Toughness and strain at break improved for the SMP
nanocomposites at low nanoparticle loadings with selected filler types (Al2O3 and SiO2).
Particulate generation increased at high filler concentrations, but all particulate counts
remained below the acceptable thresholds for USP 788. Filler leaching from the
nanocomposites was minimal relative to cytotoxic concentrations reported in literature,
indicating the safety of these SMP foams as biomaterials. The SMP nanocomposites
developed through this research have a potential to improve medical implants, pending
further investigation of in vivo biocompatibility and particle generation.

91
CHAPTER V
DEVELOPMENT OF SILOXANE-POLYETHYLENE GLYCOL
SURFACTANTS TO CONTROL SMP FOAM MORPHOLOGY
5.1 Introduction
Shape memory polymers (SMPs) are “smart” materials that have the capability of
shape change from a programmed secondary shape to a primary shape upon the input of
an external stimulus, such as heat, light, or electricity. 1-3
For thermal actuation, the
polymer can be synthesized in a primary shape, heated above its transition temperature
(Ttrans), and mechanically programmed into a secondary shape. 4 Once cooled below the
transition temperature, the material will remain in the secondary shape until it is heated
again to return to its original shape. 4 Shape fixity occurs when the polymer chains are
forced to align into conformations with net orientation and cooled below the actuation
transition to restrict chain mobility. 5 Entropic recovery to the polymer chain equilibrium
random orientation then drives the return to original shape. 5 Due to this shape memory
behavior, SMPs have a wide range of uses in medical and industrial applications, such as
vascular stents, occlusion devices, and self-controlled actuators. 1, 6
Polyurethanes are an extremely versatile class of polymers that have the
capability to be biocompatible, biodegradable, and have tunable mechanical
properties. 36
These characteristics make polyurethanes optimal for use in vivo. Wilson et
al. developed highly crosslinked, amorphous SMPs using aliphatic polyurethanes for use
in medical devices. 5 These materials have high recovery stresses due to a high level of
crosslinking, tunable Tg’s, and good shape recovery. 5 In an effort to increase the surface

92
area, Singhal et al. synthesized the polyurethane SMPs developed by Wilson as foams
with low density and high porosity. 19
Open-celled SMP foams provide a substrate for
increased cellular infiltration and adhesion, as well as flow stagnation and recirculation
zones, resulting in rapid formation of a stable thrombus upon contact with blood. 6, 37
Rodriguez et al. evaluated the biocompatibility of the SMP foams in a porcine model
and observed minimal inflammation at 90 days. 38
These properties make SMP foams
ideal for use as three-dimensional tissue scaffolds for biomedical applications.
Surfactants allow spreading at the polymer air interface via the Gibbs-Marangoni
effect. 125, 126
Namely, surfactants lower the surface tension at the polymer interface,
thereby causing flow from high surface tension areas to low surface tension areas. In
polyurethane foaming, surfactants stabilize individual foam cells through a change in the
surface tension gradient. 125
Polyurethane foams are fabricated by addition
polymerization of diisocyanates with alcohols. 49, 127
This foaming process occurs in four
steps: (i) bubble generation and growth, also known as the cream time; (ii) bubble
packing and cell stabilization; (iii) polymer stiffening and cell opening, or gel time; and
(iv) final curing, or tack-free time. Typically, surfactants used in flexible polyurethane
foaming systems do not alter the reaction kinetics of the process. However, in the
absence of surfactants, the foaming system will experience coalescence and eventual
collapse. 49
During foaming, the bubbles introduced into the system by mechanical
mixing will grow. As the volume fraction of the gas bubbles exceeds 74%, the spherical
bubbles distort into multisided polyhedrals with struts. Due to capillary pressure, the
pressure within the struts is lower than that in the cells. The pressure difference causes

93
the polymer liquid in the struts to drain. Without surfactants, this drainage rate will be
very fast, causing cell rupture and bubble coalescence. The surfactants are adsorbed at
the air-alcohol interface and have a significant effect on bubble generation, cell
stabilization, strut thickness, and final cell size, in addition to foam porosity. These
physical foam properties are of concern due of their effect on the mechanical properties
of the resulting polymer scaffold.
Silicone surfactants were first introduced in the 1950s for the development of
industrial-grade polyurethane foam. 50
They are surface active agents that lower the
interfacial surface tension and allow spreading. 50, 128
Typically, surfactants contain a
hydrophobic siloxane group attached to a hydrophilic polar molecule. 49, 129, 130
Siloxane-
based surfactants have three unique properties: (i) they maintain surface activity in both
water and non-aqueous systems, such as oil and polyols; (ii) they are able to lower
surface tension to as low as 20 mN/m; and (iii) they remain liquid at very high molecular
weights. 50
These unique properties are imparted by the siloxane backbone due to its low
glass transition temperature (Tg), its ability to stay liquid at high molecular weights, and
the presence of methyl groups that reduce surface tension. Hydrocarbon surfactants
containing alkyl hydrophobic groups with primarily –CH2– groups only lower surface
tension to 30 mN/m, making them less effective at allowing spreading at the interface. 50
Additionally, silicone surfactants have different aggregation properties from those of
hydrocarbon surfactants, such that they form bilayer phases and vesicles rather than
micelles and gel phases. 50, 131

94
This research focuses on developing linear surfactants for reliable production of
SMP foams with reproducible thermo-mechanical properties and cell structure. Siloxane
units served as the hydrophobic components, and polyethylene glycol (PEG) allyl
methyl ether acted as the hydrophilic constituent. Hydrosilylation was used to synthesize
the amphiphiles, which were then chemically and physically characterized. 50, 132-135
Then, polyurethane foams were fabricated with various surfactant concentrations, and
the effects of surfactant structure on foam morphology and thermal properties were
evaluated.
5.2 Materials and methods
1,1,1,3,5,5,5-heptamethyltrisiloxane (TS, 97%; Sigma-Aldrich Inc., St. Louis,
MO), poly(dimethylsiloxane), hydride terminated (PDMS, Mn ~580 Da; Sigma-Aldrich
Inc., St. Louis, MO), toluene (anhydrous, 99.8%; Sigma-Aldrich Inc., St. Louis, MO),
chloroform-d (CDCl3, 100%; Sigma-Aldrich Inc., St. Louis, MO), polyethylene glycol
allyl methyl ether – Polyglykol AM 350 (PEG-350, n = 8; Clariant, Charlotte, NC),
polyethylene glycol allyl methyl ether – Polyglykol AM 1100 (PEG-1100, n = 25;
Clariant, Charlotte, NC), platinum(0)-1,3-divinyl-1,1,3,3-tetramethyldisiloxane complex
solution (Karstedt’s catalyst, Pt; Sigma-Aldrich Inc., St. Louis, MO),
tris(triphenylphosphine)rhodium(I) chloride (Wilkinson’s catalyst, Rh; Sigma-Aldrich
Inc., St. Louis, MO), FisherbrandTM
activated carbon charcoal, 6 to 14 mesh (Fisher
Scientific, Pittsburgh, PA), N,N,N’,N’-tetrakis(2-hydroxypropyl)ethylenediamine
(HPED, 99%; Sigma-Aldrich Inc., St. Louis, MO), triethanolamine (TEA, 98%; Sigma-
Aldrich Inc., St. Louis, MO), trimethyl-1,6-hexamethylene diisocyanate, 2,2,4- and

95
2,4,4- mixture (TMHDI; TCI America Inc., Portland, OR), hexamethylene diisocyanate
(HDI; TCI America Inc., Portland, OR), T-131 (Air Products and Chemicals, Inc.
Allentown, PA), BL-22 (Air Products and Chemicals, Inc, Allentown, PA), Enovate
245fa blowing agent (Honeywell International, Inc., Houston, TX), 2-propanol 99%
(IPA; VWR, Radnor, PA) and deionized (DI) water (> 17 MΩ cm purity; Millipore
water purifier system, Millipore Inc., Billerica, MA) were used as received.
All reactions were conducted under a N2 atmosphere with a Teflon-covered stir
bar to agitate the reaction mixture. Chemical structures were confirmed using proton
nuclear magnetic resonance (1H NMR) spectroscopy using a Mercury 300 MHz
spectrometer operating in the Fourier transform mode with CDCl3 as the standard.
5.2.1 Synthesis of siloxane-polyethylene glycol ether amphiphiles
Siloxane-PEG amphiphiles were synthesized using the protocol detailed by
Murthy et al. 136
Figure 5.1 shows the reaction mechanism for the two siloxane units
with the appropriate synthetic parameters. Equimolar ratios of TS and PEG allyl methyl
ether (n = 8 or 25) were reacted to yield a siloxane-PEG amphiphile using Pt-catalyzed
hydrosilylation. Similarly, equimolar ratios of PDMS and PEG allyl methyl ether (n = 8
or 25) were reacted using Rh-catalyzed hydrosilylation. The reaction components were
added to a round-bottom (rb) flask equipped with a rubber stopper and heated to 80°C.
The reaction progressed for 12 hours, after which its completion was monitored with
Fourier transform infrared (FTIR) spectroscopy. An aliquot of the reaction solution was
placed on a KBr plate, and the FTIR spectrum was obtained. The disappearance of the
Si-H peak at 2155 cm-1
suggested complete functionalization. The catalyst was removed

96
from the product by refluxing the reaction mixture with activated charcoal for 12 hours.
The final product was isolated by vacuum filtration and removal of volatiles under
reduced pressure.
Figure 5.1: Hydrosilyation reaction schematic of a) trisiloxane and b)
poly(dimethylsiloxane) hydride terminated with poly(ethylene glycol) allyl methyl
ether (n = 8 or 25).

97
TS (1 mol eq.), PEG allyl methyl ether (n = 8) (1 mol eq.), and 0.003 mol eq. of
Karstedt’s catalyst were reacted using hydrosilylation in 0.0006 M toluene. The final
liquid product, TS-PEG(350), was purified with a yield of 93%. 1H NMR (δ, ppm): -0.2-
0.26 (m, 3H, SiCH3), 0.42 (m, 2H, SiCH2CH2), 1.59 (m, 2H, SiCH2CH2), 3.4 (t, 3H,
OCH3), 3.5-3.8 (m, 2H, OCH2CH2).
TS (1 mol eq.), PEG allyl methyl ether (n = 25) (1 mol eq.), and 0.004 mol eq. of
Karstedt’s catalyst were reacted using hydrosilylation in 0.0003 M toluene. The final
solid product, TS-PEG(1100), was purified with a yield of 93%. 1H NMR (δ, ppm): -
0.01-0.26 (m, 3H, SiCH3), 0.42 (m, 2H, SiCH2CH2), 1.59 (m, 2H, SiCH2CH2), 3.4 (t,
3H, OCH3), 3.5-3.8 (m, 2H, OCH2CH2).
PDMS (1 mol eq.), PEG allyl methyl ether (n = 8) (1 mol eq.), and 0.0007 mol
eq. of Wilkinson’s catalyst were reacted using hydrosilylation in 0.0002 M toluene. The
final liquid product, PDMS-PEG(350), was purified with a yield of 93%. 1H NMR (δ,
ppm): -0.15-0.65 (m, 3H, SiCH3), 0.95 (m, 2H, SiCH2CH2), 1.6 (m, 2H, SiCH2CH2), 3.4
(m, 3H, OCH3), 3.5-4.6 (m, 2H, OCH2CH2).
PDMS (1 mol eq.), PEG allyl methyl ether (n = 25) (1 mol eq.), and 0.0007 mol
eq. of Wilkinson’s catalyst were reacted using hydrosilylation in 0.0001 M toluene. The
final solid product, PDMS-PEG(350), was purified with a yield of 97%. 1H NMR (δ,
ppm): -0.18-0.56 (m, 3H, SiCH3), 0.50 (m, 2H, SiCH2CH2), 1.59 (m, 2H, SiCH2CH2),
3.4 (m, 3H, OCH3), 3.5-4.34 (m, 2H, OCH2CH2).

98
5.2.2 FTIR
1-2 drops of the product were placed on a KBr plate, and FTIR spectra were
collected using a Bruker ALPHA Infrared Spectrometer (Bruker, Billerica, MA). Thirty-
two background scans of the blank KBr plate were taken followed by sixty-four sample
scans of the various surfactant compositions. FTIR spectra were collected in absorption
mode at a resolution of 4 cm-1
. OPUS software (Bruker, Billerica, MA) was utilized to
subtract the background scans from the spectra, to conduct a baseline correction for IR
beam scattering, and to perform an atmospheric compensation to remove carbon dioxide
peaks. Each composition was measured three times.
5.2.3 Rheometry
A simple shear test was conducted on 1 mL of each surfactant type using a
Physica MCR 301 (Anton Paar USA Inc., Ashland, VA). Viscosity was measured under
a controlled shear rate of 50 s-1
for 120 seconds (6 second intervals, 20 points) for each
surfactant. For solid surfactants, the rheometer plate was heated to 40 ± 0.03°C during
each run. Viscosity (ɳ) was evaluated using the RheoCompass software (Anton Paar
USA Inc., Ashland, VA).
5.2.4 Surface tension
Hydrostatic surface tension measurements of surfactants were carried out using a
KSV CAM-2008 Contact Angle Analyzer (KSV Instruments, Ltd., Helsinki, Finland). A
5 μL drop of surfactant was ejected from the tip of the syringe. The drop was allowed to
reach equilibrium for 60 seconds, and surface tension was measured using an Attension
Tensometer and the Attension Theta software package (Biolin Scientific, Stockholm,
99
Sweden). Surface tension measurements were collected (n = 3) and presented as the
measurement average.
5.2.5 Mass spectrometry
Matrix-assisted laser desorption ionization (MALDI) experiments were
performed on a Voyager DE-STR mass spectrometer (Applied Biosystems, Foster City,
CA) under optimized conditions in positive linear mode. Ions were generated by a
pulsed nitrogen laser at 337 nm and accelerated through 25 kV and 100 laser shots were
used per spectrum. trans-2-[3-(4-t-Butylphenyl)-2-methyl-2-propenylidene]malononitrile
(DCTB) and potassium trifluoroacetate (KTFA) were used as a matrix and cationization
reagent, respectively. The surfactant samples, KTFA, and matrix were prepared at
concentration of 1, 10, and 20 mg/mL, respectively. The sample solution was mixed with
the matrix and KTFA at a volume ratio of 1:5:1. About 0.5 μL of this mixture was
deposited on a stainless steel sample holder. After being allowed to air-dry, the sample
was analyzed using MALDI-TOF MS. Mass spectra for all samples were analyzed using
5.2.6 Synthesis of SMP foams
SMP foams were synthesized using the three-step protocol described in previous
work. 98, 114
First, an isocyanate (NCO) prepolymer was synthesized with appropriate
molar ratios of HPED, TEA, HDI, and TMHDI. These prepolymers were allowed to
react for 32 hours with a temperature ramp from room temperature to 50°C and back to
room temperature. Next, a hydroxyl (OH) mixture was blended with the remaining
molar equivalants of HPED and TEA. This mixture also contained DI water and
catalysts. The NCO prepolymer and the OH mixture were combined along with a
100
physical blowing agent, Enovate, and each of the newly synthesized surfactants, TS-
PEG(350), TS-PEG(1100), PDMS-PEG(350), and PDMS-PEG(1100). This mixture was
mixed in a FlackTek speedmixer (FlackTek, Inc., Landrum, SC) and poured into a mold.
The foam was allowed to cure at 90°C for 20 minutes before cooling to room
temperature for further processing. Table 5.1 shows the weight percent of each
component used for foam synthesis. Multiple foams were synthesized with varied
concentrations of each surfactant type.
Foams were mechanically programmed by heating them to 90°C and
compressing them using a Carver press (Carver, Inc., Wabash, IN). Once cooled, the
foams were cleaned using two 15 minute cycles of isopropyl alcohol and four 15 minute
cycles of reverse osmosis water under sonication. The foams were placed in aluminum
pans and frozen overnight at -20°C. A FreeZone 6 (Labconco, Kansas City, MO) freeze-
dryer was used to remove all water from the cleaned foams, after which they were dried
overnight under vacuum at 50°C prior to characterization.
5.2.7 Density
Density measurements were conducted on foam blocks acquired from the top,
middle, and bottom sections of foams, as outlined in ASTM standard D-3574. 137
The
length, width, and height of the cube was measured, the mass of the sample was
recorded, and density was calculated in g·cm-3
. Each foam block was measured three
times.
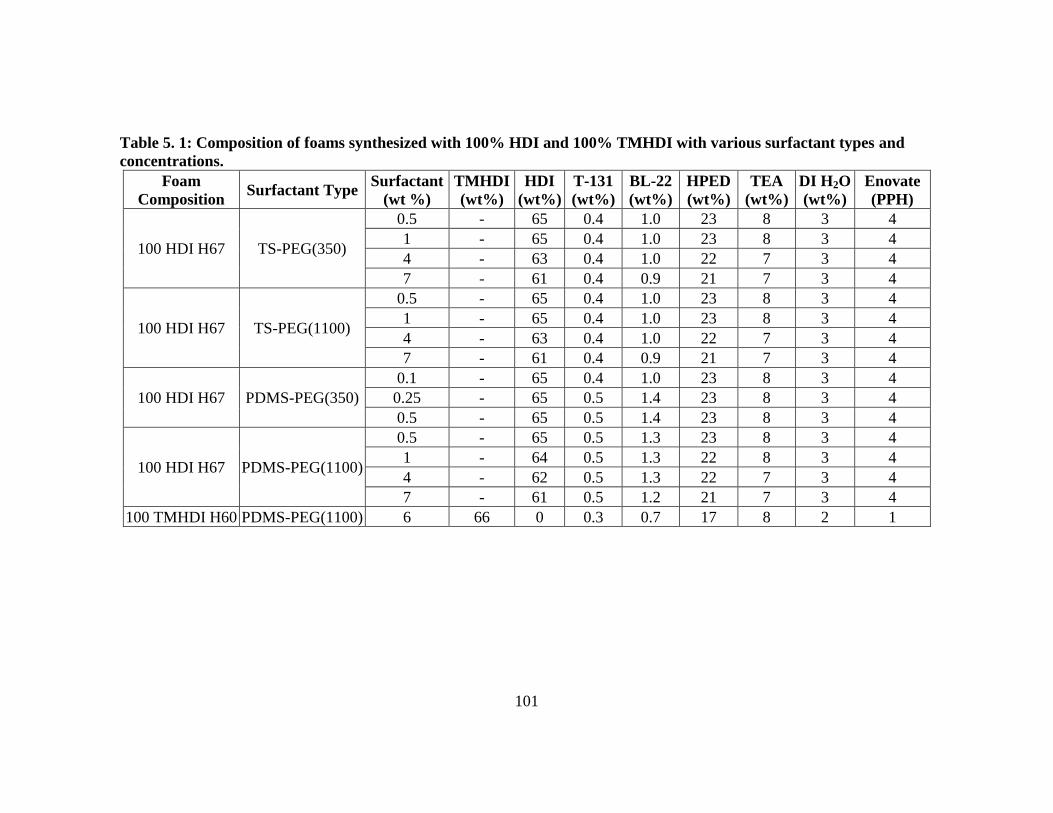
101
Table 5. 1: Composition of foams synthesized with 100% HDI and 100% TMHDI with various surfactant types and
concentrations.
Foam
Composition Surfactant Type
Surfactant
(wt %)
TMHDI
(wt%)
HDI
(wt%)
T-131
(wt%)
BL-22
(wt%)
HPED
(wt%)
TEA
(wt%)
DI H2O
(wt%)
Enovate
(PPH)
100 HDI H67 TS-PEG(350)
0.5 - 65 0.4 1.0 23 8 3 4
1 - 65 0.4 1.0 23 8 3 4
4 - 63 0.4 1.0 22 7 3 4
7 - 61 0.4 0.9 21 7 3 4
100 HDI H67 TS-PEG(1100)
0.5 - 65 0.4 1.0 23 8 3 4
1 - 65 0.4 1.0 23 8 3 4
4 - 63 0.4 1.0 22 7 3 4
7 - 61 0.4 0.9 21 7 3 4
100 HDI H67 PDMS-PEG(350)
0.1 - 65 0.4 1.0 23 8 3 4
0.25 - 65 0.5 1.4 23 8 3 4
0.5 - 65 0.5 1.4 23 8 3 4
100 HDI H67 PDMS-PEG(1100)
0.5 - 65 0.5 1.3 23 8 3 4
1 - 64 0.5 1.3 22 8 3 4
4 - 62 0.5 1.3 22 7 3 4
7 - 61 0.5 1.2 21 7 3 4
100 TMHDI H60 PDMS-PEG(1100) 6 66 0 0.3 0.7 17 8 2 1

102
5.2.8 SEM
Cell structure was determined by cutting thin slices of the bulk foam in the axial
and transverse direction. Samples were acquired from the top, middle, and bottom
sections of each foam. The samples were mounted onto a stage and sputter coated with
gold for 60 seconds at 20 mA using a Cressington sputter coater (Ted Pella, Inc.,
Redding, CA). The samples were then visualized using a Joel NeoScope JCM-5000
scanning electron microscope (Nikon Instruments, Inc., Melville, NY) at 15x
magnification under high vacuum and 5-10 kV.
5.2.9 Strut thickness
Strut thickness was measured by cutting thin slices of bulk foams in the axial
direction and imaging the samples in the brightfield mode using a Leica MZ8
microscope (Leica Microsystems, Wetzlar, Germany) with RSImage software
(Photometrics, Tucson, AZ). Foam images were analyzed using ImageJ software (NIH,
Bethesda, MD) where strut thickness was measured in microns for each foam
composition.
5.2.10 Thermal transition
The glass transition temperature (Tg) of the foams (n = 5) was determined under
dry and wet conditions. For dry Tg, foam samples (3-8 mg) were stored in a dry
container with desiccant prior to analysis. A Q-200 differential scanning calorimeter
(DSC) (TA Instruments, Inc., New Castle, DE) was used to obtain foam thermograms.
The first cycle consisted of decreasing the temperature to -40°C at 10°C·min-1
and
holding it isothermally for 2 minutes. The temperature was then increased to 120°C at

103
10°C·min-1
and held isothermally for 2 minutes. In the second cycle, the temperature
was reduced to -40°C at 10°C·min-1
, held isothermally for 2 minutes, and raised to
120°C at 10°C·min-1
. Tg was recorded from the second cycle based on the inflection
point of the thermal transition curve using TA Instruments software (TA Instruments,
Inc., New Castle, DE). The aluminum tin was not vented during this step. For wet Tg,
foam samples (3-8 mg) were submerged in RO water at 50°C for 5 minutes to allow full
plasticization. After the samples were removed from water, they were pressed dry with
Kimwipes (Kimberly-Clark Professionals, Roswell, GA), weighed, and placed in an
aluminum pan sealed with a vented aluminum lid. A Q-200 DSC was used to cool the
samples to -40°C, hold them isothermally for 2 minutes, and heat them to 80°C at
10°C·min-1
. TA Instruments software (TA Instruments, Inc., New Castle, DE) was used
to generate the thermogram and acquire the Tg after water plasticization using the
average inflection point of the thermal transition.
5.2.11 Actuation studies
Cylindrical foam samples (n = 3) with a diameter of 4 mm and a height of 1 cm
were cut. A 203.20 μm diameter nickel-titanium (Nitinol) wire (NDC, Fremont, CA) was
inserted through the center of the sample along its length to serve as a stabilizer. The
foam samples were radially compressed to their smallest possible diameter using a ST
150-42 stent crimper (Machine Solutions, Flagstaff, AZ) by heating the material to
100°C, holding it isothermally for 15 minutes, and programming the foams to the
crimped morphology. Initial foam diameter was measured and recorded for each sample
using Image J software. The foams were placed in a water bath at 37°C, and images
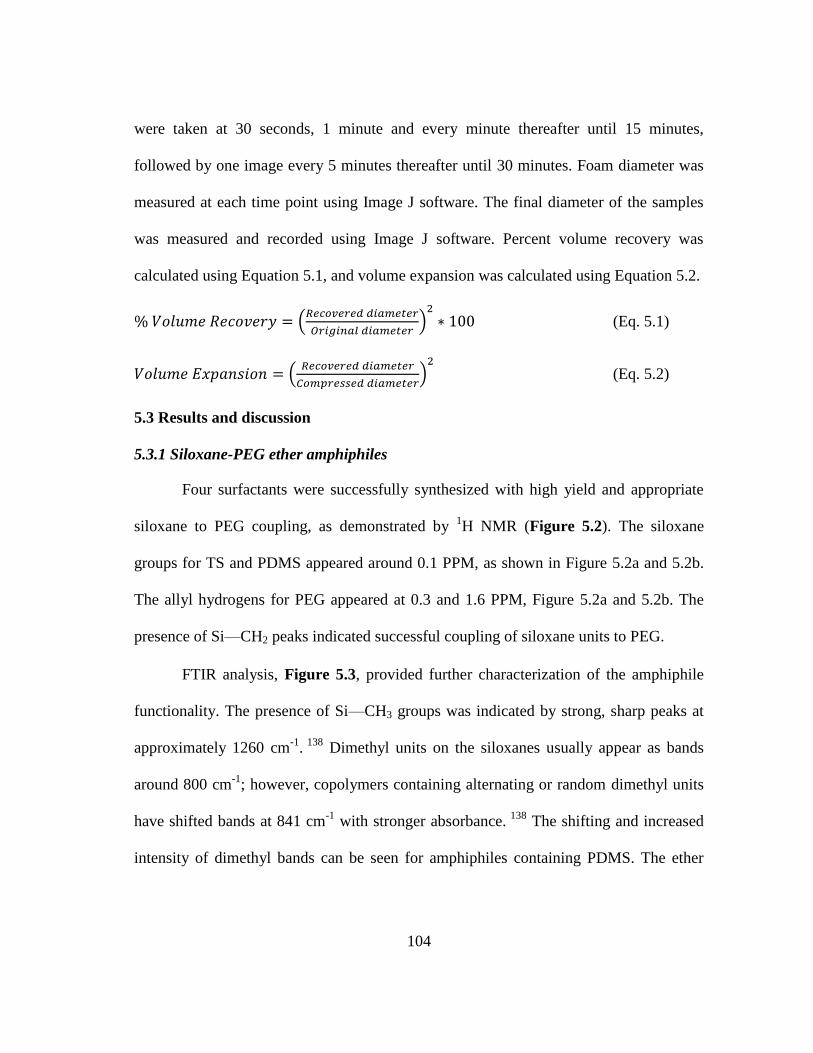
104
were taken at 30 seconds, 1 minute and every minute thereafter until 15 minutes,
followed by one image every 5 minutes thereafter until 30 minutes. Foam diameter was
measured at each time point using Image J software. The final diameter of the samples
was measured and recorded using Image J software. Percent volume recovery was
calculated using Equation 5.1, and volume expansion was calculated using Equation 5.2.
% 𝑉𝑜𝑙𝑢𝑚𝑒 𝑅𝑒𝑐𝑜𝑣𝑒𝑟𝑦 = (𝑅𝑒𝑐𝑜𝑣𝑒𝑟𝑒𝑑 𝑑𝑖𝑎𝑚𝑒𝑡𝑒𝑟
𝑂𝑟𝑖𝑔𝑖𝑛𝑎𝑙 𝑑𝑖𝑎𝑚𝑒𝑡𝑒𝑟)
2
∗ 100 (Eq. 5.1)
𝑉𝑜𝑙𝑢𝑚𝑒 𝐸𝑥𝑝𝑎𝑛𝑠𝑖𝑜𝑛 = (𝑅𝑒𝑐𝑜𝑣𝑒𝑟𝑒𝑑 𝑑𝑖𝑎𝑚𝑒𝑡𝑒𝑟
𝐶𝑜𝑚𝑝𝑟𝑒𝑠𝑠𝑒𝑑 𝑑𝑖𝑎𝑚𝑒𝑡𝑒𝑟)
2
(Eq. 5.2)
5.3 Results and discussion
5.3.1 Siloxane-PEG ether amphiphiles
Four surfactants were successfully synthesized with high yield and appropriate
siloxane to PEG coupling, as demonstrated by 1H NMR (Figure 5.2). The siloxane
groups for TS and PDMS appeared around 0.1 PPM, as shown in Figure 5.2a and 5.2b.
The allyl hydrogens for PEG appeared at 0.3 and 1.6 PPM, Figure 5.2a and 5.2b. The
presence of Si—CH2 peaks indicated successful coupling of siloxane units to PEG.
FTIR analysis, Figure 5.3, provided further characterization of the amphiphile
functionality. The presence of Si—CH3 groups was indicated by strong, sharp peaks at
approximately 1260 cm-1
. 138
Dimethyl units on the siloxanes usually appear as bands
around 800 cm-1
; however, copolymers containing alternating or random dimethyl units
have shifted bands at 841 cm-1
with stronger absorbance. 138
The shifting and increased
intensity of dimethyl bands can be seen for amphiphiles containing PDMS. The ether

105
functionality (C—O) from PEG appears around 1111 cm-1
while additional methyl (C—
H) peaks occur at 2877 cm-1
(PEG) and 2957 cm-1
(siloxanes).
Figure 5.2: 1H NMR spectra of the siloxane-PEG surfactants. a) TS-PEG (n = 8 or
25) and b) PDMS-PEG (n = 8 or 25).

106
Figure 5.3: Transmission FTIR spectra of the four siloxane-PEG surfactants. a) TS-
based and b) PDMS-based surfactants with key peaks highlighting siloxane and
PEG coupling.

107
Figure 5.3a shows successful coupling of TS to PEG due to the Si-H peak
removal at 2155 cm-1
for TS-PEG(350) and TS-PEG(1100) along with presence of C—
O and R—Si—O peaks at 1111 and 1031 cm-1
, respectively. PDMS-based surfactants
demonstrate similar peak shifts that indicate coupling, Figure 5.3b.
Characterization of the rheological changes for each amphiphile is shown in
Table 5.2. Molecular weight played a major role in changing the surfactant viscosity.
Lower molecular weight amiphiphiles, TS-PEG(350) and PDMS-PEG(350), had lower
viscosities of 9.60 ± 0.02 mPa·s and 66.27 ± 0.03 mPa·s, respectively. The sharp
increase in viscosity for PDMS-PEG(350) compared to its trisiloxane counterpart is
attributed to the high molecular weight of (~580 Da) of PDMS relative to that of
trisiloxane (222 Da). Furthermore, TS-PEG(1100) and PDMS-PEG(1100) have higher
viscosities of 75.69 ± 0.10 mPa·s and 169.00 ± 0.12 mPa·s, respectively. The long chain
lengths of PEG(1100) and PDMS contributed to the higher viscosities compared to
lower molecular weight counterparts.
Table 5. 2: Rheological and surface tension properties of the various siloxane-PEG
surfactants.
Surfactant Viscosity (mPa·s) Surface Tension (mN/m)
TS-PEG(350) 9.6 ± 0.1 21.0 ± 0.1
TS-PEG(1100) 75.7 ± 0.1 20.1 ± 0.3
PDMS-PEG(350) 66.3 ± 0.1 21.3 ± 0.1
PDMS-PEG(1100) 169.0 ± 0.1 20.3 ± 0.1

108
Surfactant surface tensions were comparable to that of commercially-available
surfactants utilized in polyurethane foam synthesis, with values ranging between 20-21
mN/m, Table 5.2. These surface tension values are indicative of the ability of these
surfactants to generate a surface tension gradient and thereby serve as cell stabilizers for
polyurethane foam blowing.
Mass spectrometry (Figure 5.4) provided an additional measure to evaluate
amphiphile generation from siloxane-PEG coupling. Figure 5.4a shows the typical mass-
to-charge (m/z) peaks for the polyether units that are prevalent in PEG. Hydrosilyation
of trisiloxane to PEG resulted in a shift in the m/z peaks to higher weights of 626 Da
compared to the original weight of 417 Da for PEG(350). Similarly, trisiloxane coupling
generated an increased molecular weight of TS-PEG(1100) (1286 Da) compared to that
of PEG(1100) (1080 Da), Figure 5.4b. Trisiloxane is a low molecular weight monomer
which ionized while coupled to PEG, resulting in peak shifts to higher molecular
weights. In contrast, PDMS-coupled surfactants did not demonstrate molecular weight
shifts due to the high molecular weight of PDMS which ionized separately from the PEG
constituents. However, peaks for PEG still appear for PDMS-based surfactants (Figure
5.4c and 5.4d), indicating successful coupling of the two surfactant components.
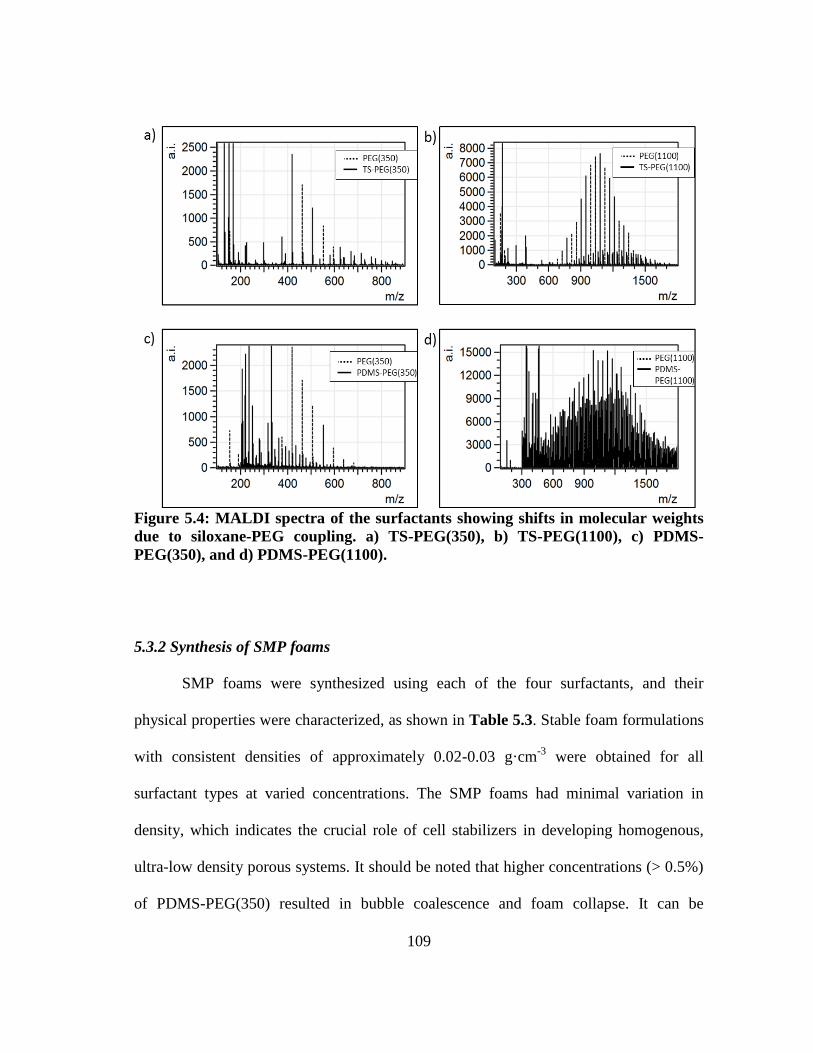
109
Figure 5.4: MALDI spectra of the surfactants showing shifts in molecular weights
due to siloxane-PEG coupling. a) TS-PEG(350), b) TS-PEG(1100), c) PDMS-
PEG(350), and d) PDMS-PEG(1100).
5.3.2 Synthesis of SMP foams
SMP foams were synthesized using each of the four surfactants, and their
physical properties were characterized, as shown in Table 5.3. Stable foam formulations
with consistent densities of approximately 0.02-0.03 g·cm-3
were obtained for all
surfactant types at varied concentrations. The SMP foams had minimal variation in
density, which indicates the crucial role of cell stabilizers in developing homogenous,
ultra-low density porous systems. It should be noted that higher concentrations (> 0.5%)
of PDMS-PEG(350) resulted in bubble coalescence and foam collapse. It can be

110
hypothesized that above 0.5% concentration, PDMS-PEG(350) reached the critical
micelle concentration (CMC). Above the CMC, surfactant/polymer interactions are
disrupted, and surfactant molecules interact with each other, causing micelle formation
that prevents the surfactants from providing phase stability. Alternatively, incomplete
functionalization of the PDMS-based surfactants could result in irregular pore sizes due
to varying polymer interfacial surface tension. Further work characterizing potential side
products must be conducted on the PDMS-PEG surfactants to determine purity.
Table 5. 3: Key physical properties of SMP foams synthesized using siloxane-PEG
surfactants.
Surfactant
Type
Foam
Composition
Surfactant
(wt %)
Density
(g·cm-3
)
Dry
Tg
(°C)
Wet
Tg
(°C)
Volume
Recovery
(%)
Volume
Expansion
(x)
TS-
PEG(350) 100 HDI H67
0.5 0.017 ± 0.001
52 ± 2 16 ± 2 103 ± 11 23 ± 3 4 0.024 ± 0.002
7 0.028 ± 0.004
TS-
PEG(1100) 100 HDI H67
0.5 0.019 ± 0.001
51 ± 2 16 ± 2 100 ± 18 22 ± 4 4 0.028 ± 0.002
7 0.026 ± 0.004
PDMS-
PEG(350) 100 HDI H67
0.1 0.018 ± 0.009
53 ± 3 17 ± 2 77 ± 5 21 ± 6 0.25 0.025 ± 0.002
0.5 0.019 ± 0.001
PDMS-
PEG(1100)
100 HDI H67
0.5 0.022 ± 0.003
48 ± 1 17 ± 1 93 ± 14 32 ± 10 4 0.016 ± 0.001
7 0.017 ± 0.001
100 TMHDI
H60 6 0.024 ± 0.002 57 ± 1 32 ± 1 110 ± 1 17 ± 4
Physical properties of the SMP foams fabricated with the four siloxane-based
surfactants had minimal variation as a function of surfactant type, Table 5.3. 100% HDI
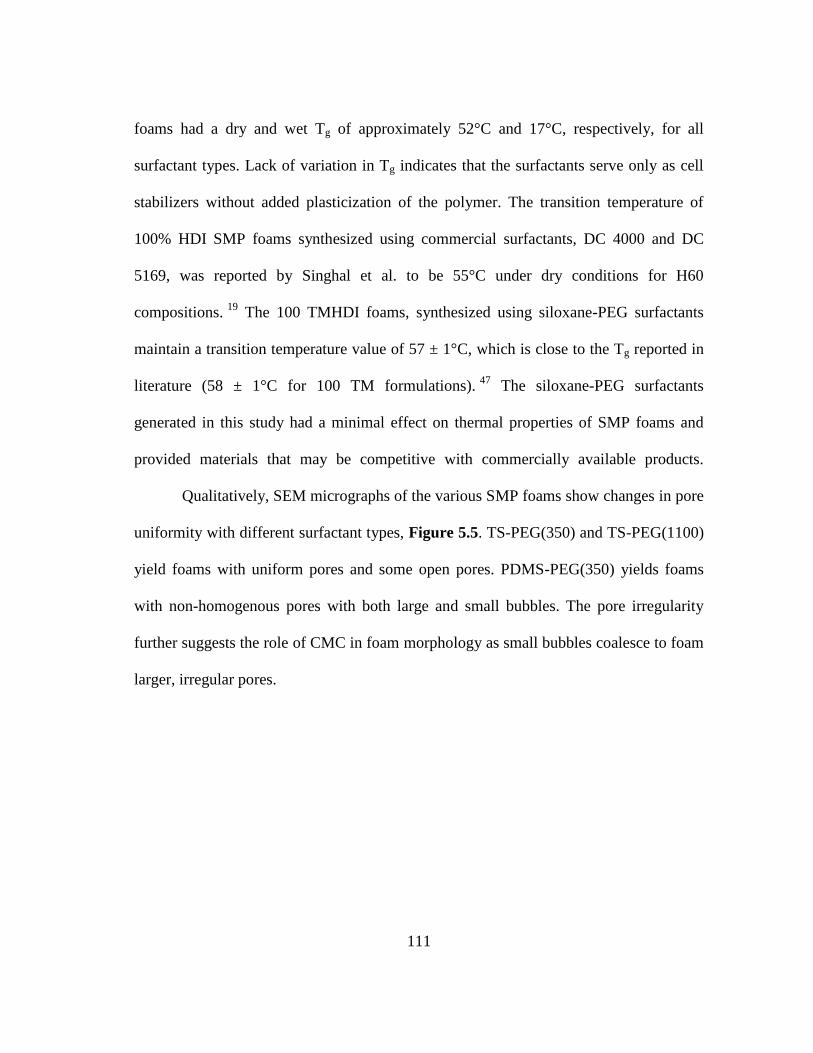
111
foams had a dry and wet Tg of approximately 52°C and 17°C, respectively, for all
surfactant types. Lack of variation in Tg indicates that the surfactants serve only as cell
stabilizers without added plasticization of the polymer. The transition temperature of
100% HDI SMP foams synthesized using commercial surfactants, DC 4000 and DC
5169, was reported by Singhal et al. to be 55°C under dry conditions for H60
compositions. 19
The 100 TMHDI foams, synthesized using siloxane-PEG surfactants
maintain a transition temperature value of 57 ± 1°C, which is close to the Tg reported in
literature (58 ± 1°C for 100 TM formulations). 47
The siloxane-PEG surfactants
generated in this study had a minimal effect on thermal properties of SMP foams and
provided materials that may be competitive with commercially available products.
Qualitatively, SEM micrographs of the various SMP foams show changes in pore
uniformity with different surfactant types, Figure 5.5. TS-PEG(350) and TS-PEG(1100)
yield foams with uniform pores and some open pores. PDMS-PEG(350) yields foams
with non-homogenous pores with both large and small bubbles. The pore irregularity
further suggests the role of CMC in foam morphology as small bubbles coalesce to foam
larger, irregular pores.
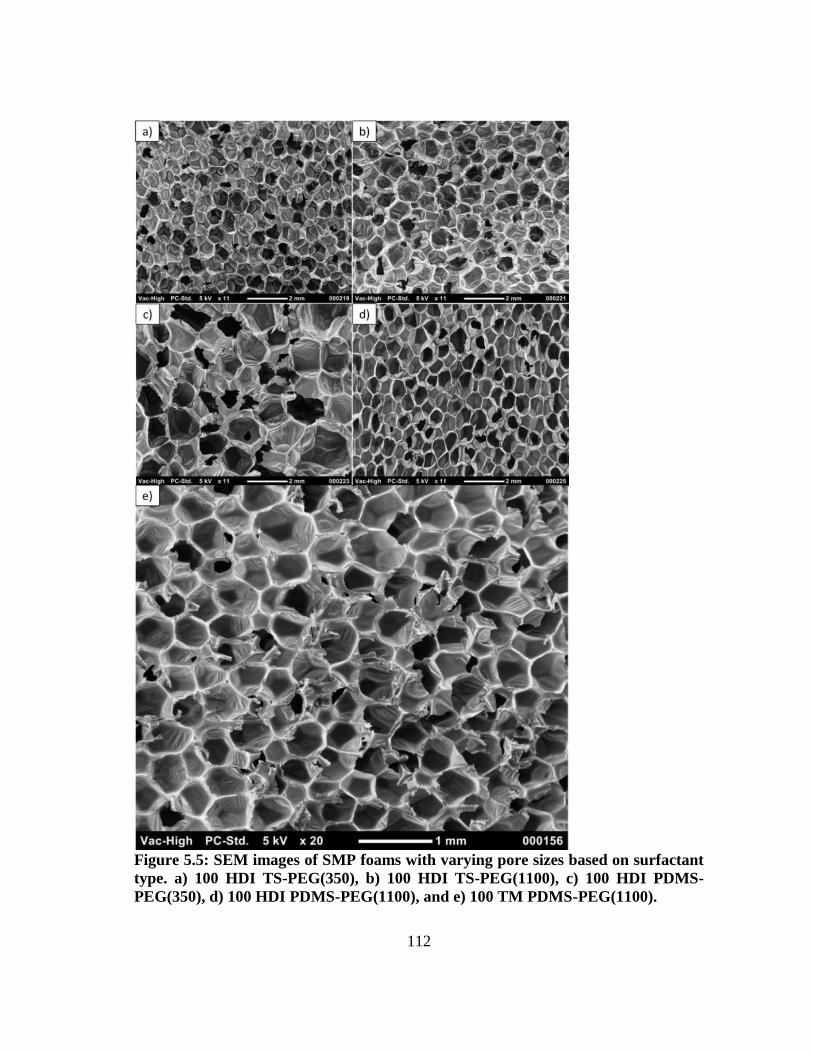
112
Figure 5.5: SEM images of SMP foams with varying pore sizes based on surfactant
type. a) 100 HDI TS-PEG(350), b) 100 HDI TS-PEG(1100), c) 100 HDI PDMS-
PEG(350), d) 100 HDI PDMS-PEG(1100), and e) 100 TM PDMS-PEG(1100).

113
PDMS-PEG(1100) also yielded uniform pores with mostly closed cells.
Surfactants that resulted in smaller pores provided more consistent bulk foams. Smaller
pores are potentially a result of improved cell stability during foam blowing, as the
surfactant stabilizes the small pores upon generation and prevents them from coalescing
into larger pores. Due to the desirable foam morphology of PDMS-PEG(1100)-based
foams, alternative polymer compositions, containing 100% TMHDI, were pursued to test
surfactant viability for different systems. Ultra-low densities are maintained with the
TMHDI foam compositions, and SEM images demonstrate uniform pores (Table 5.3,
Figure 5.5e). These results indicate the suitability of PDMS-PEG(1100) as a surfactant
for various polyurethane systems. Foam pore sizes were also affected by surfactant type
and concentration, Figure 5.6. At low trisiloxane-based surfactant concentrations (0.5-
1%), the foam pore sizes are larger (> 3000 μm) compared to higher concentrations of
4% and 7%, where the pore sizes decrease to approximately 2000 μm, Figure 5.6a and
5.6b. Alternatively, for PDMS-based surfactants, the pore sizes remain fairly consistent
around 1500-2000 μm with no discernable trend, Figure 5.6c and 5.6d.
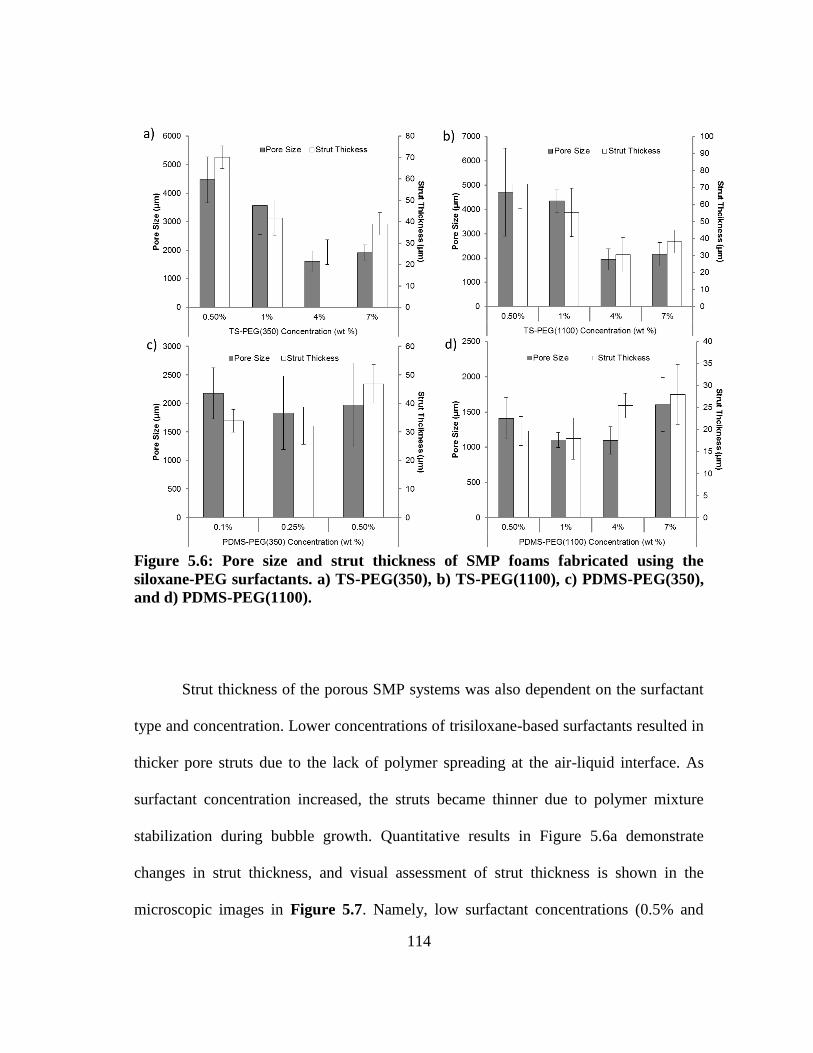
114
Figure 5.6: Pore size and strut thickness of SMP foams fabricated using the
siloxane-PEG surfactants. a) TS-PEG(350), b) TS-PEG(1100), c) PDMS-PEG(350),
and d) PDMS-PEG(1100).
Strut thickness of the porous SMP systems was also dependent on the surfactant
type and concentration. Lower concentrations of trisiloxane-based surfactants resulted in
thicker pore struts due to the lack of polymer spreading at the air-liquid interface. As
surfactant concentration increased, the struts became thinner due to polymer mixture
stabilization during bubble growth. Quantitative results in Figure 5.6a demonstrate
changes in strut thickness, and visual assessment of strut thickness is shown in the
microscopic images in Figure 5.7. Namely, low surfactant concentrations (0.5% and

115
1%) (Figure 5.6a) of TS-PEG(350) yielded foams with strut diameters of 70 μm ± 5 and
42 μm ± 8, respectively. At higher concentrations of 4% and 7%, the strut thicknesses
were reduced to approximately 30 μm (Figure 5.6a). Similar trends were noted with TS-
PEG(1100) foams. At 0.5% PDMS-PEG(350), the strut thickness slightly increased due
to cell destabilization, however no definite trend could be established. (Figure 5.6c and
5.7c). As shown in Figures 5.6d and 5.7d, minimal changes in strut diameter were
observed with increasing concentration for PDMS-PEG(1100), where struts were
approximately 22 μm over the range of surfactant concentrations. There was no trend in
strut thickness for SMP foams synthesized using PDMS-based surfactants. However,
controlling the strut thickness could potentially provide an alternative route to tuning the
mechanical properties of the scaffolds, as thicker struts are hypothesized to result in
mechanically robust systems.
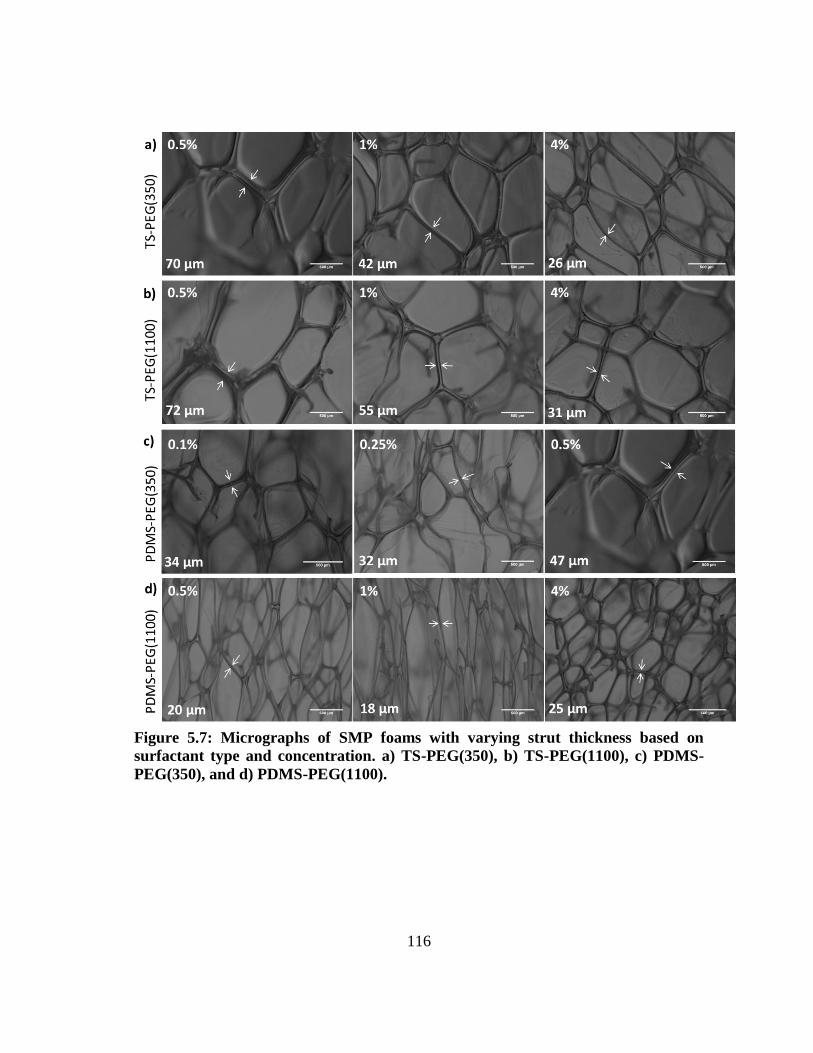
116
Figure 5.7: Micrographs of SMP foams with varying strut thickness based on
surfactant type and concentration. a) TS-PEG(350), b) TS-PEG(1100), c) PDMS-
PEG(350), and d) PDMS-PEG(1100).

117
Figure 5.8: Actuation profiles of SMP foams synthesized with siloxane-PEG
surfactants.
Further characterization of the actuation profiles of the SMP foams showed the
foams synthesized using trisiloxane-based surfactants actuated fully within the first 3
minutes of exposure to physiological temperatures in an aqueous environment, Figure
5.8. The volume recovery of these foam compositions was 100%, which is indicative of
their rapid shape memory behavior, Table 5.3.2. Due to the hydrophilic nature of HDI,
the rapid actuation and high volume recovery is an expected outcome. However, PDMS-
PEG(350) SMP foams experienced slower recovery, with full actuation achieved after
118
10 minutes. Additionally, the volume recovery of the PDMS-PEG(350) foams was lower
compared to other compositions, at only 77%. The irregular pore morphology of the
SMP foams synthesized using PDMS-PEG(350) could have a potential effect on
reducing the shape memory behavior of the system. However, the total volume
expansion (21x) of these foams was similar to trisiloxane-based formulations. 100 HDI,
PDMS-PEG(1100) foams also experienced rapid actuation, with volume recovery
similar to that of trisiloxane-based foam formulation. 100 TMHDI foam compositions
had the slowest actuation, with full recovery achieved after 20 minutes. The presence of
methyl groups on TMHDI increased hydrophobicity of the system, hence slower water
plasticization and recovery profiles were observed. However, the volume recovery of
this system was 110%, suggesting preservation of the shape memory behavior of the
material. Controlling shape recovery of the SMP foams is important for modifying
material properties, depending on the application. For example, fast volumetric recovery
is desirable for wound hemostatic treatments while slow actuation would be optimal for
aneurysm occlusion devices that require delivery though a micro-catheter.
5.4 Conclusions
Siloxane-PEG surfactants were successfully synthesized using hydrosilylation
with high yield to serve as cell stabilizers during shape memory polyurethane foam
synthesis. The surfactants had low surface tension, similar to commercially-available
products. Siloxane-PEG surfactants successfully stabilized the foam cells during the
synthesis of porous SMPs. By lowering the surface tension within the struts, the
surfactants allowed liquid polymer spreading at the interface. In addition to pore

119
stability, the surfactants played a key role in tuning the pore size and morphology of the
SMP foams. Furthermore, strut thickness of the foams was heavily dependent on
surfactant type and concentration. Controlling the strut thickness also provides a means
to control foam morphology and mechanical properties for a variety of applications.
Overall, surfactant properties and performance were similar to those of commercially
available cell stabilizers, indicating their potential for use in quality-controlled SMP
foam synthesis.
120
CHAPTER VI
CONCLUSIONS
6.1 Summary
In this work, porous SMP scaffolds were developed to serve as implantable
materials for neurovascular occlusion. The foam-over-wire device would be an
improvement compared to bare metal coils due to their high volumetric filling and large
surface area. Additionally, the SMP foams have reportedly improved healing outcomes
with good thrombus resolution compared to the industry standard. However, control over
the actuation profiles and thermo-mechanical response of the SMP foams in necessary
for device development since the working time for the clinician must include full device
delivery and proper placement prior to foam actuation. Chemical modifications to the
bulk material, using IPDI, slowed the rate of water plasticization of the urethane/urea
bonds and increased hydrophobicity of the polymer system. The added stiffness from the
ring moiety of IPDI also increased foam Tg thereby delaying the onset of actuation and
providing tunable foam recovery.
Radiopacity of the aneurysm occlusion device was enhanced by developing SMP
nanocomposites using tugsten nanoparticles. High nanoparticle loading resulted in x-ray
visibility of the SMP foams through soft and hard tissue in a porcine model. In addition
to imparting radiopacity to the polymer, incorporation of tungsten nanoparticles
provided further control over the foam morphology and thermal properties. The
transition temperature of the system increased by 10°C with a similar effect on actuation
time where the onset of foam expansion increased up to 8 minutes. High filler loading

121
also tuned the mechanical properties of the polymer system. Increased net points in the
system resulted in increased material stiffness and decreased toughness and strain at
break. While lower toughness is not desirable for medical implants, the x-ray visibility
of the device is valuable for device delivery and positioning.
Using different nanoparticles to improve mechanical properties was detailed in
Chapter IV. Al2O3, SiO2 and W nanoparticles were incorporated into the SMP foams at
low concentrations to improve material toughness and resistance to tear and particulate
generation. The resulting SMP nanocomposites had controllable thermo-mechanical
properties with tunable actuation profiles and improved thermal stability. Additionally,
the nanocomposites had minimal particulate generation and filler leaching out of the
polymer matrix.
Lastly, foam morphology and pore sizes were modified by using siloxane-PEG
surfactants are cell stabilizers during the gas blowing process. Siloxane-PEG surfactants
were synthesized via hydrosilylation with surface activity similar to commercially-
available products. The surfactants provided a greater degree of control over the SMP
foam pore morphology, strut thickness, and cell size. However, the surfactants had a
minimal effect on the shape memory behavior of the SMP systems, indicating their use
as viable cell stabilizers that do not modify the thermo-mechanical response of the
material.
6.2 Significance of work
SMP foams have a potential for use has implantable biomaterials due to their
good biocompatibility and healing response. As aneurysm occlusion agents, these foams
122
result in a rapid, stable occlusion and provide complete volumetric filling due to their
shape memory behavior. The actuation time of the foams, however, requires tailoring to
fit clinician need for a device working time of 10 minutes or greater. In Chapter II, the
actuation time of the foams was modified to 30 minutes and greater, indicating the
suitability of these SMP systems for various applications that may require tunable shape
recovery. For aneurysm occlusion, a longer working time is desirable as the clinician
must deploy the FOW device through a tortuous pathway and the final positioning of the
device may require additional time. To prevent premature foam actuation in the catheter
during the procedure, the material properties must be designed to specifically fulfil the
clinician need. Additionally, the hydrophobicity of the polymer was controllable through
IPDI incorporating. These changeable properties may potentially expand the use of our
SMP systems as drug delivery carriers and chemotherapy-induced thrombotic agents.
In Chapter III, radiopacity of the foams containing tungsten nanoparticles were
evaluated for x-ray visible devices. During a minimally-invasive endovascular coiling
procedure, the clinician must rely on x-ray fluoroscopy for guiding and positioning the
devices to the aneurysm. Lack of radiopacity is a significant obstacle for FOW devices
since feasibility of delivery and similarity to preceding devices is an important factor for
clinicians to utilize new products. Furthermore, x-ray visualization through the skull is
difficult due to the presence of dense bone and soft tissue. Therefore, high
concentrations of radiopaque agents are necessary for visualizing small geometry
materials. The tungsten-loaded SMP foams also provide a means of evaluating actuation
in vivo. When crimped, the foams are visible through fluoroscopy. However, upon

123
actuation the foams expand and lose the density requirements for radiopacity. The
change in opacity would provide another metric of confirmation to the clinician
regarding device actuation and clot formation.
In Chapter IV, the mechanical properties of the SMP foams were improved by
reinforcing them with various nanoparticles. Mechanically robust materials are less
susceptible to tear and fracture which is desirable for the SMP foams used in this work.
Due to the low density of the foams, there is a high potential for particulate generation,
from strut breakage, which can cause emboli in other parts of the body. However,
reinforcing the foams with nanoparticles provided improved toughness which further
minimized particulate generation. Additionally, the use of nanofillers in SMP foams
modified their recovery profiles and thermal stability.
Finally, in Chapter V, siloxane-PEG surfactants were developed as cell
stabilizers for SMP foams. Changing the length of the PEG units enabled control over
surfactant properties such as surface activity and viscosity. Each surfactant had low
surface tension (~20 mN/m), comparable to commercially-available products, making
them suitable cell stabilizers for polyurethane foams. The siloxane-PEG surfactants
provided control over the SMP foam cell morphology, cell size, and strut thickness.
These properties are important to tune for ultra-low density systems to maintain high
volume recovery and good mechanical properties. Uniform pores were achieved through
all surfactant types with varying cell sizes. This degree of control over foam morphology
allows for their use in multiple applications that require tunable scaffold porosity and
size.

124
6.3 Challenges and future directions
The SMP foams designed in this work have significant advantages as implantable
biomaterials compared to previous generation materials. While improvements in
material properties and actuation response have been made in this work, further
modification is required to ensure their use in medical devices. The FOW device
requires SMP scaffolds with small pores (~400 μm) to allow for delivery through
microcatheter. However, the SMP nanocomposites, developed in Chapter IV, do not
have small pores suitable for device development. Further work is required to modify the
fabrication protocol in order to generate SMPs with smaller pores. For example, pore
sizes can be controlled by changing the viscosity of the NCO premix during foam
synthesis. NCO premix viscosity can be modified by changing the OH content present in
solution. Higher OH content would increase crosslink density and therefore increase
viscosity. A highly viscous NCO premix would result in small pores in the SMP foam.
Additional variables including mixing time, catalyst concentration, and surfactant
concentration provide further control over cell size.
Similarly, surfactant structure can be altered to tune foam morphology. The
surfactants synthesized in Chapter V contain long chain PEG units. Effects of short
chain polyethylene oxide units on surfactant properties must be evaluated along with
their effectiveness as polyurethane foaming surfactants. Short chain allyl methyl ethers
can be synthesized by reacting a good electrophile, such as allyl bromide, with mono-
terminated polyethylene oxide units of varying molecular weight in the presence of acid
or base. Synthesizing custom hydrophilic constituents will provide a better
125
understanding of surfactant surface activity and interaction with the polymer phase.
Using fluorocarbons as the hydrophobic unit may also tune surfactant properties
compared to siloxane groups. Fluorocarbons are well-studied in the literature to have
surface tension ranging from 15-20 mN/m. 139
This is desirable for polyurethane foaming
because generation of a surface tension gradient prevents strut thinning during foam
blowing.
The SMP nanocomposites, designed for FOW in Chapter IV, experienced
aggregate generation of the nanoparticles. This further effected foam mechanical
properties as greater aggregates generally led to lower toughness and strength.
Additionally, higher concentrations of nanoparticles would cause aggregate formation in
the SMP struts. To overcome this limitation, future works should focus on developing
surface modified nanoparticles that can be covalently coupled to the SMP matrix during
foam synthesis. Covalent binding of nanoparticles to the polymer would yield better
reinforcement of the system which would provide a superior mechanical response.
Additionally, permanent nanoparticle coupling would prevent filler leaching from the
SMP system and potentially allow for higher filler loadings for other applications such
as x-ray visibility and drug delivery. The nanoparticles could be surface modified by
utilizing silane coupling agents. Silane coupling agents have been well-researched to
form durable bonds between inorganic and organic materials. 140, 141
The non-
hydrolyzable R group on a typical silane coupling agent (R-(CH2)n-Si-X3) unit may be a
hydroxyl or amine group which can react with the NCO groups of the SMP system. 141
Nanoparticles such as Al2O3 and SiO2 may be modified using this approach to add

126
covalent linkers for binding to the SMP. This method would improve nanoparticle
dispersion into the polymer matrix and further enhance mechanical properties due to the
increased crosslink density.
Previously-designed SMP foams, similar to the ones described in this work, have
known biocompatibility and desirable tissue response. However, the biocompatibility of
the new SMP foams needs to be further evaluated. Direct and indirect in vitro cell
adhesion and proliferation studies must be conducted on all SMP foams fabricated in this
work to determine their viability as implantable materials. Leachables, such as
surfactants and nanoparticles, may be cytotoxic; hence their effect on cell viability
should be further studied to safety of the resulting medical devices.
Lastly, scale up of SMP foams and surfactants is necessary for reproducible
device manufacturing. While the current foaming protocol is optimal for small foam
batches, additional experiments need to be conducted to generate a detailed protocol for
producing bulk materials. Factors such as surfactant concentration, mixing time, and
NCO premix viscosity would require tuning for large foam batches to prevent premature
foam actuation while maintaining the small cell morphology. Additionally, the siloxane-
PEG surfactants would need to be synthesized in bulk for their use in foam
manufacturing. Complete solvent and catalyst removal may pose as a potential difficulty
for surfactant scale up. As a solution, rigorous extraction and low-pressure evaporation
steps must be taken to provide an impurity-free product.
127
REFERENCES
1. Hearon, K.; Singhal, P.; Horn, J.; Small, W.t.; Olsovsky, C.; Maitland, K.C.;
Wilson, T.S.; Maitland, D.J. Porous shape memory polymers. Polym Rev (Phila
Pa) 2013, 53, 41-75.
2. Sun, L.; Huang, W.M.; Ding, Z.; Zhao, Y.; Wang, C.C.; Purnawali, H.; Tang, C.
Stimulus-responsive shape memory materials: A review. Materials & Design
2012, 33, 577-640.
3. Xie, T. Recent advances in polymer shape memory. Polymer 2011, 52, 4985-
5000.
4. Meng, Q.; Hu, J. A review of shape memory polymer composites and blends.
Composites Part A: Applied Science and Manufacturing 2009, 40, 1661-1672.
5. Wilson, T.S.; Bearinger, J.P.; Herberg, J.L.; Marion, J.E.; Wright, W.J.; Evans,
C.L.; Maitland, D.J. Shape memory polymers based on uniform aliphatic
urethane networks. Journal of Applied Polymer Science 2007, 106, 540-551.
6. Small, W.t.; Singhal, P.; Wilson, T.S.; Maitland, D.J. Biomedical applications of
thermally activated shape memory polymers. J Mater Chem 2010, 20, 3356-
3366.
7. Leng, J.; Lan, X.; Liu, Y.; Du, S. Shape-memory polymers and their composites:
Stimulus methods and applications. Progress in Materials Science 2011, 56,
1077-1135.
8. Song, J.J.; Chang, H.H.; Naguib, H.E. Design and characterization of
biocompatible shape memory polymer (smp) blend foams with a dynamic porous
structure. Polymer 2015, 56, 82-92.
9. Zhao, Q.; Qi, H.J.; Xie, T. Recent progress in shape memory polymer: New
behavior, enabling materials, and mechanistic understanding. Progress in
Polymer Science.
10. Hu, J.; Zhu, Y.; Huang, H.; Lu, J. Recent advances in shape–memory polymers:
Structure, mechanism, functionality, modeling and applications. Progress in
Polymer Science 2012, 37, 1720-1763.
11. Hager, M.D.; Bode, S.; Weber, C.; Schubert, U.S. Shape memory polymers: Past,
present and future developments. Progress in Polymer Science.

128
12. Meng, H.; Li, G. A review of stimuli-responsive shape memory polymer
composites. Polymer 2013, 54, 2199-2221.
13. Janik, H.; Marzec, M. A review: Fabrication of porous polyurethane scaffolds.
Mater Sci Eng C Mater Biol Appl 2015, 48, 586-591.
14. Hentze, H.P.; Antonietti, M. Porous polymers and resins for biotechnological and
biomedical applications. Reviews in Molecular Biotechnology 2002, 90, 27-53.
15. Ji, C.; Annabi, N.; Hosseinkhani, M.; Sivaloganathan, S.; Dehghani, F.
Fabrication of poly-dl-lactide/polyethylene glycol scaffolds using the gas
foaming technique. Acta Biomater 2012, 8, 570-578.
16. Drenckhan, W.; Saint-Jalmes, A. The science of foaming. Advances in Colloid
and Interface Science.
17. Jensen, J.K.; Jensen, L.O.; Terkelsen, C.J.; Lassen, J.F.; Tilsted, H.H.; Hansen,
K.N.; Maeng, M.; Thuesen, L.; Thayssen, P. Incidence of definite stent
thrombosis or in-stent restenosis after drug-eluting stent implantation for
treatment of coronary in-stent restenosis: From western denmark heart registry.
Catheterization and Cardiovascular Interventions 2013, 81, 260-265.
18. Frerich, S.C. Biopolymer foaming with supercritical co2—thermodynamics,
foaming behaviour and mechanical characteristics. The Journal of Supercritical
Fluids 2015, 96, 349-358.
19. Singhal, P.; Rodriguez, J.N.; Small, W.; Eagleston, S.; Van de Water, J.;
Maitland, D.J.; Wilson, T.S. Ultra low density and highly crosslinked
biocompatible shape memory polyurethane foams. J Polym Sci B Polym Phys
2012, 50, 724-737.
20. Lee, S.H.; Jang, M.K.; Kim, S.H.; Kim, B.K. Shape memory effects of molded
flexible polyurethane foam. Smart Materials and Structures 2007, 16, 2486.
21. Kang, S.M. Shape memory polyurethane foams. Express Polymer Letters 2011,
6, 63-69.
22. Salerno, A.; Clerici, U.; Domingo, C. Solid-state foaming of biodegradable
polyesters by means of supercritical co2/ethyl lactate mixtures: Towards
designing advanced materials by means of sustainable processes. European
Polymer Journal 2014, 51, 1-11.

129
23. Jacobs, L.J.M.; Kemmere, M.F.; Keurentjes, J.T.F. Sustainable polymer foaming
using high pressure carbon dioxide: A review on fundamentals, processes and
applications. Green Chemistry 2008, 10, 731-738.
24. Pasquali, I.; Bettini, R.; Giordano, F. Solid-state chemistry and particle
engineering with supercritical fluids in pharmaceutics. European Journal of
Pharmaceutical Sciences 2006, 27, 299-310.
25. Duarte, A.R.C.; Mano, J.F.; Reis, R.L. Supercritical fluids in biomedical and
tissue engineering applications: A review. International Materials Reviews 2009,
54, 214-222.
26. Song, J.J.; Chang, H.H.; Naguib, H.E. Design and characterization of
biocompatible shape memory polymer (smp) blend foams with a dynamic porous
structure. Polymer 2015, 56, 82-92.
27. Ortega, J.M.; Hartman, J.; Rodriguez, J.N.; Maitland, D.J. Virtual treatment of
basilar aneurysms using shape memory polymer foam. Ann Biomed Eng 2013,
41, 725-743.
28. Muschenborn, A.D.; Ortega, J.M.; Szafron, J.M.; Szafron, D.J.; Maitland, D.J.
Porous media properties of reticulated shape memory polymer foams and mock
embolic coils for aneurysm treatment. Biomed Eng Online 2013, 12, 103.
29. Hasan, S.M.; Raymond, J.E.; Wilson, T.S.; Keller, B.K.; Maitland, D.J. Effects
of isophorone diisocyanate on the thermal and mechanical properties of shape-
memory polyurethane foams. Macromolecular Chemistry and Physics 2014, 215,
2420-2429.
30. Singhal, P.; Boyle, A.; Brooks, M.L.; Infanger, S.; Letts, S.D.; Small, W.D.;
Maitland, D.J.D.; Wilson, T.S.D. Controlling the actuation rate of low-density
shape-memory polymer foams in water. Macromol Chem Phys 2013, 214, 1204-
1214.
31. Metcalfe, A.; Desfaits, A.-C.; Salazkin, I.; Yahia, L.H.; Sokolowski, W.M.;
Raymond, J. Cold hibernated elastic memory foams for endovascular
interventions. Biomaterials 2003, 24, 491-497.
32. Rodriguez, J.N.; Clubb, F.J.; Wilson, T.S.; Miller, M.W.; Fossum, T.W.;
Hartman, J.; Tuzun, E.; Singhal, P.; Maitland, D.J. In vivo response to an
implanted shape memory polyurethane foam in a porcine aneurysm model. J
Biomed Mater Res A 2014, 102, 1231-1242.
130
33. Singhal, P.; Small, W.; Cosgriff-Hernandez, E.; Maitland, D.J.; Wilson, T.S.
Low density biodegradable shape memory polyurethane foams for embolic
biomedical applications. Acta Biomater 2014, 10, 67-76.
34. Rodriguez, J.N.; Miller, M.W.; Boyle, A.; Horn, J.; Yang, C.K.; Wilson, T.S.;
Ortega, J.M.; Small, W.; Nash, L.; Skoog, H.; Maitland, D.J. Reticulation of low
density shape memory polymer foam with an in vivo demonstration of vascular
occlusion. J Mech Behav Biomed Mater 2014, 40, 102-114.
35. Boyle, A.J.; Landsman, T.L.; Wierzbicki, M.A.; Nash, L.D.; Hwang, W.; Miller,
M.W.; Tuzun, E.; Hasan, S.M.; Maitland, D.J. In vitro and in vivo evaluation of a
shape memory polymer foam-over-wire embolization device delivered in
saccular aneurysm models. Journal of Biomedical Materials Research Part B:
Applied Biomaterials 2015, n/a-n/a.
36. Avar, G.; Meier-Westhues, U.; Casselmann, H.; Achten, D. Polyurethanes. 2012,
411-441.
37. Muschenborn, A.D.; Ortega, J.M.; Szafron, J.M.; Szafron, D.J.; Maitland, D.J.
Porous media properties of reticulated shape memory polymer foams and mock
embolic coils for aneurysm treatment. BioMedical Engineering OnLine 2013, 12,
1-13.
38. Rodriguez, J.N.; Yu, Y.J.; Miller, M.W.; Wilson, T.S.; Hartman, J.; Clubb, F.J.;
Gentry, B.; Maitland, D.J. Opacification of shape memory polymer foam
designed for treatment of intracranial aneurysms. Ann Biomed Eng 2012, 40,
883-897.
39. Currie, S.; Mankad, K.; Goddard, A. Endovascular treatment of intracranial
aneurysms: Review of current practice. Postgraduate Medical Journal 2011, 87,
41-50.
40. Kim, K.-H.; Cha, K.-C.; Kim, J.-S.; Hong, S.-C. Endovascular coiling of middle
cerebral artery aneurysms as an alternative to surgical clipping. Journal of
Clinical Neuroscience 2013, 20, 520–522.
41. Hayakawa, M.; Murayama, Y.; Duckwiler, G.R.; Gobin, Y.P.; Guglielmi, G.;
Vinuela, F. Natural history of the neck remnant of a cerebral aneurysm treated
with the Guglielmi detachable coil system. Journal of Neurosurgery 2000, 93,
561-586.
42. Molyneux, A. International subarachnoid aneurysm trial (ISAT) of neurosurgical
clipping versus endovascular coiling in 2143 patients with ruptured intracranial
aneurysms: A randomised trial. The Lancet 2002, 360, 1267-1274.

131
43. Hampikian, J.M.; Heaton, B.C.; Tong, F.C.; Zhang, Z.; Wong, C.P. Mechanical
and radiographic properties of a shape memory polymer composite for
intracranial aneurysm coils. Materials Science and Engineering C 2006, 26,
1373-1379.
44. Cloft, H.J. Hydrocoil for endovascular aneurysm occlusion (heal) study:
Periprocedural results. American Journal of Neuroradiology 2006, 27, 289-292.
45. Guo, X.B.; Fan, Y.M.; Zhang, J.N. Hydrosoft coil versus hydrocoil for
endovascular aneurysm occlusion study: A single center experience. Eur J Radiol
2011, 79, e42-46.
46. Hwang, W.; Singhal, P.; Miller, M.W.; Maitland, D.J. In vitro study of
transcatheter delivery of a shape memory polymer foam embolic device for
treating cerebral aneurysms. Journal of Medical Devices 2013, 7.
47. Singhal, P.; Boyle, A.; Brooks, M.L.; Infanger, S.; Letts, S.; Small, W.; Maitland,
D.J.; Wilson, T.S. Controlling the actuation rate of low-density shape-memory
polymer foams in water. Macromolecular Chemistry and Physics 2013, 214,
1204-1214.
48. James, N.R.; Philip, J.; Jayakrishnan, A. Polyurethanes with radiopaque
properties. Biomaterials 2006, 27, 160-166.
49. Zhang, X.D.; Macosko, C.W.; Davis, H.T.; Nikolov, A.D.; Wasan, D.T. Role of
silicone surfactant in flexible polyurethane foam. J Colloid Interface Sci 1999,
215, 270-279.
50. Hill, R.M. Silicone (siloxane) surfactants. In Hydrosilylation: A comprehensive
review on recent advances; Matisons, J., Ed. Springer Science+Business Media
B.V.: Dordrecht, Netherlands,
51. Hill, R.M. Silicone surfactants new developments. Current Opinion in Colloid
& Interface Science 2002, 7, 255-261.
52. Maitland, D.J.; Metzger, M.F.; Schumann, D.; Lee, A.; Wilson, T.S.
Photothermal properties of shape memory polymer micro-actuators for treating
stroke. Lasers Surg. Med. 2002, 30, 1-11.
53. Cullum, B.M.; Wilson, T.S.; Small Iv, W.; Benett, W.J.; Bearinger, J.P.;
Maitland, D.J.; Carter, J.C. Shape memory polymer therapeutic devices for
stroke. Proc. of SPIE 2005, 6007, 60070R-60070R-60078.
132
54. Small IV, W.; Singhal, P.; Wilson, T.S.; Maitland, D.J. Biomedical applications
of thermally activated shape memory polymers. J. Mater. Chem 2010, 20, 3356-
3366.
55. Wilson, T.S.; Bearinger, J.P.; Herberg, J.L.; Marion, J.E.; Wright, W.J.; Evans,
C.L.; Maitland, D.J. Shape memory polymers based on uniform aliphatic
urethane networks. J. Appl. Polym. Sci. 2007, 106, 540-551.
56. Singhal, P.; Rodriguez, J.N.; Small, W.; Eagleston, S.; Van de Water, J.;
Maitland, D.J.; Wilson, T.S. Ultra low density and highly crosslinked
biocompatible shape memory polyurethane foams. J. Polym. Sci., Part B: Polym.
Phys. 2012, 50, 724-737.
57. Singhal, P.; Boyle, A.; Brooks, M.L.; Infanger, S.; Letts, S.; Small, W.; Maitland,
D.J.; Wilson, T.S. Controlling the actuation rate of low-density shape-memory
polymer foams in water. Macromol. Chem. Phys. 2013, 214, 1204-1214.
58. Singhal, P.; Small, W.; Cosgriff-Hernandez, E.; Maitland, D.J.; Wilson, T.S.
Low density biodegradable shape memory polyurethane foams for embolic
biomedical applications. Acta Biomater. 2014, 10, 67-76.
59. Rodriguez, J.N.; Yu, Y.J.; Miller, M.W.; Wilson, T.S.; Hartman, J.; Clubb, F.J.;
Gentry, B.; Maitland, D.J. Opacification of shape memory polymer foam
designed for treatment of intracranial aneurysms. Ann. Biomed. Eng. 2012, 40,
883-897.
60. Leng, J.; Lan, X.; Liu, Y.; Du, S. Shape-memory polymers and their composites:
Stimulus methods and applications. Prog. Mater. Sci. 2011, 56, 1077-1135.
61. Chae Jung, Y.; Hwa So, H.; Whan Cho, J. Water‐responsive shape memory
polyurethane block copolymer modified with polyhedral oligomeric
silsesquioxane. J. Macromol. Sci., Phys. 2006, 45, 453-461.
62. Hearon, K.; Singhal, P.; Horn, J.; IV, W.S.; Olsovsky, C.; Maitland, K.C.;
Wilson, T.S.; Maitland, D.J. Porous shape-memory polymers. Polym. Rev. 2013,
53, 41-75.
63. Rosler, A.; Vandermeulen, G.W.M.; Klok, H.-A. Advanced drug delivery
devices via self-assembly of amphiphilic block copolymers. Advanced Drug
Delivery Reviews 2001, 53, 95-108.
64. Warlow, C.P. Epidemiology of stroke. The Lancet 1998, 352, S1-S4.

133
65. Juvela, S.; Poussa, K.; Porras, M. Factors affecting formation and growth of
intracranial aneurysms : A long-term follow-up study. Stroke 2001, 32, 485-491.
66. Sluzewski, M.; Bosch, J.A.; Rooij, W.J.V.; Nijssen, P.C.G.; Wijnalda, D.
Rupture of intracranial aneurysms during treatment with Guglielmi detachable
coils: Incidence, outcome, and risk factors. Journal of Neurosurgery 2001, 94,
238-240.
67. Kim, J.H.; Kang, T.J.; Yu, W.R. Simulation of mechanical behavior of
temperature-responsive braided stents made of shape memory polyurethanes. J
Biomech 2010, 43, 632-643.
68. Xue, L.; Dai, S.; Li, Z. Biodegradable shape-memory block co-polymers for fast
self-expandable stents. Biomaterials 2010, 31, 8132-8140.
69. Laschke, M.W.; Strohe, A.; Scheuer, C.; Eglin, D.; Verrier, S.; Alini, M.;
Pohlemann, T.; Menger, M.D. In vivo biocompatibility and vascularization of
biodegradable porous polyurethane scaffolds for tissue engineering. Acta
Biomater. 2009, 5, 1991-2001.
70. Hong, Y.; Ye, S.H.; Pelinescu, A.L.; Wagner, W.R. Synthesis, characterization,
and paclitaxel release from a biodegradable, elastomeric, poly(ester
urethane)urea bearing phosphorylcholine groups for reduced thrombogenicity.
Biomacromolecules 2012, 13, 3686-3694.
71. Page, J.M.; Prieto, E.M.; Dumas, J.E.; Zienkiewicz, K.J.; Wenke, J.C.; Brown-
Baer, P.; Guelcher, S.A. Biocompatibility and chemical reaction kinetics of
injectable, settable polyurethane/allograft bone biocomposites. Acta Biomater.
2012, 8, 4405-4416.
72. Huang, W.M.; Yang, B.; Zhao, Y.; Ding, Z. Thermo-moisture responsive
polyurethane shape-memory polymer and composites: A review. J. Mater. Chem.
2010, 20, 3367.
73. Frigione, M.; Aiello, M.A.; Naddeo, C. Water effects on the bond strength of
concrete/concrete adhesive joints. Constr. Build. Mater. 2006, 20, 957-970.
74. Yu, Y.J.; Hearon, K.; Wilson, T.S.; Maitland, D.J. The effect of moisture
absorption on the physical properties of polyurethane shape memory polymer
foams. Smart Mater. Struct. 2011, 20.
75. Canton, G.; Levy, D.I.; Lasheras, J.C. Changes in the intraaneurysmal pressure
due to hydrocoil embolization. American Journal of Neuroradiology 2005, 26,
904-907.

134
76. Zhang, S.; Ren, Z.; He, S.; Zhu, Y.; Zhu, C. FTIR spectroscopic characterization
of polyurethane-urea model hard segments (puumhs) based on three diamine
chain extenders. Spectroc. Acta Part A 2007, 66, 188-193.
77. Zhang, Y.; Maxted, J.; Barber, A.; Lowe, C.; Smith, R. The durability of clear
polyurethane coil coatings studied by FTIR peak fitting. Polym. Degrad. Stab.
2013, 98, 527-534.
78. Crompton, T.R. Thermal methods of polymer analysis. 2013.
79. Young, R.J.; Lovell, P.A. Introduction to polymers. CRC Press, Taylor and
Francis Group, LLC. Boca Raton, Florida, USA. 2011.
80. Yuan, Y.; Lee, T.R. Contact angle and wetting properties. 2013, 51, 3-34.
81. Lu, X.; Jiang, B. Glass transition temperature and molecular parameters of
polymer. Polymer 1991, 32, 471-478.
82. Ramakrishna, S.; Mayer, J.; Wintermantel, E.; Leong, K.W. Biomedical
applications of polymer-composite materials: A review. Composites Science and
Technology 2001, 61, 1189-1224.
83. Biomaterials science: An introduction to materials in medicine; Academic Press:
1996.
84. Dawlee, S. Studies on radiopaque polymers for biomedical applications Sree
Chitra Tirunal Institute for Medical Sciences and Technology:
Thiruvananthapuram, India, Country, 2011.
85. Mottu, F.; Rüfenacht, D.; Doelker, E. Radiopaque polymeric materials for
medical applications: Current aspects of biomaterial research. Investigational
Radiology 1999, 34, 323-335.
86. Kiran, S.; James, N.R.; Jayakrishnan, A.; Joseph, R. Polyurethane thermoplastic
elastomers with inherent radiopacity for biomedical applications. J Biomed
Mater Res A 2012, 100, 3472-3479.
87. Tbanoo, B.C.; Sunny, M.C.; Jayakrishnan, A. Tantalum-loaded polyurethane
microspheres for particulate embolization: Preparation and properties.
Biomaterials 1991, 12, 525-528.
88. He, J.; Söderling, E.; Lassila, L.V.J.; Vallittu, P.K. Incorporation of an
antibacterial and radiopaque monomer in to dental resin system. Dental
Materials 2012, 28, 110-117.

135
89. Tallia, F.; Gallo, M.; Pontiroli, L.; Baino, F.; Fiorilli, S.; Onida, B.; Anselmetti,
G.C.; Manca, A.; Vitale-Brovarone, C. Zirconia-containing radiopaque
mesoporous bioactive glasses. Materials Letters 2014, 130, 281-284.
90. Reis, L.O.; Kaizer, M.R.; Ogliari, F.A.; Collares, F.M.; Moraes, R.R.
Investigation on the use of triphenyl bismuth as radiopacifier for (di)methacrylate
dental adhesives. International Journal of Adhesion & Adhesives 2014, 48, 80-
84.
91. Primack, J.E. Radiopaque denture materials. The Journal of Prosthetic Dentistry
1972, 28, 363-368.
92. Amirouche-Korichi, A.; Mouzali, M.; Watts, D.C. Effects of monomer ratios and
highly radiopaque fillers on degree of conversion and shrinkage-strain of dental
resin composites. Dental Materials 2009, 25, 1411-1418.
93. Amirouche, A.; Mouzali, M.; Watts, D.C. Radiopacity evaluation of bis-
gma/tegdma/opaque mineral filler dental composites. Journal of Applied Polymer
Science 2007, 104, 1632-1639.
94. Rawls, H.R.; Starr, J.; Kasten, F.H.; Murray, M.; Smid, J.; Cabasso, I.
Radiopaque acrylic resins containing miscible heavy-metal compounds. Dental
Materials 1990, 6, 250-255.
95. Kiran, S.; James, N.R.; Joseph, R.; Jayakrishnan, A. Synthesis and
characterization of iodinated polyurethane with inherent radiopacity.
Biomaterials 2009, 30, 5552-5559.
96. DamiaMawad; Lauto, A.; Penciu, A.; Mehier, H.; Fenet, B.; Fessi, H.; Chevalier,
Y. Synthesis and characterization of novel radiopaque poly(allyl amine)
nanoparticles. Nanotechnology 2010, 21.
97. Gall, K.; Dunn, M.L.; Liu, Y.; Finch, D.; Munshi, N.A. Shape memory polymer
nanocomposites. Acta Materialia 2002, 50, 5115-5126.
98. Hasan, S.M.; Raymond, J.E.; Wilson, T.S.; Keller, B.K.; Maitland, D.J. Effects
of isophorone diisocyanate on the thermal and mechanical properties of shape-
memory polyurethane foams. Macromolecular Chemistry and Physics 2014, 215,
2420–2429.
99. Kampmann, C.; Brzezinska, R.; Abidini, M.; Wenzel, A.; Wippermann, C.-F.;
Habermehl, P.; Knuf, M.; Schumacher, R. Biodegradation of tungsten
embolisation coils used in children. Pediatric Radiology 2002, 32, 839-843.

136
100. Peustera, M.; Fink, C.; Schnakenburg, C.v. Biocompatibility of corroding
tungsten coils: In vitro assessment of degradation kinetics and cytotoxicity on
human cells. Biomaterials 2003, 24, 4057–4061.
101. Peuster, M.; Fink, C.; Wohlsein, P.; Bruegmann, M.; Gunther, A.; Kaese, V.;
Niemeyer, M.; Haferkamp, H.; Schnakenburg, C.v. Degradation of tungsten coils
implanted into the subclavian artery of newzealand white rabbits is not associated
with local or systemic toxicity. Biomaterials 2003, 24, 393-399.
102. Jakhmola, A.; Antona, N.; Antona, H.; Messaddeq, N.; Hallouard, F.;
Klymchenko, A.; Mely, Y.; Vandamme, T.F. Poly-ε-caprolactone tungsten oxide
nanoparticles as a contrast agent for x-ray computed tomography. Biomaterials
2014, 35.
103. Huang, W.M.; Yang, B.; Zhao, Y.; Ding, Z. Thermo-moisture responsive
polyurethane shape-memory polymer and composites: A review. J Mater Chem
2010, 20, 3367.
104. Hwang, W.; Singhal, P.; Miller, M.W.; Maitland, D.J. In vitro study of
transcatheter delivery of a shape memory polymer foam embolic device for
treating cerebral aneurysms. Journal of Medical Devices 2013, 7, 020932-
020932.
105. Bistričić, L.; Baranović, G.; Leskovac, M.; Bajsić, E.G. Hydrogen bonding and
mechanical properties of thin films of polyether-based polyurethane–silica
nanocomposites. European Polymer Journal 2010, 46, 1975-1987.
106. Bugnicourt, E.; Galy, J.; Gerard, J.-F.; Barthel, H. Effect of sub-micron silica
fillers on the mechanical performances of epoxy-based composites. Polymer
2007, 48, 1596-1605.
107. Khankrua, R.; Pivsa-Art, S.; Hiroyuki, H.; Suttiruengwong, S. Thermal and
mechanical properties of biodegradable polyester/silica nanocomposites. Energy
Procedia 2013, 34, 705-713.
108. Fereidoon, A.; Memarian, S.; Albooyeh, A.; Tarahomi, S. Influence of
mesoporous silica and hydroxyapatite nanoparticles on the mechanical and
morphological properties of polypropylene. Materials & Design 2014, 57, 201-
210.
109. Haldorai, Y.; Shim, J.-J.; Lim, K.T. Synthesis of polymer–inorganic filler
nanocomposites in supercritical co2. The Journal of Supercritical Fluids 2012,
71, 45– 63.
137
110. Zare, Y. Determination of polymer–nanoparticles interfacial adhesion and its role
in shape memory behavior of shape memory polymer nanocomposites.
International Journal of Adhesion and Adhesives 2014, 54, 67-71.
111. Wichmann, M.H.G.; Cascione, M.; Fiedler, B.; Quaresimin, M.; Schulte, K.
Influence of surface treatment on mechanical behaviour of fumed silica/epoxy
resin nanocomposites. Composite Interfaces 2006, 13, 699-715.
112. Tercero, J.E.; Namin, S.; Lahiri, D.; Balani, K.; Tsoukias, N.; Agarwal, A. Effect
of carbon nanotube and aluminum oxide addition on plasma-sprayed
hydroxyapatite coating's mechanical properties and biocompatibility. Materials
Science and Engineering: C 2009, 29, 2195-2202.
113. Gupta, A.; Tripathi, G.; Lahiri, D.; Balani, K. Compression molded ultra high
molecular weight polyethylene–hydroxyapatite–aluminum oxide–carbon
nanotube hybrid composites for hard tissue replacement. Journal of Material
Science and Technology 2013, 29, 514-522.
114. Hasan, S.M.; Harmon, G.; Zhou, F.; Raymond, J.E.; Gustafson, T.P.; Wilson,
T.S.; Maitland, D.J. Tungsten-loaded smp foam nanocomposites with inherent
radiopacity and tunable thermo-mechanical properties. Polymers for Advanced
Technologies 2015, n/a-n/a.
115. Lalwani, G.; Henslee, A.M.; Farshid, B.; Parmar, P.; Lin, L.; Qin, Y.X.; Kasper,
F.K.; Mikos, A.G.; Sitharaman, B. Tungsten disulfide nanotubes reinforced
biodegradable polymers for bone tissue engineering. Acta Biomater 2013, 9,
8365-8373.
116. Glaskova, T.; Zarrelli, M.; Aniskevich, A.; Giordano, M.; Trinkler, L.; Berzina,
B. Quantitative optical analysis of filler dispersion degree in mwcnt–epoxy
nanocomposite. Composites Science and Technology 2012, 72, 477-481.
117. Tang, L.-C.; Zhang, H.; Sprenger, S.; Ye, L.; Zhang, Z. Fracture mechanisms of
epoxy-based ternary composites filled with rigid-soft particles. Composites
Science and Technology 2012, 72, 558-565.
118. Johnsen, B.B.; Kinloch, A.J.; Mohammed, R.D.; Taylor, A.C.; Sprenger, S.
Toughening mechanisms of nanoparticle-modified epoxy polymers. Polymer
2007, 48, 530-541.
119. Omrani, A.; Simon, L.C.; Rostami, A.A. The effects of alumina nanoparticle on
the properties of an epoxy resin system. Materials Chemistry and Physics 2009,
114, 145-150.

138
120. Zhao, S.; Schadler, L.S.; Duncan, R.; Hillborg, H.; Auletta, T. Mechanisms
leading to improved mechanical performance in nanoscale alumina filled epoxy.
Composites Science and Technology 2008, 68, 2965-2975.
121. Convention, T.U.S.P., 788 particulate matter in injections In Revision Bulletin,
The United States Pharmacopeial Convention: Rockville, MD, October 1, 2011;
Vol. 788.
122. Di Virgilio, A.L.; Reigosa, M.; Arnal, P.M.; Fernández Lorenzo de Mele, M.
Comparative study of the cytotoxic and genotoxic effects of titanium oxide and
aluminium oxide nanoparticles in chinese hamster ovary (cho-k1) cells. Journal
of Hazardous Materials 2010, 177, 711-718.
123. Hashimoto, M.; Imazato, S. Cytotoxic and genotoxic characterization of
aluminum and silicon oxide nanoparticles in macrophages. Dental Materials
2015, 31, 556-564.
124. Hussain, S.M.; Hess, K.L.; Gearhart, J.M.; Geiss, K.T.; Schlager, J.J. In vitro
toxicity of nanoparticles in brl 3a rat liver cells. Toxicology in Vitro 2005, 19,
975-983.
125. Stoebe, T.; Lin, Z.; Hill, R.M.; Ward, M.D.; Davis, H.T. Surfactant-enhanced
spreading. Langmuir 1996, 12, 337-344.
126. Tadros, T.F. Surfactants, industrial applications. In Encyclopedia of physical
science and technology (third edition); Meyers, R. A., Ed. Academic Press: New
York, 2003.
127. Lim, H.; Kim, S.H.; Kim, B.K. Effects of silicon surfactant in rigid polyurethane
foams. Polymer Letters 2008, 2, 194-200.
128. Yilgör, E.; Yilgör, I. Silicone containing copolymers: Synthesis, properties and
applications. Progress in Polymer Science 2014, 39, 1165-1195.
129. Naghash, H.J.; Abili, B. Synthesis of a silicone containing allylic monomer and
its uses in the waterborne polyurethane/vinyl acetate–acrylic hybrid emulsion
copolymers. Progress in Organic Coatings 2010, 69, 486-494.
130. Anthony J. O’Lenick, J., Basic silicone chemistry - a review. In Silicone
Spectator, SurfaTech Corporation: Dacula, GA, USA, 1999.
131. Hill, R.M. Silicone surfactants; Marcel Dekker, Inc.: Basek, Switzerland, 1999.

139
132. Wu, C.; Peng, J.; Li, J.; Bai, Y.; Hu, Y.; Lai, G. Synthesis of poly(ethylene
glycol) (peg) functionalized ionic liquids and the application to hydrosilylation.
Catalysis Communications 2008, 10, 248-250.
133. So, H.; Fawcett, A.S.; Sheardown, H.; Brook, M.A. Surface-active copolymer
formation stabilizes peg droplets and bubbles in silicone foams. J Colloid
Interface Sci 2013, 390, 121-128.
134. Roy, A.K. A review of recent progress in catalyzed homogeneous hydrosilation
(hydrosilylation). In Advances in organometallic chemistry; Robert West, A. F.
H., Mark, J. F., Eds.; Academic Press: 2007.
135. Bai, Y.; Zhang, F.; Li, J.; Xu, Y.; Peng, J.; Xiao, W. Application of
polyethyleneglycol (peg) functionalized ionic liquids for the rhodium-catalyzed
hydrosilylation reaction of alkenes. Journal of Organometallic Chemistry 2015,
794, 65-69.
136. Murthy, R.; Cox, C.D.; Hahn, M.S.; Grunlan, M.A. Protein-resistant silicones:
Incorporation of poly(ethylene oxide) via siloxane tethers. Biomacromolecules
2007, 8, 3244-3252.
137. ASTM Standard test methods for flexible cellular materials—slab, bonded, and
molded urethane foams; ASTM International: West Conshohocken, PA.
138. Launer, P.J. Infrared analysis of organosilicon compounds: Spectra-structure
correlations; 1987.
139. Kovalchuk, N.M.; Trybala, A.; Starov, V.; Matar, O.; Ivanova, N. Fluoro- vs
hydrocarbon surfactants: Why do they differ in wetting performance? Advances
in Colloid and Interface Science 2014, 210, 65-71.
140. Ge, X.; Li, M.-C.; Li, X.X.; Cho, U.R. Effects of silane coupling agents on the
properties of bentonite/nitrile butadiene rubber nanocomposites synthesized by a
novel green method. Applied Clay Science 2015, 118, 265-275.
141. Mathialagan, M.; Ismail, H. Optimization and effect of 3-
aminopropyltriethoxysilane content on the properties of bentonite-filled ethylene
propylene diene monomer composites. Polymer Composites 2012, 33, 1993-
2000.