Population Trends: Tulsa County, Tulsa and North Tulsa 2000 to 2010

Tulsa Public Schools Comprehensive Annual Financial Report
For the Fiscal Year Ended June 30, 2017
INDEPENDENT SCHOOL DISTRICT NO. I-1, TULSA COUNTY, OKLAHOMA

This page is left blank intentionally
Comprehensive Annual Financial Report For the Fiscal Year Ended June 30, 2017
INDEPENDENT SCHOOL DISTRICT NO. I-1, TULSA COUNTY, OKLAHOMA
Tulsa Public Schools does not discriminate on the basis of race, religion, color, national origin, sex, sexual orientation, gender expression, gender identity, disability, genetic information, veteran status, marital status or age in its employment, programs and activities and provides equal access to the Boy Scouts and other designated youth groups. The following person has been designated to handle inquiries regarding Tulsa Public Schools’ non-discrimination policies:
Dr. Pauline Harris, human rights & title IX coordinator Tulsa Public Schools Talent Management Department
3027 S. New Haven Ave. Tulsa, Oklahoma 74114-6131
918-746-6517
Prepared by the Department of Financial Services

This page is left blank intentionally
TABLE OF CONTENTS
Page
i
Introductory Section .............................................................................. 1 School District Officials .................................................................................................................... 3 Organizational Chart ........................................................................................................................ 4 Superintendent Profile ...................................................................................................................... 5 Board District Map ............................................................................................................................ 6 Board Member Profiles .................................................................................................................... 7 Letter of Transmittal ....................................................................................................................... 11 GFOA Certificate of Achievement for Excellence in Financial Reporting ...................................... 17 ASBO Certificate of Excellence in Financial Reporting ................................................................. 19
Financial Section .................................................................................. 21
Independent Auditors’ Report ............................................................................................... 23
Management’s Discussion and Analysis .............................................................................. 25
Basic Financial Statements ................................................................................................... 37 Statement of Net Position .............................................................................................................. 39 Statement of Activities .................................................................................................................... 40 Balance Sheet – Governmental Funds .......................................................................................... 41 Reconciliation of the Governmental Funds Balance Sheet to the Statement of Net
Position .................................................................................................................................... 42 Statement of Revenues, Expenditures, and Changes in Fund Balances – Governmental
Funds ....................................................................................................................................... 43 Reconciliation of Statement of Revenues, Expenditures, and Changes in Fund Balances
to the Statement of Activities ................................................................................................... 44 Statement of Fiduciary Assets and Liabilities – Student Activity Funds ........................................ 45 Notes to the Financial Statements ................................................................................................. 46
Required Supplementary Information .................................................................................. 75 Schedule of the District’s Proportionate Share of the Net Pension Liability .................................. 77 Schedule of the District’s Pension Plan Contributions ................................................................... 79 Budgetary Comparison Schedule – General Fund ........................................................................ 80 Reconciliation of Statement of Revenues, Expenditures, and Changes in Fund Balances
to the Budgetary Comparison Schedule – General Fund ....................................................... 81 Notes to Required Supplementary Information .............................................................................. 82
Other Supplementary Information ........................................................................................ 83 Budgetary Comparison Schedule – Debt Service Fund ................................................................ 85 Budgetary Comparison Schedule – Capital Improvements ........................................................... 86 Budgetary Comparison Schedule – Special Revenue Fund .......................................................... 87 Statement of Changes in Fiduciary Asset and Liabilities – Student Activity Funds ....................... 88 Combining Balance Sheet – General Funds ................................................................................. 89 Combining Statement of Revenues, Expenditures, and Changes in Fund Balances –
General Funds ......................................................................................................................... 90 Combining Balance Sheet (Nonmajor Funds) ............................................................................... 91 Combining Statement of Revenues, Expenditures, and Changes in Fund Balances
(Nonmajor Funds) .................................................................................................................... 92
TABLE OF CONTENTS
Page
ii
Statistical Section (Unaudited) ............................................................ 93
Contents .................................................................................................................................. 95
Financial Trends .................................................................................................................... 96 Changes in Net Position................................................................................................................. 96 Changes in Fund Balances – Governmental Funds ...................................................................... 98 Net Position By Component ......................................................................................................... 100 Fund Balances, Governmental Funds ......................................................................................... 101
Revenue Capacity ................................................................................................................. 102 Property Tax Rates – Direct and Overlapping Governments ...................................................... 102 Direct and Overlapping Property Tax Rates ................................................................................ 102 Assessed Value and Estimated Actual Value of Taxable Property ............................................. 103 Principal Property Taxpayer ......................................................................................................... 104 Property Tax Levies and Collections ........................................................................................... 105
Debt Capacity ....................................................................................................................... 106 Ratios of Total Outstanding Debt by Type ................................................................................... 106 Ratios of General Net Bonded Debt Outstanding ........................................................................ 107 Legal Debt Margin Information ..................................................................................................... 108 Direct and Overlapping Governmental Debt ................................................................................ 109
Demographic and Economic Information .......................................................................... 110 Tulsa Area Principal Employers ................................................................................................... 110 Population, Per Capita Income and Employment ........................................................................ 111
Operating Information ......................................................................................................... 112 Net Current Expenditures Per Pupil ............................................................................................. 112 School Food Service Program ..................................................................................................... 113 High School Graduates ................................................................................................................ 114 List of School Buildings: Square Footage, Capacity, Age .......................................................... 115 Number of Schools, Student Enrollment and Attendance Information ........................................ 117 Schedule of Government Employees by Function ....................................................................... 118

1
Introductory Section

2
This page is left blank intentionally

INTRODUCTORY SECTION: SCHOOL DISTRICT OFFICIALS
3
Board of Education
President
Suzanne Schreiber
Members
Wilbert Collins (through February 2017) Cindy Decker, Ph.D.
Ruth Ann Fate Shawna Keller
Jennettie Marshall (March 2017 through current) Gary Percefull
Amy Shelton (March 2017 through current) Lana Turner-Addison, Ed.D. (through February 2017)
Deborah A. Gist, Ed.D. Superintendent
Kathleen M. Schmitz Interim Chief Financial Officer (through July 2017)
Nolberto Delgadillo
Chief Financial Officer (August 2017 and ongoing)
George P. Stoeppelwerth Director of Finance
Treasurer
Janet L. Jamison, CPA Director of Accounting Encumbrance Clerk
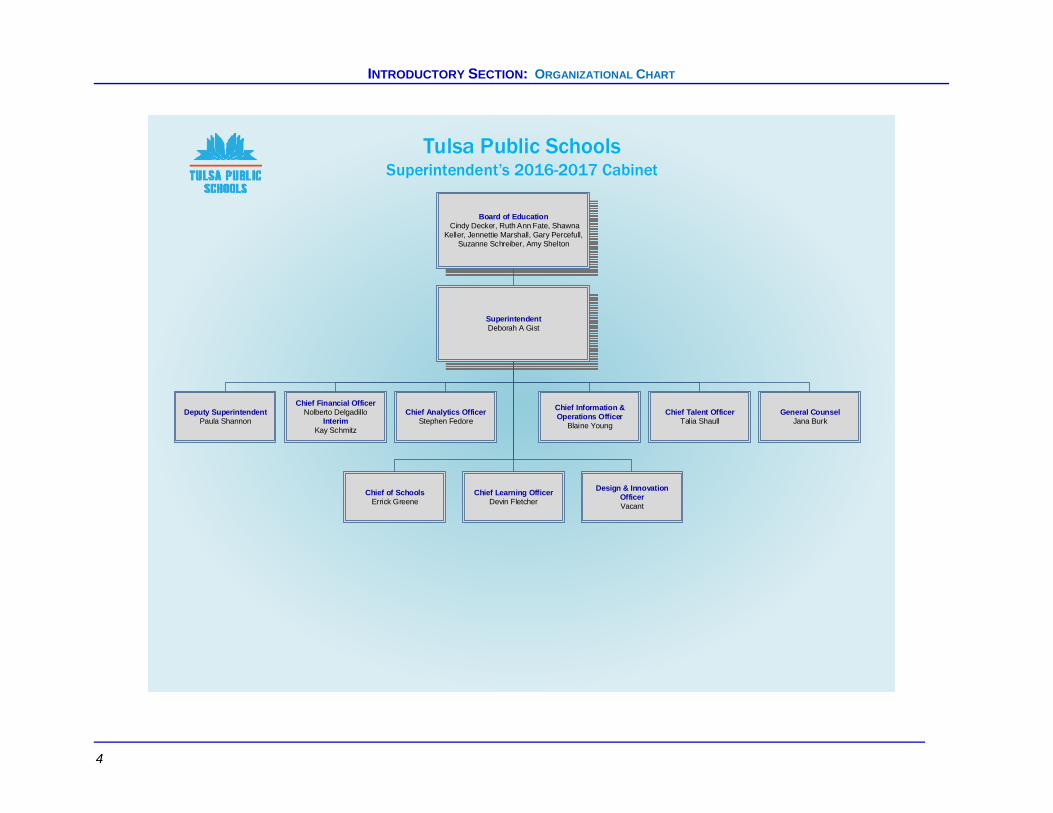
INTRODUCTORY SECTION: ORGANIZATIONAL CHART
4
SuperintendentDeborah A Gist
Board of Education Cindy Decker, Ruth Ann Fate, Shawna
Keller, Jennettie Marshall, Gary Percefull, Suzanne Schreiber, Amy Shelton
Deputy SuperintendentPaula Shannon
Chief Financial OfficerNolberto Delgadillo
InterimKay Schmitz
Chief Analytics OfficerStephen Fedore
Chief Information & Operations Officer
Blaine Young
Chief Talent OfficerTalia Shaull
General CounselJana Burk
Chief of SchoolsErrick Greene
Chief Learning OfficerDevin Fletcher
Design & Innovation OfficerVacant
Tulsa Public SchoolsSuperintendent’s 2016-2017 Cabinet

INTRODUCTORY SECTION: BOARD MEMBER PROFILES
5
Deborah A. Gist, Ed.D. (Superintendent) Dr. Deborah A. Gist is the superintendent of Tulsa Public Schools and is a proud graduate of Memorial High School. She holds a bachelor of science in early-childhood education from the University of Oklahoma, a master of arts in elementary education and curriculum from the University of South Florida, a master’s degree in public administration from the Harvard University John F. Kennedy School of Government, and a doctoral degree in education leadership from the University of Pennsylvania. Prior to returning home to lead Tulsa Public Schools, Dr. Gist served as commissioner of education for the State of Rhode Island where student achievement reached historical highs, and graduation rates increased significantly. Dr. Gist started her career in education in 1988 as an elementary school teacher in Fort Worth, Texas. She moved from the classroom to education administration in 1996, designing and implementing a literacy program serving families in 108 elementary schools in the Hillsborough County School District in Tampa, Florida. Dr. Gist continued her work to advance student achievement through access to education as a Senior Policy Analyst for the U.S. Department of Education and as the Washington, DC State Education Officer. In 2007, she became the first State Superintendent of Education for the District of Columbia, overseeing early childhood, elementary, secondary, adult, and higher education. Dr. Gist is a member of the 2008 cohort of Broad Superintendents Academy Fellows and a 2013 Pahara-Aspen Fellow through the Aspen Institute. In 2010, she was one of Time Magazine’s "100 Most Influential People in the World” and one of The Atlantic's Brave Thinkers, whom the magazine recognizes for “the year’s most intrepid and original thinking.” Dr. Gist is a founding board member of Chiefs for Change and serves on the boards of the Tulsa Area United Way, Junior Achievement of Oklahoma, and the Boy Scouts of America Indian Nations Council. She and her husband, Jock, along with their dogs Rosalita and Diamond, are enthusiastic T-Town residents and big fans of the OU Sooners.
INTRODUCTORY SECTION: BOARD MEMBER PROFILES
6
Tuls
a P
ublic
Sch
ools
B
oard
Mem
ber
Dis
tric
ts

INTRODUCTORY SECTION: BOARD MEMBER PROFILES
7
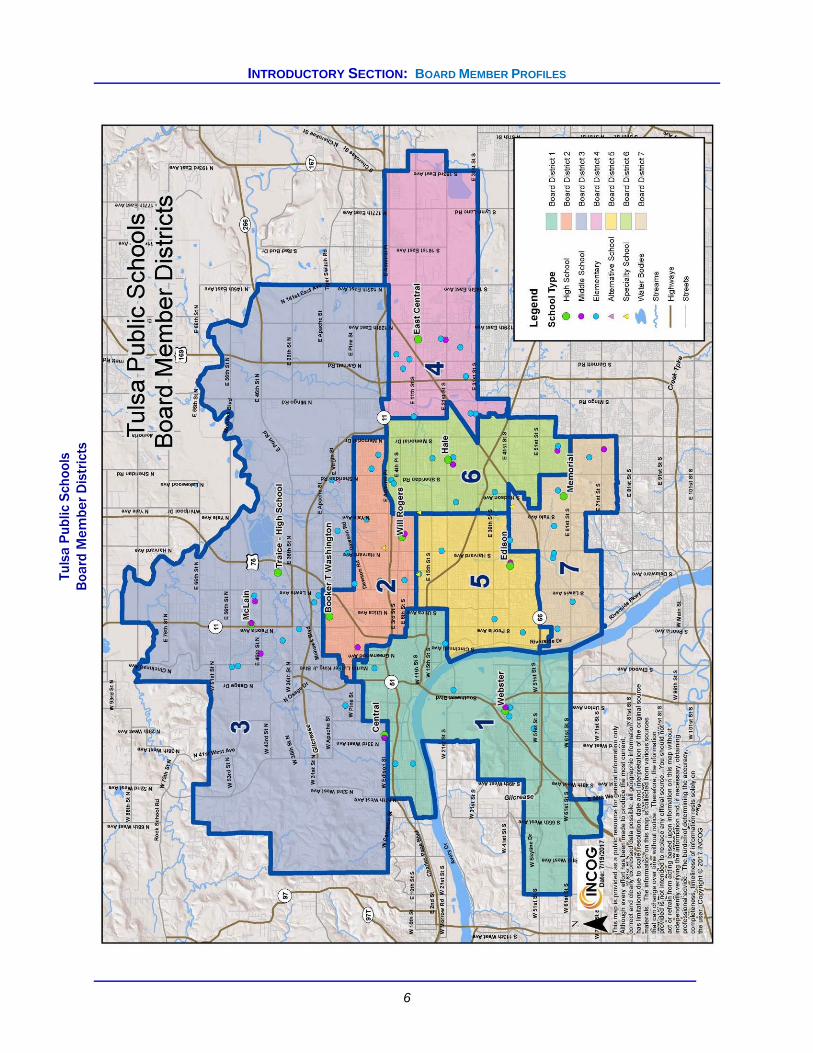
Color Legend for Board Member Districts Map
District 1 – Gary Percefull
District 2 – Amy Shelton
District 3 – Jennettie Marshall
District 4 – Shawna Keller
District 5 – Cindy Decker, Ph.D.
District 6 – Ruth Ann Fate
District 7 – Suzanne Schreiber
District 1 – Gary Percefull Mr. Percefull was elected to the Board of Education in February 2003. His term will expire February 2019. Mr. Percefull is president of a Tulsa public relations firm, The Scissortail Group Ltd. The company, based in a renovated house along historic route 66 in southwest Tulsa, specializes in events, media relations and government affairs. Mr. Percefull previously was employed at the Tulsa World. He is a graduate of Tulsa Memorial High School (class of 1972) and the University of Oklahoma where he earned a bachelor's degree in journalism. He is an active volunteer with several community organizations and initiatives. He serves on the boards of the Community Service Council of Greater Tulsa and the Southwest Tulsa Chamber of Commerce, and the steering committees of the East Tulsa Prevention Coalition and Tulsa Volunteer Center. He is past president of the Riverview Neighborhood Association. The Scissortail Group is a Partners in Education/Adopt-A-School partner with Park Elementary School and Mr. Percefull mentors students through the Going-To-Bat for Tulsa Kids program. Schools in Mr. Percefull's election district include ECDC Porter; Chouteau, Emerson, Eugene Field, Lee, Park, Remington, Robertson and Mark Twain Elementary Schools; Clinton Middle School; and Webster High School.
District 2 – Amy Shelton Ms. Shelton was elected to the Board of Education in February 2017. Her term will expire in February 2021. Ms. Shelton has dedicated her career to working in public education and serving as a community advocate and volunteer. Ms. Shelton taught fifth grade at both Anderson and Cooper, and third grade reading intervention at Celia Clinton elementary schools. She also completed an internship with the district's Teaching and Learning office. When Reading Partners came to Tulsa, Ms. Shelton directed, designed and implemented a multi-site summer school program for third grade students who were at risk of being retained. She continued volunteering with Reading Partners while working as a graduate teaching assistant in the education department at the University of Tulsa. Ms. Shelton holds an Oklahoma educator's certification, a B.A. in international studies from Cedarville University in Ohio, an M.A. in educational studies from the University of Tulsa, and a graduate certificate in nonprofit management from Oklahoma State University. She is a member of the Kendall-Whittier Resident Council, Tulsa Young Professionals and the Women's Leadership Council. Schools in Ms. Shelton's election district include Burroughs, Kendall-Whittier, McKinley, Mitchell, Owen, Sequoyah, and Springdale elementary schools; Carver Middle School; Will Rogers College High and Junior High and Booker T. Washington High School.

INTRODUCTORY SECTION: BOARD MEMBER PROFILES
8
District 3 – Jennettie Marshall Ms. Marshall was elected to her post in April 2017. Her term will expire in February 2021. Ms. Marshall has a strong history of serving people through her employment, ministerial duties, funeral service duties and volunteer work. Ms. Marshall retired from the State of Oklahoma where she worked for the Department of Corrections and the Department of Human Services. She also served the City of Tulsa as a police and fire chaplain and was trained in emergency disaster response and hostage negotiation. In 1994, Ms. Marshall established Reclaim Inc., a program that specializes in serving as a "vehicle of change and redirection" for families, juveniles and adults. Ms. Marshall holds an associates of arts in political science, bachelor of science in corrections, masters of science in business management, associates in applied science in funeral service, attended Phillips Theological Seminary and is completing her seminary coursework through Andersonville Theological Seminary. She is the founding pastor of Living Sanctuary Evangelistic Ministries and previously served as senior pastor of Snowden Chapel and Macedonia Christian Methodist Episcopal churches. Schools in Ms. Marshall’s election district include ECDC Bunche; Academy Central, Anderson, Celia Clinton, Gilcrease, Hamilton, Hawthorne, Jackson, Penn and Whitman elementary schools; Dual Language Program; Central Junior High, Monroe Demonstration School; McLain Junior High/7th Grade Academy; Central and McLain high schools.
District 4 – Shawna Keller (Vice President) Ms. Keller was elected to her post in June 2014. Her term will expire in February 2018. As a fourth generation East Tulsa resident, Ms. Keller attended Disney Elementary School, East Central Junior High School and graduated from East Central High School. Ms. Keller graduated from the University of Tulsa with a bachelor’s degree in history and received her teaching certification from Northeastern State University. Ms. Keller is currently working on her master’s degree in history at TU. Ms. Keller began teaching at Owasso Ram Academy in 2006 as a history teacher. She was selected as Teacher of the Year at the Ram Academy in 2011. Ms. Keller is an active member of the Oklahoma Education Association. Schools in Ms. Keller’s election district include Columbus, Cooper, Disney, ECDC Reed, Kerr, Lewis & Clark, Lindbergh, Peary, and Skelly Elementary Schools; East Central Junior High; and East Central High School.

INTRODUCTORY SECTION: BOARD MEMBER PROFILES
9
District 5 – Cindy Decker, Ph.D. Dr. Decker was appointed by the Board of Education in May 2015 to fill a vacancy. Her term will expire February 2020. Dr. Decker has been an education researcher since 2002. She is passionate about ensuring all children have a quality education. She works as director of research and accountability at CAP Tulsa while also consulting for various groups including the U.S. Department of Education and Howard County Public School System in Maryland. She is chair of the board of Moto, Inc., a family-owned business based in Illinois. Formerly, she was a senior economist working with the education team at the U.S. Government Accountability Office. Dr. Decker attended Patrick Henry, Edison Junior High, and graduated from Edison High School. She holds a B.A. in economics and mathematics from Emory University in Atlanta and a Ph.D. in economics from the University of California at Berkeley. She is a member of Leadership Tulsa Class 44. Schools in Dr. Decker’s election district include Eliot, Lanier, and Wright Elementary Schools; Mayo Demonstration School; and Edison Preparatory School.
District 6 – Ruth Ann Fate Ms. Fate was first elected to her post in April 1996. She served as president of the Board of Education from February 1999 through February 2002. Her term will expire February 2020. She is a life-long Oklahoman, graduating from high school in Miami, Oklahoma, and attending Oklahoma University. Ms. Fate is a charter member of Bethany Christian Church (Disciples of Christ) and a founding member of the Bethany Community pre-school where she taught for ten years. An involved community volunteer, Ms. Fate is on the Board of Trustees for the National Conference for Community and Justice and currently serves as a docent for the Philbrook Museum of Art. She served as the president of that organization during 1993 and 1994. Ms. Fate is now a trustee of the Philbrook Museum Board, is the past president and a member of the board of the Arts and Humanities Council, is the president of OU College of Education Board of Advocates, is an advisory board member for the Center for Counseling and also for the Tulsa Arboretum and serves on the Phillips Theological Seminary board. Schools in Ms. Fate's election district include Bell, Hoover, Jones, MacArthur and Salk Elementary Schools; Zarrow International School; Hale and Memorial Junior High Schools; Street School and Hale High School.

INTRODUCTORY SECTION: BOARD MEMBER PROFILES
10
District 7 – Suzanne Schreiber (President) Ms. Schreiber was elected to her post in February 2014. Her term will expire February 2018. She has lived in Tulsa for over 20 years. Her passion for public education is fueled by the belief that every child can learn and our community is stronger when all children have access to a quality education. Ms. Schreiber has always been active in civic life, participating in everything from student government, leadership organizations and charitable boards to middle school mentor and homeroom mother at Grimes Elementary. She is a graduate of the University of Tulsa and the University of Tulsa Law School. She now works for the Tulsa Community Foundation (TCF) on a variety of community improvement projects. Prior to her position at TCF, Ms. Schreiber practiced law in the private sector and served as a federal law clerk at both the district and appellate levels. Schools in Ms. Schreiber’s election district include Carnegie, Eisenhower International, Grimes, Grissom, Patrick Henry, Key, Marshall, and McClure Elementary Schools; Thoreau Demonstration Academy; and Memorial High School.
INTRODUCTORY SECTION: LETTER OF TRANSMITTAL
11
December 18, 2017 To the Board of Education Members and the Citizens of the Independent School District No. I-1, Tulsa County: The Comprehensive Annual Financial Report (CAFR) of the Independent School District No. I-1, Tulsa Public Schools, (“district”), for the fiscal year ended June 30, 2017, is hereby submitted. The CAFR has been prepared in accordance with generally accepted accounting principles (GAAP) as applicable to governmental entities. To the best of our knowledge and belief, the enclosed information is accurate in all material respects and is reported in a manner designed to fairly present the financial position as well as the financial condition of the district. Disclosures necessary to enable the reader to gain understanding of such financial operations have been included. The management’s discussion and analysis (MD&A) section provides a brief overview of these financial reports. This transmittal letter is designed to be read in conjunction with the MD&A. Oklahoma Public School Audit law (Title 70-22-101) requires the district to submit an annual report of the financial records and transactions audited by independent certified public accountants. This document is submitted in fulfillment of that requirement. An audit was also conducted to meet the requirements of Title 2 U.S. Office Code of Federal Regulations (CFR) Part 200, Uniform Administrative Requirement, Cost Principles, and Audit Requirements for Federal Awards. The role of the auditors is to audit the financial statements to determine if the basic financial statements are free of material misstatements and to assess the accounting principles followed. Based on their findings, they express an opinion on the fairness of the statements and disclose any material weaknesses. Responsibility for the accuracy and completeness of the data presented, as well as the fairness of presentation of this report, rests with district management. PROFILE OF THE TULSA PUBLIC SCHOOLS The district is a corporate body for public purposes created under Title 70 of the Oklahoma Statutes and is, accordingly, a separate entity for operating and financial reporting purposes. The general operating authority for the public school system is the Oklahoma School Code contained in Title 70, Oklahoma Statutes. The district is part of the public school system of Oklahoma under the general direction and control of the state Board of Education. The district is the primary government that has a separately elected governing body, is legally separate and is fiscally independent of other state or local governments. The governing body of the District is the Board of Education, which is composed of seven elected members who serve four year terms. The appointed superintendent is the executive officer of the district. The district is fully accredited by the Oklahoma Department of Education and by the North Central Association.
INTRODUCTORY SECTION: LETTER OF TRANSMITTAL
12
Tulsa Public Schools is a 173 square mile school district serving the city of Tulsa, the county seat of Tulsa County and the surrounding area in Tulsa, Creek, Osage and Wagoner Counties. The Tulsa metropolitan area (MSA) supports a population of 984,958 with an average household income of $69,441 (2016 estimate, Tulsa Regional Chamber). Approximately 94 percent of the district is located inside the city limits of the city of Tulsa, Oklahoma. The remaining six percent lies in surrounding portions of Tulsa, Creek, Osage and Wagoner Counties. Tulsa was first settled in the 1830’s by the Lachapoka Band of the Creek Native American tribe. For most of the 20th century, the city held the nickname “Oil Capital of the World” and played a major role as one of the most important hubs for the American oil industry. Tulsa, along with several other cities, claims to be the birthplace of U.S. Route 66 and is also known for its western swing music. Tulsa Public Schools is the second largest public school district in the State of Oklahoma, with an enrollment (ADM) of 37,932 students in fiscal year 2016-17. The district is projecting a decrease in student enrollment to 37,856 in 2017-18. As of June 30, 2017, the district employs 5,883 employees, of which 2,793 are certified teachers and 231 are certified administrators. The total number of employees also includes 2,761 support personnel and 98 support administrators. Tulsa Public Schools provides early childhood (pre-kindergarten for four-year old students), primary (kindergarten through 3rd grade), elementary schools (grades 4-5), middle schools (grades 6-8) and high schools (serving grades 9-12). During FY 2016-17 programs were delivered through 53 elementary schools, 11 middle/junior high schools, and 9 high schools plus 9 alternative school sites. The district contracted with 6 charter school organizations, Tulsa School for the Arts and Sciences, Tulsa Legacy Charter School, KIPP Tulsa College Preparatory, College Bound Academy, Collegiate Hall, and Tulsa Honor Academy. In addition, 8 early childhood programs are delivered at school sites operated by not-for-profits or partnerships with county agencies working in cooperation with the district. Program delivery occurs during the regular school calendar of 168 days of instruction annually. The district also delivers programs through evening school operating year round and through summer school. In 2010-11, the district launched a virtual academy for secondary students. During 2016-17, 273 students were enrolled in the on-line program. ECONOMIC OUTLOOK During FY 2016-17 the state general revenue fund collected approximately $5.04 billion in revenues, a decrease of approximately $200 million from FY 2015-16. Although general revenue fund collections in June 2017 exceeded the monthly estimate, FY 2017 general revenue fund receipts fell $175.9 million, or 3.4 percent, short of the yearly estimate of $5.22 billion. The City of Tulsa serves as one of the state’s two main economic centers. The city has a highly diversified economy which includes health care, aerospace manufacturing, airline maintenance, and higher education, in addition to being a continued core of the oil and petroleum-related industries. The slight improvement in the state and local economy is reflected in a decrease in unemployment. Tulsa area unemployment rate has decreased from 5.6% in September of 2016 to approximately 4.7% in September 2017. This rate is slightly higher than the state’s unemployment rate of 4.5%. Tulsa as well as the state unemployment rate is still above the national rate during this same time of 4.2%. In the past Oklahoma had been among the states with one of the lowest unemployment rates. As of September 2017, Oklahoma ranks as the state with the 18th highest unemployment rate.
INTRODUCTORY SECTION: LETTER OF TRANSMITTAL
13
For 2016-17 common education funding through the state aid formula was cut twice over the course of the year. Tulsa Public Schools was cut approximately $3.0 million from the mid-term allocation of $89,461,723. During the months of February through April, state department cash shortages resulted in state aid payments to schools being shorted by 2%. The shortages were repaid in May and June. Currently, state aid funding for Tulsa Public Schools is over $24 million less than FY 2009 levels. MAJOR INITIATIVES During FY 2016-17, the Board of Education and administrative staff worked closely together on a number of school improvement initiatives, despite the state’s continuing economic uncertainty. The district’s general fund preliminary budget for 2016-17 was $294,848,305. The budget was amended in April to reflect a budget of $296,422,971. The major initiatives for this year revolved around right sizing the district due to the general fund preliminary revenue projection for 2016-17 projecting a decrease of approximately $7.8million from the previous year’s preliminary revenue projection. This decrease of 2.4% resulted in the reduction of over 100 positions in the district, the majority in the main district offices, and an update of the staffing formula to reallocate resources more effectively to better support our schools. Project Schoolhouse (PSH), launched in January 2011, was designed to address under-enrolled schools, examine curriculum offerings, and ultimately develop a recommendation concerning the number of buildings and grade configurations for the superintendent and board approval. Using PSH as a planning tool, underutilized schools have been vacated, repurposed, or sold in an ongoing effort to utilize district buildings more efficiently. The district continues to annually review programs and building usage in order to make recommendations to the superintendent and board regarding needed changes. During FY 2008-09, TPS applied for, and was accepted as a Teach for America (TFA) district. TPS was originally awarded placement of 50 TFA teachers, and the local philanthropic community agreed to sponsor an additional group of approximately 25 new teachers. In early 2011, TFA announced plans to locate their summer institute in Tulsa. As the district entered the sixth year of the summer institute in 2016-17, the institute provided over 3,000 corps members with the opportunity to enroll in a rigorous summer academic program. STRATEGIC PLANNING During the 2015-16 fiscal year the district embarked on the development of a new strategic plan under the leadership of Dr. Gist, the district’s new superintendent. New mission and vision statements provide the framework for this bold new plan, Destination Excellence:
Tulsa Public Schools is the destination for extraordinary educators who work with our community and families to ignite the
joy of learning and prepare every student for the greatest success in college, careers and life.
Our mission is to inspire and prepare every student to love
learning, achieve ambitious goals and make positive contributions to our world.
The new strategic plan was developed with hundreds of Tulsa teachers, families, students, community members, and administrators who participated in numerous planning sessions. Destination Excellence describes a new vision for public education. This framework is based on the theory of change that the district’s community must be that of learners, contributors, and designers for students to succeed. The strategies which have been deployed are:
INTRODUCTORY SECTION: LETTER OF TRANSMITTAL
14
1. Create powerful learning experiences for all by implementing an aligned pre-K-12 instructional program
2. Cultivate safe, supportive and joyful school cultures 3. Attract, develop and retain a highly effective and empowered team 4. Incubate and implement innovative classroom, school and district designs 5. Foster the conditions to become the nation’s leading 21st century district
The key outcomes that have been defined to measure the success of Destination Excellence are: student and teacher engagement, kindergarten readiness, third grade reading scores, algebra readiness and post-secondary enrollment, with the ultimate outcome of graduating college and career ready students. The plan describes each of these components and key performance measures for success, and details how school teams, students, families, communities, and district staff will support the work in each of these areas. Following the adoption of the new strategic plan, district staff engaged in action planning to identify key strategies and outcomes for the next 5-7 years. AWARDS In 2017, the Financial Services Department received the Certificate of Achievement for Excellence in Financial Reporting from the Government Finance Officers’ Association (GFOA) for the June 30, 2016 Comprehensive Annual Financial Report (CAFR). To receive the Certificate of Achievement for Excellence, applicants must prepare a CAFR that meets rigorous program standards as well as generally accepted accounting principles and applicable statutory requirements. We believe that the CAFR for the year ended June 30, 2017 conforms to the Certificate of Achievement program requirements, and will submit this report to GFOA for review. The Association of School Business Officials International (ASBO) Certificate of Excellence in Financial Reporting was also awarded for the June 30, 2016 Comprehensive Annual Financial Report (CAFR). This award recognizes school districts that produce a CAFR meeting the principles and standards of financial reporting as adopted by ASBO. We believe that the CAFR for the year ended June 30, 2017 meets these requirements, and will submit this report to ASBO in application for this esteemed award. REVENUES Tulsa Public School’s 2016-17 general fund revenue totaled $304.8 million. The primary funding source was the State of Oklahoma, with state revenue comprising 53 percent of the total, or $160.6 million. Federal program revenue totaled $31.3 million, representing 10 percent of total revenue. Local, intermediate and other revenue sources represented 37 percent of total revenue collections, or $112.9 million. Of that amount ad valorem tax revenue totaled $85.5 million. Ad valorem tax revenues account for 90 percent of the building fund revenue and total $12.2 million. The child nutrition fund collects 76 percent of fund revenues from the federal nutrition program, administered through the U.S. Department of Agriculture. The federal free and reduced price lunch program was 86 percent of student lunches served by the district in FY 2016-17. CAPITAL PLANNING AND BOND FUNDS The district continues to follow a capital improvement plan developed in 1994 at the request of and with the input of the citizen’s bond development committee. This plan addressed the needs of approximately 8 million square feet of space owned and maintained by Tulsa Public Schools. The average age of the district’s educational buildings is 59 years, and 91 percent of the buildings are 35 years old or older. Since 1996, voters have approved bonds totaling $1,275.4 million for new facilities,

INTRODUCTORY SECTION: LETTER OF TRANSMITTAL
15
technology, media centers, school buses and textbooks for all students. Bond issues have received strong community support. The district’s bonds are rated AA by Standard & Poor’s. On March 3, 2015, voters approved the single largest bond issue in the district’s history. The $415 million authorization was approved by 85% of district voters. The four proposals included $239,740,000 for buildings/facilities, $19,800,000 for library materials and additions, $17,025,000 for transportation equipment, and $138,435,000 for classroom textbooks and technology. As of June 30, 2017, the district had $327.7 million in remaining bonds available from this authorization. FINANCIAL POLICIES AND CONTROLS District activities are governed by board-approved policies and regulations. The board’s policy committee reviews all proposals for new or revised policies. After review, the policy recommendation is placed on the board agenda for information, and then consent. Policies are routinely reviewed by administrators to insure that they are consistent with current law. The paragraphs below summarize the key policies that address the financial activities of the district:
Accounting system – Defines the Oklahoma Cost Accounting System and its required compatibility with the budgetary control system. Also provides approval requirements for journal entries. Financial reports and statements – Defines the periodic financial reporting requirements. Types of funds – Establishes separate funds for accounting purposes. Depository of funds/banking services – Establishes requirements for bidding and investment services. Purchasing – Defines responsibilities and levels of authority in the Purchasing department. Solicitation requirements – Defines requirements for solicitations and competitive procurement. Expense reimbursement – Establishes authority for reimbursing employees for travel expenses. Audit – Requires an independent annual audit be performed in accordance with governmental auditing standards. Inventories – Requires an annual inventory of district assets, identifies capitalization thresholds, and identifies individuals responsible for maintaining inventory records. Budget transfer authority – Defines levels of authority and required approvals for budget transfers. Statement of income and expenditures and the related budget process – Establishes the timeline for preparing the annual statement of income and expenditures, and for preparing the annual school district budget plan.
In addition to these explicit policies, the district maintains a strong internal and budgetary control structure:
Internal control structure – District management is responsible for implementing and enforcing a system of internal controls to protect the assets from loss, theft, or misuse and to ensure that reliable accounting data are available for the timely preparation of financial statements in accordance with GAAP. The internal controls structure is designed to provide reasonable, but not absolute, assurance that these objectives are met. The concept of reasonable assurance recognizes that the cost of control should not exceed the benefits likely to be derived and that the valuation of costs and benefits requires estimates and judgments by management. An evaluation of the internal control structure during the annual audit disclosed no material weaknesses.

INTRODUCTORY SECTION: LETTER OF TRANSMITTAL
16
Budgetary control – The objective of the district’s budgetary controls is to ensure compliance with legal appropriation limitations and to provide an operating plan for the district’s resources. The annual appropriated budget includes the general fund, special revenue funds, capital improvement funds, and debt services fund. Preliminary budgets are adopted at the commencement of the fiscal year with periodic amendments approved by the Board of Education. Budgetary control for accounts without a project is generally at the full account level. For accounts within a project the budgetary control is generally maintained by fund, project and site. These appropriated budgets represent the legally adopted fiscal plan of the district. Board of Education approval is required for budgetary transfers totaling $25,000 and greater. The district utilizes an encumbrance system as a budgetary control mechanism.
Under GASB Statement 68, beginning with the 2014-15 financial statements, the district is required to report the proportionate share of the unfunded liability for the state’s Teacher’s Retirement System. This represents a significant change in the district’s financial statements and is described more fully in the notes to the financial statements. It is important to note, however, that (as established by existing case law) the pension liability is the legal obligation of the State of Oklahoma, not the local employer. Under GASB Statement 72, beginning with the 2015-16 financial statements, the district, in order to enhance the comparability of financial statements, is using fair value measurement for certain investments. Under GASB Statement 77, beginning with the 2016-17 financial statement, the district disclosed information regarding tax abatements in the notes to the financial statements. Capital projects activity is controlled with approval of the bond plans and is monitored by individual bond project budgets. The citizen bond oversight committee reviews all bond project budgets and expenditure reports. ACKNOWLEGEMENTS
We would like to express appreciation to all the members of the Finance department who assisted with the preparation of this comprehensive annual financial report. Our goal is to continuously improve our financial accountability to our citizens. We would also like to thank the members of the Board of Education for their interest and support in conducting the financial affairs of the district in a responsible and progressive manner. Respectfully submitted,
Deborah A. Gist, Ed.D. Superintendent
Nolberto Delgadillo Chief Financial Officer
17

18
This page is left blank intentionally

19

20
This page is left blank intentionally

21
Financial Section

22
This page is left blank intentionally
FINANCIAL SECTION: AUDITORS’ REPORT
23

FINANCIAL SECTION: AUDITORS’ REPORT
24

FINANCIAL SECTION: MANAGEMENT’S DISCUSSION AND ANALYSIS
25
Our discussion and analysis of the financial performance of Independent School District No. I-1, Tulsa Public Schools, (“district”), provides an overview of the district’s financial activities for the fiscal year ended June 30, 2017. The intent of this management discussion and analysis is to look at the district’s financial performance as a whole; readers should also review the financial statements and notes to the basic financial statements to enhance their understanding of the district’s financial performance. FINANCIAL HIGHLIGHTS At fiscal 2017 year end, total fund balance was $159.1 million, an increase of $18.1 million, primarily due to an increase of $6.2 million in private donations and an increase in bond proceeds of $4.3 million. The district issues these debt offerings to further fund capital improvements and acquisitions while our overall credit rating remained strong. The district was given a “AA” rating by Standard and Poor’s for the general obligation bonds issued during the year. OVERVIEW OF FINANCIAL STATEMENTS This discussion and analysis is intended to serve as an introduction to the district’s basic financial statements, which comprise three components: 1) government-wide financial statements, 2) fund financial statements, and 3) notes to the financial statements. This report also contains other supplementary information in addition to the basic financial statements. Government-wide financial statements – The government-wide financial statements are designed to provide readers with a broad overview of the district’s finances, in a manner similar to a private-sector business. The statement of net position presents information on all of the district’s assets plus deferred outflows of resources and liabilities plus deferred inflows of resources, with the difference between the two reported as net position. Over time, increases or decreases in net position may serve as a useful indicator of whether the financial position of the district is improving or deteriorating. The statement of activities presents information showing how the district’s net position changed during the most recent fiscal year. All changes in net position are reported as soon as the underlying event giving rise to the change occurs, regardless of the timing of related cash flows. Thus, revenues and expenses are reported in this statement for some items that will only result in cash flows in future fiscal periods (e.g., uncollected taxes). The government-wide financial statements outline functions of the district that are principally supported by property taxes and intergovernmental revenues. The activities of the district include instruction, support services - student and staff, operation and maintenance of plant facilities, student transportation, and operation of non-instructional services. Examples of the types of expenses that can be found in these categories include:
Instruction – costs associated with activities that deal directly with the interaction between students and teachers.
Support services – student and staff – includes costs for activities that serve as adjuncts for fulfilling the objectives of instruction such as counseling, social work, testing, health services, psychological service, speech pathology, library, and professional development for instructional staff.
Instructional and school leadership – costs associated with the overall general administrative responsibility for a single school or group of schools, including principals, deans and assistant principals, and school office support.
FINANCIAL SECTION: MANAGEMENT’S DISCUSSION AND ANALYSIS
26
Administrative support services – includes costs such as the superintendent’s office, board of education and related support, legal, audit, budgeting, accounting and financial reporting, payroll, human resource functions, purchasing, warehouse support, information services and communications, centralized printing services, and community relations.
Non-instructional services – includes costs for child nutrition (cafeteria).
Operation and maintenance of plant services – costs for utilities, grounds upkeep, custodial, security, building repairs and maintenance that do not meet capitalization thresholds or criteria, and the servicing and maintenance of school vehicles other than school buses.
Student transportation services – costs associated with transporting students including drivers, bus maintenance and depreciation, fuel, and transportation administration.
The government-wide financial statements can be found on pages 39 and 40 of this report. Fund financial statements – A fund is a grouping of related accounts that is used to maintain control over resources that have been segregated for specific activities or objectives. The district uses fund accounting to ensure and demonstrate compliance with finance-related legal requirements. Because the focus of governmental funds is narrower than that of the government-wide financial statements, it is useful to compare the information presented for governmental funds with similar information presented for governmental activities in the government-wide financial statements. By doing so, readers may better understand the long-term impact of the district’s near-term financing decision. Both the governmental fund balance sheet and the governmental fund statement of revenues, expenditures, and changes in fund balances provide a reconciliation to facilitate this comparison between governmental funds and governmental activities. These reconciliations are on pages 42 and 44, respectively. The basic governmental fund financial statements can be found on pages 41 and 43 of this report. Notes to the financial statements – The notes provide additional information that is essential to a full understanding of the data provided in the government-wide and fund financial statements. The notes to the financial statements can be found on pages 46 through 74 of this report. Other information – In addition to the basic financial statements and accompanying notes, this report also presents certain required supplementary information concerning the district’s budget process. The district adopts an annual expenditure budget for all governmental funds. A budgetary comparison schedule has been provided for the general fund as required supplementary information. Required supplementary information also includes the district’s contributions to Oklahoma Teacher’s Retirement System and the district’s proportionate share of the net pension liability. The required supplementary information can be found on pages 77 through 82 of this report. GOVERNMENT-WIDE FINANCIAL ANALYSIS Net position may serve as a useful indicator of a government’s financial position over time. In the case of the district, assets plus deferred outflows of resources exceeded liabilities plus deferred inflows of resources by $202.0 million as of June 30, 2017 and $186.8 million as of June 30, 2016, an increase of $15.2 million, or 8.1%. This increase is primarily due to $20.3 million increase in investments, $9.3 million increase in capital assets, offset by $11.2 million increase in bonds, capital leases and contracts, and $5.2 million net increase in the pension liability and deferred outflows and inflows of resources related to pensions. The largest portion of the district’s net position reflects its investment in capital assets (e.g. land, buildings, vehicles, fixtures and equipment, and construction in progress), net of accumulated depreciation plus deferred inflows/outflows of resources (if applicable) less any related debt used to acquire those assets still outstanding. The district uses these capital assets to provide services to its students; consequently, these assets are not available for future spending. Although the district’s investment in its capital assets is reported net of related debt, it should be noted that the resources

FINANCIAL SECTION: MANAGEMENT’S DISCUSSION AND ANALYSIS
27
needed to repay this debt must be provided from other sources, since the capital assets themselves cannot be used to liquidate these liabilities. The district’s financial position is the product of several types of financial transactions including the net results of activities, the acquisition and payment of debt, the acquisition and disposal of capital assets, and the depreciation of capital assets. A summary of the district’s net position is presented below:
Statement of Net Position at June 30,2017 2016 2015
Current assets $ 298.4 $ 302.1 $ 277.9 Non current investments 92.0 60.1 99.2 Capital assets, net 562.5 553.2 540.2
Total assets 952.9 915.4 917.3
Deferred outflows of resources 96.6 29.0 17.7
Current liabilities 119.3 115.2 134.9
Long-term liabilities 536.3 444.4 416.6 Total liabilities 655.6 559.6 551.5
Succeeding year property taxes 177.1 168.3 159.2 Deferred pension plan inflows 14.8 29.6 58.1
Total deferred inflows of resources 191.9 197.9 217.3
Net position:Net investment in capital assets 335.4 323.8 326.8 Restricted 82.1 97.3 62.4 Unrestricted (215.5) (234.3) (222.9)
Total net position $ 202.0 $ 186.8 $ 166.3
(millions)
Several significant current year transactions had an impact on the statement of net position, and include the following:
Non-current assets increased $31.9 million over 2016, primarily due to moving more of our investments into higher yielding mortgage-backed securities.
Deferred outflows increased $67.6 million, deferred inflows decreased $14.7 million and net pension liability increased $87.5 million over prior year.
Changes in net position. The district’s total revenues were $415.3 million, an increase of $6.6 million from the prior fiscal year total of $408.7 million primarily due to increased property tax collections of $6.2 million. The total cost of all programs and services was $400.1 million and $387.6 million for the fiscal years ended June 30, 2017 and 2016, respectively. This increase of $12.5 million reflects the emphasis of instruction and instruction-related services which represented $14.9 million of the increase, offset by $2.9 million decrease in administrative support services.
FINANCIAL SECTION: MANAGEMENT’S DISCUSSION AND ANALYSIS
28
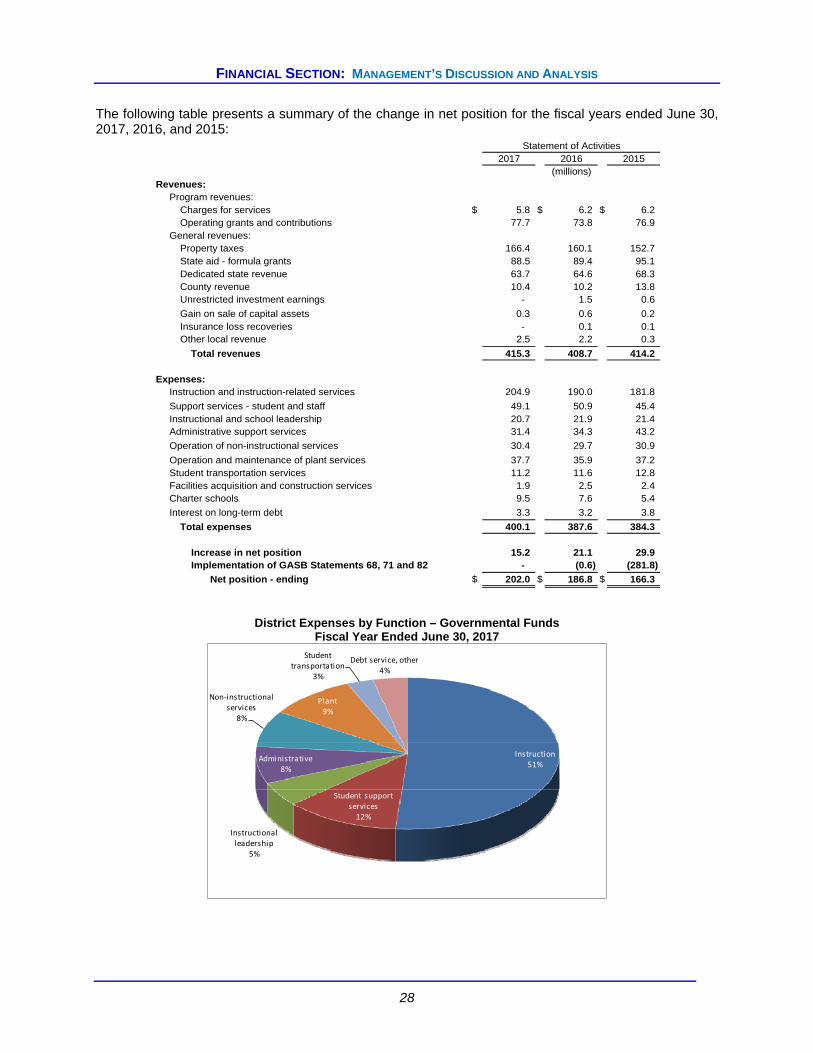
The following table presents a summary of the change in net position for the fiscal years ended June 30, 2017, 2016, and 2015:
Statement of Activities2017 2016 2015
(millions)Revenues:
Program revenues:Charges for services $ 5.8 $ 6.2 $ 6.2 Operating grants and contributions 77.7 73.8 76.9
General revenues:Property taxes 166.4 160.1 152.7 State aid - formula grants 88.5 89.4 95.1 Dedicated state revenue 63.7 64.6 68.3 County revenue 10.4 10.2 13.8 Unrestricted investment earnings - 1.5 0.6
Gain on sale of capital assets 0.3 0.6 0.2 Insurance loss recoveries - 0.1 0.1 Other local revenue 2.5 2.2 0.3
Total revenues 415.3 408.7 414.2
Expenses:Instruction and instruction-related services 204.9 190.0 181.8
Support services - student and staff 49.1 50.9 45.4 Instructional and school leadership 20.7 21.9 21.4 Administrative support services 31.4 34.3 43.2
Operation of non-instructional services 30.4 29.7 30.9
Operation and maintenance of plant services 37.7 35.9 37.2 Student transportation services 11.2 11.6 12.8 Facilities acquisition and construction services 1.9 2.5 2.4 Charter schools 9.5 7.6 5.4
Interest on long-term debt 3.3 3.2 3.8
Total expenses 400.1 387.6 384.3
Increase in net position 15.2 21.1 29.9 Implementation of GASB Statements 68, 71 and 82 - (0.6) (281.8)
Net position - ending $ 202.0 $ 186.8 $ 166.3
District Expenses by Function – Governmental Funds Fiscal Year Ended June 30, 2017
Instruction51%
Student support services12%
Instructional leadership
5%
Administrative8%
Non‐instructional services
8%
Plant9%
Student transportation
3%
Debt service, other4%

FINANCIAL SECTION: MANAGEMENT’S DISCUSSION AND ANALYSIS
29
Governmental activities – The district reports its activities in the following functional categories: instruction and instruction-related services, support services – student and staff, instructional and school leadership, administrative support services, operation of non-instructional services, operation and maintenance of plant facilities, student transportation services, facilities acquisition and construction services, charter schools, other expenses, and interest on long-term debt. The net expense shows the financial burden that was placed on the state and district’s taxpayers by each of these functions and is net of program-specific revenues and grants:
Total Net % Net
Expense Expense Expense
(millions)
Instruction and instruction-related services $ 204.9 $ 149.2 47%
Support services - student and staff 49.1 46.7 15%
Instructional and school leadership 20.7 20.7 7%
Administrative support services 31.4 31.4 10%
Operation of non-instructional services 30.4 5.3 2%
Operation and maintenance of plant services 37.7 37.3 11%
Student transportation services 11.2 11.2 4%
Facilities acquisition and construction services 1.9 1.9 1%
Charter schools 9.5 9.5 2%
Interest on long-term debt 3.3 3.3 1%
Total $ 400.1 $ 316.5 100%
FINANCIAL ANALYSIS OF DISTRICT’S FUNDS As noted earlier, the district uses fund accounting to ensure and demonstrate compliance with finance-related legal requirements. Governmental funds. The focus of the district’s governmental funds is to provide information on near-term inflow, outflows, and balances of expendable resources. Such information is useful in assessing the district’s financing requirements. In particular, the unassigned fund balance may serve as a useful measure of the district’s net resources available for spending at the end of the year. These funds are reported using the modified accrual method of accounting, which measures cash and all other financial assets that can be readily converted to cash. These statements provide a detailed short-term view of the school district’s operations and the services it provides. Because the focus of governmental funds is narrower than that of the government-wide financial statements, it is useful to compare the information presented for governmental funds with similar information presented for governmental activities in the government-wide financial statements. By doing so, readers may better understand the long-term impact of the government’s near-term financing decisions. Both the governmental fund balance sheet and the governmental fund statement of revenues, expenditures, and changes in fund balance provide a reconciliation to facilitate this comparison between governmental funds and governmental activities. The district’s fund financial statements provide detailed information about the most significant funds—not the district as a whole. The district’s governmental funds use the following accounting approach. All of the district’s services are reported in governmental funds. Governmental fund reporting focuses on showing how money flows into and out of funds and the balances left at year-end that are available for spending. They are reported using modified accrual accounting, which measures cash and all other financial assets that can readily be converted to cash. The governmental fund statements provide a detailed short-term view of the district’s operations and the services it provides. The district maintains three significant governmental funds: general, capital projects, and debt service. The following schedules present a summary of the general fund, capital projects fund and debt service

FINANCIAL SECTION: MANAGEMENT’S DISCUSSION AND ANALYSIS
30
fund revenues and other financing sources by type and expenditures by program for the period ended June 30, 2017 as compared to June 30, 2016. They also depict the amount and percentage increases and decreases in relation to prior year revenues and other financing resources.
General Fund, Capital Projects Fund, Debt Service Fund combined
Total Revenues, Other Financing Sources and Expenditures(Millions)
Percent2017 Increase Increase
2017 2016 Percent (Decrease) (Decrease)Amount Amount Of Total From 2016 From 2016
Revenues:Property taxes $ 154.2 $ 148.1 34.4% 6.1 4.1%Other local sources 11.5 6.2 2.6% 5.3 85.5%Intermediate sources 10.4 10.2 2.3% 0.2 2.0%Fees and charges 2.2 2.3 0.5% (0.1) -4.4%
State aid 160.7 164.7 35.9% (4.0) -2.4%Federal aid 31.3 33.1 7.0% (1.8) -5.4%Earnings on investments (0.2) 1.0 0.0% (1.2) -110.0%
Miscellaneous 2.8 2.7 0.6% 0.1 3.7%Subtotal $ 372.9 $ 368.3 83.3% 4.6 1.3%
Other financing sources 74.9 67.6 16.7% 7.3 10.8% Total $ 447.8 $ 435.9 100.0% 11.9 2.7%
Expenditures:Instruction and instruction-related services $ 181.2 $ 188.0 42.2% (6.8) -2.6%
Support services - student and staff 47.3 49.3 11.0% (2.0) -3.9%
Instructional and school leadership 20.7 21.9 4.8% (1.2) -5.5%Administrative support services 25.2 28.0 5.9% (2.8) -10.0%Operation of non-instructional services 1.5 1.5 0.4% - 0.0%Operation and maintenance of plant services 23.4 21.2 5.5% 2.2 9.9%
Student transportation services 15.5 16.1 3.8% (0.6) 0.0%
Facilities acquisition and construction services 36.9 40.5 8.6% (3.6) -8.7%Charter schools 9.5 7.6 2.2% 1.9 25.0%Debt service 67.3 81.6 15.6% (14.3) -17.5% Total $ 428.5 $ 455.7 100.0% (27.2) -6.0%
Change in fund balance $ 19.3 $ (19.8)

FINANCIAL SECTION: MANAGEMENT’S DISCUSSION AND ANALYSIS
31
General Fund
Revenues and Other Financing Sources(Millions)
Percent2017 Increase Increase
2017 2016 Percent (Decrease) (Decrease)Amount Amount Of Total From 2016 From 2016
Revenues:Property taxes $ 85.5 $ 83.3 28.0% 2.2 2.6%Other local sources 11.5 6.2 3.8% 5.3 85.5%Intermediate sources 10.4 10.2 3.4% 0.2 2.0%Fees and charges 2.2 2.3 0.7% (0.1) -4.3%
State aid 160.7 164.7 52.7% (4.0) -2.4%Federal aid 31.3 32.6 10.3% (1.3) -4.0%Earnings on investments 0.5 0.8 0.1% (0.3) -37.5%
Miscellaneous 2.8 2.7 0.9% 0.1 3.7%Revenues $ 304.9 $ 302.8 99.9% 2.1 0.7%
Other financing sources 0.3 0.8 0.1% (0.5) -62.5% Total $ 305.2 $ 303.6 100.0% 1.6 0.5%
Revenues increased by $1.6 million compared to 2016:
Property taxes increased by $2.2 million due to an increase in the net assessed valuation of 3.8%.
Other local sources increased by $5.3 million. The Foundation for Tulsa Schools increased contributions by $4.6 million.
State aid decreased by $4.0 million. The state aid factors went down by $29 per child and ad valorem chargeables increased by $3.1 million.
Expenditures(Millions)
Percent
2017 Increase Increase2017 2016 Percent (Decrease) (Decrease)
Amount Amount Of Total From 2016 From 2016Instruction and instruction-related services $ 170.3 $ 177.9 56.4% (7.6) -4.3%
Support services - student and staff 44.3 45.9 14.7% (1.6) -3.5%
Instructional and school leadership 20.7 21.9 6.8% (1.2) -5.5%Administrative support services 21.5 23.2 7.1% (1.7) -7.3%Operation of non-instructional services 1.5 1.5 0.5% - 0.0%Operation and maintenance of plant services 23.2 20.5 7.7% 2.7 13.2%
Student transportation services 11.2 11.2 3.7% - 0.0%
Charter schools 9.5 7.6 3.1% 1.9 25.0%Total $ 302.2 $ 309.7 100.0% (7.5) -2.4%
Change in fund balance $ 3.0 $ (6.1)
Expenditures decreased by $7.5 million primarily due to a $7.6 million decrease in instruction and instruction-related services.
FINANCIAL SECTION: MANAGEMENT’S DISCUSSION AND ANALYSIS
32
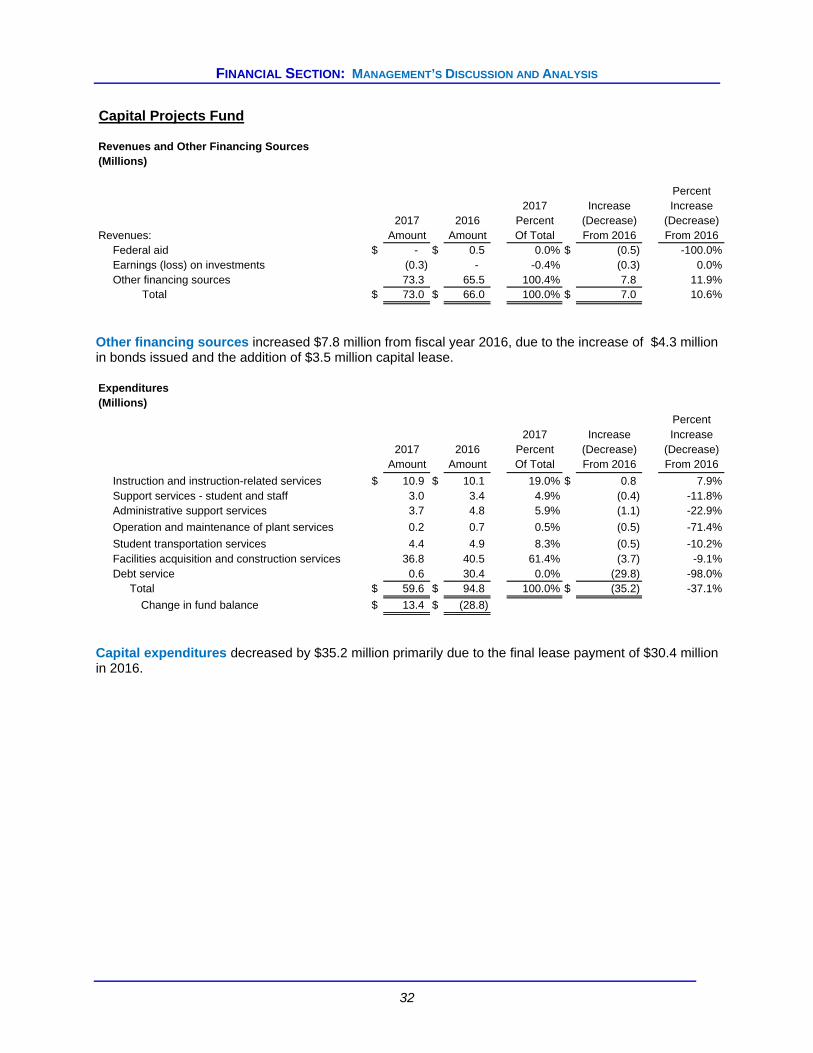
Capital Projects Fund
Revenues and Other Financing Sources(Millions)
Percent2017 Increase Increase
2017 2016 Percent (Decrease) (Decrease)Revenues: Amount Amount Of Total From 2016 From 2016
Federal aid $ - $ 0.5 0.0% $ (0.5) -100.0%Earnings (loss) on investments (0.3) - -0.4% (0.3) 0.0%Other financing sources 73.3 65.5 100.4% 7.8 11.9%
Total $ 73.0 $ 66.0 100.0% $ 7.0 10.6%
Other financing sources increased $7.8 million from fiscal year 2016, due to the increase of $4.3 million in bonds issued and the addition of $3.5 million capital lease. Expenditures(Millions)
Percent2017 Increase Increase
2017 2016 Percent (Decrease) (Decrease)Amount Amount Of Total From 2016 From 2016
Instruction and instruction-related services $ 10.9 $ 10.1 19.0% $ 0.8 7.9%Support services - student and staff 3.0 3.4 4.9% (0.4) -11.8%Administrative support services 3.7 4.8 5.9% (1.1) -22.9%
Operation and maintenance of plant services 0.2 0.7 0.5% (0.5) -71.4%
Student transportation services 4.4 4.9 8.3% (0.5) -10.2%Facilities acquisition and construction services 36.8 40.5 61.4% (3.7) -9.1%Debt service 0.6 30.4 0.0% (29.8) -98.0%
Total $ 59.6 $ 94.8 100.0% $ (35.2) -37.1%
Change in fund balance $ 13.4 $ (28.8)
Capital expenditures decreased by $35.2 million primarily due to the final lease payment of $30.4 million in 2016.

FINANCIAL SECTION: MANAGEMENT’S DISCUSSION AND ANALYSIS
33
Debt Service Fund
Revenues and Other Financing Sources(Millions)
Percent2017 Increase Increase
2017 2016 Percent (Decrease) (Decrease)Amount Amount Of Total From 2016 From 2016
Revenues:Property taxes $ 68.7 $ 64.8 98.7% $ 3.9 6.0%Earnings (loss) on investments (0.4) 0.2 -0.6% (0.6) -300.0%Other financing sources 1.3 1.3 1.9% - 0.0%
Total $ 69.6 $ 66.3 100.0% $ 3.3 5.0%
Property taxes increased by $3.9 million to provide debt service for the general obligation bonds. (Millions)
Percent2017 Increase Increase
2017 2016 Percent (Decrease) (Decrease)
Amount Amount Of Total From 2016 From 2016Debt service 66.7 51.2 100.0% 15.5 30.3% Total $ 66.7 $ 51.2 100.0% $ 15.5 30.3%
Change in fund balance $ 2.9 $ 15.1
Debt service expenditures increased by $15.5 million due to the increase in current principal and interest payments on the general obligation bonds. BUDGETARY HIGHLIGHTS The district’s budget is prepared according to Oklahoma law and is based on accounting for certain transactions in appropriated funds on the basis of cash receipts, disbursements, and encumbrances. The most significant budgeted fund is the general fund, which, including the fund balance, represented 56% of all original budgets of appropriated funds. Only the general fund is discussed below. For 2017, the district originally budgeted general fund revenues of $291.4 million and expenditures of $294.8 million. Plans were revised and an amended budget was filed in April 2017. The revised budget increased revenue expectations to $294.4 million and increased projected expenditures to $296.4 million. Actual revenue on a budgetary basis for the general fund was $0.4 million less than projected. Actual expenditures for the year were $2.7 million below the final budget, primarily due to:
Purchased services actual expenditures were $2.8 million less than expected primarily due to expenditures in several areas being less than expected:
o Professional, technical and rental services were $3.0 million less than expected o Travel was $.4 million less than expected o Other purchased services was $.6 million more than expected
Supplies actual expenditure was $3.7 million less than expected primarily due to expenditures in several areas being less than expected:
o Cleaning, paper and general supplies were $1.0 million less than expected o Electricity and heating were $.2 million less than expected

FINANCIAL SECTION: MANAGEMENT’S DISCUSSION AND ANALYSIS
34
o Fuel costs were $.5 million less than expected o Book orders were $.9 million less than expected o Co-curricular supplies were $1.1 million less than expected
Expenditures for instruction and instruction-related services, support services, instructional and school leadership, and direct payments to charter schools were budgeted at a final budget of $236.5 million or 80% of total budgeted expenditures. Actual expenditures for these same items were $234 million or 80% of total actual expenditures. The actual fund balance carry forward of $31.1 million was $3.0 million more than the final budgeted amount of $28.1 million. Capital assets. As of June 30, 2017, the district had invested $562.5 million, net of accumulated depreciation of $367.3 million, in capital assets including school buildings, athletic facilities, buses and other vehicles, computers, and other equipment. This amount represented a net increase of $9.3 million, or 1.7%.
Decreases
June 30, and June 30,
Capital assets (at cost) 2016 Increases Transfers 2017
Land $ 4.2 $ 0.8 $ - $ 5.0 Construction in progress 41.5 34.8 (41.8) 34.5 Assets out of service 2.4 - - 2.4 Buildings 778.4 - 39.9 818.3 Equipment and vehicles 68.6 4.7 (3.7) 69.6
Total asset cost 895.1 40.3 (5.6) 929.8
Accumulated depreciation (341.9) (29.9) 4.5 (367.3)
Capital assets (net) $ 553.2 $ 10.4 $ (1.1) 562.5
(millions)
Additional information related to the district’s capital assets can be found in note 6 on page 63 of this report.
Debt administration. At the end of the fiscal year, the district had $253.1 million in bonds and capital leases outstanding, $66.4 million due within one year. The following table presents a summary of the district’s outstanding long-term debt for the fiscal years ending June 30, 2017 and 2016.
June 30,
2017 2016 Change
Capital leases (at present value) $ 3.0 $ - $ 3.0 General obligation bonds 246.8 238.8 8.0 Net unamortized bond premium 3.3 3.1 0.2 Total $ 253.1 $ 241.9 $ 11.2
(millions)
State statutes currently limit the amount of total aggregate net indebtedness to ten percent of the net assessed valuation of taxable property within the district. As of June 30, 2017, the district had a legal debt limitation of $241.2 million, which was $65.5 million more than the district’s net bonded indebtedness.
FINANCIAL SECTION: MANAGEMENT’S DISCUSSION AND ANALYSIS
35
In March 2015, the electors approved authority for the issuance of $415 million in combined purpose bonds for building improvement and equipment acquisitions. At June 30, 2017, $87.3 million had been issued with $327.7 million remaining available for future issuances. See note 8 for additional information regarding the district’s long-term debt on pages 65-66. CONTACTING THE DISTRICT’S FINANCIAL MANAGEMENT This financial report is designed to provide citizens, taxpayers, parents, students, investors and creditors with a general overview of the district’s finances to show accountability for the money it receives. Additional details can be requested at the following address: Tulsa Public Schools Nolberto Delgadillo Chief Financial Officer 3027 S. New Haven Ave. Tulsa, OK 74114 Or visit our website at: www.tulsaschools.org

FINANCIAL SECTION: MANAGEMENT’S DISCUSSION AND ANALYSIS
36
This page is left blank intentionally
37
Basic Financial Statements

38
This page is left blank intentionally
FINANCIAL SECTION: BASIC FINANCIAL STATEMENTS
39
GovernmentalActivities
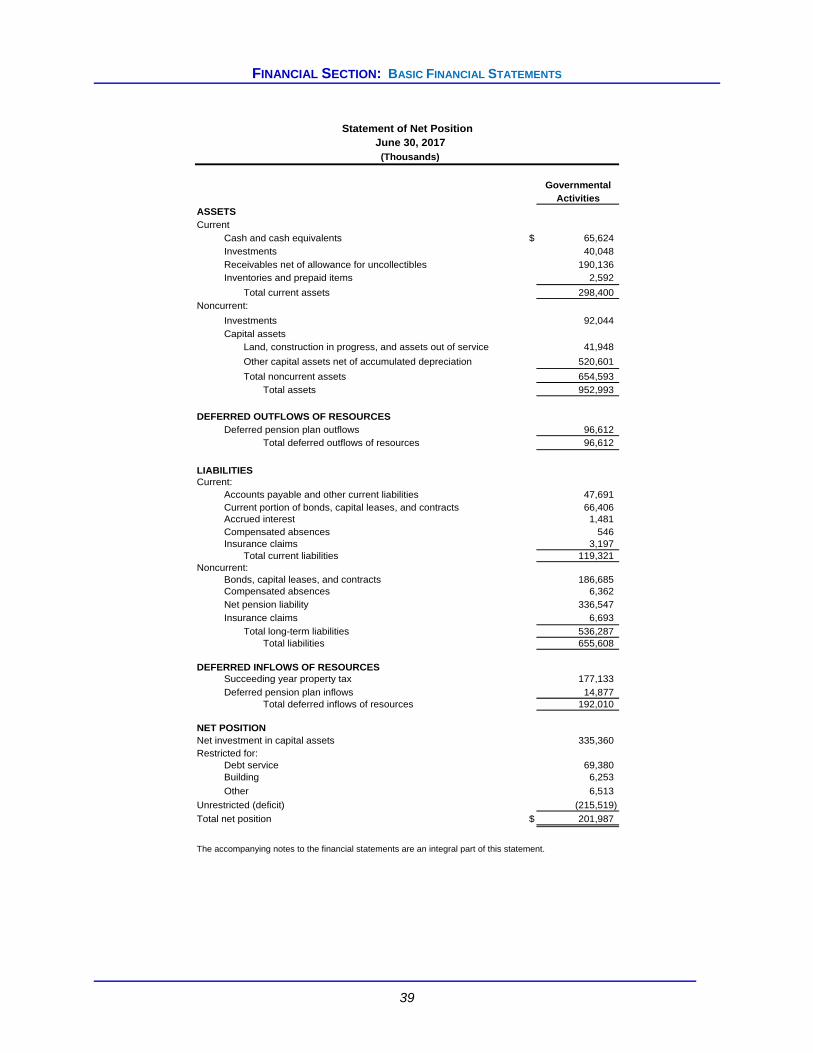
ASSETSCurrent
Cash and cash equivalents $ 65,624 Investments 40,048 Receivables net of allowance for uncollectibles 190,136 Inventories and prepaid items 2,592
Total current assets 298,400 Noncurrent:
Investments 92,044 Capital assets
Land, construction in progress, and assets out of service 41,948
Other capital assets net of accumulated depreciation 520,601
Total noncurrent assets 654,593 Total assets 952,993
DEFERRED OUTFLOWS OF RESOURCESDeferred pension plan outflows 96,612
Total deferred outflows of resources 96,612
LIABILITIESCurrent:
Accounts payable and other current liabilities 47,691 Current portion of bonds, capital leases, and contracts 66,406 Accrued interest 1,481 Compensated absences 546 Insurance claims 3,197
Total current liabilities 119,321 Noncurrent:
Bonds, capital leases, and contracts 186,685 Compensated absences 6,362 Net pension liability 336,547 Insurance claims 6,693
Total long-term liabilities 536,287 Total liabilities 655,608
DEFERRED INFLOWS OF RESOURCESSucceeding year property tax 177,133
Deferred pension plan inflows 14,877 Total deferred inflows of resources 192,010
NET POSITIONNet investment in capital assets 335,360 Restricted for:
Debt service 69,380 Building 6,253
Other 6,513
Unrestricted (deficit) (215,519)
Total net position $ 201,987
The accompanying notes to the financial statements are an integral part of this statement.
Statement of Net Position June 30, 2017
(Thousands)

FINANCIAL SECTION: BASIC FINANCIAL STATEMENTS
40
Charges Operating
for Grants and Net
Expenses Services Contributions Expense
Instruction and instruction-related services $ 204,832 $ - $ 55,617 $ (149,215)
Support services - student and staff 49,129 152 2,274 (46,703)
Instructional and school leadership 20,667 - - (20,667)
Administrative support services 31,430 - - (31,430)
Operation of non-instructional services 30,437 5,278 19,836 (5,323)
Operation and maintenance of plant services 37,732 413 1 (37,318)
Student transportation services 11,151 - - (11,151)
Facilities acquisition and construction services 1,895 - - (1,895)
Charter schools 9,491 - - (9,491)
Interest on long-term debt 3,341 - - (3,341)
Unrestricted investment loss 8 - - (8)
Total primary government $ 400,113 $ 5,843 $ 77,728 $ (316,542)
General revenues:
Taxes:
Property taxes, levied for general purposes 97,371
Property taxes, levied for debt service 69,031
State aid - formula grants 88,459
Unrestrictetd dedicated state revenue 63,653
County 4 mill levy and apportionment 10,410
Gain on sale of capital assets 296
Insurance loss recoveries 7
Other local revenue 2,493
Total general revenues 331,720
Change in net position 15,178
Net position - beginning 186,809
Net position - ending $ 201,987
The accompanying notes to the financial statements are an integral part of this statement.
Functions/Programs
Statement of Activities
For the Year Ended June 30, 2017(Thousands)
FINANCIAL SECTION: BASIC FINANCIAL STATEMENTS
41
TotalGeneral Capital Projects Debt Service Nonmajor Governmental
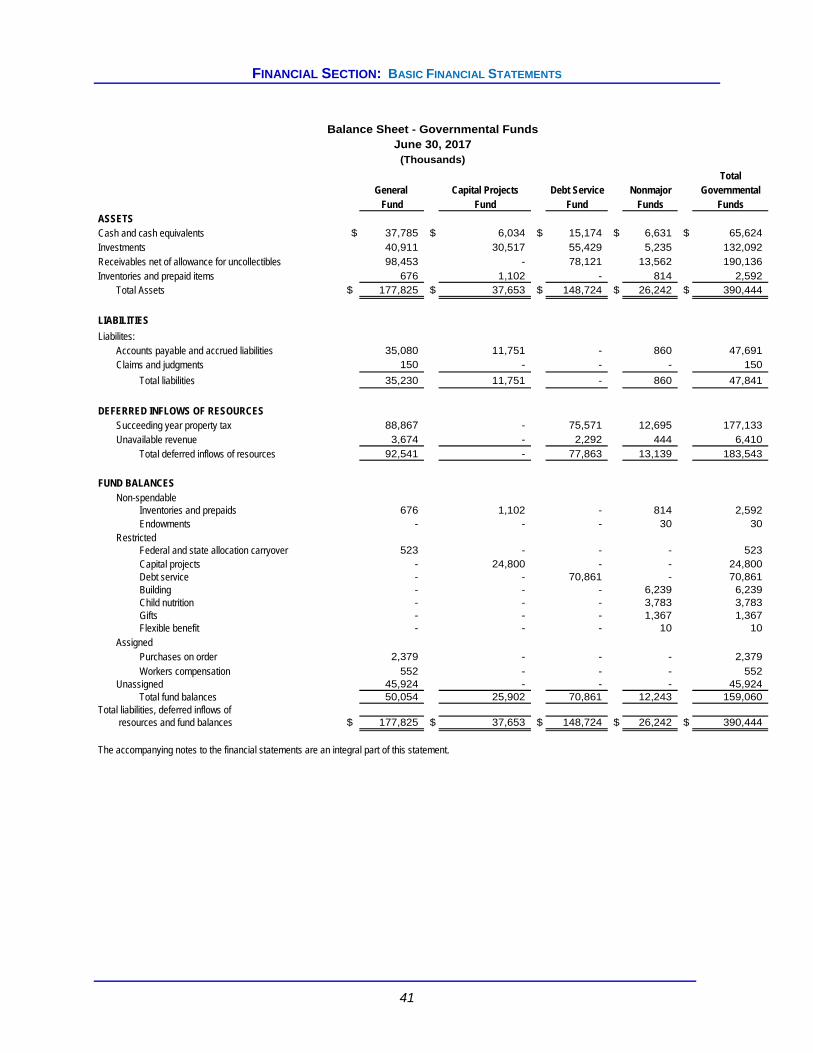
Fund Fund Fund Funds FundsASSETSCash and cash equivalents $ 37,785 $ 6,034 $ 15,174 $ 6,631 $ 65,624
Investments 40,911 30,517 55,429 5,235 132,092
Receivables net of allowance for uncollectibles 98,453 - 78,121 13,562 190,136
Inventories and prepaid items 676 1,102 - 814 2,592 Total Assets $ 177,825 $ 37,653 $ 148,724 $ 26,242 $ 390,444
LIABILITIES
Liabilites:Accounts payable and accrued liabilities 35,080 11,751 - 860 47,691 Claims and judgments 150 - - - 150
Total liabilities 35,230 11,751 - 860 47,841
DEFERRED INFLOWS OF RESOURCESSucceeding year property tax 88,867 - 75,571 12,695 177,133
Unavailable revenue 3,674 - 2,292 444 6,410
Total deferred inflows of resources 92,541 - 77,863 13,139 183,543
FUND BALANCESNon-spendable
Inventories and prepaids 676 1,102 - 814 2,592 Endowments - - - 30 30
RestrictedFederal and state allocation carryover 523 - - - 523 Capital projects - 24,800 - - 24,800 Debt service - - 70,861 - 70,861 Building - - - 6,239 6,239 Child nutrition - - - 3,783 3,783 Gifts - - - 1,367 1,367 Flexible benefit - - - 10 10
AssignedPurchases on order 2,379 - - - 2,379
Workers compensation 552 - - - 552 Unassigned 45,924 - - - 45,924
Total fund balances 50,054 25,902 70,861 12,243 159,060 Total liabilities, deferred inflows of
resources and fund balances $ 177,825 $ 37,653 $ 148,724 $ 26,242 $ 390,444
The accompanying notes to the financial statements are an integral part of this statement.
(Thousands)
Balance Sheet - Governmental FundsJune 30, 2017

FINANCIAL SECTION: BASIC FINANCIAL STATEMENTS
42
Total fund balances - governmental funds $ 159,060
The cost of capital assets purchased or constructed is reported as an expenditurein the governmental funds. The Statement of Net Position includes those capital
assets among the assets of the District as a whole. Capital assets used in governmental activities are not financial resources and therefore are not reported as assets in governmental funds.
Land $ 5,017
Construction in progress 34,509
Assets out of service 2,422
Buildings 818,259
Furniture and equipment 69,669
Accumulated depreciation (367,327) 562,549
Long-term liabilities, including bonds payable, are not due and payable in the
current period and therefore are not reported as governmental fund liabilities.
Interest payable on debt and other long-term obligations is also not recorded
in the governmental funds but is reported in the Statement of Net Position. All liabilities, both current and long-term, are reported in the Statement ofNet Position. Liabilities not reported as governmental fundliabilities include:
Bonds, capital leases and contracts $ (253,091) Interest payable (1,481)
Compensated absences (6,908)
Net pension liability (336,547)
Insurance claims (9,740) (607,767)
Other long-term assets are not available to pay for current period expenditures
and, therefore, are reported as unavailable revenue in the governmental funds. 6,410
Pension related deferred outflows and inflows are not due and payable in the current period,
therefore, they are not reported in governmental funds.Deferred pension plan outflows 96,612 Deferred pension plan inflows (14,877)
Total net position $ 201,987
The accompanying notes to the financial statements are an integral part of this statement.
Reconciliation of the Governmental FundsBalance Sheet to the Statement of Net Position
June 30, 2017
(Thousands)

FINANCIAL SECTION: BASIC FINANCIAL STATEMENTS
43
Capital Debt Total
General Projects Service Nonmajor Governmental
Fund Fund Fund Funds Funds
REVENUES
Property taxes $ 85,468 $ - $ 68,737 $ 12,197 $ 166,402
Other local sources 11,545 - - 1,517 13,062
Intermediate sources 10,410 - - - 10,410
Fees and charges 2,175 - - 3,670 5,845
State aid 160,653 - - 4,047 164,700
Federal aid 31,263 - - 21,177 52,440
Earnings (loss) on investments 468 (252) (378) 223 61
Miscellaneous 2,828 - - 157 2,985
Total revenues 304,810 (252) 68,359 42,988 415,905
EXPENDITURES
Current:
Instruction and instruction-related services 170,286 10,881 - 1,217 182,384
Support services - student and staff 44,325 2,978 - 101 47,404
Instructional and school leadership 20,666 - - 2 20,668
Administrative support services 21,541 3,699 - 775 26,015
Operation of non-instructional services 1,494 - - 28,467 29,961
Operation and maintenance of plant services 23,222 200 - 12,959 36,381
Student transportation services 11,171 4,408 - 13 15,592
Facilities acquisition and construction services 6 36,861 - 639 37,506
Charter schools 9,491 - - - 9,491
Debt service
Principal - 564 61,750 - 62,314
Interest - 2 4,967 - 4,969
Total expenditures 302,202 59,593 66,717 44,173 472,685
Excess (deficiency) revenues over
expenditures 2,608 (59,845) 1,642 (1,185) (56,780)
OTHER FINANCING SOURCES
Capital lease - 3,547 - - 3,547
Bond issuances - 69,770 - - 69,770
Premium on bond issuances - - 1,292 - 1,292
Insurance recoveries 4 - - 3 7 Proceeds from sale of capital assets 296 - - - 296
Net change in fund balances 2,908 13,472 2,934 (1,182) 18,132
Fund balance -- June 30, 2016 47,146 12,430 67,927 13,425 140,928
Fund balance -- June 30, 2017 $ 50,054 $ 25,902 $ 70,861 $ 12,243 $ 159,060
The accompanying notes to the financial statements are an integral part of this statement.
Statement of Revenues, Expenditures, and Changes in Fund Balances -
Governmental FundsFor the Year Ended June 30, 2017
(Thousands)
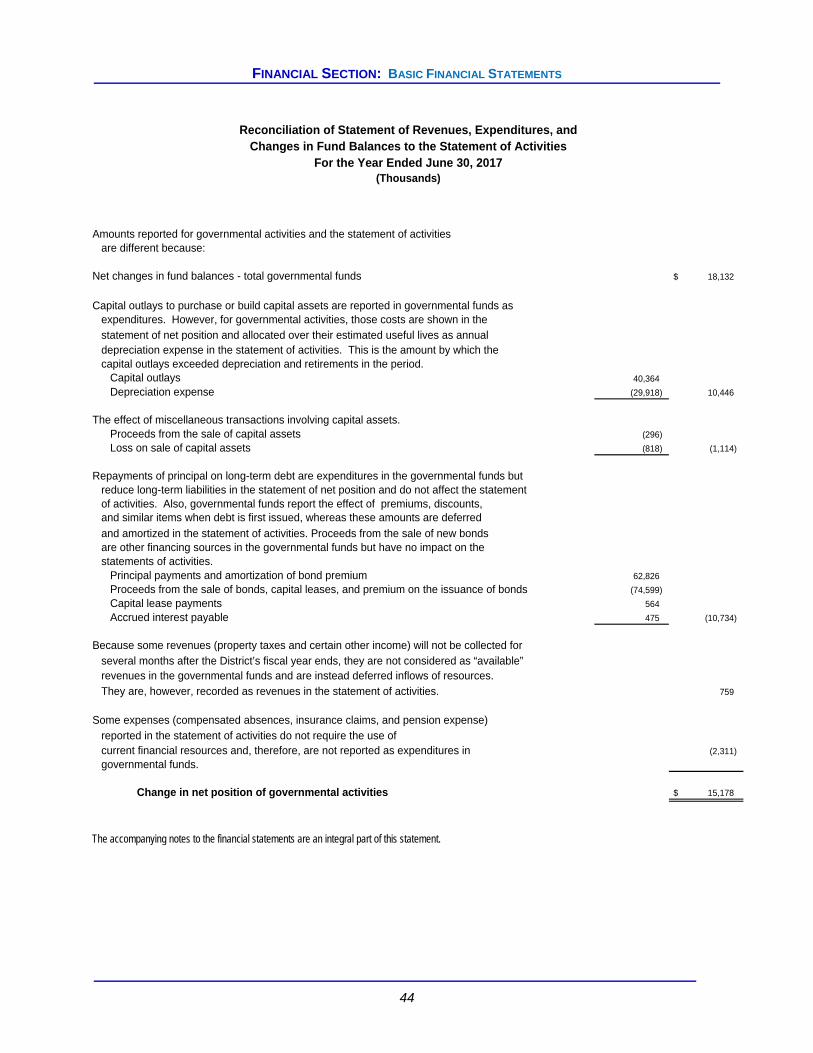
FINANCIAL SECTION: BASIC FINANCIAL STATEMENTS
44
Amounts reported for governmental activities and the statement of activities are different because:
Net changes in fund balances - total governmental funds 18,132 $
Capital outlays to purchase or build capital assets are reported in governmental funds asexpenditures. However, for governmental activities, those costs are shown in the statement of net position and allocated over their estimated useful lives as annualdepreciation expense in the statement of activities. This is the amount by which thecapital outlays exceeded depreciation and retirements in the period.
Capital outlays 40,364
Depreciation expense (29,918) 10,446
The effect of miscellaneous transactions involving capital assets. Proceeds from the sale of capital assets (296)
Loss on sale of capital assets (818) (1,114)
Repayments of principal on long-term debt are expenditures in the governmental funds butreduce long-term liabilities in the statement of net position and do not affect the statementof activities. Also, governmental funds report the effect of premiums, discounts,and similar items when debt is first issued, whereas these amounts are deferred
and amortized in the statement of activities. Proceeds from the sale of new bonds are other financing sources in the governmental funds but have no impact on the statements of activities.
Principal payments and amortization of bond premium 62,826
Proceeds from the sale of bonds, capital leases, and premium on the issuance of bonds (74,599)
Capital lease payments 564
Accrued interest payable 475 (10,734)
Because some revenues (property taxes and certain other income) will not be collected for several months after the District’s fiscal year ends, they are not considered as “available” revenues in the governmental funds and are instead deferred inflows of resources. They are, however, recorded as revenues in the statement of activities. 759
Some expenses (compensated absences, insurance claims, and pension expense)reported in the statement of activities do not require the use of current financial resources and, therefore, are not reported as expenditures in (2,311)
governmental funds.
Change in net position of governmental activities 15,178 $
The accompanying notes to the financial statements are an integral part of this statement.
Reconciliation of Statement of Revenues, Expenditures, andChanges in Fund Balances to the Statement of Activities
For the Year Ended June 30, 2017(Thousands)
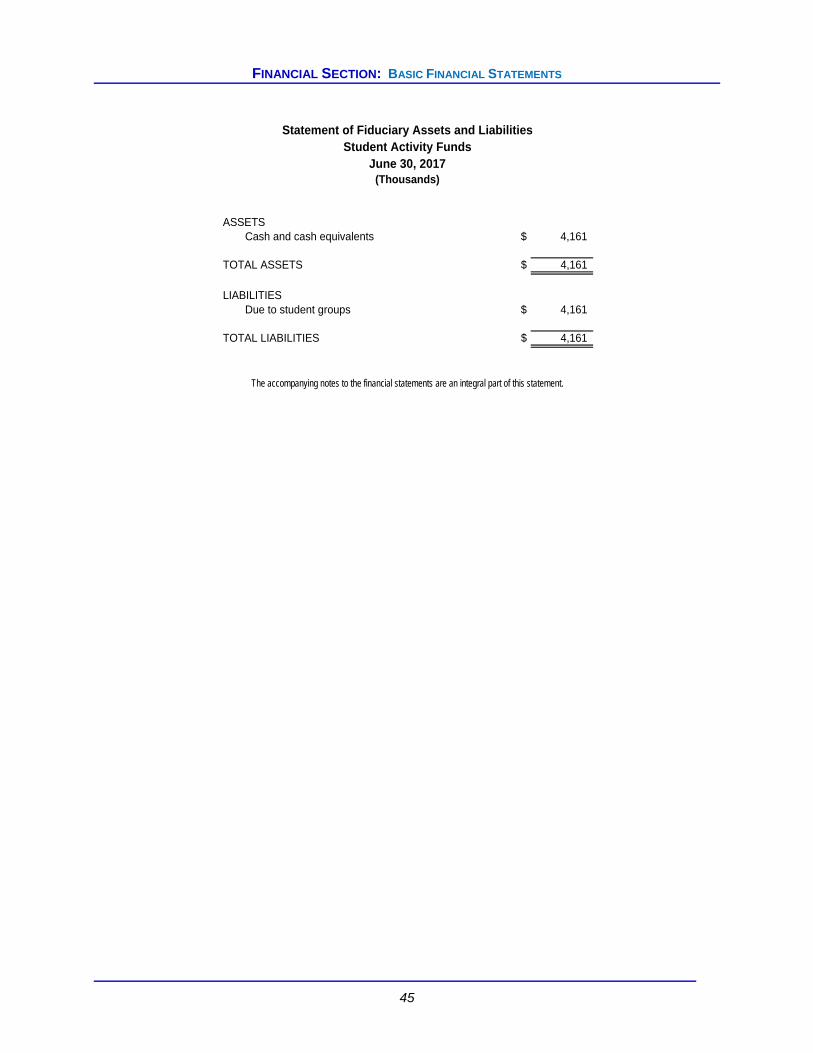
FINANCIAL SECTION: BASIC FINANCIAL STATEMENTS
45
ASSETSCash and cash equivalents $ 4,161
TOTAL ASSETS $ 4,161
LIABILITIESDue to student groups $ 4,161
TOTAL LIABILITIES $ 4,161
Student Activity FundsJune 30, 2017
(Thousands)
The accompanying notes to the financial statements are an integral part of this statement.
Statement of Fiduciary Assets and Liabilities

FINANCIAL SECTION: BASIC FINANCIAL STATEMENTS
NOTES TO THE FINANCIAL STATEMENTS Year ended June 30, 2017
Note 1. SUMMARY OF SIGNIFICANT ACCOUNTING POLICIES
46
Basis of Presentation
The financial statements of the district have been prepared in conformity with accounting principles generally accepted in the United States of America as applied to government units as promulgated by the Governmental Accounting Standards Board (GASB), the accepted standard-setting body for governmental accounting and financial reporting principles. The more significant of the district’s accounting policies are described below. Reporting Entity
The district is a corporate body for public purposes created under Title 70 of the Oklahoma Statutes and is, accordingly, a separate entity for operating and financial reporting purposes. The general operating authority for the public school system is the Oklahoma School Code contained in Title 70, Oklahoma Statutes. The district is part of the public school system of Oklahoma under the general direction and control of the state Board of Education. The district is the primary government that has a separately elected governing body, is legally separate and is fiscally independent of other state or local governments. The governing body of the district, the Board of Education, is composed of elected members. The appointed superintendent is the executive officer of the district. As required by accounting principles generally accepted in the United States of America, the basic financial statements present the reporting entity which consists of the primary government, organizations for which the primary government is financially accountable, and other organizations for which the nature and significance of their relationship with the primary government are such that exclusion could cause the district’s basic financial statements to be misleading. The district has not identified any organizations that should be included in the district’s reporting entity. Basic Financial Statements
The government-wide financial statements (i.e. the statement of net position and the statement of activities) report information on all of the non-fiduciary activities of the district. Essentially all interfund activity has been removed from these statements. The statement of activities demonstrates the degree to which the direct expenses of a given function is offset by program revenues. Direct expenses are those that are clearly identifiable with a specific function. Indirect expenses of other functions are not allocated to those functions but are reported separately in the statement of activities. Depreciation expense is specifically identified by function and is included in the direct expenses to each function. Interest on general long-term debt is considered an indirect expense and is reported separately in the statement of activities. Program revenues include 1) charges to customers or applicants who purchase, use or directly benefit from goods, services, or privileges provided by a given function and 2) grants and contributions that are restricted to meeting the operational or capital requirements of a particular function. Taxes and other items not properly included among program revenues are reported as general revenues. There are two categories of funds: governmental and fiduciary. Separate financial statements are provided for governmental funds and fiduciary funds, even though the latter are excluded from the government-wide financial statements. Major individual governmental funds are reported as separate columns in the fund financial statements. All remaining governmental funds are aggregated and reported as nonmajor funds.

FINANCIAL SECTION: BASIC FINANCIAL STATEMENTS
NOTES TO THE FINANCIAL STATEMENTS Year ended June 30, 2017
Note 1. SUMMARY OF SIGNIFICANT ACCOUNTING POLICIES (continued)
47
Funds
The district reports its financial activities through the use of fund accounting. This is a system of accounting wherein transactions are reported in self-balancing sets of accounts to reflect results of activities. Fund accounting segregates funds according to their intended purpose and is used to aid management in demonstrating compliance with finance-related legal and contractual provisions. The minimum number of funds is maintained, consistent with legal and managerial requirements. There are two categories of funds: governmental and fiduciary.
Governmental Funds
Governmental funds are those through which most governmental functions typically are financed. Governmental fund reporting focuses on the sources, uses and balances of current financial resources. Expendable assets are assigned to the various governmental funds according to the purposes for which they may or must be used. Current liabilities are assigned to the fund from which they will be paid. The difference between governmental fund assets and liabilities plus deferred inflows of resources is reported as fund balance. All governmental funds can be classified into one of five types: the general fund, capital projects funds, debt service funds, special revenue funds and permanent funds. In the fund financials, data from each major fund is presented in a separate single column while data from all the nonmajor funds are aggregated into a single column. The following are the district’s major governmental funds:
General fund – The general fund is used to account for all financial transactions except those required to be accounted for in another fund. Activities previously reported in the workers compensation fund have been included with the general fund. Combining schedules are included to show the separate accounting for workers compensation and general fund. Major revenue sources include state and local property taxes and state funding under the Foundation and Incentive Aid Program. Expenditures include all costs associated with the daily operations of the schools except for programs funded for building repairs and maintenance, school construction, and debt service on bonds and other long-term debt. The general fund includes federal and state restricted monies that must be expended for specific programs.
Capital projects fund – The capital projects fund is comprised of the district’s bond funds and is used to account for the proceeds of bond sales to be used exclusively for acquiring school sites, constructing and equipping new school facilities, renovating existing facilities, acquiring transportation, equipment, textbooks and classroom learning materials.
Debt service fund – The debt service fund is the district’s sinking fund and is used to account for the accumulation of financial resources for the payment of general long-term debt (including judgments) principal, interest, and related costs. The primary revenue sources are local property taxes levied specifically for debt service and interest earnings from temporary investments.
FINANCIAL SECTION: BASIC FINANCIAL STATEMENTS
NOTES TO THE FINANCIAL STATEMENTS Year ended June 30, 2017
Note 1. SUMMARY OF SIGNIFICANT ACCOUNTING POLICIES (continued)
48
The following are the district’s nonmajor governmental funds:
Special revenue funds – Special revenue funds are used to account for specific revenue sources that are restricted, committed, or assigned to expenditures for particular purposes.
Building fund – The building fund consists mainly of monies derived from property taxes levied for the purpose of erecting, remodeling, repairing, or maintaining school buildings and for purchasing furniture, equipment and computer software to be used on or for school district property, for paying energy and utility costs, for purchasing telecommunications services, for paying fire and casualty insurance premiums for school facilities, and for purchasing security systems.
Child nutrition fund – The child nutrition fund consists of monies derived from federal and state financial assistance and food sales. This fund is used to account for the various nutrition programs provided to students.
Gifts fund – The gifts fund receives its assets by way of philanthropic foundations, individuals, or private organizations for which no repayment or special service to the contributor is expected. This fund is used to promote the general welfare of the district.
Flexible benefit fund – The flexible benefit fund is used to account for forfeited amounts received from the third-party administrator of the district’s cafeteria plan. These funds must be used for administering employee benefit programs.
Arbitrage rebate fund – The arbitrage rebate fund is used to accumulate the earnings of certain bond issues to which the Internal Revenue Service arbitrage rules apply. These funds will either be retained or transferred to the Internal Revenue Service, depending on future financial events and computations. There was no activity in this fund during the year ended June 30, 2017.
Permanent fund – Permanent funds are used to report resources that are legally restricted to the extent that only earnings, not principal, may be used for purposes that support the government’s program.
Endowment fund – The Texaco endowment scholarship fund accounts for an endowment whose earnings are restricted to expenditures for awarding college scholarships to Memorial high school graduates.
Fiduciary Funds
As of June 30, 2017, the fiduciary fund category was comprised entirely of agency-type funds. Agency funds are custodial in nature (assets equal liabilities) and do not involve measurement of results of operations. The district’s agency funds account for monies collected principally through fundraising efforts of the students and district sponsored groups. Fiduciary funds are not included in the government-wide financial statements.
Measurement Focus, Basis of Accounting, and Financial Statement Presentation
The government-wide financial statements are reported using the economic resources measurement focus and the accrual basis of accounting, as are the fiduciary fund financial statements. The economic resources measurement focus is not applicable to the agency funds (which comprise the entire fiduciary fund category) and therefore have no measurement focus. Revenues are recorded when earned and expenses are recorded when a liability is incurred, regardless of the timing of related cash flows. Property taxes are recognized as revenues in the year for which they are budgeted. Grants and similar items are recognized as revenue as soon as all eligibility requirements imposed by the provider have been met.
FINANCIAL SECTION: BASIC FINANCIAL STATEMENTS
NOTES TO THE FINANCIAL STATEMENTS Year ended June 30, 2017
Note 1. SUMMARY OF SIGNIFICANT ACCOUNTING POLICIES (continued)
49
Governmental fund financial statements are reported using the current financial resources measurement focus and the modified accrual basis of accounting. All sources of revenues are recognized as soon as they are both measurable and available. Revenues are considered to be available when they are collectible within the current period or soon enough thereafter to pay liabilities of the current period. For this purpose, the district considers revenues to be available if they are collected within 60 days of the end of the current fiscal period. Expenditures generally are recorded when a liability is incurred, as under accrual accounting. However, debt service expenditures, as well as expenditures related to compensated absences, pension, claims and judgments, are recorded only when payment is due. All sources of revenue associated with the current fiscal year are considered to be susceptible to accrual and so have been recognized as revenues of the current fiscal year to the extent the availability criteria discussed above was met.
Cash and Cash Equivalents
The district considers all cash on hand, demand deposits and highly liquid investments with original maturity of three months or less when purchased to be cash and cash equivalents. There were no cash equivalents at June 30, 2017.
Investments
Investments consist of United States Treasury securities and agencies and certificates of deposit. Investments, except for non-negotiable certificates of deposit, are recorded at fair value. See note 3 for discussion regarding fair value measurements. The investment income including the net change in fair value of investments is recognized and reported as earnings (loss) on investments. Non-negotiable certificates of deposit are recorded at cost.
Inventories and Prepaid Items
All inventories are valued at average cost using the first-in, first-out method. Inventories of governmental funds are recorded as expenditures when consumed rather than when purchased. Certain payments to vendors reflect costs applicable to future accounting periods and are recorded as prepaid items in both the government-wide and fund financial statements. These prepaid items are recorded as expenditures/expenses when consumed rather than when purchased.
Capital Assets
Capital assets, which include land, building, building improvements, construction in progress, equipment, vehicles and fixtures are reported in the government-wide financial statements. Capital assets are recorded at historical cost or estimated historical cost if purchased or constructed. The capitalization threshold for buildings and building improvements is $10,000, while for equipment and fixtures it is $5,000. Donated capital assets are recorded at acquisition value at date of donation. As capital assets are identified as surplus, they are reclassified as assets out of service. Assets out of service are recorded at the lower of carrying amount or fair value. The costs of normal maintenance and repairs that do not add to the value of the asset or materially extend asset lives are not capitalized. Building and building improvements of the district are depreciated using the straight-line method beginning in the year they are placed in service. Equipment, vehicles, and fixtures are depreciated using the straight-line method beginning in the month acquired. The district’s capital assets have the following estimated useful lives:

FINANCIAL SECTION: BASIC FINANCIAL STATEMENTS
NOTES TO THE FINANCIAL STATEMENTS Year ended June 30, 2017
Note 1. SUMMARY OF SIGNIFICANT ACCOUNTING POLICIES (continued)
50
Assets Years Buildings and building improvements 20-50 Equipment, vehicles and fixtures 5-15
Pensions
The net pension liability, deferred inflows and outflows of resources related to pensions, pension expense, information about the fiduciary net position of the Oklahoma Teacher’s Retirement System (OTRS) and additions to/deductions from OTRS’s fiduciary net position have been determined on the same basis as reported by OTRS. For this purpose, benefit payments (including refunds of employee contributions) are recognized when due and payable in accordance with the benefit terms. Investments held by OTRS are reported at fair value.
Deferred Outflows of Resources
In addition to assets, the statement of net position will sometimes report a separate section for deferred outflows of resources. This separate financial statement element, deferred outflows of resources, represents a consumption of net position that applies to a future period(s) and so will not be recognized as an outflow of resources (expense/expenditure) until then. Deferred outflows of resources for the year ended June 30, 2017 consist of unrecognized items not yet charged to pension expense and contributions from the employer after the measurement date but before the end of the employer’s reporting period. See note 11 for additional discussion regarding pension deferred outflows of resources.
Deferred Inflows of Resources
In addition to liabilities, the statement of net position and fund balance sheet will sometimes report a separate section for deferred inflows of resources. This separate financial statement element, deferred inflows of resources, represents an acquisition of net position that applies to a future period(s) and so will not be recognized as an inflow of resources (revenue) until then. The governmental fund balance sheet includes deferred inflows of resources related to unavailable local sources of revenues and succeeding year property taxes. These amounts are deferred and recognized as an inflow of resources in the period that the amounts become available or the period levied for and budgeted. In the district’s government-wide statements, the property tax revenues for the succeeding year remain a deferred inflow and will be recognized as revenue in the year for which they are levied and budgeted for. The district’s government-wide statements also consist of unrecognized items not yet charged to pension expense. See note 11 for additional discussion regarding pension deferred inflows of resources.
Compensated Absences
The district reports compensated absences in accordance with the provisions of GASB Statement No. 16, Accounting for Compensated Absences. Vacation leave is accrued as a liability as the benefits are earned by the employees if the employees’ rights to receive compensation are attributable to services already rendered and it is probable that the district will compensate the employees for the benefits through paid time off or some other means, such as cash payments at termination or retirement. Sick leave is calculated using the vesting method. The balance reflects sick leave accumulated at the balance sheet date by those employees who are currently eligible to receive termination payments as well as other employees who are expected to become eligible in the future to receive such payments. The accrual has been reduced to the maximum amount allowed by the district’s policy as a termination payment.
FINANCIAL SECTION: BASIC FINANCIAL STATEMENTS
NOTES TO THE FINANCIAL STATEMENTS Year ended June 30, 2017
Note 1. SUMMARY OF SIGNIFICANT ACCOUNTING POLICIES (continued)
51
The liability for such leave is reported as incurred in the government-wide financial statements. A liability for those amounts is recorded in the governmental funds only if the liability has matured as a result of employee resignations or retirements.
Accrued Compensation
Salaries, wages, and benefits that have been earned but not paid as of the end of the fiscal year are reported as a liability on the fund balance sheet and statement of net position. The district has three pay cycles. Employees on each cycle, including teachers, render services under their various contracts prior to the end of the fiscal year for which they do not receive payment until after the end of the fiscal year. The total gross amount of salaries, wages, and benefits associated with these services is reported as a liability on the financial statements.
Long-term Liabilities
In the government-wide financial statements, long-term debt and other long-term obligations are reported as liabilities in the statement of net position. Bond premiums and discounts are deferred and amortized over the life of the bonds using the effective interest method. Bonds payable are reported net of applicable bond premium or discount. Bond issuance costs are reported as current year expenditures. In the fund financial statements, governmental funds recognize bond premiums and discounts, as well as bond issuance costs, as current period activity. The face amount of debt issued is reported as other financing sources. Premiums received on debt issuances are reported as other financing sources, while discounts on debt issuances are reported as other financing uses. Issuance costs, whether or not withheld from the actual debt proceeds received, are reported as administrative support service expenditures. Principal and interest payments are recorded as debt service expenditures.
Net Position and Fund Balances
The government wide financial statements utilize a net position presentation. Net position on the statement of net position include the following:
Net investment in capital assets – the component of net position that reports the difference between capital assets less both the accumulated depreciation and the outstanding balance of debt, excluding unexpended proceeds, that is directly attributable to the acquisition, construction, or improvement of those assets. Deferred outflows of resources and deferred inflows of resources that are attributable to the acquisition, construction, or improvement of those assets or related debt are also included in this component of net position, if any.
Restricted for specific purposes – the component of net position that reports the difference between assets plus deferred outflows of resources and liabilities plus deferred inflows of resources of certain programs should be reported when constraints placed on the use of resources are either (a) externally imposed by creditors, grantors, contributors, or laws or regulations of other governments or (b) imposed by law through constitutional provisions or enabling legislation. The restricted net position for other purposes is made up of the following: child nutrition fund $4,583; gifts fund $1,367; flexible benefit fund $10; endowment fund $30; and federal and state allocation carryover $523.
Unrestricted – the difference between the assets plus deferred outflows of resources and liabilities plus deferred inflows of resources that is not reported in net invested in capital assets or net position restricted for specific purposes.
FINANCIAL SECTION: BASIC FINANCIAL STATEMENTS
NOTES TO THE FINANCIAL STATEMENTS Year ended June 30, 2017
Note 1. SUMMARY OF SIGNIFICANT ACCOUNTING POLICIES (continued)
52
It is the district’s policy to first use restricted resources prior to the use of unrestricted resources when an expense is incurred for purposes for which both restricted and unrestricted resources are available. Governmental fund equity is classified as fund balance. Fund balance refers to the difference between assets and liabilities plus deferred inflows of resources in the governmental funds balance sheet. Fund balance consists of five categories, defined in GASB Statement No. 54, as follows:
Nonspendable fund balance: The nonspendable fund balance classification includes amounts that cannot be spent because they are either (a) not in spendable form or (b) legally or contractually required to be maintained intact. This would include items not expected to be converted to cash including inventories, long-term receivables, and prepaid amounts. It may also include the long-term amount of loans and receivables, as well as property acquired for resale and the corpus (principal) of a permanent fund.
Restricted fund balance: The restricted fund balance classification should be reported when constraints placed on the use of resources are either (a) externally imposed by creditors, grantors, contributors, or laws or regulations of other governments or (b) imposed by law through constitutional provisions or enabling legislation.
Committed fund balance: The committed fund balance classification reflects specific purposes pursuant to constraints imposed by formal action of the district's Board of Education. Such constraints can only be removed or changed by the same form of formal action.
For purposes of committed fund balance, the district’s Board of Education is considered to be its highest level of decision making. Funds set aside by the Board of Education as committed fund balance requires a resolution by the Board of Education. Such resolution must be made prior to the district’s fiscal year-end in order for it to be applicable to the district’s fiscal year-end, although it is permitted for the specific amount of the commitment to be determined after the fiscal year-end if additional information is required in order to determine the exact amount to be committed. The Board of Education has the authority to remove or change the commitment of funds by resolution. The district had no committed fund balance at June 30, 2017.
Assigned fund balance: The assigned fund balance classification reflects amounts that are constrained by the government’s intent to be used for specific purposes, but meet neither the restricted nor committed forms of constraint. Assigned funds cannot cause a deficit in unassigned fund balance.
For the purposes of assigned fund balance, the district has by resolution given authority to its chief financial officer to assign funds for specific purposes. Any funds that the chief financial officer assigns for specific purposes must be reported to the Board of Education at its next regular meeting. The assignment of funds shall be recorded in the Board of Education’s official meeting minutes. Unlike commitments, assignments generally only exist temporarily. In other words, an additional action does not normally have to be taken for the removal of an assignment.
Unassigned fund balance: The unassigned fund balance classification is the residual classification for the general fund only. It is also where negative residual amounts for all other governmental funds would be reported. Unassigned fund balance essentially consists of excess funds that have not been classified in the four above fund balance categories.
FINANCIAL SECTION: BASIC FINANCIAL STATEMENTS
NOTES TO THE FINANCIAL STATEMENTS Year ended June 30, 2017
Note 1. SUMMARY OF SIGNIFICANT ACCOUNTING POLICIES (continued)
53
When expenditures are incurred for purposes for which both restricted and unrestricted resources is available, it is the district’s policy to use restricted fund balance first. When expenditures are incurred for purposes for which amounts in any of the unrestricted resources classifications can be used, it is the district’s policy to use amounts classified as committed first, followed by amounts classified as assigned and then amounts classified as unassigned.
District’s Use of Estimates
The preparation of financial statements in conformity with accounting principles generally accepted in the United States requires the district to make estimates and assumptions that affect the reported amounts of assets, deferred outflows of resources, liabilities, and deferred inflows of resources and disclosure of contingent assets and liabilities at the date of the financial statements, and the reported amounts of revenues and expenditures during the reporting period. Actual results could differ from those estimates.
New Accounting Pronouncements Adopted in Fiscal Year 2017
The district adopted the following new accounting pronouncements during the year ended June 30, 2017 as follows:
Statement No. 77, Tax Abatement Disclosures
GASB Statement No. 77 requires governments that enter into tax abatement agreements to disclose the following information about the agreements: brief descriptive information, such as the tax being abated, the authority under which tax abatements are provided, eligibility criteria, the mechanism by which taxes are abated, provisions for recapturing abated taxes, and the types of commitments made by tax abatement recipients; the gross dollar amount of taxes abated during the period; and commitments made by a government, other than to abate taxes, as part of a tax abatement agreement. Governments may disclose information for individual tax abatement agreements of other governments within the specific tax being abated. For those tax abatement agreements, a reporting government should disclose: The names of the governments that entered into the agreements: the specific taxes being abated; and the gross dollar amount of taxes abated during the period. The requirements of this statement are included in Note 14 to the financial statements for the year ending June 30, 2017.
New Accounting Pronouncements Issued Not Yet Adopted
The GASB has issued several new accounting pronouncements which will be effective to the district in fiscal year ended June 30, 2018. A description of the new accounting pronouncements are described below:
Fiscal Year Ended June 30, 2018
Statement No. 85, Omnibus 2017
GASB Statement No. 85 issued March 2017 will be effective for the district beginning with its fiscal year ending June 30, 2018. Statement No. 85 is designed to address the practice issues that have been identified during implementation and application of certain GASB statements. This statement addresses a variety of topics including issues related to blending component units, goodwill, fair value measurement and application, and postemployment benefits (pensions and other postemployment benefits).

FINANCIAL SECTION: BASIC FINANCIAL STATEMENTS
NOTES TO THE FINANCIAL STATEMENTS Year ended June 30, 2017
Note 1. SUMMARY OF SIGNIFICANT ACCOUNTING POLICIES (continued)
54
Fiscal Years Ended June 30, 2019 – June 30, 2021
Statement No. 84, Fiduciary Activities
GASB Statement No. 84 issued February 2017 will be effective for the district beginning with its fiscal year ending June 30, 2020. The objective of Statement No. 84 is to improve guidance regarding the identification of fiduciary activities for accounting and financial reporting purposes and how those activities should be reported. This statement establishes criteria for identifying fiduciary activities of all state and local governments. The focus of the criteria generally is on (1) whether a government is controlling the assets of the fiduciary activity and (2) the beneficiaries with whom a fiduciary relationship exists. Separate criteria are included to identify fiduciary component units and postemployment benefit arrangements that are fiduciary activities.
An activity meeting the criteria should be reported in a fiduciary fund in the basic financial statements. Governments with activities meeting the criteria should present a statement of fiduciary net position and a statement of changes in fiduciary net position. An exception to that requirement is provided for a business-type activity that normally expects to hold custodial assets for three months or less. This statement describes four fiduciary funds that should be reported, if applicable: (1) pension (and other employee benefit) trust funds, (2) investment trust funds, (3) private-purpose trust funds, and (4) custodial funds. Custodial funds generally should report fiduciary activities that are not held in a trust or equivalent arrangement that meets specific criteria.
A fiduciary component unit, when reported in the fiduciary fund financial statements of a primary government, should combine its information with its component units that are fiduciary component units and aggregate that combined information with the primary government’s fiduciary funds.
This statement also provides for recognition of a liability to the beneficiaries in a fiduciary fund when an event has occurred that compels the government to disburse fiduciary resources. Events that compel a government to disburse fiduciary resources occur when a demand for the resources has been made or when no further action, approval, or condition is required to be taken or met by the beneficiary to release the assets.
Statement No. 87, Leases
GASB Statement No. 87 issued June 2017 will be effective for the district beginning with its fiscal year ending June 30, 2021. Statement No. 87 establishes a single approach to accounting for and reporting leases by state and local governments. Under this statement, a government entity that is a lessee must recognize (1) a lease liability and (2) an intangible asset representing the lessee’s right to use the leased asset. In addition, the district must report the (1) amortization expense for using the lease asset over the shorter of the term of the lease or the useful life of the underlying asset, (2) interest expense on the lease liability and (3) note disclosures about the lease. The statement provides exceptions from the single-approach for short-term leases, financial purchases, leases of assets that are investments, and certain regulated leases. This statement also addresses accounting for lease terminations and modifications, sale-leaseback transactions, non-lease components embedded in lease contracts (such as service agreements), and leases with related parties.
The district is currently evaluating the impact these new standards may have on its financial statements.

FINANCIAL SECTION: BASIC FINANCIAL STATEMENTS
NOTES TO THE FINANCIAL STATEMENTS Year ended June 30, 2017
55
Note 2. REVENUES A description of the district’s revenue sources is included below. Revenue is recognized as described below in the government-wide statements and as described below, to the extent the availability criteria has been met, in the governmental fund statements.
Property Taxes
The district is authorized by state law to levy property taxes, which consist of ad valorem taxes on real and personal property within the district. These property taxes are distributed to the district’s general, building fund and debt service funds based on the levies approved for each fund. The district receives property taxes from four counties. The county assessor for each county, upon receipt of the certification of tax levies from the county excise board, extends the tax levies on the tax rolls for submission to the county treasurer prior to October 1. The county treasurer must commence tax collection within fifteen days of receipt of the tax rolls. The first half of taxes is due prior to January 1. The second half is due prior to April 1. If the first payment is not made in a timely manner, the entire tax becomes due and payable on January 2. Second half taxes become delinquent on April 1 of the year following the year of assessment. If not paid by the following October 1, the property is offered for sale for the amount of taxes due. The owner has two years to redeem the property by paying the taxes and penalty owed. If at the end of two years the owner has not done so, the purchaser is issued a deed to the property. Property tax receivables are recorded on the lien date, January 1st, although the related revenue is reported as a deferred inflow of resources and will not be recognized as revenue until the year for which it is budgeted. An allowance for uncollectible property taxes is calculated based on historical collection data.
Intermediate Revenues
Revenue from intermediate sources is the amount of money collected by an intermediate administrative unit, or a political subdivision between the district and the state, and distributed to districts in amounts that differ in proportion to those which are collected within such systems. Revenue is recognized when it is both measurable and collectible.
Fees and Charges
Fees and charges include tuition, fees, rentals, disposals, commissions, and reimbursements. These are recorded as revenue when services are provided.
State Revenues
Revenues from state sources for current operations are primarily governed by the state aid formula under the provisions of Article XVIII, Title 70, of the Oklahoma Statutes. The state Board of Education administers the allocation of state aid funds to school districts based on information accumulated from the districts. Revenue is recognized when eligibility requirements have been met. After review and verification of reports and supporting documentation, the state Department of Education may adjust subsequent fiscal period allocations of money for prior year errors disclosed by review. Normally, such adjustments are treated as reductions from or additions to the revenue of the year when the adjustment is made. The district receives revenue from the state to administer certain categorical educational programs. State Board of Education rules require that revenue earmarked for these programs be expended only for the program for which the money is provided and require that the money not expended as of the close of the
FINANCIAL SECTION: BASIC FINANCIAL STATEMENTS
NOTES TO THE FINANCIAL STATEMENTS Year ended June 30, 2017
56
Note 2. REVENUES (continued) fiscal year be carried forward into the following year to be expended for the same categorical programs. As of June 30, 2017 $0.3 million of state revenue was carried forward into fiscal year 2018. The state Department of Education requires that categorical educational program revenues be accounted for in the general fund.
Federal Revenues
Federal revenues consist of revenues from the federal government in the form of operating grants, entitlements, or commodities. An operating grant is a contribution to be used for a specific purpose, activity or facility. A grant may be received either directly from the federal government or indirectly as a pass through from another government, such as the state. Revenue is recognized when eligibility requirements have been met. Expenditure-driven grants are recognized as revenue when the qualifying expenditures have been incurred and all other eligibility requirements have been met. Federal rules require that revenue earmarked for federal programs be expended only for the program for which the money is provided and require that the money not expended as of the close of the fiscal year be carried forward into the following year to be expended for the same categorical programs. As of June 30, 2017 $0.2 million of federal revenue was carried forward into fiscal year 2018. The majority of federal revenues received by the district are apportioned to the general fund. The district maintains a separate child nutrition fund and the federal revenues received for the child nutrition programs are apportioned there.

FINANCIAL SECTION: BASIC FINANCIAL STATEMENTS
NOTES TO THE FINANCIAL STATEMENTS Year ended June 30, 2017
Note 3. CASH, CASH EQUIVALENTS, AND INVESTMENTS
57
Custodial Credit Risk - Deposits
Custodial credit risk is the risk that in the event of bank failure, the district may not be able to recover its deposits. Deposits are exposed to custodial credit risk if they are uninsured and uncollateralized. The district’s policy requires that all deposits in excess of amounts covered by federal deposit insurance be fully collateralized by the entity holding the deposits. As of June 30, 2017, all of the district’s deposits were either covered by insurance or were collateralized at 110% of the investment principal. Collateral was held by the pledging financial institution’s trust department or agent in the district’s name.
Custodial Credit Risk - Investments
For an investment, custodial credit risk is the risk that the district will not be able to recover the value of its investments or collateral securities that are in the possession of an outside party. Investment securities are exposed to custodial credit risk if they are uninsured, are not registered in the name of the district, and are held by counterparty or the counterparty’s trust department but not in the name of the district. The district’s policy requires that all investments in excess of amounts covered by federal deposit insurance be fully collateralized by the entity holding the investments. As of June 30, 2017, all of the district’s investments were either covered by federal deposit insurance or were fully collateralized. Further, all of the district’s investments are held by its agent in the district’s name. Accordingly, no investments are subject to custodial credit risk.
Credit Risk
The district’s fixed-income securities are subject to credit risk. However, the district policy on credit quality limitations upholds a very high standard by limiting investments to either direct obligations of the US government or investments backed 110% by collateral. At June 30, 2017, the district’s investment portfolio had invested $96.3 million in mortgage-backed securities, which are considered agency securities of the U.S. government and therefore carry the same credit ratings of the government. The credit ratings of the agency securities are Moody’s Aaa, Standard and Poor AA+, and Fitch AAA. The remaining $35.8 million is invested in certificates of deposit which are not subject to credit risk.
Concentration of Credit Risk
The district’s investment policy requires that, except for direct obligations of the U.S. government, its agencies or instrumentalities, or certificates of deposit secured by diversified pledges of collateral, the district’s investment portfolio will be diversified to avoid incurring undue concentration in securities of one type. At June 30, 2017, all investments were in agency securities of the U.S. government or certificates of deposit. The concentration of the investments are listed below.
Interest Rate Risk
Interest rate risk is the risk that changes in interest rates will adversely affect the fair value of an investment. The district’s investment policy limits the duration of investments to a maximum maturity from the date of purchase of sixty months, provided that sufficient liquidity is available to meet the district’s major cash outlays. The district monitors investment performance on an ongoing basis to limit the district’s interest rate risk. As of June 30, 2017, all of the district’s investments were scheduled to mature in 5 years or less.
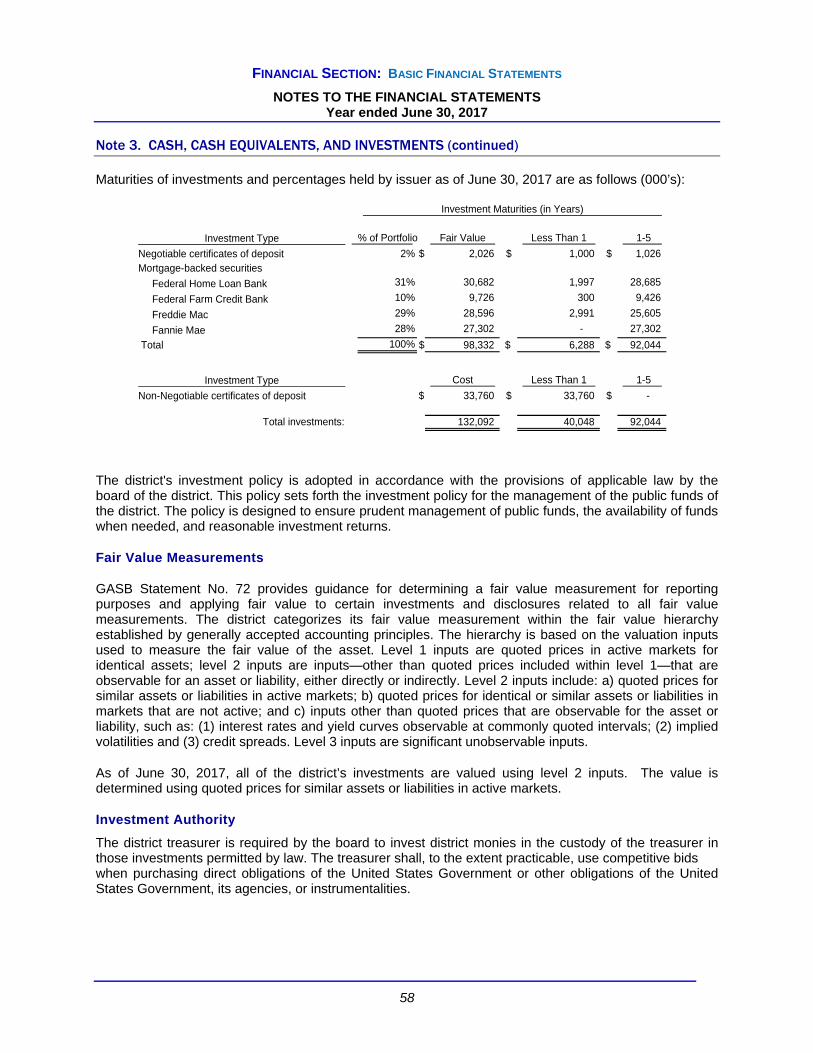
FINANCIAL SECTION: BASIC FINANCIAL STATEMENTS
NOTES TO THE FINANCIAL STATEMENTS Year ended June 30, 2017
Note 3. CASH, CASH EQUIVALENTS, AND INVESTMENTS (continued)
58
Maturities of investments and percentages held by issuer as of June 30, 2017 are as follows (000’s):
Investment Type % of Portfolio Fair Value Less Than 1 1-5
Negotiable certificates of deposit 2% $ 2,026 $ 1,000 $ 1,026 Mortgage-backed securities
Federal Home Loan Bank 31% 30,682 1,997 28,685
Federal Farm Credit Bank 10% 9,726 300 9,426
Freddie Mac 29% 28,596 2,991 25,605
Fannie Mae 28% 27,302 - 27,302
Total 100% $ 98,332 $ 6,288 $ 92,044
Investment Type Cost Less Than 1 1-5
Non-Negotiable certificates of deposit $ 33,760 $ 33,760 $ -
Total investments: 132,092 40,048 92,044
Investment Maturities (in Years)
The district's investment policy is adopted in accordance with the provisions of applicable law by the board of the district. This policy sets forth the investment policy for the management of the public funds of the district. The policy is designed to ensure prudent management of public funds, the availability of funds when needed, and reasonable investment returns.
Fair Value Measurements
GASB Statement No. 72 provides guidance for determining a fair value measurement for reporting purposes and applying fair value to certain investments and disclosures related to all fair value measurements. The district categorizes its fair value measurement within the fair value hierarchy established by generally accepted accounting principles. The hierarchy is based on the valuation inputs used to measure the fair value of the asset. Level 1 inputs are quoted prices in active markets for identical assets; level 2 inputs are inputs—other than quoted prices included within level 1—that are observable for an asset or liability, either directly or indirectly. Level 2 inputs include: a) quoted prices for similar assets or liabilities in active markets; b) quoted prices for identical or similar assets or liabilities in markets that are not active; and c) inputs other than quoted prices that are observable for the asset or liability, such as: (1) interest rates and yield curves observable at commonly quoted intervals; (2) implied volatilities and (3) credit spreads. Level 3 inputs are significant unobservable inputs.
As of June 30, 2017, all of the district’s investments are valued using level 2 inputs. The value is determined using quoted prices for similar assets or liabilities in active markets.
Investment Authority
The district treasurer is required by the board to invest district monies in the custody of the treasurer in those investments permitted by law. The treasurer shall, to the extent practicable, use competitive bids when purchasing direct obligations of the United States Government or other obligations of the United States Government, its agencies, or instrumentalities.
FINANCIAL SECTION: BASIC FINANCIAL STATEMENTS
NOTES TO THE FINANCIAL STATEMENTS Year ended June 30, 2017
Note 3. CASH, CASH EQUIVALENTS, AND INVESTMENTS (continued)
59
The district treasurer shall limit investments to: Direct obligations of the United States government to the payment of which the full faith and credit
of the government of the United States is pledged; provided the district treasurer, after completion of an investment education program in compliance with applicable law, may invest funds in the investment account in other obligations of the United States government, its agencies or instrumentalities;
Obligations to the payment of which the full faith and credit of the state is pledged; Certificates of deposits of banks when such certificates of deposits are secured by acceptable
collateral as defined in this policy. Savings accounts or savings certificates of savings and loan associations to the extent that such
accounts or certificates are fully insured by the Federal Savings and Loan Insurance Corporation; Repurchase agreements that have underlying collateral consisting of those items specified above
including obligations of the United States, its agencies and instrumentalities, and where the collateral has been deposited with a trustee or custodian bank in an irrevocable trust or escrow account established for such purposes;
County, municipal or school district direct debt obligations for which an ad valorem tax may be levied or bond and revenue anticipation notes, money judgments against such county, municipality or school district ordered by a court of record or bonds, or bond and revenue anticipation notes issued by a public trust for which such county, municipality or school district is a beneficiary thereof. All collateral pledged to secure public funds shall be valued as defined in this policy.
Money market mutual funds regulated by the Securities and Exchange Commission and which investments consist of obligations of the United States, its agencies and instrumentalities, and investments in those items and those restrictions specified in this policy;
Warrants, bonds or judgments of the district; Qualified pooled investment programs through an interlocal cooperative agreement formed
pursuant to applicable law and to which the board has voted to be a member, the investments of which consist of those items specified in this policy, as well as obligations of the United States agencies and instrumentalities; or
Any other investment that is authorized by law.
Investment Philosophy
This policy shall be based upon a “prudent investor” standard. The board recognizes that those charged with the investment of public funds act as fiduciaries for the public, and, therefore the treasurer is directed to exercise the judgment and care that persons of ordinary prudence, discretion, and intelligence exercise in the management of their own affairs as to the permanent nonspeculative disposition of their funds, with due consideration of probable income earnings and probable safety of capital. In investing the district’s funds, the treasurer shall place primary emphasis, first, on safety and liquidity of principal, and then on earnings.
Liquidity: Available funds will be invested to the fullest extent practicable in interest-bearing investments or accounts, with the investment portfolio remaining sufficiently liquid to meet reasonably anticipated operating requirements.
Diversification: The investment portfolio will be diversified to avoid one class of investment causing a disproportionate risk of loss to the portfolio. Provided this restriction will not apply to direct obligations of the United States government, its agencies or instrumentalities, or certificates of deposit secured by diversified pledges of collateral as provided this policy.
Safety of principal: Although investments are made to produce income for the district, investments will be made in a manner that preserves principal and liquidity.

FINANCIAL SECTION: BASIC FINANCIAL STATEMENTS
NOTES TO THE FINANCIAL STATEMENTS Year ended June 30, 2017
Note 3. CASH, CASH EQUIVALENTS, AND INVESTMENTS (continued)
60
Prohibition of speculation: The purchase of an investment to be sold before its maturity will normally result in either a gain or loss for the district and is therefore “speculative” by definition. This practice is prohibited.
Yield: The portfolio will be designed to attain maximum yield within each class of investment instrument, consistent with the safety of the funds invested and taking into account investment risk and liquidity needs.
Maturity: Investments will be purchased with expectation that they will be held to maturity. Investments in the sinking fund may have maturities extending to 60 months. Investments in all other funds may have maturities extending to 36 months, provided sufficient liquidity is available to meet major outlays, and except that general fund investments may not exceed 18 months. Any investment collateralized by a pledge of a surety bond or letter of credit as permitted by OAC 735, Chapter 20, may not have a maturity date after the expiration of the surety bond or letter of credit.
Capability of investment management: The superintendent shall be responsible for seeing that the treasurer and any assistant treasurer are qualified and capable of managing the investment portfolio and satisfactorily complete any investment education programs required by state law or by the board.
Collateral: Securities pledged to the district to secure investments shall be limited to the type and terms acceptable to the treasurer of the State of Oklahoma under the Oklahoma Administrative Code Title 735, Chapter 20. Such securities shall be diversified as to type and maturity. Such securities shall be valued at no more than market value and such pledged value shall be at least 110 percent of the investment principal being secured on the date of the pledge. Changes in the market value of the pledged securities occurring during the life of the pledge that would cause the value of the pledge to be less than 110 percent of the principal being secured shall be supplemented by the pledgor with additional securities. The treasurer shall have the authority to sign forms and contracts with financial institutions or the Federal Reserve to enter into agreements for the safekeeping of collateral.

FINANCIAL SECTION: BASIC FINANCIAL STATEMENTS
NOTES TO THE FINANCIAL STATEMENTS Year ended June 30, 2017
61
Note 4. RECEIVABLES (NET OF ALLOWANCE FOR UNCOLLECTIBLES)
Amounts are aggregated into a single accounts receivable (net of allowance for uncollectibles) line for governmental funds. Below is the detail of receivables including the applicable allowances for uncollectible accounts (000’s):
Debt Total
General Service Nonmajor Governmental
Fund Fund Funds Funds
Due from other governments
Local - current year property tax $ 3,798 $ 3,041 $ 543 $ 7,382
Local - succeeding year property tax 89,494 76,104 12,785 178,383
County 200 - - 200
State 2,061 - - 2,061
Federal 2,758 - 214 2,972
Other receivables 1,377 - 196 1,573
Gross receivables $ 99,688 $ 79,145 $ 13,738 $ 192,571
Less: Allowance for uncollectible property tax (1,235) (1,024) (176) (2,435)
Net receivables $ 98,453 $ 78,121 $ 13,562 $ 190,136
Receivables
Receivables which are not collected within the availability period, 60 days of the year end, are recorded in the governmental fund financial statements as deferred inflows of resources. At June 30, 2017, $183.5 million of receivables, $177.1 million of which were succeeding year property tax, were considered to be unavailable revenue and were recorded as deferred inflows of resources in the governmental fund balance sheet. On the statement of net position, $6.4 million was reclassified to revenue from unavailable revenue, while succeeding year property taxes remain deferred inflows of resources.

FINANCIAL SECTION: BASIC FINANCIAL STATEMENTS
NOTES TO THE FINANCIAL STATEMENTS Year ended June 30, 2017
62
Note 5. INVENTORIES AND PREPAID ITEMS
Inventories are valued at average cost using the first-in, first-out method. Inventories of governmental funds are recorded as expenditures/ expenses when consumed rather than when purchased. Prepaid maintenance agreements are for technology-related equipment, software subscriptions and licensing and have terms ranging from 12 months to 72 months. These are amortized over the life of the service agreement and recorded as expenditures/expenses as services are provided rather than when purchased. The inventories and prepaid items on hand at June 30, 2017 were comprised of the following categories (000’s):
TotalGeneral Capital Projects Nonmajor Governmental
Fund Fund Funds Funds
InventoryFood service supplies $ - $ - $ 800 $ 800 Classroom supplies 278 - - 278 Custodial supplies 232 - 14 246 Total inventory $ 510 $ - $ 814 $ 1,324
Prepaid items 166 1,102 - 1,268 Total Inventory and prepaid items $ 676 $ 1,102 $ 814 $ 2,592
Inventory and prepaid items

FINANCIAL SECTION: BASIC FINANCIAL STATEMENTS
NOTES TO THE FINANCIAL STATEMENTS Year ended June 30, 2017
63
Note 6. CAPITAL ASSETS Capital asset activity for the year ended June 30, 2017 was as follows (000’s):
Governmental Activities:Beginning Balance Increases Transfers Decreases Ending Balance
Capital assets, not being depreciated:Land $ 4,212 $ 805 $ - $ - $ 5,017 Construction in progress 41,495 34,806 (41,792) - 34,509 Assets out of service 2,422 - - - 2,422 Total capital assets not being depreciated $ 48,129 $ 35,611 $ (41,792) $ - $ 41,948
Capital assets being depreciated:Buildings $ 778,397 $ - $ 41,792 $ (1,930) $ 818,259
Equipment and vehicles 68,569 4,753 - (3,653) 69,669
Total capital assets being depreciated $ 846,966 $ 4,753 $ 41,792 $ (5,583) $ 887,928
Total assets $ 895,095 $ 40,364 $ - $ (5,583) $ 929,876
Less accumulated depreciation for:
Buildings $ (306,939) $ (23,662) $ - $ 1,412 $ (329,189)
Equipment and vehicles (34,939) (6,256) - 3,057 (38,138)
Total accumulated depreciation $ (341,878) $ (29,918) $ - $ 4,469 $ (367,327)
Governmental activities capital assets, net $ 553,217 $ 10,446 $ - $ (1,114) $ 562,549
Depreciation expense was charged to functions/programs of the district as follows (000’s):
Governmental activities:
Instruction and instruction-related services $ 15,990
Support services - student and staff 1,719
Administrative support services 6,180
Operation of non-instructional services 2,332
Operation and maintenance of plant services 2,031 Student transportation services 1,666
$ 29,918
Assets Out of Service Assets out of service includes sites identified as surplus properties under the Project Schoolhouse initiative. The district originally intended to sell these assets but has not yet been successful. As of June 30, 2017 assets out of service were approximately $2.4 million.
Construction Commitments
The district has active construction projects as of June 30, 2017. These projects include new construction and renovations of schools. At year-end, the district had approximately $31.1 million in outstanding construction encumbrances.
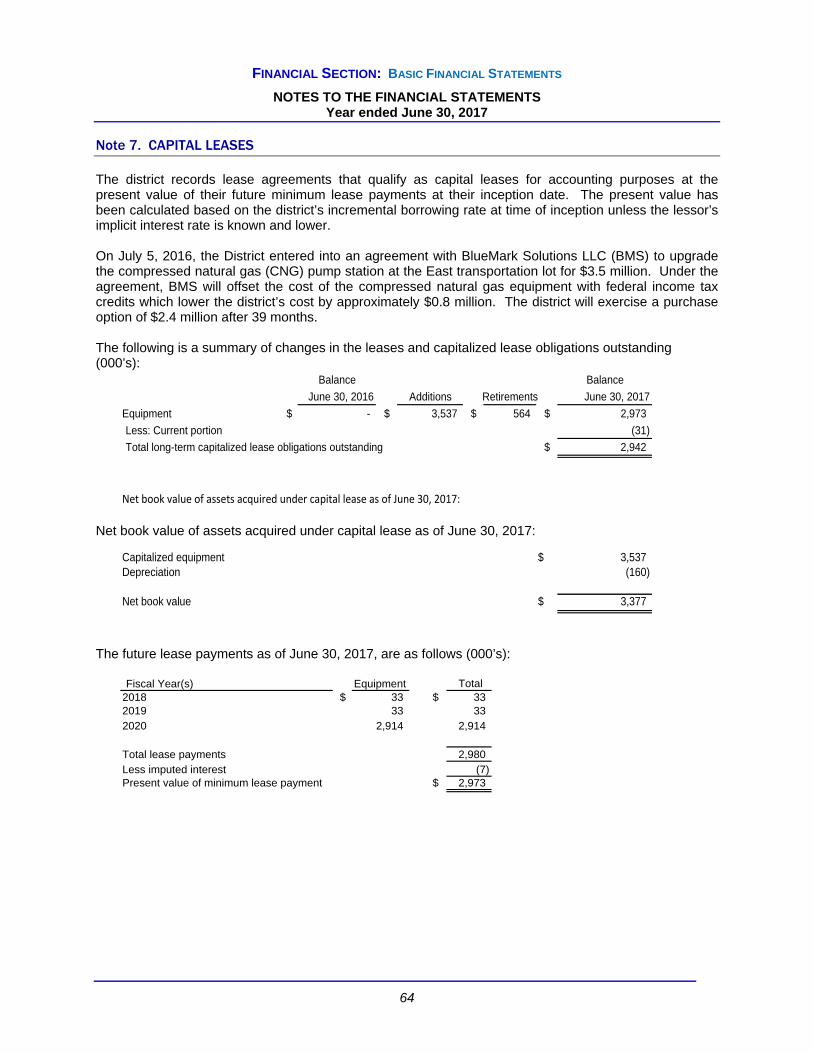
FINANCIAL SECTION: BASIC FINANCIAL STATEMENTS
NOTES TO THE FINANCIAL STATEMENTS Year ended June 30, 2017
64
Note 7. CAPITAL LEASES The district records lease agreements that qualify as capital leases for accounting purposes at the present value of their future minimum lease payments at their inception date. The present value has been calculated based on the district’s incremental borrowing rate at time of inception unless the lessor’s implicit interest rate is known and lower. On July 5, 2016, the District entered into an agreement with BlueMark Solutions LLC (BMS) to upgrade the compressed natural gas (CNG) pump station at the East transportation lot for $3.5 million. Under the agreement, BMS will offset the cost of the compressed natural gas equipment with federal income tax credits which lower the district’s cost by approximately $0.8 million. The district will exercise a purchase option of $2.4 million after 39 months. The following is a summary of changes in the leases and capitalized lease obligations outstanding (000’s):
Balance Balance
June 30, 2016 Additions Retirements June 30, 2017
Equipment $ - $ 3,537 $ 564 $ 2,973
Less: Current portion (31)
Total long-term capitalized lease obligations outstanding $ 2,942
Net book value of assets acquired under capital lease as of June 30, 2017:
Net book value of assets acquired under capital lease as of June 30, 2017:
Capitalized equipment $ 3,537 Depreciation (160)
Net book value $ 3,377
The future lease payments as of June 30, 2017, are as follows (000’s):
Fiscal Year(s) Equipment Total 2018 $ 33 $ 33 2019 33 33 2020 2,914 2,914
Total lease payments 2,980 Less imputed interest (7) Present value of minimum lease payment $ 2,973
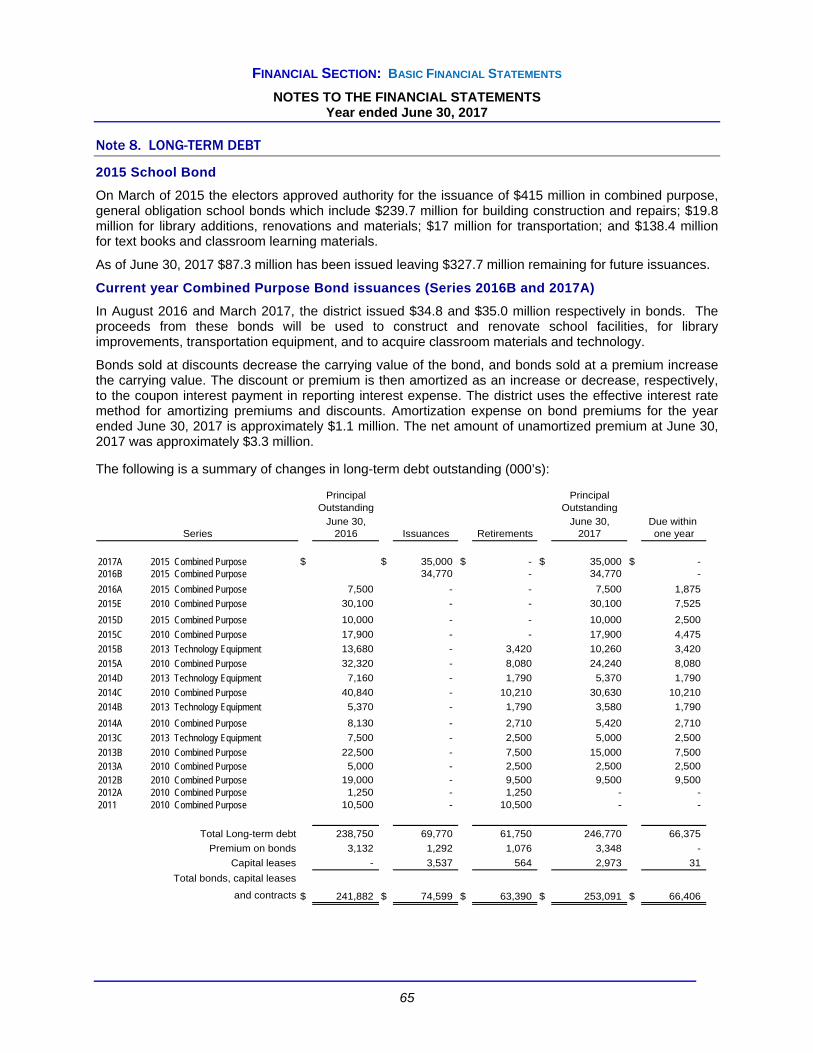
FINANCIAL SECTION: BASIC FINANCIAL STATEMENTS
NOTES TO THE FINANCIAL STATEMENTS Year ended June 30, 2017
65
Note 8. LONG-TERM DEBT
2015 School Bond
On March of 2015 the electors approved authority for the issuance of $415 million in combined purpose, general obligation school bonds which include $239.7 million for building construction and repairs; $19.8 million for library additions, renovations and materials; $17 million for transportation; and $138.4 million for text books and classroom learning materials.
As of June 30, 2017 $87.3 million has been issued leaving $327.7 million remaining for future issuances.
Current year Combined Purpose Bond issuances (Series 2016B and 2017A)
In August 2016 and March 2017, the district issued $34.8 and $35.0 million respectively in bonds. The proceeds from these bonds will be used to construct and renovate school facilities, for library improvements, transportation equipment, and to acquire classroom materials and technology.
Bonds sold at discounts decrease the carrying value of the bond, and bonds sold at a premium increase the carrying value. The discount or premium is then amortized as an increase or decrease, respectively, to the coupon interest payment in reporting interest expense. The district uses the effective interest rate method for amortizing premiums and discounts. Amortization expense on bond premiums for the year ended June 30, 2017 is approximately $1.1 million. The net amount of unamortized premium at June 30, 2017 was approximately $3.3 million. The following is a summary of changes in long-term debt outstanding (000’s):
Principal PrincipalOutstanding Outstanding
June 30, June 30, Due within 2016 Issuances Retirements 2017 one year
2017A 2015 Combined Purpose $ $ 35,000 $ - $ 35,000 $ - 2016B 2015 Combined Purpose 34,770 - 34,770 -
2016A 2015 Combined Purpose 7,500 - - 7,500 1,875
2015E 2010 Combined Purpose 30,100 - - 30,100 7,525
2015D 2015 Combined Purpose 10,000 - - 10,000 2,500
2015C 2010 Combined Purpose 17,900 - - 17,900 4,475
2015B 2013 Technology Equipment 13,680 - 3,420 10,260 3,420
2015A 2010 Combined Purpose 32,320 - 8,080 24,240 8,080
2014D 2013 Technology Equipment 7,160 - 1,790 5,370 1,790
2014C 2010 Combined Purpose 40,840 - 10,210 30,630 10,210
2014B 2013 Technology Equipment 5,370 - 1,790 3,580 1,790
2014A 2010 Combined Purpose 8,130 - 2,710 5,420 2,710
2013C 2013 Technology Equipment 7,500 - 2,500 5,000 2,500
2013B 2010 Combined Purpose 22,500 - 7,500 15,000 7,500
2013A 2010 Combined Purpose 5,000 - 2,500 2,500 2,500
2012B 2010 Combined Purpose 19,000 - 9,500 9,500 9,500 2012A 2010 Combined Purpose 1,250 - 1,250 - - 2011 2010 Combined Purpose 10,500 - 10,500 - -
Total Long-term debt 238,750 69,770 61,750 246,770 66,375
Premium on bonds 3,132 1,292 1,076 3,348 -
Capital leases - 3,537 564 2,973 31
Total bonds, capital leases
and contracts $ 241,882 $ 74,599 $ 63,390 $ 253,091 $ 66,406
Series

FINANCIAL SECTION: BASIC FINANCIAL STATEMENTS
NOTES TO THE FINANCIAL STATEMENTS Year ended June 30, 2017
66
Note 8. LONG-TERM DEBT (continued) The future payments are scheduled as follows (000’s):
CouponFiscal Year Principal Interest Total
2018 $ 66,375 $ 3,251 $ 69,626 2019 71,815 2,201 74,016 2020 57,315 1,300 58,615
2021 33,815 594 34,409 2022 17,450 204 17,654
$ 246,770 $ 7,550 $ 254,320
Interest rates on the bonds range from .97% to 1.89% and nominal rates range from .98% to 1.88% Issue date, original amount and final maturity (000's):
Annual
Issue Original Final Principal
Date Amount Maturity Payments Coupon Rate Nominal Rate
2017A 3/1/2017 $ 35,000 3/1/2022 $ 8,750 1.78% 1.77%2016B 8/1/2016 34,770 8/1/2021 8,690 1.09% 1.08%2016A 5/1/2016 7,500 5/1/2021 1,875 1.37% 1.37%2015E 11/1/2015 30,100 11/1/2020 7,525 1.31% 1.31%2015D 8/1/2015 10,000 8/1/2020 2,500 1.89% 1.88%2015C 8/1/2015 17,900 8/1/2020 4,475 1.68% 1.67%
2015B 1/1/2015 13,680 1/1/2020 3,420 1.19% 1.18%2015A 1/1/2015 32,320 1/1/2020 8,080 1.17% 1.17%2014D 7/1/2014 7,160 7/1/2019 1,790 1.15% 1.14%
2014C 7/1/2014 40,840 7/1/2019 10,210 1.11% 1.11%
2014B 3/1/2014 7,160 3/1/2019 1,790 1.03% 1.03%
2014A 3/1/2014 10,840 3/1/2019 2,710 1.02% 1.01%
2013C 8/1/2013 10,000 8/1/2018 2,500 1.55% 1.54%
2013B 8/1/2013 30,000 8/1/2018 7,500 1.59% 1.58%
2013A 3/1/2013 10,000 3/1/2018 2,500 0.97% 0.98%
2012B 8/1/2012 38,000 8/1/2017 9,500 0.99% 0.99%
2012A 4/1/2012 5,000 4/1/2017 1,250 1.07% 1.06%
2011 9/1/2011 42,000 9/1/2016 10,500 1.29% 1.30% Interest expense on bonds during the year ended June 30, 2017 totaling $4.9 million is reported in the debt service fund.

FINANCIAL SECTION: BASIC FINANCIAL STATEMENTS
NOTES TO THE FINANCIAL STATEMENTS Year ended June 30, 2017
67
Note 9. RISK MANAGEMENT The district is exposed to various risks of loss related to torts; theft of, damage to, and destruction of assets; errors and omissions; and natural disasters for which the government carries commercial insurance. Commercial policies in force during the year contained the following deductibles:
Property, fire and extended coverage $ 100,000Automobile liability 175,000General liability 175,000Inland marine 2,500School leader legal 175,000
Settled claims resulting from these risks have not exceeded the commercial insurance coverage in any of the past three fiscal years. The district is self-insured for workers’ compensation claims. Premiums are paid into the workers’ compensation fund, which is combined with the general fund for purposes of financial statement presentation, from the general fund and child nutrition fund. Liabilities are reported in the government-wide statements when it is probable that a loss has occurred and the amount of the loss can be reasonably estimated. Liabilities are reported in the general fund statements to the extent these amounts are payable with expendable available financial resources. Liabilities in the government-wide statements also include an amount for claims that have been incurred but not reported (IBNR). The result of this process to estimate the claims liability is not an exact amount as it depends on many complex factors, such as inflation, changes in legal doctrines, and damage awards. Accordingly, claims are reevaluated periodically to consider the effects of inflation, recent claim settlement trends (including frequency and amount of pay-outs), and other economic and social factors. The estimate of the claims liability also includes amounts for incremental claim adjustment expenses related to specific claims and other claim adjustment expenses regardless of whether allocated to specific claims. For example, estimated recoveries from salvage or subrogation are another component of the claims liability estimate. An excess coverage insurance policy covers individual claims in excess of $850,000 up to an aggregate total of $2,000,000. Settlements did not exceed coverage for the past three years. At June 30, 2017, the district had established liabilities for workers compensation claims and deductibles on commercial coverage of $8.4 million and $1.5 million, respectively. Changes in the balances of claims liability for the past three years are as follows (000’s):
2017 2016Unpaid claims, beginning of year $ 12,442 $ 14,471 Incurred claims (including IBNRs) 1,946 2,486 Claim payments (4,498) (4,515)Unpaid claims, end of year $ 9,890 $ 12,442
Approximately $3.2 million of the amount unpaid at June 30, 2017 is expected to be paid out in the next fiscal year from general funds.

FINANCIAL SECTION: BASIC FINANCIAL STATEMENTS
NOTES TO THE FINANCIAL STATEMENTS Year ended June 30, 2017
68
Note 10. COMMITMENTS AND CONTINGENT LIABILITIES Encumbrance accounting is utilized to assure effective budgetary control and accountability and to facilitate effective cash planning and control. Encumbrances represent commitments related to unperformed contracts for goods or services. At year end the amount of encumbrances expected to be honored upon performance by the vendor in the next year were as follows (000’s):
General Fund $ 4,247 Capital Projects Fund 31,056 Nonmajor Funds 1,533 Total $ 36,836
Amounts received or receivable from grant agencies are subject to audit and adjustment by grantor agencies, principally the federal government. Any disallowed claims, including amounts already collected, may constitute a liability of the applicable funds. The amount, if any, of expenditures that may be disallowed by the grantor cannot be determined at this time, although the district expects such amounts, if any, to be immaterial. The district is a defendant in various lawsuits. Although the outcome of these lawsuits is not presently determinable, in the opinion of the district’s counsel, the resolution of these matters will not have a material adverse effect on the financial condition of the district. Note 11. PENSION BENEFITS
Plan description
The district participates in the OTRS, a cost-sharing multiple-employer public employee retirement system that is self-administered. OTRS provides retirement, disability, and death benefits to plan members and beneficiaries. Benefit provisions are established and may be amended by the legislature of the State of Oklahoma. Title 70 of the Oklahoma State Statutes assigns the authority for management and operation of OTRS to the Board of Trustees of the OTRS. OTRS issues a publicly available annual financial report that can be obtained at www.ok.gov/TRS/.
Participation in the plan is required for certified teachers and administrators. Other permanent, support employees working at least half time are eligible for participation in the plan at their option. At June 30, 2017, there were 4,010 active employees of the district participating in the plan, comprising 5% of the total teacher’s retirement system participants.
Benefits provided
OTRS provides defined retirement benefits based on members’ final compensation, age, and term of service. In addition, the retirement program provides for benefits upon disability and to survivors upon the death of eligible members. Title 70 O. S. Sec. 17-105 defines all retirement benefits. The authority to establish and amend benefit provisions rests with the state legislature. Benefit provisions include:
Members become 100% vested in retirement benefits earned to date after five years of credited Oklahoma service. Members who joined OTRS on June 30, 1992 or prior are eligible to retire at maximum benefits when age and years of creditable service total 80. Members joining OTRS after June 30, 1992 are eligible for maximum benefits when their age and years of creditable service total

FINANCIAL SECTION: BASIC FINANCIAL STATEMENTS
NOTES TO THE FINANCIAL STATEMENTS Year ended June 30, 2017
Note 11. PENSION BENEFITS (continued)
69
90. Members whose age and service do not equal the eligible limit may receive reduced benefits as early as age 55, and at age 62 receive unreduced benefits based on their years of service. The maximum retirement benefit is equal to 2 percent of final compensation for each year of credited service.
Final compensation for members who joined OTRS prior to July 1, 1992 is defined as the average
salary for the three highest years of compensation. Final compensation for members joining OTRS after June 30, 1992 is defined as the average of the highest five consecutive years of annual compensation in which contributions have been made. The final average compensation is limited for service credit accumulated prior to July 1, 1995 to $40,000 or $25,000, depending on the member’s election. Monthly benefits are 1/12 of this amount. Service credits accumulated after June 30, 1995 are calculated based on each member’s final average compensation, except for certain employees of the two comprehensive universities. Upon the death of a member who has not yet retired, the designated beneficiary shall receive the member’s total contributions plus 100 percent of interest earned through the end of the fiscal year, with interest rates varying based on time of service. A surviving spouse of a qualified member may elect to receive, in lieu of the aforementioned benefits, the retirement benefit the member was entitled to at the time of death as provided under the joint survivor benefit option.
Upon the death of a retired member, OTRS will pay $5,000 to the designated beneficiary, in addition
to the benefits provided for the retirement option selected by the member. A member is eligible for disability benefits after ten years of credited Oklahoma service. The disability
benefit is equal to 2% of final average compensation for the applicable years of credited service. Upon separation from OTRS, members’ contributions are refundable with interest based on certain
restrictions provided in the plan, or by the IRC. Members may elect to make additional contributions to a tax-sheltered annuity program up to the
exclusion allowance provided under the IRC under Code Section 403(b).
Contributions
The contribution requirements of OTRS are at an established rate determined by Oklahoma statute and are not based on actuarial calculations. Employees are required to contribute 7 percent of their annual compensation. The district’s contribution rate is 9.5 percent for the year ended June 30, 2017. In addition, the district is required to match the state’s contribution rate on salaries that are paid with federal funds. The district’s total contribution to OTRS in 2017 was $16.8 million. The state makes a contribution on behalf of each teacher meeting minimum salary requirements (known as the OTRS years of service credit). The credit amount is determined based on years of service and ranges from $60.15 per year for 0 years of service to $1,410.53 per year for 25 years or more of service. For the fiscal year ended June 30, 2017, the state paid approximately $1.7 million on behalf of teachers employed at the district. In accordance with generally accepted accounting practices, the district recognized the on-behalf-of payments as revenue and expense/expenditure in the government wide and fund financial statements. The State of Oklahoma is also required to contribute to the system on behalf of the participating employers. For 2017, the State of Oklahoma contributed 5 percent of state revenues from sales and use taxes and individual income taxes, to the system on behalf of participating employers. The district has estimated the amounts contributed to the system by the State of Oklahoma on its behalf based on a
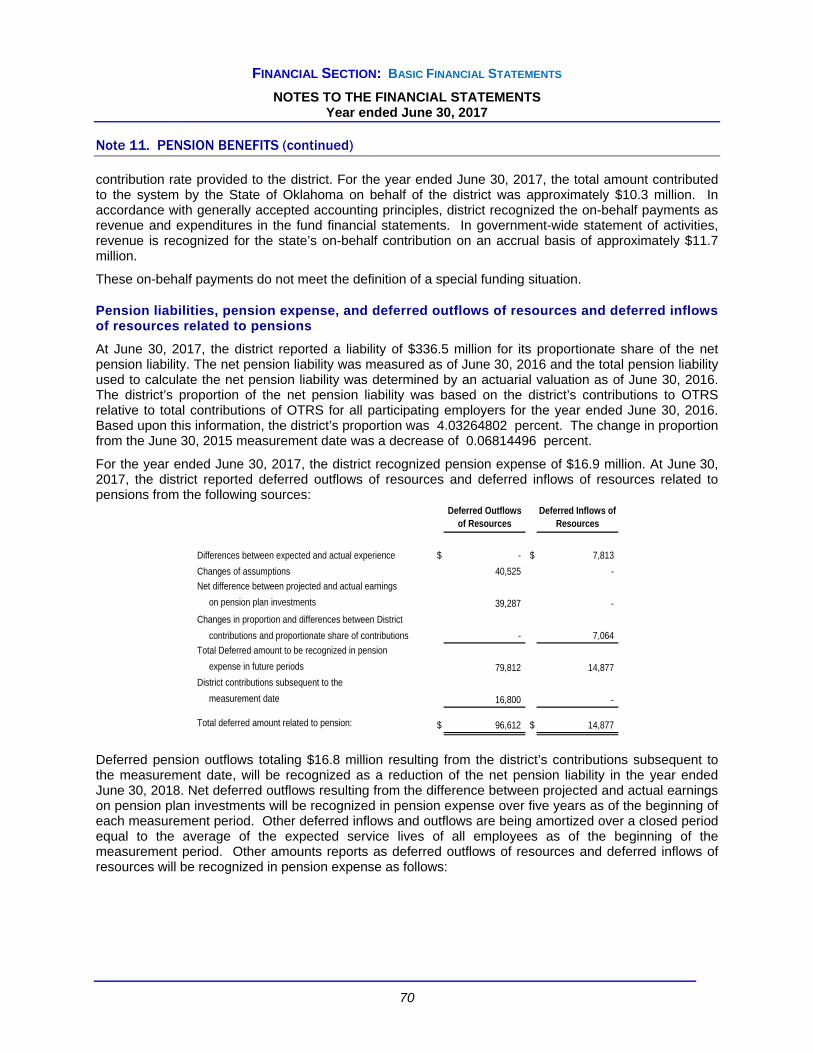
FINANCIAL SECTION: BASIC FINANCIAL STATEMENTS
NOTES TO THE FINANCIAL STATEMENTS Year ended June 30, 2017
Note 11. PENSION BENEFITS (continued)
70
contribution rate provided to the district. For the year ended June 30, 2017, the total amount contributed to the system by the State of Oklahoma on behalf of the district was approximately $10.3 million. In accordance with generally accepted accounting principles, district recognized the on-behalf payments as revenue and expenditures in the fund financial statements. In government-wide statement of activities, revenue is recognized for the state’s on-behalf contribution on an accrual basis of approximately $11.7 million.
These on-behalf payments do not meet the definition of a special funding situation.
Pension liabilities, pension expense, and deferred outflows of resources and deferred inflows of resources related to pensions
At June 30, 2017, the district reported a liability of $336.5 million for its proportionate share of the net pension liability. The net pension liability was measured as of June 30, 2016 and the total pension liability used to calculate the net pension liability was determined by an actuarial valuation as of June 30, 2016. The district’s proportion of the net pension liability was based on the district’s contributions to OTRS relative to total contributions of OTRS for all participating employers for the year ended June 30, 2016. Based upon this information, the district’s proportion was 4.03264802 percent. The change in proportion from the June 30, 2015 measurement date was a decrease of 0.06814496 percent.
For the year ended June 30, 2017, the district recognized pension expense of $16.9 million. At June 30, 2017, the district reported deferred outflows of resources and deferred inflows of resources related to pensions from the following sources:
Deferred Outflows of Resources
Deferred Inflows of Resources
Differences between expected and actual experience $ - $ 7,813
Changes of assumptions 40,525 -
Net difference between projected and actual earnings
on pension plan investments 39,287 -
Changes in proportion and differences between District
contributions and proportionate share of contributions - 7,064
Total Deferred amount to be recognized in pension
expense in future periods 79,812 14,877
District contributions subsequent to the
measurement date 16,800 -
Total deferred amount related to pension: $ 96,612 $ 14,877
Deferred pension outflows totaling $16.8 million resulting from the district’s contributions subsequent to the measurement date, will be recognized as a reduction of the net pension liability in the year ended June 30, 2018. Net deferred outflows resulting from the difference between projected and actual earnings on pension plan investments will be recognized in pension expense over five years as of the beginning of each measurement period. Other deferred inflows and outflows are being amortized over a closed period equal to the average of the expected service lives of all employees as of the beginning of the measurement period. Other amounts reports as deferred outflows of resources and deferred inflows of resources will be recognized in pension expense as follows:

FINANCIAL SECTION: BASIC FINANCIAL STATEMENTS
NOTES TO THE FINANCIAL STATEMENTS Year ended June 30, 2017
Note 11. PENSION BENEFITS (continued)
71
Year ended June 30:
2017 $ 9,969
2018 9,969
2019 23,096
2020 17,861
2021 4,040
$ 64,935
Actuarial assumptions
The total pension liability as of June 30, 2016 was determined based on an actuarial valuation prepared as of June 30, 2016 using the following actuarial assumptions:
Actuarial cost method—Entry age normal
Inflation—2.50 percent
Future ad hoc cost-of-living Increases—None
Salary increases—Composed of 3.25 percent wage inflation, including 2.50 percent price inflation, plus a service related component ranging from 0.00 percent to 8.00 percent based on years of service.
Investment rate of return—7.50 percent
Retirement age—Experience-based table of rates based on age, service, and gender. Adopted by the board in May 2015 in conjunction with the five year experience study for the period ending June 30, 2014.
Mortality rates after retirement—Males: RP-2000 Combined Health Mortality Table for males with white collar adjustments. Generational mortality improvements in accordance with Scale BB from the table’s base year of 2000. Females: GRS Southwest Region Teacher Mortality Table, scaled at 105%. Generational mortality improvements in accordance with Scale BB from the table’s base year of 2012.
Mortality rates for active members—RP-2000 Employee Mortality tables, with male rates multiplied by 60 percent and female rates multiplied by 50 percent.
The long-term expected rate of return on pension plan investments was determined using a building block method in which best estimate ranges of expected future real rates of return (expected returns, net of pension plan investment expense and inflation) are developed for each major asset class. These ranges are combined to produce the long-term expected rate of return by weighting the expected future real rates of return by the target asset allocation percentage and by adding expected inflation.
The target asset allocation and best estimates of arithmetic expected real rates of return for each major asset class as of June 30, 2016, are summarized in the following table:
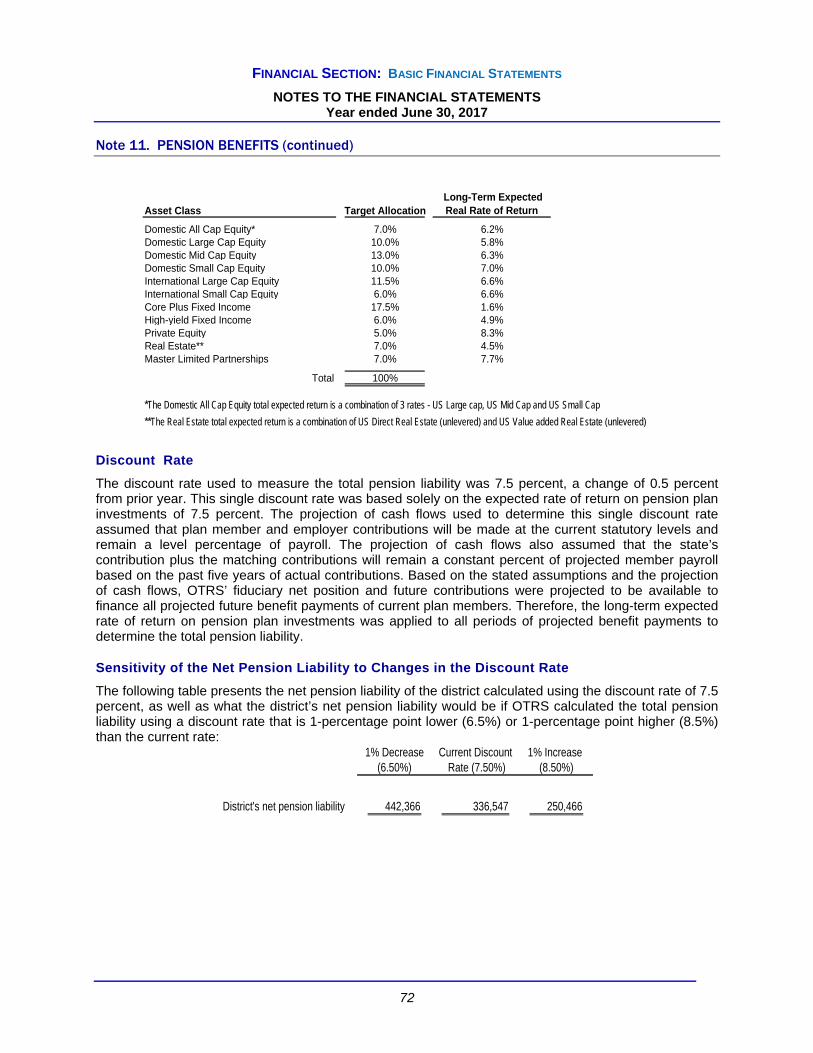
FINANCIAL SECTION: BASIC FINANCIAL STATEMENTS
NOTES TO THE FINANCIAL STATEMENTS Year ended June 30, 2017
Note 11. PENSION BENEFITS (continued)
72
Asset Class Target Allocation Long-Term Expected Real Rate of Return
Domestic All Cap Equity* 7.0% 6.2%Domestic Large Cap Equity 10.0% 5.8%Domestic Mid Cap Equity 13.0% 6.3%Domestic Small Cap Equity 10.0% 7.0%International Large Cap Equity 11.5% 6.6%International Small Cap Equity 6.0% 6.6%Core Plus Fixed Income 17.5% 1.6%High-yield Fixed Income 6.0% 4.9%Private Equity 5.0% 8.3%Real Estate** 7.0% 4.5%Master Limited Partnerships 7.0% 7.7%
Total 100%
**The Real Estate total expected return is a combination of US Direct Real Estate (unlevered) and US Value added Real Estate (unlevered)
*The Domestic All Cap Equity total expected return is a combination of 3 rates - US Large cap, US Mid Cap and US Small Cap
Discount Rate
The discount rate used to measure the total pension liability was 7.5 percent, a change of 0.5 percent from prior year. This single discount rate was based solely on the expected rate of return on pension plan investments of 7.5 percent. The projection of cash flows used to determine this single discount rate assumed that plan member and employer contributions will be made at the current statutory levels and remain a level percentage of payroll. The projection of cash flows also assumed that the state’s contribution plus the matching contributions will remain a constant percent of projected member payroll based on the past five years of actual contributions. Based on the stated assumptions and the projection of cash flows, OTRS’ fiduciary net position and future contributions were projected to be available to finance all projected future benefit payments of current plan members. Therefore, the long-term expected rate of return on pension plan investments was applied to all periods of projected benefit payments to determine the total pension liability.
Sensitivity of the Net Pension Liability to Changes in the Discount Rate
The following table presents the net pension liability of the district calculated using the discount rate of 7.5 percent, as well as what the district’s net pension liability would be if OTRS calculated the total pension liability using a discount rate that is 1-percentage point lower (6.5%) or 1-percentage point higher (8.5%) than the current rate:
1% Decrease Current Discount 1% Increase (6.50%) Rate (7.50%) (8.50%)
District's net pension liability 442,366 336,547 250,466
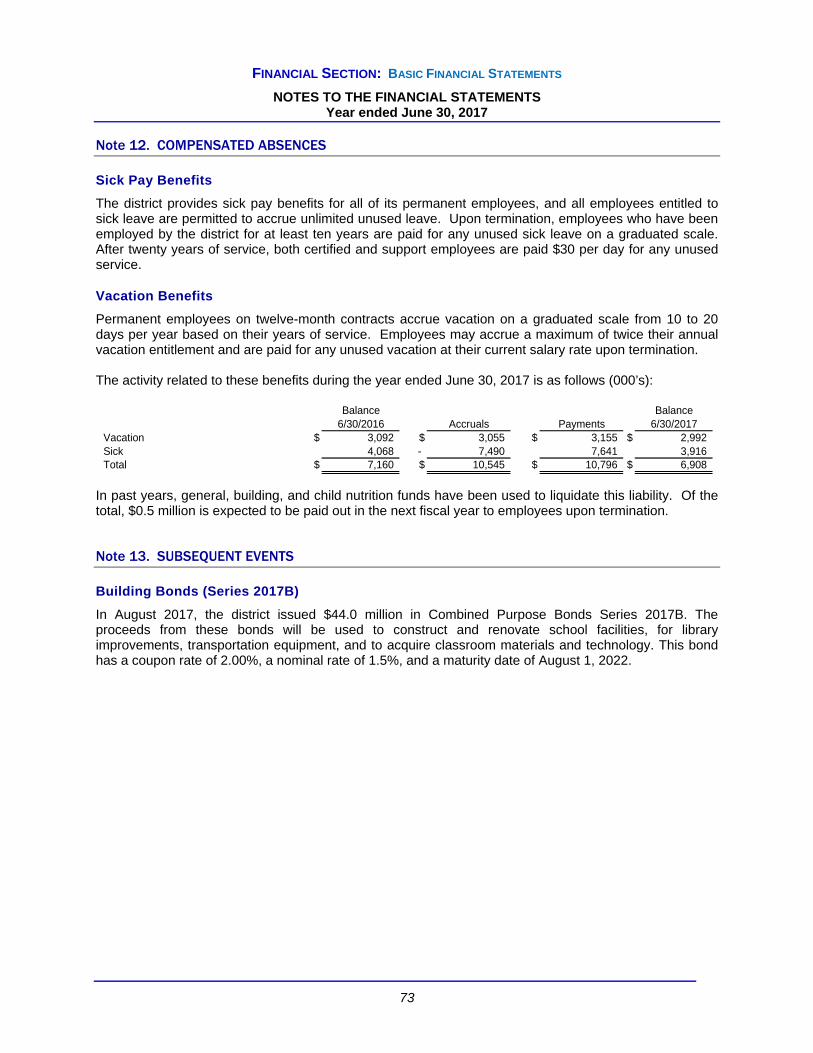
FINANCIAL SECTION: BASIC FINANCIAL STATEMENTS
NOTES TO THE FINANCIAL STATEMENTS Year ended June 30, 2017
73
Note 12. COMPENSATED ABSENCES
Sick Pay Benefits
The district provides sick pay benefits for all of its permanent employees, and all employees entitled to sick leave are permitted to accrue unlimited unused leave. Upon termination, employees who have been employed by the district for at least ten years are paid for any unused sick leave on a graduated scale. After twenty years of service, both certified and support employees are paid $30 per day for any unused service.
Vacation Benefits
Permanent employees on twelve-month contracts accrue vacation on a graduated scale from 10 to 20 days per year based on their years of service. Employees may accrue a maximum of twice their annual vacation entitlement and are paid for any unused vacation at their current salary rate upon termination. The activity related to these benefits during the year ended June 30, 2017 is as follows (000’s):
Balance Balance6/30/2016 Accruals Payments 6/30/2017
Vacation $ 3,092 $ 3,055 $ 3,155 $ 2,992 Sick 4,068 - 7,490 7,641 3,916 Total $ 7,160 $ 10,545 $ 10,796 $ 6,908
In past years, general, building, and child nutrition funds have been used to liquidate this liability. Of the total, $0.5 million is expected to be paid out in the next fiscal year to employees upon termination. Note 13. SUBSEQUENT EVENTS
Building Bonds (Series 2017B)
In August 2017, the district issued $44.0 million in Combined Purpose Bonds Series 2017B. The proceeds from these bonds will be used to construct and renovate school facilities, for library improvements, transportation equipment, and to acquire classroom materials and technology. This bond has a coupon rate of 2.00%, a nominal rate of 1.5%, and a maturity date of August 1, 2022.

FINANCIAL SECTION: BASIC FINANCIAL STATEMENTS
NOTES TO THE FINANCIAL STATEMENTS Year ended June 30, 2017
74
Note 14. TAX ABATEMENT DISCLOSURES The City of Tulsa provides ad valorem tax abatements to promote development within an enterprise zone in downtown Tulsa. The district is impacted by tax abatements provided by the City of Tulsa under the Tax Incentive District Number One economic development program. The abatements were established to encourage the development, renovation and redevelopment of residential, both single-family and multiple-unit dwellings, as well as commercial retail space and hotels. The abatements up to 100 percent of the additional property tax resulting from the increase in assessed value as a result of the improvements, are administered as a reduction in the tax bill, and last for up to 6 years (or fewer, if the property is sold). The district participates in the ad valorem tax abatement of 54.9%. For the fiscal year ended June 30, 2017, the City of Tulsa had two active agreements which resulted in a total tax abatement of approximately $111,700, of which the district’s share is approximately $61,300, and twelve other agreements which are currently under construction and will not result in tax abatements until such time that the project is completed and the ad valorem taxes are developed by the Tulsa County Tax Assessor. In all cases of the two active agreements, the district receives ad valorem taxes at the market value of the property prior to the abatement. The State of Oklahoma grants a 5-year exemption of ad valorem taxes for certain new manufacturing or research and development equipment and facilities. Pursuant to Section 193 of Title 62 of the Oklahoma Statutes, the state will reimburse the district for foregone property taxes as a result of this exemption. During the year ended June 30, 2017, the amount of foregone tax revenues as a result of this exemption were $3,612,315. The state reimbursed the district $3,197,399 during the year ended June 30, 2017 in connection with the abated tax revenues. Of the amount reimbursed, $414,916 was receivable at June 30, 2017.

75
Required Supplementary Information

76
This page is left blank intentionally

FINANCIAL SECTION: REQUIRED SUPPLEMENTARY INFORMATION
77
District's proportion of the net pension liability (asset) 4.03% 4.10% 4.18%
District's proportionate share of the net pension liability (asset) $ 336,547 $ 249,031 $ 224,675
District's covered-employee payroll $ 163,790 $ 163,115 $ 161,383
District's proportionate share of the net pension liability (asset) as a percentage of its covered-employee payroll 205.47% 152.67% 139.22%
Plan fiduciary net position as a percentage of the total pensionliability 62.24% 70.31% 72.43%
Schedule of the District's Proportionate Share of the Net Pension Liability
Last Ten Fiscal Years*(Thousands)
Teachers' Retirement System of Oklahoma
*Only three fiscal years are presented because 10-year data is not yet available. Information is as of the measurement date, which is the prior June 30th.
2017 2016 2015
CHANGES OF BENEFIT TERMS There were no significant changes to benefits provisions or other matters that affected the comparability of the information presented above. CHANGES OF ASSUMPTIONS The following information is as of the measurement date, which is the prior June 30th. The assumptions for salary increases changed for the June 30, 2016 and June 30, 2015 measurement dates. For the June 30, 2014 measurement date, salary increases were composed of 3.00 percent inflation, plus 1.00 percent productivity increase rate, plus step-rate promotional increases for members with less than 25 years of service. For the June 30, 2015 measurement date, salary increases are composed of 3.75 percent wage inflation, including 3.00 percent price inflation, plus a service-related component ranging from 0.00 percent to 8.00 percent based on years of services. For the June 30, 2016 measurement date, salary increases are composed of 3.25 percent wage inflation, including 2.50 percent price inflation, plus a service-related component ranging from 0.00 percent to 8.00 percent based on years of service. The table used to determine the retirement age changed for the June 30, 2015 measurement date. For the June 30, 2014 measurement date, the retirement age was determined using the experience-based table developed from a five year experience study for the period ending June 30, 2009. This table was adopted by the OTRS Board in September 2010. For the June 30, 2015 measurement date, the retirement age was determined using the experience-based table developed from a five year experience study for the period ending June 30, 2014. This table was adopted by the OTRS Board in May 2015. There were no changes in the retirement age assumptions for the June 30, 2016 measurement date.

FINANCIAL SECTION: REQUIRED SUPPLEMENTARY INFORMATION
78
CHANGES OF ASSUMPTIONS (continued) The mortality rate tables used changed for the June 30, 2015 measurement date. For the June 30, 2014 measurement date, mortality rates were determined using the RP-2000 Combined Mortality table, projected to 2016 using Scale AA, multiplied by 90 percent for males and 80 percent for females. For the June 30, 2015 measurement date, the mortality rates for active employees were determined using the RP-200 Employee Mortality tables, with male rates multiplied by 60 percent and female rates multiplied by 50 percent. The mortality rates for males after retirement were determined using the RP-2000 combined health Mortality Table for males with white collar adjustments. Generational mortality improvements in accordance with Scale BB from the table's base year of 2000 were used. the mortality rates for females after retirement were determined using the GRS Southwest Region Teacher Mortality Table, scaled at 105 percent. Generational mortality improvements in accordance with Scale BB from the tables base year of 2012 were used. There were no changes in the mortality rate assumptions for June 30, 2016 measurement date. The assumptions for investment return changed for the June 30, 2016 measurement date. For the June 30, 2015 and June 30, 2014 measurement dates, investment return was 8.00 percent per year, net of investment-related expenses and compounded annually, composed of an assumed 3.00 percent inflation rate and a 5.00 percent net real rate of return. For the June 30, 2016 measurement date, investment return was 7.50 percent per year, net of investment-related expenses and compounded annually, composed of an assumed 2.50 percent inflation rate and a 5.00 percent net real rate of return.

FINANCIAL SECTION: REQUIRED SUPPLEMENTARY INFORMATION
79
2017 2016 2015 2014 2013 2012 2011 2010 2009 2008Contractually required contribution $ 16.8 $ 17.1 $ 17.1 $ 16.9 $ 16.7 $ 16.0 $ 16.2 $ 16.5 $ 14.9 $ 13.6
Contributions in relation to the contractually required contribution (16.8) (17.1) (17.1) (16.9) (16.7) (16.0) (16.2) (16.5) (14.9) (13.6)
Contribution deficiency (excess) $ - $ - $ - $ - $ - $ - $ - $ - $ - $ -
District's covered-employee payroll $ 162 $ 164 $ 163 $ 161 $ 160 $ 158 $ 159 $ 161 $ 156 $ 154
Contributions as a percentage of covered-employee payroll 10.37% 10.44% 10.51% 10.50% 10.44% 10.13% 10.19% 10.25% 9.58% 8.80%
Schedule of the District's Pension Plan ContributionsTeachers' Retirement System of Oklahoma
Last Ten Fiscal Years(Millions)
Notes to Schedule:
1. July 1, 2005 to December 31, 2006 7.05%
2. January 1, 2007 to June 30, 2007 7.60%
3. July 1, 2007 to December 31, 2007 7.85%
4. January 1, 2008 to June 30, 2008 8.35%
5. July 1, 2008 to December 31, 2008 8.50%
6. January 1, 2009 to December 31, 2009 9.00%
7. January 1, 2010 to present 9.50%
The District's statutorily required contribution rate has changed over the prior 10 years as follows:

FINANCIAL SECTION: REQUIRED SUPPLEMENTARY INFORMATION
80
Actual VarianceOriginal Final (Budgetary Basis) Final Budget
REVENUESLocal and intermediate sources $ 107,405 $ 114,998 $ 124,148 $ 9,150 State program revenues 149,930 146,294 138,897 (7,397) Federal program revenues 34,032 33,131 31,750 (1,381)
Total revenues 291,367 294,423 294,795 372
EXPENDITURESCurrent:
Salaries 190,532 188,583 186,893 (1,690) Benefits 55,334 55,360 60,118 4,758 Purchased Services 19,803 24,690 21,901 (2,789) Supplies 17,866 18,216 14,497 (3,719) Property 138 68 169 101 Other Expenditures 4,163 723 663 (60) Other Outlays 7,012 8,783 9,494 711
Total expenditures 294,848 296,423 293,735 (2,688)
Excess (deficiency) of revenues over expenditures (3,481) (2,000) 1,060 3,060
OTHER FINANCING SOURCES
2,500 2,000 2,000 - Net change in fund balances (981) - 3,060 3,060
Fund balance -- June 30, 2016 28,052 28,066 28,066 - Fund balance -- June 30, 2017 $ 27,071 $ 28,066 $ 31,126 $ 3,060
Budgetary Comparison Schedule - General Fund For the Year Ended June 30, 2017
(Thousands)
Lapsed appropriations from prior year and fund transfer
See Notes to Required Supplementary Information

FINANCIAL SECTION: REQUIRED SUPPLEMENTARY INFORMATION
81
Change in fund balance of governmental funds - General Fund $ 2,908
Revenues are recognized when earned in the governmental funds but are
recognized when received for budgetary purposes. During the year, $6,991 was
received that was attributable to prior year activities and $5,912 of revenue wasrealized but not received by the close of the year. 1,079
Expenditures for supplies and materials and prepaids are shown when they are used
in the governmental funds but reported as expenses when they are purchased forbudgetary purposes. The district purchased more supplies and materials than it used
during the year, resulting in an increase in inventories from $446 to $510 and 44
prepaids decreased by $108.
Obligations are accrued when incurred and measurable in the governmental funds
but reported when expended for budgetary purposes. There was a decreaseof $449 in the accounts payable accrual. (449)
A decrease of $55 in the liability insurance reserve and a reduction of $1,629 in
the reserve for workers compensation was made to comply with modified (1,684) accrual standards.
Fair market value adjustment for long-term investments 248
Encumbrances are included in expeditures for budgetary purposes but not for the governmental fund financial statements. (4,089)
Expenditures in the governmental fund financial statements include thosepaid with prior year encumbrances, which are excluded on the budgetary basis. 2,576
Expenditures for worker's compensation claims are shown in a separate fund for
budgetary purposes but combined with the general fund in the governmental funds. 427
Excess (deficiency) of revenues over expenditures - budgetary basis $ 1,060
Reconciliation of Statement of Revenues, Expenditures, andChanges in Fund Balances to the Budgetary Comparison
Schedule - General Fund (Unaudited)For the Year Ended June 30, 2017
(Thousands)

FINANCIAL SECTION: REQUIRED SUPPLEMENTARY INFORMATION
82
NOTES TO THE REQUIRED SUPPLEMENTARY INFORMATION
Year Ended June 30, 2017 Note 1. BUDGETS AND BUDGETARY ACCOUNTING
BUDGETARY COMPARISON SCHEDULE
A cash basis of accounting is used to prepare the budgetary comparison schedule. A reconciliation from the cash basis to the modified accrual basis of accounting, which is generally accepted accounting principles (GAAP), is presented on the face of the schedule.
BUDGET LAW AND PRACTICE
The board of the district has elected to prepare and present budgets under the Oklahoma School District Budget Act. The district superintendent directs the preparation of the budget proposal and submits it to the board. The board holds a public hearing on the proposed budget within 45 days preceding the start of the budget year. Notice of the date, time and place of the hearing, together with the proposed budget summary, is published in the Tulsa Daily Commerce and Legal News at least 5 days before the public hearing. The budget is also available upon request from the district’s chief financial officer. At the public hearing on the budget, any person may present to the board comments, recommendations or information on any part of the proposed budget. Once adopted, the budget must be in effect no later than the first day of the fiscal year to which it applies. The budget as adopted and filed with the Oklahoma state auditor and inspector constitutes an appropriation for each fund which may not be used for any other purpose except as provided by law. The district presents the budget in four funds: the general fund, capital projects fund, debt service fund and the special revenue fund which includes the child nutrition and building funds. Budgetary control for accounts without a project is generally at the full account level. For accounts within a project the budgetary control is generally maintained by fund, project and site. The district superintendent or designee may transfer an unexpended and unencumbered appropriation from one account to another within the same fund. Line item transfers that are not original budget items in excess of $25,000 require board approval. Whenever the necessity for maintaining any special fund of a school district has ceased to exist and a balance remains in the fund, the governing body may authorize the transfer of the balance to the general fund. Applicable law governs the use or transfer of any remaining balance in the debt service or capital projects fund. The district board amends the original budget after the prior fiscal year financial activity has been finalized, the annual state aid allocation has been released, federal fund allocations are identified, and the property tax valuations have been certified for all affected counties within the district; generally between December and February of the fiscal year.
ENCUMBRANCES
Encumbrances represent commitments related to unperformed contracts for goods or services. Encumbrance accounting, under which purchase orders, contracts and other commitments for the expenditure of resources are recorded to reserve that portion of the applicable appropriation, is utilized in the governmental funds. Encumbrances outstanding at year-end are included in the “actual” amounts shown expended during the year for the budgetary presentation but are excluded from the fund balances in the governmental fund financial statements as they do not constitute expenditures or liabilities because the commitments will be honored during the subsequent year.
REVENUES
Revenues are recorded on a cash basis and include deposits to district accounts from the first day through the last day of the fiscal year regardless of when they were actually earned.

83
Other Supplementary Information

84
This page is left blank intentionally
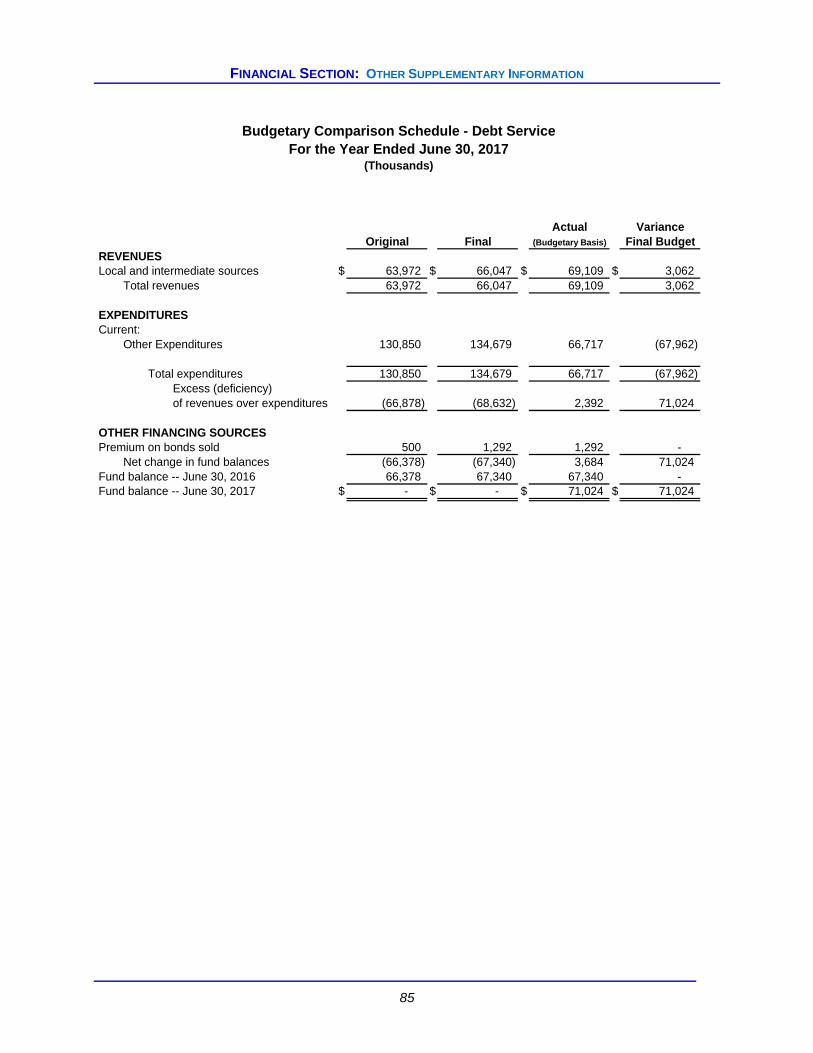
FINANCIAL SECTION: OTHER SUPPLEMENTARY INFORMATION
85
Actual VarianceOriginal Final (Budgetary Basis) Final Budget
REVENUESLocal and intermediate sources $ 63,972 $ 66,047 $ 69,109 $ 3,062
Total revenues 63,972 66,047 69,109 3,062
EXPENDITURESCurrent:
Other Expenditures 130,850 134,679 66,717 (67,962)
Total expenditures 130,850 134,679 66,717 (67,962) Excess (deficiency) of revenues over expenditures (66,878) (68,632) 2,392 71,024
OTHER FINANCING SOURCESPremium on bonds sold 500 1,292 1,292 -
Net change in fund balances (66,378) (67,340) 3,684 71,024 Fund balance -- June 30, 2016 66,378 67,340 67,340 - Fund balance -- June 30, 2017 $ - $ - $ 71,024 $ 71,024
Budgetary Comparison Schedule - Debt ServiceFor the Year Ended June 30, 2017
(Thousands)
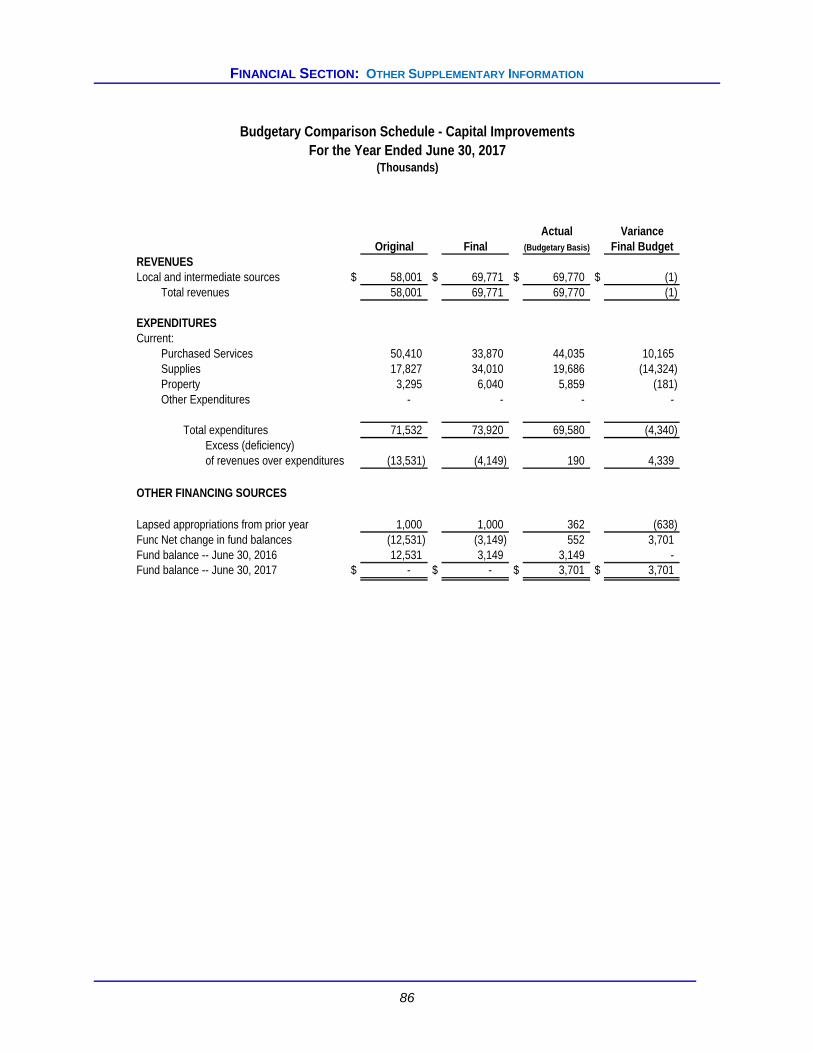
FINANCIAL SECTION: OTHER SUPPLEMENTARY INFORMATION
86
Actual VarianceOriginal Final (Budgetary Basis) Final Budget
REVENUESLocal and intermediate sources $ 58,001 $ 69,771 $ 69,770 $ (1)
Total revenues 58,001 69,771 69,770 (1)
EXPENDITURESCurrent:
Purchased Services 50,410 33,870 44,035 10,165 Supplies 17,827 34,010 19,686 (14,324) Property 3,295 6,040 5,859 (181) Other Expenditures - - - -
Total expenditures 71,532 73,920 69,580 (4,340) Excess (deficiency) of revenues over expenditures (13,531) (4,149) 190 4,339
OTHER FINANCING SOURCES
Lapsed appropriations from prior year 1,000 1,000 362 (638) FundNet change in fund balances (12,531) (3,149) 552 3,701 Fund balance -- June 30, 2016 12,531 3,149 3,149 - Fund balance -- June 30, 2017 $ - $ - $ 3,701 $ 3,701
Budgetary Comparison Schedule - Capital ImprovementsFor the Year Ended June 30, 2017
(Thousands)
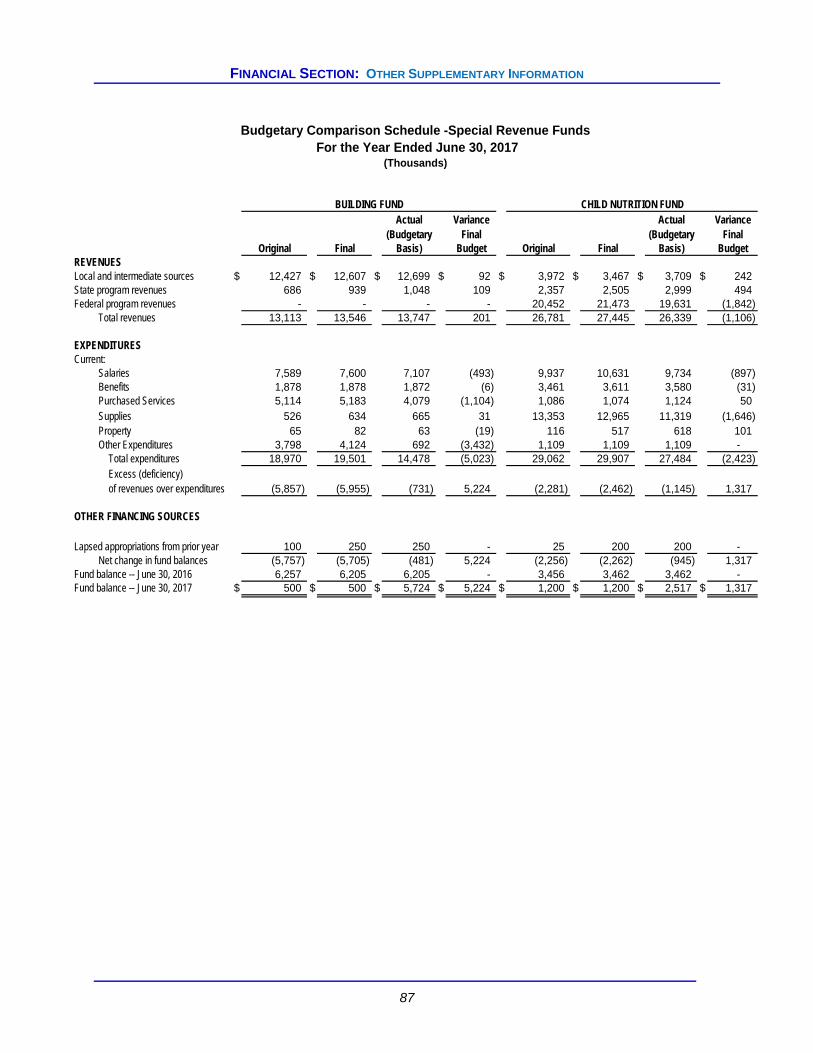
FINANCIAL SECTION: OTHER SUPPLEMENTARY INFORMATION
87
Actual Variance Actual Variance(Budgetary Final (Budgetary Final
Original Final Basis) Budget Original Final Basis) BudgetREVENUESLocal and intermediate sources $ 12,427 $ 12,607 $ 12,699 $ 92 $ 3,972 $ 3,467 $ 3,709 $ 242 State program revenues 686 939 1,048 109 2,357 2,505 2,999 494 Federal program revenues - - - - 20,452 21,473 19,631 (1,842)
Total revenues 13,113 13,546 13,747 201 26,781 27,445 26,339 (1,106)
EXPENDITURESCurrent:
Salaries 7,589 7,600 7,107 (493) 9,937 10,631 9,734 (897) Benefits 1,878 1,878 1,872 (6) 3,461 3,611 3,580 (31) Purchased Services 5,114 5,183 4,079 (1,104) 1,086 1,074 1,124 50 Supplies 526 634 665 31 13,353 12,965 11,319 (1,646) Property 65 82 63 (19) 116 517 618 101 Other Expenditures 3,798 4,124 692 (3,432) 1,109 1,109 1,109 -
Total expenditures 18,970 19,501 14,478 (5,023) 29,062 29,907 27,484 (2,423) Excess (deficiency) of revenues over expenditures (5,857) (5,955) (731) 5,224 (2,281) (2,462) (1,145) 1,317
OTHER FINANCING SOURCES
Lapsed appropriations from prior year 100 250 250 - 25 200 200 - Net change in fund balances (5,757) (5,705) (481) 5,224 (2,256) (2,262) (945) 1,317
Fund balance -- June 30, 2016 6,257 6,205 6,205 - 3,456 3,462 3,462 - Fund balance -- June 30, 2017 $ 500 $ 500 $ 5,724 $ 5,224 $ 1,200 $ 1,200 $ 2,517 $ 1,317
Budgetary Comparison Schedule -Special Revenue Funds For the Year Ended June 30, 2017
(Thousands)
BUILDING FUND CHILD NUTRITION FUND

FINANCIAL SECTION: OTHER SUPPLEMENTARY INFORMATION
88
Balance BalanceJune 30, June 30,
2016 Additions Deductions 2017ASSETS
Cash and cash equivalents $ 3,908 $ 3,475 $ 3,222 $ 4,161
TOTAL ASSETS 3,908 3,475 3,222 4,161
LIABILITIESDue to student groups 3,908 3,475 3,222 4,161
TOTAL LIABILITIES $ 3,908 $ 3,475 $ 3,222 $ 4,161
Statement of Changes in Fiduciary Assets and LiabilitiesStudent Activity Funds
For the Year Ended June 30, 2017(Thousands)

FINANCIAL SECTION: OTHER SUPPLEMENTARY INFORMATION
89
Workers TotalGeneral Compensation General Subfund Subfund Fund
ASSETSCash and cash equivalents $ 37,016 $ 769 $ 37,785 Investments 39,161 1,750 40,911 Receivables net of allowance for uncollectibles 98,453 - 98,453 Inventories and prepaid items 676 - 676
Total Assets 175,306 2,519 177,825 LIABILITIESLiabilites:
Accounts payable and accrued liabilities 35,038 42 35,080 Claims and judgments (1,775) 1,925 150
Total liabilities 33,263 1,967 35,230 DEFERRED INFLOWS OF RESOURCES
Succeeding year property tax 88,867 - 88,867 Unavailable revenue 3,674 - 3,674
Total deferred inflows of resources 92,541 - 92,541
FUND BALANCESNon-spendable
Inventories and prepaids 676 - 676 Restricted
Federal and state allocation carryover 523 - 523 Assigned
Purchases on order 2,379 - 2,379 Workers compensation - 552 552
Unassigned 45,924 - 45,924 Total fund balances 49,502 552 50,054
Total liabilities, deferred inflows of resources and fund balances $ 175,306 $ 2,519 $ 177,825
June 30, 2017(Thousands)
Combining Balance Sheet
General Fund

FINANCIAL SECTION: OTHER SUPPLEMENTARY INFORMATION
90
Workers TotalGeneral Compensation General Subfund Subfund Fund
REVENUESProperty taxes $ 85,468 $ - $ 85,468 Other local sources 11,545 - 11,545 Intermediate sources 10,410 - 10,410 Fees and charges 2,175 - 2,175 State aid 160,653 - 160,653 Federal aid 31,263 - 31,263 Earnings on investments 467 1 468 Miscellaneous 2,828 - 2,828
Total revenues 304,809 1 304,810
EXPENDITURESCurrent:
Instruction and instruction-related services 169,858 428 170,286 Support services - student and staff 44,325 - 44,325 Instructional and school leadership 20,666 - 20,666 Administrative support services 21,541 - 21,541 Operation of non-instructional services 1,494 - 1,494 Operation and maintenance of plant services 23,222 - 23,222 Student transportation services 11,171 - 11,171 Facilities acquisition and construction services 6 - 6 Charter schools 9,491 - 9,491
Total expenditures 301,774 428 302,202
Excess (deficiency) revenues overexpenditures 3,035 (427) 2,608
OTHER FINANCING SOURCESInsurance recoveries 4 - 4 Proceeds from sale of capital assets 296 - 296
Net change in fund balances 3,335 (427) 2,908
Fund balances -- June 30, 2016 46,167 979 47,146 Fund balances -- June 30, 2017 $ 49,502 $ 552 $ 50,054
For the Year Ended June 30, 2017(Thousands)
Combining Statement of Revenues, Expenditures, and Changes in Fund Balances
General Fund
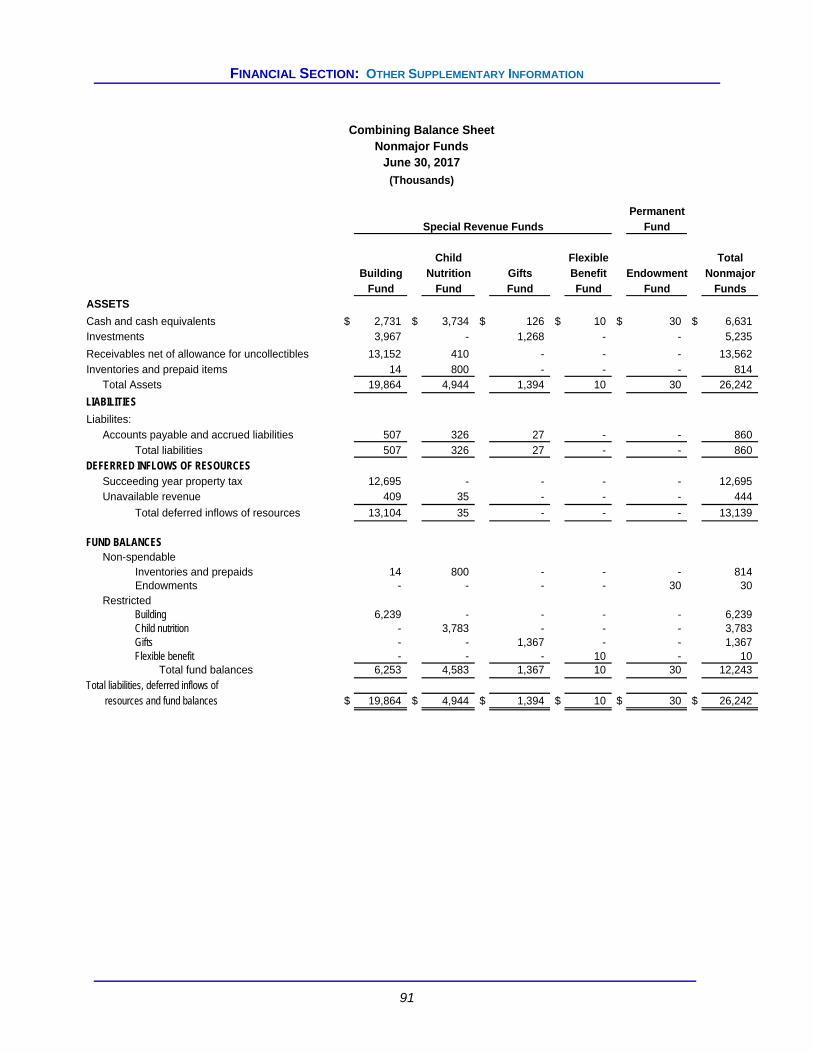
FINANCIAL SECTION: OTHER SUPPLEMENTARY INFORMATION
91
PermanentFund
Child Flexible TotalBuilding Nutrition Gifts Benefit Endowment Nonmajor
Fund Fund Fund Fund Fund FundsASSETS
Cash and cash equivalents $ 2,731 $ 3,734 $ 126 $ 10 $ 30 $ 6,631 Investments 3,967 - 1,268 - - 5,235
Receivables net of allowance for uncollectibles 13,152 410 - - - 13,562 Inventories and prepaid items 14 800 - - - 814
Total Assets 19,864 4,944 1,394 10 30 26,242
LIABILITIES
Liabilites:Accounts payable and accrued liabilities 507 326 27 - - 860
Total liabilities 507 326 27 - - 860 DEFERRED INFLOWS OF RESOURCES
Succeeding year property tax 12,695 - - - - 12,695 Unavailable revenue 409 35 - - - 444
Total deferred inflows of resources 13,104 35 - - - 13,139
FUND BALANCESNon-spendable
Inventories and prepaids 14 800 - - - 814 Endowments - - - - 30 30
RestrictedBuilding 6,239 - - - - 6,239 Child nutrition - 3,783 - - - 3,783 Gifts - - 1,367 - - 1,367 Flexible benefit - - - 10 - 10
Total fund balances 6,253 4,583 1,367 10 30 12,243 Total liabilities, deferred inflows of
resources and fund balances $ 19,864 $ 4,944 $ 1,394 $ 10 $ 30 $ 26,242
Special Revenue Funds
(Thousands)
Combining Balance SheetNonmajor Funds
June 30, 2017
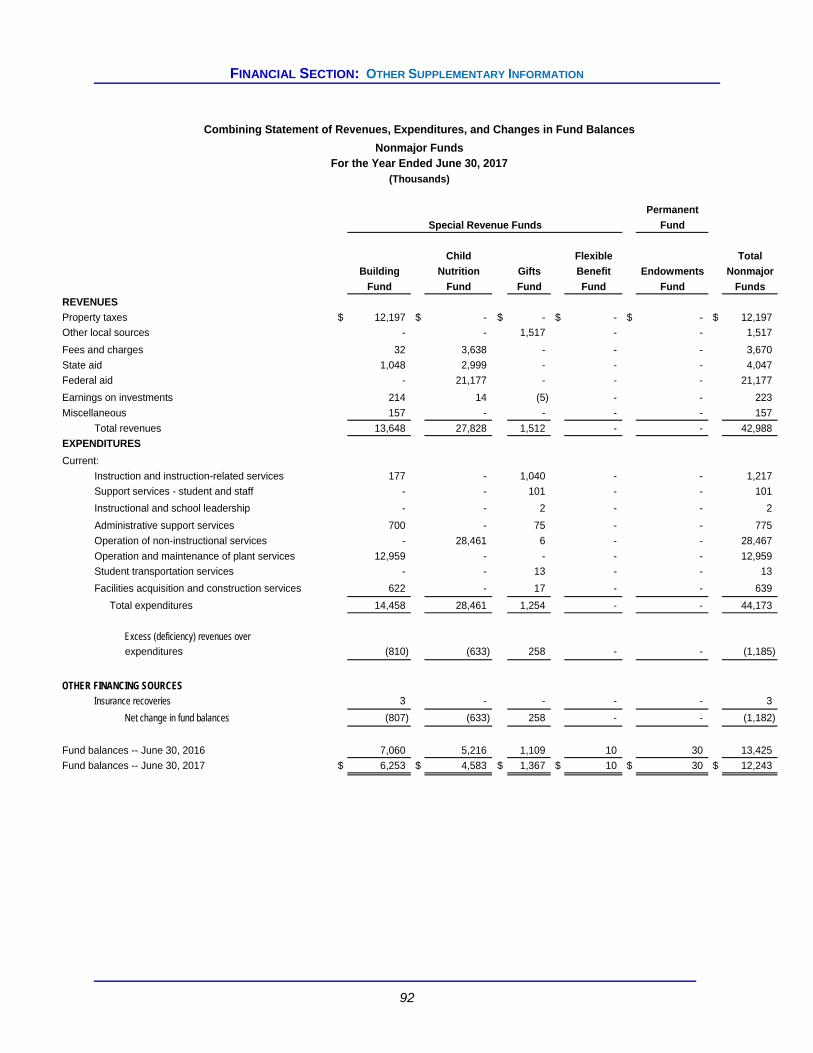
FINANCIAL SECTION: OTHER SUPPLEMENTARY INFORMATION
92
Permanent
Fund
Child Flexible Total
Building Nutrition Gifts Benefit Endowments Nonmajor
Fund Fund Fund Fund Fund Funds
REVENUES
Property taxes $ 12,197 $ - $ - $ - $ - $ 12,197
Other local sources - - 1,517 - - 1,517
Fees and charges 32 3,638 - - - 3,670
State aid 1,048 2,999 - - - 4,047
Federal aid - 21,177 - - - 21,177
Earnings on investments 214 14 (5) - - 223
Miscellaneous 157 - - - - 157
Total revenues 13,648 27,828 1,512 - - 42,988
EXPENDITURES
Current:
Instruction and instruction-related services 177 - 1,040 - - 1,217
Support services - student and staff - - 101 - - 101
Instructional and school leadership - - 2 - - 2
Administrative support services 700 - 75 - - 775
Operation of non-instructional services - 28,461 6 - - 28,467
Operation and maintenance of plant services 12,959 - - - - 12,959
Student transportation services - - 13 - - 13
Facilities acquisition and construction services 622 - 17 - - 639
Total expenditures 14,458 28,461 1,254 - - 44,173
Excess (deficiency) revenues overexpenditures (810) (633) 258 - - (1,185)
OTHER FINANCING SOURCES
Insurance recoveries 3 - - - - 3
Net change in fund balances (807) (633) 258 - - (1,182)
Fund balances -- June 30, 2016 7,060 5,216 1,109 10 30 13,425
Fund balances -- June 30, 2017 $ 6,253 $ 4,583 $ 1,367 $ 10 $ 30 $ 12,243
Combining Statement of Revenues, Expenditures, and Changes in Fund Balances
Nonmajor FundsFor the Year Ended June 30, 2017
(Thousands)
Special Revenue Funds

93
Statistical Section

94
This page is left blank intentionally
STATISTICAL SECTION: CONTENTS
95
COMPREHENSIVE ANNUAL FINANCIAL REPORT STATISTICAL SECTION (Unaudited) This part of the district’s comprehensive annual financial report presents detailed information as a context for understanding what the information in the financial statements, note disclosures, and required supplementary information says about the district’s overall financial position. Contents Page
Financial Trends .................................................................................................................................. 96
These schedules contain trend information to help the reader understand how the district’s financial performance has changed over time.
Revenue Capacity ............................................................................................................................... 102
These schedules present information to help the reader assess the district’s major revenue sources.
Debt Capacity ...................................................................................................................................... 106
These schedules present information to help the reader assess the affordability of the district’s current levels of outstanding debt and the district’s ability to issue additional debt in the future.
Demographic and Economic Information ......................................................................................... 110
These schedules offer demographic and economic indicators to help the reader understand the environment within which the district’s financial activities take place.
Operating Information ........................................................................................................................ 112
These schedules contain service and infrastructure data to help the reader understand how the information in the district’s financial report relates to the services the district provides and the activities it performs.
Sources
Unless otherwise noted, the information contained herein is derived from the comprehensive annual financial reports for the relevant year.

STATISTICAL SECTION: FINANCIAL TRENDS
96
Changes In Net Position
Last Ten Fiscal Years(accrual basis of accounting)
(Thousands)
Fiscal Year Ended June 30,
2017 2016 2015 2014
Expenses
Governmental activities:
Instruction and instruction-related services $ 204,832 $ 189,926 $ 181,819 $ 198,500
Support services - student and staff 49,129 50,977 45,399 45,168
Instructional and school leadership 20,667 21,890 21,389 20,394
Administrative support services 31,430 34,328 43,169 36,711
Operation of non-instructional services 30,437 29,665 30,923 26,071
Operation and maintenance of plant services 37,732 35,922 37,238 35,757
Student transportation services 11,151 11,603 12,800 15,246
Facilities acquisition and construction services 1,895 2,497 2,443 52
Charter schools 9,491 7,566 5,424 4,306
Interest on long-term debt 3,341 3,234 3,775 3,139
Unrestricted investment loss 8 - - -
Total primary governmental activities expense 400,113 387,608 384,379 385,344
Program Revenues
Governmental activities:
Charges for services
Operation of non-instructional services 5,278 5,612 5,406 5,548
Student transportation services - - (11,151) 1,435
Other 565 669 774 662
Operating grants and contributions 77,728 73,847 76,880 72,202
Capital grants and contributions - - - -
Total primary governmental activities program revenues 83,571 80,128 71,909 79,847
Net Expense
Total primary governmental activities net expenses (316,542) (307,480) (312,470) (305,497)
General Revenues and Other Changes in Net Position
Governmental activities:
Property taxes 166,402 160,160 159,678 147,823
State aid - formula grants 88,459 89,424 95,126 94,787
Dedicated state revenue 63,653 64,551 65,260 63,792
County revenue 10,410 10,186 9,927 9,807
Unrestricted investment earnings - 1,476 591 857
Gain (loss) on sale of real estate 296 550 218 (27)
Gain on early lease payoff - - - - Insurance recovery 7 100 69 6,112 Other local revenue 2,493 2,236 304 496
Total primary governmental activities 331,720 328,683 331,173 323,647
Change in Net Position
Total primary government $ 15,178 $ 21,203 $ 18,703 $ 18,150

STATISTICAL SECTION: FINANCIAL TRENDS
97
2013 2012 2011 2010 2009 2008
$ 188,002 $ 192,924 $ 200,810 $ 201,598 $ 190,462 $ 194,461
46,942 46,858 51,731 49,917 46,783 41,738
17,051 16,986 17,192 17,781 17,104 17,195
28,713 28,765 27,092 27,641 24,990 18,849
28,519 28,800 26,117 27,375 25,053 23,994
34,385 36,426 36,498 36,733 38,964 38,959
12,714 13,753 12,969 13,927 13,176 14,743
6,998 2,008 2,396 - - -
4,249 1,310 1,468 3,461 3,328 4,514
2,935 3,735 4,490 4,544 6,039 4,542
- - - - - -
370,508 371,565 380,763 382,977 365,899 358,995
5,722 5,754 5,429 6,039 6,411 6,368
1,263 1,079 1,855 1,736 1,370 760
636 378 1,270 699 907 899
74,612 87,483 97,373 85,309 84,977 71,787
- 90 167 150 - 868
82,233 94,784 106,094 93,933 93,665 80,682
(288,275) (276,781) (274,669) (289,044) (272,234) (278,313)
144,602 141,061 139,515 140,357 132,731 128,508
97,186 97,945 94,405 96,698 117,458 116,347
63,360 61,413 47,055 44,411 44,033 42,495
10,194 9,581 9,446 9,061 8,653 9,120
389 575 890 396 1,396 4,544
- 417 - - - -
- 359 - - - - - - - - - -
1,507 529 508 722 614 370
317,238 311,880 291,819 291,645 304,885 301,384
$ 28,963 $ 35,098 $ 17,150 $ 2,601 $ 32,651 $ 23,071

STATISTICAL SECTION: FINANCIAL TRENDS
98
Changes in Fund Balances, Governmental Funds
Last Ten Fiscal Years(modified accrual basis of accounting)
(Thousands)
Fiscal Year Ended June 30,
2017 2016 2015 2014
Revenues
Property taxes $ 166,402 $ 160,161 $ 153,943 $ 145,061
Other local sources 13,062 6,890 11,001 8,168
Intermediate sources 10,410 10,186 9,927 9,807
Fees and charges 5,845 6,286 6,187 6,224
State aid 164,700 168,126 174,496 171,526
Federal aid 52,440 54,789 54,270 57,065
Earnings on investments 61 1,503 644 917
Miscellaneous 2,985 2,702 2,312 2,263
Total revenues 415,905 410,643 412,780 401,031
Expenditures
Instruction and instruction-related services 182,384 189,630 190,655 191,443
Support services - student and staff 47,404 49,303 44,034 44,227
Instructional and school leadership 20,668 21,890 21,389 20,394
Administrative support services 26,015 28,841 41,959 38,446
Operation of non-instructional services 29,961 28,213 28,914 27,151
Operation and maintenance of plant services 36,381 35,228 36,239 37,000
Student transportation services 15,592 16,093 13,621 14,676
Facilities acquisition and construction services 37,506 40,761 43,972 34,008
Charter schools 9,491 7,566 5,424 4,305
Debt service:
Principal 62,314 78,202 53,790 51,925
Interest 4,969 3,405 4,166 3,985
Total expenditures 472,685 499,132 484,163 467,560
Excess of expenses over revenues (56,780) (88,489) (71,383) (66,529)
Other financing sources
Capital Leases 3,547 - - 1,024
Bond issuances 71,062 66,761 95,777 58,535
Insurance recoveries 7 99 56 6,113
Proceeds from sale of Capital Assets 296 851 216 2,317
Net change in fund balances $ 18,132 $ (20,778) $ 24,666 $ 1,460
Debt service as a percentage of noncapital expenditures 15.56% 17.93% 13.39% 13.32%

STATISTICAL SECTION: FINANCIAL TRENDS
99
2013 2012 2011 2010 2009 2008
$ 144,601 $ 141,060 $ 149,208 $ 150,748 $ 140,856 $ 135,964
7,056 8,090
10,194 9,581 9,446 9,061 8,873 9,063
6,427 6,222 7,566 7,199 7,069 6,518
167,754 165,789 151,118 151,481 170,505 172,858
62,689 79,665 83,271 78,227 71,656 56,873
410 597 972 757 1,569 4,693
2,128 1,938 1,734 1,547 1,591 2,045
401,259 412,942 403,315 399,020 402,119 388,014
192,258 192,615 194,066 197,140 193,200 191,845
46,144 46,196 50,758 49,112 46,018 40,981
17,050 16,986 17,197 17,781 17,104 17,195
25,347 26,208 26,258 24,845 22,258 20,144
26,237 25,850 25,759 26,303 23,862 22,744
33,706 35,588 36,309 37,813 40,088 40,443
13,133 13,948 17,482 15,582 11,647 13,158
52,898 83,689 42,026 23,348 34,685 32,912
4,249 1,310 1,468 3,461 3,328 4,514
50,175 49,593 43,490 44,615 39,615 36,615
4,654 4,470 5,280 6,320 5,813 4,118
465,851 496,453 460,093 446,320 437,618 424,669
(64,592) (83,511) (56,778) (47,300) (35,499) (36,655)
11,936 17,562 3,848 - - -
48,432 47,412 40,213 79,011 42,824 40,390
- - - - - -
- 1,948 - - - -
$ (4,224) $ (16,589) $ (12,717) $ 31,711 $ 7,325 $ 3,735
13.34% 13.12% 11.68% 11.81% 11.20% 10.32%

STATISTICAL SECTION: FINANCIAL TRENDS
100
2017 2016 2015 2014 2013 2012 2011 2010 2009 2008Governmental activities
Net investment in capital assets: $ 335,360 $ 323,765 $ 326,777 $ 318,867 $ 303,399 $ 280,211 $ 262,429 $ 255,543 $ 236,025 $ 215,331
Restricted for:Debt service 69,380 65,971 52,882 45,494 47,125 48,500 49,781 48,708 47,453 43,660
Building 6,253 7,060 8,272 8,377 5,608 4,487 1,108 1,191 - - Other 6,513 11,924 1,232 1,194 1,209 1,580 1,810 1,239 - -
Unrestricted (215,519) (234,341) (222,911) 44,316 42,757 36,357 21,175 12,472 33,074 24,910
Total primary governmentalactivities net position $ 201,987 $ 174,379 $ 166,252 $ 418,248 $ 400,098 $ 371,135 $ 336,303 $ 319,153 $ 316,552 $ 283,901
Note: The District adopted GASB Statement No. 65 for financial reporting purposes in fiscal year ended June 30, 2013; for comparative purposes fiscal year ended June 30, 2012 has been restated.The District adopted GASB Statement No. 54 for financial reporting purposes in fiscal year ended June 30, 2011; for comparative purposes fiscal year ended June 30, 2010 was restated.
Last Ten Fiscal Years(accrual basis of accounting)
(Thousands)
Fiscal Year Ended June 30,
Net Position By Component
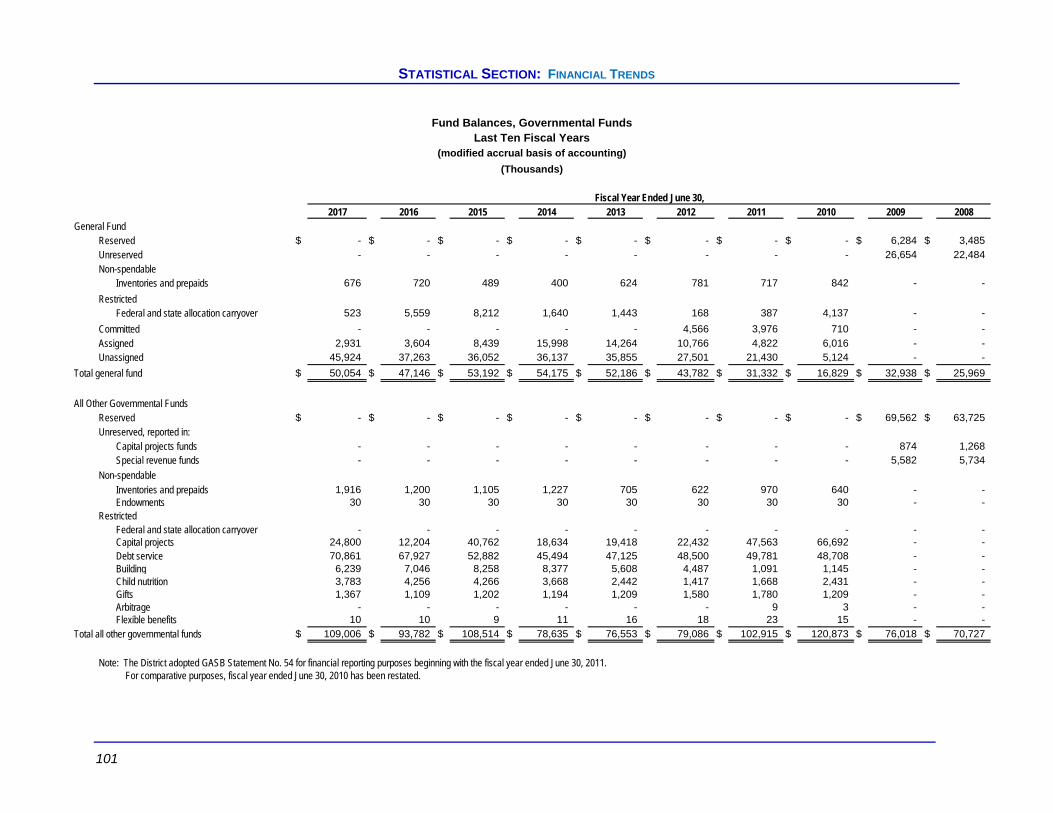
STATISTICAL SECTION: FINANCIAL TRENDS
101
2017 2016 2015 2014 2013 2012 2011 2010 2009 2008General Fund
Reserved $ - $ - $ - $ - $ - $ - $ - $ - $ 6,284 $ 3,485
Unreserved - - - - - - - - 26,654 22,484
Non-spendableInventories and prepaids 676 720 489 400 624 781 717 842 - -
RestrictedFederal and state allocation carryover 523 5,559 8,212 1,640 1,443 168 387 4,137 - -
Committed - - - - - 4,566 3,976 710 - -
Assigned 2,931 3,604 8,439 15,998 14,264 10,766 4,822 6,016 - - Unassigned 45,924 37,263 36,052 36,137 35,855 27,501 21,430 5,124 - -
Total general fund $ 50,054 $ 47,146 $ 53,192 $ 54,175 $ 52,186 $ 43,782 $ 31,332 $ 16,829 $ 32,938 $ 25,969
All Other Governmental FundsReserved $ - $ - $ - $ - $ - $ - $ - $ - $ 69,562 $ 63,725
Unreserved, reported in:Capital projects funds - - - - - - - - 874 1,268 Special revenue funds - - - - - - - - 5,582 5,734
Non-spendableInventories and prepaids 1,916 1,200 1,105 1,227 705 622 970 640 - - Endowments 30 30 30 30 30 30 30 30 - -
RestrictedFederal and state allocation carryover - - - - - - - - - - Capital projects 24,800 12,204 40,762 18,634 19,418 22,432 47,563 66,692 - - Debt service 70,861 67,927 52,882 45,494 47,125 48,500 49,781 48,708 - - Building 6,239 7,046 8,258 8,377 5,608 4,487 1,091 1,145 - - Child nutrition 3,783 4,256 4,266 3,668 2,442 1,417 1,668 2,431 - - Gifts 1,367 1,109 1,202 1,194 1,209 1,580 1,780 1,209 - - Arbitrage - - - - - - 9 3 - - Flexible benefits 10 10 9 11 16 18 23 15 - -
Total all other governmental funds $ 109,006 $ 93,782 $ 108,514 $ 78,635 $ 76,553 $ 79,086 $ 102,915 $ 120,873 $ 76,018 $ 70,727
Note: The District adopted GASB Statement No. 54 for financial reporting purposes beginning with the fiscal year ended June 30, 2011. For comparative purposes, fiscal year ended June 30, 2010 has been restated.
Fund Balances, Governmental FundsLast Ten Fiscal Years
(modified accrual basis of accounting)
(Thousands)
Fiscal Year Ended June 30,
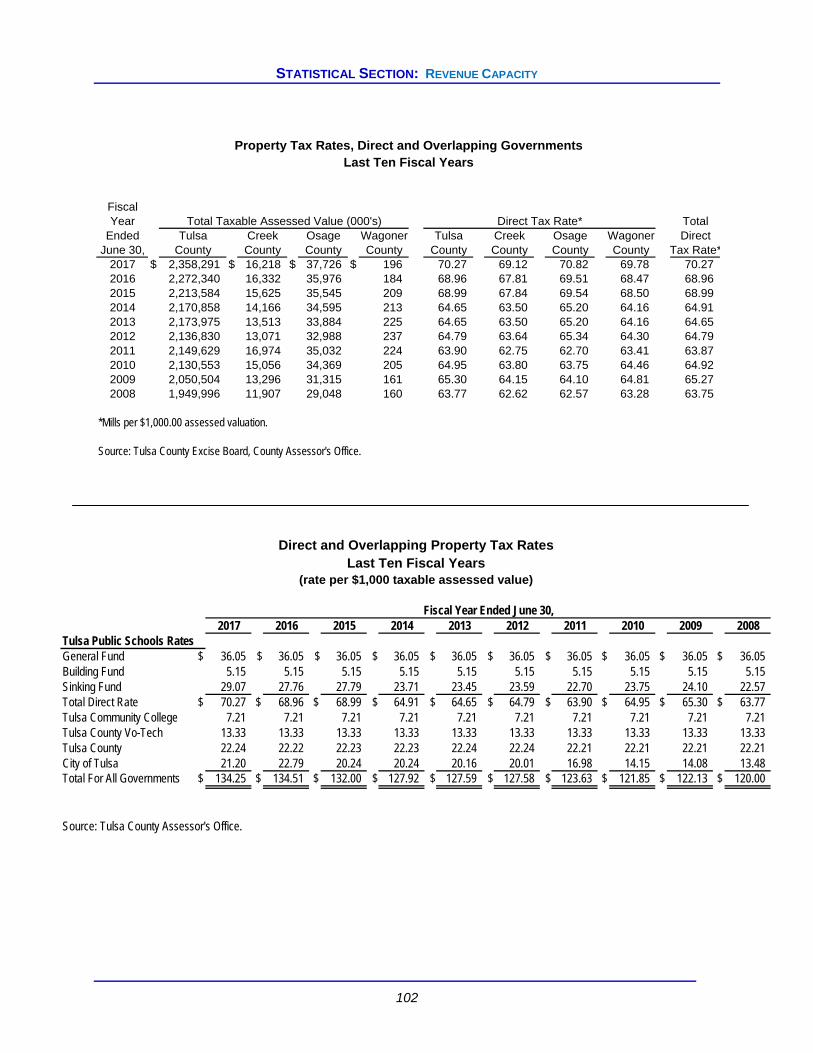
STATISTICAL SECTION: REVENUE CAPACITY
102
FiscalYear Total Taxable Assessed Value (000's) Direct Tax Rate* Total
Ended Tulsa Creek Osage Wagoner Tulsa Creek Osage Wagoner DirectJune 30, County County County County County County County County Tax Rate*
2017 $ 2,358,291 $ 16,218 $ 37,726 $ 196 70.27 69.12 70.82 69.78 70.27 2016 2,272,340 16,332 35,976 184 68.96 67.81 69.51 68.47 68.96 2015 2,213,584 15,625 35,545 209 68.99 67.84 69.54 68.50 68.99 2014 2,170,858 14,166 34,595 213 64.65 63.50 65.20 64.16 64.91 2013 2,173,975 13,513 33,884 225 64.65 63.50 65.20 64.16 64.65 2012 2,136,830 13,071 32,988 237 64.79 63.64 65.34 64.30 64.79 2011 2,149,629 16,974 35,032 224 63.90 62.75 62.70 63.41 63.87 2010 2,130,553 15,056 34,369 205 64.95 63.80 63.75 64.46 64.92 2009 2,050,504 13,296 31,315 161 65.30 64.15 64.10 64.81 65.27 2008 1,949,996 11,907 29,048 160 63.77 62.62 62.57 63.28 63.75
*Mills per $1,000.00 assessed valuation.
Source: Tulsa County Excise Board, County Assessor's Office.
Property Tax Rates, Direct and Overlapping GovernmentsLast Ten Fiscal Years
2017 2016 2015 2014 2013 2012 2011 2010 2009 2008Tulsa Public Schools RatesGeneral Fund $ 36.05 $ 36.05 $ 36.05 $ 36.05 $ 36.05 $ 36.05 $ 36.05 $ 36.05 $ 36.05 $ 36.05 Building Fund 5.15 5.15 5.15 5.15 5.15 5.15 5.15 5.15 5.15 5.15 Sinking Fund 29.07 27.76 27.79 23.71 23.45 23.59 22.70 23.75 24.10 22.57 Total Direct Rate $ 70.27 $ 68.96 $ 68.99 $ 64.91 $ 64.65 $ 64.79 $ 63.90 $ 64.95 $ 65.30 $ 63.77 Tulsa Community College 7.21 7.21 7.21 7.21 7.21 7.21 7.21 7.21 7.21 7.21 Tulsa County Vo-Tech 13.33 13.33 13.33 13.33 13.33 13.33 13.33 13.33 13.33 13.33 Tulsa County 22.24 22.22 22.23 22.23 22.24 22.24 22.21 22.21 22.21 22.21 City of Tulsa 21.20 22.79 20.24 20.24 20.16 20.01 16.98 14.15 14.08 13.48 Total For All Governments $ 134.25 $ 134.51 $ 132.00 $ 127.92 $ 127.59 $ 127.58 $ 123.63 $ 121.85 $ 122.13 $ 120.00
Source: Tulsa County Assessor's Office.
Direct and Overlapping Property Tax RatesLast Ten Fiscal Years
(rate per $1,000 taxable assessed value)
Fiscal Year Ended June 30,

STATISTICAL SECTION: REVENUE CAPACITY
103
Assessed Value and Estimated Actual Value of Taxable PropertyLast Ten Fiscal Years
Fiscal Estimated AssessedYear Total Taxable Assessed Value (000's) Total Actual Value as a
Ended Real Personal Public Direct Value Percentage ofJune 30, Property Property Service Tax Rate* (000's) Actual Value
2017 $ 1,815,016 $ 454,190 $ 143,225 70.27 $ 21,693,068 11.12%2016 1,759,111 437,249 128,472 68.96 20,948,369 11.10%2015 1,712,885 422,032 130,046 68.99 20,383,119 11.11%2014 1,678,771 392,152 148,909 64.91 19,859,929 11.18%2013 1,661,274 370,958 189,365 64.65 19,672,823 11.29%2012 1,643,445 354,142 185,539 64.79 19,325,190 11.30%2011 1,627,450 370,050 204,359 63.87 19,424,410 11.34%2010 1,562,217 379,621 188,715 64.92 19,299,072 11.04%2009 1,541,415 378,479 175,382 65.27 18,594,837 11.27%2008 1,467,926 340,065 183,119 63.75 17,577,797 11.33%
*Mills per $1,000.00 assessed valuation.
Source: Tulsa County Assessor's Office.

STATISTICAL SECTION: REVENUE CAPACITY
104
Principal Property Taxpayers
Year Ended June 30,2017 2008
Taxable Percentage of Taxable Percentage ofAssessed Total Taxable Assessed Total Taxable
Value Assessed Value AssessedTaxpayer (000's) Rank Value (000's) Rank Value
Holly Refining & Marketing $ 65,189 1 2.7% $ n/a n/a n/aPublic Service Company of Oklahoma 45,739 2 1.9% 58,701 1 2.9%AHS Hillcrest/Tulsa Holdings 27,784 3 1.2% 27,034 3 1.4%Helmerich & Payne 10,798 4 0.4% n/a n/a n/aAT&T Companies* 20,948 5 0.9% 43,809 2 2.2%Oklahoma Natural Gas Company 22,474 6 0.9% 22,267 5 1.1%Williams Companies 14,454 7 0.6% 12,112 8 0.6%Warren Foundation 13,802 8 0.6% 11,552 9 0.6%H P Financial Services 10,877 9 0.5% n/a n/a n/aLevel 3 Comms LLC 8,736 10 0.4% n/a n/a n/aSinclair Oil Company n/a n/a n/a 24,994 4 1.3%Cingular Wireless LLC n/a n/a n/a 12,520 7 0.6%Sun Oil Company n/a n/a n/a 13,516 6 0.7%EDS Information n/a n/a n/a 7,462 10 0.4%
Total $ 240,801 10.0% $ 233,967 11.8%
Source: Tulsa County Assessor's Office.

STATISTICAL SECTION: REVENUE CAPACITY
105
Property Tax Levies and Collections
Last Ten Fiscal Years
(Thousands)
Fiscal Collected within Fiscal Total Collections
Year Year of the Levy Collected in to Date
Ended Gross Percentage Subsequent Percentage
June 30, Tax Levy* Amount of Levy Years Amount of Levy
2017 169,524 161,643 95.35% - 161,643 95.35%
2016 160,321 162,172 101.15% 236 162,408 101.30%
2015 156,261 150,106 96.06% 3,816 153,922 98.50%
2014 143,515 138,723 96.66% 4,735 143,458 99.96%
2013 143,629 139,486 97.12% 3,682 143,168 99.68%
2012 141,448 134,758 95.27% 5,240 139,998 98.97%
2011 140,637 133,314 94.79% 6,204 139,518 99.20%
2010 141,544 134,517 95.04% 5,827 140,344 99.15%
2009 136,769 129,564 94.73% 6,527 136,091 99.50%
2008 126,925 121,880 96.03% 3,852 125,732 99.06%
*Tulsa County Excise Board, County Assessor's Office.

STATISTICAL SECTION: DEBT CAPACITY
106
Total General DebtFiscal Obligation Tulsa County PercentageYear Bonded Capital Total Personal of Total Tulsa County Total Debt
Ended Debt (1) Leases (1) Debt (1) Income (2) Personal Population (2) Per CapitaJune 30, (thousands) (thousands) (thousands) (thousands) Income (thousands) (thousands)2017 $ 250,118 $ 2,973 $ 253,091 44,001,173 0.58% 648 $ 391 2016 241,882 0 241,882 44,001,173 0.55% 648 373 2015 224,096 30,507 254,603 44,001,173 0.58% 639 398 2014 182,344 30,852 213,196 44,832,158 0.48% 630 338 2013 176,044 29,907 205,951 40,896,611 0.50% 623 331 2012 178,460 17,722 196,182 36,362,176 0.54% 615 319 2011 179,586 3,823 183,409 30,945,188 0.59% 609 301 2010 183,270 2,122 185,392 26,739,944 0.69% 605 306 2009 149,305 797 150,102 25,561,640 0.59% 598 251 2008 146,533 1,802 148,335 32,139,675 0.46% 589 252
Source:(1) Note 8. Long-term debt(2) See schedule of Demographic and Economic Information
Ratios of Total Outstanding Debt by Type
Last Ten Fiscal Years
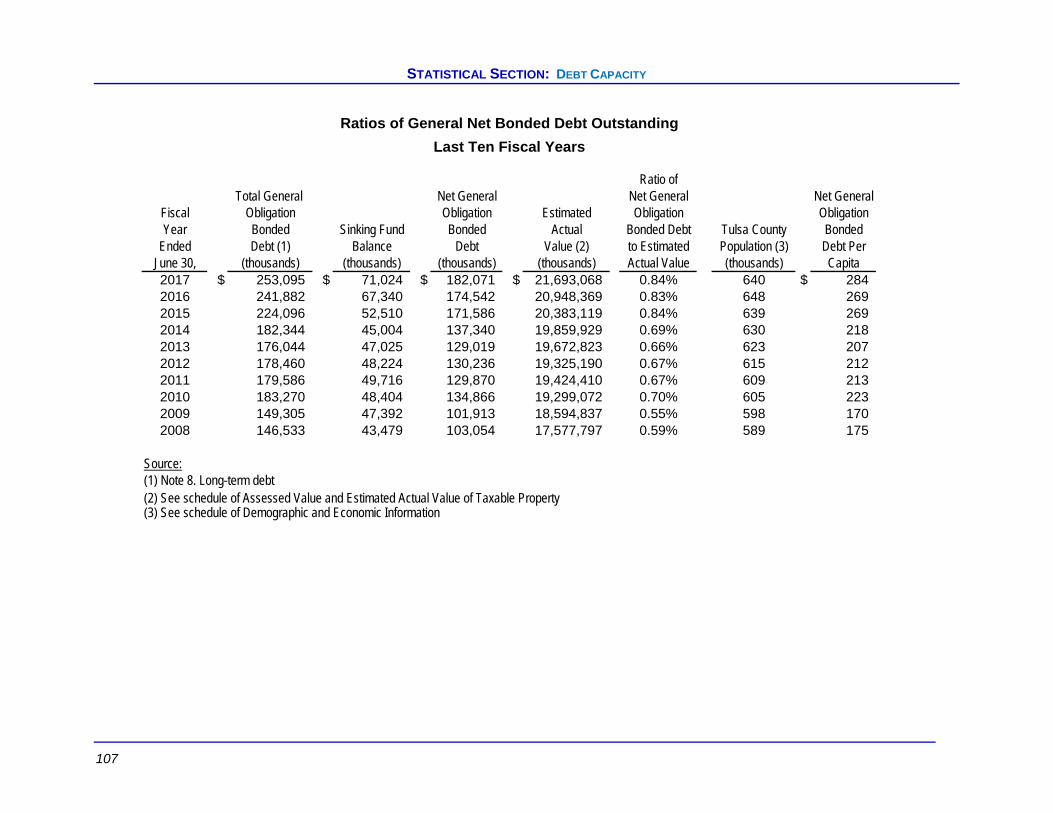
STATISTICAL SECTION: DEBT CAPACITY
107
Ratio ofTotal General Net General Net General Net General
Fiscal Obligation Obligation Estimated Obligation ObligationYear Bonded Sinking Fund Bonded Actual Bonded Debt Tulsa County Bonded
Ended Debt (1) Balance Debt Value (2) to Estimated Population (3) Debt PerJune 30, (thousands) (thousands) (thousands) (thousands) Actual Value (thousands) Capita2017 $ 253,095 $ 71,024 $ 182,071 $ 21,693,068 0.84% 640 $ 284 2016 241,882 67,340 174,542 20,948,369 0.83% 648 269 2015 224,096 52,510 171,586 20,383,119 0.84% 639 269 2014 182,344 45,004 137,340 19,859,929 0.69% 630 218 2013 176,044 47,025 129,019 19,672,823 0.66% 623 207 2012 178,460 48,224 130,236 19,325,190 0.67% 615 212 2011 179,586 49,716 129,870 19,424,410 0.67% 609 213 2010 183,270 48,404 134,866 19,299,072 0.70% 605 223 2009 149,305 47,392 101,913 18,594,837 0.55% 598 170 2008 146,533 43,479 103,054 17,577,797 0.59% 589 175
Source:(1) Note 8. Long-term debt(2) See schedule of Assessed Value and Estimated Actual Value of Taxable Property(3) See schedule of Demographic and Economic Information
Ratios of General Net Bonded Debt Outstanding
Last Ten Fiscal Years
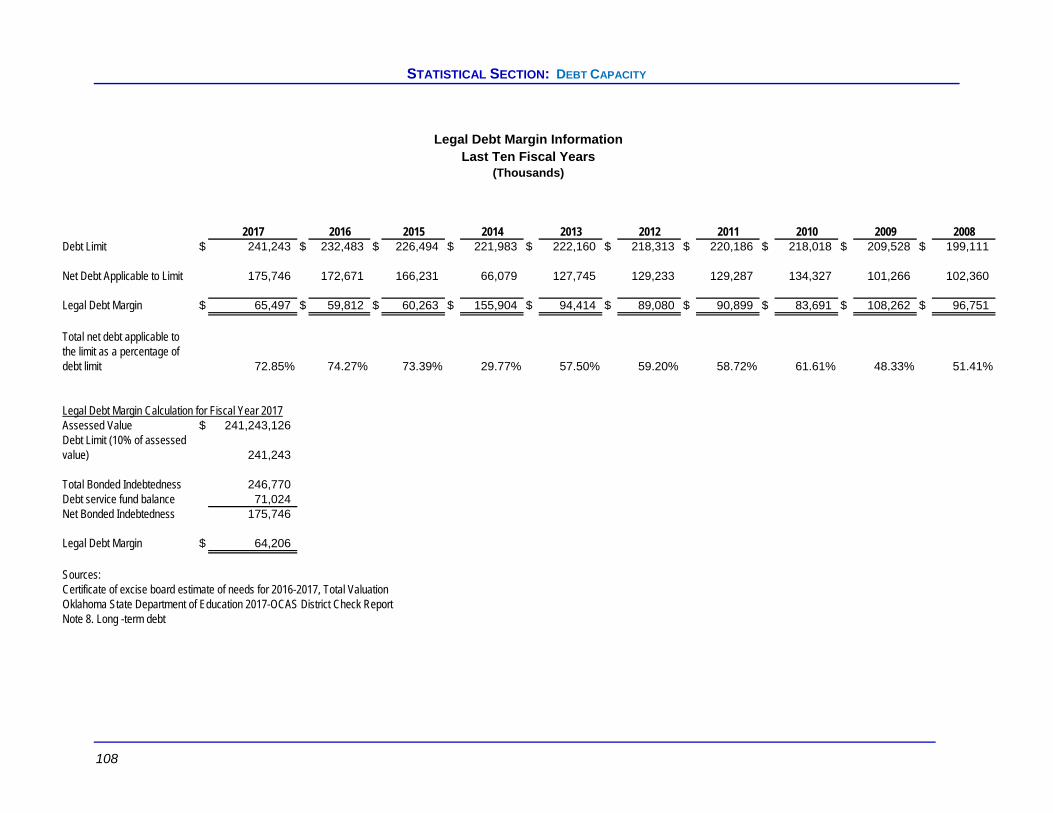
STATISTICAL SECTION: DEBT CAPACITY
108
2017 2016 2015 2014 2013 2012 2011 2010 2009 2008Debt Limit $ 241,243 $ 232,483 $ 226,494 $ 221,983 $ 222,160 $ 218,313 $ 220,186 $ 218,018 $ 209,528 $ 199,111
Net Debt Applicable to Limit 175,746 172,671 166,231 66,079 127,745 129,233 129,287 134,327 101,266 102,360
Legal Debt Margin $ 65,497 $ 59,812 $ 60,263 $ 155,904 $ 94,414 $ 89,080 $ 90,899 $ 83,691 $ 108,262 $ 96,751
Total net debt applicable tothe limit as a percentage ofdebt limit 72.85% 74.27% 73.39% 29.77% 57.50% 59.20% 58.72% 61.61% 48.33% 51.41%
Legal Debt Margin Calculation for Fiscal Year 2017Assessed Value $ 241,243,126 Debt Limit (10% of assessedvalue) 241,243
Total Bonded Indebtedness 246,770 Debt service fund balance 71,024 Net Bonded Indebtedness 175,746
Legal Debt Margin $ 64,206
Sources: Certificate of excise board estimate of needs for 2016-2017, Total ValuationOklahoma State Department of Education 2017-OCAS District Check ReportNote 8. Long -term debt
Legal Debt Margin InformationLast Ten Fiscal Years
(Thousands)
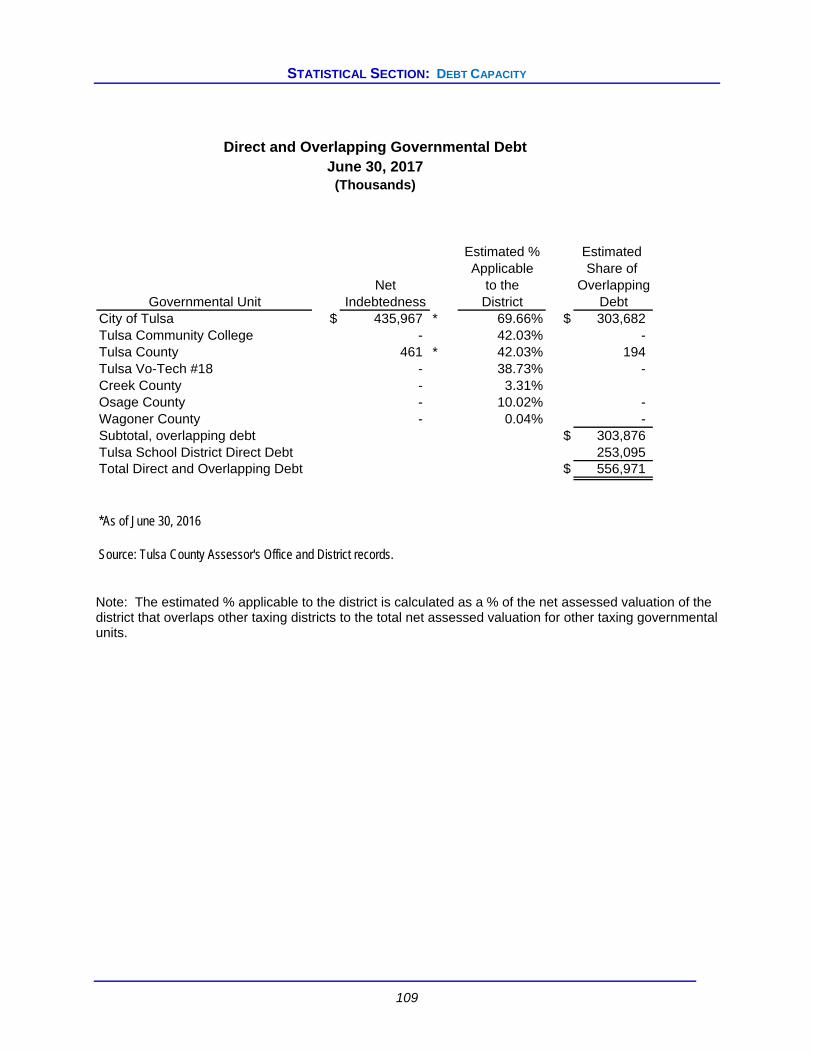
STATISTICAL SECTION: DEBT CAPACITY
109
Direct and Overlapping Governmental DebtJune 30, 2017
(Thousands)
Estimated % Estimated Applicable Share of
Net to the OverlappingGovernmental Unit Indebtedness District Debt
City of Tulsa $ 435,967 * 69.66% $ 303,682 Tulsa Community College - 42.03% - Tulsa County 461 * 42.03% 194 Tulsa Vo-Tech #18 - 38.73% - Creek County - 3.31%Osage County - 10.02% - Wagoner County - 0.04% - Subtotal, overlapping debt $ 303,876 Tulsa School District Direct Debt 253,095 Total Direct and Overlapping Debt $ 556,971
*As of June 30, 2016
Source: Tulsa County Assessor's Office and District records. Note: The estimated % applicable to the district is calculated as a % of the net assessed valuation of the district that overlaps other taxing districts to the total net assessed valuation for other taxing governmental units.
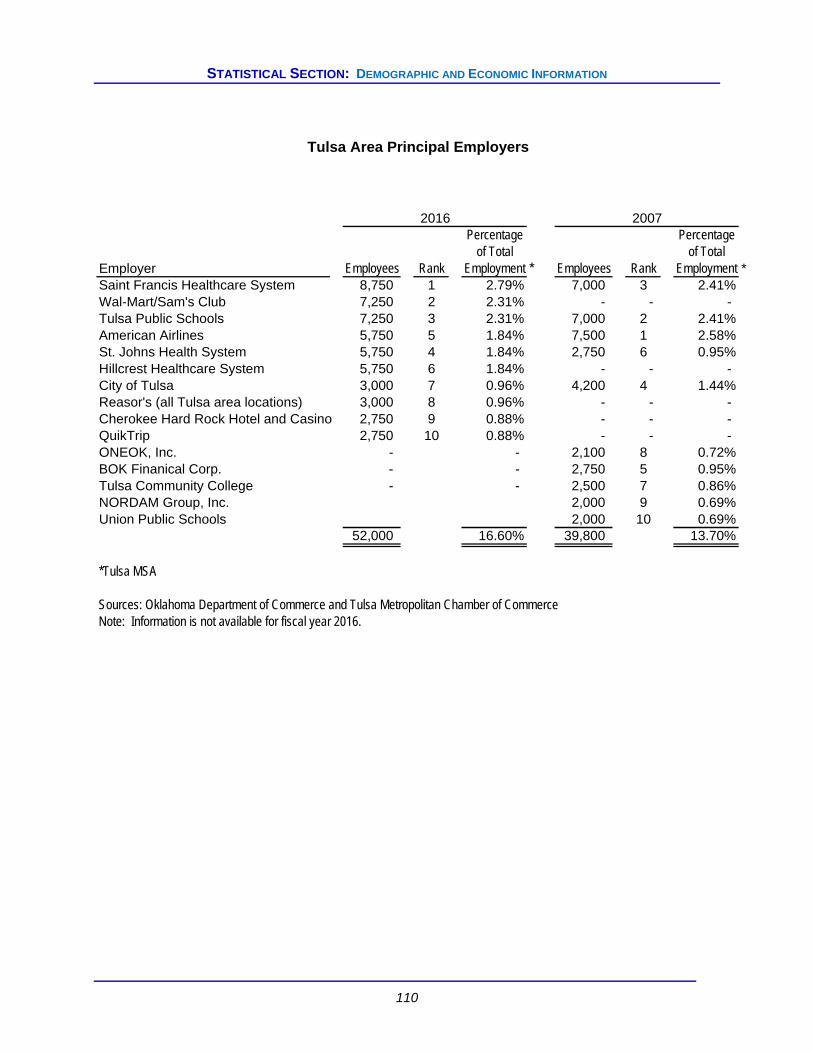
STATISTICAL SECTION: DEMOGRAPHIC AND ECONOMIC INFORMATION
110
Tulsa Area Principal Employers
2016 2007Percentage Percentage
of Total of TotalEmployer Employees Rank Employment * Employees Rank Employment *Saint Francis Healthcare System 8,750 1 2.79% 7,000 3 2.41%Wal-Mart/Sam's Club 7,250 2 2.31% - - - Tulsa Public Schools 7,250 3 2.31% 7,000 2 2.41%American Airlines 5,750 5 1.84% 7,500 1 2.58%St. Johns Health System 5,750 4 1.84% 2,750 6 0.95%Hillcrest Healthcare System 5,750 6 1.84% - - - City of Tulsa 3,000 7 0.96% 4,200 4 1.44%Reasor's (all Tulsa area locations) 3,000 8 0.96% - - - Cherokee Hard Rock Hotel and Casino 2,750 9 0.88% - - - QuikTrip 2,750 10 0.88% - - - ONEOK, Inc. - - 2,100 8 0.72%BOK Finanical Corp. - - 2,750 5 0.95%Tulsa Community College - - 2,500 7 0.86%NORDAM Group, Inc. 2,000 9 0.69%Union Public Schools 2,000 10 0.69%
52,000 16.60% 39,800 13.70%
*Tulsa MSA
Sources: Oklahoma Department of Commerce and Tulsa Metropolitan Chamber of CommerceNote: Information is not available for fiscal year 2016.
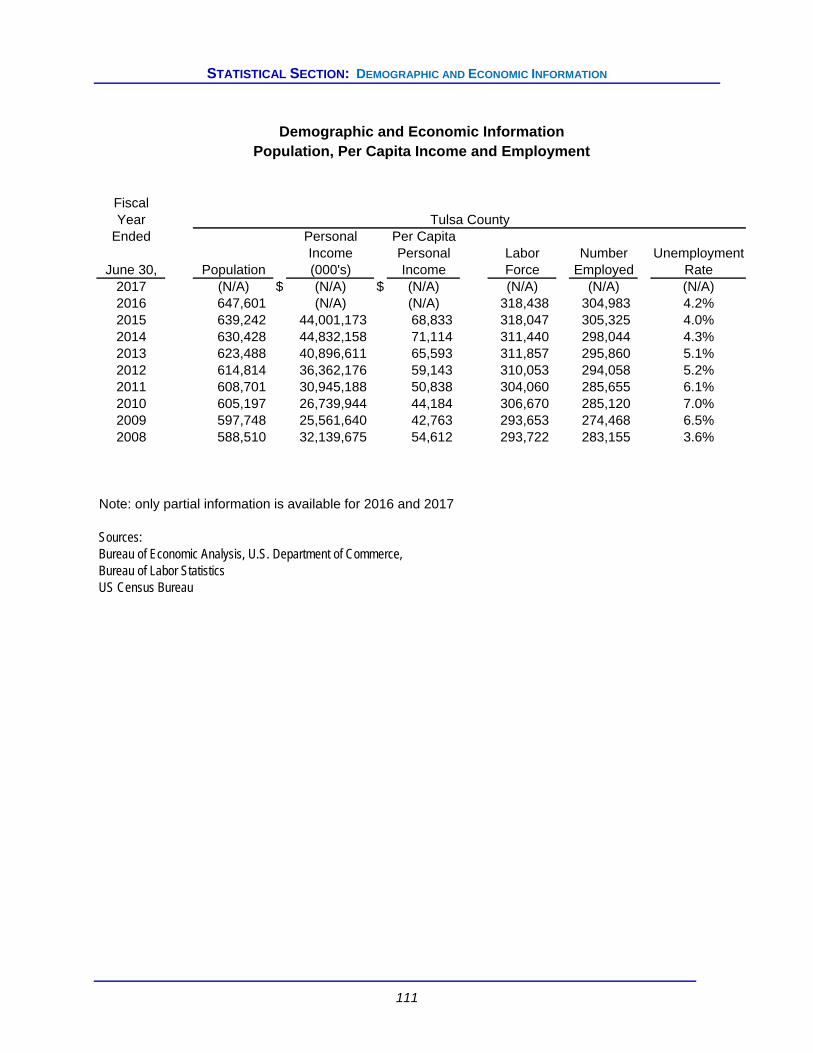
STATISTICAL SECTION: DEMOGRAPHIC AND ECONOMIC INFORMATION
111
Demographic and Economic Information
Population, Per Capita Income and Employment
FiscalYear Tulsa County
Ended Personal Per CapitaIncome Personal Labor Number Unemployment
June 30, Population (000's) Income Force Employed Rate2017 (N/A) $ (N/A) $ (N/A) (N/A) (N/A) (N/A)2016 647,601 (N/A) (N/A) 318,438 304,983 4.2%2015 639,242 44,001,173 68,833 318,047 305,325 4.0%2014 630,428 44,832,158 71,114 311,440 298,044 4.3%2013 623,488 40,896,611 65,593 311,857 295,860 5.1%2012 614,814 36,362,176 59,143 310,053 294,058 5.2%2011 608,701 30,945,188 50,838 304,060 285,655 6.1%2010 605,197 26,739,944 44,184 306,670 285,120 7.0%2009 597,748 25,561,640 42,763 293,653 274,468 6.5%2008 588,510 32,139,675 54,612 293,722 283,155 3.6%
Note: only partial information is available for 2016 and 2017
Sources:Bureau of Economic Analysis, U.S. Department of Commerce,Bureau of Labor StatisticsUS Census Bureau

STATISTICAL SECTION: OPERATING INFORMATION
112
Support Operation & Facility Total -
Services Administrative Instructional Maintenance Acquisition Net Current Average
Fiscal Student Support and School Central of Plant Child and Student Expenditures Daily
Year Instruction & Staff Services Leadership Services Facilities Nutrition Total Construction Transportation Other Per Pupil Membership
2016-17 $ 4,635 $ 1,265 142 545 603 997 695 8,882 1,139 370 340 10,732 37,932 2015-16 4,400 1,253 148 563 589 927 669 8,549 1,546 399 281 10,631 38,855 2014-15 4,319 1,157 161 544 851 955 678 8,665 1,367 390 189 10,467 39,497 2013-14 4,266 1,117 198 514 872 1,053 630 8,650 809 325 163 9,832 39,705 2012-13 4,231 1,172 253 436 410 966 633 8,101 1,010 421 269 9,588 39,596 2011-12 4,256 1,172 240 423 433 1,001 592 8,117 1,005 380 277 9,566 40,133 2010-11 4,424 1,229 222 427 434 897 576 8,209 1,944 304 264 10,580 40,540 2009-10 4,724 1,240 252 450 372 957 578 8,573 543 293 399 9,592 39,893 2008-09 4,466 1,140 166 425 400 1,007 527 8,131 818 362 295 9,469 40,632 2007-08 4,422 1,026 142 424 350 1,013 489 7,866 866 310 306 9,191 40,707
Source: District records.
Regular Education
Net Current Expenditures Per PupilLast Ten Fiscal Years
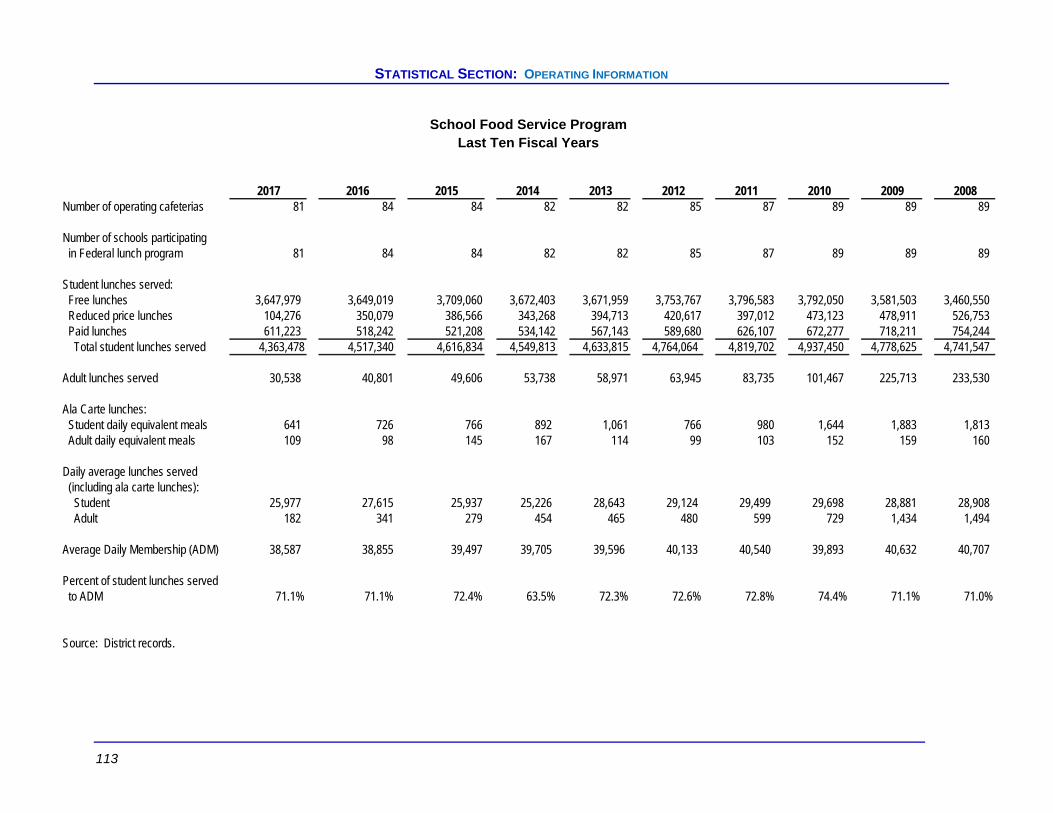
STATISTICAL SECTION: OPERATING INFORMATION
113
2017 2016 2015 2014 2013 2012 2011 2010 2009 2008Number of operating cafeterias 81 84 84 82 82 85 87 89 89 89
Number of schools participating in Federal lunch program 81 84 84 82 82 85 87 89 89 89
Student lunches served: Free lunches 3,647,979 3,649,019 3,709,060 3,672,403 3,671,959 3,753,767 3,796,583 3,792,050 3,581,503 3,460,550 Reduced price lunches 104,276 350,079 386,566 343,268 394,713 420,617 397,012 473,123 478,911 526,753 Paid lunches 611,223 518,242 521,208 534,142 567,143 589,680 626,107 672,277 718,211 754,244 Total student lunches served 4,363,478 4,517,340 4,616,834 4,549,813 4,633,815 4,764,064 4,819,702 4,937,450 4,778,625 4,741,547
Adult lunches served 30,538 40,801 49,606 53,738 58,971 63,945 83,735 101,467 225,713 233,530
Ala Carte lunches: Student daily equivalent meals 641 726 766 892 1,061 766 980 1,644 1,883 1,813 Adult daily equivalent meals 109 98 145 167 114 99 103 152 159 160
Daily average lunches served (including ala carte lunches): Student 25,977 27,615 25,937 25,226 28,643 29,124 29,499 29,698 28,881 28,908 Adult 182 341 279 454 465 480 599 729 1,434 1,494
Average Daily Membership (ADM) 38,587 38,855 39,497 39,705 39,596 40,133 40,540 39,893 40,632 40,707
Percent of student lunches served to ADM 71.1% 71.1% 72.4% 63.5% 72.3% 72.6% 72.8% 74.4% 71.1% 71.0%
Source: District records.
School Food Service ProgramLast Ten Fiscal Years
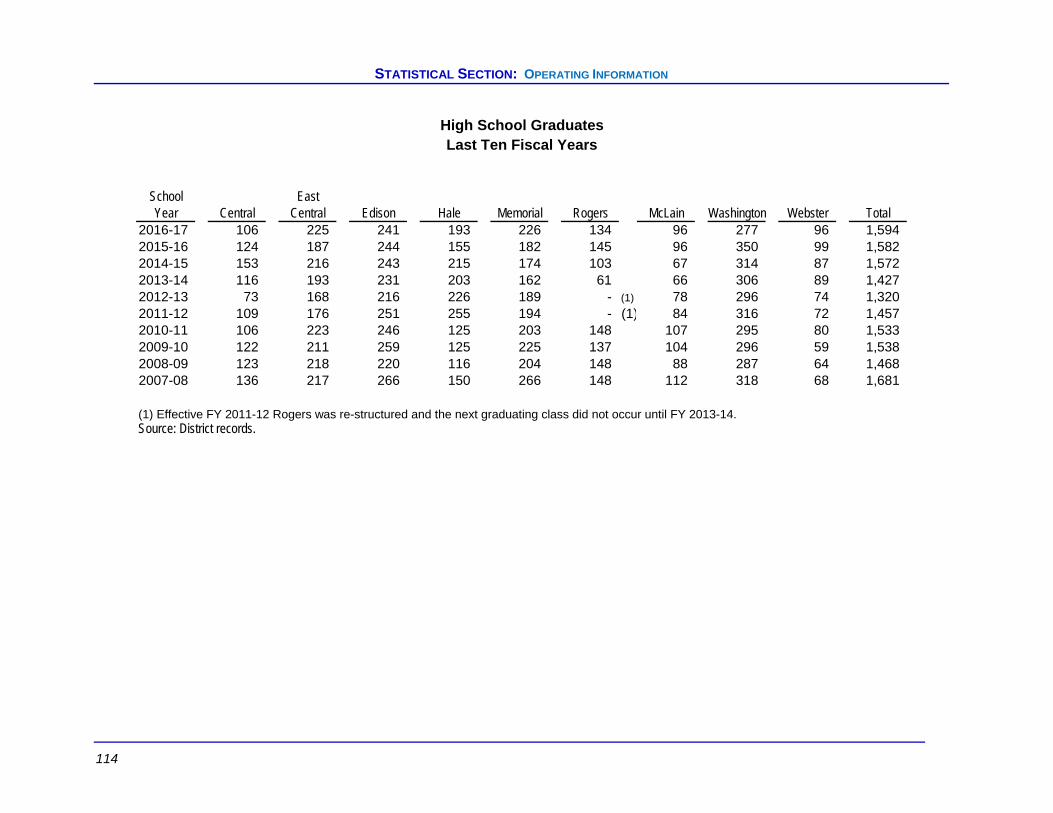
STATISTICAL SECTION: OPERATING INFORMATION
114
High School GraduatesLast Ten Fiscal Years
School EastYear Central Central Edison Hale Memorial Rogers McLain Washington Webster Total
2016-17 106 225 241 193 226 134 96 277 96 1,594 2015-16 124 187 244 155 182 145 96 350 99 1,582 2014-15 153 216 243 215 174 103 67 314 87 1,572 2013-14 116 193 231 203 162 61 66 306 89 1,427 2012-13 73 168 216 226 189 - (1) 78 296 74 1,320 2011-12 109 176 251 255 194 - (1) 84 316 72 1,457 2010-11 106 223 246 125 203 148 107 295 80 1,533 2009-10 122 211 259 125 225 137 104 296 59 1,538 2008-09 123 218 220 116 204 148 88 287 64 1,468 2007-08 136 217 266 150 266 148 112 318 68 1,681
(1) Effective FY 2011-12 Rogers was re-structured and the next graduating class did not occur until FY 2013-14.Source: District records.

STATISTICAL SECTION: OPERATING INFORMATION
115
Average Acquisition/ DepreciationPhysical Square Daily Capacity Construction Effective
School Building* Address Footage Membership* Capacity** Utilized Date(1) Date(2)
List of School Buildings: Square Footage, Capacity, AgeJune 30, 2017
Academy Central 1789 W. Seminole Street 53,377 291 546 51% 1973 1982Anderson 1921 E. 29th Street North 86,908 350 576 64% 1960 1972Bell 6304 E. Admiral Boulevard 136,955 540 849 68% 1952 1972Burroughs 1924 N. MLK Jr. Boulevard 58,836 305 467 72% 1925 1972Carnegie 4309 E. 56th Street 54,580 421 457 90% 1958 1972C. Clinton 1740 N. Harvard Avenue 82,118 640 720 90% 1953 1982Chouteau 4132 W. Cameron Street 84,183 355 619 59% 1958 1979Columbus 10620 E. 27th Street 50,366 365 513 73% 1971 1985Cooper 1808 S. 123rd East Avenue 81,545 738 901 91% 1966 1979Disney 11702 E. 25th Street 83,564 758 924 87% 1969 1982Dual Language Immersion 2703 N. Yorktown Place 44,065 257 355 72% 1955 1955ECDC Bunche 5402 N. MLK Jr. BLVD 69,709 708 355 44% 1958 1979ECDC Porter 1740 W. 41st Street 33,221 118 145 88% 1929 1929Eisenhower (@Nimitz) 3111 East 56th Street 101,868 579 641 84% 1961 1979Eliot 1442 E. 36th Street 47,504 366 480 81% 1928 1979Emerson 909 N. Boston Avenue 54,679 250 434 65% 1976 1979Eugene Field 2249 S. Phoenix Avenue 58,782 347 503 70% 2005 2006Gilcrease 5550 N. MLK Jr. Boulevard 129,845 403 615 70% 1964 1979Grimes 3213 E. 56th Street 40,550 247 388 69% 1966 1979Grissom 6646 S. 73rd East Avenue 54,062 325 434 81% 1969 1979Hamilton 2316 N. Norwood Place 120,896 535 750 66% 1957 1974Hawthorne 1105 E. 33rd Street North 59,151 307 559 56% 1952 1982Hoover 2327 S. Darlington Avenue 71,755 490 638 83% 1954 1979Jackson 2137 N. Pittsburg Avenue 55,974 338 523 61% 1959 1972Jones 1515 S. 71st East Avenue 46,702 381 457 92% 1962 1971Kendall Whittier 2601 E. 5th Place 125,520 924 1,210 78% 1998 1998Kerr 202 S. 117th East Avenue 62,015 563 687 84% 1964 1981Key 5702 S. Irvington Avenue 59,014 446 648 77% 1961 1979Lanier 1727 S. Harvard Avenue 46,657 329 375 88% 1925 1972Lee 1920 S. Cincinnati Avenue 48,271 407 490 81% 1918 1972Lewis & Clark 737 S. Garnett Road 105,666 635 704 85% 1971 1982Lindbergh 931 S. 89th East Avenue 61,862 472 536 88% 1957 1979MacArthur 2182 S. 73rd East Avenue 58,355 332 553 67% 1957 1979Mark Twain 541 S. 43rd West Avenue 57,462 437 513 89% 1999 2003Marshall 1142 E. 56th Street 67,118 313 684 58% 1953 1974Mayo 1127 South Columbia Avenue 60,008 415 424 100% 1926 1982McClure 1770 E. 61st Street 68,893 493 730 68% 1957 1979McKinley 6703 E. King Street 56,840 551 704 83% 1956 2000Mitchell 733 N. 73rd East Avenue 59,474 493 628 86% 1960 1979Owen 1132 N. Vandalia Avenue 62,459 499 628 78% 1952 1979Park 3205 W. 39th Street 39,172 216 342 57% 1972 1979Patrick Henry 3820 E. 41st Street 56,378 449 569 77% 1957 1974Peary 10818 E. 17th Street 45,657 369 467 77% 1968 1982Penn 2138 E. 48th Street North 53,079 312 457 70% 1959 1983Project Accept (Traice) 1202 West Newton Street 31,928 139 160 40% 1910 1910Remington 2524 W. 53rd Street 43,898 209 329 64% 1967 1974

STATISTICAL SECTION: OPERATING INFORMATION
116
Average Acquisition/ DepreciationPhysical Square Daily Capacity Construction Effective
School Building* Address Footage Membership* Capacity** Utilized Date(1) Date(2)
List of School Buildings: Square Footage, Capacity, AgeJune 30, 2017
Robertson 2721 W. 50th Street 51,052 351 467 74% 2003 2003Salk 7625 E. 58th Street 67,242 629 766 78% 1964 1979Sequoyah 724 N Birmingham Avenue 121,029 570 753 81% 1926 1974Skelly 2940 S. 90th East Avenue 157,774 878 1,263 71% 1966 1979Springdale 2510 E. Pine Street 54,924 527 615 88% 1925 1972Whitman 3924 N. Lansing Avenue 52,913 407 526 82% 1961 1980Wright 1110 E. 45th Place 99,534 327 629 57% 1959 1974Zarrow 3613 S. Hudson Avenue 52,831 476 470 95% 1959 1979Carver 624 E. Oklahoma Place 114,349 586 660 92% 1928 1972Clinton 2224 W. 41st Street 123,811 388 775 52% 2009 2010East Central JH 12121 E. 21st Street 127,548 691 920 80% 1967 1979Edison MS 2906 E. 41st Street 116,047 882 900 105% 1954 1979Hale JH 2177 S. 67th East Avenue 132,777 566 915 76% 1960 1974McLain 7th Grade Academy 525 E. 46th Street North 51,625 324 450 79% 1957 1974Memorial JH 7502 E. 57th Street 128,733 414 645 68% 1966 1982Monroe 2010 E. 48th Street North 98,155 272 595 47% 1958 1979Thoreau 7370 East 71st Street 123,110 648 675 95% 1973 1984Central JR/HS 3101 W. Edison Street 178,245 809 986 86% 1976 1988East Central 12150 E. 11th Street 276,721 1,092 1,254 84% 1966 1979Edison 2906 E. 41st Street 287,018 1,201 1,258 91% 1957 1979Hale 6960 E. 21st Street 251,413 1,069 1,296 83% 1959 1979McLain JR/HS 4929 N. Peoria Avenue 221,638 578 1,156 81% 1959 1988Memorial 5840 S. Hudson Avenue 221,899 1,004 1,326 76% 1962 1988Rogers JR/HS 3909 E. 5th Place 286,334 1,255 1,496 78% 1939 1972Washington 1514 E. Zion Street 259,805 1,287 1,400 94% 2001 2004Webster 1919 W. 40th Street 208,807 460 934 51% 1938 1972Street School (Franklin) 1135 S. Yale Avenue 40,635 96 210 44% 1927 1927Tulsa MET (Bryant) 6201 E. Virgin Street 57,850 155 290 33% 1929 1929Margaret Hudson 1136 S. Alleghany Avenue 18,565 44 90 57% 1999 1999Phoenix Rising (Sequoyah) 3441 E. Archer Street 50,432 49 420 13% 1928 1928Traice MS/HS (Lindsey) 2740 E. 41st Street North 45,075 483 215 61% 1957 1957
* Excluding programs at sites not owned by Independent School District No. I-1.** Capacity based on TPS management planned use of the building.(1) - Date of site acquisition or completion of building construction (fiscal year).(2) - Beginning date of 50 year depreciation of building (fiscal year).
Source: District records.

STATISTICAL SECTION: OPERATING INFORMATION
117
Number of Schools, Student Enrollment and Attendance Information
Last Ten Fiscal Years
Fiscal Average AverageYear Total Number of Schools Total Daily Daily
Ended Elementary Middle High Student Membership Attendance RatioJune 30, Schools Schools Schools Enrollment (ADM) (ADA) ADA to ADM
2017 54 12 9 38,628 37,932 35,082 92.49%2016 54 12 9 39,451 38,855 36,002 92.66%2015 54 12 9 39,999 39,497 36,416 92.20%2014 54 12 9 40,026 39,705 36,695 92.42%2013 54 12 9 40,252 39,596 36,630 92.51%2012 54 12 9 39,178 40,133 37,044 92.30%2011 59 15 9 39,957 40,540 37,433 92.33%2010 59 15 9 40,719 39,893 36,664 91.90%2009 59 15 9 40,242 40,632 37,546 92.41%2008 59 15 9 40,600 40,707 37,630 92.44%
Source: District records.

STATISTICAL SECTION: OPERATING INFORMATION
118
Function 2017 2016 2015 2014 2013 2012 2011 2010Instruction and instruction-related services 3,260 3,560 4,501 4,619 4,222 4,425 4,657 4,456 Support services - student and staff 623 727 575 589 716 642 540 563 Instructional and school leadership 396 404 257 211 212 204 232 218 Administrative support services 152 156 114 163 153 154 160 163 Operation of non-instructional services 615 611 587 453 586 529 562 456 Operation and maintenance of plant services 494 557 480 554 529 562 529 548 Student transportation services 343 337 290 251 289 329 276 258 Total Government Employees 5,883 6,352 6,804 6,840 6,707 6,845 6,956 6,662
Note: Information is not available prior to fiscal year 2009Source: District records.
at June 30,Number of Employees
Schedule of Government Employees by Function

Tulsa Public Schools Independent School District No. I-1, Tulsa County, Oklahoma
Single Audit Reports June 30, 2017

Contents Independent auditor’s report on:
Report on internal control over financial reporting and on compliance and other matters based on an audit of financial statements performed in accordance with Government Auditing Standards
1-2 Report on compliance for each major federal program and report on internal control over compliance and report on the schedule of expenditures of federal awards as required by Uniform Guidance.
3-4
Schedule of expenditures of federal awards 5-6 Notes to the schedule of expenditures of federal awards 7 Summary schedule of prior audit findings 8 Schedule of findings and questioned costs 9-12
1
Report on Internal Control Over Financial Reporting and on Compliance and Other Matters
Based on an Audit of Financial Statements Performed in Accordance with Government Auditing Standards
Independent Auditor's Report
To the Board of Education Tulsa Public Schools Tulsa, Oklahoma We have audited, in accordance with the auditing standards generally accepted in the United States of America and the standards applicable to financial audits contained in Government Auditing Standards issued by the Comptroller General of the United States, the financial statements of the governmental activities, each major fund, and the aggregate remaining fund information of Tulsa Public Schools (the District) as of and for the year ended June 30, 2017, and the related notes to the financial statements, which collectively comprise the District’s basic financial statements, and have issued our report thereon dated December 18, 2017. Internal Control over Financial Reporting In planning and performing our audit of the financial statements, we considered the District’s internal control over financial reporting (internal control) to determine the audit procedures that are appropriate in the circumstances for the purpose of expressing our opinion on the financial statements, but not for the purpose of expressing an opinion on the effectiveness of the District’s internal control over financial reporting. Accordingly, we do not express an opinion on the effectiveness of the District’s internal control over financial reporting. A deficiency in internal control exists when the design or operation of a control does not allow management or employees, in the normal course of performing their assigned functions, to prevent, or detect and correct, misstatements on a timely basis. A material weakness is a deficiency or a combination of deficiencies in internal control, such that there is a reasonable possibility that a material misstatement of the entity’s financial statements will not be prevented, or detected and corrected, on a timely basis. A significant deficiency is a deficiency or a combination of deficiencies in internal control that is less severe than a material weakness, yet important enough to merit attention by those charged with governance. Our consideration of internal control was for the limited purpose described in the first paragraph of this section and was not designed to identify all deficiencies in internal control that might be material weaknesses or significant deficiencies and therefore, material weaknesses or significant deficiencies may exist that were not identified. Given these limitations, during our audit we did not identify any deficiencies in internal control that we consider to be material weaknesses. We did identify a certain deficiency in internal control, described below as 2017-001 that we consider to be a significant deficiency.

2
Compliance and Other Matters As part of obtaining reasonable assurance about whether the District’s financial statements are free from material misstatement, we performed tests of its compliance with certain provisions of laws, regulations, contracts, and grant agreements, noncompliance with which could have a direct and material effect on the determination of financial statement amounts. However, providing an opinion on compliance with those provisions was not an objective of our audit, and accordingly, we do not express such an opinion. The results of our tests disclosed no instances of noncompliance or other matters that are required to be reported under Government Auditing Standards. District’s Response to the Finding The District’s response to the finding identified in our audit is described in the accompanying schedule of findings and questioned costs. The District’s response was not subjected to the auditing procedures applied in the audit of the financial statements and, accordingly, we express no opinion on the response. Purpose of this Report The purpose of this report is solely to describe the scope of our testing of internal control and compliance and the results of that testing, and not to provide an opinion on the effectiveness of the entity’s internal control or on compliance. This report is an integral part of an audit performed in accordance with Government Auditing Standards in considering the entity’s internal control and compliance. Accordingly, this communication is not suitable for any other purpose.
Oklahoma City, Oklahoma December 18, 2017

3
Report on Compliance for Each Major Federal Program; Report on Internal Control Over Compliance; and Report on
Schedule of Expenditures of Federal Awards Required by the Uniform Guidance
Independent Auditor's Report
To the Board of Education Tulsa Public Schools Tulsa, Oklahoma Report on Compliance for Each Major Federal Program We have audited Tulsa Public Schools’ (the District) compliance with the types of compliance requirements described in the OMB Compliance Supplement that could have a direct and material effect on each of the District’s major federal programs for the year ended June 30, 2017. The District’s major federal programs are identified in the summary of auditor’s results section of the accompanying schedule of findings and questioned costs. Management’s Responsibility Management is responsible for compliance with the requirements of laws, regulations, contracts, and grants applicable to its federal programs. Auditor’s Responsibility Our responsibility is to express an opinion on compliance for each of the District’s major federal programs based on our audit of the types of compliance requirements referred to above. We conducted our audit of compliance in accordance with auditing standards generally accepted in the United States of America; the standards applicable to financial audits contained in Government Auditing Standards issued by the Comptroller General of the United States; and the audit requirements of Title 2 U.S. Office Code of Federal Regulations (CFR) Part 200, Uniform Administrative Requirements, Cost Principles, and Audit Requirements for Federal Awards (Uniform Guidance). Those standards and Uniform Guidance require that we plan and perform the audit to obtain reasonable assurance about whether noncompliance with the types of compliance requirements referred to above that could have a direct and material effect on a major federal program occurred. An audit includes examining, on a test basis, evidence about the District’s compliance with those requirements and performing such other procedures as we considered necessary in the circumstances. We believe that our audit provides a reasonable basis for our opinion on compliance for each major federal program. However, our audit does not provide a legal determination of the District’s compliance. Opinion on Each Major Federal Program In our opinion, the District complied, in all material respects, with the types of compliance requirements referred to above that could have a direct and material effect on each of its major federal programs for the year ended June 30, 2017.
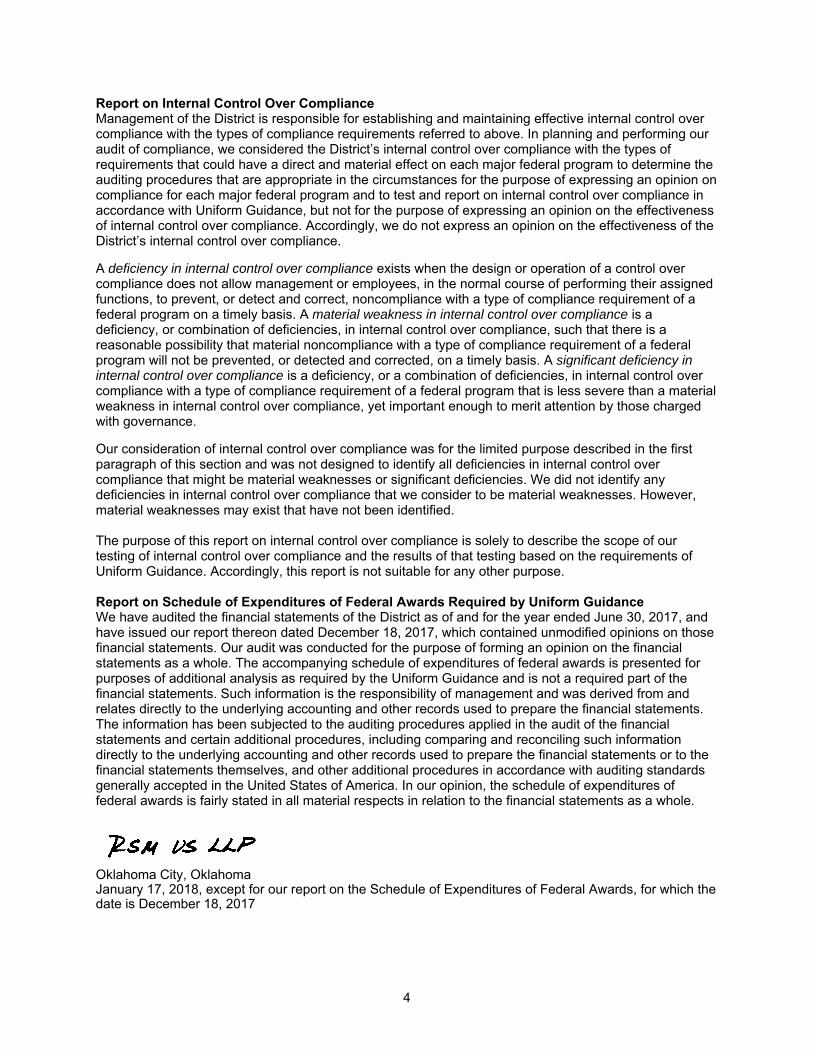
4
Report on Internal Control Over Compliance Management of the District is responsible for establishing and maintaining effective internal control over compliance with the types of compliance requirements referred to above. In planning and performing our audit of compliance, we considered the District’s internal control over compliance with the types of requirements that could have a direct and material effect on each major federal program to determine the auditing procedures that are appropriate in the circumstances for the purpose of expressing an opinion on compliance for each major federal program and to test and report on internal control over compliance in accordance with Uniform Guidance, but not for the purpose of expressing an opinion on the effectiveness of internal control over compliance. Accordingly, we do not express an opinion on the effectiveness of the District’s internal control over compliance. A deficiency in internal control over compliance exists when the design or operation of a control over compliance does not allow management or employees, in the normal course of performing their assigned functions, to prevent, or detect and correct, noncompliance with a type of compliance requirement of a federal program on a timely basis. A material weakness in internal control over compliance is a deficiency, or combination of deficiencies, in internal control over compliance, such that there is a reasonable possibility that material noncompliance with a type of compliance requirement of a federal program will not be prevented, or detected and corrected, on a timely basis. A significant deficiency in internal control over compliance is a deficiency, or a combination of deficiencies, in internal control over compliance with a type of compliance requirement of a federal program that is less severe than a material weakness in internal control over compliance, yet important enough to merit attention by those charged with governance. Our consideration of internal control over compliance was for the limited purpose described in the first paragraph of this section and was not designed to identify all deficiencies in internal control over compliance that might be material weaknesses or significant deficiencies. We did not identify any deficiencies in internal control over compliance that we consider to be material weaknesses. However, material weaknesses may exist that have not been identified. The purpose of this report on internal control over compliance is solely to describe the scope of our testing of internal control over compliance and the results of that testing based on the requirements of Uniform Guidance. Accordingly, this report is not suitable for any other purpose. Report on Schedule of Expenditures of Federal Awards Required by Uniform Guidance We have audited the financial statements of the District as of and for the year ended June 30, 2017, and have issued our report thereon dated December 18, 2017, which contained unmodified opinions on those financial statements. Our audit was conducted for the purpose of forming an opinion on the financial statements as a whole. The accompanying schedule of expenditures of federal awards is presented for purposes of additional analysis as required by the Uniform Guidance and is not a required part of the financial statements. Such information is the responsibility of management and was derived from and relates directly to the underlying accounting and other records used to prepare the financial statements. The information has been subjected to the auditing procedures applied in the audit of the financial statements and certain additional procedures, including comparing and reconciling such information directly to the underlying accounting and other records used to prepare the financial statements or to the financial statements themselves, and other additional procedures in accordance with auditing standards generally accepted in the United States of America. In our opinion, the schedule of expenditures of federal awards is fairly stated in all material respects in relation to the financial statements as a whole.
Oklahoma City, Oklahoma January 17, 2018, except for our report on the Schedule of Expenditures of Federal Awards, for which the date is December 18, 2017

5
Tulsa Public SchoolsIndependent School District No. I-1, Tulsa County
Schedule of Expenditures of Federal AwardsFor the Year Ended June 30, 2017
Pass-through Grantor's
Federal Grantor / Pass Through Project TotalGrantor / Program Title Number ExpendituresU.S. Department of AgriculturePassed Through Oklahoma Department of EducationChild Nutrition Cluster:
School Breakfast Program 10.553 764 5,582,780 $ National School Lunch Programs 10.555 763 12,368,213 Summer Food Services Program 10.559 766 654,774
Passed Through Oklahoma Department of Human ServicesNational School Lunch Program-Commodity 10.555 773 1,553,874
Total Child Nutrition Cluster 20,159,641
Fresh Fruit/Vegetable Program 10.582 768 773,896 Total U.S. Department of Agriculture 20,933,537
U.S. Department of the InteriorDirect ProgramsCreek Nation:
Johnson O'Malley 15.130 n/a 68,644 Johnson O'Malley C/O 15.130 n/a 21,035
Cherokee Nation:Johnson O'Malley 15.130 n/a 18,800
Total U.S. Department of the Interior 108,479
U.S. Department of EducationDirect ProgramsTitle VII Indian Education 84.060 n/a 659,940
The School Leadership Project 84.363 A n/a 852,394
Passed Through Oklahoma Department of EducationSpecial Education Cluster:
Special Ed Staff Development 84.027 613 1,237 IDEA-B Flowthrough 84.027 A 621 8,035,774 IDEA-B Early Intervening 84.027 A 623 438,138 IDEA-B Private Schools 84.027 A 625 4,144 IDEA-B High Cost Fund 84.027 A 626 60,000 IDEA-B Preschool 84.173 A 641 177,359
Total Special Education Cluster 8,716,652
NumberFederal CFDA
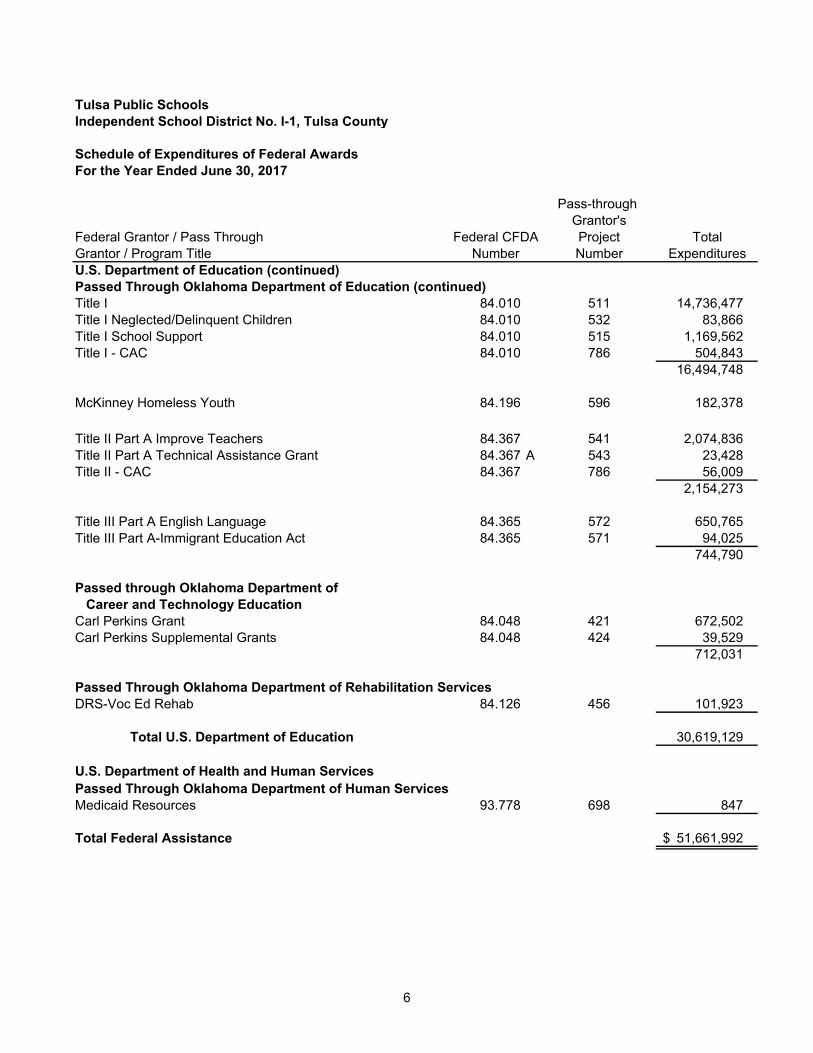
6
Tulsa Public SchoolsIndependent School District No. I-1, Tulsa County
Schedule of Expenditures of Federal AwardsFor the Year Ended June 30, 2017
Pass-through Grantor's
Federal Grantor / Pass Through Project TotalGrantor / Program Title Number ExpendituresU.S. Department of Education (continued)Passed Through Oklahoma Department of Education (continued)Title I 84.010 511 14,736,477 Title I Neglected/Delinquent Children 84.010 532 83,866 Title I School Support 84.010 515 1,169,562 Title I - CAC 84.010 786 504,843
16,494,748
McKinney Homeless Youth 84.196 596 182,378
Title II Part A Improve Teachers 84.367 541 2,074,836 Title II Part A Technical Assistance Grant 84.367 A 543 23,428 Title II - CAC 84.367 786 56,009
2,154,273
Title III Part A English Language 84.365 572 650,765 Title III Part A-Immigrant Education Act 84.365 571 94,025
744,790
Passed through Oklahoma Department of Career and Technology Education
Carl Perkins Grant 84.048 421 672,502 Carl Perkins Supplemental Grants 84.048 424 39,529
712,031
Passed Through Oklahoma Department of Rehabilitation ServicesDRS-Voc Ed Rehab 84.126 456 101,923
Total U.S. Department of Education 30,619,129
U.S. Department of Health and Human ServicesPassed Through Oklahoma Department of Human ServicesMedicaid Resources 93.778 698 847
Total Federal Assistance 51,661,992 $
Federal CFDANumber

Tulsa Public Schools Independent School District No. I-1, Tulsa County, Oklahoma Notes to Schedule of Expenditures of Federal Awards Year Ended June 30, 2017
7
Note 1. Basis of Presentation
The Schedule of Expenditures of Federal Awards (Schedule) includes the federal grant activity of the District for the year ended June 30, 2017 and is presented on the modified accrual basis of accounting. All federal awards received directly from federal agencies, as well as federal awards passed through other governmental agencies, and expended during the year are included in the Schedule. The information in this Schedule is presented in accordance with the requirements of the Uniform Guidance. Therefore, some amounts presented in this Schedule may differ from the amounts presented in or used in the preparation of the basic financial statements.
Note 2. Summary of Significant Accounting Policies
Expenditures are recognized following the modified accrual basis of accounting. Such expenditures are reported following the cost principles contained in Title 2 U.S. Code of Federal Regulations Part 200, Uniform Administrative Requirements, Cost Principles, and Audit Requirements for Federal Awards, wherein certain types of expenditures are not allowable or are limited as to reimbursement
Note 3. Indirect Cost Rate
The District has elected not to use the 10 percent de minimis indirect cost rate allowed under the Uniform Guidance.
Note 4. Noncash Assistance
The schedule includes federal awards in the form of noncash assistance (commodities) received during the year in the amount of $1,553,874 related to USDA Commodities grants (CFDA Number 10.555) provided by the U.S. Department of Agriculture and passed through the Oklahoma Department of Human Services.
Note 5. Subrecipients
For the year ended June 30, 2017, the District did not pass through any Federal funds to subrecipients.

8
Tulsa Public SchoolsIndependent School District No. 1
Summary Schedule of Prior Audit FindingsYear Ended June 30, 2017
Corrective Action Plan
Findings Status or Other Explanation
Findings Related to Financial Statements:
GAS Compliance Finding 2016-001
State statute 70-5-129 requires that activity fund receipts greater than $100 be deposited by the end of the next business day. An instance was identified wherein receipts in excess of $100 were not deposited by the end of the next business day.
Corrected N/A
Findings Related to Federal Awards:
None
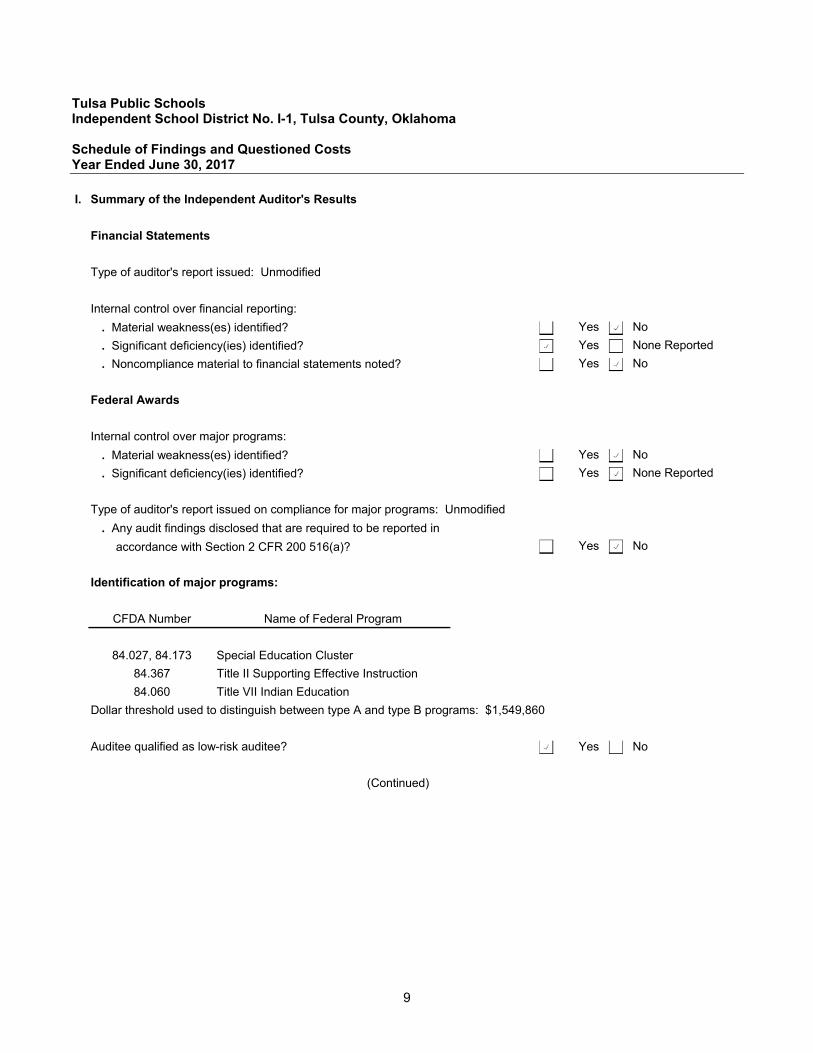
Tulsa Public Schools Independent School District No. I-1, Tulsa County, Oklahoma Schedule of Findings and Questioned Costs Year Ended June 30, 2017
9
I. Summary of the Independent Auditor's Results
Financial Statements
Type of auditor's report issued: Unmodified
Internal control over financial reporting:
. Material weakness(es) identified? Yes No
. Significant deficiency(ies) identified? Yes None Reported
. Noncompliance material to financial statements noted? Yes No
Federal Awards
Internal control over major programs:
. Material weakness(es) identified? Yes No
. Significant deficiency(ies) identified? Yes None Reported
Type of auditor's report issued on compliance for major programs: Unmodified
. Any audit findings disclosed that are required to be reported in
accordance with Section 2 CFR 200 516(a)? Yes No
Identification of major programs:
CFDA Number Name of Federal Program
84.027, 84.173 Special Education Cluster
84.367 Title II Supporting Effective Instruction
84.060 Title VII Indian Education
Dollar threshold used to distinguish between type A and type B programs: $1,549,860
Auditee qualified as low-risk auditee? Yes No
(Continued)
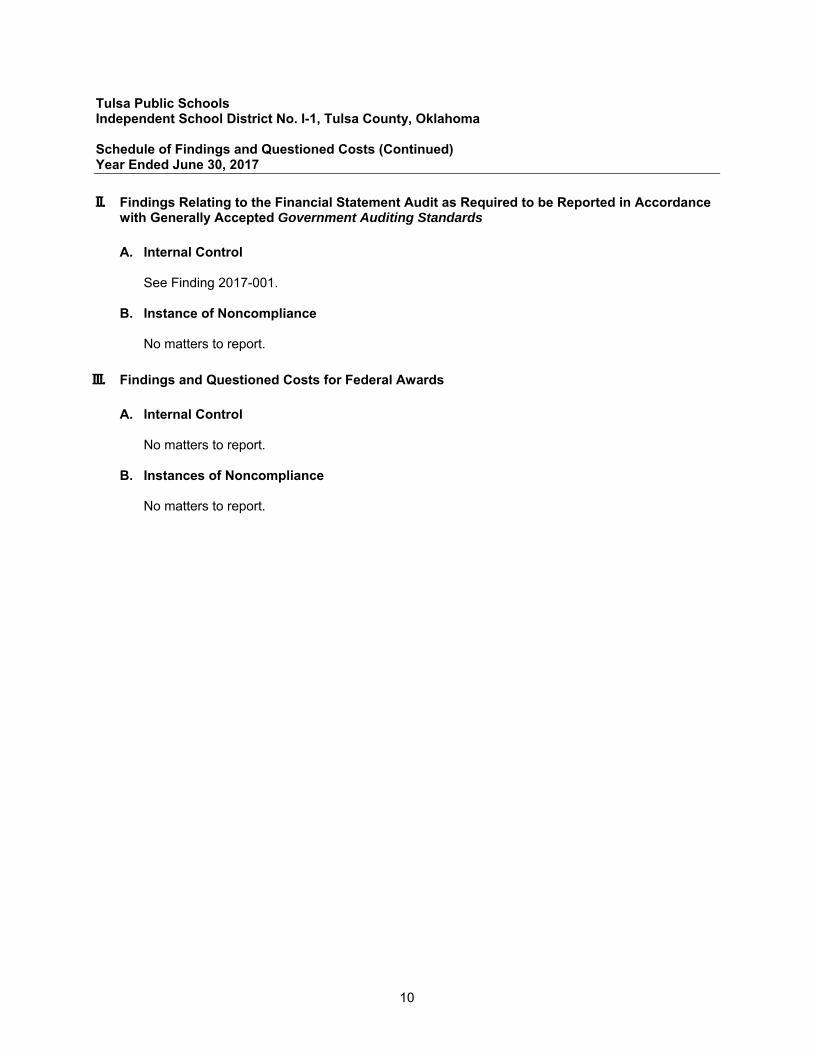
Tulsa Public Schools Independent School District No. I-1, Tulsa County, Oklahoma Schedule of Findings and Questioned Costs (Continued) Year Ended June 30, 2017
10
II. Findings Relating to the Financial Statement Audit as Required to be Reported in Accordance with Generally Accepted Government Auditing Standards
A. Internal Control
See Finding 2017-001.
B. Instance of Noncompliance
No matters to report.
III. Findings and Questioned Costs for Federal Awards
A. Internal Control
No matters to report.
B. Instances of Noncompliance
No matters to report.

Tulsa Public Schools Independent School District No. I-1, Tulsa County, Oklahoma Schedule of Findings and Questioned Costs (Continued) Year Ended June 30, 2017
11
Finding 2017-001 Finding: Internal control procedures were not designed to prevent or detect duplicate recordings of an unpaid invoice in accounts payable. Additionally, internal controls were not designed to prevent or detect the recording of a subsequent year invoice in the current year (in instances where the period of service was not noted on the invoice). Criteria: Internal controls should be established and maintained to prevent, or detect and correct material misstatements in the annual financial statements on a timely basis. Condition: During the audit, we identified misstatements related to accounts payable. Accounts payable was overstated in the financial statements as listed below:
Governmental Activities - $3.8 million General Fund - $0.4 million Capital Projects Fund - $3.3 million Nonmajor Governmental Funds - $0.1 million
Audit adjustments were recorded to properly report accounts payable as of June 30, 2017. Cause: Certain invoices, totaling approximately $2.5 million, were included in accounts payable twice. These invoices were posted to the accounts payable sub ledger through an IT system journal entry and then posted again through a manual journal entry. Additionally, other invoices, totaling approximately $1.3 million, were recorded through a manual journal entry as payables, however the related goods or services had not been delivered/performed prior to year-end. Effect: An adjusting journal entry was necessary to properly report accounts payable. Context: The preliminary and adjusted accounts payable balances are as follows: Preliminary Adjusted Governmental Activities $51.5 million $47.7 million General Fund $35.5 million $35.1 million Capital Projects Fund $15.1 million $11.8 million Nonmajor Governmental Funds $1 million $0.9 million Recommendation: We recommend that the District design and implement internal controls to prevent or detect duplicate recordings of an unpaid invoice in accounts payable. Additionally, we recommend that the District design and implement internal controls to prevent or detect the recording of a subsequent year invoice in the current year (in instances where the period of service was not noted on the invoice). Views of responsible officials and planned corrective actions The report of invoices paid after yearend has been modified to exclude those that were entered into the accounts payable system prior to yearend. A full listing of invoices included in the accrued liability account will be reviewed to ensure that none have been duplicated. Invoices received after yearend that do not clearly indicate the delivery date of those goods or services and are for a significant dollar amount will be researched to determine the actual date of receipt. The district will obtain construction progress billings that include work through the end of the year for all active projects. Additional review of the district’s current procedures for documenting the receipt date of goods or services will be conducted to determine where improvements can be made.

Tulsa Public Schools Independent School District No. I-1, Tulsa County, Oklahoma Schedule of Findings and Questioned Costs (Continued) Year Ended June 30, 2017
12
The Director of Accounting will document the final procedure for implementation. We anticipate that this will be completed by May, 2018.