Tule Wind Resource Area San Diego County, CaliforniaOverall mean bird use within the Tule WRA was...
122
2007- 2008 Avian Survey Tule Wind Resource Area San Diego County, California Prepared for Iberdrola Renewables, Inc. January 2009
Transcript of Tule Wind Resource Area San Diego County, CaliforniaOverall mean bird use within the Tule WRA was...

2007-2008 Avian Survey Tule Wind Resource Area
2007- 2008 Avian Survey Tule Wind Resource Area San Diego County, California
Prepared for
Iberdrola Renewables, Inc.
January 2009

2007-2008 Avian Survey Tule Wind Resource Area
EXECUTIVE SUMMARY Tetra Tech, EC, Inc. was contracted by Iberdrola Renewables, Inc. to undertake avian use surveys for the proposed Tule Wind Resource Area (WRA) in San Diego County, California. The studies were conducted to identify potential avian impacts associated with building and operating the wind conversion facility. Birds have been identified as a group potentially at risk because of collisions with wind turbines and power lines and displacement due to the presence of the associated structures. Biologists conducted surveys at the Tule WRA approximately every two weeks from September 13, 2007 to September 12, 2008. Thirty-minute fixed point count surveys (800-meter radius) were conducted at 16 points distributed throughout the Tule WRA. In this report, we discuss the overall results of the avian surveys (fall 2007 – summer 2008). For specific discussion of the seasonal results of the avian surveys, please see the corresponding seasonal report. However, data from all seasons are presented here for completeness. A total of 80 identified species and 12 unidentified species groups, consisting of 3,851 birds were observed within the Tule WRA. Overall mean bird use within the Tule WRA was 9.35 birds per 30 minutes (/30 min), ranging from zero to 143 birds/30 min point count. Comparing annual bird use rates at Tule in 2007-2008 with wind energy facilities throughout the country, not including previous studies at the Tule WRA, the Tule WRA ranked fourth out of 6 for raptor use, and sixth out of 6 for non-raptor use. Songbirds had the highest mean use out of all species groups observed (3.87 birds/30 min). The most common songbird, the house finch (0.44 birds/30 min) is a widespread species and has a relatively stable population (Hill 1993, Sauer et al. 2007). Thus, local mortality is not expected to have population-level consequences for the house finch. Turkey vultures and red-tailed hawks were the most commonly observed raptors in the Tule WRA. Mortalities of both species have occurred at existing wind farms (Kerns and Kerlinger 2004, Anderson et al. 2005, Kerlinger et al. 2005); however, the low mean use and the fact that both species have relatively stable populations (Sauer et al. 2007) make it unlikely that mortalities will have a population-level effect.
Listed and Sensitive Species The golden eagle, protected under the Bald and Golden Eagle Protection Act (BGEPA), was detected twice during surveys and once incidentally. Golden eagles are susceptible to mortality from wind turbines and have experienced mortality rates higher than expected from pre-construction avian use surveys with the old technology turbines at the Altamont Pass area of California. The BGEPA prohibits the killing or disturbance of any golden eagle or golden eagle nest. While only three golden eagles were detected in the WRA, its presence implies that suitable habitat exists in the WRA. No federally listed species were detected during surveys; however, the willow flycatcher, a species listed as threatened under the California Endangered Species Act was observed twice incidentally. The southwestern willow flycatcher, a federally endangered sub-species of willow flycatcher is known to occur in the area of the Tule WRA. Willow flycatchers breed in riparian vegetation and it is unlikely that this habitat will be disturbed during project development.
January 2009 ES-1

2007-2008 Avian Survey Tule Wind Resource Area
An additional 5 species observed are described as California Department of Fish and Game “Species of Special Concern” (SSC) when nesting. “…This designation is intended to result in special consideration for these animals by the department, land managers, consulting biologists, and others, and is intended to focus attention on the species to help avert the need for costly listing under federal and state endangered species laws and cumbersome recovery efforts that might ultimately be required.” California SSC that occurred during point count and incidental surveys were loggerhead shrike (1 point count; 5 incidental), northern harrier (3 point count; 8 incidental), Vaux’s swift (135 point count; 28 incidental), yellow warbler (1 point count), and olive-sided flycatcher (1 incidental). Loggerhead shrike, northern harrier, and Vaux’s swift were all seen in the fall or winter, and yellow warbler and olive-sided flycatcher were seen in the summer. However, they were seen only once each and thus are unlikely to be breeding in the area. Although 135 Vaux’s swifts were observed within the WRA, overall mean use was only 0.33 birds/30 min. There is a potential for mortality as more than half of the birds flew within the rotor swept area. The Vaux’s swift does not breed in southern California and although they are fairly common throughout California during spring and fall migrations, their occurrence is unpredictable. Thus, while some local mortality could occur, population level consequences are not expected for Vaux’s swifts that might collide with turbines at the Tule WRA. The following table summarizes potential impacts to avian species at the Tule WRA based on overall avian use, the presence of state or federally listed species, and habitat attractants (Table ES-1).
January 2009 ES-2

2007-2008 Avian Survey Tule Wind Resource Area
Table ES-1. Project Impact Summary
Result Details Raptors
Mean use Moderate Mean use without turkey vultures Low Mean use within the rotor swept area (RSA) Moderate Number of species with high encounter rates (>1.0 birds/30 min) None
Eagles observed in WRA Yes See Section 4.4 Eagles observed nesting in WRA No Federally listed1 species observed within WRA No Federally listed species observed nesting No Federally listed species within RSA No State-listed species2 within WRA Yes See Section 4.4 State-listed species observed nesting within WRA No State-listed species within RSA No
Non-raptors Mean use Low Mean use within RSA Low Number of species with high encounter rates (>1.0 birds/30 min) None
Federally listed species observed within the WRA No* See Section 4.4 Federally listed species within RSA No State-listed species within WRA Yes See Section 4.4 State-listed species observed nesting within the WRA No
Habitat Native habitat likely to be affected by development Yes Mixed chaparral Lakes (waterfowl attractant) No Wetlands (attractant for cranes, waterfowl, and other water-based species) No
Cliffs (raptor nesting and traveling) Yes River (permanent water source, migration corridor) No Known refuges or habitat features that may funnel migrants No
1 Federally listed species include threatened, endangered, or candidate species designations (USFWS 2008)
2 State-listed species include threatened, endangered, candidate, and species of concern designations. State species listed are those in addition to federally listed species (CDFG 2008).
January 2009 ES-3

2007-2008 Avian Survey Tule Wind Resource Area
TABLE OF CONTENTS
EXECUTIVE SUMMARY...............................................................................................ES-1
ABBREVIATIONS AND ACRONYMS............................................................................... iv
1.0 INTRODUCTION ......................................................................................................... 1
2.0 METHODS .................................................................................................................... 2
2.1 DIURNAL FIXED-POINT AND INCIDENTAL AVIAN USE SURVEYS....... 2 Fixed-point Surveys............................................................................................... 2 Incidental Observations ......................................................................................... 3 Data Quality Assurance/Quality Control............................................................... 3
2.2 ANALYSIS ........................................................................................................... 4 Species Groupings ................................................................................................. 4 Avian Use .............................................................................................................. 4 Flight Behavior...................................................................................................... 4 Encounter Rate ...................................................................................................... 4 Mortality Estimates ............................................................................................... 5
2.3 RAPTOR NEST SURVEYS ................................................................................. 5
3.0 RESULTS ...................................................................................................................... 5
3.1 TULE WRA........................................................................................................... 5 3.2 SPECIES COMPOSITION ................................................................................... 6 3.3 AVIAN USE.......................................................................................................... 6 3.4 FREQUENCY OF OCCURRENCE ..................................................................... 8
Flight Height and Encounter Rate ......................................................................... 8 3 MW Turbines (60-150 meter RSA).................................................................... 9 1.5 MW Turbines (41.5-118.5 meter RSA)........................................................... 9
3.5 INCIDENTAL OBSERVATIONS ....................................................................... 9 3.6 RAPTOR NEST SURVEYS ................................................................................. 9
4.0 DISCUSSION.............................................................................................................. 10
4.1 RAPTOR USE AND ENCOUNTER RATE ...................................................... 10 4.2 NON-RAPTOR USE AND ENCOUNTER RATE ............................................ 11 4.3 COMPARISON OF 2007-2008 DATA TO 2005-2006 DATA.......................... 12 4.4 LISTED AND SENSITIVE SPECIES................................................................ 13 4.5 TULE PROJECT AREA CONCLUSIONS ........................................................ 14
5.0 REFERENCES ............................................................................................................ 14
January 2009 i
2007-2008 Avian Survey Tule Wind Resource Area
TABLE OF CONTENTS (Continued)
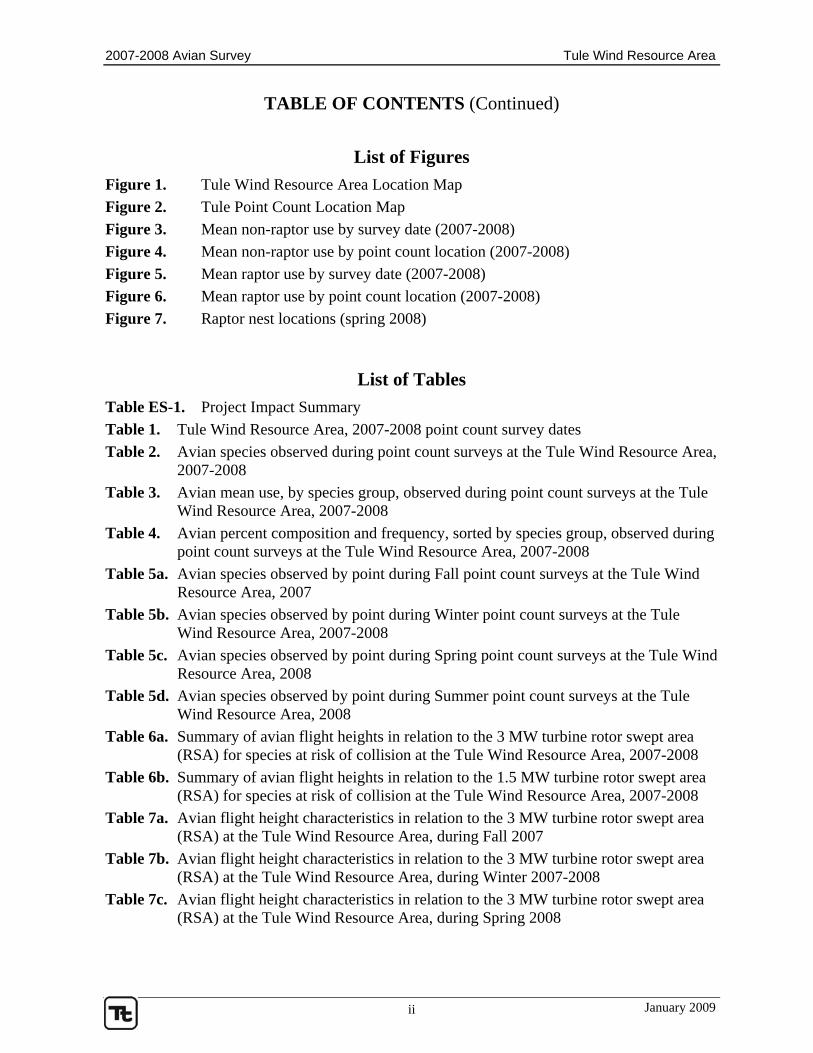
List of Figures Figure 1. Tule Wind Resource Area Location Map Figure 2. Tule Point Count Location Map Figure 3. Mean non-raptor use by survey date (2007-2008) Figure 4. Mean non-raptor use by point count location (2007-2008) Figure 5. Mean raptor use by survey date (2007-2008) Figure 6. Mean raptor use by point count location (2007-2008) Figure 7. Raptor nest locations (spring 2008)
List of Tables Table ES-1. Project Impact Summary Table 1. Tule Wind Resource Area, 2007-2008 point count survey dates Table 2. Avian species observed during point count surveys at the Tule Wind Resource Area,
2007-2008 Table 3. Avian mean use, by species group, observed during point count surveys at the Tule
Wind Resource Area, 2007-2008 Table 4. Avian percent composition and frequency, sorted by species group, observed during
point count surveys at the Tule Wind Resource Area, 2007-2008 Table 5a. Avian species observed by point during Fall point count surveys at the Tule Wind
Resource Area, 2007 Table 5b. Avian species observed by point during Winter point count surveys at the Tule
Wind Resource Area, 2007-2008 Table 5c. Avian species observed by point during Spring point count surveys at the Tule Wind
Resource Area, 2008 Table 5d. Avian species observed by point during Summer point count surveys at the Tule
Wind Resource Area, 2008 Table 6a. Summary of avian flight heights in relation to the 3 MW turbine rotor swept area
(RSA) for species at risk of collision at the Tule Wind Resource Area, 2007-2008 Table 6b. Summary of avian flight heights in relation to the 1.5 MW turbine rotor swept area
(RSA) for species at risk of collision at the Tule Wind Resource Area, 2007-2008 Table 7a. Avian flight height characteristics in relation to the 3 MW turbine rotor swept area
(RSA) at the Tule Wind Resource Area, during Fall 2007 Table 7b. Avian flight height characteristics in relation to the 3 MW turbine rotor swept area
(RSA) at the Tule Wind Resource Area, during Winter 2007-2008 Table 7c. Avian flight height characteristics in relation to the 3 MW turbine rotor swept area
(RSA) at the Tule Wind Resource Area, during Spring 2008
January 2009 ii

2007-2008 Avian Survey Tule Wind Resource Area
TABLE OF CONTENTS (Continued)
Table 7d. Avian flight height characteristics in relation to the 3 MW turbine rotor swept area (RSA) at the Tule Wind Resource Area, during Summer 2008
Table 7e. Avian flight height characteristics in relation to the 1.5 MW turbine rotor swept area (RSA) at the Tule Wind Resource Area, during Fall 2007
Table 7f. Avian flight height characteristics in relation to the 1.5 MW turbine rotor swept area (RSA) at the Tule Wind Resource Area, during Winter 2007-2008
Table 7g. Avian flight height characteristics in relation to the 1.5 MW turbine rotor swept area (RSA) at the Tule Wind Resource Area, during Spring 2008
Table 7h. Avian flight height characteristics in relation to the 1.5 MW turbine rotor swept area (RSA) at the Tule Wind Resource Area, during Summer 2008
Table 7i. Avian flight height characteristics in relation to the 3 MW turbine rotor swept area (RSA) at the Tule Wind Resource Area, during 2007-2008
Table 7j. Avian flight height characteristics in relation to the 1.5 MW turbine rotor swept area (RSA) at the Tule Wind Resource Area, during 2007-2008
Table 8. Incidental observations of birds during point counts at the Tule Wind Resource Area, 2007-2008
Table 9. Comparison of raptor and other bird use per 30-minute survey with other studies of wind projects using the similar survey methodology
Appendices
Appendix A. Flight directions of birds observed during summer point count surveys at the Tule Wind Resource Area, 2008
Appendix B. Raptor nest details for the Tule Wind Resource Area, spring 2008
January 2009 iii
2007-2008 Avian Survey Tule Wind Resource Area
ABBREVIATIONS AND ACRONYMS
BLM U.S. Bureau of Land Management
CDFG California Department of Fish and Game
MW megawatt
obs/30 min observations per 30 minutes
/30 min per 30 minutes
PIF Partners in Flight
RSA rotor swept area
SSC Species of Special Concern
TtEC Tetra Tech EC, Inc.
WRA Wind Resource Area
January 2009 iv

2007-2008 Avian Survey Tule Wind Resource Area
1.0 INTRODUCTION Iberdrola Renewables, Inc. (Iberdrola) is planning to develop a wind energy conversion facility in San Diego County, California. The Tule Wind Resource Area (WRA) is primarily located on public land administered by the U.S. Bureau of Land Management (BLM), about 50 miles east of the city of San Diego and 2 miles north of the town of Boulevard (Figure 1). Iberdrola is committed to environmental due diligence and contracted Tetra Tech EC, Inc. (TtEC) to conduct avian surveys at the Tule WRA. Surveys were conducted approximately every two weeks from September 13, 2007 to September 12, 2008 to quantify local avian use in the area and to identify potential avian impacts associated with building and/or operating the proposed facility. In addition to the avian surveys discussed in this report, TtEC conducted avian surveys at the Tule WRA from March 2005 – March 2006 (TtEC 2007). The Tule WRA covers approximately 12,000 acres and is located west of the Anza Borrego Desert State Park. The Tule WRA is located in the Sonoran Basin and Range ecoregion, and is characterized by chaparral habitats. The area contains the In-Ko-Pah Mountains, which have few dramatic peaks but are characterized by broad rolling upland areas strewn with numerous large granite rock formations. The mountains are oriented generally northwest to southeast, and rise gradually above the McCain Valley in the west and drop off into the Carrizo Canyon in the east. Some trees are present, and are generally associated with houses and campgrounds. The area is managed to provide for a variety of uses, including recreation, wildlife conservation, cattle grazing, and protection of archaeological resources (BLM 2007). Wind energy provides a clean, renewable energy source that is in high demand. As wind power has become more common, the need to address potential environmental impacts has increased. Birds have been identified as a group potentially at risk because of collisions with wind turbines and power lines and displacement due to the presence of the associated structures (Erickson et al. 2005, Drewitt and Langston 2006, Arnett et al. 2007). Specifically, raptors and migrant passerines (i.e., songbirds) were found more often in post-construction mortality monitoring compared to other groups of birds (Erickson et al. 2001, 2005, Drewitt and Langston 2006, Johnson et al. 2007, Strickland and Morrison 2008). The possible impacts to avian species from the construction and operation of the Tule wind farm are direct morality and injury from collisions with wind turbines and guy wires, temporary or permanent habitat loss, and displacement of birds from habitats near turbines (Drewitt and Langston 2006). Historically, raptor mortality has received the most attention. Raptor mortality at newer generation wind projects has been low relative to previous generation wind farms (Erickson et al. 2002). A number of mortality monitoring studies at newer generation wind projects have found fewer than five individual raptor mortalities (e.g., Johnson et al. 2002, Erickson et al. 2003, Kerns and Kerlinger 2004, Jain et al. 2007), but one study at the Stateline Wind Project in Oregon and Washington found as many as 17 dead raptors within a 2.5-year monitoring period (Erickson et al. 2004); however, the Stateline project has 454 turbines. Although raptor mortality is reduced, mortality may not be eliminated by advances in turbine technology and local micro-siting, and site evaluation efforts are still necessary. At newer generation wind energy facilities outside of California, approximately 80 percent of documented mortalities have been passerines (i.e., songbirds); of which 50 percent were night migrants (Erickson et al. 2002). It is estimated that less than 0.01 percent of migrant songbirds that pass over wind farms are killed, based on radar data and mortality monitoring at wind
January 2009 1

San Diego County
Riverside County
Imperial County
San Diego
Indio--Cathedral City--Palm Springs
Temecula--Murrieta
RamonaRamona
MeccaMecca
ThermalThermal
One Hundred PalmsOne Hundred Palms
Hemet
8
10
805
5
8
2
79
22
78
74
76
86
94
371
6
67
3
111
52
905
243
54
125
195
7
117
98
188
371
94
54
78
22
78
67
94
76
125
79
79
76
78
94
86
94
67
78
2
371
67
371
6
22
22
111
76
74
3
86
78
76
94
94
22
94
74
9494
78
79
227
195
79
78
3
86
125
94
94
79
86
8679
74
67
6
111
2
2
94
74
6
111
371
2
2
94
79
371
94
188 94
22
78
86
86
79
78
79
6
94
195
54
94
7
6
79
371
74
54
111
78 78
76
371
86
2
7979
78
94
67
22
74
6
67
905
Anza-Borrego Desert State ParkAnza-Borrego Desert State Park
Cuyamaca Rancho State ParkCuyamaca Rancho State Park
Daley RanchDaley Ranch
Lake Skinner Recreation AreaLake Skinner Recreation Area
Lake Morena Co ParkLake Morena Co Park
Salton Sea
Coyote Lake
San Felipe Creek
Carrizo Creek
Vallecito Creek
San Luis Rey River
San Diego River
Bautista Creek
Pine Valley Creek
Coachella Canal
Otay Riv er
Arroyo Salada
La Posta
Cre
ek
Palm W ash
Sweetwater River
S anta Ysabel Creek
Chihuahua Cr eek
Palm Canyon W ash
Cot
tonw
ood
Creek
Escon did
o Creek
San
Die
go R
iver
Sweetwater River
Cottonwood Creek
Mexico
1:400,000
Figure 1. TuleWind Resource Area Location Map
San Diego County, CaliforniaJuly 18, 2008
NAD 83 UTM 11
0 5 102.5
Miles
Fresno
PhoenixAnaheim
Las Vegas
RiversideSanta Ana
San Diego
Long Beach
C AA Z
N V
U T
Mexico
TETR
A TE
CH
EC
,INC
Project Area
Project Area
County Boundary
Water Body
Stream
Intermittent Stream
TransportationInterstate
Highway
Major Road
P:\GIS_PROJECTS\Iberdrola_Renewables\Tule\maps\Avian_Survey\2008_Survey_Reports\Tule_Figure1_WRA_Location_Map_081808.mxd - Last Accessed: 11/5/2008 - Map Scale is correct when printed at: Portrait ANSI B (11 x 17 inches)
2007-2008 Avian Survey Tule Wind Resource Area
farms in Oregon, Washington, and Minnesota (Erickson 2007). Resident species may have lower mortality than migrants because many songbirds do not fly within the rotor swept area (RSA). However, some resident species have behaviors that increase the risk of collisions with turbines because they fly within the RSA. In addition to mortality associated with wind farms, concerns have been raised that some species may avoid areas near turbines after the wind farm is in operation (Drewitt and Langston 2006). For example, at the Buffalo Ridge wind energy facility in Minnesota, densities of male songbirds were significantly lower in Conservation Reserve Program grasslands containing turbines than in Conservation Reserve Program grasslands without turbines. It was suggested that the reduced density may be due to avoidance of turbine noise and maintenance activities, and reduced habitat quality due to the presence of access roads and large gravel pads surrounding the turbines (Leddy et al. 1999). Reduced abundance of grassland songbirds was found within 50 meters of a turbine pad for a wind farm in Washington and Oregon, but the investigators attributed displacement to the direct loss of habitat or reduced habitat quality and not the presence of the turbines (WEST and NWC 2004). California has 634 documented bird species and is situated within the Pacific Flyway, one of the main bird migratory routes (USFWS 2008a). The Pacific Flyway runs through the western portion of the United States and subsequently, the Tule WRA. Most birds that move along the Pacific Flyway travel from the western Arctic, including Alaska and the Aleutian Islands and the Rocky Mountain and Pacific coast regions of Canada, through the United States and Mexico, and south to where the Pacific Flyway merges with other flyways in Central and South America (BNC 2004).
2.0 METHODS To evaluate avian risk at wind energy facilities, standardized protocols for pre-construction point counts have been established and were used here. Data collected from these counts can then be used to identify species or species groups of concern and may provide additional information for micro-siting to minimize impacts to birds. To facilitate identifying species at risk, results in this report are presented in terms of species groupings, and highlight federally listed species, state-listed species, and species of concern.
2.1 Diurnal Fixed-point and Incidental Avian Use Surveys
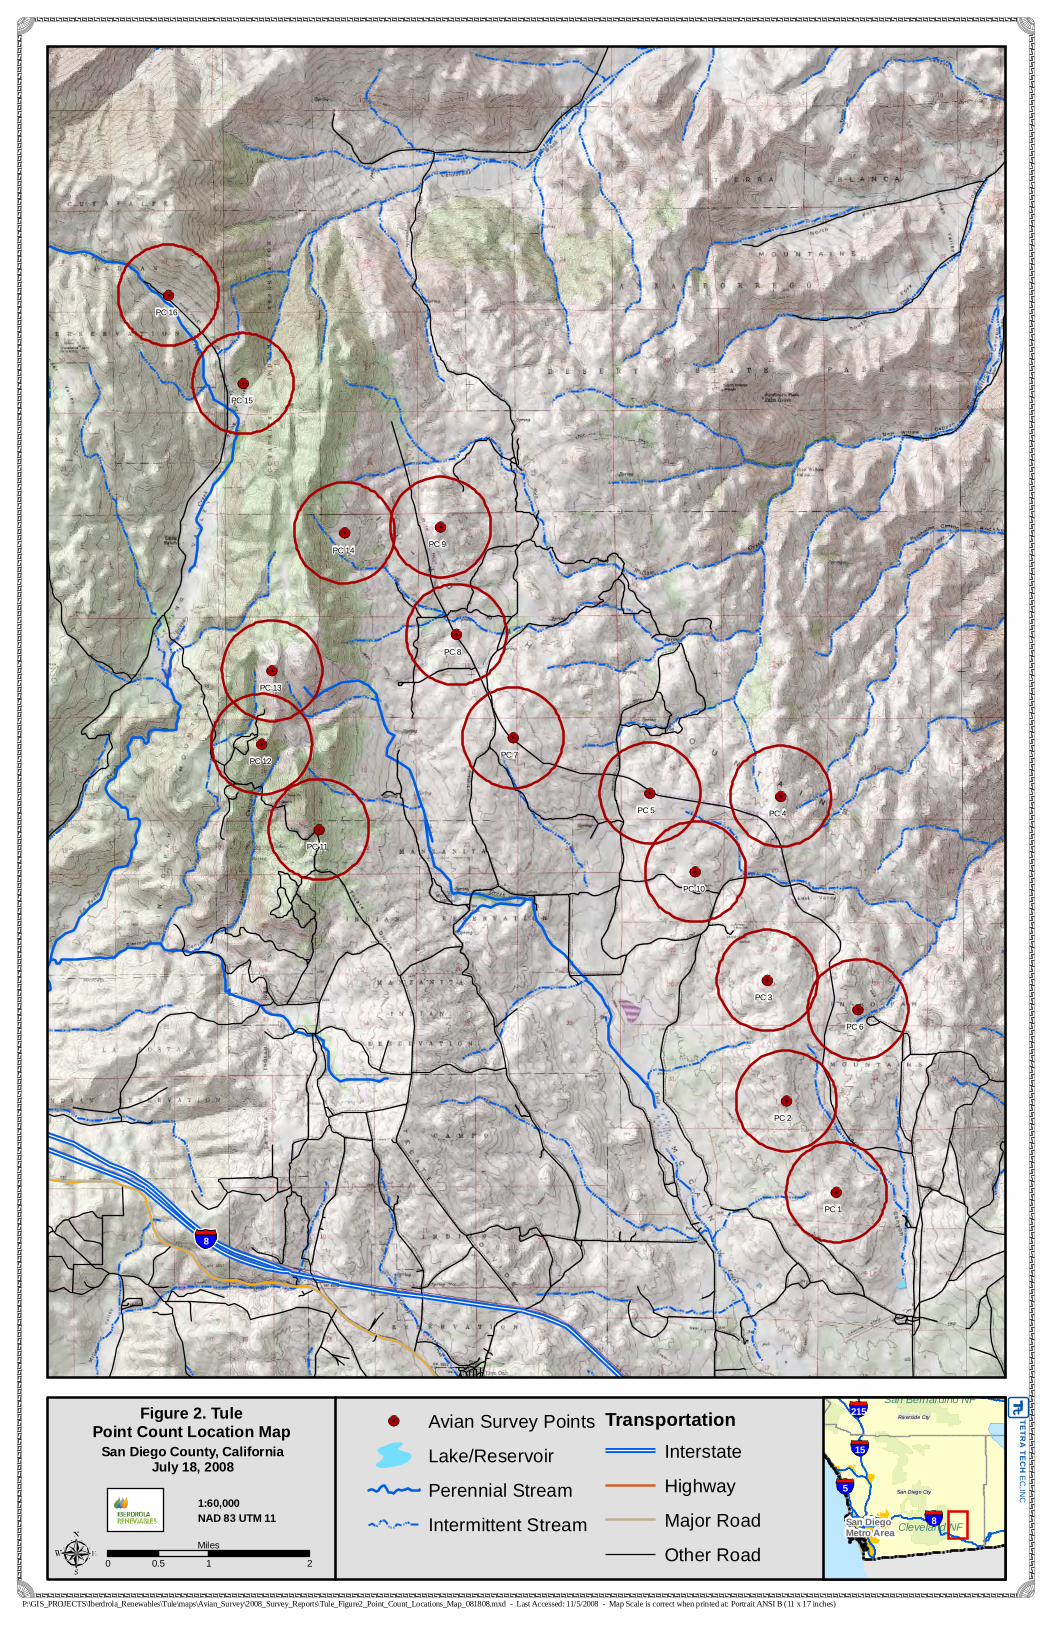
Fixed-point Surveys Experienced field biologists conducted 30-minute point count surveys at 16 locations within the Tule WRA to evaluate avian use, behavior, and species composition (Figure 2). Biologists conducted surveys approximately every two weeks from September 13, 2007 to September 12, 2008 (Table 1). TtEC distributed the survey locations throughout the WRA and chose locations that maximized the 360-degree sight distance for the observer and covered a diversity of habitats. Experienced field ornithologists collected data on all birds observed within an 800-meter radius circle centered on the point count location. The biologists also recorded incidental observations, such as birds detected outside the 800-meter radius or while moving between point count locations. Surveys at each point lasted for 30 minutes, during which time biologists continuously scanned for birds and recorded any visual or auditory observations. Biologists
January 2009 2
PC 9
PC 8
PC 7
PC 6
PC 5 PC 4
PC 3
PC 2
PC 1
PC 16
PC 15
PC 14
PC 13
PC 12
PC 11
PC 10
8
1:60,000
Figure 2. TulePoint Count Location Map
San Diego County, CaliforniaJuly 18, 2008
NAD 83 UTM 11
0 1 20.5
Miles
San Diego Metro Area
San Diego Cty
Riverside Cty
8
15
5
215
Cleveland NF
San Bernardino NF
TETR
A TE
CH
EC
,INC
Avian Survey Points
Lake/Reservoir
Perennial Stream
Intermittent Stream
TransportationInterstate
Highway
Major Road
Other Road
P:\GIS_PROJECTS\Iberdrola_Renewables\Tule\maps\Avian_Survey\2008_Survey_Reports\Tule_Figure2_Point_Count_Locations_Map_081808.mxd - Last Accessed: 11/5/2008 - Map Scale is correct when printed at: Portrait ANSI B (11 x 17 inches)

2007-2008 Avian Survey Tule Wind Resource Area
scheduled point counts to cover all daylight hours and to ensure that each point was visited during different times of day to ensure species coverage. Biologists collected the following data: species, number of individuals, time, height above ground, behavior, and flight direction. The biologists also estimated flight heights and distances using existing meteorological towers, local transmission lines, and topographic maps for reference. Flight direction data are included in Appendix A. The survey protocol used in this study is designed to collect data on all bird species and to provide results that are comparable with other studies of avian use at wind farms rather than to target specific taxa. The benefit of using this method is that it estimates avian use throughout the day and captures activity by a variety of bird species. During the breeding season, songbirds are most active in the morning and can be difficult to detect during the afternoon. In contrast, raptors become active as the sunlight heats the air and creates thermals, which individuals use for soaring (Ballam 1984). Thus, raptors are more readily detected several hours after sunrise. Therefore, the survey method used in this study is appropriate for the bird community using the WRA. TtEC chose 30-minute survey periods because they provide adequate time to detect both raptors and non-raptors. However, time periods of 30 minutes may lead to double- counting of songbirds (i.e., counting the same individual more than once) because individuals may appear and disappear from view. For example, if a scrub jay is detected perched on a fence then disappears from view and, 6 minutes later, a scrub jay is seen flying, these birds are recorded as separate observations because it is not possible to distinguish individuals. Double-counting of birds is not problematic for this type of survey because the objective is to document use in terms of number of birds noted per 30-minute survey, not number of distinct individual birds. Detectability varies among species and potentially not all individuals within the 800-meter survey were counted. This variation in detectability results in an overestimate of mean use in conspicuous species and an underestimate of mean use in reclusive species (Thompson 2002). Birds not easily identifiable, such as those seen under low light conditions or small birds seen at a distance, were identified to the lowest taxonomic level possible. Hence, unidentified birds are presented in the results.
Incidental Observations Incidental observations included observations that occurred 1) during travel between points, 2) before or after the official 30-minute survey period, and 3) outside the 800-meter radius circular plot. Biologists recorded these observations on separate data sheets and these data were not used in the formal analysis; however, a summary of incidental birds is presented to provide additional information about species found in the local area.
Data Quality Assurance/Quality Control TtEC implemented quality assurance and quality control measures during all stages of data collection, analysis, and report preparation. To ensure legibility and completeness of data sheets, each biologist reviewed, and clarified if needed, all data sheets before data entry into a Filemaker™ relational database for data storage and analysis. Prior to analysis, an independent reviewer conducted a 100-percent quality review of the data entries. Any questions that arose at this time were directed toward and answered by field personnel.
January 2009 3

2007-2008 Avian Survey Tule Wind Resource Area
2.2 Analysis
Species Groupings TtEC considered two primary groups of interest: raptors and non-raptors. TtEC defined raptors as vultures, hawks, eagles, falcons, and owls. As turkey vulture flight behavior is similar to raptors and as they are often included as raptors in other studies, TtEC has included them with raptors for the purpose of our analyses. Non-raptors were defined as all other species groups.
Avian Use TtEC derived avian use (mean use) of the Tule WRA by calculating the average number of birds observed per 30-minute survey at each point. To evaluate the diversity and composition of avian species using the Tule WRA, TtEC first summarized the number of individuals (birds per 30 minutes [/30 min]) and species. TtEC also calculated a measure of variability (90 percent confidence intervals) for all mean use values. In addition, the number of observations (obs/30 min) is also presented, where an observation can be either an individual bird or a discrete flock of birds. This information helps evaluate whether high mean use is driven by a single event (e.g., flock of birds moving through the rotor swept area). Because individual birds are not uniquely marked and identified, actual population size or abundance cannot be determined. One individual may be counted multiple times during a survey period or across survey periods. Therefore, avian use does not equate to abundance. Mean use is calculated per species and per species group. Multiple species are sighted during one point count period, which results in the overall mean for a species group being higher than the highest mean for a species within that group. TtEC classifies use as high, moderate, or low based on the ranking compared to published data from other existing wind energy facilities.
Flight Behavior TtEC evaluated flight behavior by calculating the proportion of flying birds observed below, within, or above the turbine RSA. Turbines proposed for this site are either 1.5 or 3 megawatts (MW). Therefore, TtEC compared two RSAs; between 60 and 150 meters above ground (3 MW turbines) and between 41.5 and 118.5 meters above ground (1.5 MW turbines). TtEC considered a bird to have flown within the RSA if any of its recorded heights overlapped the RSA.
Encounter Rate To estimate the rate at which a species flew through the anticipated RSA, TtEC applied the following equation to every species observed in the WRA:
Encounter Rate = A*Pf*Pt where A is the mean number of birds/30 min for a given species, Pf is the proportion of all activity observations for a given species that were flying; and Pt is the proportion flying observations that were within the turbine RSA for a given species. The encounter rate provides information on the rate at which a species moves through the RSA. This information is an important component in evaluating risk; however, this number alone does not indicate risk to a species.
January 2009 4
2007-2008 Avian Survey Tule Wind Resource Area
Encounter rate is an index of birds flying within the RSA and may not equate to actual post-construction mortality. Species with a high encounter rate are at a higher risk of collision than species with a low encounter rate but it does not mean that mortality is certain. Other factors such as a species ability to detect turbine blades, flight maneuverability to avoid blades, and habitat selection also influence mortality; therefore, actual mortality may be higher or lower than indicated by the encounter rate (Orloff and Flannery 1992). Encounter rate is based on (and only applicable to) daytime observations of bird mean use and flight height. Values are sensitive to large flocks of birds flying within the RSA. In this report, we discuss the overall results of the avian surveys (fall 2007 – summer 2008). For specific discussion of the seasonal results of the avian surveys, please see the corresponding seasonal report. However, data from all seasons are presented for completeness.
Mortality Estimates TtEC has not included mortality estimates as part of this report. The statistical relationship between pre-construction avian use and post-construction mortality remains poorly defined, thereby limiting our ability to predict mortality based on use. Previous studies (e.g., Johnson 2007) have documented a significant positive relationship between use and mortality for raptors; however, these studies have been based on data sets from throughout the United States, contain several statistical inconsistencies, and likely have limited applicability on a regional scale. This limited applicability is due, in large part, to the highly regional nature of avian mean use across North America (Arnett et al. 2007). Unfortunately, data on avian mortality at wind farms are lacking at regional scales in many parts of North America. Rather than attempt to draw conclusions from limited data sets, TtEC takes a conservative approach and limits our discussion to patterns of avian use and mortality risk factors.
2.3 Raptor Nest Surveys The purpose of raptor nest surveys is to estimate the number of active and inactive raptor nests in the project area. Biologists conducted the raptor nest survey across the project area before trees began to leaf out to increase visibility of raptor nests. Where possible, biologists also surveyed the area within approximately 1 mile around the project area. Once a nest was located, the biologist returned during the raptor breeding season to collect data on species, location, and activity status. The activity status (i.e., active or inactive) was determined by the presence of an adult or young, active territory defense by an individual, or the presence of feathers, egg shells or droppings underneath the nest. In addition, biologists determined the nest condition and substrate. Biologists visited nests a minimum of two times, once to determine the location of the nest and once to determine if the nest was active. This second check also allowed biologists to detect late-nesting species such as Swainson’s hawks. Raptor nest surveys provide an estimate of the number and species of raptors that use stick nests in the area. Ground nesting raptor species, such as northern harriers, were not surveyed.
3.0 RESULTS
3.1 Tule WRA Biologists surveyed about 7,945 acres of the Tule WRA during point count surveys, covering approximately 66 percent of its total area. The 16 point count locations were surveyed between
January 2009 5

2007-2008 Avian Survey Tule Wind Resource Area
23 and 27 times each, resulting in 412 total 30-minute surveys. Due to safety concerns, points 12-16 were surveyed from the edge of the 800-meter radius for approximately four months of the 1-year survey period. After this period, normal survey activity was resumed at points 12 and 13; and points 14, 15, and 16 were shifted to enable full-radius surveys. This method may have underestimated songbird abundance for this period at these points. However, these points were sampled at the original location during a number of surveys and the habitat at these points is not unique within the Tule WRA. Thus, the change in sampling methods is unlikely to affect conclusions regarding overall patterns of the avian community and rank order of the most common species.
3.2 Species Composition Biologists recorded a total of 3,851 birds of 80 identified species and 12 unidentified species groups during the 412 fixed-point count surveys (Table 2). The most commonly observed birds were the western scrub-jay (18.9 percent of all birds observed), common raven (10.3 percent), white-throated swift (5.6 percent), and red-tailed hawk (5.2 percent). Each remaining species comprised 4.8 percent or less of the total number of birds observed (Table 4).
3.3 Avian Use Overall mean bird use within the Tule WRA was 9.35 birds/30 min, ranging from zero to 143 birds/30 min point count. Overall mean use by non-raptors was 8.82 birds/30 min. The non-raptors with the highest mean use were the western scrub-jay (1.77 birds/30 min), common raven (0.96 birds/30 min), white-throated swift (0.52 birds/30 min), and house finch (0.44 birds/30 min) (Tables 2 and 3). Among non-raptor species groups, mean use was highest for songbirds (3.87 birds/30 min). The most commonly observed species, house finch, accounted for 11.5 percent of individuals in this species group. Among crows and allies, the second highest species group (2.80 birds/30 min), commonly observed species included western scrub-jay (1.77 birds/30 min) and common raven (0.96 birds/30 min; Table 3). Among the remaining species groups, swifts/hummingbirds, woodpeckers, pigeons/doves, gamebirds, waterfowl, gulls/terns, and waterbirds had mean use values of 1.02 birds/30 min, 0.27 birds/30 min, 0.18 birds/30 min, 0.17 birds/30 min, 0.06 birds/30 min, 0.01 birds/30 min, and a single bird seen over all surveys, respectively. Non-raptor mean use was relatively consistent throughout the spring, summer, and fall, although highest in the summer, and lower in the winter (Figure 3). Mean use for non-raptors was highest at point 16 (20.13 birds/30 min) and observations at this point included high numbers of western scrub-jay, acorn woodpecker, and flocks of bushtits (Figure 4).
January 2009 6

2007-2008 Avian Survey Tule Wind Resource Area
Figure 3: Mean non-raptor use by survey date (2007-2008)
0
5
10
15
20
25
9/13
9/27
10/1
910
/25
11/1
611
/20
11/2
912
/14
12/2
81/
101/
161/
312/
21 3/8
3/12
3/29
4/11
4/30 5/9
5/30 6/8
6/20 7/2
7/18
7/30
8/15
8/29
9/12
Fall Winter Spring Summer
Survey Date
30 m
in)
Mea
n U
se (b
irds/
Mea
n U
se (b
irds/
30 m
in)
Raptors are a group of special interest because of their propensity to fly at heights similar to those encompassed by a turbine RSA. Overall mean use for raptors was 0.98 birds/30 min. The raptors with the highest use were the red-tailed hawk (0.49 birds/30 min) and the turkey vulture (0.40 birds/30 min). Mean use for each other raptor species was 0.03 birds/30 min or fewer and included the Cooper’s hawk, American kestrel, unidentified raptor, northern harrier, unidentified falcon, sharp-shinned hawk, golden eagle, prairie falcon, and osprey. Mean use by raptors was relatively consistent throughout the survey period, although highest in the summer and lowest in the winter (Figure 5). Mean use by raptors was highest at point count location 3 (Figure 6). A total of 67 raptors were observed at point 3, of which 37 were red-tailed hawks, 28 were turkey vultures, one was a Cooper’s hawk, and one was a sharp-shinned hawk.
January 2009 7

6.44
4.58
6.63
8.54
7.78
4.22
7.35
6.04 5.33
7.07
5.76
20.13
10.88
10.28
11.15
13.19
PC 9
PC 8
PC 7
PC 6
PC 5 PC 4
PC 3
PC 2
PC 1
PC 16
PC 15
PC 14
PC 13
PC 12
PC 11
PC 10
8
1:60,000
Figure 4. TuleMean Non-Raptor Use by Point
Count Location (2007 - 2008)San Diego County, California
November 25, 2008
NAD 83 UTM 11
0 1 20.5
Miles
San Diego Metro Area
San Diego Cty
Riverside Cty
8
15
5
215
Cleveland NF
San Bernardino NF
TETR
A TE
CH
EC
,INC
Non-Raptors per 30 Minutes4.22 - 5
5.01 - 10
10.01 - 15
15.01 - 20.13
Lake/Reservoir
Perennial Stream
Intermittent Stream
TransportationInterstate
Major Road
Other Road# Mean Use Value
PC# Point Count Number
P:\GIS_PROJECTS\Iberdrola_Renewables\Tule\maps\Avian_Survey\2008_Survey_Reports\Tule_Figure4_Mean_NonRaptorUse_by_Point_Count_Location_112508.mxd - Last Accessed: 11/25/2008 - Map Scale is correct when printed at: Portrait ANSI B (11 x 17 inches)

2007-2008 Avian Survey Tule Wind Resource Area
Figure 5: Mean raptor use by survey date (2007-2008)
0.0
0.5
1.0
1.5
2.0
2.5
9/13
9/27
10/1
910
/25
11/1
611
/20
11/2
912
/14
12/2
81/
101/
161/
312/
21 3/8
3/12
3/29
4/11
4/30 5/9
5/30 6/8
6/20 7/2
7/18
7/30
8/15
8/29
9/12
Fall Winter Spring Summer
Survey Date
in)
Mea
n U
se (b
irds/
30 m
Mea
n U
se (b
irds/
30 m
in)
3.4 Frequency of Occurrence Crows and allies were present in the majority of surveys and were widely distributed throughout the Tule WRA (Tables 5a-d); the western scrub-jay (65.5 percent of all surveys) and common raven (40.3 percent of all surveys) occurred the most often (Table 4). The remaining species in this group, the Steller’s jay and American crow, were detected in less than 4 percent of surveys. Raptors were the second most commonly observed species group during surveys. Among raptors, red-tailed hawk (35.0 percent of all surveys) and turkey vulture (22.3 percent) were detected most frequently (Table 4). Turkey vultures and red-tailed hawks were widespread throughout the Tule WRA and were observed at most point count locations (Tables 5a-d). The other raptor species were detected at or less than 3.2 percent of surveys. Songbirds were the third most common species group observed during summer surveys. The California towhee was observed most frequently (25.5 percent of all surveys), followed by the wrentit (24.0 percent), spotted towhee (22.1 percent), house finch (19.4) and California thrasher (17.2 percent of all surveys). Other songbirds were observed at lower frequencies at or less than 16.0 percent of all surveys.
Flight Height and Encounter Rate During avian use surveys, biologists collected behavioral data for 97.1 percent of all birds observed during point count surveys. Biologists observed 56.2 percent of birds flying and collected flight height data for 98.3 percent and flight direction for 95.9 percent of observations.
January 2009 8

PC 9
PC 8
PC 7
PC 6
PC 5 PC 4
PC 3
PC 2
PC 1
PC 16
PC 15
PC 14
PC 13
PC 12
PC 11
PC 10
0.74
1.04
0.78
0.58
0.79
0.64
0.62
0.89
0.85
0.67
0.65
1.44 1.41
2.00
1.38
1.08
8
1:60,000
Figure 6. TuleMean Raptor Use by Point
Count Location (2007 - 2008)San Diego County, California
November 25, 2008
NAD 83 UTM 11
0 1 20.5
Miles
San Diego Metro Area
San Diego Cty
Riverside Cty
8
15
5
215
Cleveland NF
San Bernardino NF
TETR
A TE
CH
EC
,INC
Raptors per 30 Minutes0 - 0.58
0.59 - 1
1.01 - 1.5
1.51 - 2
Lake/Reservoir
Perennial Stream
Intermittent Stream
TransportationInterstate
Major Road
Other Road
# Mean Use ValuePC# Point Count Number
P:\GIS_PROJECTS\Iberdrola_Renewables\Tule\maps\Avian_Survey\2008_Survey_Reports\Tule_Figure6_Mean_RaptorUse_by_Point_Count_Location_112508.mxd - Last Accessed: 11/25/2008 - Map Scale is correct when printed at: Portrait ANSI B (11 x 17 inches)

Nest 9
Nest 8
Nest 7
Nest 6
Nest 5
Nest 4
Nest 3
Nest 2
Nest 1
Nest 14
Nest 13
Nest 12
Nest 11
Nest 10
8
94
1:55,000
Figure 7. TuleRaptor Nest Locations
(spring 2008)San Diego County, California
July 18, 2008
NAD 83 UTM 11
0 1 20.5
Miles
San Diego Metro Area
San Diego Cty
Riverside Cty
8
15
5
215
Cleveland NF
San Bernardino NF
TETR
A TE
CH
EC
,INC
Raptor NestsRed-tailed hawk
Cooper’s hawk
Inactive
Lake/Reservoir
Perennial Stream
Intermittent Stream
TransportationLimited Access
Highway
Major Road
Other Road
P:\GIS_PROJECTS\Iberdrola_Renewables\Tule\maps\Avian_Survey\2008_Survey_Reports\Tule_Figure7_RaptorNests_and_PrairieGrouseLek_Locations_081808.mxd - Last Accessed: 8/18/2008 - Map Scale is correct when printed at: Portrait ANSI B (11 x 17 inches)

2007-2008 Avian Survey Tule Wind Resource Area
3 MW Turbines (60-150 meter RSA) For non-raptor species observed flying, 72.3 percent flew below the anticipated RSA, 26.1 percent flew within the anticipated RSA; and 1.5 percent flew above the anticipated RSA. For raptor species observed flying, 56.1 percent flew within the RSA, 40.6 percent flew below the RSA, and 3.3 percent flew above (Table 6a). Data on flight direction are located in Appendix A. The white-throated swift had the highest encounter rate (0.34 birds flying within the RSA/30 min), followed by common raven (0.29 birds flying within the RSA/30 min), turkey vulture (0.25 birds flying within the RSA/30 min), and Vaux’s swift and red-tailed hawk (both with 0.21 birds flying within the RSA/30 min; Table 7i). Species with encounter rates between 0.10 and 0.01 birds flying within the RSA/30 min were violet-green swallow (0.10), cliff swallow (0.06), western scrub-jay (0.03), unidentified swallow (0.02), Cooper’s hawk (0.02), unidentified songbird (0.01), unidentified gull (0.01), house finch (0.01), and barn swallow (0.01;Table 7i).
1.5 MW Turbines (41.5-118.5 meter RSA) For non-raptor species observed flying, 67.7 percent occurred below the anticipated RSA, 28.6 percent flew within the anticipated RSA; and 3.7 percent flew above the anticipated RSA. For raptor species observed flying, 66.9 percent flew within the RSA, 26.9 percent flew below the RSA, and 6.1 percent flew above (Table 6b). Data on flight direction are located in Appendix A. The common raven had the highest encounter rate (0.39 birds flying within the RSA/30 min), followed by white-throated swift (0.30 birds flying within the RSA/30 min), turkey vulture (0.29 birds flying within the RSA/30 min), red-tailed hawk (0.25 birds flying within the RSA/30 min), and Vaux’s swift (0.23 birds flying within the RSA/30 min; Table 7j). Species with encounter rates between 0.10 and 0.01 birds flying within the RSA/30 min were cliff swallow (0.07), western scrub-jay (0.03), unidentified swallow (0.02), house finch (0.02), Cooper’s hawk (0.02), unidentified songbird (0.01), unidentified gull (0.01), northern rough-winged swallow (0.01), mourning dove (0.01), barn swallow (0.01), and American kestrel (0.01; Table 7j).
3.5 Incidental Observations During summer surveys, biologists documented 83 species and 6 unidentified species groups incidentally (outside of timed point counts) for a total of 4,520 birds (Table 8). The bushtit was the most commonly recorded species incidentally within the Tule WRA (920 birds). Biologists documented 22 incidental species that were not detected during point count surveys (Table 8). Biologists observed several raptor species both as incidentals and during the point count surveys including the red-tailed hawk, turkey vulture, Cooper’s hawk, American kestrel, sharp-shinned hawk, northern harrier, prairie falcon, osprey, and golden eagle.
3.6 Raptor Nest Surveys During the early spring, biologists identified 14 nests while trees were still without leaves (Figure 7; Appendix B). Biologists revisited all nests at the end of the spring survey during the
January 2009 9

2007-2008 Avian Survey Tule Wind Resource Area
raptor nesting period. Two of the 14 nests were active. One of those was a Cooper’s hawk nest in an oak tree, and the other was a red-tailed hawk nest in a cottonwood.
4.0 DISCUSSION
4.1 Raptor Use and Encounter Rate Overall raptor use at the Tule WRA from fall 2007 through summer 2008 was 0.98 birds/30 min and varied between seasons. Mean use was highest in the summer and spring and lowest in the fall and winter. Annual raptor use rates were moderate when compared to existing wind energy facilities throughout the country (Table 9). Compared to other facilities with seasonal raptor use rates, and not including data collected at the Tule WRA in 2005-2006, the Tule WRA ranked thirteenth out of 34 in the spring, ninth out of 32 in the summer, eighteenth out of 29 in the fall, and ninth out of 28 in winter (Table 9). High raptor use has been associated with high raptor mortality (greater than 0.40 raptors/MW/year) at wind farms (Erickson 2007); however, the strength of the conclusion is based on two data points for high raptor use (greater than 2.0 birds/30 minutes). Conversely, raptor mortality appears to be low (less than 0.20 raptors/MW/year) when raptor use is low (less than 1.0 birds/30 min; Erickson 2007). Continued monitoring and additional analysis of encounter rate and post-construction mortality data will help elucidate the relationship between these two variables. The spatial distribution of raptors in the Tule WRA was characterized by 5 points with a mean use greater than 1.0 birds/30 min during the surveys. These points were located generally in the southern portion of the Tule WRA (points 1-5), and one in the northern portion (point 15; Figure 2). Use of the Tule WRA showed distinct seasonal patterns with use being highest in summer and lowest in winter. Raptor use was driven by the seasonal movements of the turkey vulture, which migrates from the area during the fall and winter. Turkey vultures and red-tailed hawks were the most commonly observed raptor species in the Tule WRA and had the highest encounter rates for all raptors and for both turbine types (3 MW turbines: 0.25 and 0.21 birds flying within the RSA/30 min, respectively; 1.5 MW turbines: 0.29 and 0.25 birds flying within the RSA/30 min, respectively). Mean use for red-tailed hawks was consistent throughout the year (0.46 – 0.52 birds/30 min), whereas mean use for turkey vultures was seasonal with a low in winter (0.13 birds/30 min) and high in summer (0.87 birds/30 min). Turkey vultures have been recorded as fatalities at some wind energy facilities (Kerns and Kerlinger 2004, Kerlinger et al. 2005); however, at the Altamont WRA, mortality rates were lower than expected based on pre-construction avian use (Orloff and Flannery 1992). Turkey vulture populations are considered stable (Sauer et al. 2007), thereby minimizing the potential population-level impacts of fatalities. Mortality of red-tailed hawks due to collisions with wind turbines has been documented at multiple sites (Johnson et al. 2002, Erickson et al. 2004, Erickson 2007), and at the Altamont WRA, were higher than expected from pre-construction avian use surveys (Orloff and Flannery 1992); therefore, red-tailed hawk mortality events may occur at the Tule WRA. However, the overall low mean use of red-tailed hawks within the WRA coupled with a large population (Sauer et al. 2007) make it unlikely that mortality of red-tailed hawks would have population-level impacts. The Cooper’s hawk, American kestrel, northern harrier, sharp-shinned hawk, golden eagle, prairie falcon, osprey, and an unidentified falcon and raptor were also observed at the Tule WRA (Table 3). All of these species had relatively low encounter rates (0.02 or fewer birds
January 2009 10
2007-2008 Avian Survey Tule Wind Resource Area
flying within the RSA/30 min) due to the fact that they were not very abundant and did not commonly fly within the RSA (Tables 7i and 7j). Hence, the likelihood of mortality is low, but if mortality occurred it could reduce local populations. No raptors observed during the surveys are federally or state listed as threatened or endangered. When comparing the two proposed turbine types, encounter rates were higher for the 1.5 MW turbines based on the fact that more birds flew within the RSA. When analyzing flight heights with the 3 MW turbine (60-150 meter above ground), 56.1 percent of raptors flew within the RSA, compared to 66.9 percent within the 1.5 MW turbine RSA (41.5-118.5 meter above ground). Encounter rates during the surveys suggest that the 3 MW turbines may cause fewer raptor mortalities than the 1.5 MW turbines. An active red-tailed hawk nest and a Cooper’s hawk nest indicate that the Tule WRA is suitable raptor breeding habitat. Turbines should be sited away from nests to avoid impacts to nesting raptors and juvenile birds.
4.2 Non-Raptor Use and Encounter Rate Overall use by non-raptors at the Tule WRA was 8.37 birds/30 min (Table 3). Overall non-raptor use at the Tule WRA varied between seasons, and was highest in the summer and lowest in the winter. Annual non-raptor use rates were low when compared to existing wind energy facilities throughout the country (Table 9). Compared to other facilities with seasonal non-raptor use rates, and not including data collected at the Tule WRA in 2005-2006, the Tule WRA ranked eighteenth out of 20 in the spring, tenth out of 19 in the summer, tenth out of 15 in the fall, and fourteenth of 15 in winter (Table 9). Because studies of avian use do not share identical methodologies (e.g., length of survey period) and there is variance associated with the mean values, comparisons of avian use represent generalizations only. Songbirds had the highest mean use out of all groups and crows and allies had the second highest mean use. The spatial distribution of non-raptors in the Tule WRA was characterized by 5 points with a mean use greater than 10.0 birds/30 min during the surveys. These points were located throughout the Tule WRA (points 2, 8, 11, 15, and 16; Figure 2). Mean use for non-raptors was highest at point 16 because the point is located next to a riparian area. Riparian areas are particularly valuable habitats for wildlife. Riparian areas generally have more vigorous plant growth and greater plant variety than the surrounding uplands and in turn support much higher insect populations. Consequently, riparian areas are much more valuable as feeding areas for songbirds, especially during the nesting season. The dense vegetation of riparian zones also provides many wildlife species with cover that may not exist in the adjacent uplands. In addition, the structural diversity creates many niches, which offers homes to a great variety of wildlife species. Use of the Tule WRA showed seasonal patterns with use being highest in the summer and fall, and lower in the spring and winter. Non-raptor use was driven by Vaux’s swift migrating through the WRA in the fall (mean use of 1.99 birds/30 min versus 0.00 birds/30 min for all other seasons), and a number of songbirds being present in the summer during the breeding season (e.g., western scrub-jay, house finch). The white-throated swift had the highest encounter rate for the 3 MW turbine type, and second highest for the 1.5 MW turbine type. White-throated swifts have been found as mortalities at existing wind energy facilities, although in low numbers (Erickson et al. 2000, Anderson et al.
January 2009 11

2007-2008 Avian Survey Tule Wind Resource Area
2005, Kerlinger et al. 2005). The stability of white-throated swift populations is relatively unknown, due to difficulty of detection and the patchy distribution of this species. However, a long-term decrease has been noted at Palos Verdes, CA between 1972 and 1996 for unknown reasons, but the range is thought to be expanding elsewhere in British Columbia, California, and Texas (Ryan and Collins 2000). Population numbers in California are estimated to be about 50,000 birds (PIF 2008); hence, due to the relatively low numbers of birds seen in the Tule WRA (214 individuals over four survey seasons) any mortality caused by this wind energy facility would be unlikely to cause population level impacts. Common ravens had the highest encounter rate for the 1.5 MW turbine type, and second highest for the 3 MW turbine type; and Vaux’s swifts had the third highest encounter rates for non-raptor species for both turbine types. Mean use for common ravens was relatively consistent throughout the year (0.61-1.37 birds/30 min), whereas mean use for Vaux’s swifts was seasonal with a high mean use in the fall (1.99 birds/30 min) and no presence the rest of the year. Common ravens have been found as mortalities at existing wind energy facilities in low numbers (Thelander et al. 2003, Anderson et al. 2005). A post-construction mortality study at the Stateline project in Oregon and Washington found that common ravens were commonly seen in the area of wind turbines but were not found as mortalities (Erickson et al. 2004). Common raven populations appear to be relatively widespread and stable (Boarman and Heinrich 1999). Vaux’s swifts have not been documented as mortalities at any existing wind energy facilities, although other species of swift have been found dead (Anderson et al. 2005, Kerlinger et al. 2005, Erickson et al. 2000). The Vaux’s swift has declined by 2.1 percent per year in California from 1980–2006 (Sauer et al. 2007), and appears to be declining throughout its range. Vaux’s swifts do not breed within the vicinity of the Tule WRA, and the birds seen were observed in large flocks and were most likely migrating (Bull and Collins 2007). Mortalities may occur at this wind energy facility and could cause local level impacts but would not likely cause population level impacts to either common ravens or Vaux’s swifts. Aside from the species discussed above, the three most common species, the western scrub jay (1.77 birds/30 min), white-throated swift (0.52 birds/30 min), and house finch (0.44 birds/30 min) all had relatively low encounter rates (0.03 birds or fewer flying within the RSA/30 min) because they did not regularly fly through the RSA. Most of the other local resident non-raptors were observed flying below the RSA and thus had low encounter rates as well. When comparing the two proposed turbine types, encounter rates were higher for the 1.5 MW turbines based on the fact that more birds flew within the RSA. When analyzing flight heights with the 3 MW turbine (60-150 meter above ground), 26.1 percent of non-raptors flew within the RSA, compared to 28.6 percent within the 1.5 MW turbine RSA (41.5-118.5 meter above ground). Encounter rates during the summer surveys suggest that the 3 MW turbines may cause fewer non-raptor mortalities than the 1.5 MW turbines.
4.3 Comparison of 2007-2008 Data to 2005-2006 Data Summer point count surveys were conducted approximately every two weeks between March 25, 2005 and March 10, 2006 at 14 point count locations, compared to the data analyzed in this report between September 13, 2007 and September 12, 2008 at 16 point count locations. Mean avian use was in the moderate range during both 2005-2006 and 2007-2008 surveys (11.67 and 9.35 birds/30 min, respectively). Although the number of species was similar, more birds were detected in 2007-2008 than 2005-2006 (3,851 versus 3,500 birds, respectively). The most
January 2009 12
2007-2008 Avian Survey Tule Wind Resource Area
commonly detected birds in 2005 (western scrub jay, common raven, and bushtit) were also detected regularly in 2007-2008. Avian use among species groups was similar although songbird use was 6.54 and 3.87 birds/30 min, respectively, during summer 2005-2006 and 2007-2008. Species with the highest encounter rates during both years included common raven, white-throated swift, turkey vulture, and red-tailed hawk. Raptor mean use during 2005-2006 was lower than 2007-2008 (0.58 birds/30 min, 0.98 birds/30 min, respectively). Similar to 2007-2008, the red-tailed hawk and turkey vulture had the highest mean use (0.29 and 0.21 birds/30 min, respectively) of raptors detected during the 2005-2006 surveys. The encounter rates for turkey vulture and red-tailed hawk were between 0.47 and 0.02 birds flying in the RSA/30 min for both 3 MW and 1.5 MW turbines in 2005-2006; and lower than 2008 (between 0.64 and 0.04 birds flying within the RSA/30 minutes for both 3 MW and 1.5 MW turbines). Overall, these rates can be considered moderately low in both years.
4.4 Listed and Sensitive Species No species listed as candidate, threatened, or endangered under the Endangered Species Act of 1973 were observed during avian surveys. However, the willow flycatcher, a species listed as threatened under the California Endangered Species Act was observed twice incidentally. The southwestern willow flycatcher, a federally endangered sub-species of willow flycatcher is known to occur in the area of the Tule WRA. Willow flycatchers breed in riparian vegetation and it is unlikely that this habitat will be disturbed during project development. Additionally, the California Department of Fish and Game (CDFG 2008) explains “Species of Special Concern (SSC) status applies to animals not listed under the California Endangered Species Act, but which nonetheless 1) are declining at a rate that could result in listing, or 2) historically occurred in low numbers and known threats to their persistence currently exist. This designation is intended to result in special consideration for these animals by the department, land managers, consulting biologists, and others, and is intended to focus attention on the species to help avert the need for costly listing under federal and state endangered species laws and cumbersome recovery efforts that might ultimately be required.” California SSC that occurred during point count and incidental surveys were loggerhead shrike (1 point count; 5 incidental), northern harrier (3 point count; 8 incidental), Vaux’s swift (135 point count; 28 incidental), yellow warbler (1 point count), and olive-sided flycatcher (1 incidental). Cooper’s hawk, sharp-shinned hawk, merlin and osprey were identified as species of concern in previous project reports. However, these species were removed from California’s species of concern list when the list was updated in February 2008. Loggerhead shrike, northern harrier, and Vaux’s swift were all seen in the fall or winter, and yellow warbler and olive-sided flycatcher were seen in the summer. However, they were seen only once each and thus are unlikely to be breeding in the area. Although 135 Vaux’s swifts were observed within the WRA, overall mean use was only 0.33 birds/30 min. There is a potential for mortality considering that more than half of the Vaux’s swifts observed flew within the RSA, but the species does not breed in southern California. Although they are fairly common throughout California during spring and fall migrations, their occurrence is unpredictable. Thus, population level consequences are not expected for Vaux’s swifts at the Tule WRA
January 2009 13
2007-2008 Avian Survey Tule Wind Resource Area
The golden eagle, protected under the Bald and Golden Eagle Protection Act (BGEPA), was detected twice during surveys and once incidentally. Golden eagles are susceptible to mortality from wind turbines and have experienced mortality rates higher than expected from pre-construction avian use surveys in the Altamont Pass area of California. The BGEPA prohibits the killing or disturbance of any golden eagle or golden eagle nest. While only three golden eagles were detected in the WRA, its presence implies that suitable habitat exists in the WRA.
4.5 Tule Project Area Conclusions Non-raptor use at the Tule WRA ranked sixth of six studies, indicating relatively low mean use (Table 9). Although mortality events will likely occur at the Tule WRA, the most commonly observed species − the western scrub-jay and common raven − are widespread species and have relatively stable populations (Sauer et al. 2007). Therefore, individual mortalities are unlikely to have population-level consequences or receive a high level of scrutiny from state or federal wildlife agencies. Nocturnal migrants may pass through the Tule WRA and would not be detected by the survey methods used in this study if the birds did not stop over within the WRA. However, mortality of nocturnal migrants at the Tule WRA is not expected to have population-level implications because less than 0.01 percent of nocturnal migrants that fly through wind farms are killed (Erickson 2007). Raptor use at the Tule WRA was moderate when compared to other wind generation facilities, ranking fourth out of six studies (Table 9). Moderate raptor use at the Tule WRA suggests that raptor mortality is anticipated to be moderate; however, mortality rates are variable between species and pre-construction mean use surveys may not equate to post-construction mortality. Turkey vultures and red-tailed hawks were the most common raptors observed at the Tule WRA. Mortalities of both species have occurred at existing wind farms (Kerns and Kerlinger 2004, Anderson et al. 2005, Kerlinger et al. 2005); however, the stable populations make it unlikely that local mortalities would have a population-level effect. These impacts likely could be minimized if turbines are sited away from areas of high raptor use, active raptor nests, saddles along ridgelines, and ridge edges.
5.0 REFERENCES Anderson, R., J. Tom, N. Neumann, W. P. Erickson, M. D. Strickland, M. Bourassa, K. J. Bay,
and K. J. Sernka. 2005. Avian monitoring and risk assessment at the San Gorgonio Wind Resource Area. Technical report prepared by State Energy Resources Conservation and Development Commission and Western EcoSystems Technology, Inc. for National Renewable Energy Laboratory. Golden, CO.
Arnett, E. B., D. B. Inkley, D. H. Johnson, R.P. Larkin, S. Manes, A. M. Manville, J. R. Mason, M. L. Morrison, M. D. Strickland, and R. Thresher. 2007. Impacts of wind energy facilities on wildlife and wildlife habitat. Wildlife Society Technical Review 07-2. The Wildlife Society, Bethesda, MA, USA.
Ballam, J. M. 1984. The use of soaring by the red-tailed hawk (Buteo jamaicensis). Auk 3:519-524.
Birdnature.com (BNC). 2004. North American Migration Pathways (map). Available at http://www.birdnature.com/flyways.html. Accessed January 2008.
January 2009 14

2007-2008 Avian Survey Tule Wind Resource Area
BLM. 2007. Eastern San Diego County Resource Management Plan, December 2007. Available at http://www.blm.gov/ca/st/en/fo/elcentro/esdrmp.html. Accessed January 2008.
Boarman, William I. and Bernd Heinrich. 1999. Common Raven (Corvus corax), The Birds of North America Online (A. Poole, Ed.). Ithaca: Cornell Lab of Ornithology; Retrieved from the Birds of North America Online: http://bna.birds.cornell.edu/bna/species/476
Bull, Evelyn L. and Charles T. Collins. 2007. Vaux's Swift (Chaetura vauxi), The Birds of North America Online (A. Poole, Ed.). Ithaca: Cornell Lab of Ornithology; Retrieved from the Birds of North America Online: http://bna.birds.cornell.edu/bna/species/077
California Department Fish and Game (CDFG). 2008. California's Nongame Wildlife Program. Available at http://www.dfg.ca.gov/wildlife/species/. Accessed October 2008.
Drewitt, A. L. and R. H. W. Langston. 2006. Assessing the impacts of wind farms on birds. Ibis 148:29-42.
Erickson, W. P. 2007. Summary of methods and results for prediction and estimation of impacts and risk. Presented at NWCC Probability of Impact Workshop, 13 November 2007, Golden, CO.
Erickson, W. P., G. D. Johnson, and D. P. Young, Jr. 2005. A summary and comparison of bird mortality from anthropogenic causes with an emphasis on collisions. USDA Forest Service Gen. Tech. Rep. PSW-GTR-191.
Erickson, W. P., J. Jeffrey, K. Kronner, and K. Bay. 2004. Stateline Wind Project Wildlife Monitoring Final Report, July 2001 – December 2003. Technical report peer-reviewed by and submitted to FPL Energy, the Oregon Energy Facility Siting Council, and the Stateline Technical Advisory Committee.
Erickson, W. P., D. Young, G. Johnson, J. Jeffrey, K. Bay, R. Good, and H. Sawyer. 2003. Wildlife Baseline Study for the Wild Horse Wind Project, Summary of Results from 2002-2003 Wildlife Surveys. Prepared for Zilkha Renewable Energy, Portland, OR.
Erickson, W., J. Jeffery, D. Young, K. Bay, R. Good, and K. Sernka. 2003a. Wildlife Baseline Study for the Kittitas Valley Wind Project. Prepared for Zilkha Renewable Energy. January 2003.
Erickson, W. P., G. Johnson, D. Young, D. Strickland, R. Good, M. Bourassa, K. Bay, and K. Sernka. 2002. Synthesis and comparison of baseline avian and bat use, raptor nesting and mortality information from proposed and existing wind developments. Technical report prepared by WEST, Inc., for Bonneville Power Administration, Portland, OR.
Erickson, W. P., G. D. Johnson, M. D. Strickland, D. P. Young Jr., K. J. Sernka, and R. E. Good. 2001. Avian collisions with wind turbines: a summary of existing studies and comparisons to other sources of avian collision mortality in the United States. National Wind Coordinating Committee, Washington, DC. Can be found at: http://www.nationalwind.org/publications/wildlife/avian_collisions.pdf
January 2009 15

2007-2008 Avian Survey Tule Wind Resource Area
Erickson, W.P., G.D. Johnson, M.D. Strickland, and K. Kronner. 2000. Avian and bat mortality associated with the Vansycle Wind Plant, Umatilla County Oregon. 1999 study year. Technical report submitted to Umatilla County Department of Resource Services and Development, Pendleton, Oregon. 22 pp.
Hill, Geoffrey E. 1993. House Finch (Carpodacus mexicanus), The Birds of North America Online (A. Poole, Ed.). Ithaca: Cornell Lab of Ornithology; Retrieved from the Birds of North America Online: http://bna.birds.cornell.edu/bna/species/046.
Jain, A., P. Kerlinger, R. Curry, and L. Slobodnik. 2007. Annual report for the Maple Ridge wind power project postconstruction bird and bat fatality study – 2006. Prepared by Curry and Kerlinger, LLC for PPM Energy, Horizon Energy, and Technical Advisory Committee for the Maple Ridge project.
Jefferey, J. D., Poulton, V. K., Bay, K. J., Flaig, K. F., Roderick, C. C., Erickson, W. P., and J. E. Baker. 2007. Wildlife and Habitat Baseline Study for the Proposed Vantage Wind Power Project, Kittitas County Washington. Prepared for Invenergy. August 2007.
Johnson, G. D. 2007. Cumulative impacts analysis for birds and bats from existing and permitted wind energy projects in Klickitat County, Washington. Technical report submitted to Windy Point Partners.
Johnson, G. D., and W. P. Erickson. 2004. Analysis of Potential Wildlife/Wind Plant interactions Bighorn Site Klickitat County Washington. Prepared for CH2M Hill. August 2004.
Johnson, G. D., W. P. Erickson, M. D. Strickland, M. F. Shepherd, D. A. Shepherd, and S. A. Sarappo. 2007. Collision mortality of local and migrant birds at a large-scale wind-power development on Buffalo Ridge, Minnesota. Wildlife Society Bulletin 30(3): 879-887.
Johnson, G. D., Jeffery, J., Baker, J., and K. Bay. 2007a. Baseline Avian Studies for the Windy Flats Wind Energy Project, Klickitat County Washington. Prepared for Windy Point Partners. May 2007.
Johnson, G. D., Poulton, V., and K. Bay. 2007b. Baseline Ecological Studies for the Sand Ridge Wind Energy Project Klickitat County Washington. Prepared for Northwest Wind Partners. April 2007.
Johnson, G. D., Baker, J., and K. Bay. 2007c. Baseline Ecological Studies for the Lower Linden Ranch Wind Energy Project Klickitat County Washington. Prepared for Northwest Partners. July 2007.
Johnson, G. D., W. P Erickson, and J. D. Jeffrey. 2006. Analysis of potential wildlife impacts from the Windy Point wind energy project, Klickitat County, Washington. Technical Report prepared by Western EcoSystems Technology, Inc., for Ecology and Environment, Portland, OR.
Johnson, G. D., Jeffery, J., Poulton, V., and K. Baker. 2006a. Baseline Ecological Studies for the Hoctor Ridge Wind Energy Project Klickitat County Washington. Prepared for Windtricity Ventures. August 2006
January 2009 16

2007-2008 Avian Survey Tule Wind Resource Area
Johnson, G. D., W. P. Erickson, M. D. Strickland, M. F. Shepherd, D. A. Shepherd, and S. A. Sarappo. 2002. Collision mortality of local and migrant birds at a large-scale wind power development on Buffalo Ridge, Minnesota. Wildlife Society Bulletin 30: 879-887.
Johnson, G. D., D. P. Young Jr., W. P. Erickson, C. E. Derby, M. D. Strickland, and R. E. Good. 2000. Wildlife monitoring studies, SeaWest Windpower Project, Carbon County, Wyoming. 1995-1999. Technical Report prepared by Western EcoSystems Technology, Inc., for SeaWest Energy Corporation and Bureau of Land Management.
Kerlinger, P., L. Culp, and R. Curry. 2005. Post construction avian monitoring study for the High Winds wind power project. Solano County, California. Prepared for High Winds, LLC. FPL Energy.
Kerns, J., and P. Kerlinger. 2004. A study of bird and bat collision fatalities at the Mountaineer Wind Energy Center, Tucker County, West Virginia: annual report for 2003. Technical report prepared by Curry and Kerlinger, LLC. For FPL Energy and Mountaineer Wind Energy Center Technical Review Committee.
Kronner, K., Gritski, B., Baker, J., Marr, V., Johnson, G., and B. Kimberly. 2005. Wildlife Baseline Study for the Leaning Juniper Wind Power Project Gilliam County Oregon. Prepared for PPM Energy and CH2M Hill. November 2005.
Kronner, K., Gritski, B., Baker, J., Marr, V., Johnson, G., Kimberl, B., Good, R., and E. Lack. 2005a. Ecological Baseline Studies and Wildlife Impact Assessment for the White Creek Wind Power Project. Prepared for Last Mile Electric Cooperative. February 2005.
Leddy, K. L., K. F. Higgins, and D. E. Naugle. 1999. Effects of wind turbines on upland nesting birds in Conservation Reserve Program grasslands. Wilson Bulletin 111:100-104.
Orloff, S., and A. Flannery. 1992. Wind turbine effects on avian activity, habitat use, and mortality in Altamont Pass and Solano County Wind Resource Areas, 1989-1991. Final report prepared by Biosystems Analysis, Inc. for Alameda, Contra Costa, and Solano Counties and the California Energy Commission.
Partners in Flight (PIF). 2008. Landbird population estimates database. Available at http://rmbo.org/pif_db/laped/PED3.aspx. Accessed August 13, 2008.
Ryan, Thomas P. and Charles T. Collins. 2000. White-throated Swift (Aeronautes saxatalis), The Birds of North America Online (A. Poole, Ed.). Ithaca: Cornell Lab of Ornithology; Retrieved from the Birds of North America Online: http://bna.birds.cornell.edu/bna/species/526
Sauer, J. R., J. E. Hines, and J. Fallon. 2007. The North American Breeding Bird Survey, results and analysis 1966 - 2006. Version 10.13.2007. USGS Patuxent Wildlife Research Center, Laurel, MD.
Strickland, D., and M. L. Morrison. 2008. A summary of avian/wind facility interactions in the U.S. Federal Guidelines Committee for Wind Siting Guidelines, February 26, 2008, Washington, DC.
January 2009 17

2007-2008 Avian Survey Tule Wind Resource Area
Tetra Tech EC, Inc. 2007. 2005-2006 avian survey, Tule Wind Resource Area, San Diego County, California.
Thelander, C.G., K.S. Smallwood and L. Rugge. 2003. Bird risk behavior and fatalities at the Altamont Wind Resource Area, March 1998 to December 2000. Technical report prepared by BioResource Consultants for National Renewable Energy Laboratory. Golden, CO.
Thompson, W. L. 2002. Towards reliable bird surveys: accounting for individuals present but not detected. Auk 119:18-25.
URS Corporation and WEST. 2001. Avian baseline study for the Stateline Project. Prepared for ESI Vansycle Partners, L.P.
U.S. Department of the Interior, Bureau of Land Management, Twin Falls District, Burley Field Office (USDI). 2005. Draft environmental impact statement for the proposed Cotterel Wind Power Project and draft resource management plan amendment, Burley, Cassia County, Idaho.
United States Fish and Wildlife Service (USFWS). 2008. California Threatened and Endangered Species list. Found at: http://ecos.fws.gov/tess_public// pub/stateListing.jsp?state=CA&status=listed. Accessed August, 2008.
United States Fish and Wildlife Service (USFWS). 2008a. Flyways. Retrieved from: http://flyways.us/flyways/central.
Welch, R., and L. Schleder. 2006. Wildlife Assessment for the Shepherds Flat Wind Farm. Prepared for Lifeline Renewable Energy. November 2006.
Western EcoSystems Technology, Inc. (WEST). 2005. Wildlife and habitat baseline study for the proposed Biglow Canyon wind power project, Sherman County, Oregon. Prepared for Orion Energy LLC.
WEST. 2005a. Ecological Baseline Study at the Elkhorn Wind Power Project. Prepared for Zikha Renewable Energy. June 2005
WEST and Northwest Wildlife Consultants (NWC). 2004. Stateline wildlife monitoring final report. July 2001-December 2003. Prepared for FPLE, Stateline Technical Advisory Committee, and Oregon Department of Energy.
Young, D., and W. Erickson. 2003. Cumulative Impacts Analysis for Avian and Other Wildlife Resources from Proposed Wind Projects in Kittitas County Washington. Prepared for Kittitas County. October 2003
Young, D. P., Victoria, K. P., and K. Bay. 2007. Ecological Baseline Studies Report Proposed Dry Lake Wind Project Navajo County Arizona. Prepared for PPM Energy. June 20.
Young, D. P., Johnson, G. D., Poulton, V. K., and K. Bay. 2007a. Ecological Baseline Studies for the Hatchet Ridge Wind Energy Project Shasta County California. Prepared from Hatchet Ridge Wind. August 2007.
January 2009 18
2007-2008 Avian Survey Tule Wind Resource Area
Young, D., W. Erickson, K. Bay, R. Good, and K Kronner. 2002. Baseline Avian Studies for the Proposed Maiden Wind Farm, Yakima and Benton Counties, Washington. Final Report prepared for Bonneville Power Administration.
Young, D., W. Erickson, J. D. Jeffery, K. Bay, and M. Bourassa. 2002a. Avian and Sensitive Species Baseline Study Plan and Interim Report TPC Combine Hills Turbine Ranch Umatilla County Oregon. Prepared for Tomen Power Corporation.
Susan Hurley/ Rich Young 12/16/08 Report Author Date
Karl Kosciuch 12/31/08 Peer Review #1 Date
Lynn Sharp 12/31/08 Peer Review #2 Date
January 2009 19
2007-2008 Avian Survey Tule Wind Resource Area
TABLES
January 2009

DateSurvey Number
Table 1. Tule Wind Resource Area 2007-2008 point count survey dates.
Fall 20079/13/0719/21/0719/26/0729/27/0729/28/07210/4/07210/5/07310/10/07310/11/07310/17/07310/18/07310/19/07310/25/07410/26/07410/31/07411/1/07411/14/07511/15/07511/16/075
Winter 200711/19/07111/20/07111/28/07211/29/07212/6/07212/12/07312/13/07312/14/07312/27/07412/28/07412/29/0741/9/0851/10/0851/11/0851/16/0861/17/086

DateSurvey Number
Table 1. Tule Wind Resource Area 2007-2008 point count survey dates.
1/23/0861/24/0861/30/0871/31/0872/6/0872/7/0872/13/0882/21/0882/27/0892/28/0893/7/0893/8/089
Spring 20083/12/0813/13/0813/22/0813/23/0813/24/0813/28/0823/29/0823/31/0824/1/0824/10/0834/11/0834/17/0834/18/0834/26/0844/29/0844/30/0845/1/0845/2/0845/8/0855/9/0855/15/0855/16/0855/22/0865/29/086
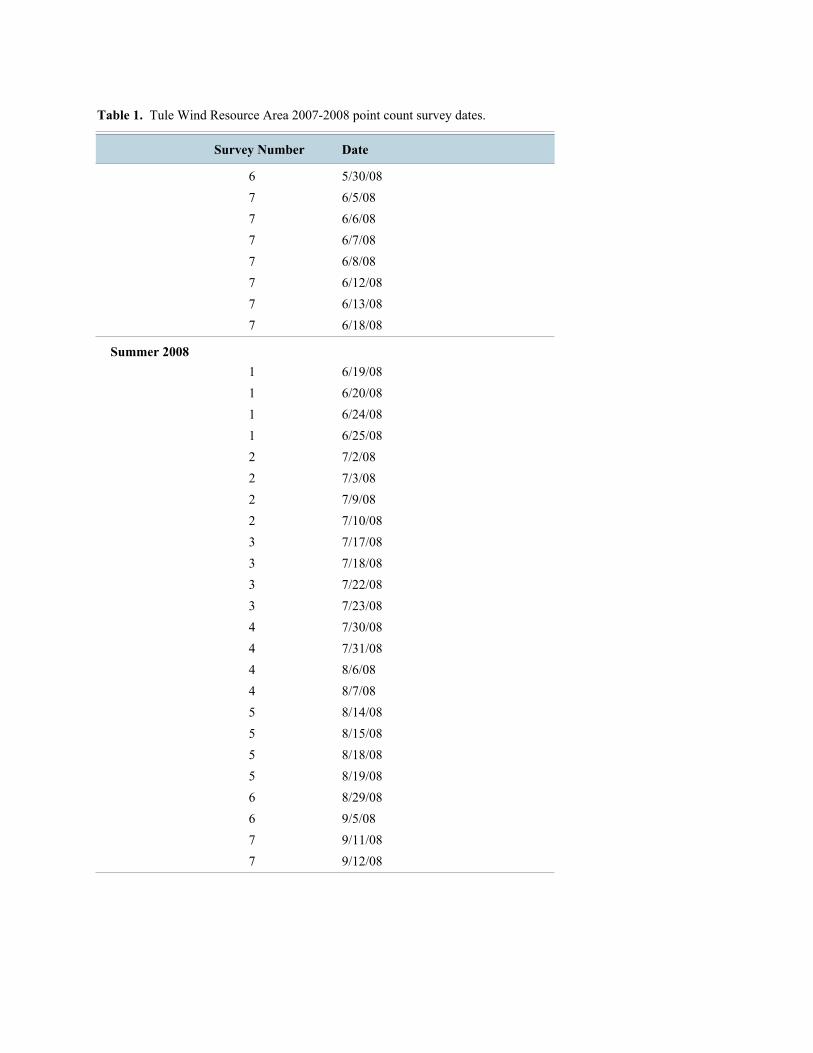
DateSurvey Number
Table 1. Tule Wind Resource Area 2007-2008 point count survey dates.
5/30/0866/5/0876/6/0876/7/0876/8/0876/12/0876/13/0876/18/087
Summer 20086/19/0816/20/0816/24/0816/25/0817/2/0827/3/0827/9/0827/10/0827/17/0837/18/0837/22/0837/23/0837/30/0847/31/0848/6/0848/7/0848/14/0858/15/0858/18/0858/19/0858/29/0869/5/0869/11/0879/12/087

Species
Fall 2007 Winter 2007-2008
Table 2. Avian species observed during point count surveys at the Tule Wind Resource Area, 2007-2008.
Spring 2008 Summer 2008
#Birds
#Obs.
MeanUse*
Overall
#Birds
#Obs.
MeanUse*
#Birds
#Obs.
MeanUse*
#Birds
#Obs.
MeanUse*
#Birds
#Obs.
MeanUse*
western scrub-jay 149 2.56256122 1.36146147 1.39190118 2.01137 729 536 1.77common raven 29 0.616192 1.3314262 0.7310047 1.3793 396 230 0.96white-throated swift 18 0.959510 0.32347 0.081115 1.0974 214 50 0.52red-tailed hawk 41 0.484840 0.464965 0.527129 0.5034 202 175 0.49house finch 58 1.1511523 0.38417 0.08119 0.2416 183 97 0.44turkey vulture 56 0.878751 0.56608 0.07108 0.139 166 123 0.40California towhee 44 0.555536 0.363929 0.253419 0.3423 151 128 0.37wrentit 43 0.545443 0.414422 0.172328 0.4329 150 136 0.36Vaux's swift 0 0.0000 0.0000 0.0007 1.99135 135 7 0.33spotted towhee 31 0.343459 0.576117 0.15206 0.096 121 113 0.29California thrasher 11 0.141435 0.343641 0.31436 0.096 99 93 0.24bushtit 3 0.32323 0.12133 0.17232 0.2215 83 11 0.20Bewick's wren 16 0.191940 0.37409 0.071011 0.1611 80 76 0.19lesser goldfinch 17 0.53533 0.0553 0.0467 0.1913 77 30 0.19mourning dove 33 0.444422 0.23253 0.0230 0.000 72 58 0.17western bluebird 6 0.14142 0.0449 0.25343 0.2819 71 20 0.17California quail 8 0.131317 0.21236 0.09133 0.2920 69 34 0.17phainopepla 35 0.44445 0.09103 0.0232 0.032 59 45 0.14black-throated sparrow 22 0.292918 0.19203 0.0450 0.000 54 43 0.13northern flicker 17 0.17179 0.091011 0.09125 0.096 45 42 0.11unidentified hummingbird 29 0.35353 0.0440 0.0004 0.064 43 36 0.10acorn woodpecker 13 0.23236 0.09102 0.0461 0.032 41 22 0.10
* Mean use=# birds/30 min.
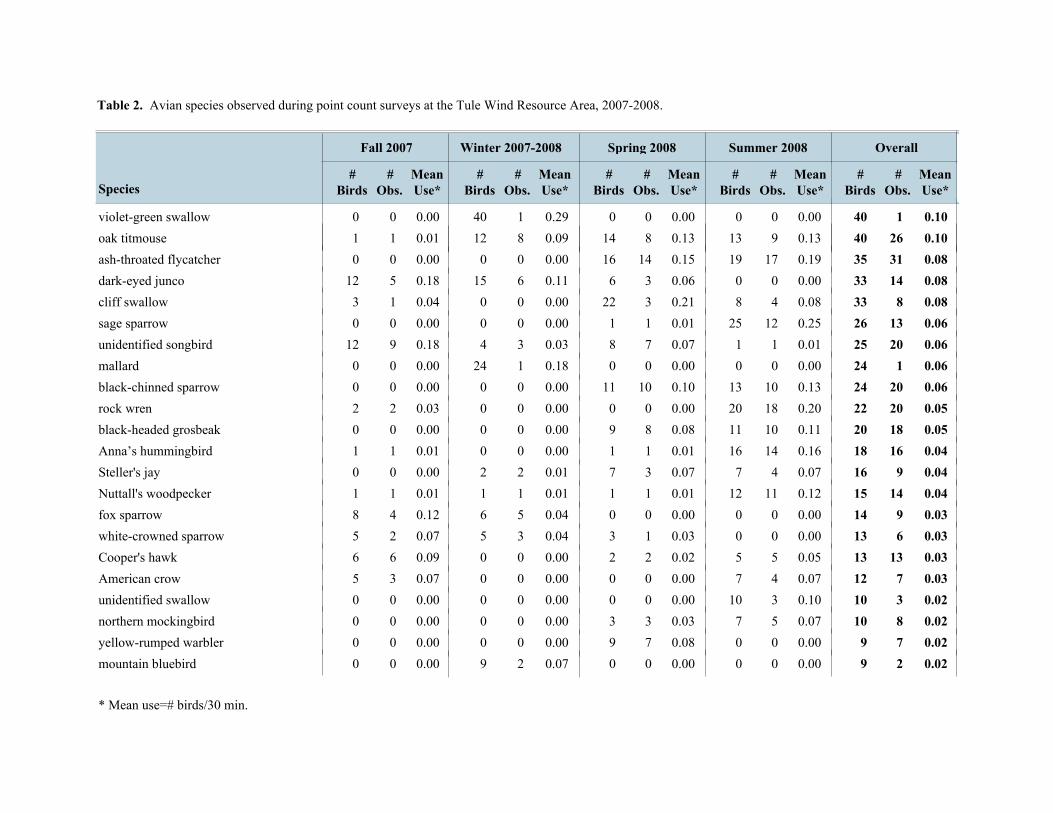
Species
Fall 2007 Winter 2007-2008
Table 2. Avian species observed during point count surveys at the Tule Wind Resource Area, 2007-2008.
Spring 2008 Summer 2008
#Birds
#Obs.
MeanUse*
Overall
#Birds
#Obs.
MeanUse*
#Birds
#Obs.
MeanUse*
#Birds
#Obs.
MeanUse*
#Birds
#Obs.
MeanUse*
violet-green swallow 0 0.0000 0.0001 0.29400 0.000 40 1 0.10oak titmouse 9 0.13138 0.13148 0.09121 0.011 40 26 0.10ash-throated flycatcher 17 0.191914 0.15160 0.0000 0.000 35 31 0.08dark-eyed junco 0 0.0003 0.0666 0.11155 0.1812 33 14 0.08cliff swallow 4 0.0883 0.21220 0.0001 0.043 33 8 0.08sage sparrow 12 0.25251 0.0110 0.0000 0.000 26 13 0.06unidentified songbird 1 0.0117 0.0783 0.0349 0.1812 25 20 0.06mallard 0 0.0000 0.0001 0.18240 0.000 24 1 0.06black-chinned sparrow 10 0.131310 0.10110 0.0000 0.000 24 20 0.06rock wren 18 0.20200 0.0000 0.0002 0.032 22 20 0.05black-headed grosbeak 10 0.11118 0.0890 0.0000 0.000 20 18 0.05Anna’s hummingbird 14 0.16161 0.0110 0.0001 0.011 18 16 0.04Steller's jay 4 0.0773 0.0772 0.0120 0.000 16 9 0.04Nuttall's woodpecker 11 0.12121 0.0111 0.0111 0.011 15 14 0.04fox sparrow 0 0.0000 0.0005 0.0464 0.128 14 9 0.03white-crowned sparrow 0 0.0001 0.0333 0.0452 0.075 13 6 0.03Cooper's hawk 5 0.0552 0.0220 0.0006 0.096 13 13 0.03American crow 4 0.0770 0.0000 0.0003 0.075 12 7 0.03unidentified swallow 3 0.10100 0.0000 0.0000 0.000 10 3 0.02northern mockingbird 5 0.0773 0.0330 0.0000 0.000 10 8 0.02yellow-rumped warbler 0 0.0007 0.0890 0.0000 0.000 9 7 0.02mountain bluebird 0 0.0000 0.0002 0.0790 0.000 9 2 0.02
* Mean use=# birds/30 min.

Species
Fall 2007 Winter 2007-2008
Table 2. Avian species observed during point count surveys at the Tule Wind Resource Area, 2007-2008.
Spring 2008 Summer 2008
#Birds
#Obs.
MeanUse*
Overall
#Birds
#Obs.
MeanUse*
#Birds
#Obs.
MeanUse*
#Birds
#Obs.
MeanUse*
#Birds
#Obs.
MeanUse*
black-chinned hummingbird 2 0.0227 0.0770 0.0000 0.000 9 9 0.02Lawrence’s goldfinch 4 0.0880 0.0000 0.0000 0.000 8 4 0.02northern rough-winged swallow 1 0.0220 0.0000 0.0001 0.075 7 2 0.02ladder-backed woodpecker 3 0.0330 0.0004 0.0340 0.000 7 7 0.02American kestrel 2 0.0222 0.0222 0.0121 0.011 7 7 0.02western tanager 3 0.0660 0.0000 0.0000 0.000 6 3 0.01unidentified sparrow 4 0.0550 0.0000 0.0001 0.011 6 5 0.01barn swallow 1 0.0110 0.0000 0.0002 0.075 6 3 0.01western kingbird 5 0.0550 0.0000 0.0000 0.000 5 5 0.01unidentified raptor 0 0.0000 0.0003 0.0231 0.032 5 4 0.01ruby-crowned kinglet 0 0.0002 0.0221 0.0112 0.032 5 5 0.01orange-crowned warbler 0 0.0005 0.0550 0.0000 0.000 5 5 0.01mountain chickadee 0 0.0001 0.0111 0.0340 0.000 5 2 0.01house wren 4 0.0441 0.0110 0.0000 0.000 5 5 0.01horned lark 0 0.0002 0.0550 0.0000 0.000 5 2 0.01Wilson's warbler 2 0.0222 0.0220 0.0000 0.000 4 4 0.01western wood-pewee 2 0.0221 0.0220 0.0000 0.000 4 3 0.01Scott's oriole 2 0.0222 0.0220 0.0000 0.000 4 4 0.01blue-gray gnatcatcher 2 0.0221 0.0220 0.0000 0.000 4 3 0.01unidentified gull 0 0.0000 0.0001 0.0230 0.000 3 1 0.01pacific-slope flycatcher 2 0.0221 0.0110 0.0000 0.000 3 3 0.01northern harrier 0 0.0000 0.0002 0.0121 0.011 3 3 0.01
* Mean use=# birds/30 min.

Species
Fall 2007 Winter 2007-2008
Table 2. Avian species observed during point count surveys at the Tule Wind Resource Area, 2007-2008.
Spring 2008 Summer 2008
#Birds
#Obs.
MeanUse*
Overall
#Birds
#Obs.
MeanUse*
#Birds
#Obs.
MeanUse*
#Birds
#Obs.
MeanUse*
#Birds
#Obs.
MeanUse*
unidentified falcon 1 0.0220 0.0000 0.0000 0.000 2 1 0.00unidentified empidonax flycatcher 1 0.0111 0.0110 0.0000 0.000 2 2 0.00Townsend's Warbler 0 0.0002 0.0220 0.0000 0.000 2 2 0.00sharp-shinned hawk 1 0.0110 0.0000 0.0001 0.011 2 2 0.00savannah sparrow 1 0.0220 0.0000 0.0000 0.000 2 1 0.00golden eagle 0 0.0001 0.0110 0.0001 0.011 2 2 0.00canyon wren 1 0.0111 0.0110 0.0000 0.000 2 2 0.00band-tailed pigeon 1 0.0110 0.0001 0.0110 0.000 2 2 0.00yellow warbler 1 0.0110 0.0000 0.0000 0.000 1 1 0.00unidentified piranga tanager 0 0.0000 0.0000 0.0001 0.011 1 1 0.00unidentified woodpecker 1 0.0110 0.0000 0.0000 0.000 1 1 0.00unidentified warbler 1 0.0110 0.0000 0.0000 0.000 1 1 0.00unidentified quail 0 0.0000 0.0000 0.0001 0.011 1 1 0.00Say's phoebe 1 0.0110 0.0000 0.0000 0.000 1 1 0.00rufous-crowned sparrow 1 0.0110 0.0000 0.0000 0.000 1 1 0.00prairie falcon 0 0.0001 0.0110 0.0000 0.000 1 1 0.00osprey 0 0.0001 0.0110 0.0000 0.000 1 1 0.00Nashville warbler 0 0.0001 0.0110 0.0000 0.000 1 1 0.00loggerhead shrike 0 0.0000 0.0000 0.0001 0.011 1 1 0.00Hammond’s flycatcher 0 0.0001 0.0110 0.0000 0.000 1 1 0.00downy woodpecker 0 0.0001 0.0110 0.0000 0.000 1 1 0.00double-crested cormorant 0 0.0001 0.0110 0.0000 0.000 1 1 0.00
* Mean use=# birds/30 min.
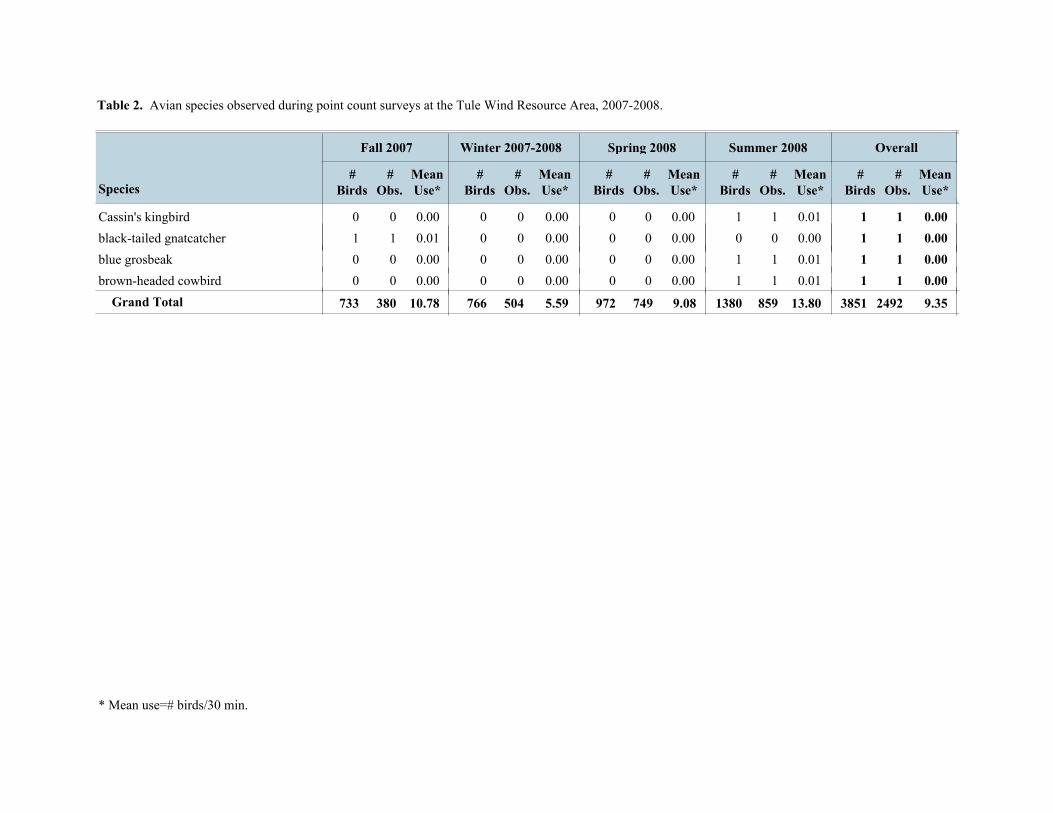
Species
Fall 2007 Winter 2007-2008
Table 2. Avian species observed during point count surveys at the Tule Wind Resource Area, 2007-2008.
Spring 2008 Summer 2008
#Birds
#Obs.
MeanUse*
Overall
#Birds
#Obs.
MeanUse*
#Birds
#Obs.
MeanUse*
#Birds
#Obs.
MeanUse*
#Birds
#Obs.
MeanUse*
Cassin's kingbird 1 0.0110 0.0000 0.0000 0.000 1 1 0.00black-tailed gnatcatcher 0 0.0000 0.0000 0.0001 0.011 1 1 0.00blue grosbeak 1 0.0110 0.0000 0.0000 0.000 1 1 0.00brown-headed cowbird 1 0.0110 0.0000 0.0000 0.000 1 1 0.00
Grand Total 8591380 13.80749972 9.08504766 5.59380733 10.78 3851 2492 9.35
* Mean use=# birds/30 min.
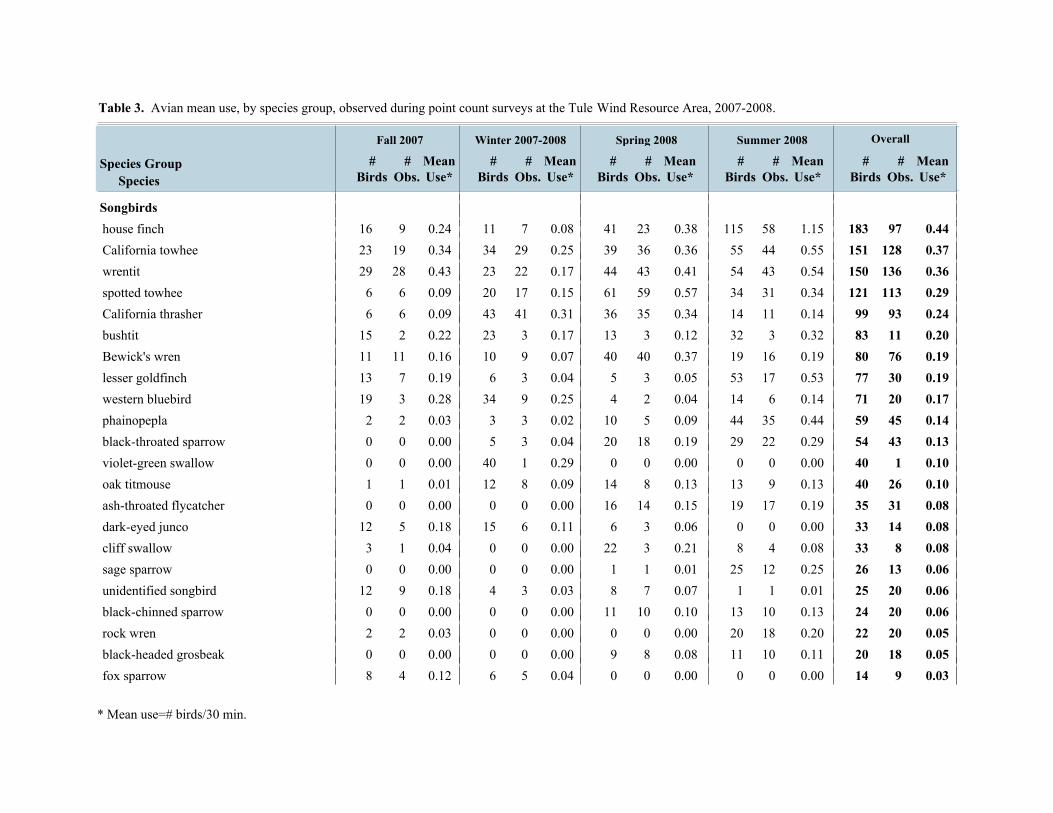
Table 3. Avian mean use, by species group, observed during point count surveys at the Tule Wind Resource Area, 2007-2008.
SpeciesSpecies Group
Fall 2007 Winter 2007-2008 Summer 2008Spring 2008
#Birds
#Obs.
MeanUse*
Overall
#Birds
#Obs.
MeanUse*
#Birds
#Obs.
MeanUse*
#Birds
#Obs.
MeanUse*
#Birds
#Obs.
MeanUse*
Songbirds16house finch 58 1.1511523 0.38417 0.08119 0.24 97 0.4418323California towhee 44 0.555536 0.363929 0.253419 0.34 128 0.3715129wrentit 43 0.545443 0.414422 0.172328 0.43 136 0.361506spotted towhee 31 0.343459 0.576117 0.15206 0.09 113 0.291216California thrasher 11 0.141435 0.343641 0.31436 0.09 93 0.2499
15bushtit 3 0.32323 0.12133 0.17232 0.22 11 0.208311Bewick's wren 16 0.191940 0.37409 0.071011 0.16 76 0.198013lesser goldfinch 17 0.53533 0.0553 0.0467 0.19 30 0.197719western bluebird 6 0.14142 0.0449 0.25343 0.28 20 0.17712phainopepla 35 0.44445 0.09103 0.0232 0.03 45 0.14590black-throated sparrow 22 0.292918 0.19203 0.0450 0.00 43 0.13540violet-green swallow 0 0.0000 0.0001 0.29400 0.00 1 0.10401oak titmouse 9 0.13138 0.13148 0.09121 0.01 26 0.10400ash-throated flycatcher 17 0.191914 0.15160 0.0000 0.00 31 0.0835
12dark-eyed junco 0 0.0003 0.0666 0.11155 0.18 14 0.08333cliff swallow 4 0.0883 0.21220 0.0001 0.04 8 0.08330sage sparrow 12 0.25251 0.0110 0.0000 0.00 13 0.0626
12unidentified songbird 1 0.0117 0.0783 0.0349 0.18 20 0.06250black-chinned sparrow 10 0.131310 0.10110 0.0000 0.00 20 0.06242rock wren 18 0.20200 0.0000 0.0002 0.03 20 0.05220black-headed grosbeak 10 0.11118 0.0890 0.0000 0.00 18 0.05208fox sparrow 0 0.0000 0.0005 0.0464 0.12 9 0.0314
* Mean use=# birds/30 min.
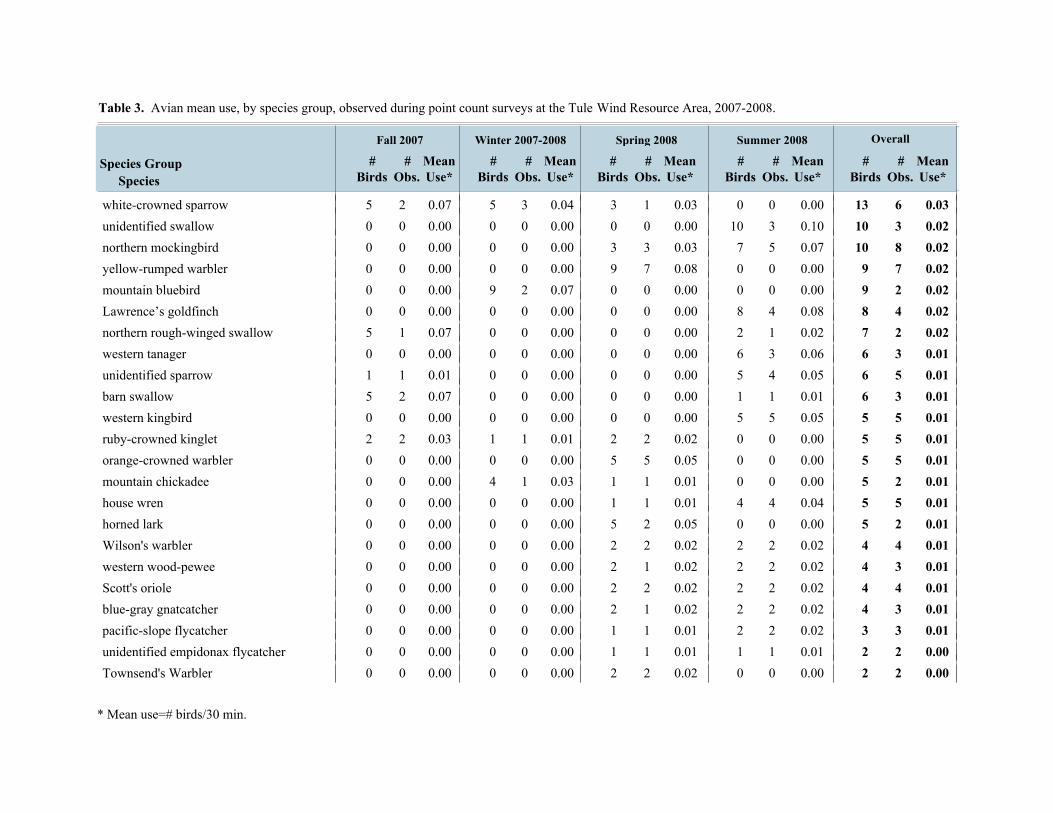
Table 3. Avian mean use, by species group, observed during point count surveys at the Tule Wind Resource Area, 2007-2008.
SpeciesSpecies Group
Fall 2007 Winter 2007-2008 Summer 2008Spring 2008
#Birds
#Obs.
MeanUse*
Overall
#Birds
#Obs.
MeanUse*
#Birds
#Obs.
MeanUse*
#Birds
#Obs.
MeanUse*
#Birds
#Obs.
MeanUse*
5white-crowned sparrow 0 0.0001 0.0333 0.0452 0.07 6 0.03130unidentified swallow 3 0.10100 0.0000 0.0000 0.00 3 0.02100northern mockingbird 5 0.0773 0.0330 0.0000 0.00 8 0.02100yellow-rumped warbler 0 0.0007 0.0890 0.0000 0.00 7 0.0290mountain bluebird 0 0.0000 0.0002 0.0790 0.00 2 0.0290Lawrence’s goldfinch 4 0.0880 0.0000 0.0000 0.00 4 0.0285northern rough-winged swallow 1 0.0220 0.0000 0.0001 0.07 2 0.0270western tanager 3 0.0660 0.0000 0.0000 0.00 3 0.0161unidentified sparrow 4 0.0550 0.0000 0.0001 0.01 5 0.0165barn swallow 1 0.0110 0.0000 0.0002 0.07 3 0.0160western kingbird 5 0.0550 0.0000 0.0000 0.00 5 0.0152ruby-crowned kinglet 0 0.0002 0.0221 0.0112 0.03 5 0.0150orange-crowned warbler 0 0.0005 0.0550 0.0000 0.00 5 0.0150mountain chickadee 0 0.0001 0.0111 0.0340 0.00 2 0.0150house wren 4 0.0441 0.0110 0.0000 0.00 5 0.0150horned lark 0 0.0002 0.0550 0.0000 0.00 2 0.0150Wilson's warbler 2 0.0222 0.0220 0.0000 0.00 4 0.0140western wood-pewee 2 0.0221 0.0220 0.0000 0.00 3 0.0140Scott's oriole 2 0.0222 0.0220 0.0000 0.00 4 0.0140blue-gray gnatcatcher 2 0.0221 0.0220 0.0000 0.00 3 0.0140pacific-slope flycatcher 2 0.0221 0.0110 0.0000 0.00 3 0.0130unidentified empidonax flycatcher 1 0.0111 0.0110 0.0000 0.00 2 0.0020Townsend's Warbler 0 0.0002 0.0220 0.0000 0.00 2 0.002
* Mean use=# birds/30 min.

Table 3. Avian mean use, by species group, observed during point count surveys at the Tule Wind Resource Area, 2007-2008.
SpeciesSpecies Group
Fall 2007 Winter 2007-2008 Summer 2008Spring 2008
#Birds
#Obs.
MeanUse*
Overall
#Birds
#Obs.
MeanUse*
#Birds
#Obs.
MeanUse*
#Birds
#Obs.
MeanUse*
#Birds
#Obs.
MeanUse*
0savannah sparrow 1 0.0220 0.0000 0.0000 0.00 1 0.0020canyon wren 1 0.0111 0.0110 0.0000 0.00 2 0.0020yellow warbler 1 0.0110 0.0000 0.0000 0.00 1 0.0011unidentified piranga tanager 0 0.0000 0.0000 0.0001 0.01 1 0.0010unidentified warbler 1 0.0110 0.0000 0.0000 0.00 1 0.0010Say's phoebe 1 0.0110 0.0000 0.0000 0.00 1 0.0010rufous-crowned sparrow 1 0.0110 0.0000 0.0000 0.00 1 0.0010Nashville warbler 0 0.0001 0.0110 0.0000 0.00 1 0.0011loggerhead shrike 0 0.0000 0.0000 0.0001 0.01 1 0.0010Hammond’s flycatcher 0 0.0001 0.0110 0.0000 0.00 1 0.0010Cassin's kingbird 1 0.0110 0.0000 0.0000 0.00 1 0.0011black-tailed gnatcatcher 0 0.0000 0.0000 0.0001 0.01 1 0.0010blue grosbeak 1 0.0110 0.0000 0.0000 0.00 1 0.0010brown-headed cowbird 1 0.0110 0.0000 0.0000 0.00 1 0.001
199Group Total 6.424176424.153564442.251763082.93126 3.8710751593
Crows and Allies137western scrub-jay 149 2.56256122 1.36146147 1.39190118 2.01 536 1.7772993common raven 29 0.616192 1.3314262 0.7310047 1.37 230 0.963960Steller's jay 4 0.0773 0.0772 0.0120 0.00 9 0.04165American crow 4 0.0770 0.0000 0.0003 0.07 7 0.0312
235Group Total 3.311863312.762172952.132112923.46168 2.807821153
Swifts/Hummingbirds74white-throated swift 18 0.959510 0.32347 0.081115 1.09 50 0.52214
* Mean use=# birds/30 min.
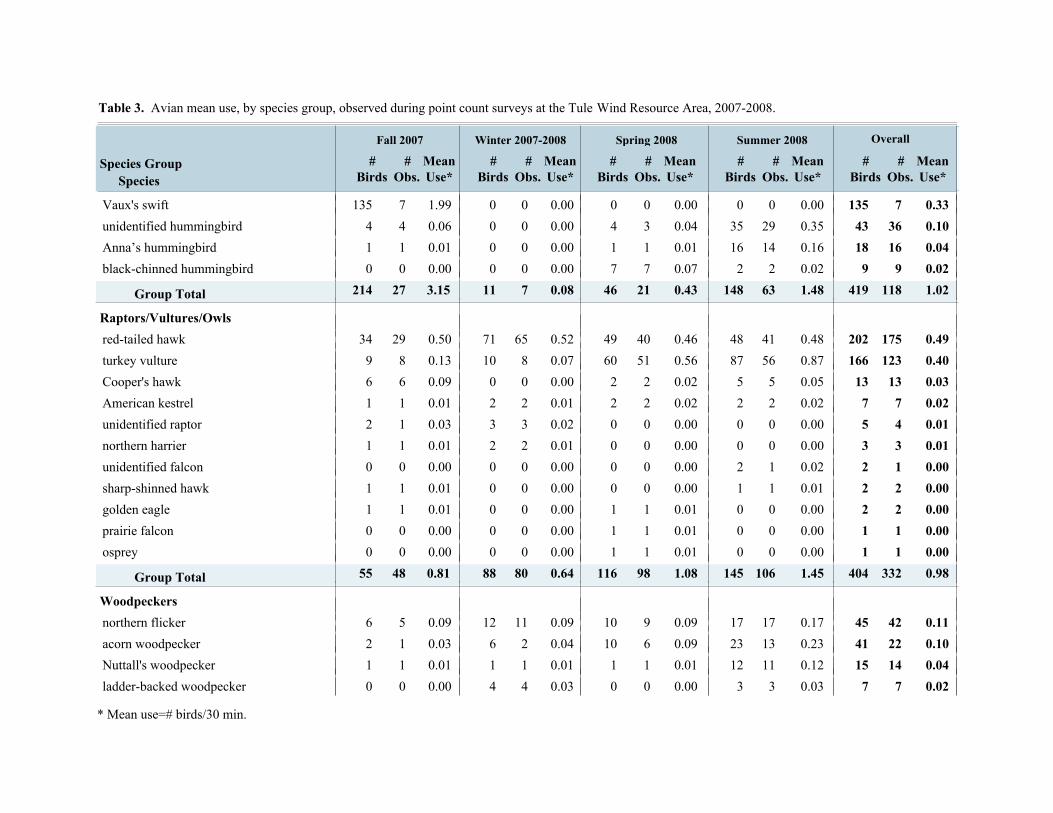
Table 3. Avian mean use, by species group, observed during point count surveys at the Tule Wind Resource Area, 2007-2008.
SpeciesSpecies Group
Fall 2007 Winter 2007-2008 Summer 2008Spring 2008
#Birds
#Obs.
MeanUse*
Overall
#Birds
#Obs.
MeanUse*
#Birds
#Obs.
MeanUse*
#Birds
#Obs.
MeanUse*
#Birds
#Obs.
MeanUse*
135Vaux's swift 0 0.0000 0.0000 0.0007 1.99 7 0.331354unidentified hummingbird 29 0.35353 0.0440 0.0004 0.06 36 0.10431Anna’s hummingbird 14 0.16161 0.0110 0.0001 0.01 16 0.04180black-chinned hummingbird 2 0.0227 0.0770 0.0000 0.00 9 0.029
214Group Total 1.48631480.4321460.087113.1527 1.02118419
Raptors/Vultures/Owls34red-tailed hawk 41 0.484840 0.464965 0.527129 0.50 175 0.492029turkey vulture 56 0.878751 0.56608 0.07108 0.13 123 0.401666Cooper's hawk 5 0.0552 0.0220 0.0006 0.09 13 0.03131American kestrel 2 0.0222 0.0222 0.0121 0.01 7 0.0272unidentified raptor 0 0.0000 0.0003 0.0231 0.03 4 0.0151northern harrier 0 0.0000 0.0002 0.0121 0.01 3 0.0130unidentified falcon 1 0.0220 0.0000 0.0000 0.00 1 0.0021sharp-shinned hawk 1 0.0110 0.0000 0.0001 0.01 2 0.0021golden eagle 0 0.0001 0.0110 0.0001 0.01 2 0.0020prairie falcon 0 0.0001 0.0110 0.0000 0.00 1 0.0010osprey 0 0.0001 0.0110 0.0000 0.00 1 0.001
55Group Total 1.451061451.08981160.6480880.8148 0.98332404
Woodpeckers6northern flicker 17 0.17179 0.091011 0.09125 0.09 42 0.11452acorn woodpecker 13 0.23236 0.09102 0.0461 0.03 22 0.10411Nuttall's woodpecker 11 0.12121 0.0111 0.0111 0.01 14 0.04150ladder-backed woodpecker 3 0.0330 0.0004 0.0340 0.00 7 0.027
* Mean use=# birds/30 min.

Table 3. Avian mean use, by species group, observed during point count surveys at the Tule Wind Resource Area, 2007-2008.
SpeciesSpecies Group
Fall 2007 Winter 2007-2008 Summer 2008Spring 2008
#Birds
#Obs.
MeanUse*
Overall
#Birds
#Obs.
MeanUse*
#Birds
#Obs.
MeanUse*
#Birds
#Obs.
MeanUse*
#Birds
#Obs.
MeanUse*
0unidentified woodpecker 1 0.0110 0.0000 0.0000 0.00 1 0.0010downy woodpecker 0 0.0001 0.0110 0.0000 0.00 1 0.0019Group Total 0.5645560.2117220.1718230.137 0.2787110
Pigeons/Doves0mourning dove 33 0.444422 0.23253 0.0230 0.00 58 0.17720band-tailed pigeon 1 0.0110 0.0001 0.0110 0.00 2 0.0020Group Total 0.4534450.2322250.03440.000 0.186074
Gamebirds20California quail 8 0.131317 0.21236 0.09133 0.29 34 0.17691unidentified quail 0 0.0000 0.0000 0.0001 0.01 1 0.001
21Group Total 0.138130.2117230.096130.314 0.173570
Waterfowl0mallard 0 0.0000 0.0001 0.18240 0.00 1 0.06240Group Total 0.00000.00000.181240.000 0.06124
Gulls/Terns0unidentified gull 0 0.0000 0.0001 0.0230 0.00 1 0.0130Group Total 0.00000.00000.02130.000 0.0113
Waterbirds0double-crested cormorant 0 0.0001 0.0110 0.0000 0.00 1 0.0010Group Total 0.00000.01110.00000.000 0.0011
733Grand Total 8591380 13.80749972 9.08504766 5.59380 10.78 24923851 9.35
* Mean use=# birds/30 min.
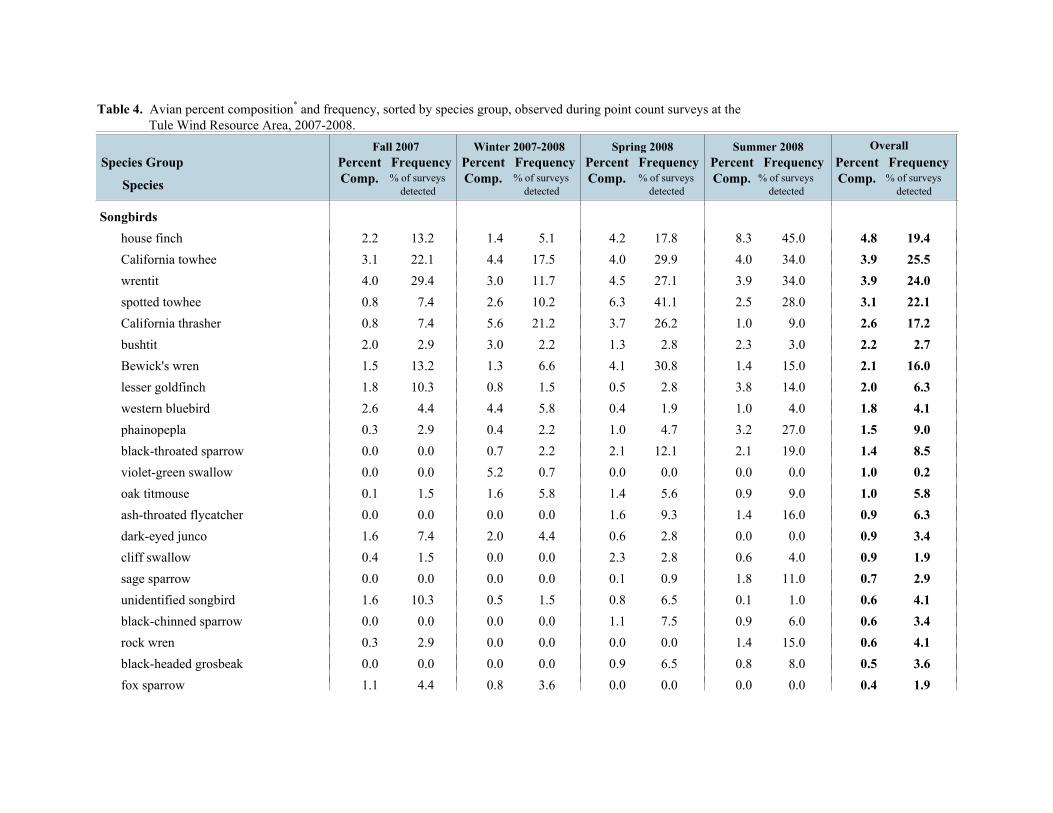
Table 4. Avian percent composition* and frequency, sorted by species group, observed during point count surveys at the Tule Wind Resource Area, 2007-2008.
Species
Species GroupFall 2007 Winter 2007-2008 Summer 2008Spring 2008
PercentComp.
Frequency PercentComp.
Frequency PercentComp.
Frequency PercentComp.
Frequency PercentComp.
FrequencyOverall
% of surveysdetected
% of surveysdetected
% of surveysdetected
% of surveysdetected
% of surveysdetected
Songbirdshouse finch 2.2 13.2 1.4 5.1 4.2 17.8 8.3 45.0 4.8 19.4California towhee 3.1 22.1 4.4 17.5 4.0 29.9 4.0 34.0 3.9 25.5wrentit 4.0 29.4 3.0 11.7 4.5 27.1 3.9 34.0 3.9 24.0spotted towhee 0.8 7.4 2.6 10.2 6.3 41.1 2.5 28.0 3.1 22.1California thrasher 0.8 7.4 5.6 21.2 3.7 26.2 1.0 9.0 2.6 17.2bushtit 2.0 2.9 3.0 2.2 1.3 2.8 2.3 3.0 2.2 2.7Bewick's wren 1.5 13.2 1.3 6.6 4.1 30.8 1.4 15.0 2.1 16.0lesser goldfinch 1.8 10.3 0.8 1.5 0.5 2.8 3.8 14.0 2.0 6.3western bluebird 2.6 4.4 4.4 5.8 0.4 1.9 1.0 4.0 1.8 4.1phainopepla 0.3 2.9 0.4 2.2 1.0 4.7 3.2 27.0 1.5 9.0black-throated sparrow 0.0 0.0 0.7 2.2 2.1 12.1 2.1 19.0 1.4 8.5violet-green swallow 0.0 0.0 5.2 0.7 0.0 0.0 0.0 0.0 1.0 0.2oak titmouse 0.1 1.5 1.6 5.8 1.4 5.6 0.9 9.0 1.0 5.8ash-throated flycatcher 0.0 0.0 0.0 0.0 1.6 9.3 1.4 16.0 0.9 6.3dark-eyed junco 1.6 7.4 2.0 4.4 0.6 2.8 0.0 0.0 0.9 3.4cliff swallow 0.4 1.5 0.0 0.0 2.3 2.8 0.6 4.0 0.9 1.9sage sparrow 0.0 0.0 0.0 0.0 0.1 0.9 1.8 11.0 0.7 2.9unidentified songbird 1.6 10.3 0.5 1.5 0.8 6.5 0.1 1.0 0.6 4.1black-chinned sparrow 0.0 0.0 0.0 0.0 1.1 7.5 0.9 6.0 0.6 3.4rock wren 0.3 2.9 0.0 0.0 0.0 0.0 1.4 15.0 0.6 4.1black-headed grosbeak 0.0 0.0 0.0 0.0 0.9 6.5 0.8 8.0 0.5 3.6fox sparrow 1.1 4.4 0.8 3.6 0.0 0.0 0.0 0.0 0.4 1.9
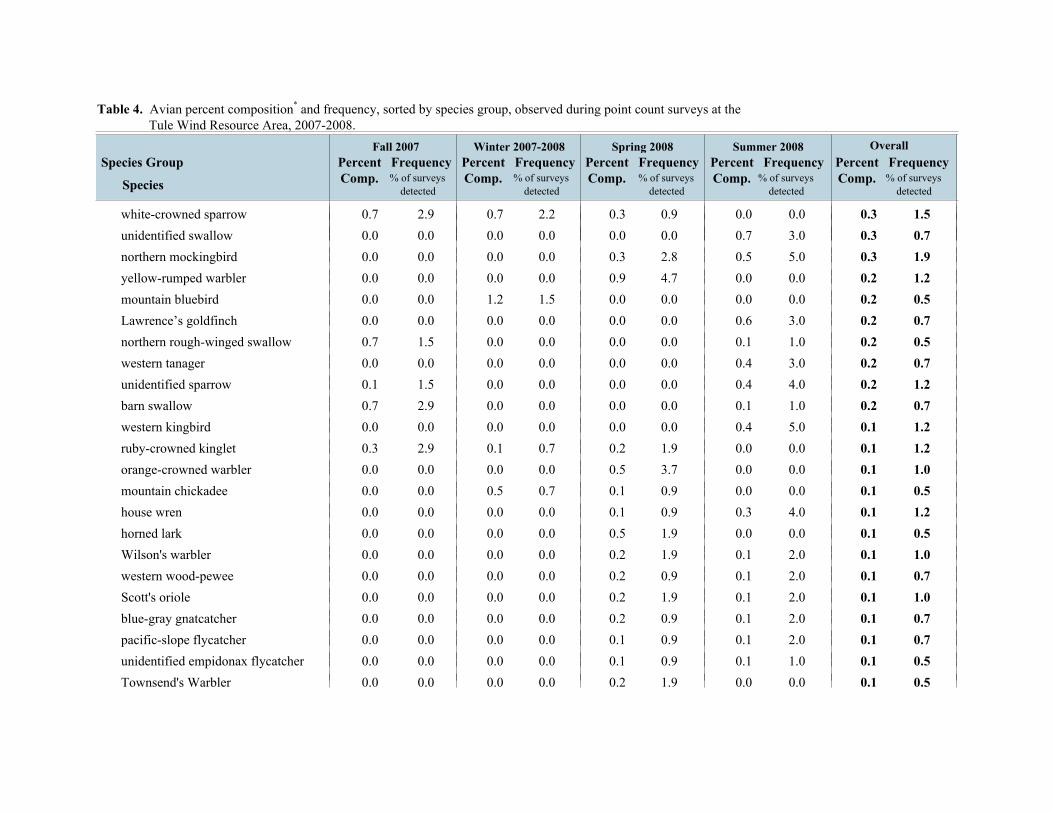
Table 4. Avian percent composition* and frequency, sorted by species group, observed during point count surveys at the Tule Wind Resource Area, 2007-2008.
Species
Species GroupFall 2007 Winter 2007-2008 Summer 2008Spring 2008
PercentComp.
Frequency PercentComp.
Frequency PercentComp.
Frequency PercentComp.
Frequency PercentComp.
FrequencyOverall
% of surveysdetected
% of surveysdetected
% of surveysdetected
% of surveysdetected
% of surveysdetected
white-crowned sparrow 0.7 2.9 0.7 2.2 0.3 0.9 0.0 0.0 0.3 1.5unidentified swallow 0.0 0.0 0.0 0.0 0.0 0.0 0.7 3.0 0.3 0.7northern mockingbird 0.0 0.0 0.0 0.0 0.3 2.8 0.5 5.0 0.3 1.9yellow-rumped warbler 0.0 0.0 0.0 0.0 0.9 4.7 0.0 0.0 0.2 1.2mountain bluebird 0.0 0.0 1.2 1.5 0.0 0.0 0.0 0.0 0.2 0.5Lawrence’s goldfinch 0.0 0.0 0.0 0.0 0.0 0.0 0.6 3.0 0.2 0.7northern rough-winged swallow 0.7 1.5 0.0 0.0 0.0 0.0 0.1 1.0 0.2 0.5western tanager 0.0 0.0 0.0 0.0 0.0 0.0 0.4 3.0 0.2 0.7unidentified sparrow 0.1 1.5 0.0 0.0 0.0 0.0 0.4 4.0 0.2 1.2barn swallow 0.7 2.9 0.0 0.0 0.0 0.0 0.1 1.0 0.2 0.7western kingbird 0.0 0.0 0.0 0.0 0.0 0.0 0.4 5.0 0.1 1.2ruby-crowned kinglet 0.3 2.9 0.1 0.7 0.2 1.9 0.0 0.0 0.1 1.2orange-crowned warbler 0.0 0.0 0.0 0.0 0.5 3.7 0.0 0.0 0.1 1.0mountain chickadee 0.0 0.0 0.5 0.7 0.1 0.9 0.0 0.0 0.1 0.5house wren 0.0 0.0 0.0 0.0 0.1 0.9 0.3 4.0 0.1 1.2horned lark 0.0 0.0 0.0 0.0 0.5 1.9 0.0 0.0 0.1 0.5Wilson's warbler 0.0 0.0 0.0 0.0 0.2 1.9 0.1 2.0 0.1 1.0western wood-pewee 0.0 0.0 0.0 0.0 0.2 0.9 0.1 2.0 0.1 0.7Scott's oriole 0.0 0.0 0.0 0.0 0.2 1.9 0.1 2.0 0.1 1.0blue-gray gnatcatcher 0.0 0.0 0.0 0.0 0.2 0.9 0.1 2.0 0.1 0.7pacific-slope flycatcher 0.0 0.0 0.0 0.0 0.1 0.9 0.1 2.0 0.1 0.7unidentified empidonax flycatcher 0.0 0.0 0.0 0.0 0.1 0.9 0.1 1.0 0.1 0.5Townsend's Warbler 0.0 0.0 0.0 0.0 0.2 1.9 0.0 0.0 0.1 0.5
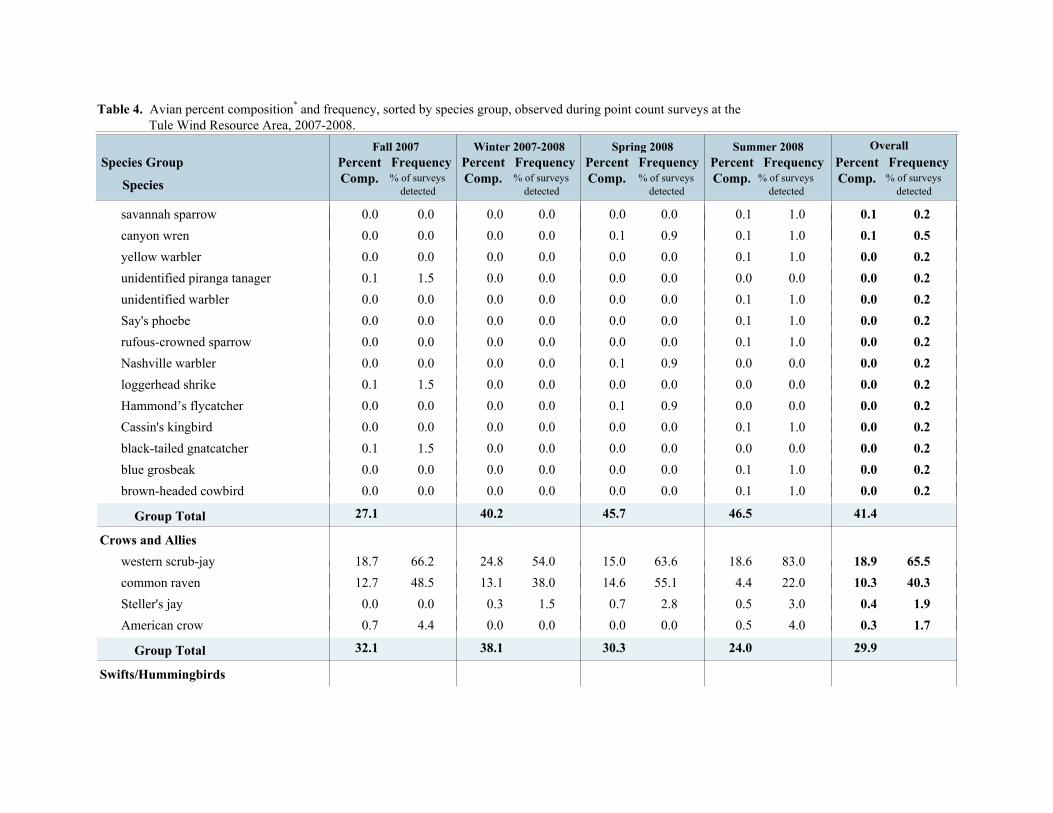
Table 4. Avian percent composition* and frequency, sorted by species group, observed during point count surveys at the Tule Wind Resource Area, 2007-2008.
Species
Species GroupFall 2007 Winter 2007-2008 Summer 2008Spring 2008
PercentComp.
Frequency PercentComp.
Frequency PercentComp.
Frequency PercentComp.
Frequency PercentComp.
FrequencyOverall
% of surveysdetected
% of surveysdetected
% of surveysdetected
% of surveysdetected
% of surveysdetected
savannah sparrow 0.0 0.0 0.0 0.0 0.0 0.0 0.1 1.0 0.1 0.2canyon wren 0.0 0.0 0.0 0.0 0.1 0.9 0.1 1.0 0.1 0.5yellow warbler 0.0 0.0 0.0 0.0 0.0 0.0 0.1 1.0 0.0 0.2unidentified piranga tanager 0.1 1.5 0.0 0.0 0.0 0.0 0.0 0.0 0.0 0.2unidentified warbler 0.0 0.0 0.0 0.0 0.0 0.0 0.1 1.0 0.0 0.2Say's phoebe 0.0 0.0 0.0 0.0 0.0 0.0 0.1 1.0 0.0 0.2rufous-crowned sparrow 0.0 0.0 0.0 0.0 0.0 0.0 0.1 1.0 0.0 0.2Nashville warbler 0.0 0.0 0.0 0.0 0.1 0.9 0.0 0.0 0.0 0.2loggerhead shrike 0.1 1.5 0.0 0.0 0.0 0.0 0.0 0.0 0.0 0.2Hammond’s flycatcher 0.0 0.0 0.0 0.0 0.1 0.9 0.0 0.0 0.0 0.2Cassin's kingbird 0.0 0.0 0.0 0.0 0.0 0.0 0.1 1.0 0.0 0.2black-tailed gnatcatcher 0.1 1.5 0.0 0.0 0.0 0.0 0.0 0.0 0.0 0.2blue grosbeak 0.0 0.0 0.0 0.0 0.0 0.0 0.1 1.0 0.0 0.2brown-headed cowbird 0.0 0.0 0.0 0.0 0.0 0.0 0.1 1.0 0.0 0.2
Group Total 27.1 40.2 45.7 46.5 41.4
Crows and Allieswestern scrub-jay 18.7 66.2 24.8 54.0 15.0 63.6 18.6 83.0 18.9 65.5common raven 12.7 48.5 13.1 38.0 14.6 55.1 4.4 22.0 10.3 40.3Steller's jay 0.0 0.0 0.3 1.5 0.7 2.8 0.5 3.0 0.4 1.9American crow 0.7 4.4 0.0 0.0 0.0 0.0 0.5 4.0 0.3 1.7
Group Total 32.1 38.1 30.3 24.0 29.9
Swifts/Hummingbirds
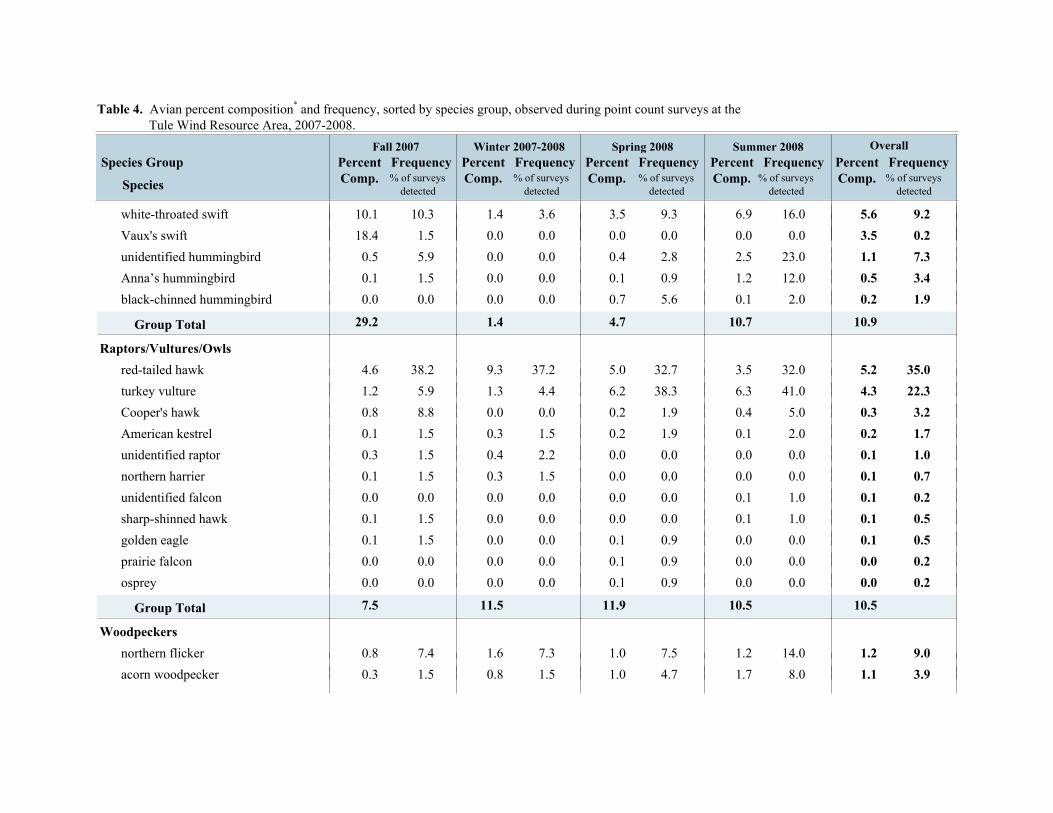
Table 4. Avian percent composition* and frequency, sorted by species group, observed during point count surveys at the Tule Wind Resource Area, 2007-2008.
Species
Species GroupFall 2007 Winter 2007-2008 Summer 2008Spring 2008
PercentComp.
Frequency PercentComp.
Frequency PercentComp.
Frequency PercentComp.
Frequency PercentComp.
FrequencyOverall
% of surveysdetected
% of surveysdetected
% of surveysdetected
% of surveysdetected
% of surveysdetected
white-throated swift 10.1 10.3 1.4 3.6 3.5 9.3 6.9 16.0 5.6 9.2Vaux's swift 18.4 1.5 0.0 0.0 0.0 0.0 0.0 0.0 3.5 0.2unidentified hummingbird 0.5 5.9 0.0 0.0 0.4 2.8 2.5 23.0 1.1 7.3Anna’s hummingbird 0.1 1.5 0.0 0.0 0.1 0.9 1.2 12.0 0.5 3.4black-chinned hummingbird 0.0 0.0 0.0 0.0 0.7 5.6 0.1 2.0 0.2 1.9
Group Total 29.2 1.4 4.7 10.7 10.9
Raptors/Vultures/Owlsred-tailed hawk 4.6 38.2 9.3 37.2 5.0 32.7 3.5 32.0 5.2 35.0turkey vulture 1.2 5.9 1.3 4.4 6.2 38.3 6.3 41.0 4.3 22.3Cooper's hawk 0.8 8.8 0.0 0.0 0.2 1.9 0.4 5.0 0.3 3.2American kestrel 0.1 1.5 0.3 1.5 0.2 1.9 0.1 2.0 0.2 1.7unidentified raptor 0.3 1.5 0.4 2.2 0.0 0.0 0.0 0.0 0.1 1.0northern harrier 0.1 1.5 0.3 1.5 0.0 0.0 0.0 0.0 0.1 0.7unidentified falcon 0.0 0.0 0.0 0.0 0.0 0.0 0.1 1.0 0.1 0.2sharp-shinned hawk 0.1 1.5 0.0 0.0 0.0 0.0 0.1 1.0 0.1 0.5golden eagle 0.1 1.5 0.0 0.0 0.1 0.9 0.0 0.0 0.1 0.5prairie falcon 0.0 0.0 0.0 0.0 0.1 0.9 0.0 0.0 0.0 0.2osprey 0.0 0.0 0.0 0.0 0.1 0.9 0.0 0.0 0.0 0.2
Group Total 7.5 11.5 11.9 10.5 10.5
Woodpeckersnorthern flicker 0.8 7.4 1.6 7.3 1.0 7.5 1.2 14.0 1.2 9.0acorn woodpecker 0.3 1.5 0.8 1.5 1.0 4.7 1.7 8.0 1.1 3.9

Table 4. Avian percent composition* and frequency, sorted by species group, observed during point count surveys at the Tule Wind Resource Area, 2007-2008.
Species
Species GroupFall 2007 Winter 2007-2008 Summer 2008Spring 2008
PercentComp.
Frequency PercentComp.
Frequency PercentComp.
Frequency PercentComp.
Frequency PercentComp.
FrequencyOverall
% of surveysdetected
% of surveysdetected
% of surveysdetected
% of surveysdetected
% of surveysdetected
Nuttall's woodpecker 0.1 1.5 0.1 0.7 0.1 0.9 0.9 11.0 0.4 3.4ladder-backed woodpecker 0.0 0.0 0.5 2.9 0.0 0.0 0.2 3.0 0.2 1.7unidentified woodpecker 0.0 0.0 0.0 0.0 0.0 0.0 0.1 1.0 0.0 0.2downy woodpecker 0.0 0.0 0.0 0.0 0.1 0.9 0.0 0.0 0.0 0.2
Group Total 1.2 3.0 2.3 4.1 2.9
Pigeons/Dovesmourning dove 0.0 0.0 0.4 1.5 2.6 15.0 3.2 28.0 1.9 11.2band-tailed pigeon 0.0 0.0 0.1 0.7 0.0 0.0 0.1 1.0 0.1 0.5
Group Total 0.0 0.5 2.6 3.3 1.9
GamebirdsCalifornia quail 2.7 4.4 1.7 3.6 2.4 15.9 0.9 8.0 1.8 8.0unidentified quail 0.1 1.5 0.0 0.0 0.0 0.0 0.0 0.0 0.0 0.2
Group Total 2.9 1.7 2.4 0.9 1.8
Waterfowlmallard 0.0 0.0 3.1 0.7 0.0 0.0 0.0 0.0 0.6 0.2
Group Total 0.0 3.1 0.0 0.0 0.6
Gulls/Ternsunidentified gull 0.0 0.0 0.4 0.7 0.0 0.0 0.0 0.0 0.1 0.2
Group Total 0.0 0.4 0.0 0.0 0.1
Waterbirdsdouble-crested cormorant 0.0 0.0 0.0 0.0 0.1 0.9 0.0 0.0 0.0 0.2
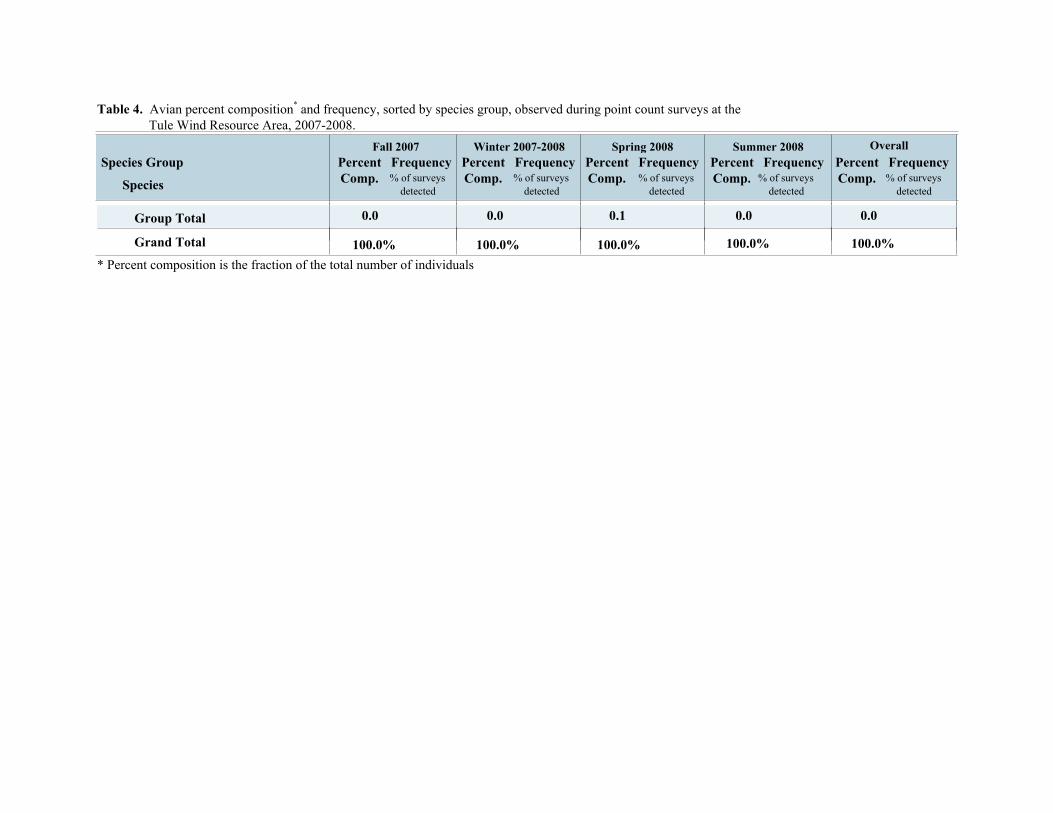
Table 4. Avian percent composition* and frequency, sorted by species group, observed during point count surveys at the Tule Wind Resource Area, 2007-2008.
Species
Species GroupFall 2007 Winter 2007-2008 Summer 2008Spring 2008
PercentComp.
Frequency PercentComp.
Frequency PercentComp.
Frequency PercentComp.
Frequency PercentComp.
FrequencyOverall
% of surveysdetected
% of surveysdetected
% of surveysdetected
% of surveysdetected
% of surveysdetected
Group Total 0.0 0.0 0.1 0.0 0.0
Grand Total 100.0% 100.0% 100.0% 100.0% 100.0%* Percent composition is the fraction of the total number of individuals
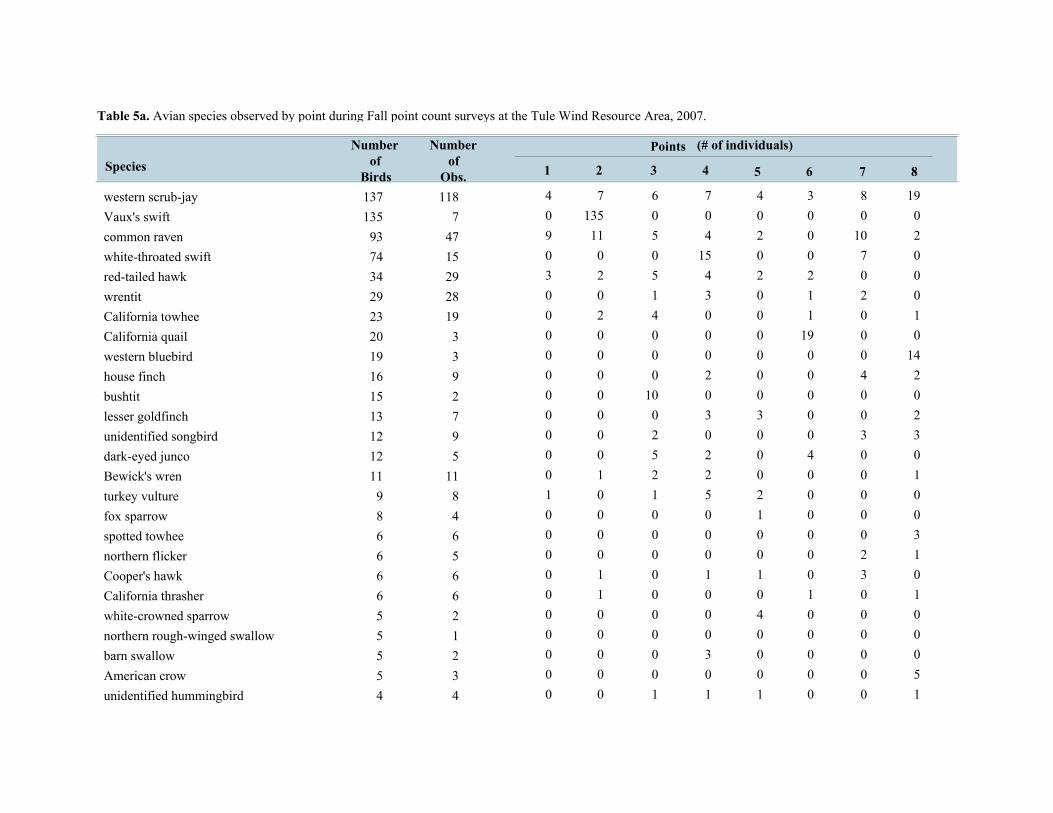
Numberof
BirdsSpecies
Numberof
Obs.
Points (# of individuals)
Table 5a. Avian species observed by point during Fall point count surveys at the Tule Wind Resource Area, 2007.
1 2 3 4 5 6 7 8
western scrub-jay 137 118 4 7 6 7 4 3 8 19Vaux's swift 135 7 0 135 0 0 0 0 0 0common raven 93 47 9 11 5 4 2 0 10 2white-throated swift 74 15 0 0 0 15 0 0 7 0red-tailed hawk 34 29 3 2 5 4 2 2 0 0wrentit 29 28 0 0 1 3 0 1 2 0California towhee 23 19 0 2 4 0 0 1 0 1California quail 20 3 0 0 0 0 0 19 0 0western bluebird 19 3 0 0 0 0 0 0 0 14house finch 16 9 0 0 0 2 0 0 4 2bushtit 15 2 0 0 10 0 0 0 0 0lesser goldfinch 13 7 0 0 0 3 3 0 0 2unidentified songbird 12 9 0 0 2 0 0 0 3 3dark-eyed junco 12 5 0 0 5 2 0 4 0 0Bewick's wren 11 11 0 1 2 2 0 0 0 1turkey vulture 9 8 1 0 1 5 2 0 0 0fox sparrow 8 4 0 0 0 0 1 0 0 0spotted towhee 6 6 0 0 0 0 0 0 0 3northern flicker 6 5 0 0 0 0 0 0 2 1Cooper's hawk 6 6 0 1 0 1 1 0 3 0California thrasher 6 6 0 1 0 0 0 1 0 1white-crowned sparrow 5 2 0 0 0 0 4 0 0 0northern rough-winged swallow 5 1 0 0 0 0 0 0 0 0barn swallow 5 2 0 0 0 3 0 0 0 0American crow 5 3 0 0 0 0 0 0 0 5unidentified hummingbird 4 4 0 0 1 1 1 0 0 1
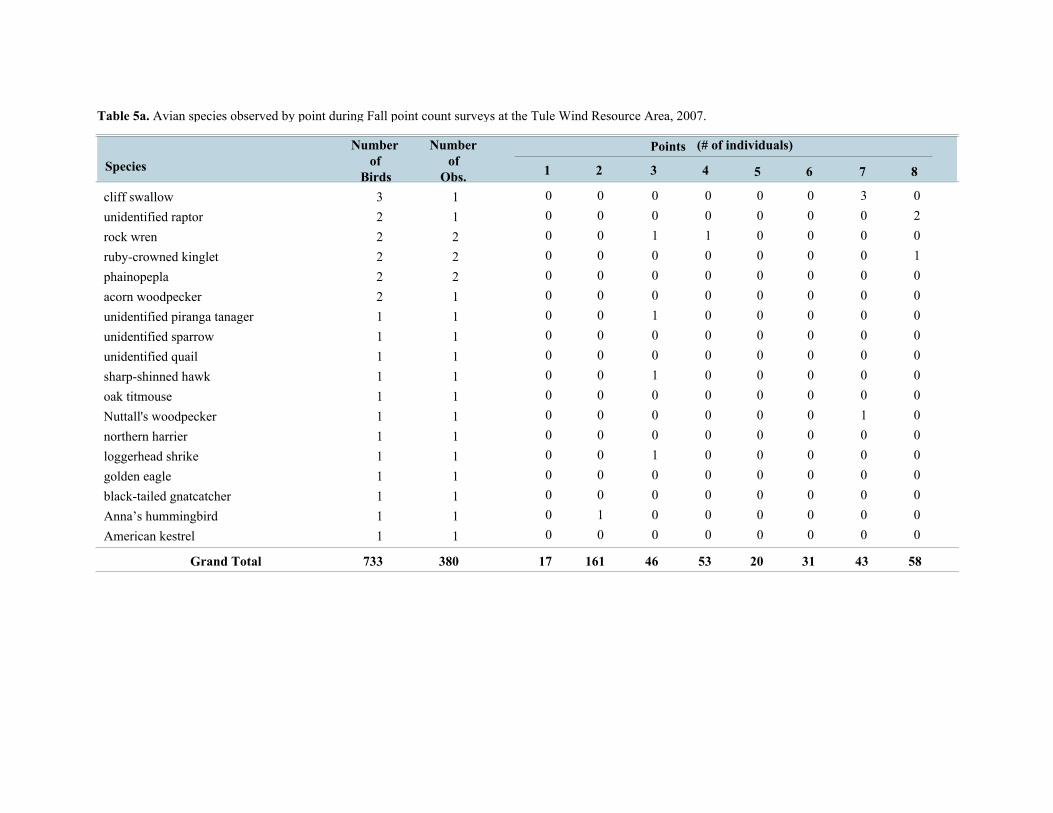
Numberof
BirdsSpecies
Numberof
Obs.
Points (# of individuals)
Table 5a. Avian species observed by point during Fall point count surveys at the Tule Wind Resource Area, 2007.
1 2 3 4 5 6 7 8
cliff swallow 3 1 0 0 0 0 0 0 3 0unidentified raptor 2 1 0 0 0 0 0 0 0 2rock wren 2 2 0 0 1 1 0 0 0 0ruby-crowned kinglet 2 2 0 0 0 0 0 0 0 1phainopepla 2 2 0 0 0 0 0 0 0 0acorn woodpecker 2 1 0 0 0 0 0 0 0 0unidentified piranga tanager 1 1 0 0 1 0 0 0 0 0unidentified sparrow 1 1 0 0 0 0 0 0 0 0unidentified quail 1 1 0 0 0 0 0 0 0 0sharp-shinned hawk 1 1 0 0 1 0 0 0 0 0oak titmouse 1 1 0 0 0 0 0 0 0 0Nuttall's woodpecker 1 1 0 0 0 0 0 0 1 0northern harrier 1 1 0 0 0 0 0 0 0 0loggerhead shrike 1 1 0 0 1 0 0 0 0 0golden eagle 1 1 0 0 0 0 0 0 0 0black-tailed gnatcatcher 1 1 0 0 0 0 0 0 0 0Anna’s hummingbird 1 1 0 1 0 0 0 0 0 0American kestrel 1 1 0 0 0 0 0 0 0 0
Grand Total 733 380 17 161 46 53 20 31 43 58

Numberof
BirdsSpecies
Numberof
Obs. 11 12
Points (# of individuals)
Table 5a. Avian species observed by point during Fall point count surveys at the Tule Wind Resource Area, 2007.
9 10 13 14 15 16
western scrub-jay 137 118 15 24 3 2 16 7 48Vaux's swift 135 7 0 0 0 0 0 0 00common raven 93 47 14 10 3 1 5 1 115white-throated swift 74 15 25 3 0 0 2 16 06red-tailed hawk 34 29 3 2 3 2 2 1 12wrentit 29 28 0 5 5 1 8 0 12California towhee 23 19 3 7 2 0 1 0 02California quail 20 3 0 0 0 0 1 0 00western bluebird 19 3 0 0 0 0 0 0 32house finch 16 9 5 0 0 0 2 0 10bushtit 15 2 0 0 5 0 0 0 00lesser goldfinch 13 7 2 1 0 0 0 2 00unidentified songbird 12 9 0 0 0 1 0 1 02dark-eyed junco 12 5 0 0 0 0 0 0 10Bewick's wren 11 11 3 0 0 0 2 0 00turkey vulture 9 8 0 0 0 0 0 0 00fox sparrow 8 4 0 6 0 0 0 0 10spotted towhee 6 6 1 0 0 0 2 0 00northern flicker 6 5 0 2 1 0 0 0 00Cooper's hawk 6 6 0 0 0 0 0 0 00California thrasher 6 6 0 1 0 2 0 0 00white-crowned sparrow 5 2 0 1 0 0 0 0 00northern rough-winged swallow 5 1 5 0 0 0 0 0 00barn swallow 5 2 2 0 0 0 0 0 00American crow 5 3 0 0 0 0 0 0 00

Numberof
BirdsSpecies
Numberof
Obs. 11 12
Points (# of individuals)
Table 5a. Avian species observed by point during Fall point count surveys at the Tule Wind Resource Area, 2007.
9 10 13 14 15 16
unidentified hummingbird 4 4 0 0 0 0 0 0 00cliff swallow 3 1 0 0 0 0 0 0 00unidentified raptor 2 1 0 0 0 0 0 0 00rock wren 2 2 0 0 0 0 0 0 00ruby-crowned kinglet 2 2 1 0 0 0 0 0 00phainopepla 2 2 0 0 0 0 0 0 20acorn woodpecker 2 1 0 0 0 0 0 0 20unidentified piranga tanager 1 1 0 0 0 0 0 0 00unidentified sparrow 1 1 0 1 0 0 0 0 00unidentified quail 1 1 0 0 0 0 0 0 01sharp-shinned hawk 1 1 0 0 0 0 0 0 00oak titmouse 1 1 0 0 0 0 0 0 10Nuttall's woodpecker 1 1 0 0 0 0 0 0 00northern harrier 1 1 0 0 0 0 0 1 00loggerhead shrike 1 1 0 0 0 0 0 0 00golden eagle 1 1 0 0 0 0 0 1 00black-tailed gnatcatcher 1 1 0 1 0 0 0 0 00Anna’s hummingbird 1 1 0 0 0 0 0 0 00American kestrel 1 1 1 0 0 0 0 0 00
Grand Total 733 380 80 64 22 9 41 30 2830
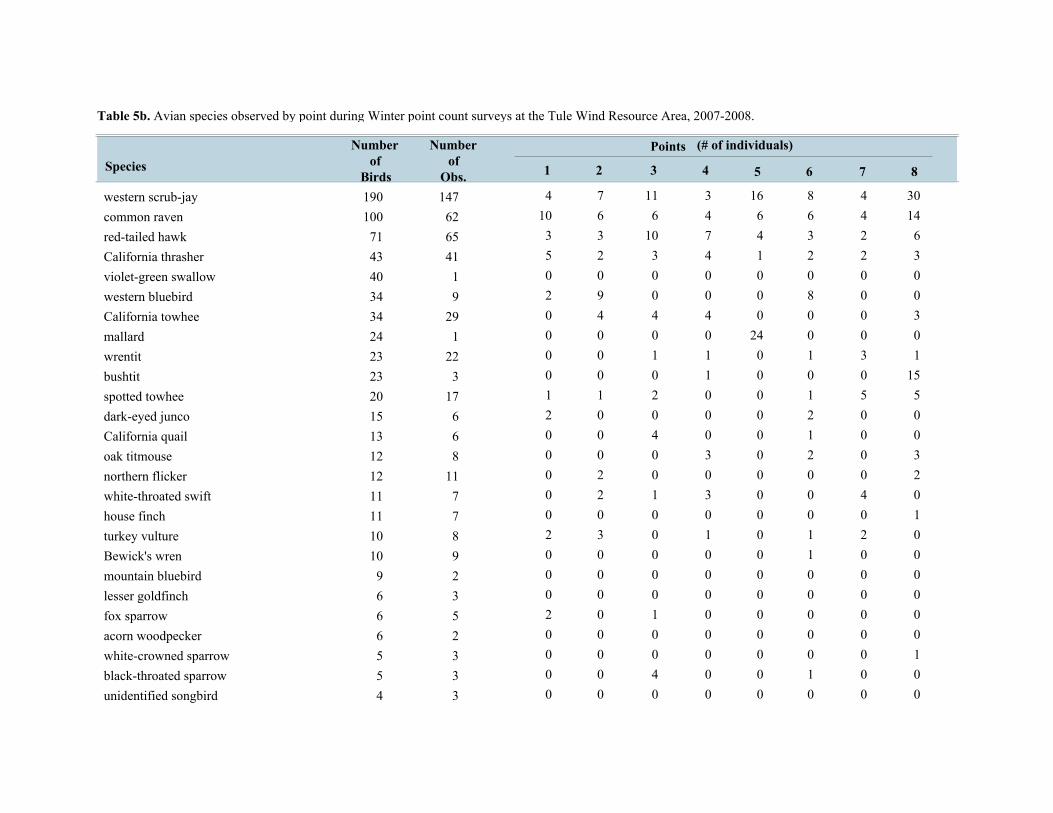
Numberof
BirdsSpecies
Numberof
Obs.
Points (# of individuals)
Table 5b. Avian species observed by point during Winter point count surveys at the Tule Wind Resource Area, 2007-2008.
1 2 3 4 5 6 7 8
western scrub-jay 190 147 4 7 11 3 16 8 4 30common raven 100 62 10 6 6 4 6 6 4 14red-tailed hawk 71 65 3 3 10 7 4 3 2 6California thrasher 43 41 5 2 3 4 1 2 2 3violet-green swallow 40 1 0 0 0 0 0 0 0 0western bluebird 34 9 2 9 0 0 0 8 0 0California towhee 34 29 0 4 4 4 0 0 0 3mallard 24 1 0 0 0 0 24 0 0 0wrentit 23 22 0 0 1 1 0 1 3 1bushtit 23 3 0 0 0 1 0 0 0 15spotted towhee 20 17 1 1 2 0 0 1 5 5dark-eyed junco 15 6 2 0 0 0 0 2 0 0California quail 13 6 0 0 4 0 0 1 0 0oak titmouse 12 8 0 0 0 3 0 2 0 3northern flicker 12 11 0 2 0 0 0 0 0 2white-throated swift 11 7 0 2 1 3 0 0 4 0house finch 11 7 0 0 0 0 0 0 0 1turkey vulture 10 8 2 3 0 1 0 1 2 0Bewick's wren 10 9 0 0 0 0 0 1 0 0mountain bluebird 9 2 0 0 0 0 0 0 0 0lesser goldfinch 6 3 0 0 0 0 0 0 0 0fox sparrow 6 5 2 0 1 0 0 0 0 0acorn woodpecker 6 2 0 0 0 0 0 0 0 0white-crowned sparrow 5 3 0 0 0 0 0 0 0 1black-throated sparrow 5 3 0 0 4 0 0 1 0 0unidentified songbird 4 3 0 0 0 0 0 0 0 0

Numberof
BirdsSpecies
Numberof
Obs.
Points (# of individuals)
Table 5b. Avian species observed by point during Winter point count surveys at the Tule Wind Resource Area, 2007-2008.
1 2 3 4 5 6 7 8
mountain chickadee 4 1 0 0 0 0 0 0 0 0ladder-backed woodpecker 4 4 0 0 1 0 0 0 0 1unidentified raptor 3 3 0 0 0 0 0 0 0 1unidentified gull 3 1 0 0 0 0 0 3 0 0phainopepla 3 3 0 0 0 0 0 1 0 0mourning dove 3 3 0 0 0 1 0 2 0 0Steller's jay 2 2 0 0 0 0 0 0 0 0northern harrier 2 2 0 0 0 2 0 0 0 0American kestrel 2 2 0 0 0 0 0 0 0 0ruby-crowned kinglet 1 1 0 0 0 0 0 0 0 0Nuttall's woodpecker 1 1 0 1 0 0 0 0 0 0band-tailed pigeon 1 1 0 0 0 0 0 0 0 0
Grand Total 766 504 31 40 48 34 51 43 26 86

Numberof
BirdsSpecies
Numberof
Obs. 11 12
Points (# of individuals)
Table 5b. Avian species observed by point during Winter point count surveys at the Tule Wind Resource Area, 2007-2008.
9 10 13 14 15 16
western scrub-jay 190 147 16 26 3 11 17 7 207common raven 100 62 3 10 12 3 4 2 64red-tailed hawk 71 65 1 5 10 5 2 4 24California thrasher 43 41 4 5 3 4 5 0 00violet-green swallow 40 1 0 0 0 0 0 0 040western bluebird 34 9 10 0 0 0 5 0 00California towhee 34 29 3 5 4 1 3 1 20mallard 24 1 0 0 0 0 0 0 00wrentit 23 22 0 8 1 5 0 1 10bushtit 23 3 0 0 0 0 0 0 70spotted towhee 20 17 0 0 0 0 1 0 13dark-eyed junco 15 6 0 0 0 0 0 5 51California quail 13 6 0 0 0 0 7 0 01oak titmouse 12 8 0 0 0 0 0 0 22northern flicker 12 11 0 1 2 0 0 2 21white-throated swift 11 7 0 0 1 0 0 0 00house finch 11 7 1 2 3 3 0 0 10turkey vulture 10 8 1 0 0 0 0 0 00Bewick's wren 10 9 2 1 0 1 1 0 31mountain bluebird 9 2 6 0 0 3 0 0 00lesser goldfinch 6 3 3 0 0 3 0 0 00fox sparrow 6 5 0 2 0 0 0 0 10acorn woodpecker 6 2 0 0 0 0 0 1 50white-crowned sparrow 5 3 0 1 3 0 0 0 00black-throated sparrow 5 3 0 0 0 0 0 0 00

Numberof
BirdsSpecies
Numberof
Obs. 11 12
Points (# of individuals)
Table 5b. Avian species observed by point during Winter point count surveys at the Tule Wind Resource Area, 2007-2008.
9 10 13 14 15 16
unidentified songbird 4 3 0 0 0 2 0 0 02mountain chickadee 4 1 0 0 0 0 0 0 40ladder-backed woodpecker 4 4 0 1 0 0 0 0 01unidentified raptor 3 3 0 0 0 1 1 0 00unidentified gull 3 1 0 0 0 0 0 0 00phainopepla 3 3 0 0 0 0 1 0 10mourning dove 3 3 0 0 0 0 0 0 00Steller's jay 2 2 0 0 0 0 0 0 20northern harrier 2 2 0 0 0 0 0 0 00American kestrel 2 2 0 0 0 1 0 0 10ruby-crowned kinglet 1 1 0 0 0 0 0 0 10Nuttall's woodpecker 1 1 0 0 0 0 0 0 00band-tailed pigeon 1 1 0 0 0 0 0 0 10
Grand Total 766 504 50 67 42 43 47 23 6867

Numberof
BirdsSpecies
Numberof
Obs.
Points (# of individuals)
Table 5c. Avian species observed by point during Spring point count surveys at the Tule Wind Resource Area, 2008.
1 2 3 4 5 6 7 8
western scrub-jay 146 122 2 7 8 7 15 7 5 12common raven 142 92 11 14 9 12 3 7 4 18spotted towhee 61 59 3 2 1 4 4 1 4 5turkey vulture 60 51 3 6 6 6 9 3 4 3red-tailed hawk 49 40 1 8 4 5 2 3 1 2wrentit 44 43 2 0 0 4 3 3 2 0house finch 41 23 1 1 0 2 12 1 7 0Bewick's wren 40 40 4 3 2 3 1 4 1 4California towhee 39 36 4 5 4 4 1 6 2 1California thrasher 36 35 4 3 2 2 3 1 2 2white-throated swift 34 10 0 0 4 0 0 0 0 0mourning dove 25 22 0 3 1 0 0 2 0 0California quail 23 17 0 2 1 0 0 1 0 0cliff swallow 22 3 0 0 0 0 1 0 0 0black-throated sparrow 20 18 3 4 6 1 0 0 0 2ash-throated flycatcher 16 14 0 0 0 1 0 2 0 1oak titmouse 14 8 0 0 0 0 0 0 0 2bushtit 13 3 0 0 5 0 5 0 0 0black-chinned sparrow 11 10 0 0 0 0 0 0 0 0phainopepla 10 5 4 1 3 0 0 0 0 0northern flicker 10 9 0 0 0 0 0 2 0 0acorn woodpecker 10 6 0 0 0 0 0 0 0 0yellow-rumped warbler 9 7 0 0 0 0 0 0 0 0black-headed grosbeak 9 8 2 1 0 0 0 0 0 0unidentified songbird 8 7 1 0 0 1 1 0 0 3Steller's jay 7 3 0 0 0 0 0 0 0 0

Numberof
BirdsSpecies
Numberof
Obs.
Points (# of individuals)
Table 5c. Avian species observed by point during Spring point count surveys at the Tule Wind Resource Area, 2008.
1 2 3 4 5 6 7 8
black-chinned hummingbird 7 7 1 0 0 0 0 0 0 0dark-eyed junco 6 3 0 0 0 0 0 0 0 0orange-crowned warbler 5 5 0 1 0 0 0 0 0 0lesser goldfinch 5 3 0 3 0 0 0 0 0 0horned lark 5 2 0 4 0 0 0 0 0 0western bluebird 4 2 0 0 0 0 0 0 0 0unidentified hummingbird 4 3 0 0 2 1 0 0 0 0white-crowned sparrow 3 1 0 0 0 0 0 0 0 0northern mockingbird 3 3 1 0 0 0 1 1 0 0Wilson's warbler 2 2 1 0 0 1 0 0 0 0western wood-pewee 2 1 0 0 0 0 0 0 0 0Townsend's Warbler 2 2 0 0 0 0 0 0 0 0Scott's oriole 2 2 0 0 0 0 0 0 0 0ruby-crowned kinglet 2 2 0 0 0 0 0 0 0 0Cooper's hawk 2 2 0 1 0 0 0 0 1 0blue-gray gnatcatcher 2 1 0 2 0 0 0 0 0 0American kestrel 2 2 0 0 0 0 1 0 0 0unidentified empidonax flycatcher 1 1 0 0 0 0 0 0 0 0sage sparrow 1 1 0 0 0 0 0 0 0 0pacific-slope flycatcher 1 1 0 0 0 0 0 0 0 0prairie falcon 1 1 0 0 0 0 0 0 0 0osprey 1 1 0 0 0 0 1 0 0 0Nuttall's woodpecker 1 1 0 0 0 0 0 0 0 0Nashville warbler 1 1 0 0 0 0 0 0 0 0mountain chickadee 1 1 0 0 0 0 0 0 0 0house wren 1 1 0 0 0 0 0 0 0 0

Numberof
BirdsSpecies
Numberof
Obs.
Points (# of individuals)
Table 5c. Avian species observed by point during Spring point count surveys at the Tule Wind Resource Area, 2008.
1 2 3 4 5 6 7 8
Hammond’s flycatcher 1 1 0 0 0 0 0 0 0 0golden eagle 1 1 0 0 0 0 0 0 0 0downy woodpecker 1 1 0 0 0 0 0 0 0 0double-crested cormorant 1 1 0 0 0 1 0 0 0 0canyon wren 1 1 0 0 0 0 0 0 0 0Anna’s hummingbird 1 1 0 0 0 0 0 0 0 0
Grand Total 972 749 48 71 58 55 63 44 33 55

Numberof
BirdsSpecies
Numberof
Obs. 11 12
Points (# of individuals)
Table 5c. Avian species observed by point during Spring point count surveys at the Tule Wind Resource Area, 2008.
9 10 13 14 15 16
western scrub-jay 146 122 12 15 1 5 10 12 1216common raven 142 92 3 9 21 7 3 6 312spotted towhee 61 59 7 3 2 1 6 3 411turkey vulture 60 51 8 1 3 0 5 2 01red-tailed hawk 49 40 2 1 0 4 2 5 45wrentit 44 43 1 8 4 4 2 4 34house finch 41 23 1 0 0 0 0 3 103Bewick's wren 40 40 2 1 2 2 3 1 34California towhee 39 36 3 2 0 1 1 1 13California thrasher 36 35 1 4 1 0 1 2 44white-throated swift 34 10 0 1 1 0 0 5 221mourning dove 25 22 1 0 0 0 0 9 90California quail 23 17 0 0 0 0 6 2 101cliff swallow 22 3 0 0 0 0 0 1 200black-throated sparrow 20 18 4 0 0 0 0 0 00ash-throated flycatcher 16 14 4 0 0 0 1 0 70oak titmouse 14 8 0 0 0 0 0 3 90bushtit 13 3 0 0 0 0 0 0 30black-chinned sparrow 11 10 0 1 0 2 1 3 40phainopepla 10 5 1 0 0 0 1 0 00northern flicker 10 9 0 0 0 0 0 5 30acorn woodpecker 10 6 0 0 0 0 0 3 70yellow-rumped warbler 9 7 0 0 0 0 0 2 70black-headed grosbeak 9 8 0 3 0 0 0 1 11unidentified songbird 8 7 0 0 0 0 2 0 00

Numberof
BirdsSpecies
Numberof
Obs. 11 12
Points (# of individuals)
Table 5c. Avian species observed by point during Spring point count surveys at the Tule Wind Resource Area, 2008.
9 10 13 14 15 16
Steller's jay 7 3 0 0 0 0 0 3 40black-chinned hummingbird 7 7 1 0 0 1 2 2 00dark-eyed junco 6 3 3 0 0 0 0 2 10orange-crowned warbler 5 5 0 0 0 0 0 3 10lesser goldfinch 5 3 0 0 0 0 0 1 10horned lark 5 2 0 0 0 0 0 0 10western bluebird 4 2 0 0 0 0 0 2 20unidentified hummingbird 4 3 0 0 0 0 0 0 10white-crowned sparrow 3 1 0 0 0 0 0 3 00northern mockingbird 3 3 0 0 0 0 0 0 00Wilson's warbler 2 2 0 0 0 0 0 0 00western wood-pewee 2 1 0 0 0 0 0 0 20Townsend's Warbler 2 2 0 0 0 0 0 0 20Scott's oriole 2 2 0 0 0 0 0 0 20ruby-crowned kinglet 2 2 0 0 0 0 0 1 10Cooper's hawk 2 2 0 0 0 0 0 0 00blue-gray gnatcatcher 2 1 0 0 0 0 0 0 00American kestrel 2 2 0 1 0 0 0 0 00unidentified empidonax flycatcher 1 1 0 0 0 0 0 0 10sage sparrow 1 1 0 0 0 0 0 0 01pacific-slope flycatcher 1 1 0 0 0 0 0 0 10prairie falcon 1 1 0 0 0 0 0 1 00osprey 1 1 0 0 0 0 0 0 00Nuttall's woodpecker 1 1 0 0 0 0 0 0 10Nashville warbler 1 1 0 0 0 0 0 0 10

Numberof
BirdsSpecies
Numberof
Obs. 11 12
Points (# of individuals)
Table 5c. Avian species observed by point during Spring point count surveys at the Tule Wind Resource Area, 2008.
9 10 13 14 15 16
mountain chickadee 1 1 0 0 0 0 0 0 10house wren 1 1 0 0 0 0 0 0 10Hammond’s flycatcher 1 1 0 0 0 0 0 0 10golden eagle 1 1 0 1 0 0 0 0 00downy woodpecker 1 1 0 0 0 0 0 1 00double-crested cormorant 1 1 0 0 0 0 0 0 00canyon wren 1 1 0 0 0 0 0 1 00Anna’s hummingbird 1 1 0 0 0 0 0 1 00
Grand Total 972 749 54 51 35 27 46 94 17167

Numberof
BirdsSpecies
Numberof
Obs.
Points (# of individuals)
Table 5d. Avian species observed by point during Summer point count surveys at the Tule Wind Resource Area, 2008.
1 2 3 4 5 6 7 8
western scrub-jay 256 149 13 12 15 6 19 9 11 22house finch 115 58 3 18 4 5 15 13 1 23white-throated swift 95 18 0 0 5 3 0 0 0 0turkey vulture 87 56 10 10 18 3 17 2 5 3common raven 61 29 13 16 9 1 0 10 0 2California towhee 55 44 7 6 1 4 1 4 0 8wrentit 54 43 0 3 0 2 4 1 1 5lesser goldfinch 53 17 0 0 0 1 0 0 0 2red-tailed hawk 48 41 3 2 9 4 0 2 0 5phainopepla 44 35 4 9 2 4 1 12 0 1mourning dove 44 33 2 3 3 3 2 2 0 8unidentified hummingbird 35 29 2 1 0 0 2 0 3 3spotted towhee 34 31 1 2 0 0 2 2 2 4bushtit 32 3 0 0 0 0 0 0 0 12black-throated sparrow 29 22 2 10 1 1 0 2 1 0sage sparrow 25 12 1 5 10 0 0 0 0 0acorn woodpecker 23 13 0 0 0 0 0 0 0 2rock wren 20 18 5 2 2 0 0 5 0 0Bewick's wren 19 16 0 1 0 1 2 2 0 0ash-throated flycatcher 19 17 2 1 1 0 0 3 1 3northern flicker 17 17 2 0 1 0 1 0 0 3Anna’s hummingbird 16 14 0 0 0 0 0 1 0 2western bluebird 14 6 0 0 0 0 0 0 0 0California thrasher 14 11 3 0 0 1 1 5 1 0oak titmouse 13 9 0 0 0 0 0 2 0 0California quail 13 8 0 0 0 0 0 8 0 0
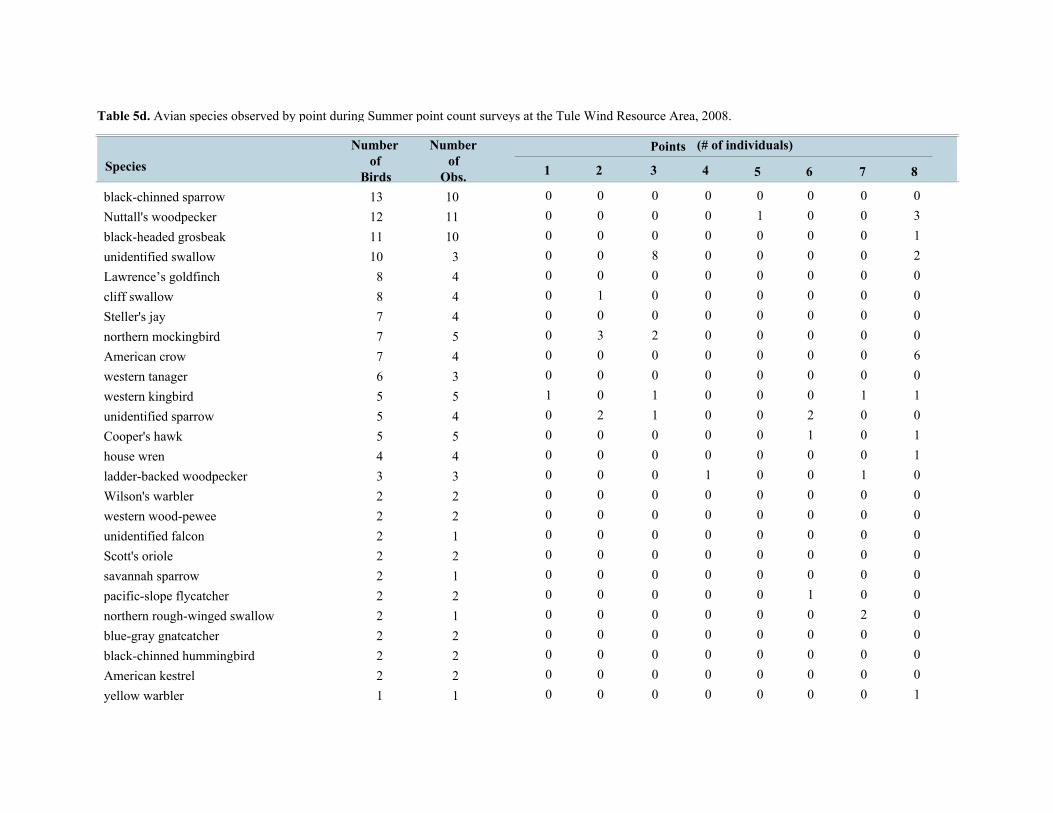
Numberof
BirdsSpecies
Numberof
Obs.
Points (# of individuals)
Table 5d. Avian species observed by point during Summer point count surveys at the Tule Wind Resource Area, 2008.
1 2 3 4 5 6 7 8
black-chinned sparrow 13 10 0 0 0 0 0 0 0 0Nuttall's woodpecker 12 11 0 0 0 0 1 0 0 3black-headed grosbeak 11 10 0 0 0 0 0 0 0 1unidentified swallow 10 3 0 0 8 0 0 0 0 2Lawrence’s goldfinch 8 4 0 0 0 0 0 0 0 0cliff swallow 8 4 0 1 0 0 0 0 0 0Steller's jay 7 4 0 0 0 0 0 0 0 0northern mockingbird 7 5 0 3 2 0 0 0 0 0American crow 7 4 0 0 0 0 0 0 0 6western tanager 6 3 0 0 0 0 0 0 0 0western kingbird 5 5 1 0 1 0 0 0 1 1unidentified sparrow 5 4 0 2 1 0 0 2 0 0Cooper's hawk 5 5 0 0 0 0 0 1 0 1house wren 4 4 0 0 0 0 0 0 0 1ladder-backed woodpecker 3 3 0 0 0 1 0 0 1 0Wilson's warbler 2 2 0 0 0 0 0 0 0 0western wood-pewee 2 2 0 0 0 0 0 0 0 0unidentified falcon 2 1 0 0 0 0 0 0 0 0Scott's oriole 2 2 0 0 0 0 0 0 0 0savannah sparrow 2 1 0 0 0 0 0 0 0 0pacific-slope flycatcher 2 2 0 0 0 0 0 1 0 0northern rough-winged swallow 2 1 0 0 0 0 0 0 2 0blue-gray gnatcatcher 2 2 0 0 0 0 0 0 0 0black-chinned hummingbird 2 2 0 0 0 0 0 0 0 0American kestrel 2 2 0 0 0 0 0 0 0 0yellow warbler 1 1 0 0 0 0 0 0 0 1
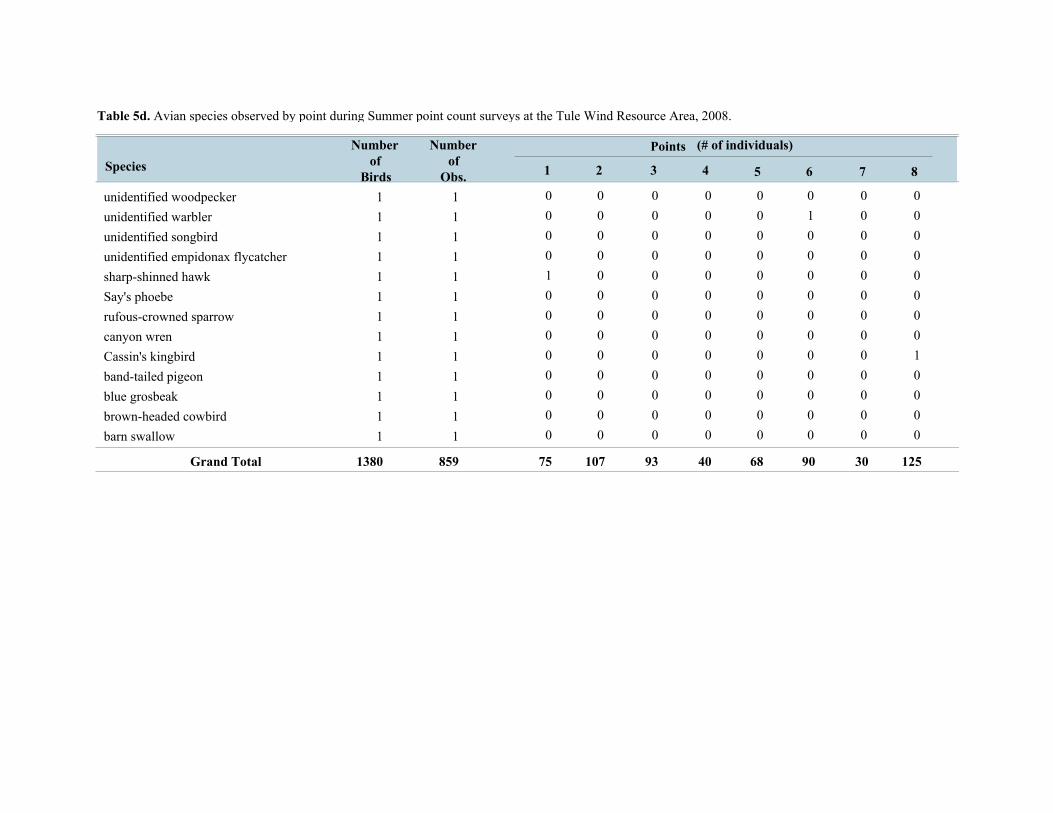
Numberof
BirdsSpecies
Numberof
Obs.
Points (# of individuals)
Table 5d. Avian species observed by point during Summer point count surveys at the Tule Wind Resource Area, 2008.
1 2 3 4 5 6 7 8
unidentified woodpecker 1 1 0 0 0 0 0 0 0 0unidentified warbler 1 1 0 0 0 0 0 1 0 0unidentified songbird 1 1 0 0 0 0 0 0 0 0unidentified empidonax flycatcher 1 1 0 0 0 0 0 0 0 0sharp-shinned hawk 1 1 1 0 0 0 0 0 0 0Say's phoebe 1 1 0 0 0 0 0 0 0 0rufous-crowned sparrow 1 1 0 0 0 0 0 0 0 0canyon wren 1 1 0 0 0 0 0 0 0 0Cassin's kingbird 1 1 0 0 0 0 0 0 0 1band-tailed pigeon 1 1 0 0 0 0 0 0 0 0blue grosbeak 1 1 0 0 0 0 0 0 0 0brown-headed cowbird 1 1 0 0 0 0 0 0 0 0barn swallow 1 1 0 0 0 0 0 0 0 0
Grand Total 1380 859 75 107 93 40 68 90 30 125
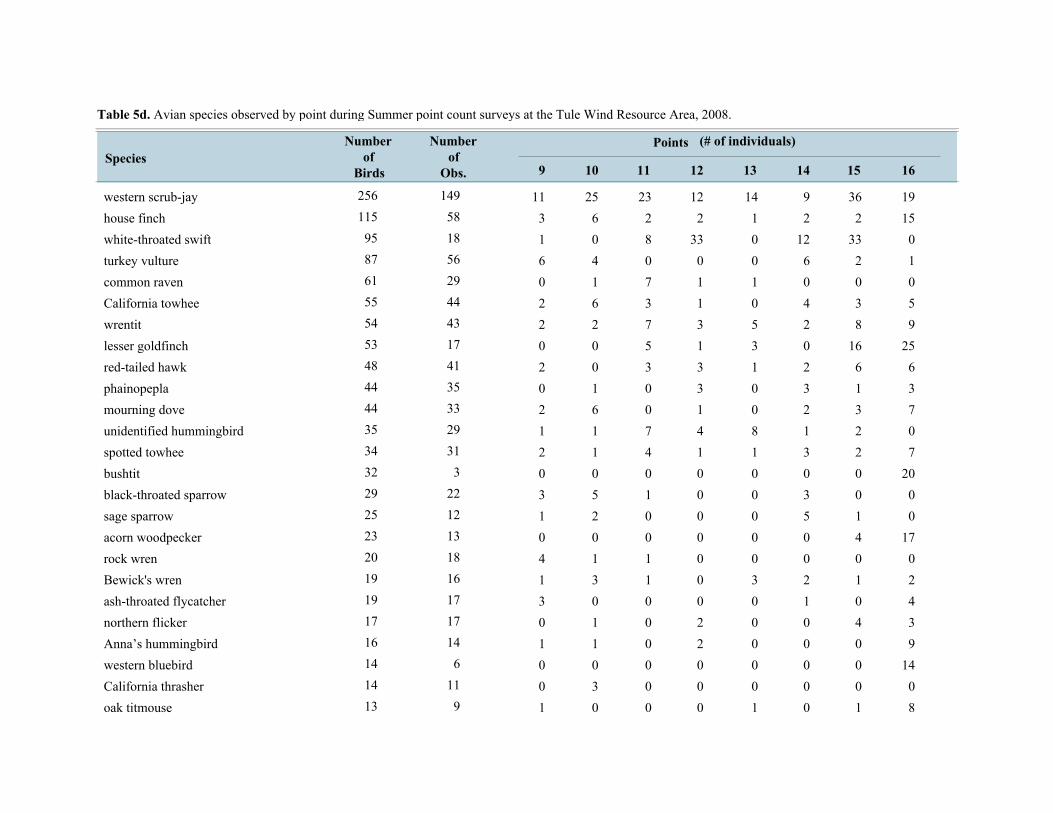
Numberof
BirdsSpecies
Numberof
Obs. 11 12
Points (# of individuals)
Table 5d. Avian species observed by point during Summer point count surveys at the Tule Wind Resource Area, 2008.
9 10 13 14 15 16
western scrub-jay 256 149 11 23 12 14 9 36 1925house finch 115 58 3 2 2 1 2 2 156white-throated swift 95 18 1 8 33 0 12 33 00turkey vulture 87 56 6 0 0 0 6 2 14common raven 61 29 0 7 1 1 0 0 01California towhee 55 44 2 3 1 0 4 3 56wrentit 54 43 2 7 3 5 2 8 92lesser goldfinch 53 17 0 5 1 3 0 16 250red-tailed hawk 48 41 2 3 3 1 2 6 60phainopepla 44 35 0 0 3 0 3 1 31mourning dove 44 33 2 0 1 0 2 3 76unidentified hummingbird 35 29 1 7 4 8 1 2 01spotted towhee 34 31 2 4 1 1 3 2 71bushtit 32 3 0 0 0 0 0 0 200black-throated sparrow 29 22 3 1 0 0 3 0 05sage sparrow 25 12 1 0 0 0 5 1 02acorn woodpecker 23 13 0 0 0 0 0 4 170rock wren 20 18 4 1 0 0 0 0 01Bewick's wren 19 16 1 1 0 3 2 1 23ash-throated flycatcher 19 17 3 0 0 0 1 0 40northern flicker 17 17 0 0 2 0 0 4 31Anna’s hummingbird 16 14 1 0 2 0 0 0 91western bluebird 14 6 0 0 0 0 0 0 140California thrasher 14 11 0 0 0 0 0 0 03oak titmouse 13 9 1 0 0 1 0 1 80

Numberof
BirdsSpecies
Numberof
Obs. 11 12
Points (# of individuals)
Table 5d. Avian species observed by point during Summer point count surveys at the Tule Wind Resource Area, 2008.
9 10 13 14 15 16
California quail 13 8 0 0 0 0 1 0 22black-chinned sparrow 13 10 0 4 2 6 0 1 00Nuttall's woodpecker 12 11 0 0 0 0 0 4 40black-headed grosbeak 11 10 0 6 2 0 1 0 10unidentified swallow 10 3 0 0 0 0 0 0 00Lawrence’s goldfinch 8 4 0 0 0 0 0 0 80cliff swallow 8 4 0 4 3 0 0 0 00Steller's jay 7 4 0 0 0 0 0 0 70northern mockingbird 7 5 2 0 0 0 0 0 00American crow 7 4 0 1 0 0 0 0 00western tanager 6 3 0 0 0 0 0 1 50western kingbird 5 5 0 0 0 0 0 1 00unidentified sparrow 5 4 0 0 0 0 0 0 00Cooper's hawk 5 5 0 0 0 0 1 0 20house wren 4 4 0 0 0 0 0 1 20ladder-backed woodpecker 3 3 1 0 0 0 0 0 00Wilson's warbler 2 2 0 0 0 0 1 0 10western wood-pewee 2 2 0 0 0 0 0 0 20unidentified falcon 2 1 0 2 0 0 0 0 00Scott's oriole 2 2 1 0 0 0 0 0 10savannah sparrow 2 1 0 0 0 0 0 0 02pacific-slope flycatcher 2 2 0 0 0 0 0 0 10northern rough-winged swallow 2 1 0 0 0 0 0 0 00blue-gray gnatcatcher 2 2 0 0 1 1 0 0 00black-chinned hummingbird 2 2 0 0 1 0 0 0 10

Numberof
BirdsSpecies
Numberof
Obs. 11 12
Points (# of individuals)
Table 5d. Avian species observed by point during Summer point count surveys at the Tule Wind Resource Area, 2008.
9 10 13 14 15 16
American kestrel 2 2 0 0 0 0 0 2 00yellow warbler 1 1 0 0 0 0 0 0 00unidentified woodpecker 1 1 0 0 0 0 0 1 00unidentified warbler 1 1 0 0 0 0 0 0 00unidentified songbird 1 1 0 1 0 0 0 0 00unidentified empidonax flycatcher 1 1 0 0 0 0 0 1 00sharp-shinned hawk 1 1 0 0 0 0 0 0 00Say's phoebe 1 1 0 0 0 0 0 0 01rufous-crowned sparrow 1 1 0 0 0 0 0 1 00canyon wren 1 1 0 0 0 0 0 0 10Cassin's kingbird 1 1 0 0 0 0 0 0 00band-tailed pigeon 1 1 0 0 0 0 0 1 00blue grosbeak 1 1 0 0 0 0 0 0 10brown-headed cowbird 1 1 0 1 0 0 0 0 00barn swallow 1 1 0 0 1 0 0 0 00
Grand Total 1380 859 50 91 79 45 61 139 21374
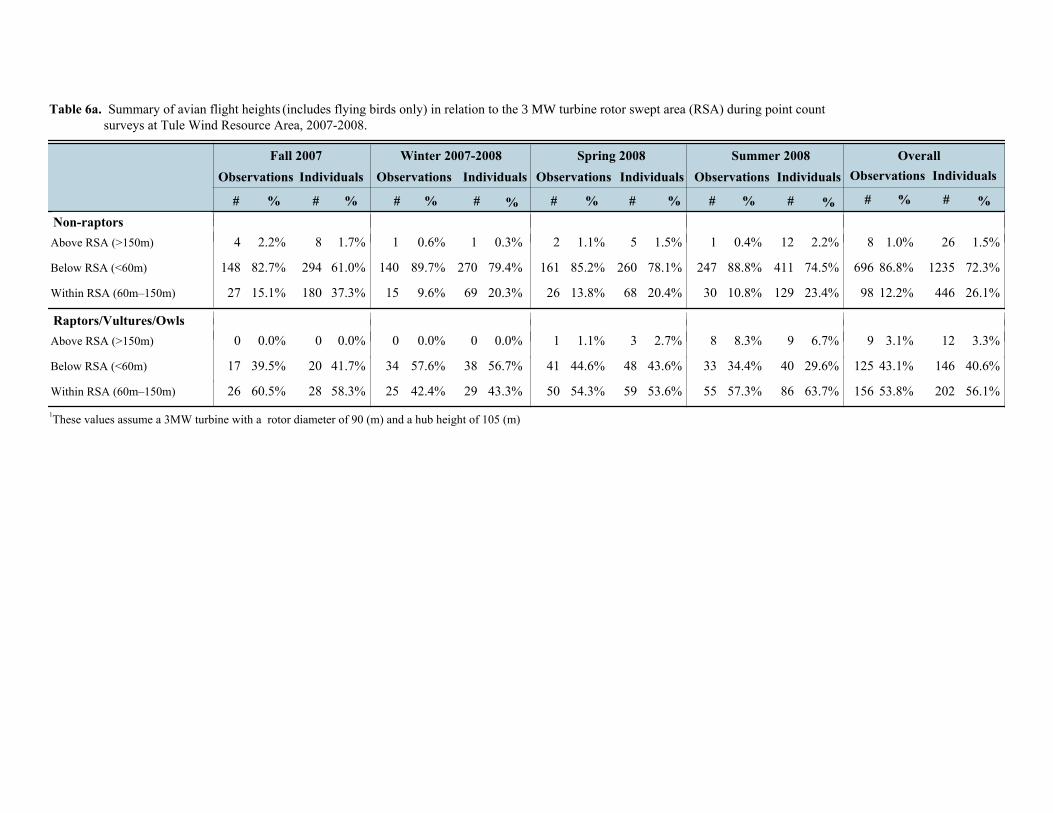
Table 6a. Summary of avian flight heights (includes flying birds only) in relation to the 3 MW turbine rotor swept area (RSA) during point count surveys at Tule Wind Resource Area, 2007-2008.
Observations
# %
Individuals
# %
Fall 2007Observations
# %
Individuals
#
Winter 2007-2008
%
Observations
# %
Individuals
# %
Spring 2008Observations
# %
Individuals
#
Summer 2008
%
Observations
# %
Individuals
# %
Overall
Non-raptorsAbove RSA (>150m) 4 2.2% 8 1.7% 1 0.6% 1 0.3% 2 1.1% 5 1.5% 1 0.4% 12 2.2% 1.0% 26 1.5%8
Below RSA (<60m) 148 82.7% 294 61.0% 140 89.7% 270 79.4% 161 85.2% 260 78.1% 247 88.8% 411 74.5% 86.8% 1235 72.3%696
Within RSA (60m–150m) 27 15.1% 180 37.3% 15 9.6% 69 20.3% 26 13.8% 68 20.4% 30 10.8% 129 23.4% 12.2% 446 26.1%98
Raptors/Vultures/OwlsAbove RSA (>150m) 0 0.0% 0 0.0% 0 0.0% 0 0.0% 1 1.1% 3 2.7% 8 8.3% 9 6.7% 3.1% 12 3.3%9
Below RSA (<60m) 17 39.5% 20 41.7% 34 57.6% 38 56.7% 41 44.6% 48 43.6% 33 34.4% 40 29.6% 43.1% 146 40.6%125
Within RSA (60m–150m) 26 60.5% 28 58.3% 25 42.4% 29 43.3% 50 54.3% 59 53.6% 55 57.3% 86 63.7% 53.8% 202 56.1%1561These values assume a 3MW turbine with a rotor diameter of 90 (m) and a hub height of 105 (m)
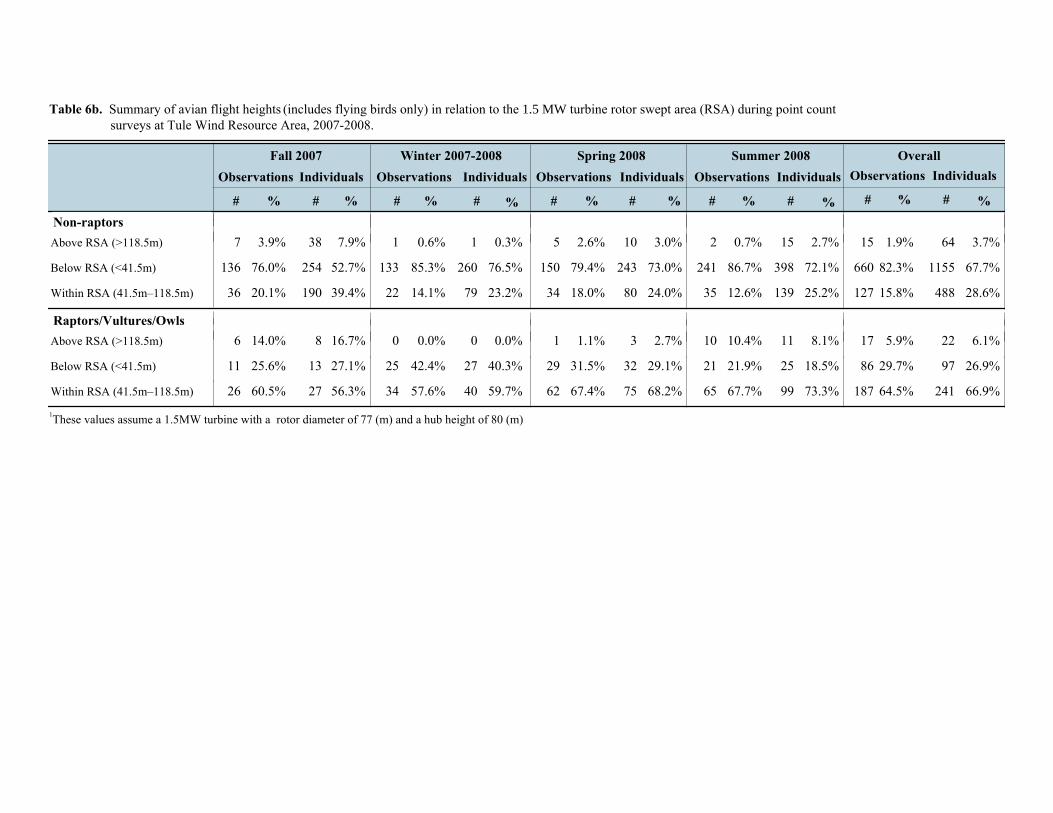
Table 6b. Summary of avian flight heights (includes flying birds only) in relation to the 1.5 MW turbine rotor swept area (RSA) during point count surveys at Tule Wind Resource Area, 2007-2008.
Observations
# %
Individuals
# %
Fall 2007Observations
# %
Individuals
#
Winter 2007-2008
%
Observations
# %
Individuals
# %
Spring 2008Observations
# %
Individuals
#
Summer 2008
%
Observations
# %
Individuals
# %
Overall
Non-raptorsAbove RSA (>118.5m) 7 3.9% 38 7.9% 1 0.6% 1 0.3% 5 2.6% 10 3.0% 2 0.7% 15 2.7% 1.9% 64 3.7%15
Below RSA (<41.5m) 136 76.0% 254 52.7% 133 85.3% 260 76.5% 150 79.4% 243 73.0% 241 86.7% 398 72.1% 82.3% 1155 67.7%660
Within RSA (41.5m–118.5m) 36 20.1% 190 39.4% 22 14.1% 79 23.2% 34 18.0% 80 24.0% 35 12.6% 139 25.2% 15.8% 488 28.6%127
Raptors/Vultures/OwlsAbove RSA (>118.5m) 6 14.0% 8 16.7% 0 0.0% 0 0.0% 1 1.1% 3 2.7% 10 10.4% 11 8.1% 5.9% 22 6.1%17
Below RSA (<41.5m) 11 25.6% 13 27.1% 25 42.4% 27 40.3% 29 31.5% 32 29.1% 21 21.9% 25 18.5% 29.7% 97 26.9%86
Within RSA (41.5m–118.5m) 26 60.5% 27 56.3% 34 57.6% 40 59.7% 62 67.4% 75 68.2% 65 67.7% 99 73.3% 64.5% 241 66.9%1871These values assume a 1.5MW turbine with a rotor diameter of 77 (m) and a hub height of 80 (m)

Table 7a. Avian flight height characteristics in relation to the 3 MW turbine rotor swept area (RSA) 1 at the Tule Wind Resource Area, during Fall 2007.
Percent Flying
EncounterRate
Percent Below RSA
PercentWithin RSA
PercentAbove RSA
Species Mean Use# birds/ 30 min.
(90% confidence interval)
(0.00 - 5.26) 0.0Vaux's swift 1.28 1.99 100.0 35.9 64.1(0.27 - 1.91) 1.4white-throated swift 0.81 1.09 100.0 24.7 74.0(0.94 - 1.80) 8.8common raven 0.48 1.37 87.1 51.3 40.0(0.35 - 0.65) 0.0red-tailed hawk 0.26 0.50 82.4 37.0 63.0(0.00 - 0.26) 0.0turkey vulture 0.07 0.13 100.0 44.4 55.6(0.03 - 0.15) 0.0Cooper's hawk 0.06 0.09 100.0 33.3 66.7(0.07 - 0.29) 0.0unidentified songbird 0.05 0.18 100.0 75.0 25.0(0.00 - 0.11) 0.0cliff swallow 0.04 0.04 100.0 0.0 100.0(0.00 - 0.16) 0.0barn swallow 0.04 0.07 100.0 40.0 60.0(0.01 - 0.11) 0.0unidentified hummingbird 0.02 0.06 100.0 75.0 25.0(0.00 - 0.03) 0.0golden eagle 0.01 0.01 100.0 0.0 100.0(0.00 - 0.03) 0.0American kestrel 0.01 0.01 100.0 0.0 100.0(0.27 - 0.59) 0.0wrentit 0.00 0.43 6.9 100.0 0.0(1.53 - 2.49) 0.0western scrub-jay 0.00 2.01 47.4 100.0 0.0(0.00 - 0.63) 0.0western bluebird 0.00 0.28 84.2 100.0 0.0(0.00 - 0.17) 0.0white-crowned sparrow 0.00 0.07 100.0 100.0 0.0(0.00 - 0.03) 0.0unidentified piranga tanager 0.00 0.01 100.0 100.0 0.0(0.00 - 0.03) 0.0unidentified sparrow 0.00 0.01 100.0 100.0 0.0(0.00 - 0.08) 0.0unidentified raptor 0.00 0.03 100.0 100.0 0.0(0.00 - 0.03) 0.0unidentified quail 0.00 0.01 0.0 0.0 0.0(0.00 - 0.03) 0.0sharp-shinned hawk 0.00 0.01 100.0 100.0 0.0(0.02 - 0.16) 0.0spotted towhee 0.00 0.09 33.3 100.0 0.0(0.00 - 0.06) 0.0rock wren 0.00 0.03 50.0 100.0 0.0(0.00 - 0.06) 0.0ruby-crowned kinglet 0.00 0.03 50.0 100.0 0.0(0.00 - 0.06) 0.0phainopepla 0.00 0.03 0.0 0.0 0.0(0.00 - 0.03) 0.0oak titmouse 0.00 0.01 0.0 0.0 0.0

Table 7a. Avian flight height characteristics in relation to the 3 MW turbine rotor swept area (RSA) 1 at the Tule Wind Resource Area, during Fall 2007.
Percent Flying
EncounterRate
Percent Below RSA
PercentWithin RSA
PercentAbove RSA
Species Mean Use# birds/ 30 min.
(90% confidence interval)
(0.00 - 0.03) 0.0Nuttall's woodpecker 0.00 0.01 100.0 100.0 0.0(0.00 - 0.19) 0.0northern rough-winged swallow 0.00 0.07 100.0 100.0 0.0(0.00 - 0.03) 0.0northern harrier 0.00 0.01 100.0 100.0 0.0(0.02 - 0.16) 0.0northern flicker 0.00 0.09 33.3 100.0 0.0(0.00 - 0.03) 0.0loggerhead shrike 0.00 0.01 0.0 0.0 0.0(0.06 - 0.32) 0.0lesser goldfinch 0.00 0.19 69.2 100.0 0.0(0.11 - 0.37) 0.0house finch 0.00 0.24 31.3 100.0 0.0(0.00 - 0.27) 0.0fox sparrow 0.00 0.12 87.5 100.0 0.0(0.03 - 0.33) 0.0dark-eyed junco 0.00 0.18 83.3 100.0 0.0(0.02 - 0.16) 0.0California thrasher 0.00 0.09 83.3 100.0 0.0(0.00 - 0.73) 0.0California quail 0.00 0.29 90.0 100.0 0.0(0.18 - 0.50) 0.0California towhee 0.00 0.34 47.8 100.0 0.0(0.00 - 0.49) 0.0bushtit 0.00 0.22 0.0 0.0 0.0(0.00 - 0.03) 0.0black-tailed gnatcatcher 0.00 0.01 100.0 100.0 0.0(0.07 - 0.25) 0.0Bewick's wren 0.00 0.16 9.1 100.0 0.0(0.00 - 0.03) 0.0Anna’s hummingbird 0.00 0.01 100.0 100.0 0.0(0.00 - 0.14) 0.0American crow 0.00 0.07 100.0 100.0 0.0(0.00 - 0.08) 0.0acorn woodpecker 0.00 0.03 0.0 0.0 0.0
1These values assume a rotor diameter of 90 (m) and a hub height of 105 (m)

Table 7b. Avian flight height characteristics in relation to the 3 MW turbine rotor swept area (RSA) 1 at the Tule Wind Resource Area, during Winter 2007-2008.
Percent Flying
EncounterRate
Percent Below RSA
PercentWithin RSA
PercentAbove RSA
Species Mean Use# birds/ 30 min.
(90% confidence interval)
(0.00 - 0.77) 0.0violet-green swallow 0.29 0.29 100.0 0.0 100.0(0.41 - 0.63) 0.0red-tailed hawk 0.17 0.52 74.6 55.8 44.2(0.57 - 0.89) 1.2common raven 0.15 0.73 86.0 74.4 24.4(0.01 - 0.15) 0.0white-throated swift 0.04 0.08 100.0 54.5 45.5(0.02 - 0.12) 0.0turkey vulture 0.04 0.07 100.0 50.0 50.0(0.00 - 0.06) 0.0unidentified gull 0.02 0.02 100.0 0.0 100.0(0.00 - 0.03) 0.0American kestrel 0.01 0.01 100.0 50.0 50.0(0.10 - 0.24) 0.0wrentit 0.00 0.17 4.3 100.0 0.0(1.14 - 1.64) 0.0western scrub-jay 0.00 1.39 37.4 100.0 0.0(0.10 - 0.40) 0.0western bluebird 0.00 0.25 67.6 100.0 0.0(0.00 - 0.08) 0.0white-crowned sparrow 0.00 0.04 20.0 100.0 0.0(0.00 - 0.04) 0.0unidentified raptor 0.00 0.02 33.3 100.0 0.0(0.00 - 0.06) 0.0unidentified songbird 0.00 0.03 50.0 100.0 0.0(0.00 - 0.03) 0.0Steller's jay 0.00 0.01 0.0 0.0 0.0(0.09 - 0.21) 0.0spotted towhee 0.00 0.15 20.0 100.0 0.0(0.00 - 0.02) 0.0ruby-crowned kinglet 0.00 0.01 100.0 100.0 0.0(0.00 - 0.04) 0.0phainopepla 0.00 0.02 66.7 100.0 0.0(0.04 - 0.14) 0.0oak titmouse 0.00 0.09 0.0 0.0 0.0(0.00 - 0.02) 0.0Nuttall's woodpecker 0.00 0.01 0.0 0.0 0.0(0.00 - 0.03) 0.0northern harrier 0.00 0.01 100.0 100.0 0.0(0.04 - 0.14) 0.0northern flicker 0.00 0.09 0.0 0.0 0.0(0.00 - 0.05) 0.0mourning dove 0.00 0.02 0.0 0.0 0.0(0.00 - 0.08) 0.0mountain chickadee 0.00 0.03 100.0 100.0 0.0(0.00 - 0.15) 0.0mountain bluebird 0.00 0.07 100.0 100.0 0.0(0.00 - 0.47) 0.0mallard 0.00 0.18 100.0 100.0 0.0(0.00 - 0.09) 0.0lesser goldfinch 0.00 0.04 66.7 100.0 0.0
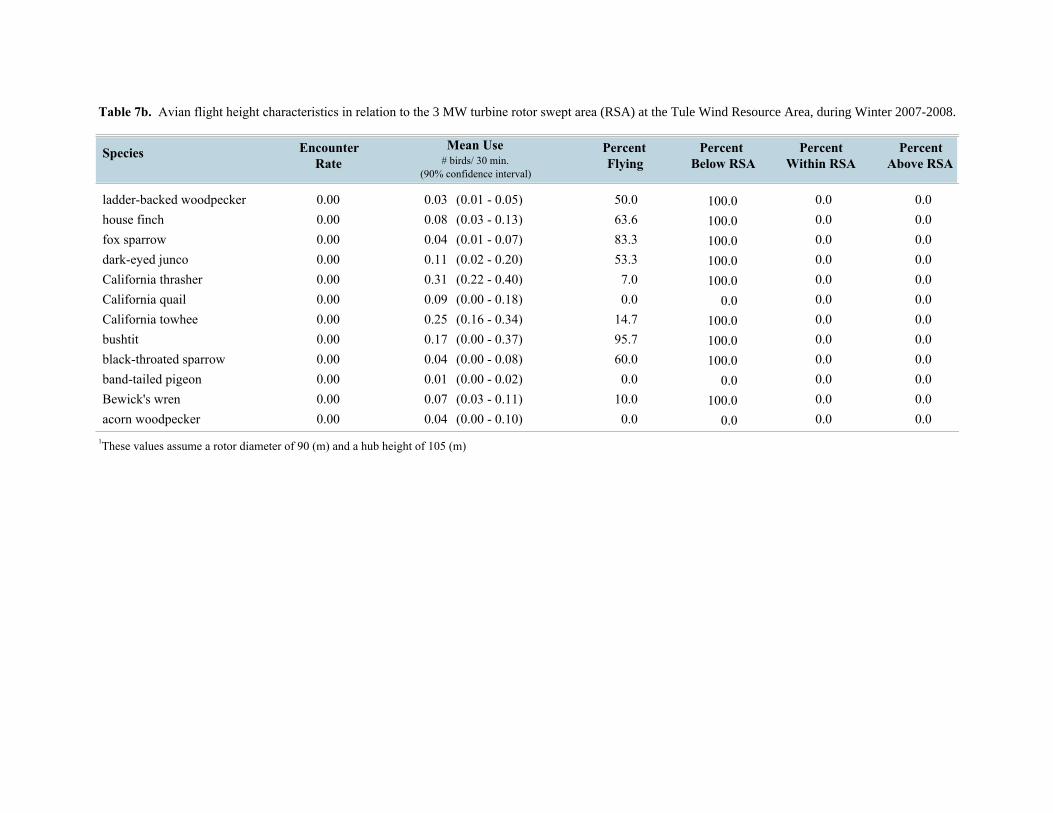
Table 7b. Avian flight height characteristics in relation to the 3 MW turbine rotor swept area (RSA) at the Tule Wind Resource Area, during Winter 2007-2008.
Percent Flying
EncounterRate
Percent Below RSA
PercentWithin RSA
PercentAbove RSA
Species Mean Use# birds/ 30 min.
(90% confidence interval)
(0.01 - 0.05) 0.0ladder-backed woodpecker 0.00 0.03 50.0 100.0 0.0(0.03 - 0.13) 0.0house finch 0.00 0.08 63.6 100.0 0.0(0.01 - 0.07) 0.0fox sparrow 0.00 0.04 83.3 100.0 0.0(0.02 - 0.20) 0.0dark-eyed junco 0.00 0.11 53.3 100.0 0.0(0.22 - 0.40) 0.0California thrasher 0.00 0.31 7.0 100.0 0.0(0.00 - 0.18) 0.0California quail 0.00 0.09 0.0 0.0 0.0(0.16 - 0.34) 0.0California towhee 0.00 0.25 14.7 100.0 0.0(0.00 - 0.37) 0.0bushtit 0.00 0.17 95.7 100.0 0.0(0.00 - 0.08) 0.0black-throated sparrow 0.00 0.04 60.0 100.0 0.0(0.00 - 0.02) 0.0band-tailed pigeon 0.00 0.01 0.0 0.0 0.0(0.03 - 0.11) 0.0Bewick's wren 0.00 0.07 10.0 100.0 0.0(0.00 - 0.10) 0.0acorn woodpecker 0.00 0.04 0.0 0.0 0.0
1These values assume a rotor diameter of 90 (m) and a hub height of 105 (m)

Table 7c. Avian flight height characteristics in relation to the 3 MW turbine rotor swept area (RSA) 1 at the Tule Wind Resource Area, during Spring 2008.
Percent Flying
EncounterRate
Percent Below RSA
PercentWithin RSA
PercentAbove RSA
Species Mean Use# birds/ 30 min.
(90% confidence interval)
(1.05 - 1.61) 4.2common raven 0.36 1.33 86.6 65.0 30.8(0.43 - 0.69) 0.0turkey vulture 0.29 0.56 100.0 48.3 51.7(0.34 - 0.58) 7.0red-tailed hawk 0.25 0.46 87.8 30.2 62.8(0.00 - 0.52) 0.0cliff swallow 0.19 0.21 100.0 9.1 90.9(0.11 - 0.53) 0.0white-throated swift 0.10 0.32 97.1 67.7 32.3(0.00 - 0.03) 0.0prairie falcon 0.01 0.01 100.0 0.0 100.0(0.00 - 0.03) 0.0double-crested cormorant 0.01 0.01 100.0 0.0 100.0(0.01 - 0.15) 0.0yellow-rumped warbler 0.00 0.08 33.3 100.0 0.0(0.29 - 0.53) 0.0wrentit 0.00 0.41 0.0 0.0 0.0(0.00 - 0.04) 0.0Wilson's warbler 0.00 0.02 100.0 100.0 0.0(0.00 - 0.05) 0.0western wood-pewee 0.00 0.02 0.0 0.0 0.0(1.13 - 1.59) 0.0western scrub-jay 0.00 1.36 21.9 100.0 0.0(0.00 - 0.08) 0.0western bluebird 0.00 0.04 100.0 100.0 0.0(0.00 - 0.08) 0.0white-crowned sparrow 0.00 0.03 0.0 0.0 0.0(0.02 - 0.12) 0.0unidentified songbird 0.00 0.07 87.5 100.0 0.0(0.00 - 0.08) 0.0unidentified hummingbird 0.00 0.04 50.0 100.0 0.0(0.00 - 0.03) 0.0unidentified empidonax flycatcher 0.00 0.01 0.0 0.0 0.0(0.00 - 0.04) 0.0Townsend's Warbler 0.00 0.02 0.0 0.0 0.0(0.00 - 0.14) 0.0Steller's jay 0.00 0.07 0.0 0.0 0.0(0.44 - 0.70) 0.0spotted towhee 0.00 0.57 1.6 100.0 0.0(0.00 - 0.04) 0.0Scott's oriole 0.00 0.02 50.0 100.0 0.0(0.00 - 0.03) 0.0sage sparrow 0.00 0.01 100.0 100.0 0.0(0.00 - 0.04) 0.0ruby-crowned kinglet 0.00 0.02 50.0 100.0 0.0(0.00 - 0.03) 0.0pacific-slope flycatcher 0.00 0.01 0.0 0.0 0.0(0.01 - 0.17) 0.0phainopepla 0.00 0.09 80.0 100.0 0.0(0.00 - 0.03) 0.0osprey 0.00 0.01 100.0 100.0 0.0
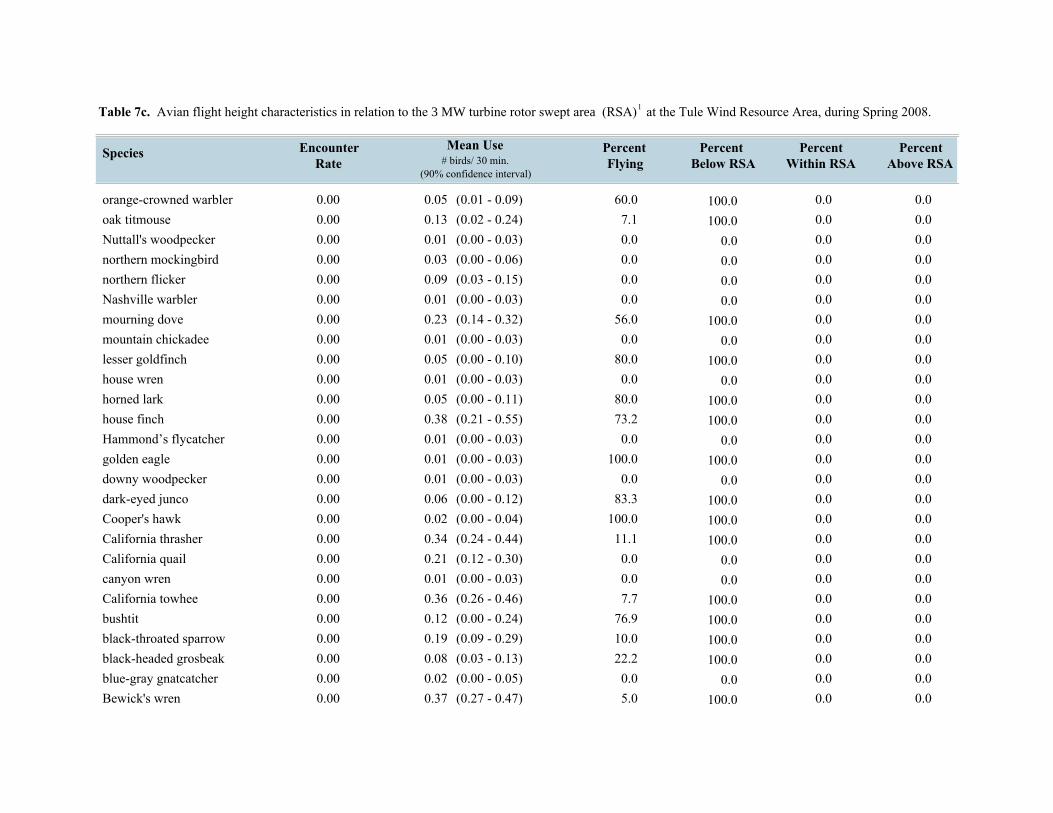
Table 7c. Avian flight height characteristics in relation to the 3 MW turbine rotor swept area (RSA) 1 at the Tule Wind Resource Area, during Spring 2008.
Percent Flying
EncounterRate
Percent Below RSA
PercentWithin RSA
PercentAbove RSA
Species Mean Use# birds/ 30 min.
(90% confidence interval)
(0.01 - 0.09) 0.0orange-crowned warbler 0.00 0.05 60.0 100.0 0.0(0.02 - 0.24) 0.0oak titmouse 0.00 0.13 7.1 100.0 0.0(0.00 - 0.03) 0.0Nuttall's woodpecker 0.00 0.01 0.0 0.0 0.0(0.00 - 0.06) 0.0northern mockingbird 0.00 0.03 0.0 0.0 0.0(0.03 - 0.15) 0.0northern flicker 0.00 0.09 0.0 0.0 0.0(0.00 - 0.03) 0.0Nashville warbler 0.00 0.01 0.0 0.0 0.0(0.14 - 0.32) 0.0mourning dove 0.00 0.23 56.0 100.0 0.0(0.00 - 0.03) 0.0mountain chickadee 0.00 0.01 0.0 0.0 0.0(0.00 - 0.10) 0.0lesser goldfinch 0.00 0.05 80.0 100.0 0.0(0.00 - 0.03) 0.0house wren 0.00 0.01 0.0 0.0 0.0(0.00 - 0.11) 0.0horned lark 0.00 0.05 80.0 100.0 0.0(0.21 - 0.55) 0.0house finch 0.00 0.38 73.2 100.0 0.0(0.00 - 0.03) 0.0Hammond’s flycatcher 0.00 0.01 0.0 0.0 0.0(0.00 - 0.03) 0.0golden eagle 0.00 0.01 100.0 100.0 0.0(0.00 - 0.03) 0.0downy woodpecker 0.00 0.01 0.0 0.0 0.0(0.00 - 0.12) 0.0dark-eyed junco 0.00 0.06 83.3 100.0 0.0(0.00 - 0.04) 0.0Cooper's hawk 0.00 0.02 100.0 100.0 0.0(0.24 - 0.44) 0.0California thrasher 0.00 0.34 11.1 100.0 0.0(0.12 - 0.30) 0.0California quail 0.00 0.21 0.0 0.0 0.0(0.00 - 0.03) 0.0canyon wren 0.00 0.01 0.0 0.0 0.0(0.26 - 0.46) 0.0California towhee 0.00 0.36 7.7 100.0 0.0(0.00 - 0.24) 0.0bushtit 0.00 0.12 76.9 100.0 0.0(0.09 - 0.29) 0.0black-throated sparrow 0.00 0.19 10.0 100.0 0.0(0.03 - 0.13) 0.0black-headed grosbeak 0.00 0.08 22.2 100.0 0.0(0.00 - 0.05) 0.0blue-gray gnatcatcher 0.00 0.02 0.0 0.0 0.0(0.27 - 0.47) 0.0Bewick's wren 0.00 0.37 5.0 100.0 0.0

Table 7c. Avian flight height characteristics in relation to the 3 MW turbine rotor swept area (RSA) 1 at the Tule Wind Resource Area, during Spring 2008.
Percent Flying
EncounterRate
Percent Below RSA
PercentWithin RSA
PercentAbove RSA
Species Mean Use# birds/ 30 min.
(90% confidence interval)
(0.04 - 0.16) 0.0black-chinned sparrow 0.00 0.10 9.1 100.0 0.0(0.02 - 0.12) 0.0black-chinned hummingbird 0.00 0.07 71.4 100.0 0.0(0.07 - 0.23) 0.0ash-throated flycatcher 0.00 0.15 31.3 100.0 0.0(0.00 - 0.03) 0.0Anna’s hummingbird 0.00 0.01 100.0 100.0 0.0(0.00 - 0.04) 0.0American kestrel 0.00 0.02 100.0 100.0 0.0(0.01 - 0.17) 0.0acorn woodpecker 0.00 0.09 20.0 100.0 0.0
1These values assume a rotor diameter of 90 (m) and a hub height of 105 (m)

Table 7d. Avian flight height characteristics in relation to the 3 MW turbine rotor swept area (RSA) 1 at the Tule Wind Resource Area, during Summer 2008.
Percent Flying
EncounterRate
Percent Below RSA
PercentWithin RSA
PercentAbove RSA
Species Mean Use# birds/ 30 min.
(90% confidence interval)
(0.46 - 1.44) 12.6white-throated swift 0.71 0.95 100.0 12.6 74.7(0.57 - 1.17) 5.7turkey vulture 0.64 0.87 100.0 20.7 73.6(0.32 - 0.90) 0.0common raven 0.30 0.61 90.2 46.3 53.7(0.34 - 0.62) 7.7red-tailed hawk 0.17 0.48 81.3 48.7 43.6(2.14 - 2.98) 0.0western scrub-jay 0.12 2.56 29.7 84.2 15.8(0.00 - 0.21) 0.0unidentified swallow 0.10 0.10 100.0 0.0 100.0(0.81 - 1.49) 0.0house finch 0.07 1.15 63.5 90.9 9.1(0.01 - 0.09) 20.0Cooper's hawk 0.03 0.05 100.0 20.0 60.0(0.00 - 0.16) 0.0cliff swallow 0.03 0.08 100.0 62.5 37.5(0.00 - 0.05) 0.0unidentified falcon 0.02 0.02 100.0 0.0 100.0(0.00 - 0.03) 0.0barn swallow 0.01 0.01 100.0 0.0 100.0(0.00 - 0.03) 0.0yellow warbler 0.00 0.01 100.0 100.0 0.0(0.38 - 0.70) 0.0wrentit 0.00 0.54 0.0 0.0 0.0(0.00 - 0.04) 0.0Wilson's warbler 0.00 0.02 0.0 0.0 0.0(0.00 - 0.04) 0.0western wood-pewee 0.00 0.02 50.0 100.0 0.0(0.00 - 0.12) 0.0western tanager 0.00 0.06 83.3 100.0 0.0(0.01 - 0.09) 0.0western kingbird 0.00 0.05 60.0 100.0 0.0(0.01 - 0.27) 0.0western bluebird 0.00 0.14 64.3 100.0 0.0(0.00 - 0.03) 0.0unidentified woodpecker 0.00 0.01 100.0 100.0 0.0(0.00 - 0.03) 0.0unidentified warbler 0.00 0.01 100.0 100.0 0.0(0.01 - 0.09) 0.0unidentified sparrow 0.00 0.05 100.0 100.0 0.0(0.00 - 0.03) 0.0unidentified songbird 0.00 0.01 100.0 100.0 0.0(0.22 - 0.48) 0.0unidentified hummingbird 0.00 0.35 100.0 100.0 0.0(0.00 - 0.03) 0.0unidentified empidonax flycatcher 0.00 0.01 100.0 100.0 0.0(0.00 - 0.14) 0.0Steller's jay 0.00 0.07 42.9 100.0 0.0(0.00 - 0.03) 0.0sharp-shinned hawk 0.00 0.01 100.0 100.0 0.0
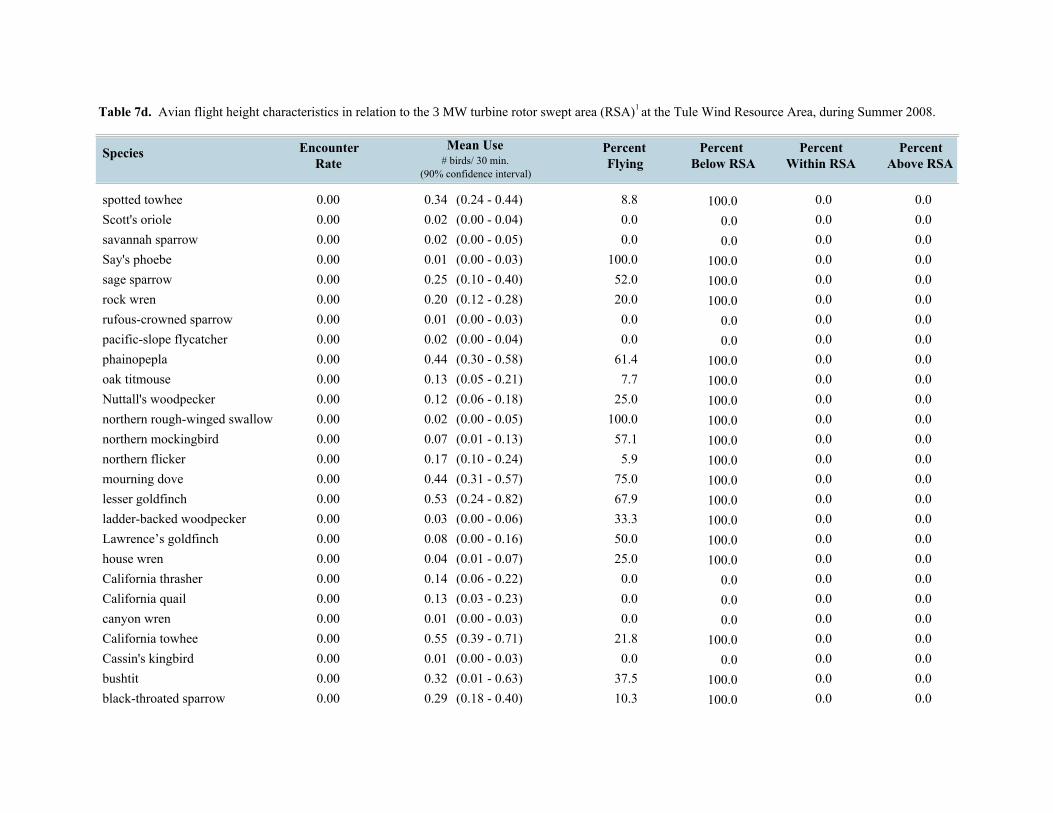
Table 7d. Avian flight height characteristics in relation to the 3 MW turbine rotor swept area (RSA) 1 at the Tule Wind Resource Area, during Summer 2008.
Percent Flying
EncounterRate
Percent Below RSA
PercentWithin RSA
PercentAbove RSA
Species Mean Use# birds/ 30 min.
(90% confidence interval)
(0.24 - 0.44) 0.0spotted towhee 0.00 0.34 8.8 100.0 0.0(0.00 - 0.04) 0.0Scott's oriole 0.00 0.02 0.0 0.0 0.0(0.00 - 0.05) 0.0savannah sparrow 0.00 0.02 0.0 0.0 0.0(0.00 - 0.03) 0.0Say's phoebe 0.00 0.01 100.0 100.0 0.0(0.10 - 0.40) 0.0sage sparrow 0.00 0.25 52.0 100.0 0.0(0.12 - 0.28) 0.0rock wren 0.00 0.20 20.0 100.0 0.0(0.00 - 0.03) 0.0rufous-crowned sparrow 0.00 0.01 0.0 0.0 0.0(0.00 - 0.04) 0.0pacific-slope flycatcher 0.00 0.02 0.0 0.0 0.0(0.30 - 0.58) 0.0phainopepla 0.00 0.44 61.4 100.0 0.0(0.05 - 0.21) 0.0oak titmouse 0.00 0.13 7.7 100.0 0.0(0.06 - 0.18) 0.0Nuttall's woodpecker 0.00 0.12 25.0 100.0 0.0(0.00 - 0.05) 0.0northern rough-winged swallow 0.00 0.02 100.0 100.0 0.0(0.01 - 0.13) 0.0northern mockingbird 0.00 0.07 57.1 100.0 0.0(0.10 - 0.24) 0.0northern flicker 0.00 0.17 5.9 100.0 0.0(0.31 - 0.57) 0.0mourning dove 0.00 0.44 75.0 100.0 0.0(0.24 - 0.82) 0.0lesser goldfinch 0.00 0.53 67.9 100.0 0.0(0.00 - 0.06) 0.0ladder-backed woodpecker 0.00 0.03 33.3 100.0 0.0(0.00 - 0.16) 0.0Lawrence’s goldfinch 0.00 0.08 50.0 100.0 0.0(0.01 - 0.07) 0.0house wren 0.00 0.04 25.0 100.0 0.0(0.06 - 0.22) 0.0California thrasher 0.00 0.14 0.0 0.0 0.0(0.03 - 0.23) 0.0California quail 0.00 0.13 0.0 0.0 0.0(0.00 - 0.03) 0.0canyon wren 0.00 0.01 0.0 0.0 0.0(0.39 - 0.71) 0.0California towhee 0.00 0.55 21.8 100.0 0.0(0.00 - 0.03) 0.0Cassin's kingbird 0.00 0.01 0.0 0.0 0.0(0.01 - 0.63) 0.0bushtit 0.00 0.32 37.5 100.0 0.0(0.18 - 0.40) 0.0black-throated sparrow 0.00 0.29 10.3 100.0 0.0

Table 7d. Avian flight height characteristics in relation to the 3 MW turbine rotor swept area (RSA) 1 at the Tule Wind Resource Area, during Summer 2008.
Percent Flying
EncounterRate
Percent Below RSA
PercentWithin RSA
PercentAbove RSA
Species Mean Use# birds/ 30 min.
(90% confidence interval)
(0.00 - 0.03) 0.0band-tailed pigeon 0.00 0.01 100.0 100.0 0.0(0.00 - 0.03) 0.0blue grosbeak 0.00 0.01 0.0 0.0 0.0(0.04 - 0.18) 0.0black-headed grosbeak 0.00 0.11 63.6 100.0 0.0(0.00 - 0.03) 0.0brown-headed cowbird 0.00 0.01 100.0 100.0 0.0(0.00 - 0.04) 0.0blue-gray gnatcatcher 0.00 0.02 50.0 100.0 0.0(0.11 - 0.27) 0.0Bewick's wren 0.00 0.19 5.3 100.0 0.0(0.04 - 0.22) 0.0black-chinned sparrow 0.00 0.13 15.4 100.0 0.0(0.00 - 0.04) 0.0black-chinned hummingbird 0.00 0.02 50.0 100.0 0.0(0.11 - 0.27) 0.0ash-throated flycatcher 0.00 0.19 26.3 100.0 0.0(0.08 - 0.24) 0.0Anna’s hummingbird 0.00 0.16 43.8 100.0 0.0(0.00 - 0.04) 0.0American kestrel 0.00 0.02 50.0 100.0 0.0(0.01 - 0.13) 0.0American crow 0.00 0.07 57.1 100.0 0.0(0.08 - 0.38) 0.0acorn woodpecker 0.00 0.23 8.7 100.0 0.0
1These values assume a rotor diameter of 90 (m) and a hub height of 105 (m)

Table 7e. Avian flight height characteristics in relation to the 1.5 MW turbine rotor swept area (RSA) 1 at the Tule Wind Resource Area, during Fall 2007.
Percent Flying
EncounterRate
Percent Below RSA
PercentWithin RSA
PercentAbove RSA
Species Mean Use# birds/ 30 min.
(90% confidence interval)
(0.00 - 5.26) 0.0Vaux's swift 1.40 1.99 100.0 29.8 70.2(0.94 - 1.80) 11.3common raven 0.69 1.37 87.1 31.3 57.5(0.27 - 1.91) 39.7white-throated swift 0.52 1.09 100.0 12.3 47.9(0.35 - 0.65) 18.5red-tailed hawk 0.23 0.50 82.4 25.9 55.6(0.00 - 0.26) 33.3turkey vulture 0.07 0.13 100.0 11.1 55.6(0.00 - 0.19) 0.0northern rough-winged swallow 0.07 0.07 100.0 0.0 100.0(0.03 - 0.15) 0.0Cooper's hawk 0.07 0.09 100.0 16.7 83.3(0.00 - 0.16) 0.0barn swallow 0.07 0.07 100.0 0.0 100.0(0.07 - 0.29) 0.0unidentified songbird 0.05 0.18 100.0 75.0 25.0(0.00 - 0.11) 0.0cliff swallow 0.04 0.04 100.0 0.0 100.0(0.01 - 0.11) 0.0unidentified hummingbird 0.02 0.06 100.0 75.0 25.0(0.00 - 0.03) 0.0golden eagle 0.01 0.01 100.0 0.0 100.0(0.00 - 0.03) 0.0American kestrel 0.01 0.01 100.0 0.0 100.0(0.27 - 0.59) 0.0wrentit 0.00 0.43 6.9 100.0 0.0(1.53 - 2.49) 0.0western scrub-jay 0.00 2.01 47.4 100.0 0.0(0.00 - 0.63) 0.0western bluebird 0.00 0.28 84.2 100.0 0.0(0.00 - 0.17) 0.0white-crowned sparrow 0.00 0.07 100.0 100.0 0.0(0.00 - 0.03) 0.0unidentified piranga tanager 0.00 0.01 100.0 100.0 0.0(0.00 - 0.03) 0.0unidentified sparrow 0.00 0.01 100.0 100.0 0.0(0.00 - 0.08) 0.0unidentified raptor 0.00 0.03 100.0 100.0 0.0(0.00 - 0.03) 0.0unidentified quail 0.00 0.01 0.0 0.0 0.0(0.00 - 0.03) 0.0sharp-shinned hawk 0.00 0.01 100.0 100.0 0.0(0.02 - 0.16) 0.0spotted towhee 0.00 0.09 33.3 100.0 0.0(0.00 - 0.06) 0.0rock wren 0.00 0.03 50.0 100.0 0.0(0.00 - 0.06) 0.0ruby-crowned kinglet 0.00 0.03 50.0 100.0 0.0(0.00 - 0.06) 0.0phainopepla 0.00 0.03 0.0 0.0 0.0
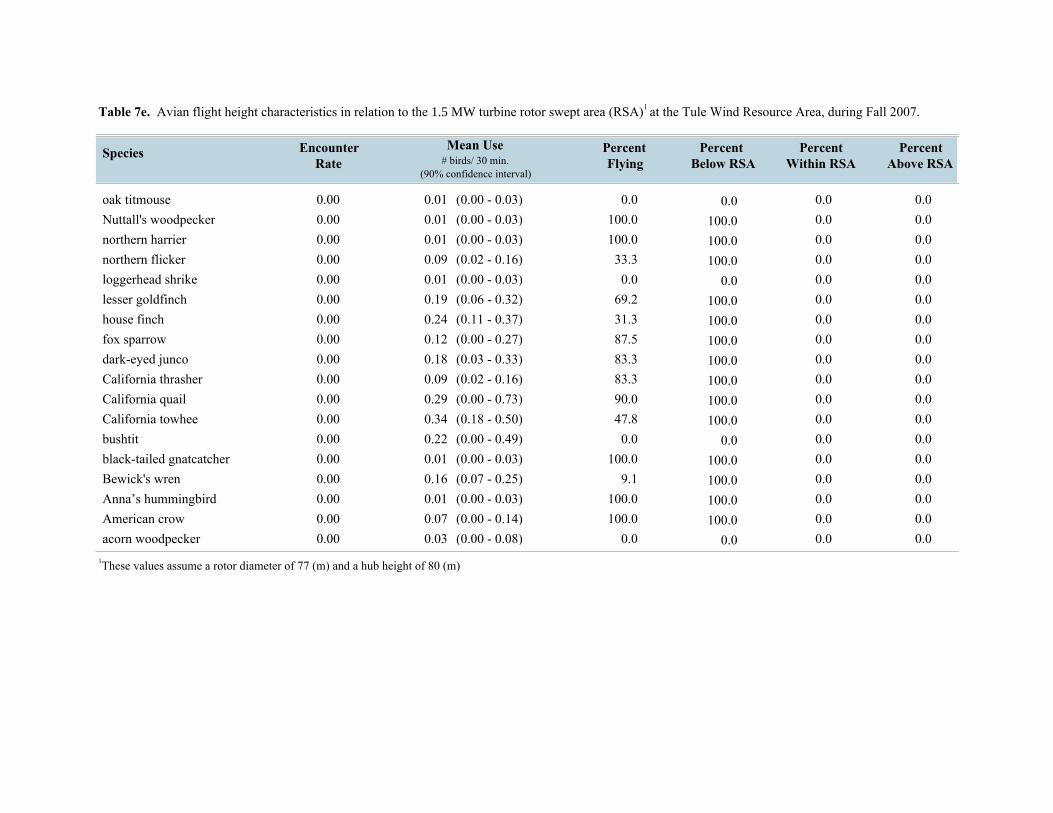
Table 7e. Avian flight height characteristics in relation to the 1.5 MW turbine rotor swept area (RSA) 1 at the Tule Wind Resource Area, during Fall 2007.
Percent Flying
EncounterRate
Percent Below RSA
PercentWithin RSA
PercentAbove RSA
Species Mean Use# birds/ 30 min.
(90% confidence interval)
(0.00 - 0.03) 0.0oak titmouse 0.00 0.01 0.0 0.0 0.0(0.00 - 0.03) 0.0Nuttall's woodpecker 0.00 0.01 100.0 100.0 0.0(0.00 - 0.03) 0.0northern harrier 0.00 0.01 100.0 100.0 0.0(0.02 - 0.16) 0.0northern flicker 0.00 0.09 33.3 100.0 0.0(0.00 - 0.03) 0.0loggerhead shrike 0.00 0.01 0.0 0.0 0.0(0.06 - 0.32) 0.0lesser goldfinch 0.00 0.19 69.2 100.0 0.0(0.11 - 0.37) 0.0house finch 0.00 0.24 31.3 100.0 0.0(0.00 - 0.27) 0.0fox sparrow 0.00 0.12 87.5 100.0 0.0(0.03 - 0.33) 0.0dark-eyed junco 0.00 0.18 83.3 100.0 0.0(0.02 - 0.16) 0.0California thrasher 0.00 0.09 83.3 100.0 0.0(0.00 - 0.73) 0.0California quail 0.00 0.29 90.0 100.0 0.0(0.18 - 0.50) 0.0California towhee 0.00 0.34 47.8 100.0 0.0(0.00 - 0.49) 0.0bushtit 0.00 0.22 0.0 0.0 0.0(0.00 - 0.03) 0.0black-tailed gnatcatcher 0.00 0.01 100.0 100.0 0.0(0.07 - 0.25) 0.0Bewick's wren 0.00 0.16 9.1 100.0 0.0(0.00 - 0.03) 0.0Anna’s hummingbird 0.00 0.01 100.0 100.0 0.0(0.00 - 0.14) 0.0American crow 0.00 0.07 100.0 100.0 0.0(0.00 - 0.08) 0.0acorn woodpecker 0.00 0.03 0.0 0.0 0.0
1These values assume a rotor diameter of 77 (m) and a hub height of 80 (m)
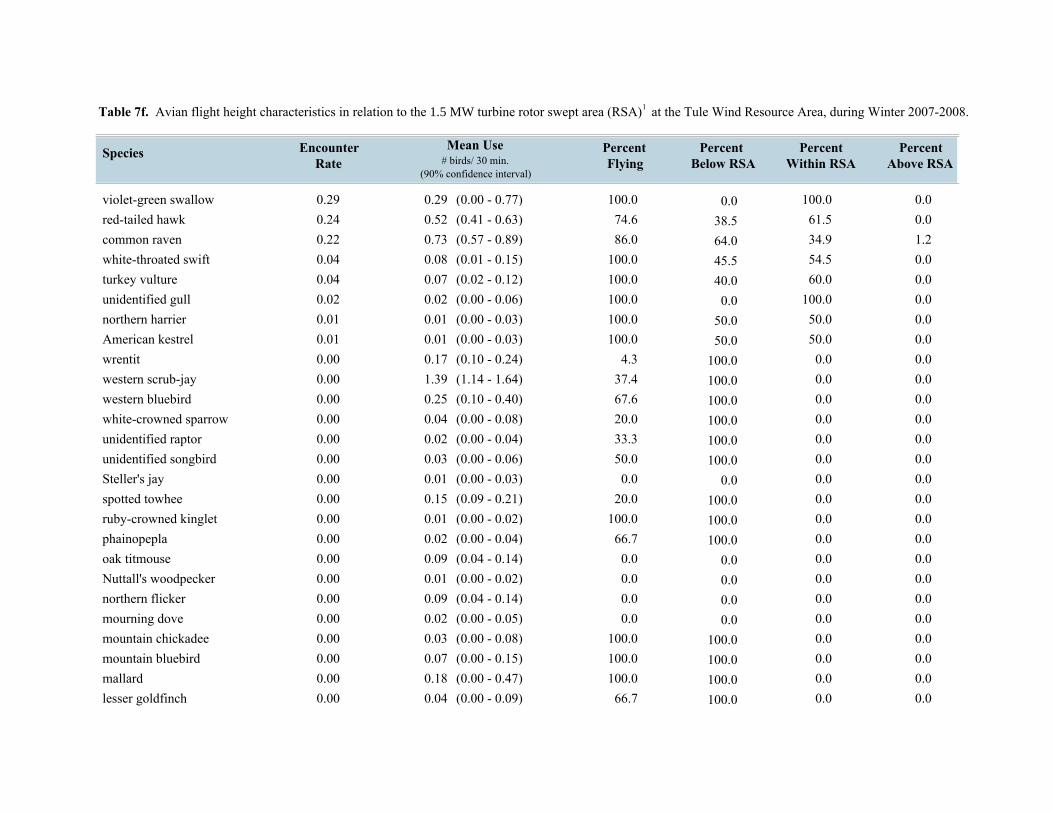
Table 7f. Avian flight height characteristics in relation to the 1.5 MW turbine rotor swept area (RSA) 1 at the Tule Wind Resource Area, during Winter 2007-2008.
Percent Flying
EncounterRate
Percent Below RSA
PercentWithin RSA
PercentAbove RSA
Species Mean Use# birds/ 30 min.
(90% confidence interval)
(0.00 - 0.77) 0.0violet-green swallow 0.29 0.29 100.0 0.0 100.0(0.41 - 0.63) 0.0red-tailed hawk 0.24 0.52 74.6 38.5 61.5(0.57 - 0.89) 1.2common raven 0.22 0.73 86.0 64.0 34.9(0.01 - 0.15) 0.0white-throated swift 0.04 0.08 100.0 45.5 54.5(0.02 - 0.12) 0.0turkey vulture 0.04 0.07 100.0 40.0 60.0(0.00 - 0.06) 0.0unidentified gull 0.02 0.02 100.0 0.0 100.0(0.00 - 0.03) 0.0northern harrier 0.01 0.01 100.0 50.0 50.0(0.00 - 0.03) 0.0American kestrel 0.01 0.01 100.0 50.0 50.0(0.10 - 0.24) 0.0wrentit 0.00 0.17 4.3 100.0 0.0(1.14 - 1.64) 0.0western scrub-jay 0.00 1.39 37.4 100.0 0.0(0.10 - 0.40) 0.0western bluebird 0.00 0.25 67.6 100.0 0.0(0.00 - 0.08) 0.0white-crowned sparrow 0.00 0.04 20.0 100.0 0.0(0.00 - 0.04) 0.0unidentified raptor 0.00 0.02 33.3 100.0 0.0(0.00 - 0.06) 0.0unidentified songbird 0.00 0.03 50.0 100.0 0.0(0.00 - 0.03) 0.0Steller's jay 0.00 0.01 0.0 0.0 0.0(0.09 - 0.21) 0.0spotted towhee 0.00 0.15 20.0 100.0 0.0(0.00 - 0.02) 0.0ruby-crowned kinglet 0.00 0.01 100.0 100.0 0.0(0.00 - 0.04) 0.0phainopepla 0.00 0.02 66.7 100.0 0.0(0.04 - 0.14) 0.0oak titmouse 0.00 0.09 0.0 0.0 0.0(0.00 - 0.02) 0.0Nuttall's woodpecker 0.00 0.01 0.0 0.0 0.0(0.04 - 0.14) 0.0northern flicker 0.00 0.09 0.0 0.0 0.0(0.00 - 0.05) 0.0mourning dove 0.00 0.02 0.0 0.0 0.0(0.00 - 0.08) 0.0mountain chickadee 0.00 0.03 100.0 100.0 0.0(0.00 - 0.15) 0.0mountain bluebird 0.00 0.07 100.0 100.0 0.0(0.00 - 0.47) 0.0mallard 0.00 0.18 100.0 100.0 0.0(0.00 - 0.09) 0.0lesser goldfinch 0.00 0.04 66.7 100.0 0.0

Table 7f. Avian flight height characteristics in relation to the 1.5 MW turbine rotor swept area (RSA) 1 at the Tule Wind Resource Area, during Winter 2007-2008.
Percent Flying
EncounterRate
Percent Below RSA
PercentWithin RSA
PercentAbove RSA
Species Mean Use# birds/ 30 min.
(90% confidence interval)
(0.01 - 0.05) 0.0ladder-backed woodpecker 0.00 0.03 50.0 100.0 0.0(0.03 - 0.13) 0.0house finch 0.00 0.08 63.6 100.0 0.0(0.01 - 0.07) 0.0fox sparrow 0.00 0.04 83.3 100.0 0.0(0.02 - 0.20) 0.0dark-eyed junco 0.00 0.11 53.3 100.0 0.0(0.22 - 0.40) 0.0California thrasher 0.00 0.31 7.0 100.0 0.0(0.00 - 0.18) 0.0California quail 0.00 0.09 0.0 0.0 0.0(0.16 - 0.34) 0.0California towhee 0.00 0.25 14.7 100.0 0.0(0.00 - 0.37) 0.0bushtit 0.00 0.17 95.7 100.0 0.0(0.00 - 0.08) 0.0black-throated sparrow 0.00 0.04 60.0 100.0 0.0(0.00 - 0.02) 0.0band-tailed pigeon 0.00 0.01 0.0 0.0 0.0(0.03 - 0.11) 0.0Bewick's wren 0.00 0.07 10.0 100.0 0.0(0.00 - 0.10) 0.0acorn woodpecker 0.00 0.04 0.0 0.0 0.0
1These values assume a rotor diameter of 77 (m) and a hub height of 80 (m)

Table 7g. Avian flight height characteristics in relation to the 1.5 MW turbine rotor swept area (RSA) 1 at the Tule Wind Resource Area, during Spring 2008.
Percent Flying
EncounterRate
Percent Below RSA
PercentWithin RSA
PercentAbove RSA
Species Mean Use# birds/ 30 min.
(90% confidence interval)
(1.05 - 1.61) 8.3common raven 0.46 1.33 86.6 51.7 40.0(0.43 - 0.69) 0.0turkey vulture 0.37 0.56 100.0 33.3 66.7(0.34 - 0.58) 7.0red-tailed hawk 0.30 0.46 87.8 18.6 74.4(0.00 - 0.52) 0.0cliff swallow 0.19 0.21 100.0 9.1 90.9(0.11 - 0.53) 0.0white-throated swift 0.10 0.32 97.1 67.7 32.3(0.00 - 0.03) 0.0prairie falcon 0.01 0.01 100.0 0.0 100.0(0.14 - 0.32) 0.0mourning dove 0.01 0.23 56.0 92.9 7.1(0.00 - 0.03) 0.0double-crested cormorant 0.01 0.01 100.0 0.0 100.0(0.00 - 0.04) 0.0Cooper's hawk 0.01 0.02 100.0 50.0 50.0(0.00 - 0.04) 0.0American kestrel 0.01 0.02 100.0 50.0 50.0(0.01 - 0.15) 0.0yellow-rumped warbler 0.00 0.08 33.3 100.0 0.0(0.29 - 0.53) 0.0wrentit 0.00 0.41 0.0 0.0 0.0(0.00 - 0.04) 0.0Wilson's warbler 0.00 0.02 100.0 100.0 0.0(0.00 - 0.05) 0.0western wood-pewee 0.00 0.02 0.0 0.0 0.0(1.13 - 1.59) 0.0western scrub-jay 0.00 1.36 21.9 100.0 0.0(0.00 - 0.08) 0.0western bluebird 0.00 0.04 100.0 100.0 0.0(0.00 - 0.08) 0.0white-crowned sparrow 0.00 0.03 0.0 0.0 0.0(0.02 - 0.12) 0.0unidentified songbird 0.00 0.07 87.5 100.0 0.0(0.00 - 0.08) 0.0unidentified hummingbird 0.00 0.04 50.0 100.0 0.0(0.00 - 0.03) 0.0unidentified empidonax flycatcher 0.00 0.01 0.0 0.0 0.0(0.00 - 0.04) 0.0Townsend's Warbler 0.00 0.02 0.0 0.0 0.0(0.00 - 0.14) 0.0Steller's jay 0.00 0.07 0.0 0.0 0.0(0.44 - 0.70) 0.0spotted towhee 0.00 0.57 1.6 100.0 0.0(0.00 - 0.04) 0.0Scott's oriole 0.00 0.02 50.0 100.0 0.0(0.00 - 0.03) 0.0sage sparrow 0.00 0.01 100.0 100.0 0.0(0.00 - 0.04) 0.0ruby-crowned kinglet 0.00 0.02 50.0 100.0 0.0

Table 7g. Avian flight height characteristics in relation to the 1.5 MW turbine rotor swept area (RSA) 1 at the Tule Wind Resource Area, during Spring 2008.
Percent Flying
EncounterRate
Percent Below RSA
PercentWithin RSA
PercentAbove RSA
Species Mean Use# birds/ 30 min.
(90% confidence interval)
(0.00 - 0.03) 0.0pacific-slope flycatcher 0.00 0.01 0.0 0.0 0.0(0.01 - 0.17) 0.0phainopepla 0.00 0.09 80.0 100.0 0.0(0.00 - 0.03) 0.0osprey 0.00 0.01 100.0 100.0 0.0(0.01 - 0.09) 0.0orange-crowned warbler 0.00 0.05 60.0 100.0 0.0(0.02 - 0.24) 0.0oak titmouse 0.00 0.13 7.1 100.0 0.0(0.00 - 0.03) 0.0Nuttall's woodpecker 0.00 0.01 0.0 0.0 0.0(0.00 - 0.06) 0.0northern mockingbird 0.00 0.03 0.0 0.0 0.0(0.03 - 0.15) 0.0northern flicker 0.00 0.09 0.0 0.0 0.0(0.00 - 0.03) 0.0Nashville warbler 0.00 0.01 0.0 0.0 0.0(0.00 - 0.03) 0.0mountain chickadee 0.00 0.01 0.0 0.0 0.0(0.00 - 0.10) 0.0lesser goldfinch 0.00 0.05 80.0 100.0 0.0(0.00 - 0.03) 0.0house wren 0.00 0.01 0.0 0.0 0.0(0.00 - 0.11) 0.0horned lark 0.00 0.05 80.0 100.0 0.0(0.21 - 0.55) 0.0house finch 0.00 0.38 73.2 100.0 0.0(0.00 - 0.03) 0.0Hammond’s flycatcher 0.00 0.01 0.0 0.0 0.0(0.00 - 0.03) 0.0golden eagle 0.00 0.01 100.0 100.0 0.0(0.00 - 0.03) 0.0downy woodpecker 0.00 0.01 0.0 0.0 0.0(0.00 - 0.12) 0.0dark-eyed junco 0.00 0.06 83.3 100.0 0.0(0.24 - 0.44) 0.0California thrasher 0.00 0.34 11.1 100.0 0.0(0.12 - 0.30) 0.0California quail 0.00 0.21 0.0 0.0 0.0(0.00 - 0.03) 0.0canyon wren 0.00 0.01 0.0 0.0 0.0(0.26 - 0.46) 0.0California towhee 0.00 0.36 7.7 100.0 0.0(0.00 - 0.24) 0.0bushtit 0.00 0.12 76.9 100.0 0.0(0.09 - 0.29) 0.0black-throated sparrow 0.00 0.19 10.0 100.0 0.0(0.03 - 0.13) 0.0black-headed grosbeak 0.00 0.08 22.2 100.0 0.0(0.00 - 0.05) 0.0blue-gray gnatcatcher 0.00 0.02 0.0 0.0 0.0
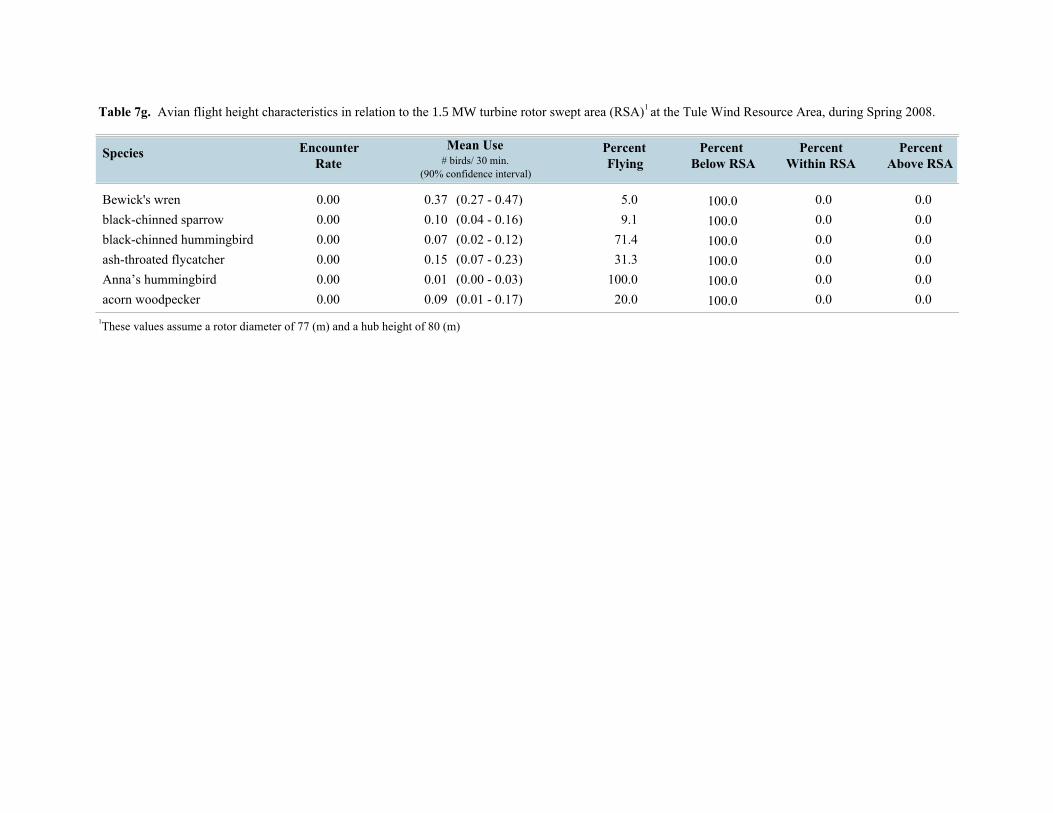
Table 7g. Avian flight height characteristics in relation to the 1.5 MW turbine rotor swept area (RSA) 1 at the Tule Wind Resource Area, during Spring 2008.
Percent Flying
EncounterRate
Percent Below RSA
PercentWithin RSA
PercentAbove RSA
Species Mean Use# birds/ 30 min.
(90% confidence interval)
(0.27 - 0.47) 0.0Bewick's wren 0.00 0.37 5.0 100.0 0.0(0.04 - 0.16) 0.0black-chinned sparrow 0.00 0.10 9.1 100.0 0.0(0.02 - 0.12) 0.0black-chinned hummingbird 0.00 0.07 71.4 100.0 0.0(0.07 - 0.23) 0.0ash-throated flycatcher 0.00 0.15 31.3 100.0 0.0(0.00 - 0.03) 0.0Anna’s hummingbird 0.00 0.01 100.0 100.0 0.0(0.01 - 0.17) 0.0acorn woodpecker 0.00 0.09 20.0 100.0 0.0
1These values assume a rotor diameter of 77 (m) and a hub height of 80 (m)

Table 7h. Avian flight height characteristics in relation to the 1.5 MW turbine rotor swept area (RSA) 1 at the Tule Wind Resource Area, during Summer 2008.
Percent Flying
EncounterRate
Percent Below RSA
PercentWithin RSA
PercentAbove RSA
Species Mean Use# birds/ 30 min.
(90% confidence interval)
(0.46 - 1.44) 15.8white-throated swift 0.70 0.95 100.0 10.5 73.7(0.57 - 1.17) 8.0turkey vulture 0.70 0.87 100.0 11.5 80.5(0.32 - 0.90) 0.0common raven 0.34 0.61 90.2 38.9 61.1(0.34 - 0.62) 7.7red-tailed hawk 0.24 0.48 81.3 30.8 61.5(2.14 - 2.98) 0.0western scrub-jay 0.12 2.56 29.7 84.2 15.8(0.00 - 0.21) 0.0unidentified swallow 0.10 0.10 100.0 0.0 100.0(0.81 - 1.49) 0.0house finch 0.08 1.15 63.5 89.1 10.9(0.00 - 0.16) 0.0cliff swallow 0.07 0.08 100.0 12.5 87.5(0.01 - 0.09) 20.0Cooper's hawk 0.03 0.05 100.0 20.0 60.0(0.00 - 0.05) 0.0unidentified falcon 0.02 0.02 100.0 0.0 100.0(0.31 - 0.57) 0.0mourning dove 0.02 0.44 75.0 93.8 6.3(0.00 - 0.03) 0.0barn swallow 0.01 0.01 100.0 0.0 100.0(0.00 - 0.03) 0.0yellow warbler 0.00 0.01 100.0 100.0 0.0(0.38 - 0.70) 0.0wrentit 0.00 0.54 0.0 0.0 0.0(0.00 - 0.04) 0.0Wilson's warbler 0.00 0.02 0.0 0.0 0.0(0.00 - 0.04) 0.0western wood-pewee 0.00 0.02 50.0 100.0 0.0(0.00 - 0.12) 0.0western tanager 0.00 0.06 83.3 100.0 0.0(0.01 - 0.09) 0.0western kingbird 0.00 0.05 60.0 100.0 0.0(0.01 - 0.27) 0.0western bluebird 0.00 0.14 64.3 100.0 0.0(0.00 - 0.03) 0.0unidentified woodpecker 0.00 0.01 100.0 100.0 0.0(0.00 - 0.03) 0.0unidentified warbler 0.00 0.01 100.0 100.0 0.0(0.01 - 0.09) 0.0unidentified sparrow 0.00 0.05 100.0 100.0 0.0(0.00 - 0.03) 0.0unidentified songbird 0.00 0.01 100.0 100.0 0.0(0.22 - 0.48) 0.0unidentified hummingbird 0.00 0.35 100.0 100.0 0.0(0.00 - 0.03) 0.0unidentified empidonax flycatcher 0.00 0.01 100.0 100.0 0.0(0.00 - 0.14) 0.0Steller's jay 0.00 0.07 42.9 100.0 0.0

Table 7h. Avian flight height characteristics in relation to the 1.5 MW turbine rotor swept area (RSA) 1 at the Tule Wind Resource Area, during Summer 2008.
Percent Flying
EncounterRate
Percent Below RSA
PercentWithin RSA
PercentAbove RSA
Species Mean Use# birds/ 30 min.
(90% confidence interval)
(0.00 - 0.03) 0.0sharp-shinned hawk 0.00 0.01 100.0 100.0 0.0(0.24 - 0.44) 0.0spotted towhee 0.00 0.34 8.8 100.0 0.0(0.00 - 0.04) 0.0Scott's oriole 0.00 0.02 0.0 0.0 0.0(0.00 - 0.05) 0.0savannah sparrow 0.00 0.02 0.0 0.0 0.0(0.00 - 0.03) 0.0Say's phoebe 0.00 0.01 100.0 100.0 0.0(0.10 - 0.40) 0.0sage sparrow 0.00 0.25 52.0 100.0 0.0(0.12 - 0.28) 0.0rock wren 0.00 0.20 20.0 100.0 0.0(0.00 - 0.03) 0.0rufous-crowned sparrow 0.00 0.01 0.0 0.0 0.0(0.00 - 0.04) 0.0pacific-slope flycatcher 0.00 0.02 0.0 0.0 0.0(0.30 - 0.58) 0.0phainopepla 0.00 0.44 61.4 100.0 0.0(0.05 - 0.21) 0.0oak titmouse 0.00 0.13 7.7 100.0 0.0(0.06 - 0.18) 0.0Nuttall's woodpecker 0.00 0.12 25.0 100.0 0.0(0.00 - 0.05) 0.0northern rough-winged swallow 0.00 0.02 100.0 100.0 0.0(0.01 - 0.13) 0.0northern mockingbird 0.00 0.07 57.1 100.0 0.0(0.10 - 0.24) 0.0northern flicker 0.00 0.17 5.9 100.0 0.0(0.24 - 0.82) 0.0lesser goldfinch 0.00 0.53 67.9 100.0 0.0(0.00 - 0.06) 0.0ladder-backed woodpecker 0.00 0.03 33.3 100.0 0.0(0.00 - 0.16) 0.0Lawrence’s goldfinch 0.00 0.08 50.0 100.0 0.0(0.01 - 0.07) 0.0house wren 0.00 0.04 25.0 100.0 0.0(0.06 - 0.22) 0.0California thrasher 0.00 0.14 0.0 0.0 0.0(0.03 - 0.23) 0.0California quail 0.00 0.13 0.0 0.0 0.0(0.00 - 0.03) 0.0canyon wren 0.00 0.01 0.0 0.0 0.0(0.39 - 0.71) 0.0California towhee 0.00 0.55 21.8 100.0 0.0(0.00 - 0.03) 0.0Cassin's kingbird 0.00 0.01 0.0 0.0 0.0(0.01 - 0.63) 0.0bushtit 0.00 0.32 37.5 100.0 0.0(0.18 - 0.40) 0.0black-throated sparrow 0.00 0.29 10.3 100.0 0.0
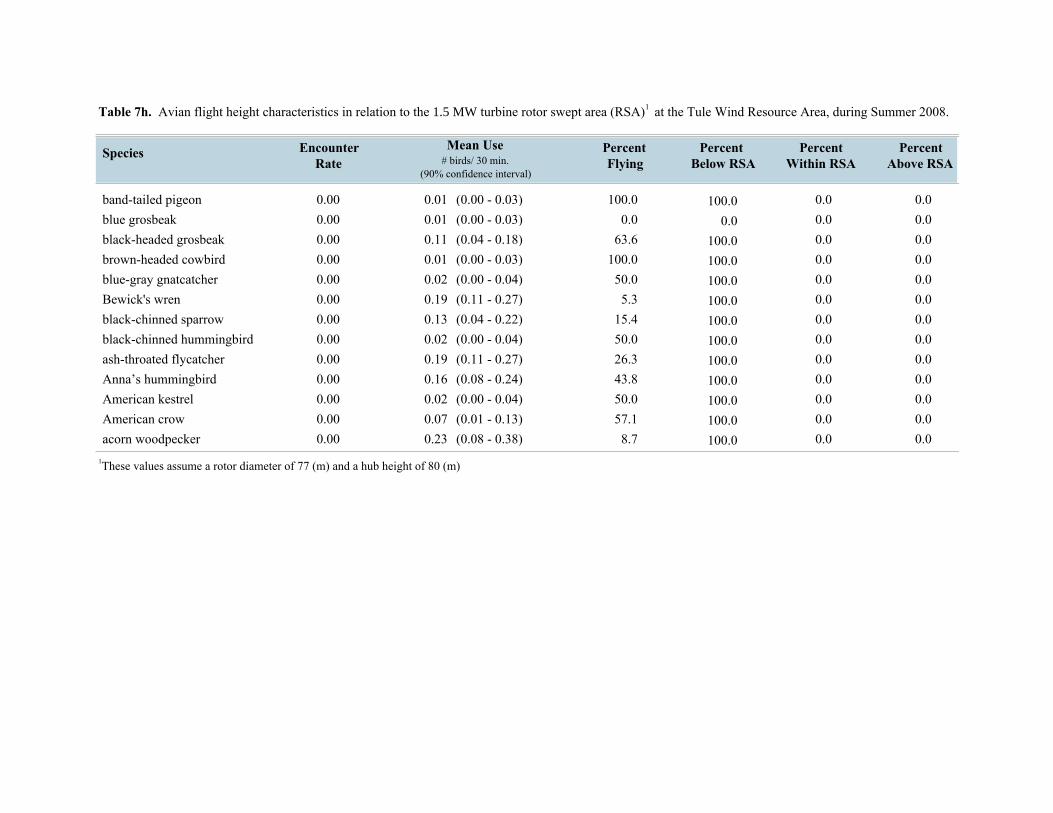
Table 7h. Avian flight height characteristics in relation to the 1.5 MW turbine rotor swept area (RSA) 1 at the Tule Wind Resource Area, during Summer 2008.
Percent Flying
EncounterRate
Percent Below RSA
PercentWithin RSA
PercentAbove RSA
Species Mean Use# birds/ 30 min.
(90% confidence interval)
(0.00 - 0.03) 0.0band-tailed pigeon 0.00 0.01 100.0 100.0 0.0(0.00 - 0.03) 0.0blue grosbeak 0.00 0.01 0.0 0.0 0.0(0.04 - 0.18) 0.0black-headed grosbeak 0.00 0.11 63.6 100.0 0.0(0.00 - 0.03) 0.0brown-headed cowbird 0.00 0.01 100.0 100.0 0.0(0.00 - 0.04) 0.0blue-gray gnatcatcher 0.00 0.02 50.0 100.0 0.0(0.11 - 0.27) 0.0Bewick's wren 0.00 0.19 5.3 100.0 0.0(0.04 - 0.22) 0.0black-chinned sparrow 0.00 0.13 15.4 100.0 0.0(0.00 - 0.04) 0.0black-chinned hummingbird 0.00 0.02 50.0 100.0 0.0(0.11 - 0.27) 0.0ash-throated flycatcher 0.00 0.19 26.3 100.0 0.0(0.08 - 0.24) 0.0Anna’s hummingbird 0.00 0.16 43.8 100.0 0.0(0.00 - 0.04) 0.0American kestrel 0.00 0.02 50.0 100.0 0.0(0.01 - 0.13) 0.0American crow 0.00 0.07 57.1 100.0 0.0(0.08 - 0.38) 0.0acorn woodpecker 0.00 0.23 8.7 100.0 0.0
1These values assume a rotor diameter of 77 (m) and a hub height of 80 (m)

Table 7i. Avian flight height characteristics in relation to the 3 MW turbine rotor swept area (RSA) 1 at the Tule Wind Resource Area, from 2007-2008.
Percent Flying
EncounterRate
Percent Below RSA
PercentWithin RSA
PercentAbove RSA
Species Mean Use# birds/ 30 min.
(90% confidence interval)
6.2white-throated swift 0.34 0.52 99.5 27.1 66.7(0.00 - 1.08)3.8common raven 0.29 0.96 87.1 61.2 35.0(0.40 - 1.52)3.0turkey vulture 0.25 0.40 100.0 33.7 63.3(0.00 - 0.96)0.0Vaux's swift 0.21 0.33 100.0 35.9 64.1(0.00 - 1.00)3.7red-tailed hawk 0.21 0.49 80.7 44.1 52.2(0.00 - 1.05)0.0violet-green swallow 0.10 0.10 100.0 0.0 100.0(0.00 - 0.57)0.0cliff swallow 0.06 0.08 100.0 21.2 78.8(0.00 - 0.64)0.0western scrub-jay 0.03 1.77 33.5 95.1 4.9(1.21 - 2.33)0.0unidentified swallow 0.02 0.02 100.0 0.0 100.0(0.00 - 0.58)7.7Cooper's hawk 0.02 0.03 100.0 38.5 53.8(0.00 - 0.59)0.0unidentified songbird 0.01 0.06 88.0 85.7 14.3(0.00 - 0.62)0.0unidentified gull 0.01 0.01 100.0 0.0 100.0(0.00 - 0.48)0.0house finch 0.01 0.44 62.8 94.8 5.2(0.00 - 1.00)0.0barn swallow 0.01 0.01 100.0 33.3 66.7(0.00 - 0.57)0.0yellow warbler 0.00 0.00 100.0 100.0 0.0(0.00 - 0.56)0.0yellow-rumped warbler 0.00 0.02 33.3 100.0 0.0(0.00 - 0.56)0.0wrentit 0.00 0.36 2.0 100.0 0.0(0.00 - 0.92)0.0Wilson's warbler 0.00 0.01 50.0 100.0 0.0(0.00 - 0.57)0.0western wood-pewee 0.00 0.01 25.0 100.0 0.0(0.00 - 0.57)0.0western tanager 0.00 0.01 83.3 100.0 0.0(0.00 - 0.57)0.0western kingbird 0.00 0.01 60.0 100.0 0.0(0.00 - 0.57)0.0western bluebird 0.00 0.17 73.2 100.0 0.0(0.00 - 0.73)0.0white-crowned sparrow 0.00 0.03 46.2 100.0 0.0(0.00 - 0.57)0.0unidentified piranga tanager 0.00 0.00 100.0 100.0 0.0(0.00 - 0.68)0.0unidentified woodpecker 0.00 0.00 100.0 100.0 0.0(0.00 - 0.56)0.0unidentified warbler 0.00 0.00 100.0 100.0 0.0(0.00 - 0.56)

Table 7i. Avian flight height characteristics in relation to the 3 MW turbine rotor swept area (RSA) 1 at the Tule Wind Resource Area, from 2007-2008.
Percent Flying
EncounterRate
Percent Below RSA
PercentWithin RSA
PercentAbove RSA
Species Mean Use# birds/ 30 min.
(90% confidence interval)
0.0unidentified sparrow 0.00 0.01 100.0 100.0 0.0(0.00 - 0.57)0.0unidentified raptor 0.00 0.01 60.0 100.0 0.0(0.00 - 0.49)0.0unidentified quail 0.00 0.00 0.0 0.0 0.0(0.00 - 0.68)0.0unidentified hummingbird 0.00 0.10 95.3 97.5 2.5(0.00 - 0.66)0.0unidentified falcon 0.00 0.00 100.0 0.0 100.0(0.00 - 0.56)0.0unidentified empidonax flycatcher 0.00 0.00 50.0 100.0 0.0(0.00 - 0.56)0.0Townsend's Warbler 0.00 0.00 0.0 0.0 0.0(0.00 - 0.54)0.0Steller's jay 0.00 0.04 18.8 100.0 0.0(0.00 - 0.60)0.0sharp-shinned hawk 0.00 0.00 100.0 100.0 0.0(0.00 - 0.56)0.0spotted towhee 0.00 0.29 8.3 100.0 0.0(0.00 - 0.85)0.0Scott's oriole 0.00 0.01 25.0 100.0 0.0(0.00 - 0.57)0.0savannah sparrow 0.00 0.00 0.0 0.0 0.0(0.00 - 0.56)0.0Say's phoebe 0.00 0.00 100.0 100.0 0.0(0.00 - 0.56)0.0sage sparrow 0.00 0.06 53.8 100.0 0.0(0.00 - 0.62)0.0rock wren 0.00 0.05 22.7 100.0 0.0(0.00 - 0.61)0.0rufous-crowned sparrow 0.00 0.00 0.0 0.0 0.0(0.00 - 0.56)0.0ruby-crowned kinglet 0.00 0.01 60.0 100.0 0.0(0.00 - 0.55)0.0pacific-slope flycatcher 0.00 0.01 0.0 0.0 0.0(0.00 - 0.56)0.0prairie falcon 0.00 0.00 100.0 0.0 100.0(0.00 - 0.54)0.0phainopepla 0.00 0.14 62.7 100.0 0.0(0.00 - 0.70)0.0osprey 0.00 0.00 100.0 100.0 0.0(0.00 - 0.54)0.0orange-crowned warbler 0.00 0.01 60.0 100.0 0.0(0.00 - 0.55)0.0oak titmouse 0.00 0.10 5.0 100.0 0.0(0.00 - 0.65)0.0Nuttall's woodpecker 0.00 0.04 26.7 100.0 0.0(0.00 - 0.59)0.0northern rough-winged swallow 0.00 0.02 100.0 100.0 0.0(0.00 - 0.57)0.0northern mockingbird 0.00 0.02 40.0 100.0 0.0(0.00 - 0.58)

Table 7i. Avian flight height characteristics in relation to the 3 MW turbine rotor swept area (RSA) 1 at the Tule Wind Resource Area, from 2007-2008.
Percent Flying
EncounterRate
Percent Below RSA
PercentWithin RSA
PercentAbove RSA
Species Mean Use# birds/ 30 min.
(90% confidence interval)
0.0northern harrier 0.00 0.01 100.0 100.0 0.0(0.00 - 0.68)0.0northern flicker 0.00 0.11 6.7 100.0 0.0(0.00 - 0.67)0.0Nashville warbler 0.00 0.00 0.0 0.0 0.0(0.00 - 0.54)0.0mourning dove 0.00 0.17 65.3 100.0 0.0(0.00 - 0.73)0.0mountain chickadee 0.00 0.01 80.0 100.0 0.0(0.00 - 0.55)0.0mountain bluebird 0.00 0.02 100.0 100.0 0.0(0.00 - 0.50)0.0mallard 0.00 0.06 100.0 100.0 0.0(0.00 - 0.53)0.0loggerhead shrike 0.00 0.00 0.0 0.0 0.0(0.00 - 0.68)0.0lesser goldfinch 0.00 0.19 68.8 100.0 0.0(0.00 - 0.74)0.0ladder-backed woodpecker 0.00 0.02 42.9 100.0 0.0(0.00 - 0.57)0.0Lawrence’s goldfinch 0.00 0.02 50.0 100.0 0.0(0.00 - 0.58)0.0house wren 0.00 0.01 20.0 100.0 0.0(0.00 - 0.57)0.0horned lark 0.00 0.01 80.0 100.0 0.0(0.00 - 0.55)0.0Hammond’s flycatcher 0.00 0.00 0.0 0.0 0.0(0.00 - 0.54)0.0golden eagle 0.00 0.00 100.0 50.0 50.0(0.00 - 0.54)0.0fox sparrow 0.00 0.03 85.7 100.0 0.0(0.00 - 0.51)0.0downy woodpecker 0.00 0.00 0.0 0.0 0.0(0.00 - 0.54)0.0dark-eyed junco 0.00 0.08 69.7 100.0 0.0(0.00 - 0.62)0.0double-crested cormorant 0.00 0.00 100.0 0.0 100.0(0.00 - 0.54)0.0California thrasher 0.00 0.24 12.1 100.0 0.0(0.00 - 0.80)0.0California quail 0.00 0.17 26.1 100.0 0.0(0.00 - 0.72)0.0canyon wren 0.00 0.00 0.0 0.0 0.0(0.00 - 0.56)0.0California towhee 0.00 0.37 20.5 100.0 0.0(0.00 - 0.92)0.0Cassin's kingbird 0.00 0.00 0.0 0.0 0.0(0.00 - 0.56)0.0bushtit 0.00 0.20 53.0 100.0 0.0(0.00 - 0.76)0.0black-throated sparrow 0.00 0.13 14.8 100.0 0.0(0.00 - 0.69)

Table 7i. Avian flight height characteristics in relation to the 3 MW turbine rotor swept area (RSA) 1 at the Tule Wind Resource Area, from 2007-2008.
Percent Flying
EncounterRate
Percent Below RSA
PercentWithin RSA
PercentAbove RSA
Species Mean Use# birds/ 30 min.
(90% confidence interval)
0.0band-tailed pigeon 0.00 0.00 50.0 100.0 0.0(0.00 - 0.56)0.0black-tailed gnatcatcher 0.00 0.00 100.0 100.0 0.0(0.00 - 0.68)0.0blue grosbeak 0.00 0.00 0.0 0.0 0.0(0.00 - 0.56)0.0black-headed grosbeak 0.00 0.05 45.0 100.0 0.0(0.00 - 0.60)0.0brown-headed cowbird 0.00 0.00 100.0 100.0 0.0(0.00 - 0.56)0.0blue-gray gnatcatcher 0.00 0.01 25.0 100.0 0.0(0.00 - 0.57)0.0Bewick's wren 0.00 0.19 6.3 100.0 0.0(0.00 - 0.75)0.0black-chinned sparrow 0.00 0.06 12.5 100.0 0.0(0.00 - 0.61)0.0black-chinned hummingbird 0.00 0.02 66.7 100.0 0.0(0.00 - 0.58)0.0ash-throated flycatcher 0.00 0.08 28.6 100.0 0.0(0.00 - 0.64)0.0Anna’s hummingbird 0.00 0.04 50.0 100.0 0.0(0.00 - 0.60)0.0American kestrel 0.00 0.02 85.7 66.7 33.3(0.00 - 0.57)0.0American crow 0.00 0.03 75.0 100.0 0.0(0.00 - 0.59)0.0acorn woodpecker 0.00 0.10 9.8 100.0 0.0(0.00 - 0.66)
1These values assume a 3MW turbine with a rotor diameter of 90 (m) and a hub height of 105 (m)
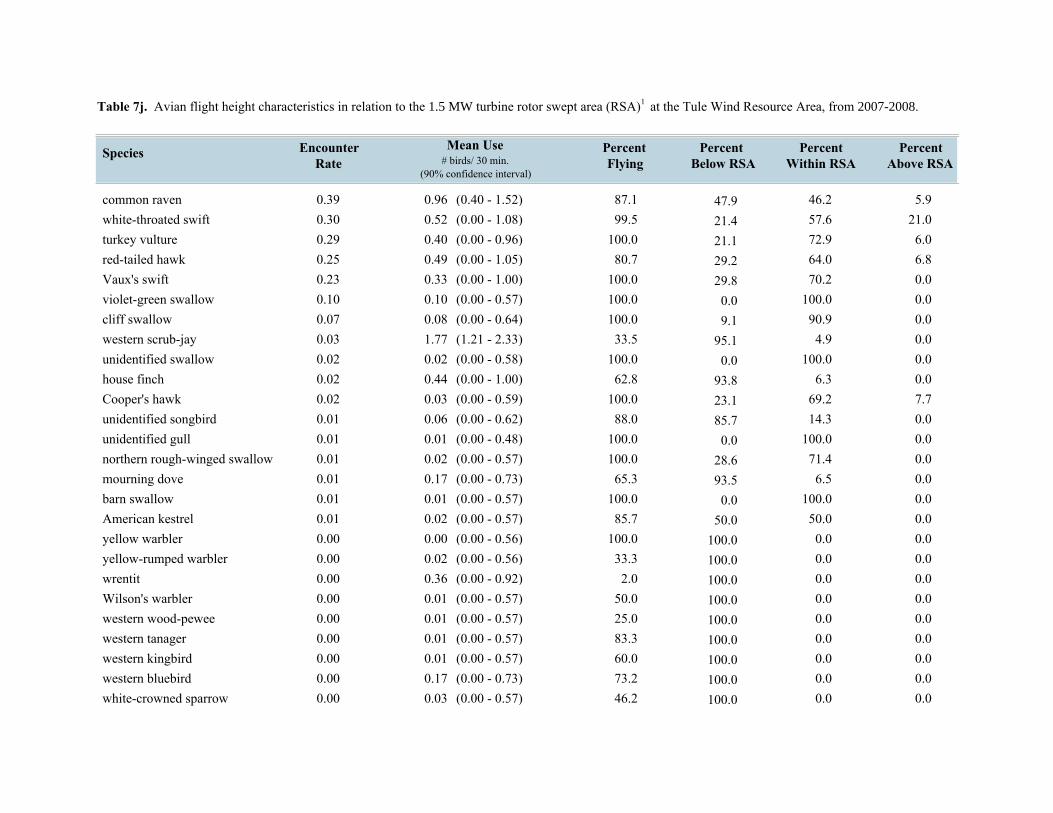
Table 7j. Avian flight height characteristics in relation to the 1.5 MW turbine rotor swept area (RSA) 1 at the Tule Wind Resource Area, from 2007-2008.
Percent Flying
EncounterRate
Percent Below RSA
PercentWithin RSA
PercentAbove RSA
Species Mean Use# birds/ 30 min.
(90% confidence interval)
5.9common raven 0.39 0.96 87.1 47.9 46.2(0.40 - 1.52)21.0white-throated swift 0.30 0.52 99.5 21.4 57.6(0.00 - 1.08)6.0turkey vulture 0.29 0.40 100.0 21.1 72.9(0.00 - 0.96)6.8red-tailed hawk 0.25 0.49 80.7 29.2 64.0(0.00 - 1.05)0.0Vaux's swift 0.23 0.33 100.0 29.8 70.2(0.00 - 1.00)0.0violet-green swallow 0.10 0.10 100.0 0.0 100.0(0.00 - 0.57)0.0cliff swallow 0.07 0.08 100.0 9.1 90.9(0.00 - 0.64)0.0western scrub-jay 0.03 1.77 33.5 95.1 4.9(1.21 - 2.33)0.0unidentified swallow 0.02 0.02 100.0 0.0 100.0(0.00 - 0.58)0.0house finch 0.02 0.44 62.8 93.8 6.3(0.00 - 1.00)7.7Cooper's hawk 0.02 0.03 100.0 23.1 69.2(0.00 - 0.59)0.0unidentified songbird 0.01 0.06 88.0 85.7 14.3(0.00 - 0.62)0.0unidentified gull 0.01 0.01 100.0 0.0 100.0(0.00 - 0.48)0.0northern rough-winged swallow 0.01 0.02 100.0 28.6 71.4(0.00 - 0.57)0.0mourning dove 0.01 0.17 65.3 93.5 6.5(0.00 - 0.73)0.0barn swallow 0.01 0.01 100.0 0.0 100.0(0.00 - 0.57)0.0American kestrel 0.01 0.02 85.7 50.0 50.0(0.00 - 0.57)0.0yellow warbler 0.00 0.00 100.0 100.0 0.0(0.00 - 0.56)0.0yellow-rumped warbler 0.00 0.02 33.3 100.0 0.0(0.00 - 0.56)0.0wrentit 0.00 0.36 2.0 100.0 0.0(0.00 - 0.92)0.0Wilson's warbler 0.00 0.01 50.0 100.0 0.0(0.00 - 0.57)0.0western wood-pewee 0.00 0.01 25.0 100.0 0.0(0.00 - 0.57)0.0western tanager 0.00 0.01 83.3 100.0 0.0(0.00 - 0.57)0.0western kingbird 0.00 0.01 60.0 100.0 0.0(0.00 - 0.57)0.0western bluebird 0.00 0.17 73.2 100.0 0.0(0.00 - 0.73)0.0white-crowned sparrow 0.00 0.03 46.2 100.0 0.0(0.00 - 0.57)

Table 7j. Avian flight height characteristics in relation to the 1.5 MW turbine rotor swept area (RSA) 1 at the Tule Wind Resource Area, from 2007-2008.
Percent Flying
EncounterRate
Percent Below RSA
PercentWithin RSA
PercentAbove RSA
Species Mean Use# birds/ 30 min.
(90% confidence interval)
0.0unidentified piranga tanager 0.00 0.00 100.0 100.0 0.0(0.00 - 0.68)0.0unidentified woodpecker 0.00 0.00 100.0 100.0 0.0(0.00 - 0.56)0.0unidentified warbler 0.00 0.00 100.0 100.0 0.0(0.00 - 0.56)0.0unidentified sparrow 0.00 0.01 100.0 100.0 0.0(0.00 - 0.57)0.0unidentified raptor 0.00 0.01 60.0 100.0 0.0(0.00 - 0.49)0.0unidentified quail 0.00 0.00 0.0 0.0 0.0(0.00 - 0.68)0.0unidentified hummingbird 0.00 0.10 95.3 97.5 2.5(0.00 - 0.66)0.0unidentified falcon 0.00 0.00 100.0 0.0 100.0(0.00 - 0.56)0.0unidentified empidonax flycatcher 0.00 0.00 50.0 100.0 0.0(0.00 - 0.56)0.0Townsend's Warbler 0.00 0.00 0.0 0.0 0.0(0.00 - 0.54)0.0Steller's jay 0.00 0.04 18.8 100.0 0.0(0.00 - 0.60)0.0sharp-shinned hawk 0.00 0.00 100.0 100.0 0.0(0.00 - 0.56)0.0spotted towhee 0.00 0.29 8.3 100.0 0.0(0.00 - 0.85)0.0Scott's oriole 0.00 0.01 25.0 100.0 0.0(0.00 - 0.57)0.0savannah sparrow 0.00 0.00 0.0 0.0 0.0(0.00 - 0.56)0.0Say's phoebe 0.00 0.00 100.0 100.0 0.0(0.00 - 0.56)0.0sage sparrow 0.00 0.06 53.8 100.0 0.0(0.00 - 0.62)0.0rock wren 0.00 0.05 22.7 100.0 0.0(0.00 - 0.61)0.0rufous-crowned sparrow 0.00 0.00 0.0 0.0 0.0(0.00 - 0.56)0.0ruby-crowned kinglet 0.00 0.01 60.0 100.0 0.0(0.00 - 0.55)0.0pacific-slope flycatcher 0.00 0.01 0.0 0.0 0.0(0.00 - 0.56)0.0prairie falcon 0.00 0.00 100.0 0.0 100.0(0.00 - 0.54)0.0phainopepla 0.00 0.14 62.7 100.0 0.0(0.00 - 0.70)0.0osprey 0.00 0.00 100.0 100.0 0.0(0.00 - 0.54)0.0orange-crowned warbler 0.00 0.01 60.0 100.0 0.0(0.00 - 0.55)0.0oak titmouse 0.00 0.10 5.0 100.0 0.0(0.00 - 0.65)

Table 7j. Avian flight height characteristics in relation to the 1.5 MW turbine rotor swept area (RSA) 1 at the Tule Wind Resource Area, from 2007-2008.
Percent Flying
EncounterRate
Percent Below RSA
PercentWithin RSA
PercentAbove RSA
Species Mean Use# birds/ 30 min.
(90% confidence interval)
0.0Nuttall's woodpecker 0.00 0.04 26.7 100.0 0.0(0.00 - 0.59)0.0northern mockingbird 0.00 0.02 40.0 100.0 0.0(0.00 - 0.58)0.0northern harrier 0.00 0.01 100.0 66.7 33.3(0.00 - 0.68)0.0northern flicker 0.00 0.11 6.7 100.0 0.0(0.00 - 0.67)0.0Nashville warbler 0.00 0.00 0.0 0.0 0.0(0.00 - 0.54)0.0mountain chickadee 0.00 0.01 80.0 100.0 0.0(0.00 - 0.55)0.0mountain bluebird 0.00 0.02 100.0 100.0 0.0(0.00 - 0.50)0.0mallard 0.00 0.06 100.0 100.0 0.0(0.00 - 0.53)0.0loggerhead shrike 0.00 0.00 0.0 0.0 0.0(0.00 - 0.68)0.0lesser goldfinch 0.00 0.19 68.8 100.0 0.0(0.00 - 0.74)0.0ladder-backed woodpecker 0.00 0.02 42.9 100.0 0.0(0.00 - 0.57)0.0Lawrence’s goldfinch 0.00 0.02 50.0 100.0 0.0(0.00 - 0.58)0.0house wren 0.00 0.01 20.0 100.0 0.0(0.00 - 0.57)0.0horned lark 0.00 0.01 80.0 100.0 0.0(0.00 - 0.55)0.0Hammond’s flycatcher 0.00 0.00 0.0 0.0 0.0(0.00 - 0.54)0.0golden eagle 0.00 0.00 100.0 50.0 50.0(0.00 - 0.54)0.0fox sparrow 0.00 0.03 85.7 100.0 0.0(0.00 - 0.51)0.0downy woodpecker 0.00 0.00 0.0 0.0 0.0(0.00 - 0.54)0.0dark-eyed junco 0.00 0.08 69.7 100.0 0.0(0.00 - 0.62)0.0double-crested cormorant 0.00 0.00 100.0 0.0 100.0(0.00 - 0.54)0.0California thrasher 0.00 0.24 12.1 100.0 0.0(0.00 - 0.80)0.0California quail 0.00 0.17 26.1 100.0 0.0(0.00 - 0.72)0.0canyon wren 0.00 0.00 0.0 0.0 0.0(0.00 - 0.56)0.0California towhee 0.00 0.37 20.5 100.0 0.0(0.00 - 0.92)0.0Cassin's kingbird 0.00 0.00 0.0 0.0 0.0(0.00 - 0.56)0.0bushtit 0.00 0.20 53.0 100.0 0.0(0.00 - 0.76)

Table 7j. Avian flight height characteristics in relation to the 1.5 MW turbine rotor swept area (RSA) 1 at the Tule Wind Resource Area, from 2007-2008.
Percent Flying
EncounterRate
Percent Below RSA
PercentWithin RSA
PercentAbove RSA
Species Mean Use# birds/ 30 min.
(90% confidence interval)
0.0black-throated sparrow 0.00 0.13 14.8 100.0 0.0(0.00 - 0.69)0.0band-tailed pigeon 0.00 0.00 50.0 100.0 0.0(0.00 - 0.56)0.0black-tailed gnatcatcher 0.00 0.00 100.0 100.0 0.0(0.00 - 0.68)0.0blue grosbeak 0.00 0.00 0.0 0.0 0.0(0.00 - 0.56)0.0black-headed grosbeak 0.00 0.05 45.0 100.0 0.0(0.00 - 0.60)0.0brown-headed cowbird 0.00 0.00 100.0 100.0 0.0(0.00 - 0.56)0.0blue-gray gnatcatcher 0.00 0.01 25.0 100.0 0.0(0.00 - 0.57)0.0Bewick's wren 0.00 0.19 6.3 100.0 0.0(0.00 - 0.75)0.0black-chinned sparrow 0.00 0.06 12.5 100.0 0.0(0.00 - 0.61)0.0black-chinned hummingbird 0.00 0.02 66.7 100.0 0.0(0.00 - 0.58)0.0ash-throated flycatcher 0.00 0.08 28.6 100.0 0.0(0.00 - 0.64)0.0Anna’s hummingbird 0.00 0.04 50.0 100.0 0.0(0.00 - 0.60)0.0American crow 0.00 0.03 75.0 100.0 0.0(0.00 - 0.59)0.0acorn woodpecker 0.00 0.10 9.8 100.0 0.0(0.00 - 0.66)
1These values assume a 1.5MW turbine with a rotor diameter of 77 (m) and a hub height of 80 (m)

Species
Table 8. Incidental observations of birds during point counts at the Tule Wind Resource Area, 2007-2008.
Number of
individuals
Winter 2007-2008 OverallFall 2007 Spring 2008 Summer 2008
Number of
individuals
Number of
individuals
Number of
individuals
Number of
individualsbushtit 107 790 23 0 920dark-eyed junco 150 425 35 0 610red-tailed hawk 117 125 47 73 362western scrub-jay 41 173 72 0 286California quail 72 20 21 146 259common raven 91 106 39 8 244western bluebird 79 118 3 0 200turkey vulture 4 20 45 118 187oak titmouse 17 55 45 0 117acorn woodpecker 56 46 5 0 107red-winged blackbird 65 15 0 0 80house finch 72 8 0 0 80California thrasher 7 43 12 12 74mountain quail 20 11 1 35 67Brewer's blackbird 10 50 6 0 66spotted towhee 15 30 19 0 64California towhee 17 27 13 0 57white-throated swift 33 5 11 0 49white-crowned sparrow 16 18 13 0 47yellow-rumped warbler 39 0 2 0 41Bewick's wren 8 18 15 0 41northern flicker 14 16 5 0 35Cooper's hawk 17 6 3 8 34wrentit 12 12 7 0 31Steller's jay 4 13 14 0 31lesser goldfinch 26 0 4 0 30Vaux's swift 28 0 0 0 28
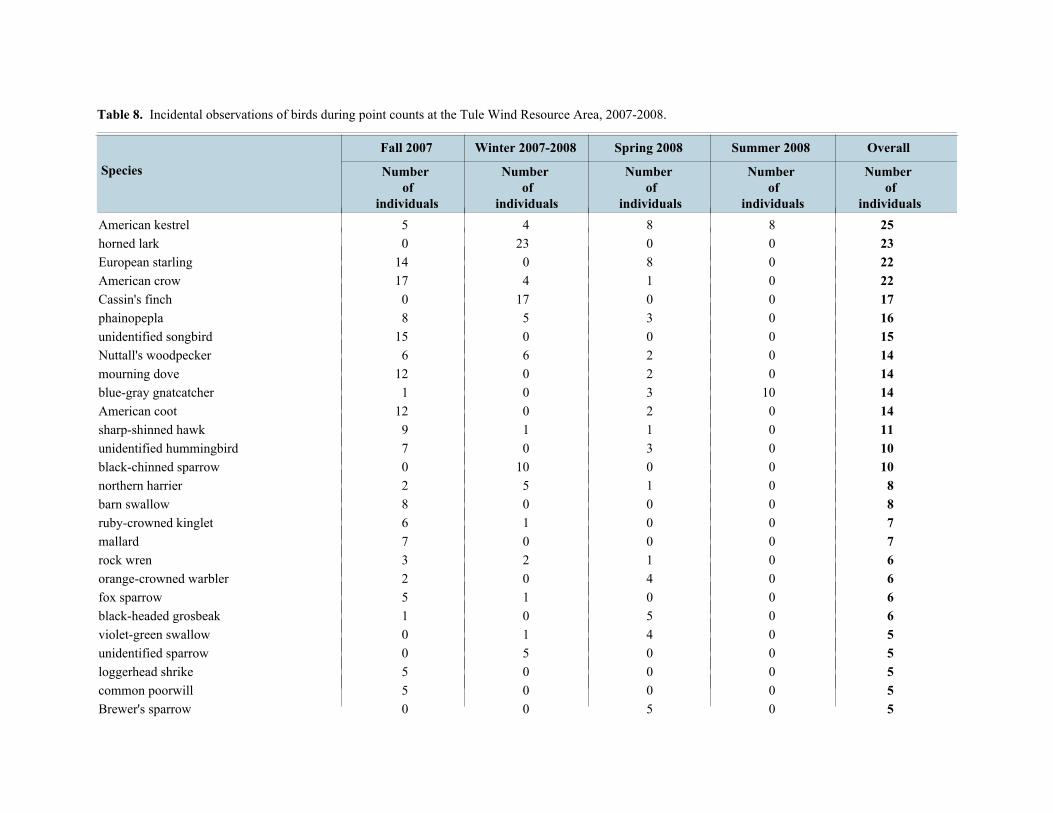
Species
Table 8. Incidental observations of birds during point counts at the Tule Wind Resource Area, 2007-2008.
Number of
individuals
Winter 2007-2008 OverallFall 2007 Spring 2008 Summer 2008
Number of
individuals
Number of
individuals
Number of
individuals
Number of
individualsAmerican kestrel 5 4 8 8 25horned lark 0 23 0 0 23European starling 14 0 8 0 22American crow 17 4 1 0 22Cassin's finch 0 17 0 0 17phainopepla 8 5 3 0 16unidentified songbird 15 0 0 0 15Nuttall's woodpecker 6 6 2 0 14mourning dove 12 0 2 0 14blue-gray gnatcatcher 1 0 3 10 14American coot 12 0 2 0 14sharp-shinned hawk 9 1 1 0 11unidentified hummingbird 7 0 3 0 10black-chinned sparrow 0 10 0 0 10northern harrier 2 5 1 0 8barn swallow 8 0 0 0 8ruby-crowned kinglet 6 1 0 0 7mallard 7 0 0 0 7rock wren 3 2 1 0 6orange-crowned warbler 2 0 4 0 6fox sparrow 5 1 0 0 6black-headed grosbeak 1 0 5 0 6violet-green swallow 0 1 4 0 5unidentified sparrow 0 5 0 0 5loggerhead shrike 5 0 0 0 5common poorwill 5 0 0 0 5Brewer's sparrow 0 0 5 0 5
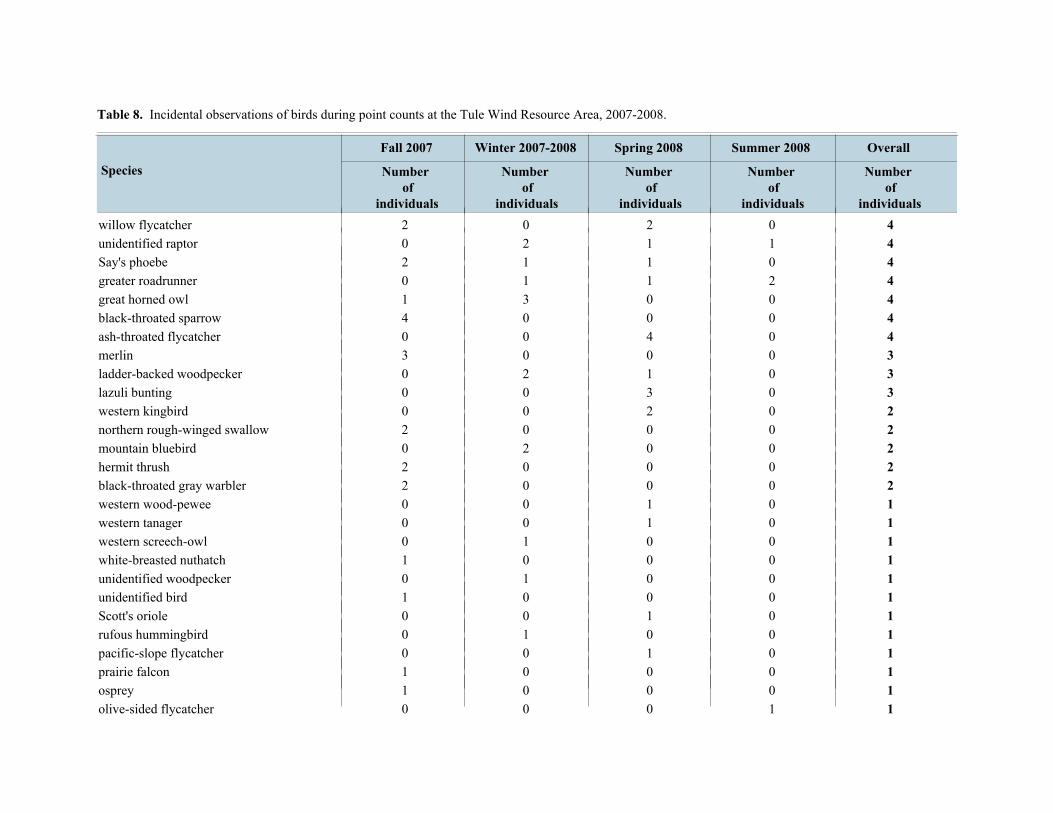
Species
Table 8. Incidental observations of birds during point counts at the Tule Wind Resource Area, 2007-2008.
Number of
individuals
Winter 2007-2008 OverallFall 2007 Spring 2008 Summer 2008
Number of
individuals
Number of
individuals
Number of
individuals
Number of
individualswillow flycatcher 2 0 2 0 4unidentified raptor 0 2 1 1 4Say's phoebe 2 1 1 0 4greater roadrunner 0 1 1 2 4great horned owl 1 3 0 0 4black-throated sparrow 4 0 0 0 4ash-throated flycatcher 0 0 4 0 4merlin 3 0 0 0 3ladder-backed woodpecker 0 2 1 0 3lazuli bunting 0 0 3 0 3western kingbird 0 0 2 0 2northern rough-winged swallow 2 0 0 0 2mountain bluebird 0 2 0 0 2hermit thrush 2 0 0 0 2black-throated gray warbler 2 0 0 0 2western wood-pewee 0 0 1 0 1western tanager 0 0 1 0 1western screech-owl 0 1 0 0 1white-breasted nuthatch 1 0 0 0 1unidentified woodpecker 0 1 0 0 1unidentified bird 1 0 0 0 1Scott's oriole 0 0 1 0 1rufous hummingbird 0 1 0 0 1pacific-slope flycatcher 0 0 1 0 1prairie falcon 1 0 0 0 1osprey 1 0 0 0 1olive-sided flycatcher 0 0 0 1 1
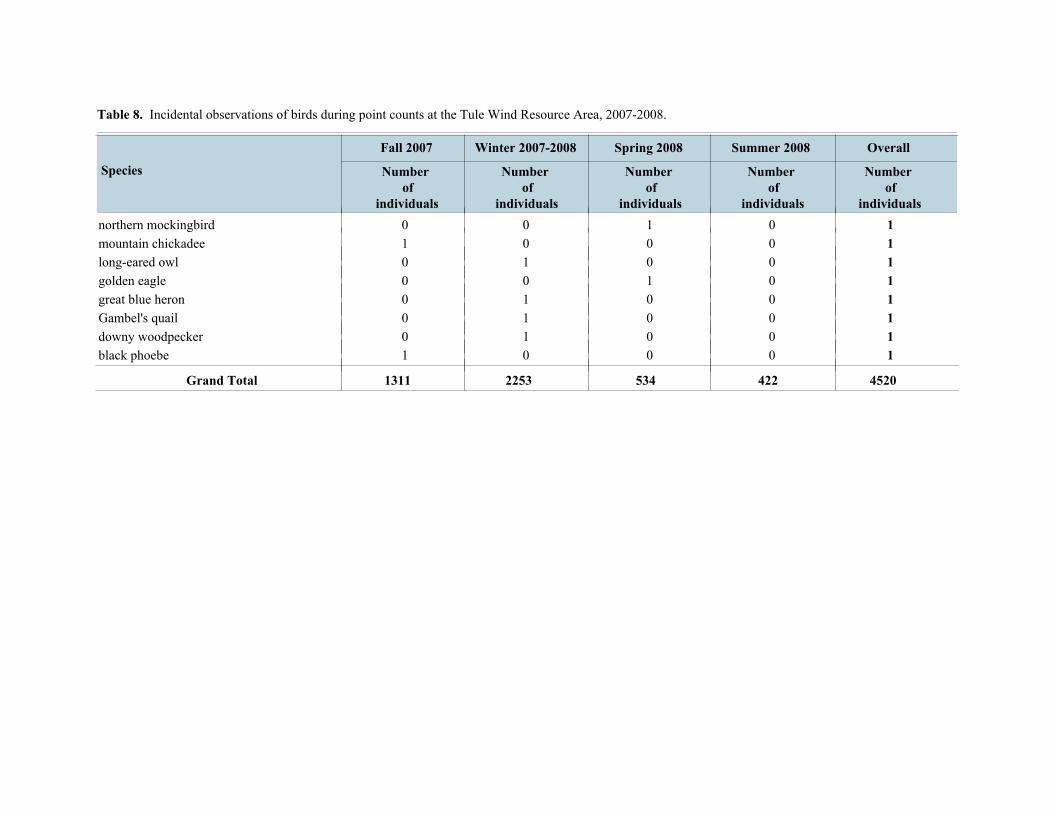
Species
Table 8. Incidental observations of birds during point counts at the Tule Wind Resource Area, 2007-2008.
Number of
individuals
Winter 2007-2008 OverallFall 2007 Spring 2008 Summer 2008
Number of
individuals
Number of
individuals
Number of
individuals
Number of
individualsnorthern mockingbird 0 0 1 0 1mountain chickadee 1 0 0 0 1long-eared owl 0 1 0 0 1golden eagle 0 0 1 0 1great blue heron 0 1 0 0 1Gambel's quail 0 1 0 0 1downy woodpecker 0 1 0 0 1black phoebe 1 0 0 0 1
Grand Total 1311 2253 534 422 4520

Table 9. Comparison of raptor and other bird use per 30-minute survey with other studies of wind projects using the similar survey methodology. Mean Use by Raptors Mean Use by Other Birds
Project Site Spr Sum Fall Win Ann Spr Sum Fall Win Ann
Duration of Survey
(minutes)
Plot Radius Reference Correction
factor a
Altamont Pass, CA 5.67 4.48 6.87 4.48 10 800m
Orloff and Flannery (1992)
x3
Cotterel Mountain, ID 2.52 2.82 2.22 0.27 21.28 16.75 11.42 13.22 20 800m USDI, BLM
(2005) ÷0.67
Hoctor Ridge, WA 2.12 1.99 14.93 26.75 20 800m Johnson et al. (2006b) ÷0.67
Lower Linden Ranch, WA 2.04 20 800m Johnson et
al. (2007d) ÷0.67
Kittitas Valley, WA 1.51 1.54 1.09 20 800m Erickson et
al. (2003b) ÷0.67
Columbia Hills, WA 1.40 2.00 1.16 0.39 20 800m Erickson et
al. (2002) ÷0.67
Combine study of: Kittitas Valley; Desert Claim; Wild Horse, WA
1.33 1.27 1.13 0.76 1.12 16.24 20 800m Young et al. (2003) ÷0.67
Tule, CA 2005-2006 1.29 0.74 0.43 0.39 0.71 11.47 14.53 13.70 7.61 11.83 30 800m TtEC (2007)
Buffalo Ridge Phase II, MN 1.25 1.03 1.24 0.15 20 800m Erickson et
al. (2002) ÷0.67
Elkhorn, OR 1.21 2.33 1.18 43.93 18.13 30.39 20 800m WEST (2005b) ÷0.67
Combine Hills, OR 1.19 0.84 0.66 0.96 8.90 3.93 2.00 4.00 30 800m Young et al.
(2002b)
Windy Point, WA 1.18 1.15 24.49 20.22 20 800m Johnson et al. (2006a) ÷0.67

Table 9. Comparison of raptor and other bird use per 30-minute survey with other studies of wind projects using the similar survey methodology. Mean Use by Raptors Mean Use by Other Birds
Project Site Spr Sum Fall Win Ann Spr Sum Fall Win Ann
Duration of Survey
(minutes)
Plot Radius Reference Correction
factor a
Windy Flats, WA 1.15 1.31 1.22 1.28 32.10 20.84 23.94 36.66 20 800m Johnson et al. (2007b) ÷0.67
Tule, CA 2007-2008 1.08 1.45 0.81 0.64 0.98 8.00 12.35 9.97 4.95 8.37 30 800m THIS
STUDY
Hatchet Ridge, CA 1.04 1.54 1.36 0.18 1.03 7.82 10.36 9.43 6.01 8.43 30 800m Young et al.
(2007b)
Buffalo Ridge, MN 1.01 0.78 1.03 0.66 20 800m Erickson et al. (2002) ÷0.67
Buffalo Ridge Phase I, MN 0.97 0.64 1.13 0.19 20 800m Erickson et
al. (2002) ÷0.67
Buffalo Ridge Phase III, MN 0.96 0.81 1.27 0.27 20 800m Erickson et
al. (2002) ÷0.67
Stateline Wind EIS, OR/WA 0.88 0.60 0.37 0.63 10.58 8.16 20 800m URS and
West (2001) ÷0.67
Foote Creek WEC, WY 0.73 1.13 1.45 0.31 40 800m Johnson et
al. (2000) ÷1.33
Klondike Phase I, OR 0.70 0.58 0.57 0.84 20 800m Erickson et
al. (2002) ÷0.67
White Creek, WA 0.69 1.30 0.84 0.57 14.79 13.58 22.75 16.43 20 800m Kronner et al. (2005b) ÷0.67
Wild Horse, WA 0.69 0.69 0.46 0.21 8.63 8.63 6.00 5.36 30 800m Erickson et al. (2003a)
Shepherds Flat, OR 0.66 0.73 0.82 0.48 13.40 21.96 7.79 5.93 20 800m
Welch and Schleder (2006)
÷0.67
Bighorn Site, WA 0.60 0.66 14.51 14.99 20 800m
Johnson and
Erickson (2004)
÷0.67

Table 9. Comparison of raptor and other bird use per 30-minute survey with other studies of wind projects using the similar survey methodology. Mean Use by Raptors Mean Use by Other Birds
Project Site Spr Sum Fall Win Ann Spr Sum Fall Win Ann
Duration of Survey
(minutes)
Plot Radius Reference Correction
factor a
Leaning Juniper, OR 0.58 1.60 0.79 0.36 16.96 8.48 28.49 70.15 20 800m Kronner et
al. (2005a) ÷0.67
Biglow Canyon WRA, OR 0.55 0.51 0.16 0.37 10.09 7.60 10.01 25.48 30 800m WEST
(2005a)
Nine Canyon, WA 0.52 0.30 0.24 0.46 . 20 800m Erickson et al. (2002) ÷0.67
Sand Ridge, WA 0.51 0.69 9.24 7.78 20 800m Johnson et al. (2007c) ÷0.67
Biglow Canyon project area, OR 0.46 0.58 0.28 0.48 15.18 4.99 10.72 17.40 30 800m WEST
(2005a)
Maiden, WA 0.45 0.52 0.93 0.22 6.84 7.03 17.81 12.81 30 800m Young et al. (2002a)
Vantage, WA 0.43 0.60 0.21 0.22 15.78 13.18 5.52 7.31 20 800m Jefferey et al. (2007) ÷0.67
Stateline Wind, OR/WA 0.42 0.39 0.24 0.03 0.33 34.45 10 800m Erickson et
al. (2004) x 3
Zintel Canyon, WA 0.28 0.45 1.04 0.76 20 800m Erickson et
al. (2002) ÷0.67
Dry Lake, AZ 0.12 0.21 0.31 0.21 0.22 12.09 16.45 24.03 26.87 20.18 30 800m Young et al. (2007a)
High Winds, CA 10.03 707.46 20 800m Kerlinger et al. (2005) ÷0.67
ª Correction factor to standardize mean use to birds/30 min.

2007-2008 Avian Survey Tule Wind Resource Area
APPENDIX A
FLIGHT DIRECTIONS OF BIRDS OBSERVED DURING SUMMER POINT COUNT SURVEYS AT THE
TULE WIND RESOURCE AREA, 2008
January 2009
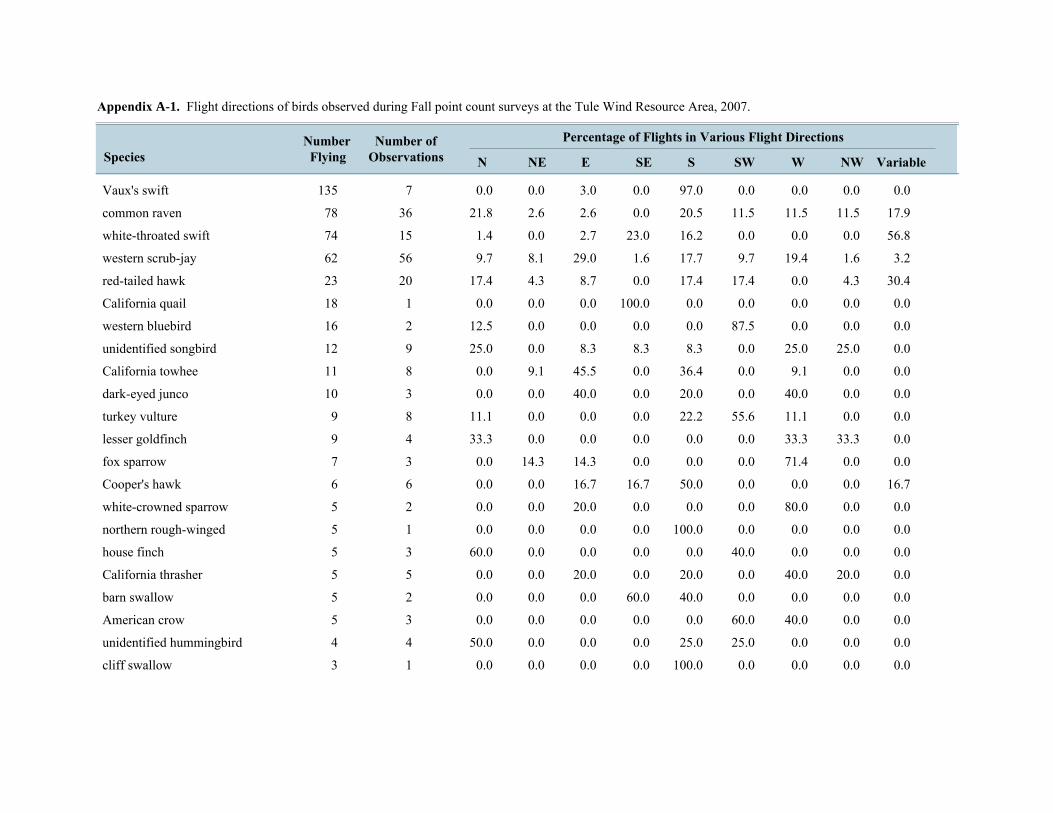
NumberFlying
Number ofObservationsSpecies
Appendix A-1. Flight directions of birds observed during Fall point count surveys at the Tule Wind Resource Area, 2007.
Percentage of Flights in Various Flight Directions
N NE E SE S SW W NW Variable
Vaux's swift 135 7 0.0 0.0 3.0 0.0 97.0 0.0 0.00.0 0.0
common raven 78 36 21.8 2.6 2.6 0.0 20.5 11.5 17.911.5 11.5
white-throated swift 74 15 1.4 0.0 2.7 23.0 16.2 0.0 56.80.0 0.0
western scrub-jay 62 56 9.7 8.1 29.0 1.6 17.7 9.7 3.219.4 1.6
red-tailed hawk 23 20 17.4 4.3 8.7 0.0 17.4 17.4 30.40.0 4.3
California quail 18 1 0.0 0.0 0.0 100.0 0.0 0.0 0.00.0 0.0
western bluebird 16 2 12.5 0.0 0.0 0.0 0.0 87.5 0.00.0 0.0
unidentified songbird 12 9 25.0 0.0 8.3 8.3 8.3 0.0 0.025.0 25.0
California towhee 11 8 0.0 9.1 45.5 0.0 36.4 0.0 0.09.1 0.0
dark-eyed junco 10 3 0.0 0.0 40.0 0.0 20.0 0.0 0.040.0 0.0
turkey vulture 9 8 11.1 0.0 0.0 0.0 22.2 55.6 0.011.1 0.0
lesser goldfinch 9 4 33.3 0.0 0.0 0.0 0.0 0.0 0.033.3 33.3
fox sparrow 7 3 0.0 14.3 14.3 0.0 0.0 0.0 0.071.4 0.0
Cooper's hawk 6 6 0.0 0.0 16.7 16.7 50.0 0.0 16.70.0 0.0
white-crowned sparrow 5 2 0.0 0.0 20.0 0.0 0.0 0.0 0.080.0 0.0
northern rough-winged 5 1 0.0 0.0 0.0 0.0 100.0 0.0 0.00.0 0.0
house finch 5 3 60.0 0.0 0.0 0.0 0.0 40.0 0.00.0 0.0
California thrasher 5 5 0.0 0.0 20.0 0.0 20.0 0.0 0.040.0 20.0
barn swallow 5 2 0.0 0.0 0.0 60.0 40.0 0.0 0.00.0 0.0
American crow 5 3 0.0 0.0 0.0 0.0 0.0 60.0 0.040.0 0.0
unidentified hummingbird 4 4 50.0 0.0 0.0 0.0 25.0 25.0 0.00.0 0.0
cliff swallow 3 1 0.0 0.0 0.0 0.0 100.0 0.0 0.00.0 0.0

NumberFlying
Number ofObservationsSpecies
Appendix A-1. Flight directions of birds observed during Fall point count surveys at the Tule Wind Resource Area, 2007.
Percentage of Flights in Various Flight Directions
N NE E SE S SW W NW Variable
wrentit 2 2 0.0 0.0 50.0 0.0 0.0 0.0 0.050.0 0.0
unidentified raptor 2 1 0.0 0.0 0.0 0.0 100.0 0.0 0.00.0 0.0
spotted towhee 2 2 0.0 0.0 0.0 0.0 0.0 0.0 0.050.0 50.0
northern flicker 2 2 50.0 0.0 50.0 0.0 0.0 0.0 0.00.0 0.0
unidentified piranga tanager 1 1 0.0 0.0 100.0 0.0 0.0 0.0 0.00.0 0.0
unidentified sparrow 1 1 100.0 0.0 0.0 0.0 0.0 0.0 0.00.0 0.0
sharp-shinned hawk 1 1 100.0 0.0 0.0 0.0 0.0 0.0 0.00.0 0.0
rock wren 1 1 0.0 0.0 0.0 0.0 0.0 0.0 0.00.0 100.0
ruby-crowned kinglet 1 1 0.0 0.0 0.0 0.0 0.0 0.0 0.0100.0 0.0
Nuttall's woodpecker 1 1 0.0 0.0 100.0 0.0 0.0 0.0 0.00.0 0.0
northern harrier 1 1 0.0 0.0 0.0 100.0 0.0 0.0 0.00.0 0.0
golden eagle 1 1 0.0 0.0 0.0 0.0 0.0 0.0 0.00.0 100.0
Bewick's wren 1 1 0.0 0.0 100.0 0.0 0.0 0.0 0.00.0 0.0
Anna’s hummingbird 1 1 100.0 0.0 0.0 0.0 0.0 0.0 0.00.0 0.0
American kestrel 1 1 0.0 0.0 100.0 0.0 0.0 0.0 0.00.0 0.0
526 217Grand Total 8.7 1.9 9.1 8.0 38.0 8.4 12.59.3 4.0

NumberFlying
Number ofObservationsSpecies
Appendix A-2. Flight directions of birds observed during Winter point count surveys at the Tule Wind Resource Area, 2007-2008.
Percentage of Flights in Various Flight Directions
N NE E SE S SW W NW Variable
common raven 82 49 30.5 2.4 9.8 1.2 22.0 3.7 19.58.5 2.4
western scrub-jay 71 53 23.9 11.3 29.6 0.0 14.1 0.0 7.014.1 0.0
red-tailed hawk 44 39 9.1 6.8 6.8 11.4 18.2 9.1 25.011.4 2.3
violet-green swallow 40 1 100.0 0.0 0.0 0.0 0.0 0.0 0.00.0 0.0
mallard 24 1 0.0 0.0 0.0 0.0 0.0 0.0 0.0100.0 0.0
western bluebird 23 5 30.4 43.5 13.0 0.0 13.0 0.0 0.00.0 0.0
bushtit 22 2 68.2 0.0 31.8 0.0 0.0 0.0 0.00.0 0.0
white-throated swift 11 7 0.0 0.0 18.2 0.0 18.2 9.1 45.50.0 9.1
mountain bluebird 9 2 0.0 0.0 0.0 0.0 33.3 0.0 0.066.7 0.0
turkey vulture 8 7 25.0 12.5 0.0 12.5 25.0 25.0 0.00.0 0.0
dark-eyed junco 8 3 12.5 25.0 0.0 0.0 62.5 0.0 0.00.0 0.0
house finch 6 4 0.0 16.7 0.0 0.0 50.0 0.0 0.033.3 0.0
fox sparrow 5 4 40.0 0.0 0.0 0.0 0.0 20.0 0.020.0 20.0
California towhee 5 5 0.0 0.0 40.0 0.0 0.0 0.0 0.040.0 20.0
spotted towhee 4 2 50.0 0.0 0.0 0.0 0.0 0.0 0.050.0 0.0
mountain chickadee 4 1 0.0 0.0 0.0 0.0 100.0 0.0 0.00.0 0.0
lesser goldfinch 4 2 0.0 0.0 0.0 0.0 25.0 0.0 0.075.0 0.0
unidentified gull 3 1 0.0 0.0 0.0 0.0 0.0 100.0 0.00.0 0.0
California thrasher 3 3 100.0 0.0 0.0 0.0 0.0 0.0 0.00.0 0.0
black-throated sparrow 3 1 0.0 0.0 0.0 0.0 100.0 0.0 0.00.0 0.0
unidentified songbird 2 1 0.0 0.0 0.0 0.0 0.0 100.0 0.00.0 0.0
phainopepla 2 2 50.0 0.0 50.0 0.0 0.0 0.0 0.00.0 0.0

NumberFlying
Number ofObservationsSpecies
Appendix A-2. Flight directions of birds observed during Winter point count surveys at the Tule Wind Resource Area, 2007-2008.
Percentage of Flights in Various Flight Directions
N NE E SE S SW W NW Variable
northern harrier 2 2 0.0 0.0 0.0 0.0 100.0 0.0 0.00.0 0.0
ladder-backed woodpecker 2 2 0.0 50.0 50.0 0.0 0.0 0.0 0.00.0 0.0
American kestrel 2 2 50.0 0.0 0.0 50.0 0.0 0.0 0.00.0 0.0
wrentit 1 1 0.0 0.0 0.0 0.0 100.0 0.0 0.00.0 0.0
white-crowned sparrow 1 1 0.0 0.0 0.0 0.0 0.0 0.0 0.0100.0 0.0
unidentified raptor 1 1 0.0 0.0 0.0 0.0 100.0 0.0 0.00.0 0.0
ruby-crowned kinglet 1 1 0.0 0.0 0.0 0.0 100.0 0.0 0.00.0 0.0
Bewick's wren 1 1 0.0 0.0 0.0 0.0 100.0 0.0 0.00.0 0.0
394 206Grand Total 30.5 7.1 12.2 2.0 17.3 4.1 9.416.0 1.5

NumberFlying
Number ofObservationsSpecies
Appendix A-3. Flight directions of birds observed during Spring point count surveys at the Tule Wind Resource Area, 2008.
Percentage of Flights in Various Flight Directions
N NE E SE S SW W NW Variable
common raven 116 72 19.0 6.9 14.7 8.6 17.2 6.9 8.617.2 0.9
turkey vulture 49 44 22.4 10.2 6.1 6.1 16.3 4.1 16.310.2 8.2
red-tailed hawk 36 29 11.1 5.6 13.9 2.8 5.6 5.6 47.25.6 2.8
western scrub-jay 32 24 18.8 0.0 40.6 3.1 9.4 3.1 0.018.8 6.3
white-throated swift 31 8 0.0 0.0 0.0 3.2 9.7 0.0 83.93.2 0.0
house finch 30 14 30.0 6.7 6.7 20.0 6.7 0.0 0.013.3 16.7
cliff swallow 22 3 0.0 0.0 0.0 0.0 9.1 0.0 90.90.0 0.0
mourning dove 14 11 0.0 7.1 7.1 0.0 42.9 14.3 0.028.6 0.0
bushtit 10 2 50.0 0.0 50.0 0.0 0.0 0.0 0.00.0 0.0
phainopepla 8 3 0.0 0.0 0.0 0.0 12.5 37.5 0.050.0 0.0
unidentified songbird 6 5 16.7 33.3 0.0 0.0 16.7 16.7 0.00.0 16.7
dark-eyed junco 5 2 0.0 0.0 0.0 40.0 0.0 0.0 0.060.0 0.0
black-chinned hummingbird 5 5 20.0 20.0 20.0 0.0 0.0 20.0 0.020.0 0.0
ash-throated flycatcher 5 4 20.0 0.0 60.0 0.0 0.0 20.0 0.00.0 0.0
western bluebird 4 2 0.0 0.0 50.0 0.0 0.0 0.0 0.050.0 0.0
lesser goldfinch 4 2 0.0 0.0 0.0 0.0 0.0 0.0 0.0100.0 0.0
horned lark 4 1 0.0 0.0 0.0 0.0 0.0 0.0 0.0100.0 0.0
California thrasher 4 3 25.0 0.0 25.0 0.0 0.0 50.0 0.00.0 0.0
yellow-rumped warbler 3 1 0.0 0.0 0.0 100.0 0.0 0.0 0.00.0 0.0
orange-crowned warbler 3 3 0.0 0.0 66.7 0.0 33.3 0.0 0.00.0 0.0
California towhee 3 3 0.0 33.3 0.0 33.3 0.0 0.0 0.033.3 0.0
Wilson's warbler 2 2 0.0 0.0 0.0 0.0 0.0 0.0 0.0100.0 0.0

NumberFlying
Number ofObservationsSpecies
Appendix A-3. Flight directions of birds observed during Spring point count surveys at the Tule Wind Resource Area, 2008.
Percentage of Flights in Various Flight Directions
N NE E SE S SW W NW Variable
unidentified hummingbird 2 2 100.0 0.0 0.0 0.0 0.0 0.0 0.00.0 0.0
Cooper's hawk 2 2 0.0 0.0 0.0 0.0 100.0 0.0 0.00.0 0.0
black-throated sparrow 2 2 0.0 0.0 0.0 0.0 0.0 50.0 0.050.0 0.0
black-headed grosbeak 2 2 0.0 0.0 0.0 50.0 0.0 0.0 0.050.0 0.0
Bewick's wren 2 2 0.0 0.0 50.0 0.0 0.0 0.0 0.050.0 0.0
American kestrel 2 2 0.0 0.0 0.0 0.0 0.0 0.0 50.050.0 0.0
acorn woodpecker 2 1 0.0 0.0 0.0 0.0 0.0 0.0 0.0100.0 0.0
spotted towhee 1 1 0.0 0.0 0.0 0.0 100.0 0.0 0.00.0 0.0
Scott's oriole 1 1 0.0 0.0 0.0 0.0 0.0 0.0 0.0100.0 0.0
sage sparrow 1 1 0.0 0.0 0.0 0.0 100.0 0.0 0.00.0 0.0
ruby-crowned kinglet 1 1 0.0 0.0 0.0 100.0 0.0 0.0 0.00.0 0.0
prairie falcon 1 1 0.0 0.0 0.0 0.0 0.0 0.0 100.00.0 0.0
osprey 1 1 0.0 0.0 100.0 0.0 0.0 0.0 0.00.0 0.0
oak titmouse 1 1 0.0 0.0 100.0 0.0 0.0 0.0 0.00.0 0.0
golden eagle 1 1 100.0 0.0 0.0 0.0 0.0 0.0 0.00.0 0.0
double-crested cormorant 1 1 0.0 0.0 0.0 0.0 0.0 0.0 0.0100.0 0.0
black-chinned sparrow 1 1 0.0 0.0 0.0 0.0 100.0 0.0 0.00.0 0.0
Anna’s hummingbird 1 1 0.0 0.0 0.0 100.0 0.0 0.0 0.00.0 0.0
421 267Grand Total 15.2 5.2 13.8 7.4 12.8 5.7 19.716.9 3.3

NumberFlying
Number ofObservationsSpecies
Appendix A-4 Flight directions of birds observed during Summer point count surveys at the Tule Wind Resource Area, 2008.
Percentage of Flights in Various Flight Directions
N NE E SE S SW W NW Variable
white-throated swift 95 18 0.0 1.1 18.9 0.0 3.2 0.0 76.80.0 0.0
turkey vulture 87 56 13.8 1.1 4.6 13.8 13.8 9.2 26.410.3 4.6
western scrub-jay 76 36 9.2 9.2 13.2 18.4 22.4 1.3 7.918.4 0.0
house finch 55 29 12.7 5.5 9.1 16.4 18.2 9.1 0.021.8 7.3
common raven 54 24 20.4 5.6 20.4 5.6 7.4 3.7 20.414.8 1.9
red-tailed hawk 36 29 11.1 0.0 8.3 8.3 8.3 8.3 25.011.1 19.4
lesser goldfinch 36 9 0.0 0.0 8.3 8.3 33.3 27.8 0.013.9 8.3
unidentified hummingbird 34 28 8.8 0.0 17.6 0.0 11.8 5.9 17.638.2 0.0
mourning dove 32 22 15.6 6.3 37.5 6.3 12.5 0.0 0.012.5 9.4
phainopepla 26 21 34.6 0.0 23.1 3.8 23.1 11.5 0.03.8 0.0
sage sparrow 13 5 0.0 0.0 92.3 0.0 0.0 7.7 0.00.0 0.0
California towhee 12 8 16.7 16.7 25.0 0.0 16.7 0.0 0.025.0 0.0
bushtit 12 1 100.0 0.0 0.0 0.0 0.0 0.0 0.00.0 0.0
western bluebird 9 3 22.2 0.0 0.0 33.3 0.0 44.4 0.00.0 0.0
unidentified swallow 8 2 0.0 0.0 0.0 0.0 75.0 0.0 0.025.0 0.0
cliff swallow 8 4 0.0 0.0 0.0 12.5 0.0 12.5 50.025.0 0.0
black-headed grosbeak 7 6 14.3 14.3 0.0 0.0 0.0 28.6 0.042.9 0.0
Anna’s hummingbird 7 6 0.0 0.0 42.9 0.0 14.3 0.0 0.042.9 0.0
western tanager 5 2 0.0 0.0 0.0 0.0 0.0 0.0 60.040.0 0.0
Cooper's hawk 5 5 0.0 0.0 20.0 0.0 20.0 20.0 40.00.0 0.0
ash-throated flycatcher 5 4 60.0 0.0 0.0 0.0 20.0 0.0 0.020.0 0.0
unidentified sparrow 4 3 0.0 0.0 0.0 0.0 0.0 50.0 0.050.0 0.0

NumberFlying
Number ofObservationsSpecies
Appendix A-4 Flight directions of birds observed during Summer point count surveys at the Tule Wind Resource Area, 2008.
Percentage of Flights in Various Flight Directions
N NE E SE S SW W NW Variable
northern mockingbird 4 4 0.0 0.0 0.0 0.0 25.0 0.0 0.075.0 0.0
Lawrence’s goldfinch 4 2 0.0 0.0 0.0 0.0 25.0 0.0 0.075.0 0.0
American crow 4 2 0.0 0.0 0.0 0.0 50.0 50.0 0.00.0 0.0
western kingbird 3 3 33.3 0.0 33.3 0.0 0.0 0.0 0.033.3 0.0
Steller's jay 3 2 0.0 0.0 0.0 0.0 66.7 0.0 0.00.0 33.3
spotted towhee 3 3 33.3 0.0 0.0 0.0 0.0 0.0 0.066.7 0.0
rock wren 3 3 0.0 0.0 0.0 0.0 0.0 33.3 0.033.3 33.3
Nuttall's woodpecker 3 3 66.7 0.0 0.0 0.0 33.3 0.0 0.00.0 0.0
black-throated sparrow 3 2 33.3 0.0 0.0 0.0 0.0 0.0 0.066.7 0.0
unidentified falcon 2 1 0.0 0.0 0.0 0.0 100.0 0.0 0.00.0 0.0
northern rough-winged 2 1 0.0 0.0 0.0 0.0 0.0 0.0 0.0100.0 0.0
black-chinned sparrow 2 2 0.0 0.0 0.0 0.0 0.0 0.0 0.050.0 50.0
acorn woodpecker 2 2 0.0 0.0 50.0 0.0 50.0 0.0 0.00.0 0.0
yellow warbler 1 1 0.0 0.0 0.0 0.0 0.0 100.0 0.00.0 0.0
western wood-pewee 1 1 100.0 0.0 0.0 0.0 0.0 0.0 0.00.0 0.0
unidentified woodpecker 1 1 0.0 0.0 0.0 0.0 0.0 100.0 0.00.0 0.0
unidentified warbler 1 1 0.0 0.0 0.0 0.0 0.0 0.0 0.0100.0 0.0
unidentified songbird 1 1 0.0 0.0 0.0 0.0 0.0 0.0 0.00.0 100.0
unidentified empidonax 1 1 0.0 0.0 0.0 0.0 100.0 0.0 0.00.0 0.0
sharp-shinned hawk 1 1 0.0 0.0 100.0 0.0 0.0 0.0 0.00.0 0.0
Say's phoebe 1 1 0.0 0.0 0.0 0.0 100.0 0.0 0.00.0 0.0
oak titmouse 1 1 0.0 0.0 0.0 0.0 0.0 0.0 0.0100.0 0.0
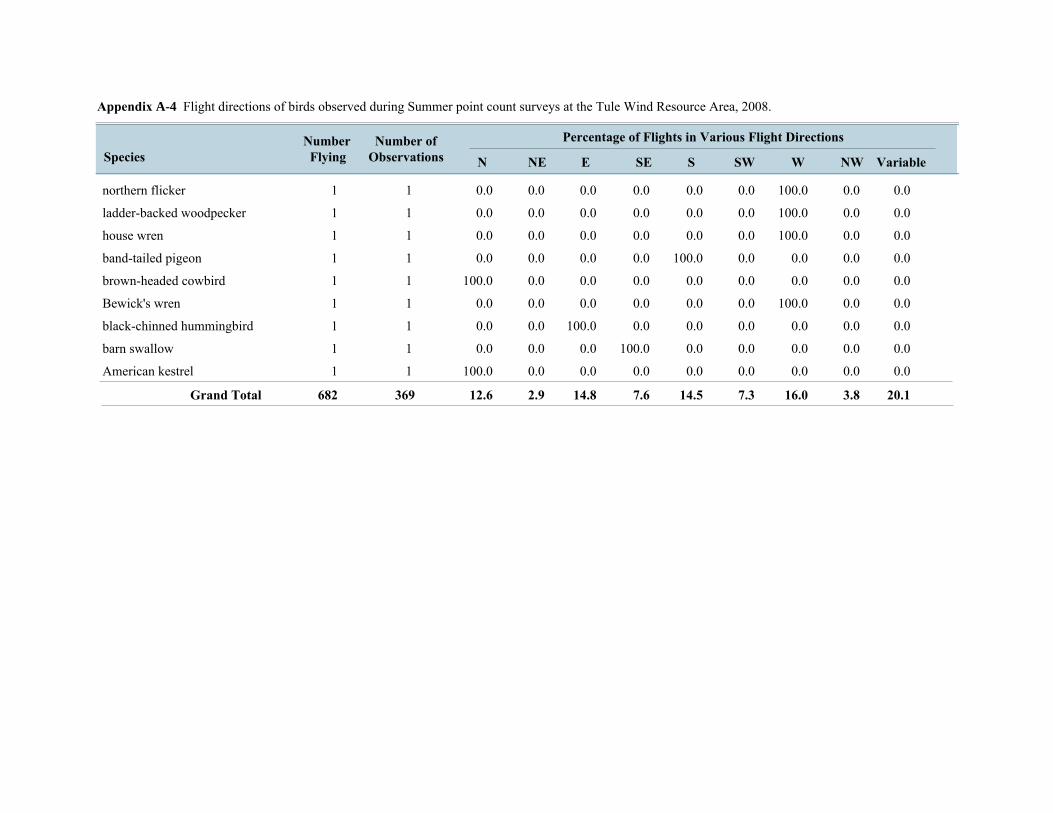
NumberFlying
Number ofObservationsSpecies
Appendix A-4 Flight directions of birds observed during Summer point count surveys at the Tule Wind Resource Area, 2008.
Percentage of Flights in Various Flight Directions
N NE E SE S SW W NW Variable
northern flicker 1 1 0.0 0.0 0.0 0.0 0.0 0.0 0.0100.0 0.0
ladder-backed woodpecker 1 1 0.0 0.0 0.0 0.0 0.0 0.0 0.0100.0 0.0
house wren 1 1 0.0 0.0 0.0 0.0 0.0 0.0 0.0100.0 0.0
band-tailed pigeon 1 1 0.0 0.0 0.0 0.0 100.0 0.0 0.00.0 0.0
brown-headed cowbird 1 1 100.0 0.0 0.0 0.0 0.0 0.0 0.00.0 0.0
Bewick's wren 1 1 0.0 0.0 0.0 0.0 0.0 0.0 0.0100.0 0.0
black-chinned hummingbird 1 1 0.0 0.0 100.0 0.0 0.0 0.0 0.00.0 0.0
barn swallow 1 1 0.0 0.0 0.0 100.0 0.0 0.0 0.00.0 0.0
American kestrel 1 1 100.0 0.0 0.0 0.0 0.0 0.0 0.00.0 0.0
682 369Grand Total 12.6 2.9 14.8 7.6 14.5 7.3 20.116.0 3.8
2007-2008 Avian Survey Tule Wind Resource Area
APPENDIX B
RAPTOR NEST DETAILS FOR THE TULE WIND RESOURCE AREA, SPRING 2008
January 2009

Appendix B: Raptor nests observed at the Tule Wind Resource Area, 2008.
NestNumber Species Substrate
NestConditionStatusDates
SurveyedNest
Height (m)
1 Cooper's hawk Oak ExcellentActive4/30/2008 10
2 NA Oak FairInactive4/30/2008 8
3 NA Oak GoodInactive4/30/2008 17
4 NA Oak ExcellentInactive4/30/2008 25
5 red-tailed hawk Cottonwood ExcellentActive4/30/2008 30
6 NA Oak RemnantInactive4/30/2008
7 NA Oak PoorInactive4/30/2008 15
8 NA Inactive4/30/2008
9 NA Oak ExcellentInactive4/1/2008 15
10 NA Oak GoodInactive4/30/2008 26
11 NA Oak GoneInactive4/30/2008
12 NA Oak GoodInactive4/30/2008 20
13 NA Oak GoodInactive4/30/2008 22
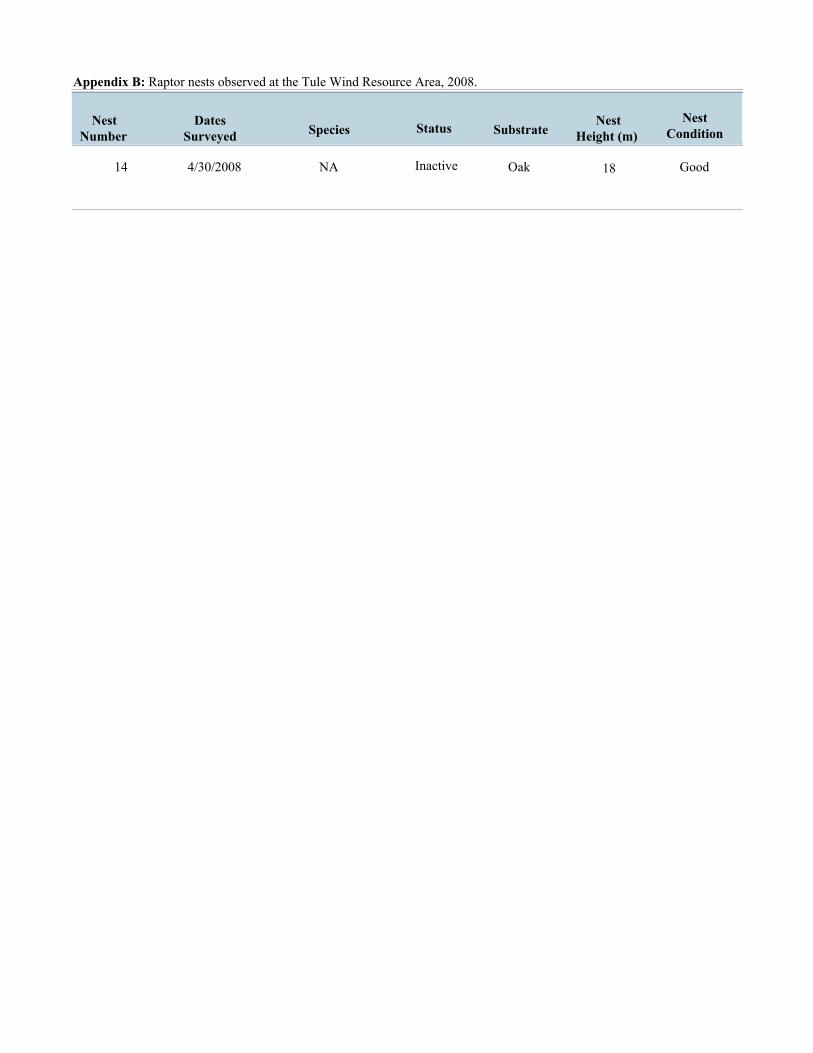
Appendix B: Raptor nests observed at the Tule Wind Resource Area, 2008.
NestNumber Species Substrate
NestConditionStatusDates
SurveyedNest
Height (m)
14 NA Oak GoodInactive4/30/2008 18