
Tuesday 10 June 2014 – Morning - MEImei.org.uk/files/papers/S2_2014_June.pdf · may assume that...
36
Tuesday 10 June 2014 – Morning A2 GCE MATHEMATICS (MEI) 4767/01 Statistics 2 QUESTION PAPER *1239966959* INSTRUCTIONS TO CANDIDATES These instructions are the same on the Printed Answer Book and the Question Paper. • The Question Paper will be found inside the Printed Answer Book. • Write your name, centre number and candidate number in the spaces provided on the Printed Answer Book. Please write clearly and in capital letters. • Write your answer to each question in the space provided in the Printed Answer Book. Additional paper may be used if necessary but you must clearly show your candidate number, centre number and question number(s). • Use black ink. HB pencil may be used for graphs and diagrams only. • Read each question carefully. Make sure you know what you have to do before starting your answer. • Answer all the questions. • Do not write in the bar codes. • You are permitted to use a scientific or graphical calculator in this paper. • Final answers should be given to a degree of accuracy appropriate to the context. INFORMATION FOR CANDIDATES This information is the same on the Printed Answer Book and the Question Paper. • The number of marks is given in brackets [ ] at the end of each question or part question on the Question Paper. • You are advised that an answer may receive no marks unless you show sufficient detail of the working to indicate that a correct method is being used. • The total number of marks for this paper is 72. • The Printed Answer Book consists of 12 pages. The Question Paper consists of 4 pages. Any blank pages are indicated. INSTRUCTION TO EXAMS OFFICER / INVIGILATOR • Do not send this Question Paper for marking; it should be retained in the centre or recycled. Please contact OCR Copyright should you wish to re-use this document. OCR is an exempt Charity Turn over © OCR 2014 [L/102/2657] DC (NH/SW) 75543/6 Candidates answer on the Printed Answer Book. OCR supplied materials: • Printed Answer Book 4767/01 • MEI Examination Formulae and Tables (MF2) Other materials required: • Scientific or graphical calculator Duration: 1 hour 30 minutes
Transcript of Tuesday 10 June 2014 – Morning - MEImei.org.uk/files/papers/S2_2014_June.pdf · may assume that...

Tuesday 10 June 2014 – MorningA2 GCE MATHEMATICS (MEI)
4767/01 Statistics 2
QUESTION PAPER
*1239966959*
INSTRUCTIONS TO CANDIDATES
These instructions are the same on the Printed Answer Book and the Question Paper.
• The Question Paper will be found inside the Printed Answer Book.• Write your name, centre number and candidate number in the spaces provided on the
Printed Answer Book. Please write clearly and in capital letters.• Write your answer to each question in the space provided in the Printed Answer
Book. Additional paper may be used if necessary but you must clearly show your candidate number, centre number and question number(s).
• Use black ink. HB pencil may be used for graphs and diagrams only.• Read each question carefully. Make sure you know what you have to do before starting
your answer.• Answer all the questions.• Do not write in the bar codes.• You are permitted to use a scientific or graphical calculator in this paper.• Final answers should be given to a degree of accuracy appropriate to the context.
INFORMATION FOR CANDIDATES
This information is the same on the Printed Answer Book and the Question Paper.
• The number of marks is given in brackets [ ] at the end of each question or part question on the Question Paper.
• You are advised that an answer may receive no marks unless you show sufficient detail of the working to indicate that a correct method is being used.
• The total number of marks for this paper is 72.• The Printed Answer Book consists of 12 pages. The Question Paper consists of 4 pages.
Any blank pages are indicated.
INSTRUCTION TO EXAMS OFFICER / INVIGILATOR
• Do not send this Question Paper for marking; it should be retained in the centre or recycled. Please contact OCR Copyright should you wish to re-use this document.
OCR is an exempt CharityTurn over
© OCR 2014 [L/102/2657]DC (NH/SW) 75543/6
Candidates answer on the Printed Answer Book.
OCR supplied materials:• Printed Answer Book 4767/01• MEI Examination Formulae and Tables (MF2)
Other materials required:• Scientific or graphical calculator
Duration: 1 hour 30 minutes

2
4767/01 Jun14© OCR 2014
1 A medical student is investigating the claim that young adults with high diastolic blood pressure tend to have high systolic blood pressure. The student measures the diastolic and systolic blood pressures of a random sample of ten young adults. The data are shown in the table and illustrated in the scatter diagram.
Diastolic blood pressure 60 61 62 63 73 76 84 87 90 95
Systolic blood pressure 98 121 118 114 108 112 132 130 134 139
500
90
0
100
110
120
130
140
150
60 70 80 90 100Diastolic blood pressure
Syst
olic
blo
od p
ress
ure
(i) Calculate the value of Spearman’s rank correlation coefficient for these data. [5]
(ii) Carry out a hypothesis test at the 5% significance level to examine whether there is positive association between diastolic blood pressure and systolic blood pressure in the population of young adults. [6]
(iii) Explain why, in the light of the scatter diagram, it might not be valid to carry out a test based on the product moment correlation coefficient. [2]
The product moment correlation coefficient between the diastolic and systolic blood pressures of a random sample of 10 athletes is 0.707.
(iv) Carry out a hypothesis test at the 1% significance level to investigate whether there appears to be positive correlation between these two variables in the population of athletes. You may assume that in this case such a test is valid. [5]

3
4767/01 Jun14 Turn over© OCR 2014
2 Manufacturing defects occur in a particular type of aluminium sheeting randomly, independently and at a constant average rate of 1.7 defects per square metre.
(i) Explain the meaning of the term ‘independently’ and name the distribution that models this situation. [2]
(ii) Find the probability that there are exactly 2 defects in a sheet of area 1 square metre. [2]
(iii) Find the probability that there are exactly 12 defects in a sheet of area 7 square metres. [3]
In another type of aluminium sheet, defects occur randomly, independently and at a constant average rate of 0.8 defects per square metre.
(iv) A large box is made from 2 square metres of the first type of sheet and 2 square metres of the second type of sheet, chosen independently. Show that the probability that there are at least 8 defects altogether in the box is 0.1334. [3]
A random sample of 100 of these boxes is selected.
(v) State the exact distribution of the number of boxes which have at least 8 defects. [2]
(vi) Use a suitable approximating distribution to find the probability that there are at least 20 boxes in the sample which have at least 8 defects. [5]
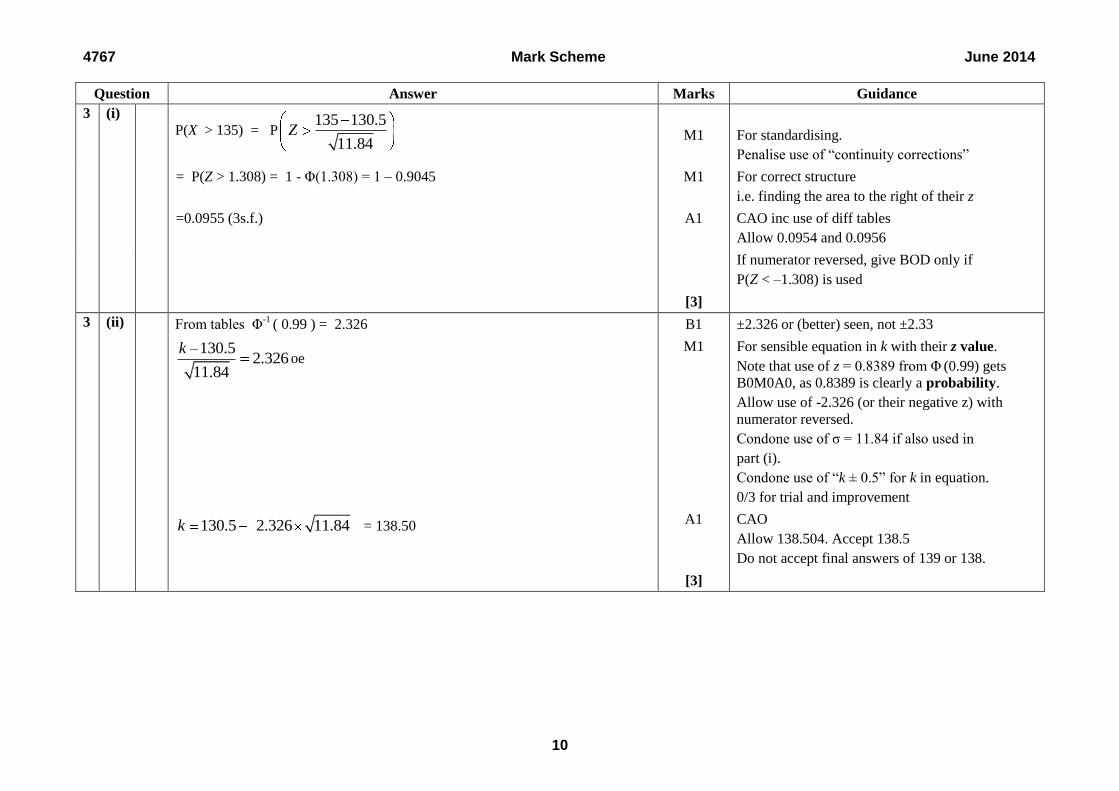
3 The wing lengths of native English male blackbirds, measured in mm, are Normally distributed with mean 130.5 and variance 11.84.
(i) Find the probability that a randomly selected native English male blackbird has a wing length greater than 135 mm. [3]
(ii) Given that 1% of native English male blackbirds have wing length more than k mm, find the value of k. [3]
(iii) Find the probability that a randomly selected native English male blackbird has a wing length which is 131 mm correct to the nearest millimetre. [3]
It is suspected that Scandinavian male blackbirds have, on average, longer wings than native English male blackbirds. A random sample of 20 Scandinavian male blackbirds has mean wing length 132.4 mm. You may assume that wing lengths in this population are Normally distributed with variance 11.84 mm2.
(iv) Carry out an appropriate hypothesis test, at the 5% significance level. [8]
(v) Discuss briefly one advantage and one disadvantage of using a 10% significance level rather than a 5% significance level in hypothesis testing in general. [2]

4
4767/01 Jun14© OCR 2014
4 A researcher at a large company thinks that there may be some relationship between the numbers of working days lost due to illness per year and the ages of the workers in the company. The researcher selects a random sample of 190 workers. The ages of the workers and numbers of days lost for a period of 1 year are summarised below.
Working days lost
0 to 4 5 to 9 10 or more
Age
Under 35 31 27 4
35 to 50 28 32 8
Over 50 16 28 16
(i) Carry out a test at the 1% significance level to investigate whether the researcher’s belief appears to be true. Your working should include a table showing the contributions of each cell to the test statistic. [10]
(ii) For the ‘Over 50’ age group, comment briefly on how the working days lost compare with what would be expected if there were no association. [3]
(iii) A student decides to reclassify the ‘working days lost’ into two groups, ‘0 to 4’ and ‘5 or more’, but leave the age groups as before. The test statistic with this classification is 7.08. Carry out the test at the 1% level with this new classification, using the same hypotheses as for the original test. [3]
(iv) Comment on the results of the two tests. [2]
END OF QUESTION PAPER
Copyright Information
OCR is committed to seeking permission to reproduce all third-party content that it uses in its assessment materials. OCR has attempted to identify and contact all copyright holders whose work is used in this paper. To avoid the issue of disclosure of answer-related information to candidates, all copyright acknowledgements are reproduced in the OCR Copyright Acknowledgements Booklet. This is produced for each series of examinations and is freely available to download from our public website (www.ocr.org.uk) after the live examination series.
If OCR has unwittingly failed to correctly acknowledge or clear any third-party content in this assessment material, OCR will be happy to correct its mistake at the earliest possible opportunity.
For queries or further information please contact the Copyright Team, First Floor, 9 Hills Road, Cambridge CB2 1GE.
OCR is part of the Cambridge Assessment Group; Cambridge Assessment is the brand name of University of Cambridge Local Examinations Syndicate (UCLES), which is itself a department of the University of Cambridge.
Turn over© OCR 2014 [L/102/2657]DC (NH) 75542/6
Tuesday 10 June 2014 – MorningA2 GCE MATHEMATICS (MEI)
4767/01 Statistics 2
PRINTED ANSWER BOOK
INSTRUCTIONS TO CANDIDATESThese instructions are the same on the Printed Answer Book and the Question Paper.• The Question Paper will be found inside the Printed Answer Book.• Write your name, centre number and candidate number in the spaces provided on the
Printed Answer Book. Please write clearly and in capital letters.• Write your answer to each question in the space provided in the Printed Answer
Book. Additional paper may be used if necessary but you must clearly show your candidate number, centre number and question number(s).
• Use black ink. HB pencil may be used for graphs and diagrams only.• Read each question carefully. Make sure you know what you have to do before starting
your answer.• Answer all the questions.• Do not write in the bar codes.• You are permitted to use a scientific or graphical calculator in this paper.• Final answers should be given to a degree of accuracy appropriate to the context.
INFORMATION FOR CANDIDATESThis information is the same on the Printed Answer Book and the Question Paper.• The number of marks is given in brackets [ ] at the end of each question or part question
on the Question Paper.• You are advised that an answer may receive no marks unless you show sufficient detail
of the working to indicate that a correct method is being used.• The total number of marks for this paper is 72.• The Printed Answer Book consists of 12 pages. The Question Paper consists of 4 pages.
Any blank pages are indicated.
* 4 7 6 7 0 1 *
Candidates answer on this Printed Answer Book.
OCR supplied materials:• Question Paper 4767/01 (inserted)• MEI Examination Formulae and Tables (MF2)
Other materials required:• Scientific or graphical calculator
OCR is an exempt Charity
*1240591940*
Duration: 1 hour 30 minutes

2
© OCR 2014
1 (i)

3
Turn over© OCR 2014
1 (ii)
1 (iii)

4
© OCR 2014
1 (iv)
2 (i)
2 (ii)

5
Turn over© OCR 2014
2 (iii)
2 (iv)
2 (v)

6
© OCR 2014
2 (vi)

7
Turn over© OCR 2014
3 (i)
3 (ii)
3 (iii)

8
© OCR 2014
3 (iv)
3 (v)

9
Turn over© OCR 2014
4 (i)
(answer space continued on next page)

10
© OCR 2014
4 (i) (continued)
4 (ii)

11
© OCR 2014
4 (iii)
4 (iv)

12
© OCR 2014
PLEASE DO NOT WRITE ON THIS PAGE
Copyright Information
OCR is committed to seeking permission to reproduce all third-party content that it uses in its assessment materials. OCR has attempted to identify and contact all copyright holders whose work is used in this paper. To avoid the issue of disclosure of answer-related information to candidates, all copyright acknowledgements are reproduced in the OCR Copyright Acknowledgements Booklet. This is produced for each series of examinations and is freely available to download from our public website (www.ocr.org.uk) after the live examination series.
If OCR has unwittingly failed to correctly acknowledge or clear any third-party content in this assessment material, OCR will be happy to correct its mistake at the earliest possible opportunity.
For queries or further information please contact the Copyright Team, First Floor, 9 Hills Road, Cambridge CB2 1GE.
OCR is part of the Cambridge Assessment Group; Cambridge Assessment is the brand name of University of Cambridge Local Examinations Syndicate (UCLES), which is itself a department of the University of Cambridge.

Oxford Cambridge and RSA Examinations
GCE
Mathematics (MEI)
Unit 4767: Statistics 2
Advanced GCE
Mark Scheme for June 2014

4767 Final Mark Scheme June 2014
1
1. Annotations and abbreviations
Annotation in scoris Meaning
Blank Page – this annotation must be used on all blank pages within an answer booklet (structured or unstructured) and on each page of an additional object where there is no candidate response.
and
BOD Benefit of doubt
FT Follow through
ISW Ignore subsequent working
M0, M1 Method mark awarded 0, 1
A0, A1 Accuracy mark awarded 0, 1
B0, B1 Independent mark awarded 0, 1
SC Special case
^ Omission sign
MR Misread
Highlighting
Other abbreviations in mark scheme
Meaning
E1 Mark for explaining
U1 Mark for correct units
G1 Mark for a correct feature on a graph
M1 dep* Method mark dependent on a previous mark, indicated by *
cao Correct answer only
oe Or equivalent
rot Rounded or truncated
soi Seen or implied
www Without wrong working
4767 Final Mark Scheme June 2014
2
2. Subject-specific Marking Instructions for GCE Mathematics (MEI) Statistics strand
a Annotations should be used whenever appropriate during your marking.
The A, M and B annotations must be used on your standardisation scripts for responses that are not awarded either 0 or full marks. It is vital that you annotate standardisation scripts fully to show how the marks have been awarded. For subsequent marking you must make it clear how you have arrived at the mark you have awarded.
b An element of professional judgement is required in the marking of any written paper. Remember that the mark scheme is designed to assist in marking incorrect solutions. Correct solutions leading to correct answers are awarded full marks but work must not be judged on the answer alone, and answers that are given in the question, especially, must be validly obtained; key steps in the working must always be looked at and anything unfamiliar must be investigated thoroughly.
Correct but unfamiliar or unexpected methods are often signalled by a correct result following an apparently incorrect method. Such work must be carefully assessed. When a candidate adopts a method which does not correspond to the mark scheme, award marks according to the spirit of the basic scheme; if you are in any doubt whatsoever (especially if several marks or candidates are involved) you should contact your Team Leader.
c The following types of marks are available.
M A suitable method has been selected and applied in a manner which shows that the method is essentially understood. Method marks are not usually lost for numerical errors, algebraic slips or errors in units. However, it is not usually sufficient for a candidate just to indicate an intention of using some method or just to quote a formula; the formula or idea must be applied to the specific problem in hand, eg by substituting the relevant quantities into the formula. In some cases the nature of the errors allowed for the award of an M mark may be specified.
A Accuracy mark, awarded for a correct answer or intermediate step correctly obtained. Accuracy marks cannot be given unless the associated Method mark is earned (or implied). Therefore M0 A1 cannot ever be awarded.
B Mark for a correct result or statement independent of Method marks.

4767 Final Mark Scheme June 2014
3
E A given result is to be established or a result has to be explained. This usually requires more working or explanation than the establishment of an unknown result.
Unless otherwise indicated, marks once gained cannot subsequently be lost, eg wrong working following a correct form of answer is ignored. Sometimes this is reinforced in the mark scheme by the abbreviation isw. However, this would not apply to a case where a candidate passes through the correct answer as part of a wrong argument.
d When a part of a question has two or more ‘method’ steps, the M marks are in principle independent unless the scheme specifically says otherwise; and similarly where there are several B marks allocated. (The notation ‘dep *’ is used to indicate that a particular mark is dependent on an earlier, asterisked, mark in the scheme.) Of course, in practice it may happen that when a candidate has once gone wrong in a part of a question, the work from there on is worthless so that no more marks can sensibly be given. On the other hand, when two or more steps are successfully run together by the candidate, the earlier marks are implied and full credit must be given.
e The abbreviation ft implies that the A or B mark indicated is allowed for work correctly following on from previously incorrect results. Otherwise, A and B marks are given for correct work only — differences in notation are of course permitted. A (accuracy) marks are not given for answers obtained from incorrect working. When A or B marks are awarded for work at an intermediate stage of a solution, there may be various alternatives that are equally acceptable. In such cases, exactly what is acceptable will be detailed in the mark scheme rationale. If this is not the case please consult your Team Leader. Sometimes the answer to one part of a question is used in a later part of the same question. In this case, A marks will often be ‘follow through’. In such cases you must ensure that you refer back to the answer of the previous part question even if this is not shown within the image zone. You may find it easier to mark follow through questions candidate-by-candidate rather than question-by-question.
f Wrong or missing units in an answer should not lead to the loss of a mark unless the scheme specifically indicates otherwise. Candidates are expected to give numerical answers to an appropriate degree of accuracy. 3 significant figures may often be the norm for this, but this always needs to be considered in the context of the problem in hand. For example, in quoting probabilities from Normal tables, we generally expect some evidence of interpolation and so quotation to 4 decimal places will often be appropriate. But even this does not always apply – quotations of the standard critical points for significance tests such as 1.96, 1.645, 2.576 (maybe even 2.58 – but not 2.57) will commonly suffice, especially if the calculated value of a test statistic is nowhere near any of these values. Sensible discretion must be exercised in such cases. Discretion must also be exercised in the case of small variations in the degree of accuracy to which an answer is given. For example, if 3 significant figures are expected (either because of an explicit instruction or because the general context of a problem demands it) but only 2 are given, loss of an accuracy ("A") mark is likely to be appropriate; but if 4 significant figures
4767 Final Mark Scheme June 2014
4
are given, this should not normally be penalised. Likewise, answers which are slightly deviant from what is expected in a very minor manner (for example a Normal probability given, after an attempt at interpolation, as 0.6418 whereas 0.6417 was expected) should not be penalised. However, answers which are grossly over- or under-specified should normally result in the loss of a mark. This includes cases such as, for example, insistence that the value of a test statistic is (say) 2.128888446667 merely because that is the value that happened to come off the candidate's calculator. Note that this applies to answers that are given as final stages of calculations; intermediate working should usually be carried out, and quoted, to a greater degree of accuracy to avoid the danger of premature approximation. The situation regarding any particular cases where the accuracy of the answer may be a marking issue should be detailed in the mark scheme rationale. If in doubt, contact your Team Leader.
g Rules for replaced work If a candidate attempts a question more than once, and indicates which attempt he/she wishes to be marked, then examiners should do as the candidate requests.
If there are two or more attempts at a question which have not been crossed out, examiners should mark what appears to be the last (complete) attempt and ignore the others. NB Follow these maths-specific instructions rather than those in the assessor handbook.
h Genuine misreading (of numbers or symbols, occasionally even of text) occurs. If this results in the object and/or difficulty of the question being considerably changed, it is likely that all the marks for that question, or section of the question, will be lost. However, misreads are often such that the object and/or difficulty remain substantially unaltered; these cases are considered below. The simple rule is that all method ("M") marks [and of course all independent ("B") marks] remain accessible but at least some accuracy ("A") marks do not. It is difficult to legislate in an overall sense beyond this global statement because misreads, even when the object and/or difficulty remains unchanged, can vary greatly in their effects. For example, a misread of 1.02 as 10.2 (perhaps as a quoted value of a sample mean) may well be catastrophic; whereas a misread of 1.6748 as 1.6746 may have so slight an effect as to be almost unnoticeable in the candidate's work. A misread should normally attract some penalty, though this would often be only 1 mark and should rarely if ever be more than 2. Commonly in sections of questions where there is a numerical answer either at the end of the section or to be obtained and commented on (eg the value of a test statistic), this answer will have an "A" mark that may actually be designated as "cao" [correct answer only]. This should be interpreted strictly – if the misread has led to failure to obtain this value, then this "A" mark must be withheld even if all method marks have been earned. It will also often be the case that such a mark is implicitly "cao"

4767 Final Mark Scheme June 2014
5
even if not explicitly designated as such. On the other hand, we commonly allow "fresh starts" within a question or part of question. For example, a follow-through of the candidate's value of a test statistic is generally allowed (and often explicitly stated as such within the marking scheme), so that the candidate may exhibit knowledge of how to compare it with a critical value and draw conclusions. Such "fresh starts" are not affected by any earlier misreads. A misread may be of a symbol rather than a number – for example, an algebraic symbol in a mathematical expression. Such misreads are more likely to bring about a considerable change in the object and/or difficulty of the question; but, if they do not, they should be treated as far as possible in the same way as numerical misreads, mutatis mutandis. This also applied to misreads of text, which are fairly rare but can cause major problems in fair marking. The situation regarding any particular cases that arise while you are marking for which you feel you need detailed guidance should be discussed with your Team Leader. Note that a miscopy of the candidate’s own working is not a misread but an accuracy error.

4767 Mark Scheme June 2014
6
Question Answer Marks Guidance
1 (i)
Diastolic 60 61 62 63 73 76 84 87 90 95
Systolic 98 121 118 114 108 112 132 130 134 139
Rank dias 1 2 3 4 5 6 7 8 9 10
Rank sys 1 6 5 4 2 3 8 7 9 10
d 0 4 2 0 -3 -3 1 -1 0 0
d2 0 16 4 0 9 9 1 1 0 0
M1 For attempt at ranking (allow all ranks reversed)
M1 For d2
Σd2 = 40 A1 For 40 soi e.g. can be implied by 0.242 seen.
2
2
6 6 40 2401 1 1 1 0.242
10 99 990( 1)
ds
n nr
M1 For method for rs using their Σd2
= 0.758 (to 3 s.f.) [ allow 0.76 to 2 s.f.]
A1 For 0.758 or 25/33 or 0.75 recurring
f.t. their Σd2 provided |rs| < 1
Do not allow 0.7575
NB No ranking scores 0/5
[5]

4767 Mark Scheme June 2014
7
Question Answer Marks Guidance
1 (ii)
H0: no association between diastolic blood pressure and systolic blood pressure
in the population of young adults
B1
H1: positive association between diastolic blood pressure and systolic blood
pressure in the population of young adults
B1 NB Hypotheses must be in context.
H0: no association,
H1: positive association, earns SC1
Hypotheses must not be given in terms of ρ or
mention correlation. Ignore references to ρ if
hypotheses also given in words.
B1 For population of young adults seen at least
once. Do not allow underlying population.
B0 for population correlation coefficient.
One tail test critical value at 5% level is 0.5636 B1* for 0.5636
cv from pmcc test = 0.5494 gets B0
Since 0.758 > 0.5636, there is sufficient evidence to reject H0,
M1dep*
For a sensible comparison, leading to a conclusion,
of their rs with 0.5636, provided 0 < rs< 1
The comparison may be in the form of a diagram.
i.e. conclude that there is sufficient evidence to suggest that there is positive
association between diastolic blood pressure and systolic blood pressure (in the
population of young adults).
A1
For non-assertive, correct conclusion in context.
f.t. their rs. Allow “support” in place of “suggest”.
Do not allow “show”, “imply”, “conclude” or
”prove” in place of “suggest”.
If a two-tailed test is carried out then award
maxB1B0B1B1(for 0.6485)M0A0
[6]
1 (iii) The scatter diagram does not appear to be roughly elliptical
so the (population) may not have a bivariate Normal distribution.
E1 For not elliptical. Allow “not oval”.
E1 For not bivariate Normal.
Do not allow “not Normal bivariate”.
Do not allow “the data does not have a bivariate
Normal distribution”.
[2]

4767 Mark Scheme June 2014
8
Question Answer Marks Guidance
1 (iv) H0: ρ = 0
H1: ρ > 0
B1
Do not allow other symbols unless clearly defined
as population correlation coefficient.
Do not allow hypotheses solely in words.
where ρ is the (population) correlation coefficient B1 For defining ρ
For n = 10, 1% critical value = 0.7155 B1* For 0.7155
Since 0.707 < 0.7155 the result is not significant M1dep*
For sensible comparison leading to a conclusion.
Conclusion soi.
There is insufficient evidence at the 1% level to suggest that there is positive
correlation between diastolic blood pressure and systolic blood pressure (in this
population).
A1
For non-assertive correct conclusion in context.
If a two-tailed test is carried out then award
maxB0B1B1(for 0.7646)M0A0
[5]
2 (i) ‘Independently’ means that the occurrence of one defect does not affect the
probability of another defect occurring.
E1 Allow e.g. “event” for “defect”
Poisson distribution E1 Allow Po(…)
[2]
2 (ii)
P( 2 defects ) =
1.7 2e 1.7
2!
OR from tables P( 2 defects) = 0.7572 – 0.4932
M1
For calculation of P(X = 2)
= 0.2640 A1 CAO Allow 0.264
Do not allow 0.2639
[2]

4767 Mark Scheme June 2014
9
Question Answer Marks Guidance
2 (iii) New λ = 7 1.7 = 11.9 B1 For mean (SOI)
P(12 defects) =
11.9 12e 11.9
12!
M1 For calculation with their λ ≠ 1.7
= 0.1143 cao A1
Allow 0.114 www
Note B0M1A0 for 0.114 from use of λ = 11.7
[3]
2 (iv) New λ = (2 × 1.7) + (2 × 0.8) = 5.0 B1* For new mean = 5 seen
P(At least 8 defects) = 1 – P(7 or fewer defects)
= 1 – 0.8666
B1*
B1dep*
For 1 – P(X ≤ 7) or 1 - P(X < 8) seen
For 1 – 0.8666 seen
(= 0.1334) NB Answer given
[3]
2 (v) Binomial(100, 0.1334) or B(100, 0.1334) B1* For binomial.
B1dep* For parameters
[2]
2 (vi) Mean = 13.34 B1 For mean (soi)
Variance = 100 × 0.1334 × 0.8666 = 11.56 B1 For variance (soi)
Using Normal approx. to the binomial,
X ~ N(13.34, 11.56)
For B(13.34, 11.56) seen, award B0B0 unless used
correctly as part of a Normal calculation.
P(X ≥ 20) = P19.5 13.34
11.56Z
= P(Z > 1.812) = 1 – Φ(1.812) = 1 – 0.9650
B1 For 19.5 seen
M1 For probability using correct tail and a sensible
calculation with their mean and variance.
e.g. using standard deviation = 11.56 or finding
P(Z < 1.812) gets M0A0
= 0.035 A1 CAO, (Do not FT wrong or omitted CC)
[5]
4767 Mark Scheme June 2014
10
Question Answer Marks Guidance
3 (i)
P(X > 135) = P135 130.5
11.84Z
M1
For standardising.
Penalise use of “continuity corrections”
= P(Z > 1.308) = 1 - Φ(1.308) = 1 – 0.9045 M1 For correct structure
i.e. finding the area to the right of their z
=0.0955 (3s.f.) A1 CAO inc use of diff tables
Allow 0.0954 and 0.0956
If numerator reversed, give BOD only if
P(Z < –1.308) is used
[3]
3 (ii) From tables Φ-1
( 0.99 ) = 2.326 B1 ±2.326 or (better) seen, not ±2.33
130.52.326
11.84
koe
M1 For sensible equation in k with their z value.
Note that use of z = 0.8389 from Φ (0.99) gets
B0M0A0, as 0.8389 is clearly a probability.
Allow use of -2.326 (or their negative z) with
numerator reversed.
Condone use of σ = 11.84 if also used in
part (i).
Condone use of “k ± 0.5” for k in equation.
0/3 for trial and improvement
130.5 2.326 11.84k = 138.50
A1 CAO
Allow 138.504. Accept 138.5
Do not accept final answers of 139 or 138.
[3]

4767 Mark Scheme June 2014
11
Question Answer Marks Guidance
3 (iii)
P(Wing length = 131) = P130.5 130.5 131.5 130.5
11.84 11.84Z
B1
For both limits correct, soi.
e.g. use of 0.5 in probability calculation implies
correct lower limit.
= P(0 < Z < 0.2906)
= Φ(0. 2906) – Φ(0)
= 0.6143 – 0.5
M1
For correct structure using their standardised
values. i.e. Finding the area between their z
values found using µ = 130.5
Condone use of σ = 11.84 if also used in part (i) or
part (ii).
= 0.1143 A1 CAO inc use of diff tables
Allow 0.1145
Allow 0.114 www
[3]

4767 Mark Scheme June 2014
12
Question Answer Marks Guidance
3 (iv) H0: μ = 130.5
H1 : μ > 130.5
B1 For both correct
Hypotheses in words must refer to population.
Do not allow other symbols unless clearly defined
as population mean
Where μ denotes the mean wing length (in the population) (of Scandinavian
male blackbirds).
B1 For definition of μ in context.
Do not allow “sample mean wing length”
or “mean wing length of English blackbirds”
Test statistic =
132.4 130.5 1.90
0.769411.84 / 20
M1* must include √20
Condone use of σ = 11.84 if also used in part (i),
part (ii) or part (iii).
Condone numerator reversed for
max M1*A0B1M0depA0A0 (max 4/8)
= 2.469 A1 Allow 2.47
Upper 5% level 1 tailed critical value of z = 1.645
B1 For 1.645. Must be positive.
B0 if -1.645 seen.
No further A marks from here if wrong.
2.469 > 1.645 M1dep* For sensible comparison leading to a conclusion.
The result is significant. There is sufficient evidence to reject H0 A1 For correct conclusion. e.g. for “significant” oe
FT only candidate’s test statistic if cv = 1.645
There is sufficient evidence to suggest that the mean wing length (of this
population of birds) is greater (than 130.5mm).
A1 For non-assertive conclusion in context,
consistent with their result
Condone use of “average” for “mean”
FT only candidate’s test statistic if cv = 1.645
[8]

4767 Mark Scheme June 2014
13
Question Answer Marks Guidance
3 (v) With a 10% significance level rather than a 5% significance level,
Advantage: One is less likely to accept the null hypothesis when it is false. E1 Accept equivalent wording.
Disadvantage: One is more likely to reject the null hypothesis when it is true. E1 Note – Unless stated otherwise, assume the first
comment relates to an advantage and the second
comment relates to a disadvantage.
[2]

4767 Mark Scheme June 2014
14
Question Answer Marks Guidance
4 (i) H0: no association between age and working days lost
H1: some association between age and working days lost
EXPEC
TED 0 to 4 5 to 9 10 or more
Under
35 24.47 28.39 9.14
35 to 50 26.84 31.14 10.02
Over 50 23.68 27.47 8.84
B1 For hypotheses, at least one of which is in context.
Allow hypotheses in terms of independence, in
context.
Do not allow “relationship” or “correlation” for
“association”
B1 For at least one row/column of expected values
correct (to 1 d.p.)
Seen or implied by contributions
B1 All correct (to 2 d.p.). Accept fraction equivalents.
Seen or implied by contributions
CONTRIB
’N
0 to 4 5 to 9 10 or more
Under 35 1.7404 0.0680 2.8880
35 to 50 0.0499 0.0239 0.4076
Over 50 2.4931 0.0101 5.7945
M1 For valid attempt at (O-E)2/E
Seen or implied by at least one correct
contribution to 2 d.p.. Allow 5.80 for last cell.
Condone values in a list.
A1 For all correct to 2 d.p. or better.
Allow 5.80 for last cell. Condone values in a list.
NB: These two marks cannot be implied by a
correct final value of X 2
X 2 = 13.48 B1 For answers rounding to 13.48. Do not penalize
over-specification here.
Refer to 2
4 B1 For 4 degrees of freedom.
Critical value at 1% level = 13.28 B1 No further marks from here if incorrect.
13.48 > 13.28 so result is significant
B1* For significant oe
FT their test statistic
There is evidence to suggest that there is some association between age and
working days lost
E1dep* For non-assertive conclusion in context
Allow conclusion in terms of independence
FT their test statistic
NB if H0 H1 reversed, or ‘correlation’ mentioned,
do not award final E1
[10]

4767 Mark Scheme June 2014
15
Question Answer Marks Guidance
4 (ii) The large contribution/contribution of 2.4931 implies that there are fewer
employees than expected who lose 0 to 4 working days.
The small contribution/contribution of 0.0101 implies that there are about as
many as expected who lose 5 to 9 working days.
E1 For correct interpretation with reference to
contribution for 0 to 4 working days
E1 For correct interpretation with reference to
contribution for 5 to 9 working days
The large contribution/contribution of 5.7945 implies that there are more
employees than expected who lose more than 10 working days.
E1 For correct interpretation with reference to
contribution for more than 10 working days
SC1 if all interpretations are correct but with no
reference to contributions. i.e. max 1 out of 3
[3]
4 (iii) Critical value at 1% level = 9.21 B1* CAO for cv
7.08 < 9.21 so the result is not significant oe B1dep* For correct conclusion
There is insufficient evidence to suggest that there is an association between age
and working days lost.
E1dep* For non-assertive conclusion in context
[3]
4 (iv) Conclusion in (iii) is valid if only categorizing working days lost into ‘0 to 4’
and ‘5 or more’.
However, if ‘5 or more’ is subdivided into ‘5 to 9’ and ‘10 or more’, this
additional subdivision gives the data more precision and allows the relationship
in part (i) to be revealed.
E1 As written,
or for explaining that combining/subdividing
groups leads to a different result.
E1 For subdivision allows relationship to be revealed
or gives more precision/sensitivity/detail.
Allow subdivision gives “a more reliable test” but
not “a more accurate test”
For both to be awarded, wording must be clear.
[2]

OCR Report to Centres – June 2014
43
4767 Statistics 2
General Comments The overall performance of candidates taking this paper was very good. It was particularly pleasing to see candidates taking care over the wording used in hypothesis tests, with the majority providing non-assertive conclusions referring to the alternative hypothesis. Most candidates demonstrated awareness of the difference between parameters relating to an underlying population and statistics relating to sample data, though there are still many who seem unsure in this area. In general, statistical calculations were accurately handled and, where statistical tables were required, these were used appropriately. More candidates took care not to provide over-specified answers than in previous years. As in previous years, questions requiring some form of interpretation provided the most diverse range of responses; if candidates could be advised to limit explanations to statistical considerations then their answers would be more likely to gain credit. Comments on Individual Questions: Question No. 1 (i) Well answered. Responses to the first part this question saw most candidates correctly
rank the data and then accurately use the appropriate formula to find the correct figure to an appropriate degree of accuracy. Of the few errors, mostly it was forgetting the “1 -...” even if the formula had been quoted correctly initially.
(ii) Also well answered, with correctly worded hypotheses and conclusions commonly seen.
There were a few cases of the final statement being too assertive [eg “there is positive association between...”]. Most candidates obtained the correct critical value and used it appropriately. A small proportion of candidates seemed unsure whether to use “association” or “correlation” in this part, and expressions given in terms of ρ appeared alongside otherwise correct hypotheses in many cases.
(iii) The need for the elliptical nature of the scatter diagram and the relevance of this for the
underlying population distribution seemed to be known by many candidates although the language explaining the relevance was sometimes not as precise as it might have been. Many incorrect spellings of “ellipse” and “bivariate” were seen. Candidates referring to the distribution of the “data” rather than “underlying population” were penalised.
(iv) Use of the correct symbol , in hypotheses was common, as was its definition. Though most candidates gave fully correct final statements, there were many who were too assertive in their summing up or who focussed on the null hypothesis [eg “the evidence suggests there is no association between…].
Question No. 2 (i) The vast majority of candidates got the mark for identifying the Poisson distribution though
most struggled to provide a statistical interpretation of “independent”. Many attempts went along the lines of “independent means not dependent”. Those attempting to mention probability in their explanations usually picked up this mark.
(ii) Most candidates earned both marks. The few errors seen usually involved accuracy –
either over-specification or incorrect rounding.

OCR Report to Centres – June 2014
44
(iii) Most candidates earned all three marks. Fairly common errors included using λ = 7, or
finding P(7 defects). (iv) Most candidates provided convincing methods leading to the given answer. Those who
stated that λ = 5 tended to obtain all three marks. A small proportion stated incorrectly that P(X ≥ 8) = 1 – P(X <7). Since the answer was provided, candidates who just wrote “1 – 0.8666” without first writing “1 – P(X ≤ 7)” were not given full credit.
(v) Mostly correct answers were seen, though Poisson or Normal distributions were suggested
by a small proportion of candidates. (vi) Many were awarded full marks here; it was clear that candidates were familiar with the
method. Common errors included not applying the continuity correction or mistakes with the standard deviation (such as using σ = 11.56 or σ = √13.34).
Question No. 3 (i) Apart from the occasional use of a spurious continuity correction, or using the variance as
the standard deviation, this part of the question caused few problems for candidates. It was pleasing to note that there were fewer cases of the use of the form
mean - valuewhen standardising. Some candidates evaluated Φ(1.308) rather than 1 -
Φ(1.308) for their final answer. (ii) Most obtained the value 2.326 and then used it correctly in the relevant equation, avoiding
continuity corrections, to find the value of k. Common errors included using -2.326 or 1.282 in place of +2.326.
(iii) Many candidates correctly identified the appropriate range of values as 130.5 to 131.5 and
went on to find the appropriate probability, though other ranges were seen frequently.
(iv) Having used the correct symbol, , in the hypotheses (although a few believed related to the population of English male blackbirds), most candidates used the correct distribution of
the sample mean, 11.84
N 130.5,20
when answering this question. However, the inclusion
of units with the population variance led to confusion for some. Most candidates successfully completed the test by providing suitable conclusions, with over-assertiveness leading to loss of the final mark in only a few cases.
(v) This part of the question proved to be difficult for many candidates. Those who made the
connection that the move from 5% to 10% meant it was more likely to reject H0 tended to provide suitable comments. Most candidates did not clearly distinguish between their advantage and disadvantage.
Question No. 4 (i) This Chi-squared test was well handled by the majority of candidates. Most obtained the
mark for stating hypotheses though some use “relationship” here in place of “association”; many candidates provided hypotheses as an afterthought rather than at the beginning of their solution as desired. Most followed the instruction to “include a table showing the contributions of each cell to the test statistic” and, in general, a suitable level of accuracy in working was observed. Most obtained the marks for stating the number of degrees of freedom and critical value. Most provided appropriate conclusions here.
OCR Report to Centres – June 2014
45
(ii) Despite following the instruction to “include a table showing the contributions of each cell
to the test statistic” in part (i), it was evident that many candidates were unaware that this instruction was to assist in answering part (ii). Many of those who did make the connection tended to earn all three marks.
(iii) Well answered, though conclusions relating to the null hypothesis were seen frequently. (iv) Many candidates found it difficult to provide succinct answers to this question, though
many plausible comments were seen.

For a description of how UMS marks are calculated see:www.ocr.org.uk/learners/ums_results.html
Unit level raw mark and UMS grade boundaries June 2013 series: GCE 1
Unit level raw mark and UMS grade boundaries June 2014 seriesAS GCE / Advanced GCE / AS GCE Double Award / Advanced GCE Double AwardGCE Mathematics (MEI)
Max Mark a b c d e u4751/01 (C1) MEI Introduction to Advanced Mathematics Raw 72 61 56 51 46 42 0
UMS 100 80 70 60 50 40 04752/01 (C2) MEI Concepts for Advanced Mathematics Raw 72 57 51 45 39 33 0
UMS 100 80 70 60 50 40 04753/01 (C3) MEI Methods for Advanced Mathematics with Coursework: Written Paper Raw 72 58 52 47 42 36 04753/02 (C3) MEI Methods for Advanced Mathematics with Coursework: Coursework Raw 18 15 13 11 9 8 04753/82 (C3) MEI Methods for Advanced Mathematics with Coursework: Carried Forward Coursework Mark Raw 18 15 13 11 9 8 04753 (C3) MEI Methods for Advanced Mathematics with Coursework UMS 100 80 70 60 50 40 04754/01 (C4) MEI Applications of Advanced Mathematics Raw 90 68 61 54 47 41 0
UMS 100 80 70 60 50 40 04755/01 (FP1) MEI Further Concepts for Advanced Mathematics Raw 72 63 57 51 45 40 0
UMS 100 80 70 60 50 40 04756/01 (FP2) MEI Further Methods for Advanced Mathematics Raw 72 60 54 48 42 36 0
UMS 100 80 70 60 50 40 04757/01 (FP3) MEI Further Applications of Advanced Mathematics Raw 72 57 51 45 39 34 0
UMS 100 80 70 60 50 40 04758/01 (DE) MEI Differential Equations with Coursework: Written Paper Raw 72 63 56 50 44 37 04758/02 (DE) MEI Differential Equations with Coursework: Coursework Raw 18 15 13 11 9 8 04758/82 (DE) MEI Differential Equations with Coursework: Carried Forward Coursework Mark Raw 18 15 13 11 9 8 04758 (DE) MEI Differential Equations with Coursework UMS 100 80 70 60 50 40 04761/01 (M1) MEI Mechanics 1 Raw 72 57 49 41 34 27 0
UMS 100 80 70 60 50 40 04762/01 (M2) MEI Mechanics 2 Raw 72 57 49 41 34 27 0
UMS 100 80 70 60 50 40 04763/01 (M3) MEI Mechanics 3 Raw 72 55 48 42 36 30 0
UMS 100 80 70 60 50 40 04764/01 (M4) MEI Mechanics 4 Raw 72 48 41 34 28 22 0
UMS 100 80 70 60 50 40 04766/01 (S1) MEI Statistics 1 Raw 72 61 53 46 39 32 0
UMS 100 80 70 60 50 40 04767/01 (S2) MEI Statistics 2 Raw 72 60 53 46 40 34 0
UMS 100 80 70 60 50 40 04768/01 (S3) MEI Statistics 3 Raw 72 61 54 47 41 35 0
UMS 100 80 70 60 50 40 04769/01 (S4) MEI Statistics 4 Raw 72 56 49 42 35 28 0
UMS 100 80 70 60 50 40 04771/01 (D1) MEI Decision Mathematics 1 Raw 72 51 46 41 36 31 0
UMS 100 80 70 60 50 40 04772/01 (D2) MEI Decision Mathematics 2 Raw 72 46 41 36 31 26 0
UMS 100 80 70 60 50 40 04773/01 (DC) MEI Decision Mathematics Computation Raw 72 46 40 34 29 24 0
UMS 100 80 70 60 50 40 04776/01 (NM) MEI Numerical Methods with Coursework: Written Paper Raw 72 54 48 43 38 32 04776/02 (NM) MEI Numerical Methods with Coursework: Coursework Raw 18 14 12 10 8 7 04776/82 (NM) MEI Numerical Methods with Coursework: Carried Forward Coursework Mark Raw 18 14 12 10 8 7 04776 (NM) MEI Numerical Methods with Coursework UMS 100 80 70 60 50 40 04777/01 (NC) MEI Numerical Computation Raw 72 55 47 39 32 25 0
UMS 100 80 70 60 50 40 04798/01 (FPT) Further Pure Mathematics with Technology Raw 72 57 49 41 33 26 0
UMS 100 80 70 60 50 40 0GCE Statistics (MEI)
Max Mark a b c d e uG241/01 (Z1) Statistics 1 Raw 72 61 53 46 39 32 0
UMS 100 80 70 60 50 40 0G242/01 (Z2) Statistics 2 Raw 72 55 48 41 34 27 0
UMS 100 80 70 60 50 40 0G243/01 (Z3) Statistics 3 Raw 72 56 48 41 34 27 0
UMS 100 80 70 60 50 40 0


![file(ALF and ADS) and manual wiring] 8.0-9.0 mm - [not specified] 0.50-1.00 mm2 0.50-1.00 mm2 0.5 mm2 Operating Characteristics Automatic restart Battery voltage](https://static.fdocuments.us/doc/165x107/5bcb373d09d3f2761f8b82d0/alf-and-ads-and-manual-wiring-80-90-mm-not-specified-050-100-mm2-050-100.jpg)


![Mm2 Crazyness![1]](https://static.fdocuments.us/doc/165x107/558673bed8b42a08578b470f/mm2-crazyness1.jpg)

