TTA's Vision To be The mosT TrusTed - thoresen.com · 206 Management Structure 218 Details of the...
242
Transcript of TTA's Vision To be The mosT TrusTed - thoresen.com · 206 Management Structure 218 Details of the...

TTA's Vision
To be The mosT TrusTed AsiAn inVesTmenT group by 2020

002 Group Financial Summary
004 Honorary Chairman Statement
005 Message from Chairman
006 Message from CEO
010 Important Changes and Developments
012 Board of Directors and Executive Officers
015 Corporate Structure
016 Business Review and Outlook
054 Sustainable Development and Corporate
Social Responsibility : Policy and Mission
067 Corporate Governance Report
086 Risk Factors
091 Audit Committee Report
093 Internal Control and Risk Management
095 Financial Highlights
096 Income Structure
097 Management Discussion and Analysis
112 Statement of the Board of Directors'
Responsibilities for the Financial
Statements
113 Consolidated and Company Financial
Statements
200 Related Party Transactions
204 Dividend Policy
205 Remuneration of Auditors
206 Management Structure
218 Details of the Board of Directors and
Executives
228 Securities Holding by Directors and
Executives
230 Shareholding Structure
231 Company Investments
234 Glossary
237 Corporate Information
Table of Contents

002
THORESEN THAI AGENCIES PLC.
group Financial summaryrevenues
ebiTdA
revenue breakdown
ebiTdAbreakdown
Net Profit and Normalized Net Profit
(4,751.4)
(82.4) (256.3)
902.1
2,586.9
3,576.2
1,841.7
974.6
(11,335.1)
FY2014(2)FY2013(1) FY2015
(Million Baht)
(Million Baht)
(Million Baht)
(Million Baht)
(Million Baht)
Net Profit/ (Loss) to TTA
Normalized Net Profit(3) to TTA
Transport
Transport
Energy
Energy
Infrastructure
Infrastructure
Other Holding
27% 26%
47%
FY2013(1)
19,569.6
18%
34%
48%
FY2014(2)
19%
27%
54%
FY2015
19,569.6
22,341.3 21,425.8
FY2013 FY2014 FY2015
FY2013(1) FY2014(2)
32% 35% 38%
52%
23%
8%
-22%
62%
-10%
76%
7%
-15%
FY2015
13%
Group financial summary
22,341.3 21,425.8
2,586.9 3,576.2 1,841.7
FY2013 FY2014 FY2015
(4) (4)
003
ANNUAL REPORT 2015
Group financial summary
Key Financial ratio
historical eps and dividend payment
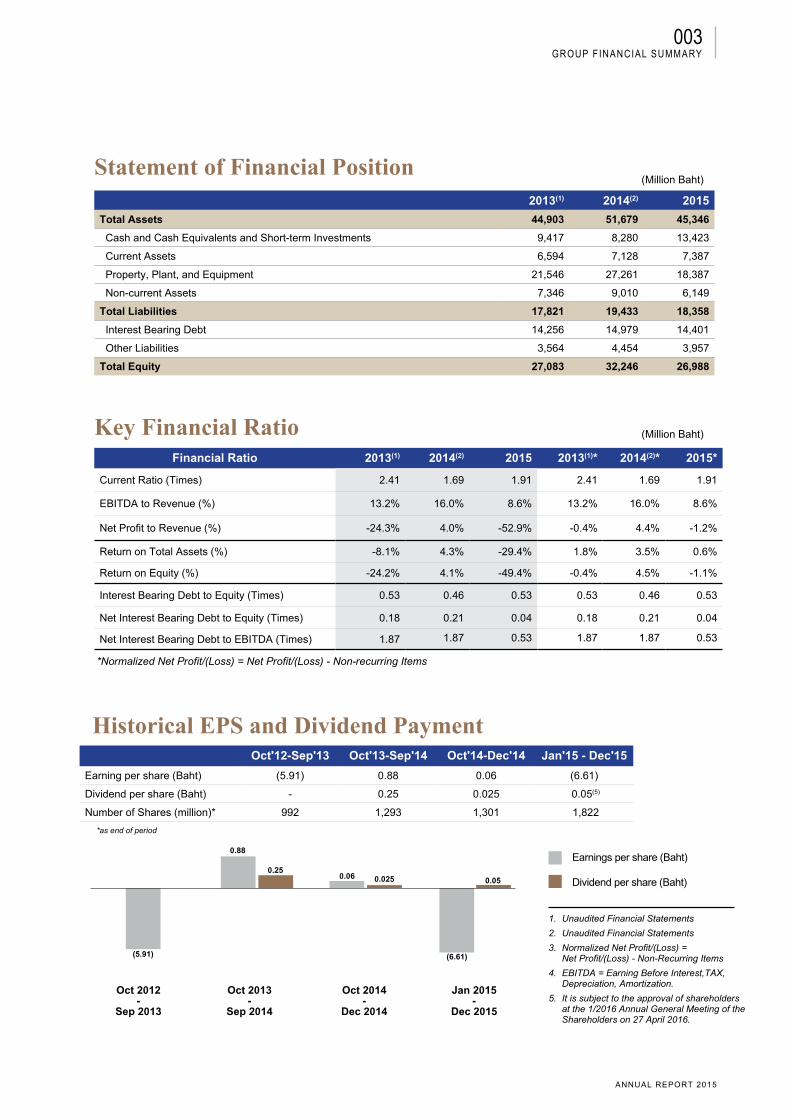
statement of Financial position(Million Baht)
(Million Baht)
Financial Ratio 2013(1) 2014(2) 2015 2013(1)* 2014(2)* 2015*
Current Ratio (Times) 2.41 1.69 1.91 2.41 1.69 1.91
EBITDA to Revenue (%) 13.2% 16.0% 8.6% 13.2% 16.0% 8.6%
Net Profit to Revenue (%) -24.3% 4.0% -52.9% -0.4% 4.4% -1.2%
Return on Total Assets (%) -8.1% 4.3% -29.4% 1.8% 3.5% 0.6%
Return on Equity (%) -24.2% 4.1% -49.4% -0.4% 4.5% -1.1%
Interest Bearing Debt to Equity (Times) 0.53 0.46 0.53 0.53 0.46 0.53
Net Interest Bearing Debt to Equity (Times) 0.18 0.21 0.04 0.18 0.21 0.04
Net Interest Bearing Debt to EBITDA (Times) 1.87 1.87 0.53 1.87 1.87 0.53
2013(1) 2014(2) 2015
Total Assets 44,903 51,679 45,346
Cash and Cash Equivalents and Short-term Investments 9,417 8,280 13,423
Current Assets 6,594 7,128 7,387
Property, Plant, and Equipment 21,546 27,261 18,387
Non-current Assets 7,346 9,010 6,149
Total Liabilities 17,821 19,433 18,358
Interest Bearing Debt 14,256 14,979 14,401
Other Liabilities 3,564 4,454 3,957
Total Equity 27,083 32,246 26,988
*Normalized Net Profit/(Loss) = Net Profit/(Loss) - Non-recurring Items
Earnings per share (Baht)
Dividend per share (Baht)
(5.91) (6.61)
0.88
0.250.025 0.050.06
Oct 2012-
Sep 2013
Oct 2013-
Sep 2014
Oct 2014-
Dec 2014
Jan 2015-
Dec 2015
Oct'12-Sep'13 Oct'13-Sep'14 Oct'14-Dec'14 Jan'15 - Dec'15
Earning per share (Baht) (5.91) 0.88 0.06 (6.61)
Dividend per share (Baht) - 0.25 0.025 0.05(5)
Number of Shares (million)* 992 1,293 1,301 1,822
1. Unaudited Financial Statements
2. Unaudited Financial Statements
3. Normalized Net Profit/(Loss) = Net Profit/(Loss) - Non-Recurring Items
4. EBITDA = Earning Before Interest,TAX, Depreciation, Amortization.
5. It is subject to the approval of shareholders at the 1/2016 Annual General Meeting of the Shareholders on 27 April 2016.
*as end of period

004
THORESEN THAI AGENCIES PLC.
I believe that our opportunitieswill be found in times of greatest
diff iculty.Prayudh Mahagits ir i
Honorary Chairman
Honorary cHairman statement
005
ANNUAL REPORT 2015
messaGe from cHairman
Dear Valued Shareholders,
The year 2015 was a difficult and challenging year. The world economy was evidently staggering as a result of several negative factors. China’s economic growth has slowed down more than expectation, oil prices have dropped dramatically and unceasingly. This has caused the decrease in commodity prices, severely affecting the economy of emerging and developing countries, especially those that are trading partners of China. In addition, emerging countries have suffered a big outflow of capital, moving to the United States, after the FED announced its policy on interest rate increase of 0.25% during late 2015.
Beyond doubt, such economic downturn and turbulence have directly impacted TTA’s performance this year. TTA’s two main businesses, the dry bulk shipping and offshore services for oil and gas industry, have severely suffered the economic slowdown and volatility of the market from the middle of 2014 until the end of 2015. The former has encountered the problem of lowest ever freight rates due to a lower demand caused by China’s economic slowdown coupled with oversupply of world fleet. Meanwhile, the offshore services for oil and gas business has been affected by a prolonged period of depressed oil prices that influenced oil companies to review and reduce their investment plans for exploration and production. This has affected all oil and gas businesses in the supply chain.
The fertilizer business has also been negatively affected, due to the prolonged drought in Southeast Asian region. This has caused the deceleration of demand for fertilizers. Likewise, the coal business has also decelerated. The prices have dropped because the world’s three biggest coal importers, namely China, Japan and India, dominating with over 50% of market share, have continuously reduced their coal imports.
Despite the volatile market condition and according to the global economy and life cycle of the business, most of TTA’s investments portfolio (ranging from transportation to energy and food to fertilizers) can be regarded as the foundation that facilitates people’s living. TTA is determined to maintain this core strength for the benefit of shareholders. In the meantime, we are fully prepared to encounter the downturn of the industry so that we can remain strong. With a view to reducing expenditure, we focus on effective cost and expense control, efficient spending and providing speedy solutions to the problems each business unit is facing. In regard to revenue generation, we enhance the efficiency of our business units so that they generate more revenue. We also keep an eye on new opportunities, new business contracts, expansion of service areas, establishing relationship with new clients, and taking good care of our existing clients.
With a purpose of the expansion of business, the Company is maintaining sufficient capital to be ready to invest.
However due to not so favorable business environment, the Company needs to consider even more thoroughly and prudently whether or not to invest in both existing and new businesses.
In this highly fluctuating economic condition, maintaining enough liquidity and equity allows the Company to tackle the situation well and endure any crisis with stability. Currently, TTA is having a strong financial position, with cash and short-term investments aggregating in excess of Baht 13 billion while the debt to equity ratio (D/E) is strong at mere 0.68.
Finally, on behalf of the Board of Directors, I would like to thank all TTA’s shareholders for your tremendous suppor t fo r the IPO launch o f PM Thoresen Asia Holdings Public Company Limited or PMTA during 2015. This enabled PMTA to be listed successfully on the Stock Exchange of Thailand (the “SET”) as the country’s second holding company which mainly invests overseas. PMTA’s graceful success has emphasized on TTA’s opportunity to grow firmly as a potential holding company. We don’t want to limit our business activities to the country. Instead, we aim, in the near future, to become a leading, globally-accepted holding company with pride.
Sincerely yours,
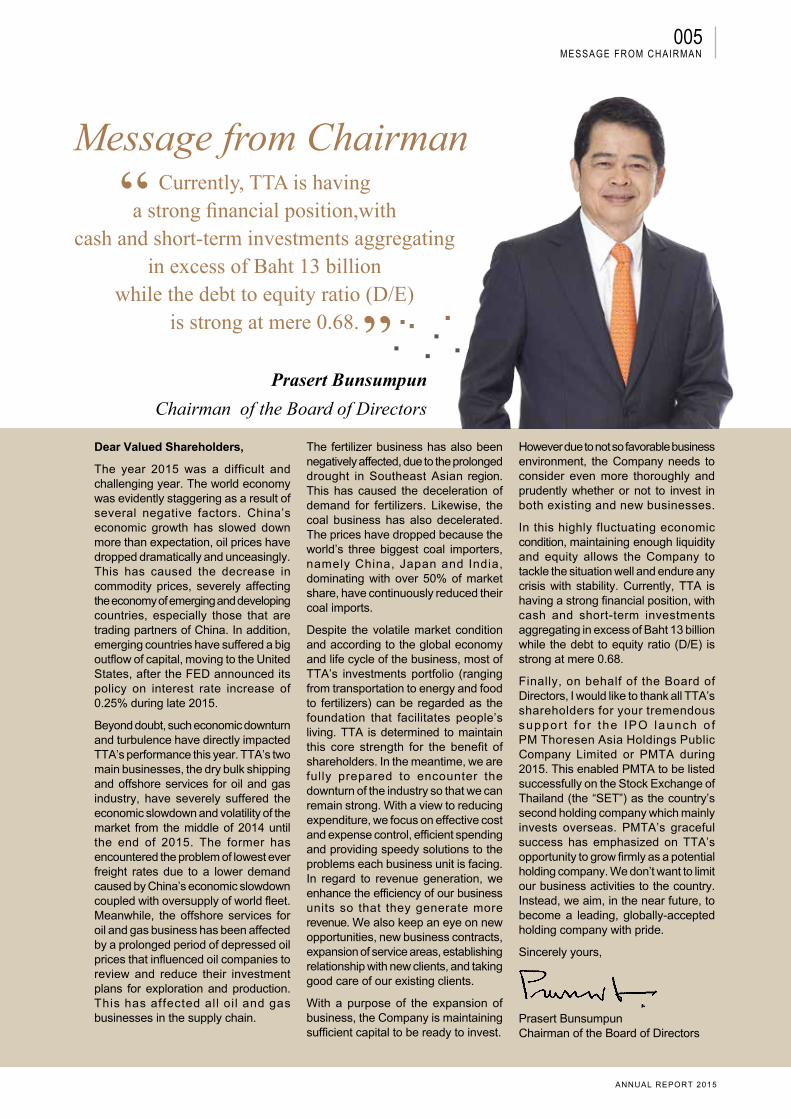
Prasert Bunsumpun Chairman of the Board of Directors
Prasert BunsumpunChairman of the Board of Directors
Message from ChairmanCurrently, TTA is having
a strong financial position,with cash and short-term investments aggregating
in excess of Baht 13 billion while the debt to equity ratio (D/E)
is strong at mere 0.68.
006
THORESEN THAI AGENCIES PLC.
Year 2015: The Year of
Volatility
Looking back at 2015, we faced a number of challenges and prolonged downturn in oil & gas, dry bulk shipping and coal industries, which are likely to continue throughout 2016 and part of 2017. The volatile situation turned 2015 into a very challenging and difficult year not only for us but our peers in all sectors of the economy. We cannot deny that these negative impacts have directly influenced the Company’s performance, but I am proud that we still maintained strong EBITDA of Baht 1.8 billion and positive net cash from operating activities of Baht 635.5 million in 2015. While this downturn has presented tremendous challenges, I believe the leaner we can be in these circumstances, the more it will help us to remain stronger and weather the storm in the next 24 months.
Asset Impairments
In line with best corporate governance practices and accounting standards that call for transparent financial reporting, it was necessary for the Company to take significant impairments and other provision of expenses resulting in a net loss of Baht 11,335.1 million, while reporting normalized net loss of only Baht 256.3 million. The significant net losses this year, driven primarily by non-cash extraordinary impairments and provision of expenses, have not affected our cash position. We continue to maintain strong net cash flow from operations of Baht 635.5 million with cash and short-term investment on our balance sheet totaling to Baht 13,423 million or approximately Baht 7.37 per share. We now go into 2016 with a balance sheet that represents a realistic view of our operations and should position us for strong performance improvement in future.
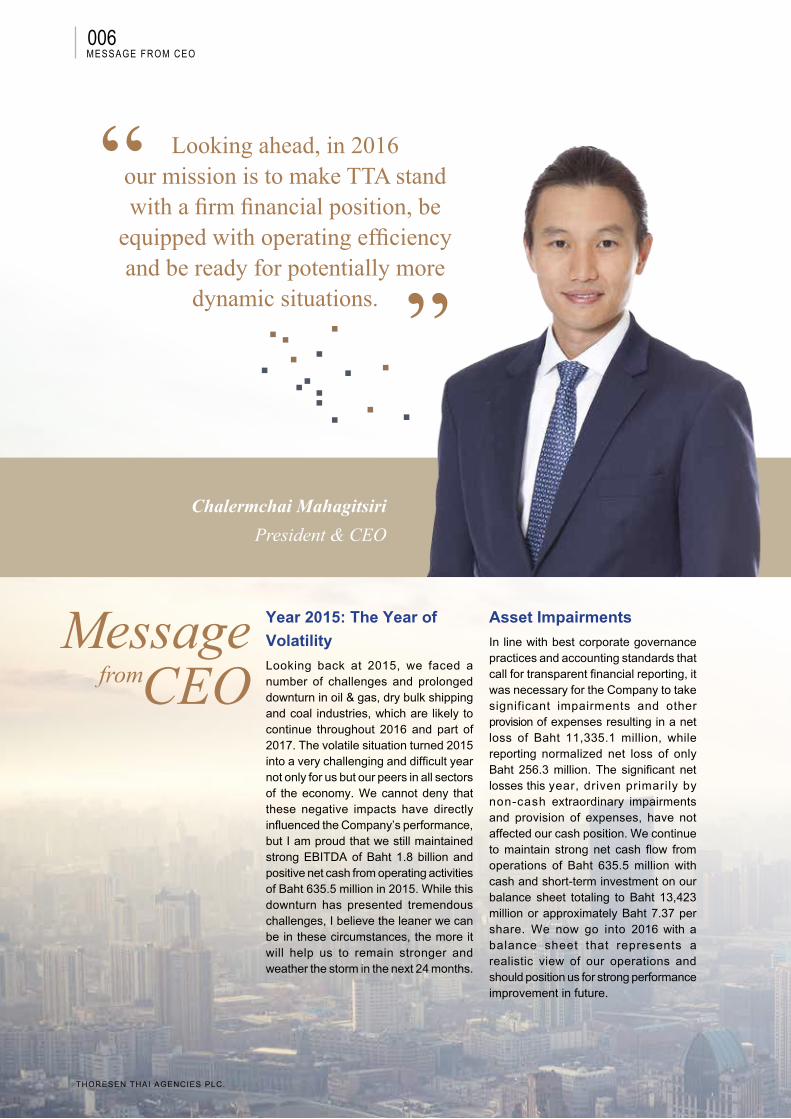
Looking ahead, in 2016 our mission is to make TTA stand with a firm financial position, be
equipped with operating efficiency and be ready for potentially more
dynamic situations.
Chalermchai MahagitsiriPresident & CEO
messaGe from ceo
MessageCEOfrom

007
ANNUAL REPORT 2015
Results
The dry bulk shipping business is suffering its worst downturn in nearly 30 years where BDI has fallen to its all-time low and averaging 718 in 2015. This is a decline of 35% from an average of 1,105 in 2014 which was already low. Despite the challenging environment, Thoresen Shipping still reported positive EBITDA of Baht 573.2 million with EBITDA margin of 10% in 2015. Backed by its strong commercial team, Thoresen Shipping’s average TCE rate was at USD 7,507 per day, outperforming the adjusted market TC average BSI by 22%. Thoresen Shipping also continued to focus on cost efficiencies with operating cash cost per day at USD 5,794. The combination of weaker demand from China and a glut of ships in the market during the year and for the next 24 months have put additional pressure on freight rates. Sooner or later, we may see a number of our peers exit this business. However, Thoresen Shipping remains in a strong position with a healthy balance sheet coupled with our business contingency plans to face the market under different scenarios so we can weather this storm.
For the oil and gas offshore services business, the oil price has been falling since mid-2014 from over USD 100 per BBL down to just over USD 30 BBL at the end of 2015. Despite the challenges of this operating environment, Mermaid revenues grew 8% to Baht 11,527.3 million in 2015. EBITDA for the year was also positive, while net profits before extraordinary charges were Baht 52.8 million. The
year-on-year improvement in Mermaid revenues was driven by its growing and now profitable cable laying activities as well as overall strong growth in subsea services. Set against the backdrop of the current operating environment, Mermaid remains in a strong position, w i t h a hea l t hy balance sheet as evidenced by its strong liquidity and low net gearing. Mermaid’s backlog of orders in hand stands at USD 255.5 million as of 31 December 2015 which is competitive given that we are at a low point in the industry cycle.
Infrastructure business brought in mixed results in 2015, with UMS reporting net loss of Baht 329.2 million to TTA. PMTA on the other hand, ended 2015 with the net profit of Baht 233 million, despite the challenging year with the shortage of rainfall in Southeast Asia that affected the demand for fertilizers. Several key developments were accomplished during the year driven by the company’s considerable effort, including the completion of its new granulation units to support future growth especially for export market, expanding more factory area for leasing and introduction of new products. In this backdrop, strong positive contribution from PMTA serves as a proof that TTA is on the right track of its diversification strategy.
Overall, in 2015 PMTA continued to strongly contribute to TTA, while the other three core businesses faced a number of challenges and prolonged industry downturn. Despi te the impairments and provision of expenses, TTA remains financially strong and has ample liquidity.
Our Successes
To sustain the business through such a crisis, our actions undertaken in 2015 included investing in Sino Grandness Food Industry Group Limited (“Sino Grandness”), a Singapore-Listed canned food and fruit beverage producer and distributor in China, early last year as part of our diversification into the food and beverage industry. The strategy positioned TTA as a leading holding company and provided a new business line, diversifying its investment with no significant risks from the downturn of industrial cycles.
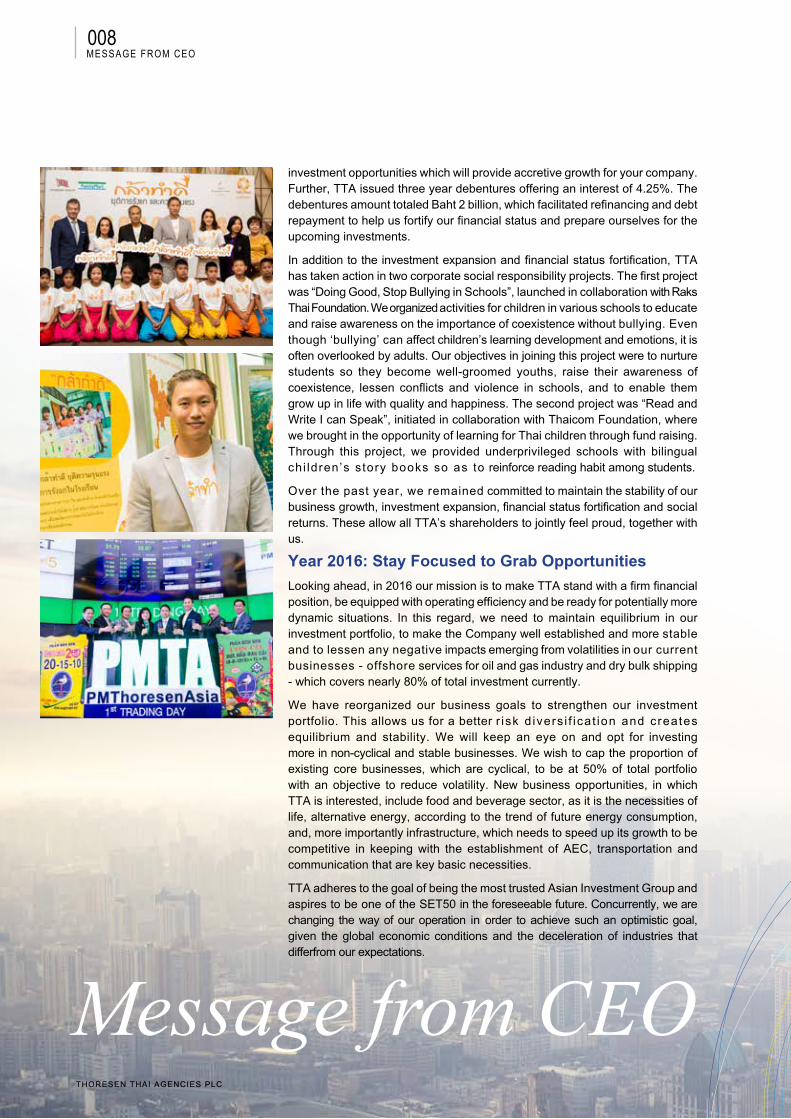
During the first quarter of 2015, PM Thoresen Asia Holdings Public Company Limited or PMTA became a listed company in the Stock Exchange of Thailand (the “SET”), with the IPO launch of 35.42 million shares, with an offer price of Baht 18 per share, allowing the fund raise of over Baht 600 million in total. PMTA becomes only the second holding company listed in the SET which mainly invests overseas. PMTA owns 100% shares in Baconco, Vietnam’s leading chemical fertilizer producer and distributor that also exports to many countries around the globe. Apart from TTA’s strong performance, this strategy positioned TTA as a regionally and globally well-accepted enterprise.
In addition to the success of our investments, we also stepped forward to fortify our financial performance, by issu ing a cap i ta l increase o f 739,383,450 shares, with an offer price of Baht 14 per share to expand our business and be ready for new
messaGe from ceo
008
THORESEN THAI AGENCIES PLC.
investment opportunities which will provide accretive growth for your company. Further, TTA issued three year debentures offering an interest of 4.25%. The debentures amount totaled Baht 2 billion, which facilitated refinancing and debt repayment to help us fortify our financial status and prepare ourselves for the upcoming investments.
In addition to the investment expansion and financial status fortification, TTA has taken action in two corporate social responsibility projects. The first project was “Doing Good, Stop Bullying in Schools”, launched in collaboration with Raks Thai Foundation. We organized activities for children in various schools to educate and raise awareness on the importance of coexistence without bullying. Even though ‘bullying’ can affect children’s learning development and emotions, it is often overlooked by adults. Our objectives in joining this project were to nurture students so they become well-groomed youths, raise their awareness of coexistence, lessen conflicts and violence in schools, and to enable them grow up in life with quality and happiness. The second project was “Read and Write I can Speak”, initiated in collaboration with Thaicom Foundation, where we brought in the opportunity of learning for Thai children through fund raising. Through this project, we provided underprivileged schools with bilingual chi ldren’s story books so as to reinforce reading habit among students.
Over the past year, we remained committed to maintain the stability of our business growth, investment expansion, financial status fortification and social returns. These allow all TTA’s shareholders to jointly feel proud, together with us.
Year 2016: Stay Focused to Grab Opportunities
Looking ahead, in 2016 our mission is to make TTA stand with a firm financial position, be equipped with operating efficiency and be ready for potentially more dynamic situations. In this regard, we need to maintain equilibrium in our investment portfolio, to make the Company well established and more stable and to lessen any negative impacts emerging from volatilities in our current businesses - offshore services for oil and gas industry and dry bulk shipping - which covers nearly 80% of total investment currently.
We have reorganized our business goals to strengthen our investment portfolio. This allows us for a better r isk d ivers i f icat ion and creates equilibrium and stability. We will keep an eye on and opt for investing more in non-cyclical and stable businesses. We wish to cap the proportion of existing core businesses, which are cyclical, to be at 50% of total portfolio with an objective to reduce volatility. New business opportunities, in which TTA is interested, include food and beverage sector, as it is the necessities of life, alternative energy, according to the trend of future energy consumption, and, more importantly infrastructure, which needs to speed up its growth to be competitive in keeping with the establishment of AEC, transportation and communication that are key basic necessities.
TTA adheres to the goal of being the most trusted Asian Investment Group and aspires to be one of the SET50 in the foreseeable future. Concurrently, we are changing the way of our operation in order to achieve such an optimistic goal, given the global economic conditions and the deceleration of industries that differfrom our expectations.
messaGe from ceo
Message from CEOTHORESEN THAI AGENCIES PLC
009
ANNUAL REPORT 2015
messaGe from ceo
Message from CEO
My top priority in 2016 is to support our business so it survives through the recession and economic crisis. In the past year, we reorganized our business structure and controlled costs and expenditures to maintain strong financial position, operated with flexibility, and adjusted our business strategies during the overall economic volatility. Considering TTA’s core strengths, our expertise and dedicated teamwork, I truly believe that TTA can achieve sustained growth as soon as the overall situation gets back to normal.
Words of Gratitude
Enduring the crisis in 2015 and taking on all challenges in 2016 require the invaluable support of all stakeholders. On behalf of the executive team, I would like to express my gratitude to you, our
shareholders, for your continued support and confidence in the Company. Particularly, we would like to thank for your support on the capital increase and the launch of PMTA’s IPO which gained overwhelming welcome and interest from TTA’s shareholders.
In return for the faith and trust all the shareholders have reposed in us, I, our executives and staff will remain focused on our goals and dedicate our efforts in achieving our business objectives.
Sincerely yours,
Chalermchai MahagitsiriPresident & CEO
ANNUAL REPORT 2015
010
THORESEN THAI AGENCIES PLC.
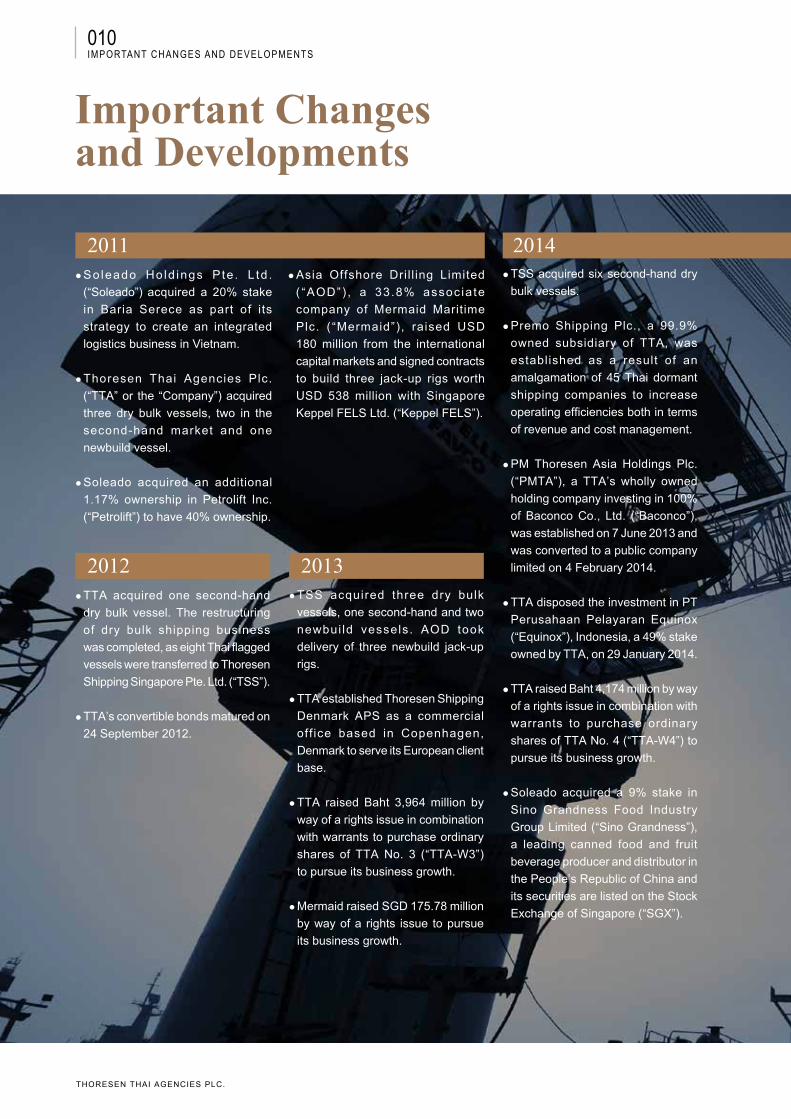
TSS acquired six second-hand dry
bulk vessels.
Premo Shipping Plc., a 99.9%
owned subsidiary of TTA, was
established as a result of an
amalgamation of 45 Thai dormant
shipping companies to increase
operating efficiencies both in terms
of revenue and cost management.
PM Thoresen Asia Holdings Plc.
(“PMTA”), a TTA’s wholly owned
holding company investing in 100%
of Baconco Co., Ltd. (“Baconco”),
was established on 7 June 2013 and
was converted to a public company
limited on 4 February 2014.
TTA disposed the investment in PT
Perusahaan Pelayaran Equinox
(“Equinox”), Indonesia, a 49% stake
owned by TTA, on 29 January 2014.
TTA raised Baht 4,174 million by way
of a rights issue in combination with
warrants to purchase ordinary
shares of TTA No. 4 (“TTA-W4”) to
pursue its business growth.
Soleado acquired a 9% stake in
Sino Grandness Food Industry
Group Limited (“Sino Grandness”),
a leading canned food and fruit
beverage producer and distributor in
the People’s Republic of China and
its securities are listed on the Stock
Exchange of Singapore (“SGX”).
2011 2014
2012 2013
Soleado Ho ld ings P te . L td .
(“Soleado”) acquired a 20% stake
in Baria Serece as part of its
strategy to create an integrated
logistics business in Vietnam.
Thoresen Thai Agencies Plc.
(“TTA” or the “Company”) acquired
three dry bulk vessels, two in the
second-hand market and one
newbuild vessel.
Soleado acquired an additional
1.17% ownership in Petrolift Inc.
(“Petrolift”) to have 40% ownership.
Asia Offshore Dril l ing Limited
( “AOD”) , a 33.8% assoc ia te
company of Mermaid Maritime
Plc. (“Mermaid”), raised USD
180 million from the international
capital markets and signed contracts
to build three jack-up rigs worth
USD 538 million with Singapore
Keppel FELS Ltd. (“Keppel FELS”).
TTA acquired one second-hand
dry bulk vessel. The restructuring
of dry bulk shipping business
was completed, as eight Thai flagged
vessels were transferred to Thoresen
Shipping Singapore Pte. Ltd. (“TSS”).
TTA’s convertible bonds matured on
24 September 2012.
TSS acquired three dry bulk
vessels, one second-hand and two
newbui ld vessels. AOD took
delivery of three newbuild jack-up
rigs.
TTA established Thoresen Shipping
Denmark APS as a commercial
off ice based in Copenhagen,
Denmark to serve its European client
base.
TTA raised Baht 3,964 million by
way of a rights issue in combination
with warrants to purchase ordinary
shares of TTA No. 3 (“TTA-W3”)
to pursue its business growth.
Mermaid raised SGD 175.78 million
by way of a rights issue to pursue
its business growth.
important Changes and developments
important cHanGes and developments
011
ANNUAL REPORT 2015
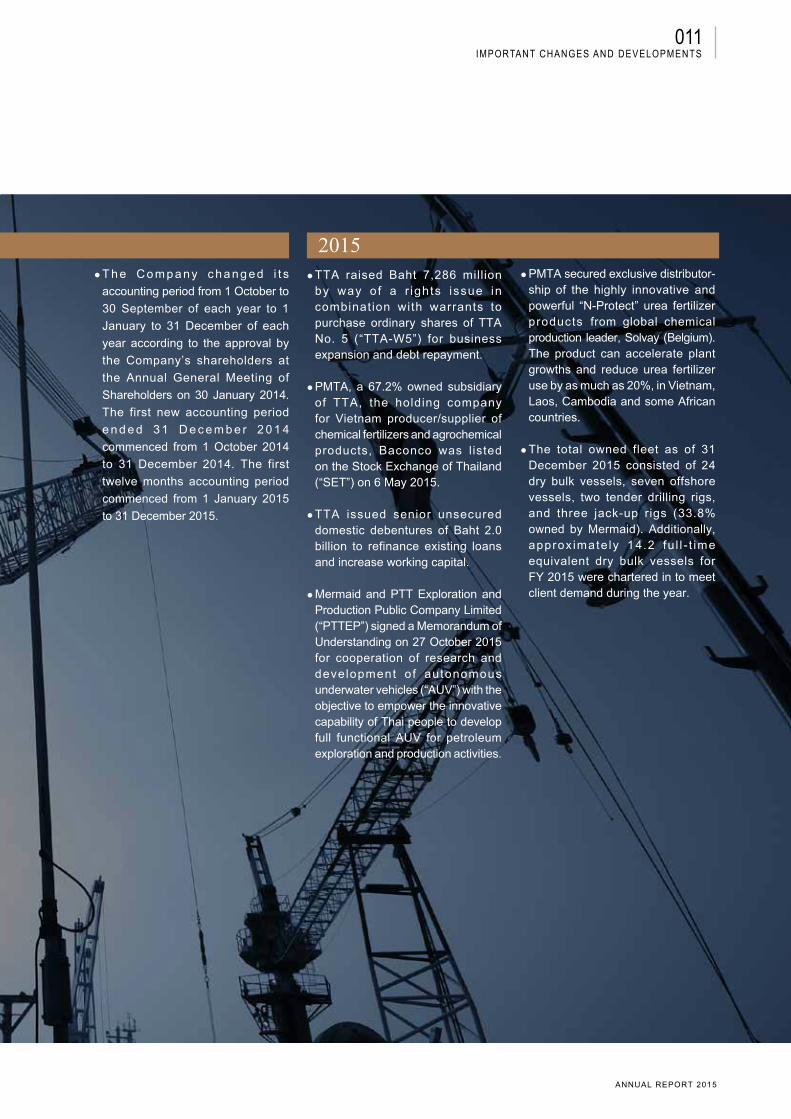
2015TTA raised Baht 7,286 million
by way of a r ights issue in combination with warrants to purchase ordinary shares of TTA No. 5 (“TTA-W5”) for business expansion and debt repayment.
PMTA, a 67.2% owned subsidiary of TTA, the holding company for Vietnam producer/supplier of chemical fertilizers and agrochemical products, Baconco was l isted on the Stock Exchange of Thailand (“SET”) on 6 May 2015.
TTA issued senior unsecured domestic debentures of Baht 2.0 billion to refinance existing loans and increase working capital.
Mermaid and PTT Exploration and Production Public Company Limited (“PTTEP”) signed a Memorandum of Understanding on 27 October 2015 for cooperation of research and development of autonomous underwater vehicles (“AUV”) with the objective to empower the innovative capability of Thai people to develop full functional AUV for petroleum exploration and production activities.
PMTA secured exclusive distributor-ship of the highly innovative and powerful “N-Protect” urea fertilizer products from global chemical production leader, Solvay (Belgium). The product can accelerate plant growths and reduce urea fertilizer use by as much as 20%, in Vietnam, Laos, Cambodia and some African countries.
The total owned fleet as of 31 December 2015 consisted of 24 dry bulk vessels, seven offshore vessels, two tender drilling rigs, and three jack-up rigs (33.8% owned by Mermaid). Additionally, approx imate ly 14.2 fu l l - t ime equivalent dry bulk vessels for FY 2015 were chartered in to meet client demand during the year.
The Company changed i t s
accounting period from 1 October to
30 September of each year to 1
January to 31 December of each
year according to the approval by
the Company’s shareholders at
the Annual General Meeting of
Shareholders on 30 January 2014.
The first new accounting period
e n d e d 3 1 D e c e m b e r 2 0 1 4
commenced from 1 October 2014
to 31 December 2014. The first
twelve months accounting period
commenced from 1 January 2015
to 31 December 2015.
important cHanGes and developments
012
THORESEN THAI AGENCIES PLC.
Board of directors and executive officers
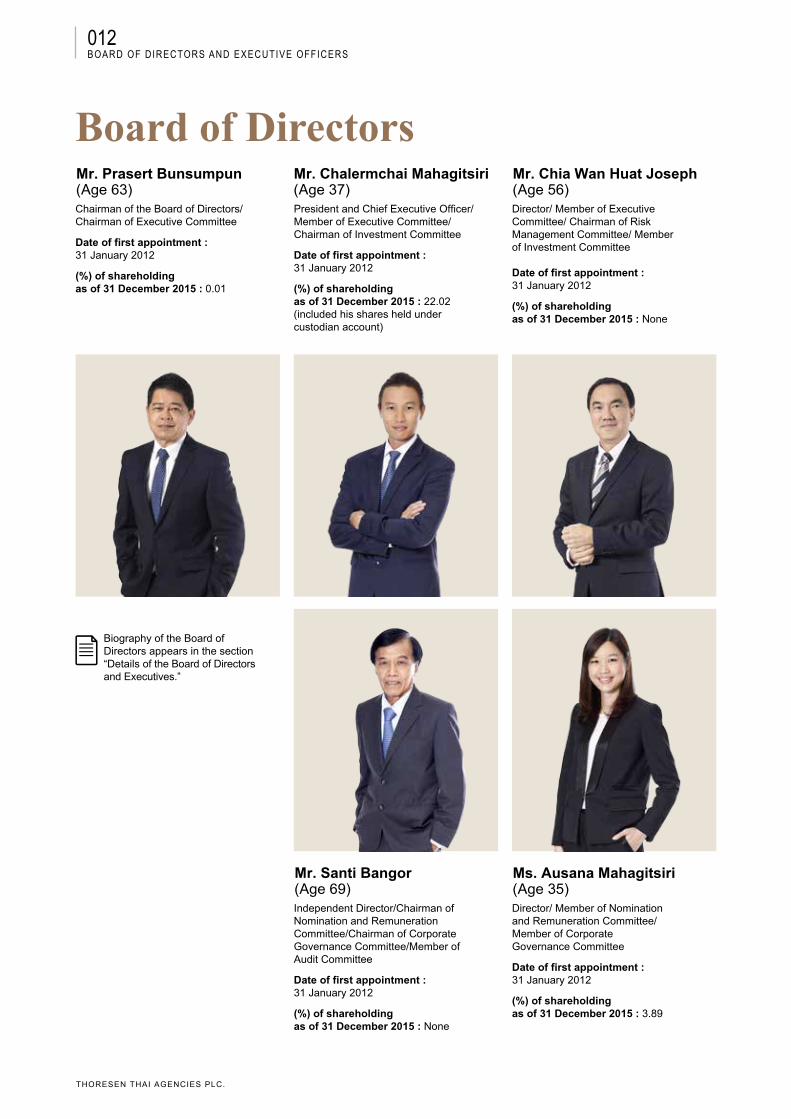
board of directorsMr. Prasert Bunsumpun(Age 63)Chairman of the Board of Directors/Chairman of Executive Committee
Date of first appointment :31 January 2012 (%) of shareholding as of 31 December 2015 : 0.01
Mr. Chalermchai Mahagitsiri(Age 37)President and Chief Executive Officer/Member of Executive Committee/ Chairman of Investment Committee
Date of first appointment :31 January 2012
(%) of shareholding as of 31 December 2015 : 22.02(included his shares held under custodian account)
Mr. Chia Wan Huat Joseph(Age 56)Director/ Member of ExecutiveCommittee/ Chairman of RiskManagement Committee/ Member of Investment Committee
Date of first appointment :31 January 2012
(%) of shareholding as of 31 December 2015 : None
Biography of the Board of Directors appears in the section “Details of the Board of Directors and Executives.”
Mr. Santi Bangor(Age 69)Independent Director/Chairman ofNomination and RemunerationCommittee/Chairman of CorporateGovernance Committee/Member ofAudit Committee
Date of first appointment :31 January 2012
(%) of shareholding as of 31 December 2015 : None
Ms. Ausana Mahagitsiri(Age 35)Director/ Member of Nominationand Remuneration Committee/Member of CorporateGovernance Committee
Date of first appointment :31 January 2012
(%) of shareholding as of 31 December 2015 : 3.89
013
ANNUAL REPORT 2015
Board of directors and executive officers
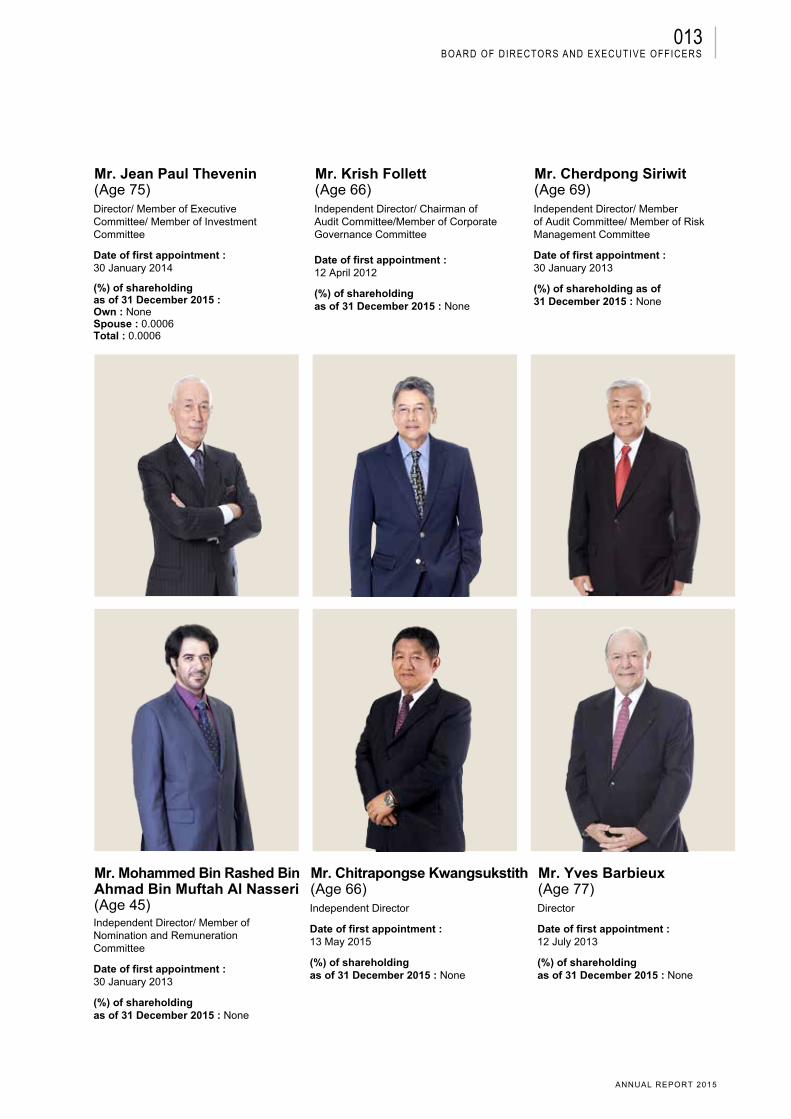
Mr. Yves Barbieux(Age 77)Director
Date of first appointment :12 July 2013
(%) of shareholding as of 31 December 2015 : None
Mr. Krish Follett(Age 66)Independent Director/ Chairman ofAudit Committee/Member of CorporateGovernance Committee
Date of first appointment :12 April 2012
(%) of shareholdingas of 31 December 2015 : None
Mr. Cherdpong Siriwit(Age 69)Independent Director/ Memberof Audit Committee/ Member of RiskManagement Committee
Date of first appointment :30 January 2013
(%) of shareholding as of31 December 2015 : None
Mr. Mohammed Bin Rashed BinAhmad Bin Muftah Al Nasseri(Age 45)Independent Director/ Member ofNomination and RemunerationCommittee
Date of first appointment :30 January 2013
(%) of shareholding as of 31 December 2015 : None
Mr. Chitrapongse Kwangsukstith(Age 66)Independent Director
Date of first appointment :13 May 2015
(%) of shareholding as of 31 December 2015 : None
Mr. Jean Paul Thevenin(Age 75)Director/ Member of ExecutiveCommittee/ Member of InvestmentCommittee
Date of first appointment :30 January 2014
(%) of shareholding as of 31 December 2015 :Own : NoneSpouse : 0.0006Total : 0.0006
014
THORESEN THAI AGENCIES PLC.
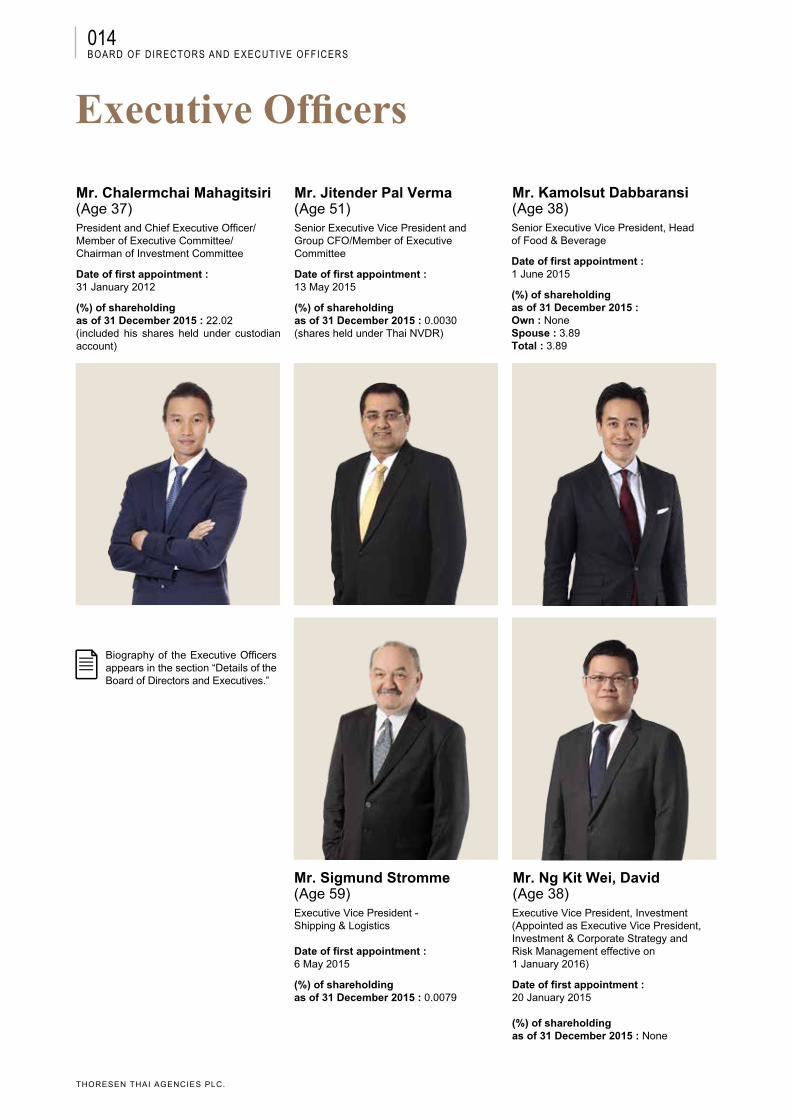
Executive Officers
Biography of the Executive Officers appears in the section “Details of the Board of Directors and Executives.”
Mr. Kamolsut Dabbaransi(Age 38)Senior Executive Vice President, Headof Food & Beverage
Date of first appointment :1 June 2015
(%) of shareholdingas of 31 December 2015 : Own : NoneSpouse : 3.89Total : 3.89
Mr. Ng Kit Wei, David(Age 38)Executive Vice President, Investment(Appointed as Executive Vice President, Investment & Corporate Strategy andRisk Management effective on1 January 2016)
Date of first appointment :20 January 2015
(%) of shareholding as of 31 December 2015 : None
Mr. Chalermchai Mahagitsiri(Age 37)President and Chief Executive Officer/Member of Executive Committee/ Chairman of Investment Committee
Date of first appointment :31 January 2012
(%) of shareholding as of 31 December 2015 : 22.02(included his shares held under custodian account)
Mr. Jitender Pal Verma(Age 51)Senior Executive Vice President andGroup CFO/Member of ExecutiveCommittee
Date of first appointment :13 May 2015
(%) of shareholding as of 31 December 2015 : 0.0030(shares held under Thai NVDR)
Mr. Sigmund Stromme(Age 59)Executive Vice President - Shipping & Logistics
Date of first appointment :6 May 2015
(%) of shareholding as of 31 December 2015 : 0.0079
Board of directors and executive officers
015
ANNUAL REPORT 2015
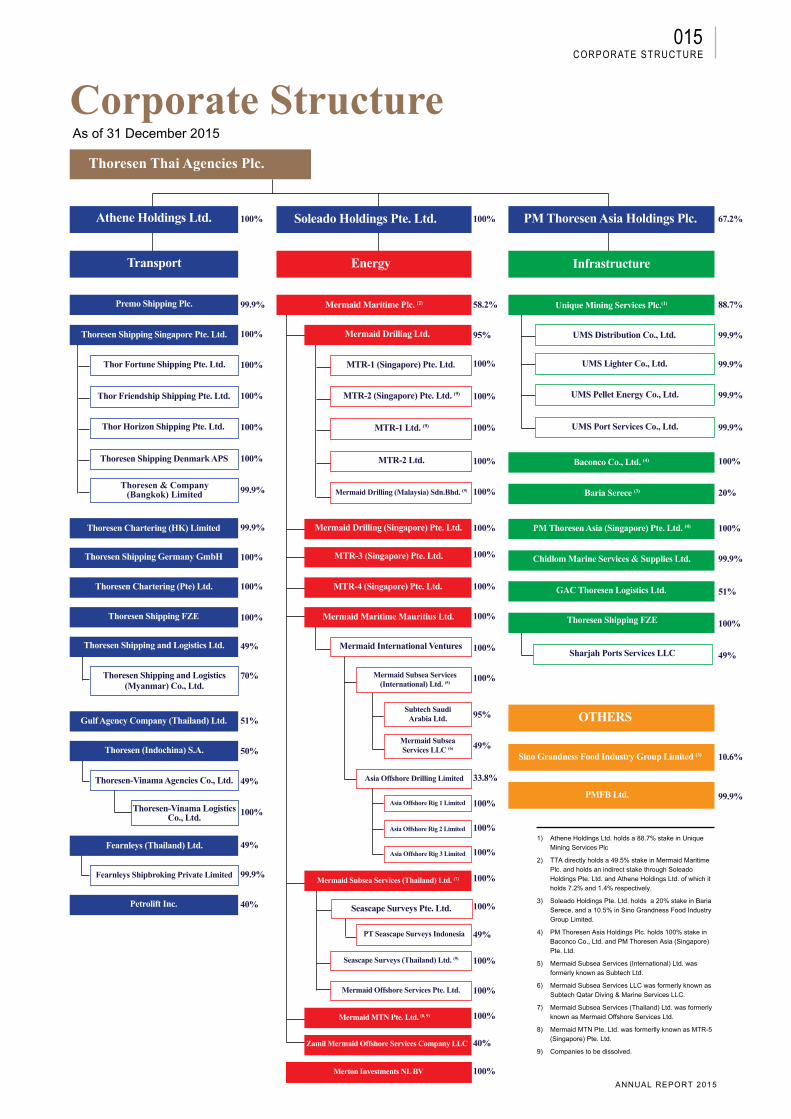
Corporate structureThoresen Thai Agencies plc.
Athene holdings Ltd.
Transport
premo shipping plc. mermaid maritime plc. (2) unique mining services plc.(1)
baconco Co., Ltd. (4)
pm Thoresen Asia (singapore) pte. Ltd. (4)
gAC Thoresen Logistics Ltd.
sino grandness Food industry group Limited (3)
pmFb Ltd.
baria serece (3)
Chidlom marine services & supplies Ltd.
Thoresen shipping FZe
mermaid drilling Ltd.
mermaid drilling (singapore) pte. Ltd.
mTr-3 (singapore) pte. Ltd.
mTr-4 (singapore) pte. Ltd.
mermaid maritime mauritius Ltd.
mermaid subsea services (Thailand) Ltd. (7)
mermaid mTn pte. Ltd. (8, 9)
Zamil mermaid offshore services Company LLC
merton investments nL bV
mTr-1 (singapore) pte. Ltd.
mTr-2 (singapore) pte. Ltd. (9)
mTr-1 Ltd. (9)
mTr-2 Ltd.
seascape surveys pte. Ltd.
mermaid offshore services pte. Ltd.
mermaid subsea services (international) Ltd. (5)
Asia offshore drilling Limited
pT seascape surveys indonesia
subtech saudi Arabia Ltd.
Asia offshore rig 1 Limited
Asia offshore rig 2 Limited
Asia offshore rig 3 Limited
mermaid drilling (malaysia) sdn.bhd. (9)
100% 100% 67.2%
58.2% 88.7%
99.9%
99.9%
99.9%
99.9%
100%
20%
100%
99.9%
51%
100%
49%
10.6%
99.9%
95%
100%
100%
100%
100%
100%
100%
100%
100%
100%
100%
100%
95%
49%
33.8%
100%
100%
100%
100%
100%
49%
100%
100%
100%
100%
40%
99.9%
100%
100%
100%
100%
100%
99.9%
99.9%
100%
100%
100%
49%
70%
51%
50%
49%
100%
49%
99.9%
40%
Thoresen shipping singapore pte. Ltd.
Thoresen Chartering (hK) Limited
Thoresen Chartering (pte) Ltd.
Thoresen shipping germany gmbh
Thoresen shipping FZe
Thoresen shipping and Logistics Ltd.
gulf Agency Company (Thailand) Ltd.
Thoresen (indochina) s.A.
petrolift inc.
Thor Fortune shipping pte. Ltd.
Thor horizon shipping pte. Ltd.
Thor Friendship shipping pte. Ltd.
Thoresen shipping denmark Aps
Thoresen shipping and Logistics (myanmar) Co., Ltd.
Thoresen-Vinama Agencies Co., Ltd.
Fearnleys shipbroking private Limited
Thoresen-Vinama Logistics Co., Ltd.
Thoresen & Company (bangkok) Limited
soleado holdings pte. Ltd.
energy
pm Thoresen Asia holdings plc.
infrastructure
oThers
ums distribution Co., Ltd.
ums Lighter Co., Ltd.
ums pellet energy Co., Ltd.
ums port services Co., Ltd.
sharjah ports services LLC
1) Athene Holdings Ltd. holds a 88.7% stake in Unique Mining Services Plc
2) TTA directly holds a 49.5% stake in Mermaid Maritime Plc. and holds an indirect stake through Soleado Holdings Pte. Ltd. and Athene Holdings Ltd. of which it holds 7.2% and 1.4% respectively.
3) Soleado Holdings Pte. Ltd. holds a 20% stake in Baria Serece, and a 10.5% in Sino Grandness Food Industry Group Limited.
4) PM Thoresen Asia Holdings Plc. holds 100% stake in Baconco Co., Ltd. and PM Thoresen Asia (Singapore) Pte. Ltd.
5) Mermaid Subsea Services (International) Ltd. was formerly known as Subtech Ltd.
6) Mermaid Subsea Services LLC was formerly known as Subtech Qatar Diving & Marine Services LLC.
7) Mermaid Subsea Services (Thailand) Ltd. was formerly known as Mermaid Offshore Services Ltd.
8) Mermaid MTN Pte. Ltd. was formerlly known as MTR-5 (Singapore) Pte. Ltd.
9) Companies to be dissolved.
As of 31 December 2015
corporate structure
mermaid subsea services LLC (6)
seascape surveys (Thailand) Ltd. (9)
Fearnleys (Thailand) Ltd.
mermaid international Ventures

016
THORESEN THAI AGENCIES PLC.
Established in 1904, Thoresen Thai Agencies Publ ic Company Limited (“TTA” or the “Company”) has grown
from its humble beginnings as a shipping service company to now a strategic investment holding company l isted on the Stock Exchange of Thailand (the “SET”). A member of SET100 indices, TTA operates businesses across three primary groups - Transport, Energy, and Infrastructure with global presence throughout Asia, the Middle East, Europe and Africa.
TTA started dry bulk shipping services in 1985. Its marine interest subsequently expanded when TTA acquired an offshore oil and gas service company to penetrate the offshore oil and gas services industry.
Founded by Danish mariners in Thailand as Mermaid Marine Services Ltd., the offshore oil and gas specialist was subsequently renamed and listed in 2007 on the Singapore Stock Exchange as Mermaid Maritime Public Company Limited (“Mermaid”). TTA diversified beyond the marine sector in 2009 when it first acquired a large stake in Unique Mining Services Public Company Limited (“UMS”). This was subsequently supplemented with acquisition of Vietnamese fertilizer company, Baconco Co., Ltd., which TTA has since unlocked value through a successful listing of PM Thoresen Asia Holdings Company Limited (“PMTA”) in 2015, and other infrastructure companies for the group to form a new business under Infrastructure. Apart from providing
Corporate sectionThoresen Thai Agencies Plc. (“TTA”)
Company Overview
Business review & outlook
017
ANNUAL REPORT 2015
shareholders new source of growth, the investments were also to allow TTA to reduce exposure to the highly cyclical marine business and diversify its earnings. These kick-off TTA long-term move to become a more diversified investment holding group.
TTA went through a major change in 2011 with the emergence of a new major shareholder under the Mahagitsiri family. The new leadership under Mr . Cha le rmcha i Mahag i t s i r i reassessed TTA position and made conscientious changes to lay new foundations and build new platform for growth. Initial priority was to solidify its financial position and enhance existing core business performance. TTA successfully raised Baht 8.1 billion capitals via two rounds of rights offering to achieve its objective, while Mermaid underwent a SGD 176 million rights issuance and private placement to bolster its balance sheet.
TTA articulated its new vision and mission in 2014 where the Company aspires “To be the most Trusted Asian Investment Group”. While TTA remains committed to its existing business, TTA wants to expand further by looking for new sustainable and resilient growth business to create value for shareholders. The new strategic initiative began late 2014 with TTA entry into the food and beverage sector via acquisition of a stake in Sino Grandness, a leading Chinese producer of canned fruits and vegetables and loquat juice company listed on the Singapore Stock Exchange (the “SGX”). To beef up its war chest, TTA had another round of capital raising in 2015 through a Baht 7,286 million rights offering.
VISION & BUSINESS STRATEGYOur vision is “To be the most Trusted Asian Investment Group by 2020”, a leader in the business by responsibly operating and excelling in sustainable businesses and delivering long-term value and growth. With the objective to ult imately deliver enhanced experience for our stakeholders, we are committed to ensuring sustainability, superior financial and
business franchise/reputation for our business and make each business profitable.
We are focused on our multi-business model and core competencies. While we will seek for opportunities in close adjacencies, we will continue to sharpen execution of our businesses through constant improvements to optimize productivity and efficiencies. The tough market conditions facing the businesses we operate present huge challenge and we will intensify efforts to recalibrate the core business particularly for shipping and offshore services for oil and gas through operational restructuring and cost structure improvement. We will look to further strengthen the competitive position of our existing portfolio companies to sustain and enhance performance.
2016-2020 will be a period of strategic transformation as TTA looks to consolidate and diversify from existing core business. With a war chest, TTA is seeking new business growth engine targeting more defensive, resilient and high barrier to entry business focused on Thailand and Indochina region. With the aim to generate more stable earnings and cashflows, TTA has earmarked attractive sectors such as infrastructure, renewable energy, logistics and consumer products, among others. TTA will be rigorous and be financially disciplined with huge emphasis on growth, returns and value creation in merger and acquisition or business expansion. TTA will also pursue partnerships for new business to develop organically.
As an investment holding company, TTA success ultimately depends on its ability to prudently and effectively manage its investments and businesses through different industry cycles, and sustain value by managing for the long-term. TTA will be forward looking and have talented people and strong capabilities, right solutions and innovation and robust governance and discipline across all our business.
TTA will be a more diversified conglomerate with bottom line and shareholder value focus.
BUSINESS PORTFOLIOWith the ultimate goal to create and sustain value for shareholders, TTA is focused on managing and enhancing the value of its overall business portfolio. Been a holding company, the Group has a diversified business portfolio across three primary business groups under Transport, Energy and Infrastructure. The initial investment into a leading Chinese beverage player, Sino Grandness late 2014 accelerated the Group’s expansion into the food and beverage business last year, and the Group set up a new Food and Beverage strategic business unit under PM Food & Beverage Ltd. Still in its early day, TTA has ambitions to expand the business. Key business portfolio as at end December 2015 comprise the following three primary business groups and the companies within the group.
TRANSPORTThoresen Shipping Singapore Pte.
Ltd. (100%) Dry bulk shipping services
ENERGYMermaid Maritime Public Company
Limited (58.2%) Subsea engineering and oil and gas
offshore services
INFRASTRUCTUREPM Thoresen Asia Holdings Public
Company Limited (67.2%) Holding company
Baconco Co., Ltd. (effective interest 100 %) Leading Vietnamese ferti l izer
producer & factory area leasing service provider
Unique Mining Services Public Company Limited (88.7%)
Thailand coal logistic services
Contributing approximately 98.75% of revenues in 2015, TTA has four major operating subsidiaries comprising Thoresen Shipping Singapore Pte. Ltd. (“Thoresen Shipping”), Mermaid Maritime Public Company Limited (“Mermaid”), PM Thoresen Asia Holdings Public Company Limited (“PMTA”) and Unique Mining Services Public Company Limited (“UMS”).
Business review & outlook
018
THORESEN THAI AGENCIES PLC.
Business review & outlook
m
THB
ebiTdA573.2m
1.2DWT
Total Capacity
019
ANNUAL REPORT 2015
Business review & outlook
Thoresen Shipping
dry buLK shipping
Cargo12.6TONS
m
020
THORESEN THAI AGENCIES PLC.
The TTA dry bulk shipping business trades under the brand name Thoresen Shipping and is an internationally acclaimed participant in the global freight markets with roots going back over 110 years.
Thoresen Shipping provides deep sea transportation services to customers from all corners of the world, hauling a wide range of dry bulk and break bulk commodities such as mineral ore, coal, agriculture products, construction materials and steel products.
Our f leet services our cl ients’ requirements in the spot market, under time charters and through contracts of affreightment (“COA”). In addition to our own vessels, we engage in freight trading activities using our owned tonnage as well as a fleet of chartered-in vessels from the market.
The combined fleet is commercially managed by Thoresen’s experienced and professional teams based in Singapore and Thailand.
Thoresen vessels, and those we charter in, are fitted with cranes which enable self-loading and self-discharging of cargoes in port with l imited or no shore based infrastructure. By being able to call in these hard-to-reach ports, often in emerging markets - we can charge a premium for shipping services that is not available to larger, more conventional bulk carriers.
There is plenty of competition as the global fleet has grown at a fast pace over the last 5 years. Our competitive advantage now comes more from the efficiency of our operation and the skill of our people than from the vessels themselves.
In order to improve our competitive advantage we made some changes to the way we work, during 2015.
dry bulk shippingThoresen Shipping
Business review & outlook
Major developments:
Changes to management and business structure
Boosting operational efficiencies
Focus on risk and cost control
The dry bulk shipping market endured a very challenging year in 2015 as the Balt ic Dry Index for Supramax averaged just USD 6,966 per day, the lowest annual average since the index was created in 2005. The main factors driving the market lower are; substantially lower growth in the demand for bulk commodities in China; and a rapidly expanding global fleet of dry bulk vessels, as new building orders placed in the last few years are delivered to ship owners.
Our estimate of the supply / demand balance in the Handymax/Supramax segment of the dry bulk market is that oversupply reached 9.5 million deadweight tons and approximately 350 ships - and is on track to reach 24 million deadweight tons, or about 450 ships by the end of 2016.
This continues to present a unique challenge to the whole dry bulk shipping industry, and Thoresen Shipping are taking steps to ensure we are ready for a prolonged downturn in freight rates.
Specifically we have been focusing our efforts on effective management of revenues, costs and risk.
1) Changes to management and business structure to suit our strategy
In 2015, changes were made to the overall TTA shipping and maritime portfolio by consolidating control of the Thoresen Shipping and other maritime investments of the Group, such as ports, agencies and brokerages.
The newly formed Shipping and Transport Division was brought under the management control of Mr. Sigmund Stromme-who is also responsible for the Group’s investments in Vietnam.
Over the next few years th is consolidation will present common sense opportunities and investment cases for revenue cooperation within the Division. More immediately, the consolidation allows better sharing of common resources, leading to cost savings that help us stay competitive in a very tough market.
2) Boosting operational efficiencies
Recognizing that cost savings and stronger revenues can also be had by improving communication, creating stronger working relationships across departments and fostering closer cooperation between cost centers and our accounting functions, we relocated the commercial operations department back to Bangkok from Singapore during 2015.
Early gains have already been seen in major cost items such as bunker procurement and port call coordination and we are expecting these synergies to continue to add value to our results for 2016.
3) Focus on risk and cost control
In 2015 we decided to tailor the structure of our business to our plans for dealing with the very challenging market conditions for dry bulk shipping. We closed our offices in Copenhagen, South Africa and Dubai, bringing our operating costs down by approximately USD 1.5 million, and we called an end to our efforts in building a commercial pool operation, hence making further savings. We now conduct all our business from our offices in Bangkok and in Singapore.
With poor market conditions, comes an elevated risk of customer defaults. Our focus on risk management of freight rates, bunker prices and counterparty credit r isks were boosted in 2015 by improving our credit routines, tightening our risk tolerances and boosting both security and collateral from customers. Our freight rate hedge program was
Business Review

021
ANNUAL REPORT 2015
expanded and our portfolio risk management systems improved to give a better overview of our complete risk exposures. All these initiatives helped improve the bottom line for the shipping business in 2015.
Despite the deteriorating freight rates, Thoresen Shipping ran a cash positive balance throughout 2015 from timely positioning of vessels into higher paying loading areas, reduced costs and a renewed focus on risk management.
A: Product and Services
Fleet Structure and Commercial Services
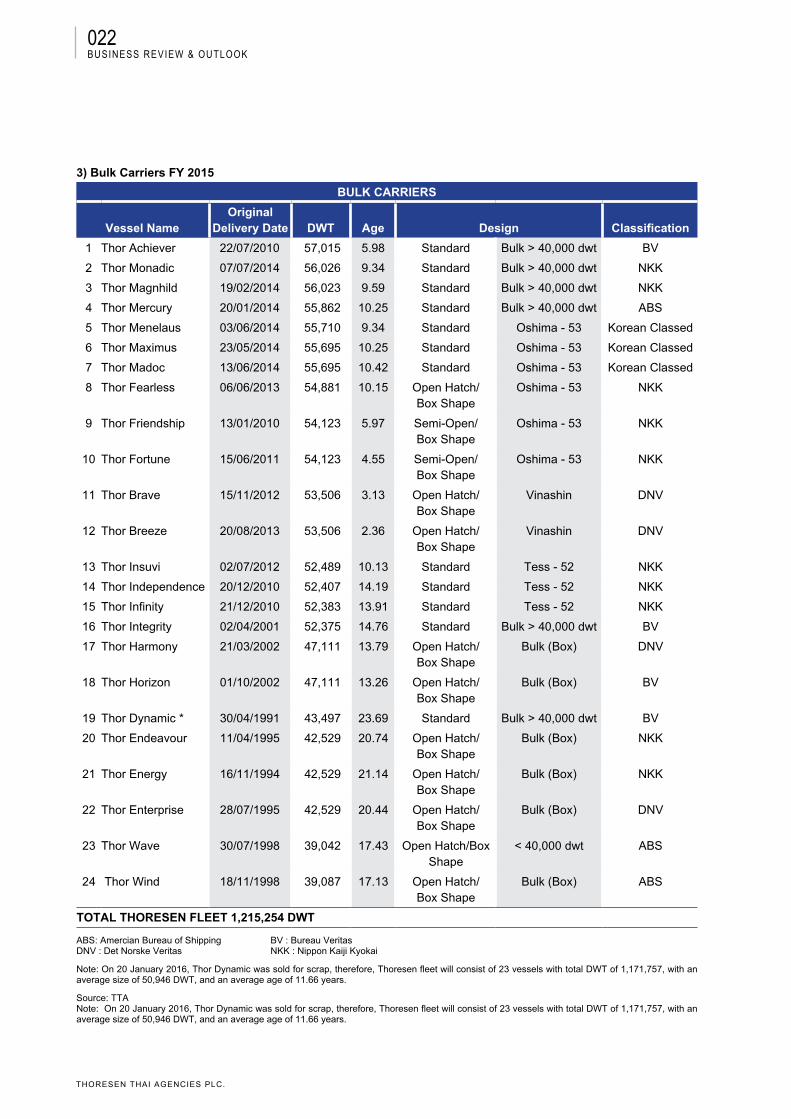
At the end of 2015 Thoresen Shipping owns 24 vessels: 8 Handymax and 16 Supramax vessels with a total carrying capacity of 1.2 million deadweight tons. Our oldest vessel Thor Dynamic reached 25 years at the end of 2015, and has been committed to scrap in the early part of 2016. The average age of the remaining vessels in the fleet will be 11.66 years and average DWT is 50,946 tons.
Dry Bulk Fleet Structure
1) Fleet Structure
Number of Vessels
Type of Vessels Owned VesselsPeriod
Chartered-in VesselsNewbuild
Vessels on Order Total
Handymax 8 2 - 10
Supramax 16 12 - 28
TOTAL 24 14 - 38
2) DWT-Weighted Average Age
Dwt-Weighted Average Age of Vessels
Type of Vessels Owned VesselsPeriod
Chartered-in VesselsNewbuild
Vessels on Order Total
Handymax 18.58 15.11 - 16.18
Supramax 9.02 5.96 - 6.33
TOTAL 12.21 7.19 - 7.95
Business review & outlook
022
THORESEN THAI AGENCIES PLC.
3) Bulk Carriers FY 2015
BULK CARRIERS
Vessel NameOriginal
Delivery Date DWT Age Design Classification
1 Thor Achiever 22/07/2010 57,015 5.98 Standard Bulk > 40,000 dwt BV
2 Thor Monadic 07/07/2014 56,026 9.34 Standard Bulk > 40,000 dwt NKK
3 Thor Magnhild 19/02/2014 56,023 9.59 Standard Bulk > 40,000 dwt NKK
4 Thor Mercury 20/01/2014 55,862 10.25 Standard Bulk > 40,000 dwt ABS
5 Thor Menelaus 03/06/2014 55,710 9.34 Standard Oshima - 53 Korean Classed
6 Thor Maximus 23/05/2014 55,695 10.25 Standard Oshima - 53 Korean Classed
7 Thor Madoc 13/06/2014 55,695 10.42 Standard Oshima - 53 Korean Classed
8 Thor Fearless 06/06/2013 54,881 10.15 Open Hatch/Box Shape
Oshima - 53 NKK
9 Thor Friendship 13/01/2010 54,123 5.97 Semi-Open/Box Shape
Oshima - 53 NKK
10 Thor Fortune 15/06/2011 54,123 4.55 Semi-Open/Box Shape
Oshima - 53 NKK
11 Thor Brave 15/11/2012 53,506 3.13 Open Hatch/Box Shape
Vinashin DNV
12 Thor Breeze 20/08/2013 53,506 2.36 Open Hatch/Box Shape
Vinashin DNV
13 Thor Insuvi 02/07/2012 52,489 10.13 Standard Tess - 52 NKK
14 Thor Independence 20/12/2010 52,407 14.19 Standard Tess - 52 NKK
15 Thor Infinity 21/12/2010 52,383 13.91 Standard Tess - 52 NKK
16 Thor Integrity 02/04/2001 52,375 14.76 Standard Bulk > 40,000 dwt BV
17 Thor Harmony 21/03/2002 47,111 13.79 Open Hatch/Box Shape
Bulk (Box) DNV
18 Thor Horizon 01/10/2002 47,111 13.26 Open Hatch/Box Shape
Bulk (Box) BV
19 Thor Dynamic * 30/04/1991 43,497 23.69 Standard Bulk > 40,000 dwt BV
20 Thor Endeavour 11/04/1995 42,529 20.74 Open Hatch/Box Shape
Bulk (Box) NKK
21 Thor Energy 16/11/1994 42,529 21.14 Open Hatch/Box Shape
Bulk (Box) NKK
22 Thor Enterprise 28/07/1995 42,529 20.44 Open Hatch/Box Shape
Bulk (Box) DNV
23 Thor Wave 30/07/1998 39,042 17.43 Open Hatch/Box Shape
< 40,000 dwt ABS
24 Thor Wind 18/11/1998 39,087 17.13 Open Hatch/ Box Shape
Bulk (Box) ABS
TOTAL THORESEN FLEET 1,215,254 DWT
ABS: Amercian Bureau of Shipping BV : Bureau Veritas DNV : Det Norske Veritas NKK : Nippon Kaiji Kyokai
Note: On 20 January 2016, Thor Dynamic was sold for scrap, therefore, Thoresen fleet will consist of 23 vessels with total DWT of 1,171,757, with an average size of 50,946 DWT, and an average age of 11.66 years.
Source: TTANote: On 20 January 2016, Thor Dynamic was sold for scrap, therefore, Thoresen fleet will consist of 23 vessels with total DWT of 1,171,757, with an average size of 50,946 DWT, and an average age of 11.66 years.
Business review & outlook

023
ANNUAL REPORT 2015
Source: TTA
Commercial Services
A key feature of our commercial service offering is to keep a balanced portfolio of vessels out on time charter to credible companies and to evenly spread the remaining open positions across the three main ocean regions; Atlantic, Indian Ocean and Pacific. As a rule about 1/3 of forward open positions are to be found in each region, and the portfolio is skewed westwards at certain times of the year in preparation for the two main Atlantic grain export seasons.
Combined with our diversified portfolio of forward cargoes, this enables us to react quickly to changes in market sentiment by sailing into higher paying loading areas at minimal cost.
B: Marketing and Competition
I. Cargo Operations and Customer Focus, Competitive Advantage
Cargo Operations and Customer Focus
Throughout 2015, much effort was made to further develop strong relations with our main customers which are industrial majors, international trading houses and specialist regional exporters.
However, our focus on common sense portfolio risk management means that we spread our counterparty exposure across a wide variety of different customers.
During 2015, Thoresen contracted with 152 different counterparties, where just 37% of our revenues came from our 10 largest customers. A further 36% of our revenues
50
45
40
35
30
25
20
15
10
5
0
200,000
0
400,000
600,000
800,000
1,000,000
1,200,000
1,400,000
1,600,000
DWTNumber of Vessels
2008 2009 2010 2011 2012 2013 2014 2015
No. of Vessels 44 36 27 15 16 18 24 24
DWT 1,243,273 1,050,839 905,809 702,853 755,342 880,243 1,215,254 1,215,254
10%
36%
17%
37%
10 Largest Customers
< USD 1,000,000
USD 0.5-1,000,000
< USD 500,000
came from another 37 customers with the remaining 27% spread across 105 different companies from around the world.
Strong diversification of counterparty risk is a key element in keeping claims and customer defaults to a minimum, and is an essential part of our commercial strategy in a challenging market.
Chart: FY 2015 Freight Revenue (by Client Size)
Source: TTA
Thoresen carried 12.6 million tons of cargo during 2015 divided roughly 50/50 between major bulks such as coal, iron ore and agricultural products, and minor bulks such as steels, fertilizer, cement and sand.
Chart: FY 2015 Cargoes
Chart: Thoresen Fleet 2008-2015
Business review & outlook
Coal
Fertilizer
Mineral/Concentrate
Cement
Steel products
Sand
Agricultural products
Wood products
Iron
Other general cargoes
Chemical
Source: TTA
27.21%
21.39%
14.69%
13.83%
8.80%
6.25%
1.73%1.53%
4.23%
0.25
0.09
024
THORESEN THAI AGENCIES PLC.
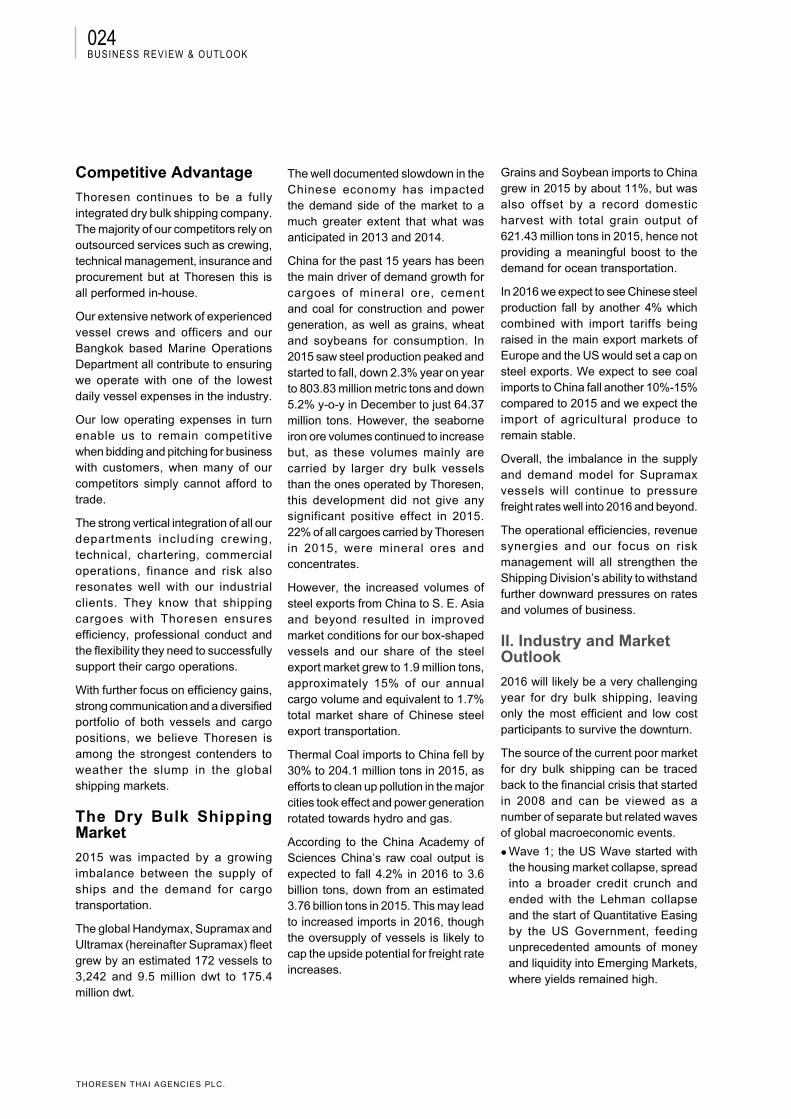
Competitive Advantage
Thoresen continues to be a fully integrated dry bulk shipping company. The majority of our competitors rely on outsourced services such as crewing, technical management, insurance and procurement but at Thoresen this is all performed in-house.
Our extensive network of experienced vessel crews and officers and our Bangkok based Marine Operations Department all contribute to ensuring we operate with one of the lowest daily vessel expenses in the industry.
Our low operating expenses in turn enable us to remain competitive when bidding and pitching for business with customers, when many of our competitors simply cannot afford to trade.
The strong vertical integration of all our departments including crewing, technical, chartering, commercial operations, finance and risk also resonates well with our industrial clients. They know that shipping cargoes with Thoresen ensures efficiency, professional conduct and the flexibility they need to successfully support their cargo operations.
With further focus on efficiency gains, strong communication and a diversified portfolio of both vessels and cargo positions, we believe Thoresen is among the strongest contenders to weather the slump in the global shipping markets.
The Dry Bulk Shipping Market
2015 was impacted by a growing imbalance between the supply of ships and the demand for cargo transportation.
The global Handymax, Supramax and Ultramax (hereinafter Supramax) fleet grew by an estimated 172 vessels to 3,242 and 9.5 million dwt to 175.4 million dwt.
The well documented slowdown in the Chinese economy has impacted the demand side of the market to a much greater extent that what was anticipated in 2013 and 2014.
China for the past 15 years has been the main driver of demand growth for cargoes of mineral ore, cement and coal for construction and power generation, as well as grains, wheat and soybeans for consumption. In 2015 saw steel production peaked and started to fall, down 2.3% year on year to 803.83 million metric tons and down 5.2% y-o-y in December to just 64.37 million tons. However, the seaborne iron ore volumes continued to increase but, as these volumes mainly are carried by larger dry bulk vessels than the ones operated by Thoresen, this development did not give any significant positive effect in 2015. 22% of all cargoes carried by Thoresen in 2015, were mineral ores and concentrates.
However, the increased volumes of steel exports from China to S. E. Asia and beyond resulted in improved market conditions for our box-shaped vessels and our share of the steel export market grew to 1.9 million tons, approximately 15% of our annual cargo volume and equivalent to 1.7% total market share of Chinese steel export transportation.
Thermal Coal imports to China fell by 30% to 204.1 million tons in 2015, as efforts to clean up pollution in the major cities took effect and power generation rotated towards hydro and gas.
According to the China Academy of Sciences China’s raw coal output is expected to fall 4.2% in 2016 to 3.6 billion tons, down from an estimated 3.76 billion tons in 2015. This may lead to increased imports in 2016, though the oversupply of vessels is likely to cap the upside potential for freight rate increases.
Grains and Soybean imports to China grew in 2015 by about 11%, but was also offset by a record domestic harvest with total grain output of 621.43 million tons in 2015, hence not providing a meaningful boost to the demand for ocean transportation.
In 2016 we expect to see Chinese steel production fall by another 4% which combined with import tariffs being raised in the main export markets of Europe and the US would set a cap on steel exports. We expect to see coal imports to China fall another 10%-15% compared to 2015 and we expect the import of agricultural produce to remain stable.
Overall, the imbalance in the supply and demand model for Supramax vessels will continue to pressure freight rates well into 2016 and beyond.
The operational efficiencies, revenue synergies and our focus on risk management will all strengthen the Shipping Division’s ability to withstand further downward pressures on rates and volumes of business.
II. Industry and Market Outlook
2016 will likely be a very challenging year for dry bulk shipping, leaving only the most efficient and low cost participants to survive the downturn.
The source of the current poor market for dry bulk shipping can be traced back to the financial crisis that started in 2008 and can be viewed as a number of separate but related waves of global macroeconomic events.
Wave 1; the US Wave started with the housing market collapse, spread into a broader credit crunch and ended with the Lehman collapse and the start of Quantitative Easing by the US Government, feeding unprecedented amounts of money and liquidity into Emerging Markets, where yields remained high.
Business review & outlook
025
ANNUAL REPORT 2015
Wave 2; the European Wave began with the exposure of banks to leveraged losses in the US and spread into a sovereign crisis, given the lack of a debt sharing mechanism across the Euro area. It ended with the Outright Monetary Transactions, promises to ‘do whatever it takes’, and finally the introduction of Quantitative Easing, again feeding the investment bubble in Emerging Markets.
Wave 3; the Emerging Markets Wave coincided with the collapse in commodity prices as the over investment in fixed asset investment in China slows.
A key feature of the third wave is the powerful outflow of funds from Emerging Market Economies back into US Dollars and the Euro, causing serious stresses on the currencies of EM countries. This is turn adds to the slowdown in commodity demand, leaving the oversupply of commodities exposed. Producer action follows by cutting exports in a bid to shore up prices and protect national interests. As demand growth slows, the effect of supply side action is reduced and so on, until the markets hit an equilibrium from where it can once again grow.
We believe we are in the midst of the third wave, which has yet to play out across the global commodity and investment markets.
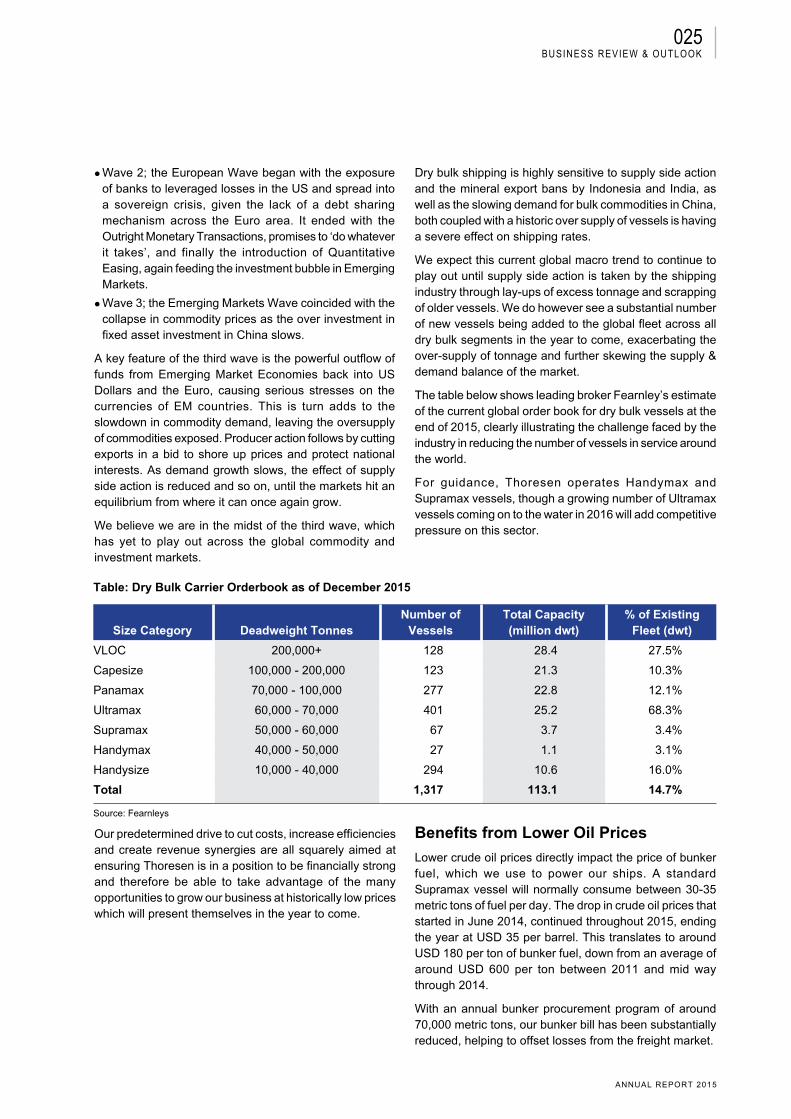
Table: Dry Bulk Carrier Orderbook as of December 2015
Size Category Deadweight TonnesNumber of
VesselsTotal Capacity(million dwt)
% of ExistingFleet (dwt)
VLOC 200,000+ 128 28.4 27.5%
Capesize 100,000 - 200,000 123 21.3 10.3%
Panamax 70,000 - 100,000 277 22.8 12.1%
Ultramax 60,000 - 70,000 401 25.2 68.3%
Supramax 50,000 - 60,000 67 3.7 3.4%
Handymax 40,000 - 50,000 27 1.1 3.1%
Handysize 10,000 - 40,000 294 10.6 16.0%
Total 1,317 113.1 14.7%
Source: Fearnleys
Dry bulk shipping is highly sensitive to supply side action and the mineral export bans by Indonesia and India, as well as the slowing demand for bulk commodities in China, both coupled with a historic over supply of vessels is having a severe effect on shipping rates.
We expect this current global macro trend to continue to play out until supply side action is taken by the shipping industry through lay-ups of excess tonnage and scrapping of older vessels. We do however see a substantial number of new vessels being added to the global fleet across all dry bulk segments in the year to come, exacerbating the over-supply of tonnage and further skewing the supply & demand balance of the market.
The table below shows leading broker Fearnley’s estimate of the current global order book for dry bulk vessels at the end of 2015, clearly illustrating the challenge faced by the industry in reducing the number of vessels in service around the world.
For guidance, Thoresen operates Handymax and Supramax vessels, though a growing number of Ultramax vessels coming on to the water in 2016 will add competitive pressure on this sector.
Our predetermined drive to cut costs, increase efficiencies and create revenue synergies are all squarely aimed at ensuring Thoresen is in a position to be financially strong and therefore be able to take advantage of the many opportunities to grow our business at historically low prices which will present themselves in the year to come.
Benefits from Lower Oil Prices
Lower crude oil prices directly impact the price of bunker fuel, which we use to power our ships. A standard Supramax vessel will normally consume between 30-35 metric tons of fuel per day. The drop in crude oil prices that started in June 2014, continued throughout 2015, ending the year at USD 35 per barrel. This translates to around USD 180 per ton of bunker fuel, down from an average of around USD 600 per ton between 2011 and mid way through 2014.
With an annual bunker procurement program of around 70,000 metric tons, our bunker bill has been substantially reduced, helping to offset losses from the freight market.
Business review & outlook

026
THORESEN THAI AGENCIES PLC.
Business review & outlook
order book
revenue growth8%
349mTHB
027
ANNUAL REPORT 2015
Business review & outlook
968.4m
Mermaid Maritime Public Company Limited
oFFshoreserViCes
ebiTdA
USD
028
THORESEN THAI AGENCIES PLC.
offshore servicesMermaid Maritime Public Company Limited (“Mermaid”)
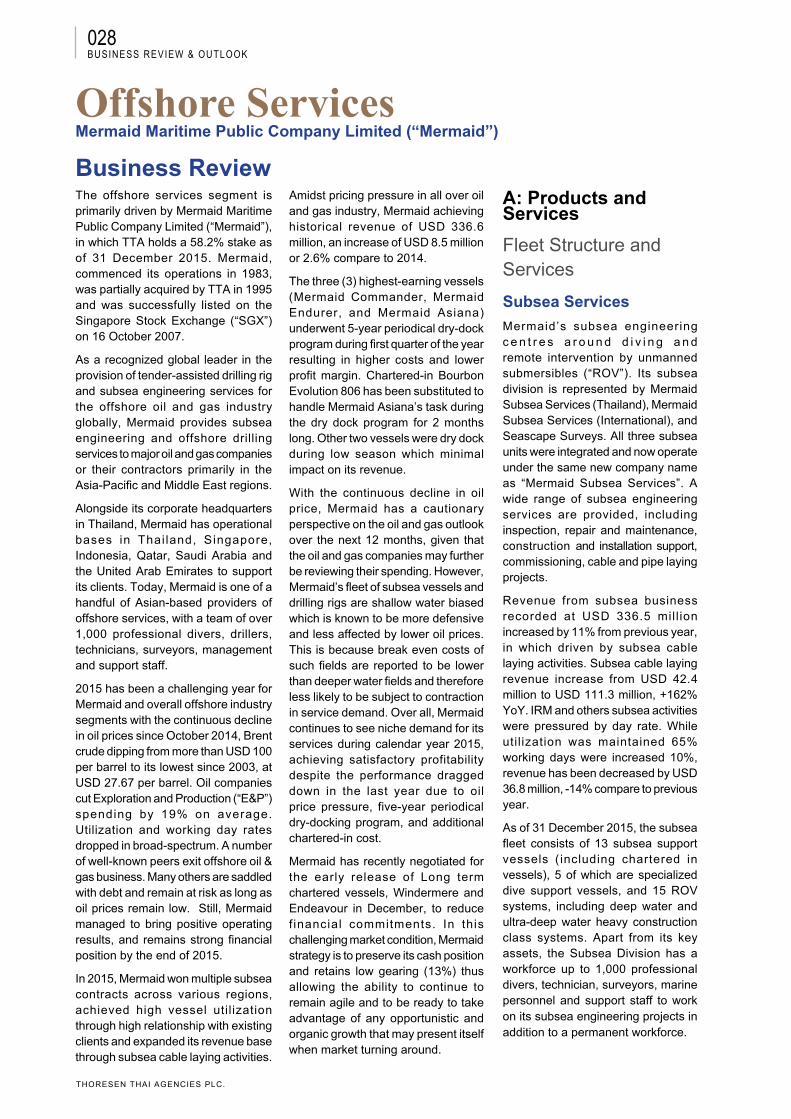
Business ReviewThe offshore services segment is primarily driven by Mermaid Maritime Public Company Limited (“Mermaid”), in which TTA holds a 58.2% stake as of 31 December 2015. Mermaid, commenced its operations in 1983, was partially acquired by TTA in 1995 and was successfully listed on the Singapore Stock Exchange (“SGX”) on 16 October 2007.
As a recognized global leader in the provision of tender-assisted drilling rig and subsea engineering services for the offshore oil and gas industry globally, Mermaid provides subsea engineering and offshore drilling services to major oil and gas companies or their contractors primarily in the Asia-Pacific and Middle East regions.
Alongside its corporate headquarters in Thailand, Mermaid has operational bases in Thai land, Singapore, Indonesia, Qatar, Saudi Arabia and the United Arab Emirates to support its clients. Today, Mermaid is one of a handful of Asian-based providers of offshore services, with a team of over 1,000 professional divers, drillers, technicians, surveyors, management and support staff.
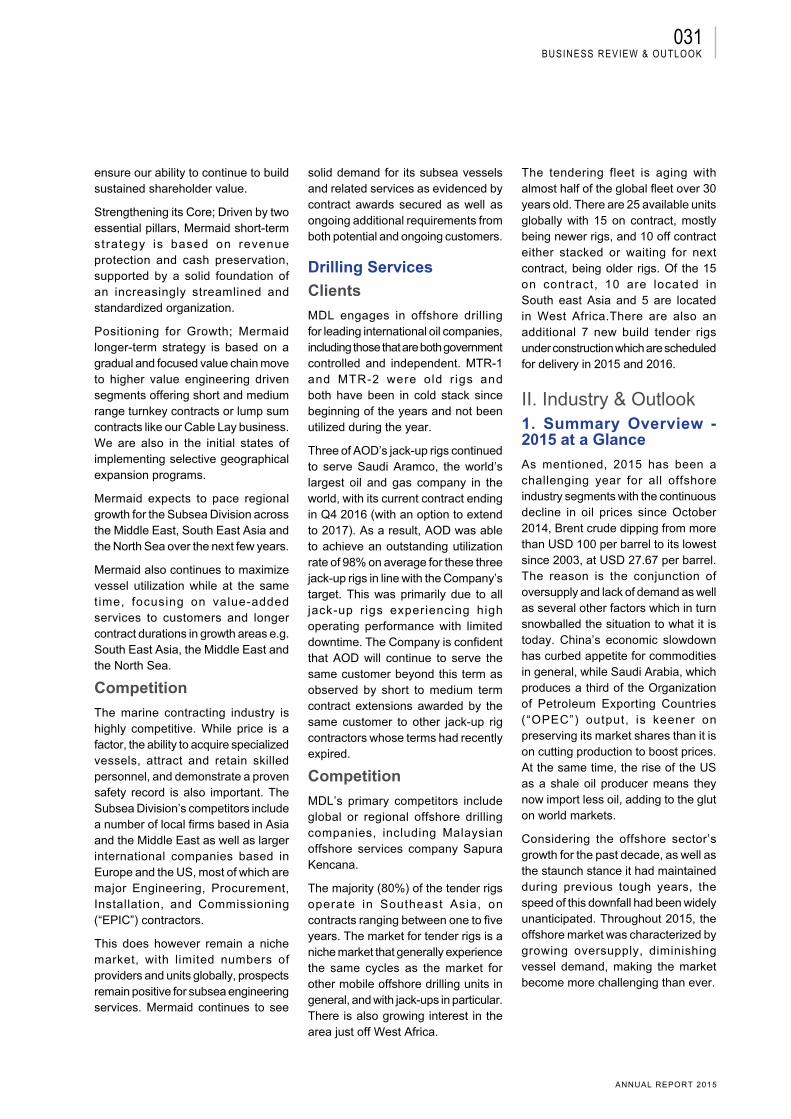
2015 has been a challenging year for Mermaid and overall offshore industry segments with the continuous decline in oil prices since October 2014, Brent crude dipping from more than USD 100 per barrel to its lowest since 2003, at USD 27.67 per barrel. Oil companies cut Exploration and Production (“E&P”) spending by 19% on average. Utilization and working day rates dropped in broad-spectrum. A number of well-known peers exit offshore oil & gas business. Many others are saddled with debt and remain at risk as long as oil prices remain low. Still, Mermaid managed to bring positive operating results, and remains strong financial position by the end of 2015.
In 2015, Mermaid won multiple subsea contracts across various regions, achieved high vessel util ization through high relationship with existing clients and expanded its revenue base through subsea cable laying activities.
Business review & outlook
Amidst pricing pressure in all over oil and gas industry, Mermaid achieving historical revenue of USD 336.6 million, an increase of USD 8.5 million or 2.6% compare to 2014.
The three (3) highest-earning vessels (Mermaid Commander, Mermaid Endurer, and Mermaid Asiana) underwent 5-year periodical dry-dock program during first quarter of the year resulting in higher costs and lower profit margin. Chartered-in Bourbon Evolution 806 has been substituted to handle Mermaid Asiana’s task during the dry dock program for 2 months long. Other two vessels were dry dock during low season which minimal impact on its revenue.
With the continuous decline in oil price, Mermaid has a cautionary perspective on the oil and gas outlook over the next 12 months, given that the oil and gas companies may further be reviewing their spending. However, Mermaid’s fleet of subsea vessels and drilling rigs are shallow water biased which is known to be more defensive and less affected by lower oil prices. This is because break even costs of such fields are reported to be lower than deeper water fields and therefore less likely to be subject to contraction in service demand. Over all, Mermaid continues to see niche demand for its services during calendar year 2015, achieving satisfactory profitability despite the performance dragged down in the last year due to oil price pressure, five-year periodical dry-docking program, and additional chartered-in cost.
Mermaid has recently negotiated for the early release of Long term chartered vessels, Windermere and Endeavour in December, to reduce f inancial commitments. In this challenging market condition, Mermaid strategy is to preserve its cash position and retains low gearing (13%) thus allowing the ability to continue to remain agile and to be ready to take advantage of any opportunistic and organic growth that may present itself when market turning around.
A: Products and Services
Fleet Structure and Services
Subsea Services
Mermaid’s subsea engineering c e n t r e s a r o u n d d i v i n g a n d remote intervention by unmanned submersibles (“ROV”). Its subsea division is represented by Mermaid Subsea Services (Thailand), Mermaid Subsea Services (International), and Seascape Surveys. All three subsea units were integrated and now operate under the same new company name as “Mermaid Subsea Services”. A wide range of subsea engineering services are provided, including inspection, repair and maintenance, construction and installation support, commissioning, cable and pipe laying projects.
Revenue from subsea business recorded at USD 336.5 mil l ion increased by 11% from previous year, in which driven by subsea cable laying activities. Subsea cable laying revenue increase from USD 42.4 million to USD 111.3 million, +162% YoY. IRM and others subsea activities were pressured by day rate. While util ization was maintained 65% working days were increased 10%, revenue has been decreased by USD 36.8 million, -14% compare to previous year.
As of 31 December 2015, the subsea fleet consists of 13 subsea support vessels (including chartered in vessels), 5 of which are specialized dive support vessels, and 15 ROV systems, including deep water and ultra-deep water heavy construction class systems. Apart from its key assets, the Subsea Division has a workforce up to 1,000 professional divers, technician, surveyors, marine personnel and support staff to work on its subsea engineering projects in addition to a permanent workforce.
029
ANNUAL REPORT 2015
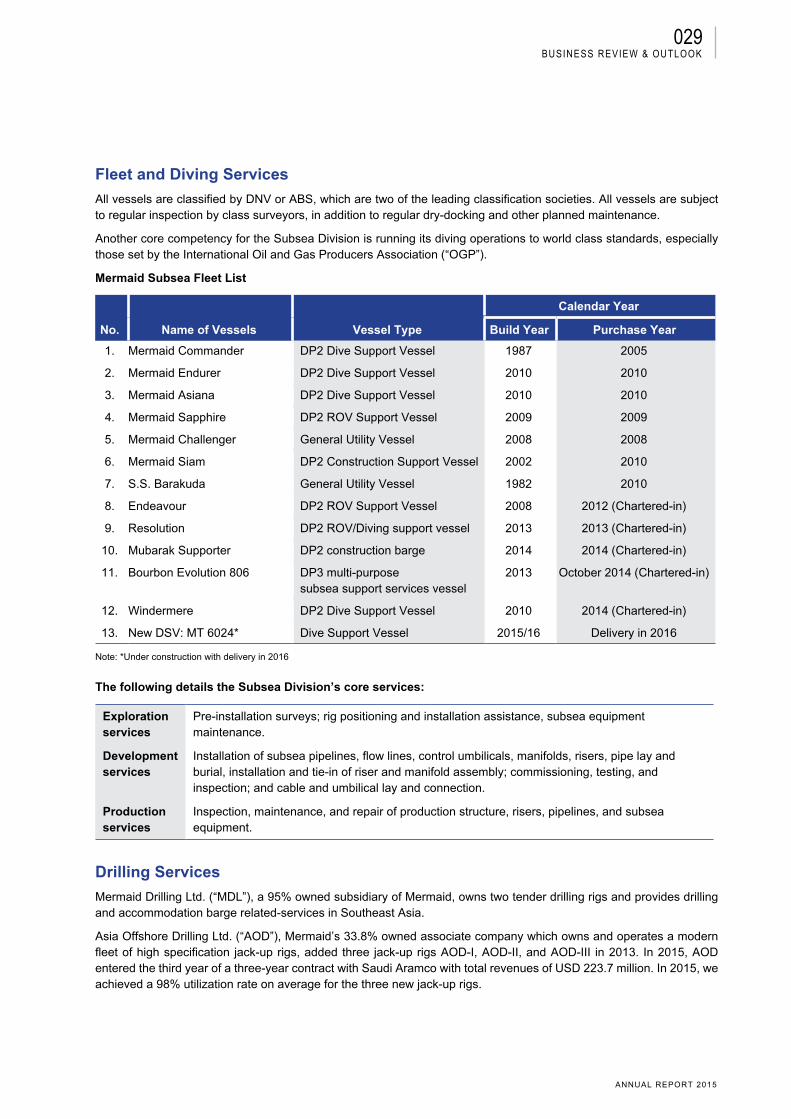
Fleet and Diving Services
All vessels are classified by DNV or ABS, which are two of the leading classification societies. All vessels are subject to regular inspection by class surveyors, in addition to regular dry-docking and other planned maintenance.
Another core competency for the Subsea Division is running its diving operations to world class standards, especially those set by the International Oil and Gas Producers Association (“OGP”).
Mermaid Subsea Fleet List
No. Name of Vessels Vessel Type
Calendar Year
Build Year Purchase Year
1. Mermaid Commander DP2 Dive Support Vessel 1987 2005
2. Mermaid Endurer DP2 Dive Support Vessel 2010 2010
3. Mermaid Asiana DP2 Dive Support Vessel 2010 2010
4. Mermaid Sapphire DP2 ROV Support Vessel 2009 2009
5. Mermaid Challenger General Utility Vessel 2008 2008
6. Mermaid Siam DP2 Construction Support Vessel 2002 2010
7. S.S. Barakuda General Utility Vessel 1982 2010
8. Endeavour DP2 ROV Support Vessel 2008 2012 (Chartered-in)
9. Resolution DP2 ROV/Diving support vessel 2013 2013 (Chartered-in)
10. Mubarak Supporter DP2 construction barge 2014 2014 (Chartered-in)
11. Bourbon Evolution 806 DP3 multi-purpose subsea support services vessel
2013 October 2014 (Chartered-in)
12. Windermere DP2 Dive Support Vessel 2010 2014 (Chartered-in)
13. New DSV: MT 6024* Dive Support Vessel 2015/16 Delivery in 2016
Note: *Under construction with delivery in 2016
The following details the Subsea Division’s core services:
Exploration services
Pre-installation surveys; rig positioning and installation assistance, subsea equipment maintenance.
Development services
Installation of subsea pipelines, flow lines, control umbilicals, manifolds, risers, pipe lay and burial, installation and tie-in of riser and manifold assembly; commissioning, testing, and inspection; and cable and umbilical lay and connection.
Production services
Inspection, maintenance, and repair of production structure, risers, pipelines, and subsea equipment.
Drilling Services
Mermaid Drilling Ltd. (“MDL”), a 95% owned subsidiary of Mermaid, owns two tender drilling rigs and provides drilling and accommodation barge related-services in Southeast Asia.
Asia Offshore Drilling Ltd. (“AOD”), Mermaid’s 33.8% owned associate company which owns and operates a modern fleet of high specification jack-up rigs, added three jack-up rigs AOD-I, AOD-II, and AOD-III in 2013. In 2015, AOD entered the third year of a three-year contract with Saudi Aramco with total revenues of USD 223.7 million. In 2015, we achieved a 98% utilization rate on average for the three new jack-up rigs.
Business review & outlook
030
THORESEN THAI AGENCIES PLC.
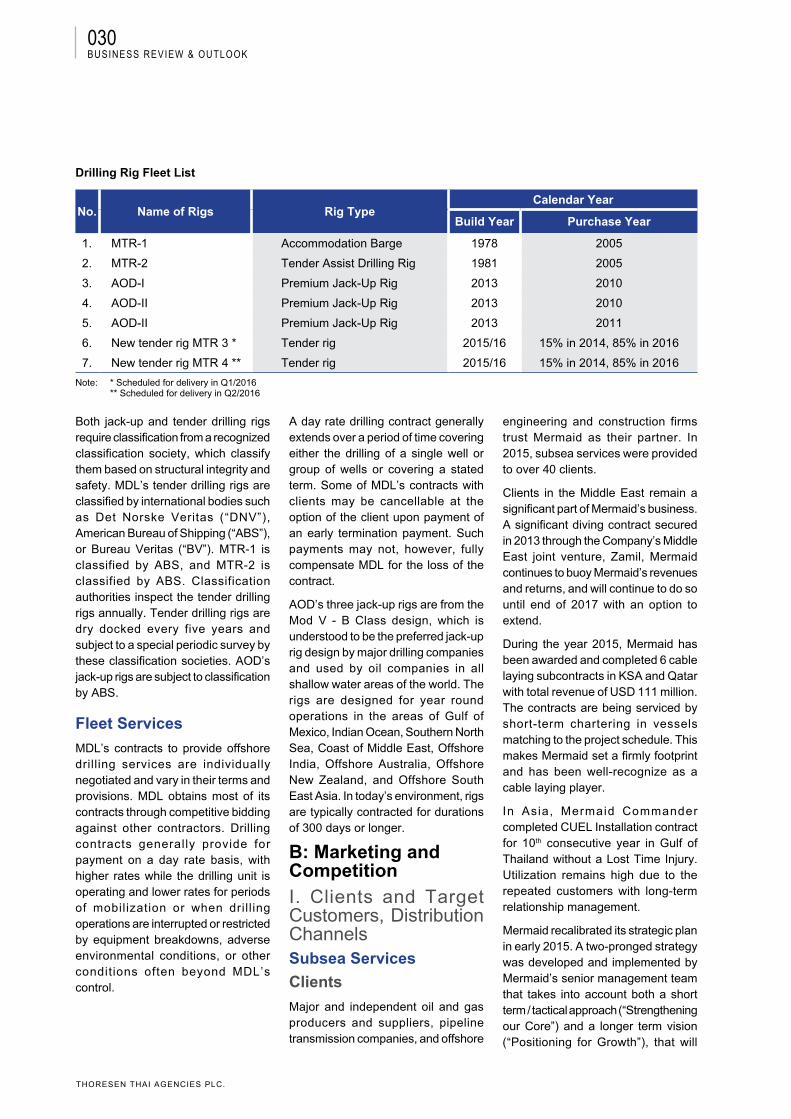
Drilling Rig Fleet List
No. Name of Rigs Rig TypeCalendar Year
Build Year Purchase Year
1. MTR-1 Accommodation Barge 1978 2005
2. MTR-2 Tender Assist Drilling Rig 1981 2005
3. AOD-I Premium Jack-Up Rig 2013 2010
4. AOD-II Premium Jack-Up Rig 2013 2010
5. AOD-II Premium Jack-Up Rig 2013 2011
6. New tender rig MTR 3 * Tender rig 2015/16 15% in 2014, 85% in 2016
7. New tender rig MTR 4 ** Tender rig 2015/16 15% in 2014, 85% in 2016
Note: * Scheduled for delivery in Q1/2016 ** Scheduled for delivery in Q2/2016
Both jack-up and tender drilling rigs require classification from a recognized classification society, which classify them based on structural integrity and safety. MDL’s tender drilling rigs are classified by international bodies such as Det Norske Veritas (“DNV”), American Bureau of Shipping (“ABS”), or Bureau Veritas (“BV”). MTR-1 is classified by ABS, and MTR-2 is classified by ABS. Classification authorities inspect the tender drilling rigs annually. Tender drilling rigs are dry docked every five years and subject to a special periodic survey by these classification societies. AOD’s jack-up rigs are subject to classification by ABS.
Fleet Services
MDL’s contracts to provide offshore drilling services are individually negotiated and vary in their terms and provisions. MDL obtains most of its contracts through competitive bidding against other contractors. Drilling contracts generally provide for payment on a day rate basis, with higher rates while the drilling unit is operating and lower rates for periods of mobilization or when dril l ing operations are interrupted or restricted by equipment breakdowns, adverse environmental conditions, or other conditions often beyond MDL’s control.
A day rate drilling contract generally extends over a period of time covering either the drilling of a single well or group of wells or covering a stated term. Some of MDL’s contracts with clients may be cancellable at the option of the client upon payment of an early termination payment. Such payments may not, however, fully compensate MDL for the loss of the contract.
AOD’s three jack-up rigs are from the Mod V - B Class design, which is understood to be the preferred jack-up rig design by major drilling companies and used by oil companies in all shallow water areas of the world. The rigs are designed for year round operations in the areas of Gulf of Mexico, Indian Ocean, Southern North Sea, Coast of Middle East, Offshore India, Offshore Australia, Offshore New Zealand, and Offshore South East Asia. In today’s environment, rigs are typically contracted for durations of 300 days or longer.
B: Marketing and CompetitionI. Clients and Target Customers, Distribution ChannelsSubsea Services
Clients
Major and independent oil and gas producers and suppliers, pipeline transmission companies, and offshore
engineering and construction firms trust Mermaid as their partner. In 2015, subsea services were provided to over 40 clients.
Clients in the Middle East remain a significant part of Mermaid’s business. A significant diving contract secured in 2013 through the Company’s Middle East joint venture, Zamil, Mermaid continues to buoy Mermaid’s revenues and returns, and will continue to do so until end of 2017 with an option to extend.
During the year 2015, Mermaid has been awarded and completed 6 cable laying subcontracts in KSA and Qatar with total revenue of USD 111 million. The contracts are being serviced by short-term chartering in vessels matching to the project schedule. This makes Mermaid set a firmly footprint and has been well-recognize as a cable laying player.
In Asia, Mermaid Commander completed CUEL Installation contract for 10th consecutive year in Gulf of Thailand without a Lost Time Injury. Utilization remains high due to the repeated customers with long-term relationship management.
Mermaid recalibrated its strategic plan in early 2015. A two-pronged strategy was developed and implemented by Mermaid’s senior management team that takes into account both a short term / tactical approach (“Strengthening our Core”) and a longer term vision (“Positioning for Growth”), that will
Business review & outlook
031
ANNUAL REPORT 2015
ensure our ability to continue to build sustained shareholder value.
Strengthening its Core; Driven by two essential pillars, Mermaid short-term strategy is based on revenue protection and cash preservation, supported by a solid foundation of an increasingly streamlined and standardized organization.
Positioning for Growth; Mermaid longer-term strategy is based on a gradual and focused value chain move to higher value engineering driven segments offering short and medium range turnkey contracts or lump sum contracts like our Cable Lay business. We are also in the initial states of implementing selective geographical expansion programs.
Mermaid expects to pace regional growth for the Subsea Division across the Middle East, South East Asia and the North Sea over the next few years.
Mermaid also continues to maximize vessel utilization while at the same time, focusing on value-added services to customers and longer contract durations in growth areas e.g. South East Asia, the Middle East and the North Sea.
Competition
The marine contracting industry is highly competitive. While price is a factor, the ability to acquire specialized vessels, attract and retain skilled personnel, and demonstrate a proven safety record is also important. The Subsea Division’s competitors include a number of local firms based in Asia and the Middle East as well as larger international companies based in Europe and the US, most of which are major Engineering, Procurement, Installation, and Commissioning (“EPIC”) contractors.
This does however remain a niche market, with limited numbers of providers and units globally, prospects remain positive for subsea engineering services. Mermaid continues to see
solid demand for its subsea vessels and related services as evidenced by contract awards secured as well as ongoing additional requirements from both potential and ongoing customers.
Drilling Services
Clients
MDL engages in offshore drilling for leading international oil companies, including those that are both government controlled and independent. MTR-1 and MTR-2 were old r igs and both have been in cold stack since beginning of the years and not been utilized during the year.
Three of AOD’s jack-up rigs continued to serve Saudi Aramco, the world’s largest oil and gas company in the world, with its current contract ending in Q4 2016 (with an option to extend to 2017). As a result, AOD was able to achieve an outstanding utilization rate of 98% on average for these three jack-up rigs in line with the Company’s target. This was primarily due to all jack-up rigs experiencing high operating performance with limited downtime. The Company is confident that AOD will continue to serve the same customer beyond this term as observed by short to medium term contract extensions awarded by the same customer to other jack-up rig contractors whose terms had recently expired.
Competition
MDL’s primary competitors include global or regional offshore drilling companies, including Malaysian offshore services company Sapura Kencana.
The majority (80%) of the tender rigs operate in Southeast Asia, on contracts ranging between one to five years. The market for tender rigs is a niche market that generally experience the same cycles as the market for other mobile offshore drilling units in general, and with jack-ups in particular. There is also growing interest in the area just off West Africa.
The tendering fleet is aging with almost half of the global fleet over 30 years old. There are 25 available units globally with 15 on contract, mostly being newer rigs, and 10 off contract either stacked or waiting for next contract, being older rigs. Of the 15 on contract, 10 are located in South east Asia and 5 are located in West Africa.There are also an additional 7 new build tender rigs under construction which are scheduled for delivery in 2015 and 2016.
II. Industry & Outlook 1. Summary Overview - 2015 at a Glance
As mentioned, 2015 has been a challenging year for all offshore industry segments with the continuous decline in oil prices since October 2014, Brent crude dipping from more than USD 100 per barrel to its lowest since 2003, at USD 27.67 per barrel. The reason is the conjunction of oversupply and lack of demand as well as several other factors which in turn snowballed the situation to what it is today. China’s economic slowdown has curbed appetite for commodities in general, while Saudi Arabia, which produces a third of the Organization of Petroleum Exporting Countries (“OPEC”) output, is keener on preserving its market shares than it is on cutting production to boost prices. At the same time, the rise of the US as a shale oil producer means they now import less oil, adding to the glut on world markets.
Considering the offshore sector’s growth for the past decade, as well as the staunch stance it had maintained during previous tough years, the speed of this downfall had been widely unanticipated. Throughout 2015, the offshore market was characterized by growing oversupply, diminishing vessel demand, making the market become more challenging than ever.
Business review & outlook
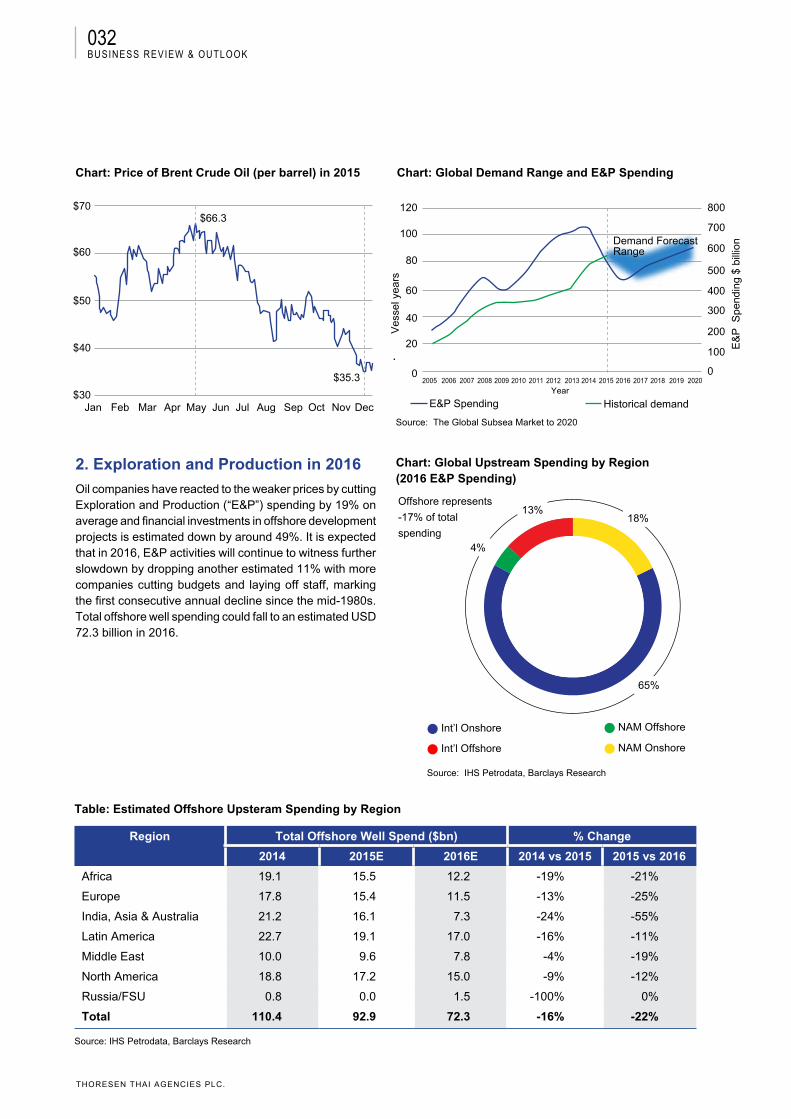
032
THORESEN THAI AGENCIES PLC.
Chart: Price of Brent Crude Oil (per barrel) in 2015 Chart: Global Demand Range and E&P Spending
Table: Estimated Offshore Upsteram Spending by Region
Region Total Offshore Well Spend ($bn) % Change
2014 2015E 2016E 2014 vs 2015 2015 vs 2016
Africa 19.1 15.5 12.2 -19% -21%
Europe 17.8 15.4 11.5 -13% -25%
India, Asia & Australia 21.2 16.1 7.3 -24% -55%
Latin America 22.7 19.1 17.0 -16% -11%
Middle East 10.0 9.6 7.8 -4% -19%
North America 18.8 17.2 15.0 -9% -12%
Russia/FSU 0.8 0.0 1.5 -100% 0%
Total 110.4 92.9 72.3 -16% -22%
Source: IHS Petrodata, Barclays Research
Source: The Global Subsea Market to 2020
$30
$40
$50
$60
$66.3
$35.3
Jan Feb Mar Apr May Jun Jul Aug Sep Oct Nov Dec
$70 800120
100
80
60
40
2005 2006 2007 2008 2009 2010 2011 2012 2013 2014 2015 2016 2017 2018 2019 2020
20
0
700
600
500
400
300
200
100
0
Year
E&P SpendingV
esse
l yea
rs
E&
P S
pend
ing
$ bi
llion
Historical demand
Demand Forecast Range
Business review & outlook
2. Exploration and Production in 2016
Oil companies have reacted to the weaker prices by cutting Exploration and Production (“E&P”) spending by 19% on average and financial investments in offshore development projects is estimated down by around 49%. It is expected that in 2016, E&P activities will continue to witness further slowdown by dropping another estimated 11% with more companies cutting budgets and laying off staff, marking the first consecutive annual decline since the mid-1980s. Total offshore well spending could fall to an estimated USD 72.3 billion in 2016.
Chart: Global Upstream Spending by Region (2016 E&P Spending)
65%
18%13%
4%
Int’l Onshore
Int’l Offshore
NAM Offshore
NAM Onshore
Source: IHS Petrodata, Barclays Research
Offshore represents
-17% of total
spending
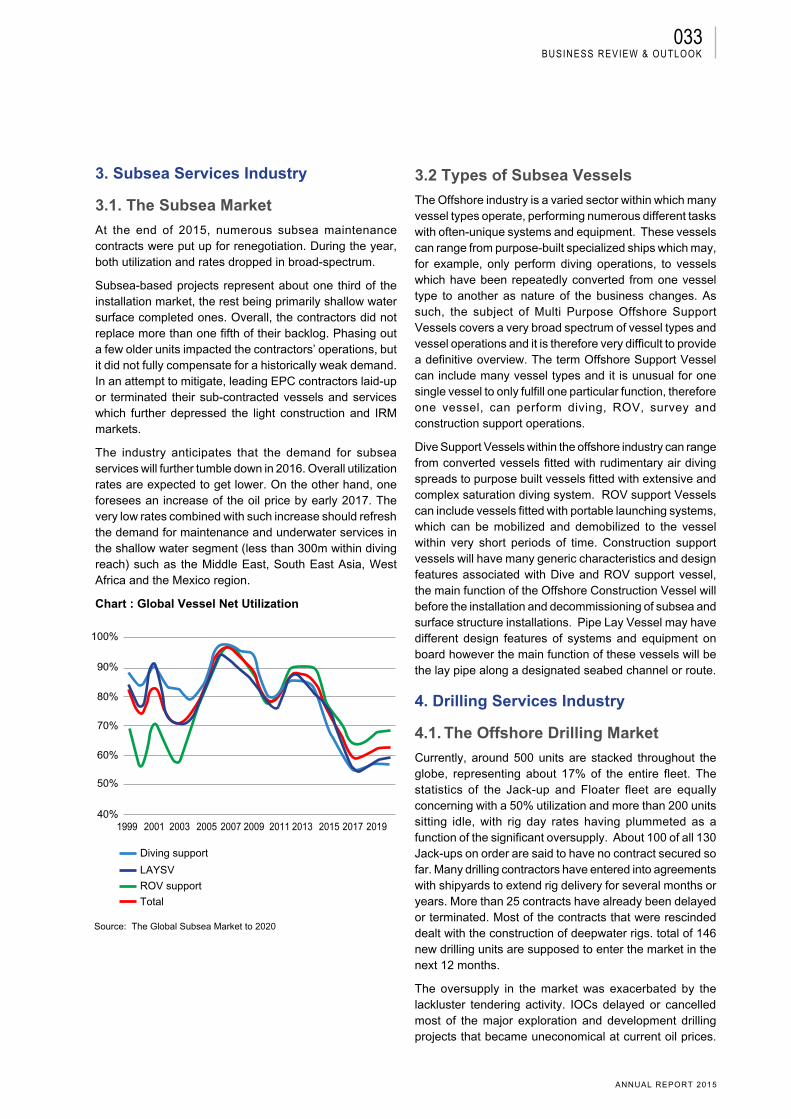
033
ANNUAL REPORT 2015
3. Subsea Services Industry
3.1. The Subsea Market
At the end of 2015, numerous subsea maintenance contracts were put up for renegotiation. During the year, both utilization and rates dropped in broad-spectrum.
Subsea-based projects represent about one third of the installation market, the rest being primarily shallow water surface completed ones. Overall, the contractors did not replace more than one fifth of their backlog. Phasing out a few older units impacted the contractors’ operations, but it did not fully compensate for a historically weak demand. In an attempt to mitigate, leading EPC contractors laid-up or terminated their sub-contracted vessels and services which further depressed the light construction and IRM markets.
The industry anticipates that the demand for subsea services will further tumble down in 2016. Overall utilization rates are expected to get lower. On the other hand, one foresees an increase of the oil price by early 2017. The very low rates combined with such increase should refresh the demand for maintenance and underwater services in the shallow water segment (less than 300m within diving reach) such as the Middle East, South East Asia, West Africa and the Mexico region.
Chart : Global Vessel Net Utilization
3.2 Types of Subsea Vessels
The Offshore industry is a varied sector within which many vessel types operate, performing numerous different tasks with often-unique systems and equipment. These vessels can range from purpose-built specialized ships which may, for example, only perform diving operations, to vessels which have been repeatedly converted from one vessel type to another as nature of the business changes. As such, the subject of Multi Purpose Offshore Support Vessels covers a very broad spectrum of vessel types and vessel operations and it is therefore very difficult to provide a definitive overview. The term Offshore Support Vessel can include many vessel types and it is unusual for one single vessel to only fulfill one particular function, therefore one vessel, can perform diving, ROV, survey and construction support operations.
Dive Support Vessels within the offshore industry can range from converted vessels fitted with rudimentary air diving spreads to purpose built vessels fitted with extensive and complex saturation diving system. ROV support Vessels can include vessels fitted with portable launching systems, which can be mobilized and demobilized to the vessel within very short periods of time. Construction support vessels will have many generic characteristics and design features associated with Dive and ROV support vessel, the main function of the Offshore Construction Vessel will before the installation and decommissioning of subsea and surface structure installations. Pipe Lay Vessel may have different design features of systems and equipment on board however the main function of these vessels will be the lay pipe along a designated seabed channel or route.
4. Drilling Services Industry
4.1. The Offshore Drilling Market
Currently, around 500 units are stacked throughout the globe, representing about 17% of the entire fleet. The statistics of the Jack-up and Floater fleet are equally concerning with a 50% utilization and more than 200 units sitting idle, with rig day rates having plummeted as a function of the significant oversupply. About 100 of all 130 Jack-ups on order are said to have no contract secured so far. Many drilling contractors have entered into agreements with shipyards to extend rig delivery for several months or years. More than 25 contracts have already been delayed or terminated. Most of the contracts that were rescinded dealt with the construction of deepwater rigs. total of 146 new drilling units are supposed to enter the market in the next 12 months.
The oversupply in the market was exacerbated by the lackluster tendering activity. IOCs delayed or cancelled most of the major exploration and development drilling projects that became uneconomical at current oil prices.
40%1999 2001 2003 2005 2007 2009 2011 2013 2015 2017 2019
50%
60%
70%
80%
90%
100%
Diving support
LAYSV
ROV support
Total
Business review & outlook
Source: The Global Subsea Market to 2020
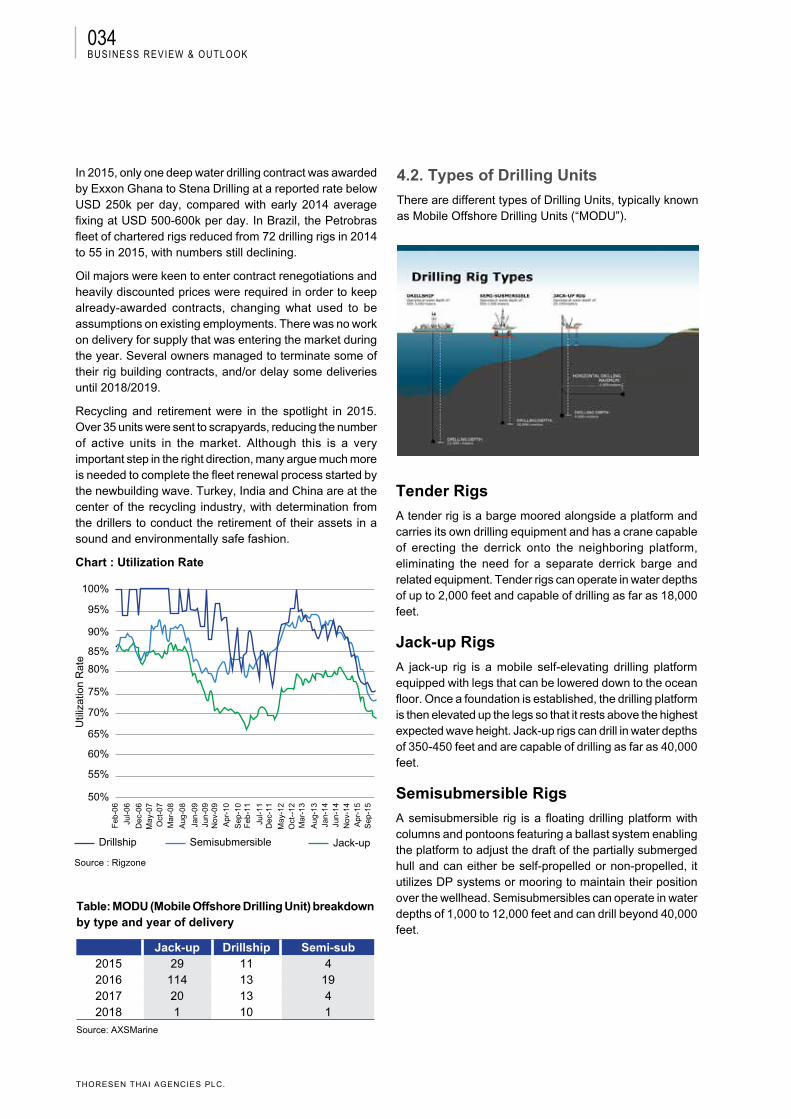
034
THORESEN THAI AGENCIES PLC.
Table: MODU (Mobile Offshore Drilling Unit) breakdown by type and year of delivery
Jack-up Drillship Semi-sub2015 29 11 42016 114 13 192017 20 13 42018 1 10 1
Source: AXSMarine
4.2. Types of Drilling Units
There are different types of Drilling Units, typically known as Mobile Offshore Drilling Units (“MODU”).
Tender Rigs
A tender rig is a barge moored alongside a platform and carries its own drilling equipment and has a crane capable of erecting the derrick onto the neighboring platform, eliminating the need for a separate derrick barge and related equipment. Tender rigs can operate in water depths of up to 2,000 feet and capable of drilling as far as 18,000 feet.
Jack-up Rigs
A jack-up rig is a mobile self-elevating drilling platform equipped with legs that can be lowered down to the ocean floor. Once a foundation is established, the drilling platform is then elevated up the legs so that it rests above the highest expected wave height. Jack-up rigs can drill in water depths of 350-450 feet and are capable of drilling as far as 40,000 feet.
Semisubmersible Rigs
A semisubmersible rig is a floating drilling platform with columns and pontoons featuring a ballast system enabling the platform to adjust the draft of the partially submerged hull and can either be self-propelled or non-propelled, it utilizes DP systems or mooring to maintain their position over the wellhead. Semisubmersibles can operate in water depths of 1,000 to 12,000 feet and can drill beyond 40,000 feet.
Source : Rigzone
In 2015, only one deep water drilling contract was awarded by Exxon Ghana to Stena Drilling at a reported rate below USD 250k per day, compared with early 2014 average fixing at USD 500-600k per day. In Brazil, the Petrobras fleet of chartered rigs reduced from 72 drilling rigs in 2014 to 55 in 2015, with numbers still declining.
Oil majors were keen to enter contract renegotiations and heavily discounted prices were required in order to keep already-awarded contracts, changing what used to be assumptions on existing employments. There was no work on delivery for supply that was entering the market during the year. Several owners managed to terminate some of their rig building contracts, and/or delay some deliveries until 2018/2019.
Recycling and retirement were in the spotlight in 2015. Over 35 units were sent to scrapyards, reducing the number of active units in the market. Although this is a very important step in the right direction, many argue much more is needed to complete the fleet renewal process started by the newbuilding wave. Turkey, India and China are at the center of the recycling industry, with determination from the drillers to conduct the retirement of their assets in a sound and environmentally safe fashion.
Chart : Utilization Rate
Feb
-06
Jul-0
6
Dec
-06
May
-07
Oct
-07
Mar
-08
Aug
-08
Jan-
09Ju
n-09
Nov
-09
Apr
-10
Sep
-10
Feb
-11
Jul-1
1D
ec-1
1
May
-12
Oct
--12
Mar
-13
Aug
-13
Jan-
14Ju
n-14
Nov
-14
Apr
-15
Sep
-15
100%
95%
90%
85%
80%
75%
70%
65%
60%
55%
50%
Util
izat
ion
Rat
e
Drillship Semisubmersible Jack-up
Business review & outlook
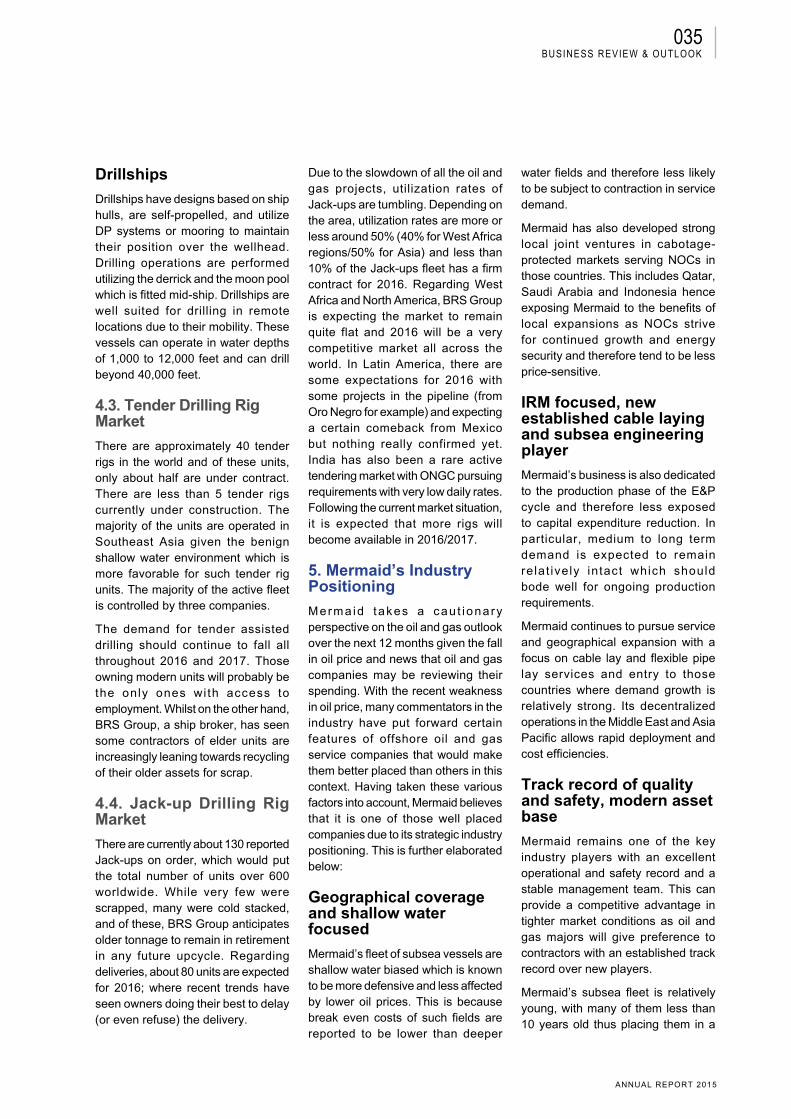
035
ANNUAL REPORT 2015
Drillships
Drillships have designs based on ship hulls, are self-propelled, and utilize DP systems or mooring to maintain their position over the wellhead. Drilling operations are performed utilizing the derrick and the moon pool which is fitted mid-ship. Drillships are well suited for drilling in remote locations due to their mobility. These vessels can operate in water depths of 1,000 to 12,000 feet and can drill beyond 40,000 feet.
4.3. Tender Drilling Rig Market
There are approximately 40 tender rigs in the world and of these units, only about half are under contract. There are less than 5 tender rigs currently under construction. The majority of the units are operated in Southeast Asia given the benign shallow water environment which is more favorable for such tender rig units. The majority of the active fleet is controlled by three companies.
The demand for tender assisted drilling should continue to fall all throughout 2016 and 2017. Those owning modern units will probably be the only ones with access to employment. Whilst on the other hand, BRS Group, a ship broker, has seen some contractors of elder units are increasingly leaning towards recycling of their older assets for scrap.
4.4. Jack-up Drilling Rig Market
There are currently about 130 reported Jack-ups on order, which would put the total number of units over 600 worldwide. While very few were scrapped, many were cold stacked, and of these, BRS Group anticipates older tonnage to remain in retirement in any future upcycle. Regarding deliveries, about 80 units are expected for 2016; where recent trends have seen owners doing their best to delay (or even refuse) the delivery.
Due to the slowdown of all the oil and gas projects, utilization rates of Jack-ups are tumbling. Depending on the area, utilization rates are more or less around 50% (40% for West Africa regions/50% for Asia) and less than 10% of the Jack-ups fleet has a firm contract for 2016. Regarding West Africa and North America, BRS Group is expecting the market to remain quite flat and 2016 will be a very competitive market all across the world. In Latin America, there are some expectations for 2016 with some projects in the pipeline (from Oro Negro for example) and expecting a certain comeback from Mexico but nothing really confirmed yet. India has also been a rare active tendering market with ONGC pursuing requirements with very low daily rates. Following the current market situation, it is expected that more rigs will become available in 2016/2017.
5. Mermaid’s Industry Positioning
Merma id takes a cau t ionary perspective on the oil and gas outlook over the next 12 months given the fall in oil price and news that oil and gas companies may be reviewing their spending. With the recent weakness in oil price, many commentators in the industry have put forward certain features of offshore oil and gas service companies that would make them better placed than others in this context. Having taken these various factors into account, Mermaid believes that it is one of those well placed companies due to its strategic industry positioning. This is further elaborated below:
Geographical coverage and shallow water focused
Mermaid’s fleet of subsea vessels are shallow water biased which is known to be more defensive and less affected by lower oil prices. This is because break even costs of such fields are reported to be lower than deeper
water fields and therefore less likely to be subject to contraction in service demand.
Mermaid has also developed strong local joint ventures in cabotage-protected markets serving NOCs in those countries. This includes Qatar, Saudi Arabia and Indonesia hence exposing Mermaid to the benefits of local expansions as NOCs strive for continued growth and energy security and therefore tend to be less price-sensitive.
IRM focused, new established cable laying and subsea engineering player
Mermaid’s business is also dedicated to the production phase of the E&P cycle and therefore less exposed to capital expenditure reduction. In particular, medium to long term demand is expected to remain relat ively intact which should bode well for ongoing production requirements.
Mermaid continues to pursue service and geographical expansion with a focus on cable lay and flexible pipe lay services and entry to those countries where demand growth is relatively strong. Its decentralized operations in the Middle East and Asia Pacific allows rapid deployment and cost efficiencies.
Track record of quality and safety, modern asset base
Mermaid remains one of the key industry players with an excellent operational and safety record and a stable management team. This can provide a competitive advantage in tighter market conditions as oil and gas majors will give preference to contractors with an established track record over new players.
Mermaid’s subsea fleet is relatively young, with many of them less than 10 years old thus placing them in a
Business review & outlook
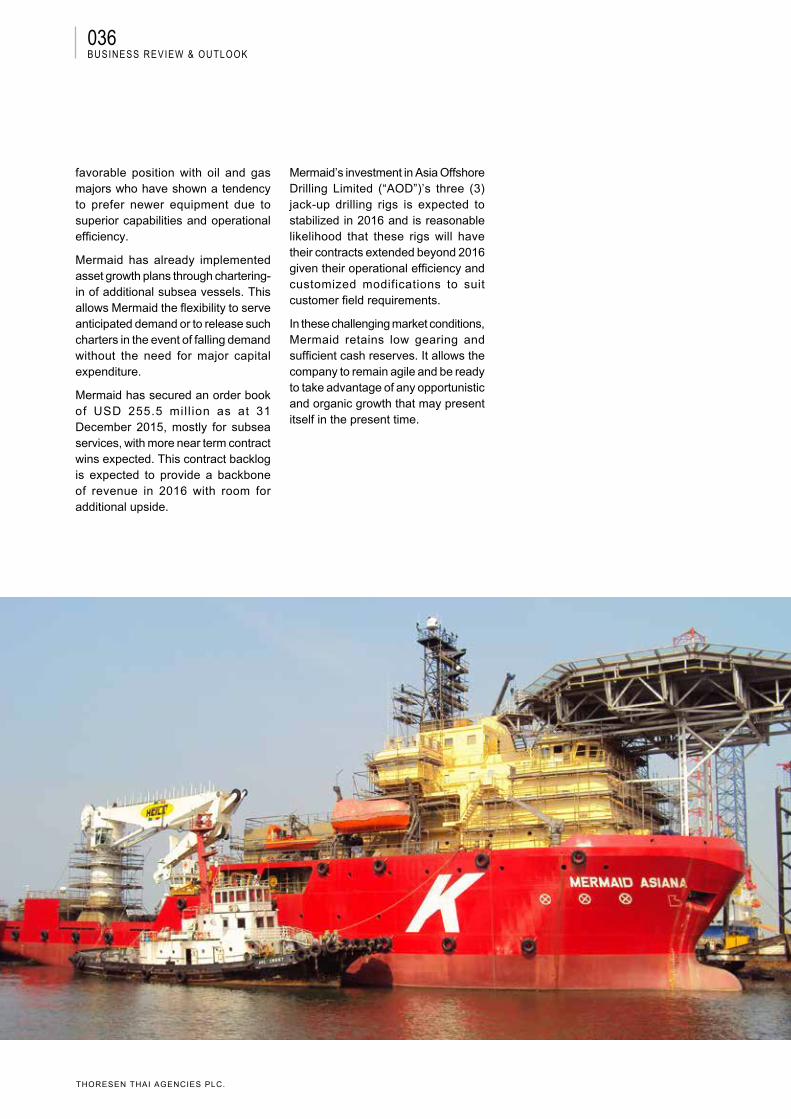
036
THORESEN THAI AGENCIES PLC.
favorable position with oil and gas majors who have shown a tendency to prefer newer equipment due to superior capabilities and operational efficiency.
Mermaid has already implemented asset growth plans through chartering-in of additional subsea vessels. This allows Mermaid the flexibility to serve anticipated demand or to release such charters in the event of falling demand without the need for major capital expenditure.
Mermaid has secured an order book of USD 255.5 mil l ion as at 31 December 2015, mostly for subsea services, with more near term contract wins expected. This contract backlog is expected to provide a backbone of revenue in 2016 with room for additional upside.
Mermaid’s investment in Asia Offshore Drilling Limited (“AOD”)’s three (3) jack-up drilling rigs is expected to stabilized in 2016 and is reasonable likelihood that these rigs will have their contracts extended beyond 2016 given their operational efficiency and customized modifications to suit customer field requirements.
In these challenging market conditions, Mermaid retains low gearing and sufficient cash reserves. It allows the company to remain agile and be ready to take advantage of any opportunistic and organic growth that may present itself in the present time.
Business review & outlook

037
ANNUAL REPORT 2015
Business review & outlook
038
THORESEN THAI AGENCIES PLC.
Business review & outlook
sales revenue
Fertilizer production Capacity
450,000
3,258.5THB
Metric Tons
m

039
ANNUAL REPORT 2015
Business review & outlook
mPM Thoresen Asia Holdings Company Limited
30export Footprint
Countries
FerTiLiZer & FACTory AreA LeAsing serViCes
040
THORESEN THAI AGENCIES PLC.
Fertilizer & Factory Area Leasing servicesPM Thoresen Asia Holdings Plc. (“PMTA”)
BUSINESS REVIEW - FERTILIZERPM Thoresen Asia Holdings Public Company Limited (“PMTA” or the “Company”) is a holding company of Baconco Co., Ltd. (“Baconco”) and PM Thoresen Asia (Singapore) Pte. Ltd. (“PMTS”). Baconco is currently operating in the agrochemical industry, having its headquarters located in southern Vietnam about 70 kilometers from Ho Chi Minh City. PMTS, incorporated in Singapore, principally functions as an offshore procurement organization for Baconco, providing purchasing services mainly for macronutrient products, including nitrogen (N), phosphate (P
2O
5) and potash (K
2O).
Baconco develops, manufactures, markets and distributes compound fertilizers and single fertilizers with a total production capacity of approximately 450,000 metric tons per year which has been increased from 2013 at 100,000 metric tons as a result of the opening of the expansion project of granulation unit that was commercially operated on February 2015 and packaging capacity of 550,000 metric tons per year. All Baconco’s fertilizers distributed in Vietnam, Laos PDR and Cambodia are under the “STORK” trademark registered by Baconco since 2005. The STORK brand has been highly-recognized and credited for quality and reliability, a result from Baconco’s strategy to produce high-quality fertilizers with major nutrients of nitrogen (N), phosphate (P
2O
5) and potash (K
2O).
Baconco’s trademark, STORK, has been registered in Vietnam since 2005.
To expand customer base and to increase sales and distribution channels overseas, Baconco also manufactures and distributes fertilizers for external customers. At present, it exports fertilizers relation over 30 countries worldwide with main clusters of customers in Africa, MEA and SEA. Apart from the fertilizers, Baconco also distributes pesticides in Vietnam and foliar both in Vietnam and abroad where it outsources production process and packaging of pesticides based on formulas and criteria determined thereby to the third party. In addition, Baconco
markets, sells and distributes fertilizers, pesticides and foliar under its trademarks registered in Vietnam and overseas such as in Laos PDR and Cambodia.
A: Products and Services1. FertilzersThe essential ingredients in chemical fertilizers are nitrogen (N), phosphate (P
2O
5) which provides phosphorus (P), and
potash (K2O) which provides potassium (K) as well as other
supplements. Major and supplementing nutrients restore and increase soil nutrients to enhance cultivation yields and productivity. Nitrogen not only helps leaves required for photosynthesis to grow quickly but also helps producing seeds. Phosphorus encourages trunks to grow, strengthens and expands roots. Potassium is used in the transportation and production of starch to feed growing parts or to roots and stems while reducing infection.
NPK Compound Fertilizers
NPK Compound Fertilizers are composed of all three main nutrients, namely, nitrogen (N), phosphate (P
2O
5) which
provides phosphorus (P), and potash (K2O) which provides
potassium (K) for plants. The N-P-K mix may vary according to purposes and each crop’s biological needs. Baconco sells NPK Compound Fertilizers both in Vietnam and overseas. These fertilizers are Baconco’s main products.
NPK Compound Fertilizers accounted for 94.5% and 94.4% of Baconco’s total sales revenues as end of December 31, 2014 and 2015, respectively. The firm also produced more than 95 formulas of NPK Compound Fertilizer for coffee, rice, rubber, vegetables and various other crops.
Other Fertilizers
The Other Fertilizers segment includes single fertilizer which contains a single nutrient; and compound fertilizer composing of at least two nutrients. The fertilizers are widely used due to the flexibility they offer end users to mix as desired. Nitrogen-based (N) fertilizers speed up photosynthesis and the production of seeds. Phosphorus-based (P) fertilizers helps developing the plant’s stems and roots. Potash (K) in fertilizer creates and transports nutrients to develop growing parts, improves fruit quality and increases protein contents to prevent infection.
As end of December 31, 2014 and 2015, other fertilizer products accounted for 1.1% and 1.3% of total sales revenues, respectively.
Business review & outlook
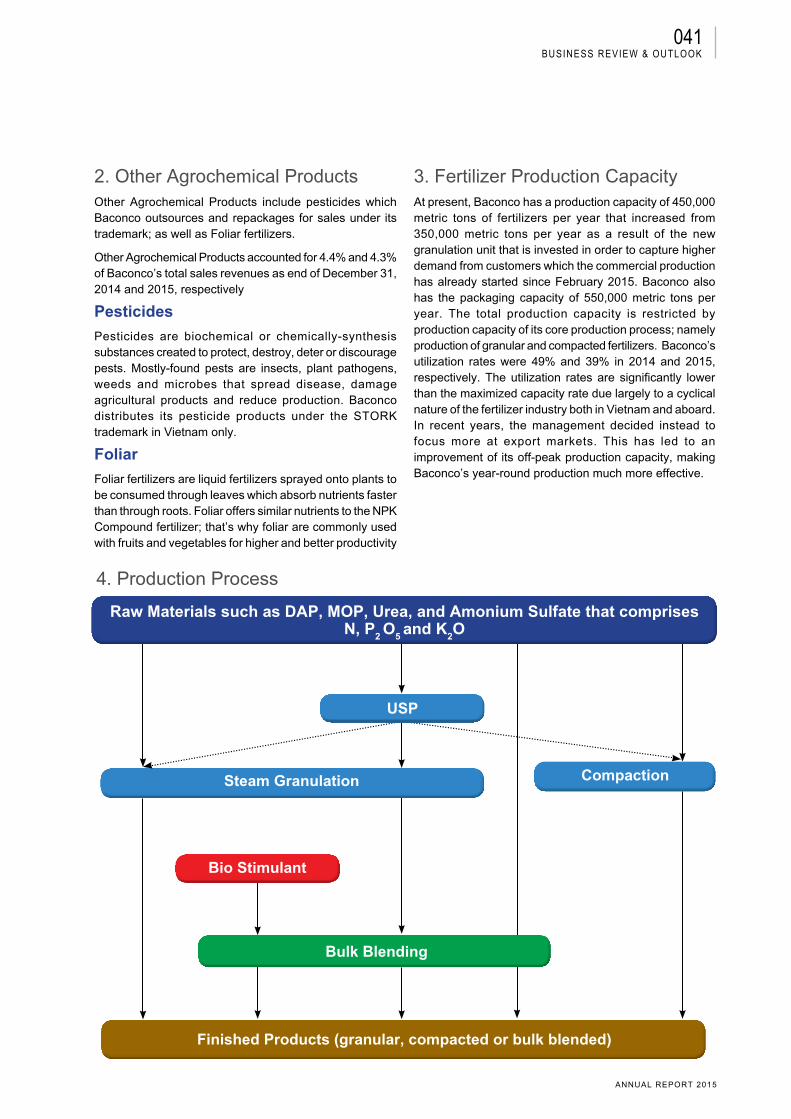
041
ANNUAL REPORT 2015
Finished Products (granular, compacted or bulk blended)
2. Other Agrochemical ProductsOther Agrochemical Products include pesticides which Baconco outsources and repackages for sales under its trademark; as well as Foliar fertilizers.
Other Agrochemical Products accounted for 4.4% and 4.3% of Baconco’s total sales revenues as end of December 31, 2014 and 2015, respectively
Pesticides
Pesticides are biochemical or chemically-synthesis substances created to protect, destroy, deter or discourage pests. Mostly-found pests are insects, plant pathogens, weeds and microbes that spread disease, damage agricultural products and reduce production. Baconco distributes its pesticide products under the STORK trademark in Vietnam only.
Foliar
Foliar fertilizers are liquid fertilizers sprayed onto plants to be consumed through leaves which absorb nutrients faster than through roots. Foliar offers similar nutrients to the NPK Compound fertilizer; that’s why foliar are commonly used with fruits and vegetables for higher and better productivity
3. Fertilizer Production CapacityAt present, Baconco has a production capacity of 450,000 metric tons of fertilizers per year that increased from 350,000 metric tons per year as a result of the new granulation unit that is invested in order to capture higher demand from customers which the commercial production has already started since February 2015. Baconco also has the packaging capacity of 550,000 metric tons per year. The total production capacity is restricted by production capacity of its core production process; namely production of granular and compacted fertilizers. Baconco’s utilization rates were 49% and 39% in 2014 and 2015, respectively. The utilization rates are significantly lower than the maximized capacity rate due largely to a cyclical nature of the fertilizer industry both in Vietnam and aboard. In recent years, the management decided instead to focus more at export markets. This has led to an improvement of its off-peak production capacity, making Baconco’s year-round production much more effective.
4. Production Process
Raw Materials such as DAP, MOP, Urea, and Amonium Sulfate that comprisesN, P2 O5 and K2O
Bulk Blending
Steam Granulation Compaction
USP
Bio Stimulant
Business review & outlook
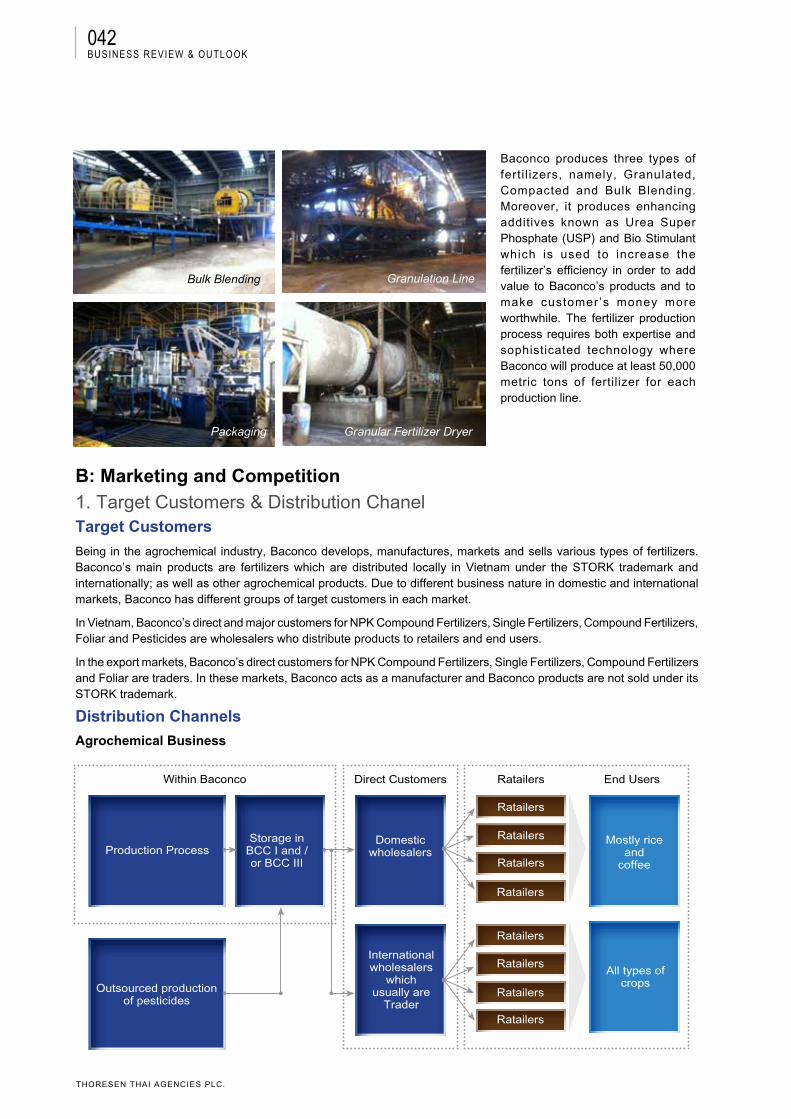
042
THORESEN THAI AGENCIES PLC.
Baconco produces three types of ferti l izers, namely, Granulated, Compacted and Bulk Blending. Moreover, it produces enhancing additives known as Urea Super Phosphate (USP) and Bio Stimulant which is used to increase the fertilizer’s efficiency in order to add value to Baconco’s products and to make customer’s money more worthwhile. The fertilizer production process requires both expertise and sophisticated technology where Baconco will produce at least 50,000 metric tons of fertilizer for each production line.
Bulk Blending Granulation Line
Packaging Granular Fertilizer Dryer
B: Marketing and Competition1. Target Customers & Distribution ChanelTarget Customers
Being in the agrochemical industry, Baconco develops, manufactures, markets and sells various types of fertilizers. Baconco’s main products are fertilizers which are distributed locally in Vietnam under the STORK trademark and internationally; as well as other agrochemical products. Due to different business nature in domestic and international markets, Baconco has different groups of target customers in each market.
In Vietnam, Baconco’s direct and major customers for NPK Compound Fertilizers, Single Fertilizers, Compound Fertilizers, Foliar and Pesticides are wholesalers who distribute products to retailers and end users.
In the export markets, Baconco’s direct customers for NPK Compound Fertilizers, Single Fertilizers, Compound Fertilizers and Foliar are traders. In these markets, Baconco acts as a manufacturer and Baconco products are not sold under its STORK trademark.
Distribution Channels
Agrochemical Business
Within Baconco Direct Customers
Production Process
Outsourced production of pesticides
Storage in BCC I and / or BCC III
Domestic wholesalers
Mostly rice and
coffee
All types of crops
International wholesalers
which usually are
Trader
Ratailers
Ratailers
Ratailers
Ratailers
Ratailers
Ratailers
Ratailers
Ratailers
Ratailers End Users
Business review & outlook
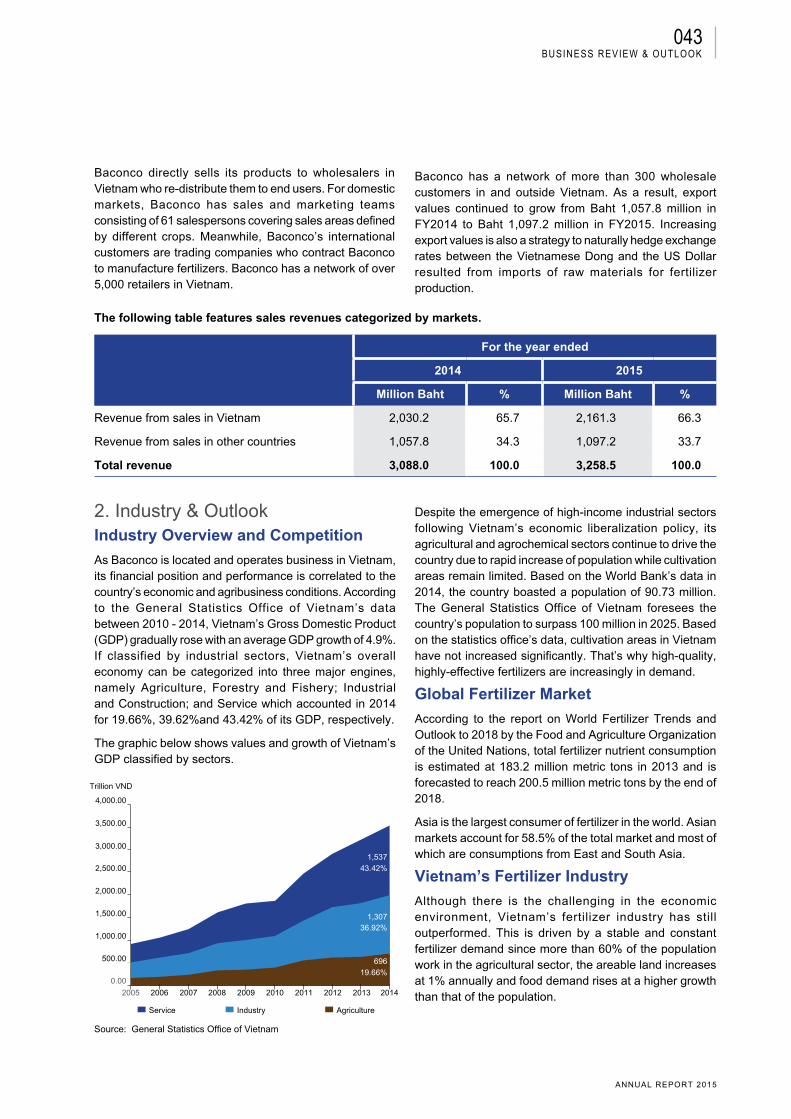
043
ANNUAL REPORT 2015
Baconco directly sells its products to wholesalers in Vietnam who re-distribute them to end users. For domestic markets, Baconco has sales and marketing teams consisting of 61 salespersons covering sales areas defined by different crops. Meanwhile, Baconco’s international customers are trading companies who contract Baconco to manufacture fertilizers. Baconco has a network of over 5,000 retailers in Vietnam.
Baconco has a network of more than 300 wholesale customers in and outside Vietnam. As a result, export values continued to grow from Baht 1,057.8 million in FY2014 to Baht 1,097.2 million in FY2015. Increasing export values is also a strategy to naturally hedge exchange rates between the Vietnamese Dong and the US Dollar resulted from imports of raw materials for fertilizer production.
The following table features sales revenues categorized by markets.
For the year ended
2014 2015
Million Baht % Million Baht %
Revenue from sales in Vietnam 2,030.2 65.7 2,161.3 66.3
Revenue from sales in other countries 1,057.8 34.3 1,097.2 33.7
Total revenue 3,088.0 100.0 3,258.5 100.0
2. Industry & OutlookIndustry Overview and Competition
As Baconco is located and operates business in Vietnam, its financial position and performance is correlated to the country’s economic and agribusiness conditions. According to the General Statistics Office of Vietnam’s data between 2010 - 2014, Vietnam’s Gross Domestic Product (GDP) gradually rose with an average GDP growth of 4.9%. If classified by industrial sectors, Vietnam’s overall economy can be categorized into three major engines, namely Agriculture, Forestry and Fishery; Industrial and Construction; and Service which accounted in 2014 for 19.66%, 39.62%and 43.42% of its GDP, respectively.
The graphic below shows values and growth of Vietnam’s GDP classified by sectors.
Trillion VND
4,000.00
3,500.00
3,000.00
2,500.00
2,000.00
1,500.00
1,000.00
500.00
0.00
2005 2006 2007 2008 2009 2010 2011 2012 2013 2014
1,537
1,307
696
43.42%
Service Industry Agriculture
36.92%
19.66%
Source: General Statistics Office of Vietnam
Despite the emergence of high-income industrial sectors following Vietnam’s economic liberalization policy, its agricultural and agrochemical sectors continue to drive the country due to rapid increase of population while cultivation areas remain limited. Based on the World Bank’s data in 2014, the country boasted a population of 90.73 million. The General Statistics Office of Vietnam foresees the country’s population to surpass 100 million in 2025. Based on the statistics office’s data, cultivation areas in Vietnam have not increased significantly. That’s why high-quality, highly-effective fertilizers are increasingly in demand.
Global Fertilizer Market
According to the report on World Fertilizer Trends and Outlook to 2018 by the Food and Agriculture Organization of the United Nations, total fertilizer nutrient consumption is estimated at 183.2 million metric tons in 2013 and is forecasted to reach 200.5 million metric tons by the end of 2018.
Asia is the largest consumer of fertilizer in the world. Asian markets account for 58.5% of the total market and most of which are consumptions from East and South Asia.
Vietnam’s Fertilizer Industry
Although there is the challenging in the economic environment, Vietnam’s fertilizer industry has still outperformed. This is driven by a stable and constant fertilizer demand since more than 60% of the population work in the agricultural sector, the areable land increases at 1% annually and food demand rises at a higher growth than that of the population.
Business review & outlook
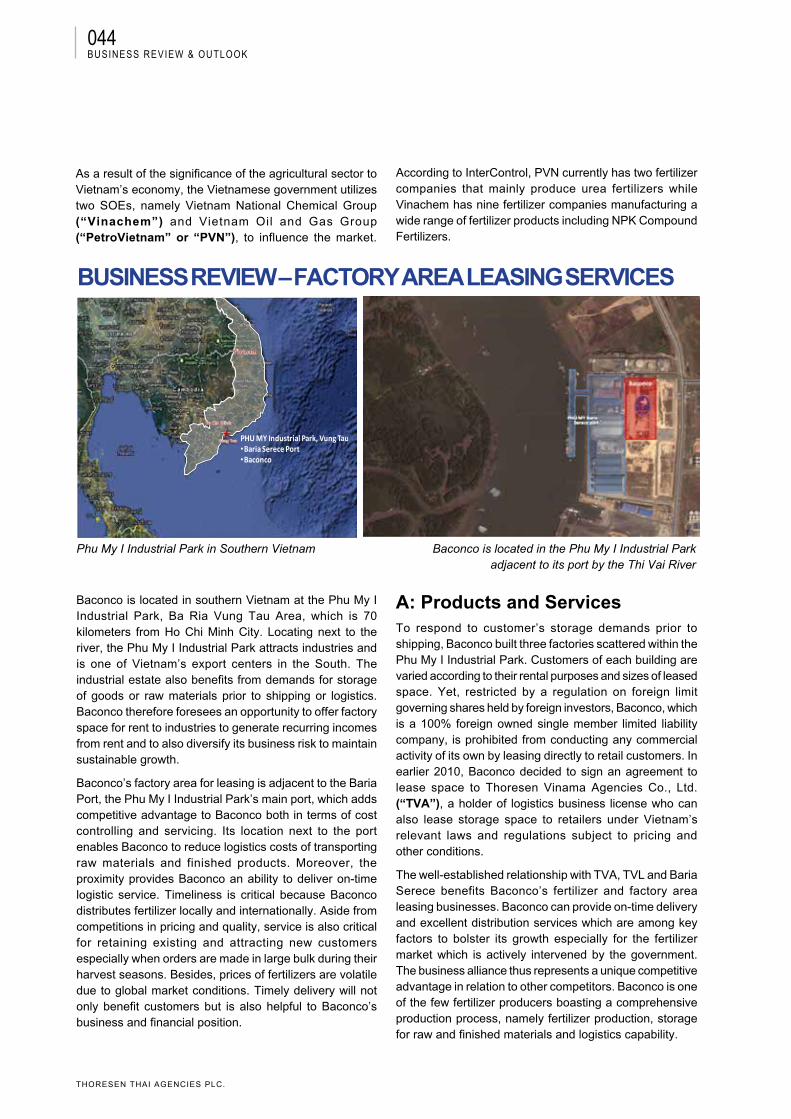
044
THORESEN THAI AGENCIES PLC.
As a result of the significance of the agricultural sector to Vietnam’s economy, the Vietnamese government utilizes two SOEs, namely Vietnam National Chemical Group (“Vinachem”) and Vietnam Oil and Gas Group (“PetroVietnam” or “PVN”), to influence the market.
Baconco is located in southern Vietnam at the Phu My I Industrial Park, Ba Ria Vung Tau Area, which is 70 kilometers from Ho Chi Minh City. Locating next to the river, the Phu My I Industrial Park attracts industries and is one of Vietnam’s export centers in the South. The industrial estate also benefits from demands for storage of goods or raw materials prior to shipping or logistics. Baconco therefore foresees an opportunity to offer factory space for rent to industries to generate recurring incomes from rent and to also diversify its business risk to maintain sustainable growth.
Baconco’s factory area for leasing is adjacent to the Baria Port, the Phu My I Industrial Park’s main port, which adds competitive advantage to Baconco both in terms of cost controlling and servicing. Its location next to the port enables Baconco to reduce logistics costs of transporting raw materials and finished products. Moreover, the proximity provides Baconco an ability to deliver on-time logistic service. Timeliness is critical because Baconco distributes fertilizer locally and internationally. Aside from competitions in pricing and quality, service is also critical for retaining existing and attracting new customers especially when orders are made in large bulk during their harvest seasons. Besides, prices of fertilizers are volatile due to global market conditions. Timely delivery will not only benefit customers but is also helpful to Baconco’s business and financial position.
PHU MY Industrial Park, Vung Tau•Baria Serece Port•Baconco
Baconco is located in the Phu My I Industrial Parkadjacent to its port by the Thi Vai River
Phu My I Industrial Park in Southern Vietnam
A: Products and ServicesTo respond to customer’s storage demands prior to shipping, Baconco built three factories scattered within the Phu My I Industrial Park. Customers of each building are varied according to their rental purposes and sizes of leased space. Yet, restricted by a regulation on foreign limit governing shares held by foreign investors, Baconco, which is a 100% foreign owned single member limited liability company, is prohibited from conducting any commercial activity of its own by leasing directly to retail customers. In earlier 2010, Baconco decided to sign an agreement to lease space to Thoresen Vinama Agencies Co., Ltd. (“TVA”), a holder of logistics business license who can also lease storage space to retailers under Vietnam’s relevant laws and regulations subject to pricing and other conditions.
The well-established relationship with TVA, TVL and Baria Serece benefits Baconco’s fertilizer and factory area leasing businesses. Baconco can provide on-time delivery and excellent distribution services which are among key factors to bolster its growth especially for the fertilizer market which is actively intervened by the government. The business alliance thus represents a unique competitive advantage in relation to other competitors. Baconco is one of the few fertilizer producers boasting a comprehensive production process, namely fertilizer production, storage for raw and finished materials and logistics capability.
Business review & outlook
According to InterControl, PVN currently has two fertilizer companies that mainly produce urea fertilizers while Vinachem has nine fertilizer companies manufacturing a wide range of fertilizer products including NPK Compound Fertilizers.
BUSINESS REVIEW – FACTORY AREA LEASING SERVICES
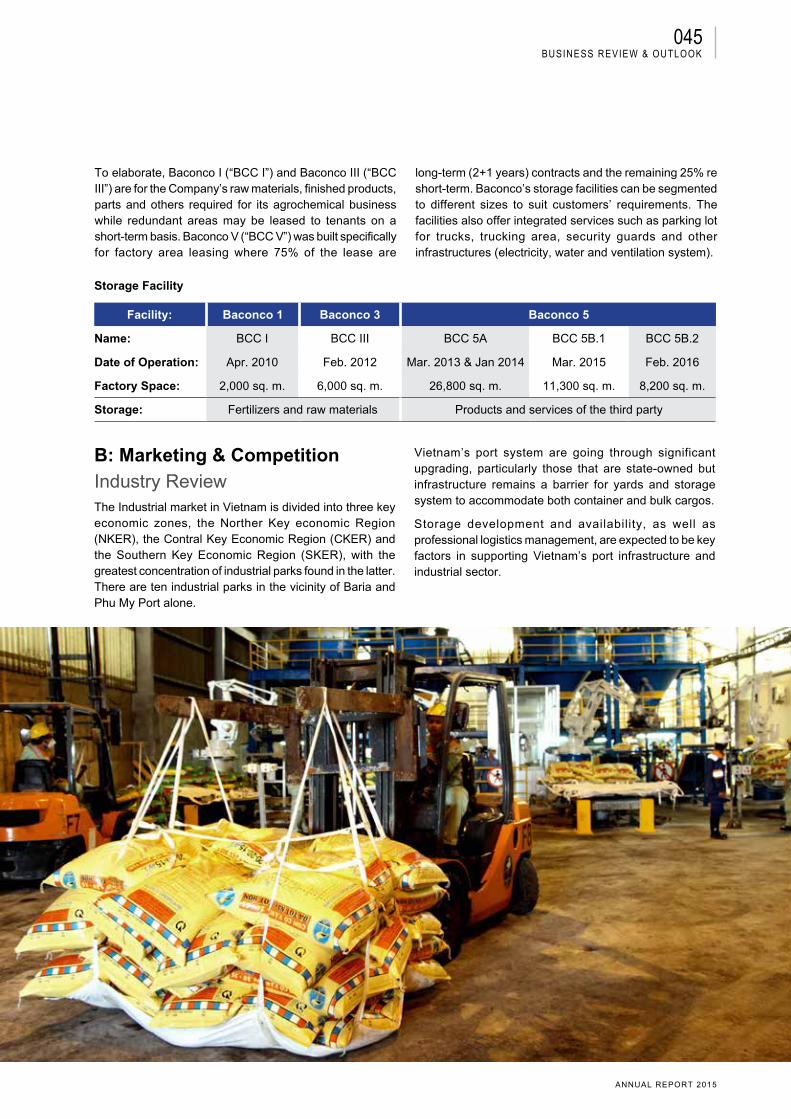
045
ANNUAL REPORT 2015
To elaborate, Baconco I (“BCC I”) and Baconco III (“BCC III”) are for the Company’s raw materials, finished products, parts and others required for its agrochemical business while redundant areas may be leased to tenants on a short-term basis. Baconco V (“BCC V”) was built specifically for factory area leasing where 75% of the lease are
long-term (2+1 years) contracts and the remaining 25% re short-term. Baconco’s storage facilities can be segmented to different sizes to suit customers’ requirements. The facilities also offer integrated services such as parking lot for trucks, trucking area, security guards and other infrastructures (electricity, water and ventilation system).
Storage Facility
Facility: Baconco 1 Baconco 3 Baconco 5
Name: BCC I BCC III BCC 5A BCC 5B.1 BCC 5B.2
Date of Operation: Apr. 2010 Feb. 2012 Mar. 2013 & Jan 2014 Mar. 2015 Feb. 2016
Factory Space: 2,000 sq. m. 6,000 sq. m. 26,800 sq. m. 11,300 sq. m. 8,200 sq. m.
Storage: Fertilizers and raw materials Products and services of the third party
B: Marketing & CompetitionIndustry ReviewThe Industrial market in Vietnam is divided into three key economic zones, the Norther Key economic Region (NKER), the Contral Key Economic Region (CKER) and the Southern Key Economic Region (SKER), with the greatest concentration of industrial parks found in the latter. There are ten industrial parks in the vicinity of Baria and Phu My Port alone.
Vietnam’s port system are going through significant upgrading, particularly those that are state-owned but infrastructure remains a barrier for yards and storage system to accommodate both container and bulk cargos.
Storage development and availability, as well as professional logistics management, are expected to be key factors in supporting Vietnam’s port infrastructure and industrial sector.
Business review & outlook
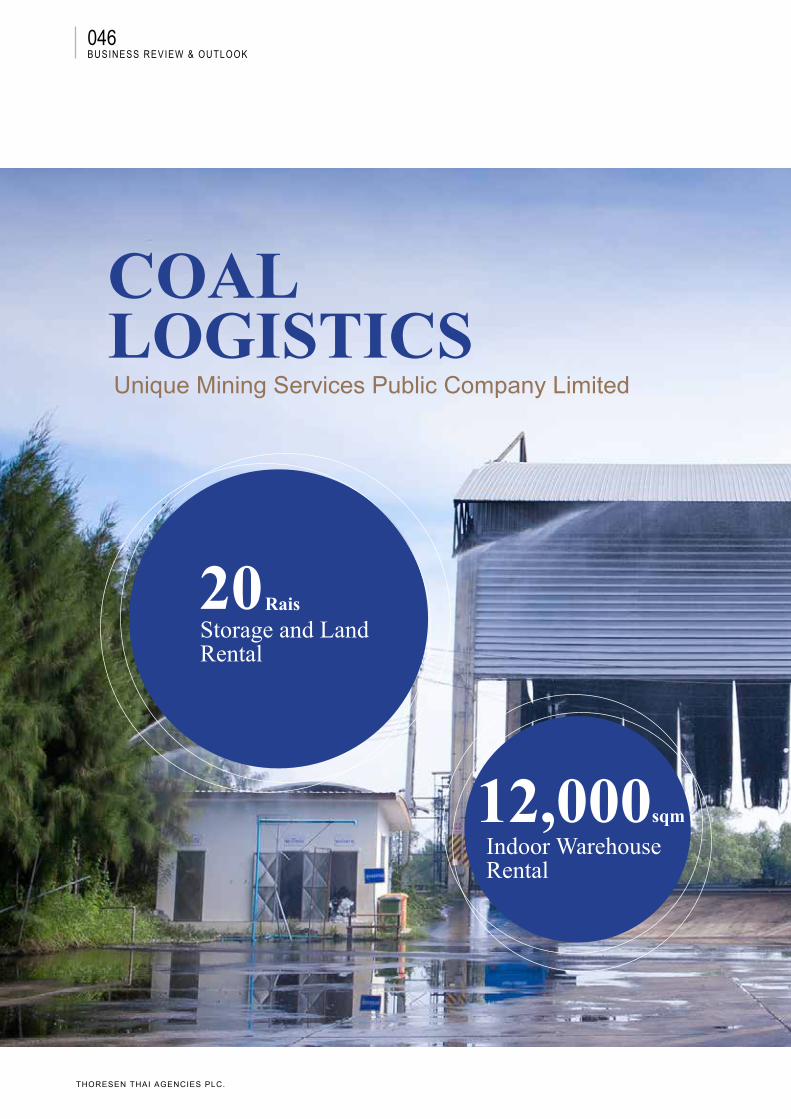
046
THORESEN THAI AGENCIES PLC.
Business review & outlook
CoALLogisTiCsUnique Mining Services Public Company Limited
12,000sqm
rais
Indoor Warehouse rental
Storage and Land rental
20
047
ANNUAL REPORT 2015
Business review & outlook
4,300sqm
Office Space

048
THORESEN THAI AGENCIES PLC.
Business review & outlook
Unique Mining Services Public Company Limited or UMS operates import of high quality coal with moderate calorific value and less environmental impact where coal is mainly imported from Indonesia for distribution to large, medium and small-sized factories especially to those located in Bangkok and nearby provinces. UMS’s primary industrial targets are food & beverage, pulp & paper and textile industries. Imported coal will be transferred to UMS’s preparation and handling plant to ensure coal quality is apt for the engineering specifications of boilers used by each industrial manufacturing production. UMS has also participated in several reverse auctions for coal supply to private companies in the cement and power generation industries.
UMS lays out its strategic blueprints to deliver coal to customers in a timely manner through complete supply chain management with efficient administration in coal stockpiles and warehouses to ensure coal adequacy for delivery to customers. This enables customers never have to worry about stocking up coal and preparing stations or warehouse to store coal on its own.
A: Products and ServicesCoal is a fossil fuel, with a large number of proven reserves whose resources spread over more than 100 countries worldwide. Coal is known to have a high rate of secure supplies which encourages strong price competition resulting in lower prices than other fuels particularly natural gas and fuel oil. Coal is a type of natural fuel that has a solid state and an important compound which is carbon. Typically, coal is dark brown or black and can belong in multiple categories. Coals can be ranked in order of their quality (considering from the calorific value, level of moisture and sulfur
BUSINESS REVIEW
Coal LogisticsUnique Mining Services Public Company Limited (“UMS”)
content) in the respective following: Anthracite, Bituminous, Sub - bituminous and Lignite.
UMS focuses on importing bituminous and sub-bituminous coals as these are good quality containing moderate calorific value, moisture and ash at appropriate level and low sulfur content in particular, compared to fuel oil (fuel oil has a sulfur content of approximately 0.1 to 3.0 percent), begetting less environmental pollution. UMS does not import anthracite coal due to its higher cost, limited domestic consumption and lack of growth trend. Lignite is the lowest quality coal as it carries a lot of sulfur content causing a higher impact on the environment and is so unpopular with customers as a result.
UMS’s business workflow begins with the import of coal from Indonesia for sale to industrial facilities. For all large industrial plants and some medium-sized factories, UMS is able to deliver coal to customers immediately, without a stop at UMS’s warehouse, whilst some medium industrial customers and small industries require coal that undergoes the coal preparation and screening process. Each imported run-of-mine coal (50,000-70,000 tons) have different qualities in terms of calorific value, level of moisture, ash and sulfur content. Therefore, it is important that these coals are properly graded prior to transport. Each type of run-of-mine coal has different attributes such as the calorific value although they come from the same mine. (Coal in each different soil layer will have different features, for instance the sub-bituminous coal can be divided into several types depending on the calorific value, moisture, ash and sulfur content, etc.), The coal will then be mixed with UMS’s unique formula to meet customer requirements. The coal will also be sized to have quality appropriate for the boilers used
in the industrial plant of each customer since boilers are differently engineered to achieve highest combustion. UMS provides delivery service to its customers on a daily basis for ease of customer use which trims the number of coals that need to be kept in the customer’s storage facility since many customers do not have enough sites to store coal.
B: Marketing & CompetitionMarketing PolicyUMS has adopted an aggressive marketing strategy based on various characteristic strengths; its cost is lower than fuel oil with more available proven reserves. UMS has succeeded very well in increasing the customer base among small and medium-sized industrial companies with significant marketing strategies as follows:
Competitive Strategy(1) Goods and Services
UMS follows optimal productive strategy which distinguishes itself from competitors in general as UMS extensively carries out quality handling and preparation test to ensure coal fits the boilers used in each factory to achieve maximum efficiency of fuel combustion. At present, UMS uses this technique for medium-sized and small industrial plants which adds value to its products relieving price competitive pressure, especially with the major coal suppliers in the country. UMS is determined to penetrate many medium and small industrial markets since UMS can achieve higher gross profit from coal sales than to large industrial groups.
UMS applies thorough procedures to monitor the quality of coal to give customers confidence in using quality coal. Prior to shipping coal from Indonesia, vendors/manufacturers will
049
ANNUAL REPORT 2015
Business review & outlook
check the quality through service of certified institutes with coal analysis standards in Indonesia where calorific value, carbon, level of moisture, ash derived from combustion and the sulfur dioxide will be examined. Once imported into Thailand, UMS will re-ascertain coal quality by means of coal sampling at the time the coal is unloaded from the ship and have it sent for final check by leading acceptable organizations such as SGS (Thailand) Limited, Cotecna Inspection (Thailand) Co., Ltd. and the Electricity Generating Authority of Thailand in the Mae Moh district, Lam Pang province etc, before delivery to customers. In some cases where customers, especially large industrial enterprises, have special agreement expecting additional quality control, UMS will arrange samples of coal to be tested by SGS (Thailand) Limited or other leading organizations with several branches in many countries whose coal analysis standards and services are widely recognized.
In terms of service performance, UMS has successfully fulfilled its function of product delivery on an ongoing basis to the customer’s satisfaction. Coal will be delivered immediately should there be any spot orders from customers. This has given several benefits to the customers whose inventories are not needed and usability increases as well.
(2) Customer Base Expansion
Because coal is a fuel that is offered with low prices but obtainable from large quantities of proven reserves compared with fuel oil and gas and has very little environmental impact (bituminous coal and sub-bituminous coal that UMS sells), so industrialists are more likely to switch to coal in a long run. UMS aims to expand its customer base to industrial units that use fuel oil due to a considerable number of active consumers in the market as well as penetrating large customer groups such as cement and power plants etc.
UMS plans to make proposals to other more customers to realize the benefits from using coal as an alternative fuel source instead of fuel oil. UMS’s strategy is to elucidate them about cost savings advantage with an estimated return period of 9-24 months, as well as putting them in the picture about the wrong attitude towards the cause of environmental pollution by using coal which will turn customers’ attention to more use of coal.
UMS also has sales channels through distributors of coal boilers. After UMS’s data presentation in relation to coal as an alternative fuel is given to customers who show interest in coal products, UMS will introduce its boiler distribution agents to customers suggesting the preferred type of boilers that match UMS’s coal products so as to maximize efficiency in coal using.
Alternatively, these distributors will market their boilers to many industrialists a lot of who will be introduced to UMS after the boiler sale is completed. These industrial clients will then buy coal from UMS following the recommendation of the boiler agents. This distribution channel will help increase sales of UMS’s coal.
However, increasing the customer base to use more coal will take some time since installation of small boilers typically takes about 3-4 months (including the import of boilers period) while the medium to large boilers can take up to 8-15 months for installation after which UMS will begin selling the coal to the factories. In addition, most customers will first experiment with replacing fuel oil with coal to some of their boilers to see if it runs without any problem during a period of about 3-6 months. If no errors are spotted, customers will then replace the fuel oil with coal to the rest. That being said, UMS expects sales to rise continually.
(3) Cost Administration
UMS is planning to deliver cost effective logistics service through a reasonable level of inventory management, systematic transport planning including fabricating a warehouse near the industrial stations of customers, thus saving a lot of shipping costs. UMS owns several barges diminishing the transport outsourcing expenses.
UMS has main ta ined a good relationship with coal suppliers/manufacturers for many consecutive years. This has enabled UMS to trade coal with competitive prices. Basically, UMS has contractually fixed the number of tons of coal to be purchased from major suppliers/manufacturers while general coal prices are set according to the market mechanism. UMS also sources coal from several additional places in an attempt to have bargaining power and competitive ability to negotiate purchase coal price.
Clients & Target Customer, Distribution ChannelsUMS sells coal to domestic factories, divided into large, medium and small sized industrial companies. UMS pursues its policy of expanding its customer base to medium and small sized factories all of which are mainly the sale target of major coal suppliers in the country, thus minimizing its pricing competitive status with the major coal vendors. Currently, there are approximately 100 small and medium sized industrial customers and 10 large sized industrial customers UMS serves, all of which are mainly in the industry of cement, large pulp & paper and power plants.
UMS’s target customers are in industries that require thermal energy to produce steam in the manufacturing process, such as the food processing, pulp paper, rubber gloves and textile industries etc. At present, most of the thermal energy is diffused from fuel
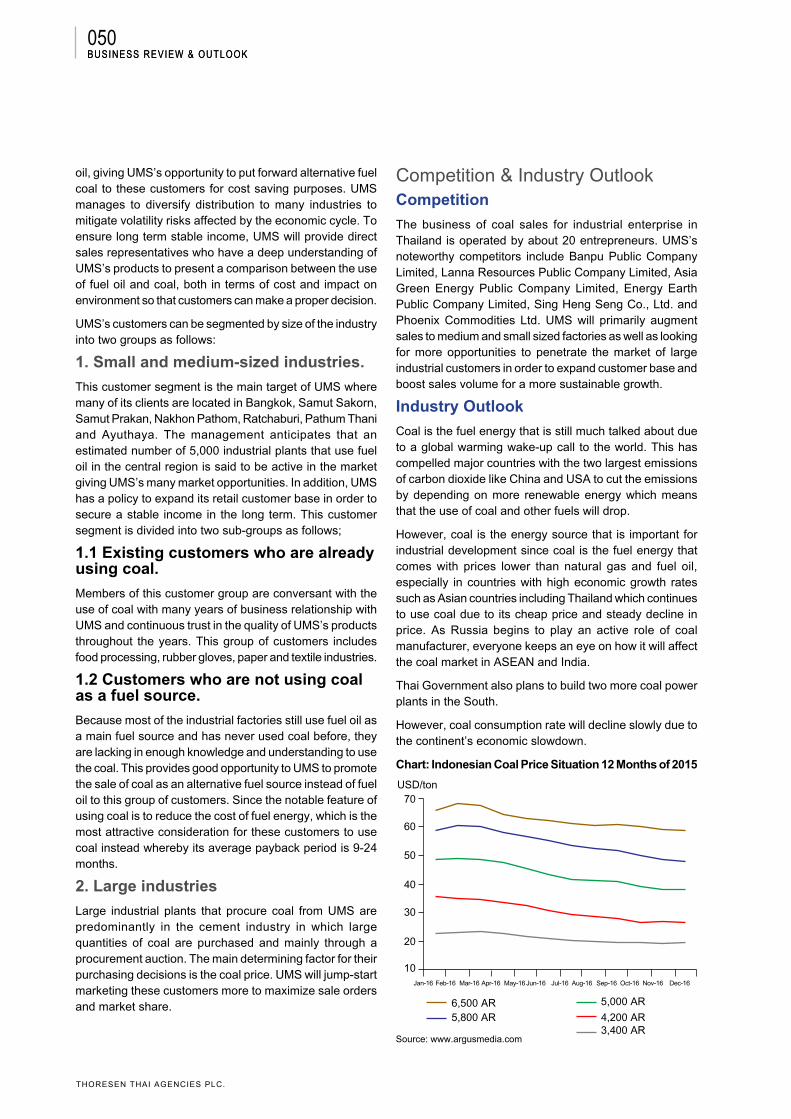
050
THORESEN THAI AGENCIES PLC.
Business review & outlook
oil, giving UMS’s opportunity to put forward alternative fuel coal to these customers for cost saving purposes. UMS manages to diversify distribution to many industries to mitigate volatility risks affected by the economic cycle. To ensure long term stable income, UMS will provide direct sales representatives who have a deep understanding of UMS’s products to present a comparison between the use of fuel oil and coal, both in terms of cost and impact on environment so that customers can make a proper decision.
UMS’s customers can be segmented by size of the industry into two groups as follows:
1. Small and medium-sized industries.
This customer segment is the main target of UMS where many of its clients are located in Bangkok, Samut Sakorn, Samut Prakan, Nakhon Pathom, Ratchaburi, Pathum Thani and Ayuthaya. The management anticipates that an estimated number of 5,000 industrial plants that use fuel oil in the central region is said to be active in the market giving UMS’s many market opportunities. In addition, UMS has a policy to expand its retail customer base in order to secure a stable income in the long term. This customer segment is divided into two sub-groups as follows;
1.1 Existing customers who are already using coal.
Members of this customer group are conversant with the use of coal with many years of business relationship with UMS and continuous trust in the quality of UMS’s products throughout the years. This group of customers includes food processing, rubber gloves, paper and textile industries.
1.2 Customers who are not using coal as a fuel source.
Because most of the industrial factories still use fuel oil as a main fuel source and has never used coal before, they are lacking in enough knowledge and understanding to use the coal. This provides good opportunity to UMS to promote the sale of coal as an alternative fuel source instead of fuel oil to this group of customers. Since the notable feature of using coal is to reduce the cost of fuel energy, which is the most attractive consideration for these customers to use coal instead whereby its average payback period is 9-24 months.
2. Large industries
Large industrial plants that procure coal from UMS are predominantly in the cement industry in which large quantities of coal are purchased and mainly through a procurement auction. The main determining factor for their purchasing decisions is the coal price. UMS will jump-start marketing these customers more to maximize sale orders and market share.
Competition & Industry OutlookCompetition
The business of coal sales for industrial enterprise in Thailand is operated by about 20 entrepreneurs. UMS’s noteworthy competitors include Banpu Public Company Limited, Lanna Resources Public Company Limited, Asia Green Energy Public Company Limited, Energy Earth Public Company Limited, Sing Heng Seng Co., Ltd. and Phoenix Commodities Ltd. UMS will primarily augment sales to medium and small sized factories as well as looking for more opportunities to penetrate the market of large industrial customers in order to expand customer base and boost sales volume for a more sustainable growth.
Industry Outlook
Coal is the fuel energy that is still much talked about due to a global warming wake-up call to the world. This has compelled major countries with the two largest emissions of carbon dioxide like China and USA to cut the emissions by depending on more renewable energy which means that the use of coal and other fuels will drop.
However, coal is the energy source that is important for industrial development since coal is the fuel energy that comes with prices lower than natural gas and fuel oil, especially in countries with high economic growth rates such as Asian countries including Thailand which continues to use coal due to its cheap price and steady decline in price. As Russia begins to play an active role of coal manufacturer, everyone keeps an eye on how it will affect the coal market in ASEAN and India.
Thai Government also plans to build two more coal power plants in the South.
However, coal consumption rate will decline slowly due to the continent’s economic slowdown.
Chart: Indonesian Coal Price Situation 12 Months of 2015
70USD/ton
60
50
40
30
20
10Jan-16
6,500 AR5,800 AR
5,000 AR
4,200 AR3,400 AR
Feb-16 Mar-16 Apr-16 May-16Jun-16 Jul-16 Aug-16 Sep-16 Oct-16 Nov-16 Dec-16
Source: www.argusmedia.com
Business review & outlook
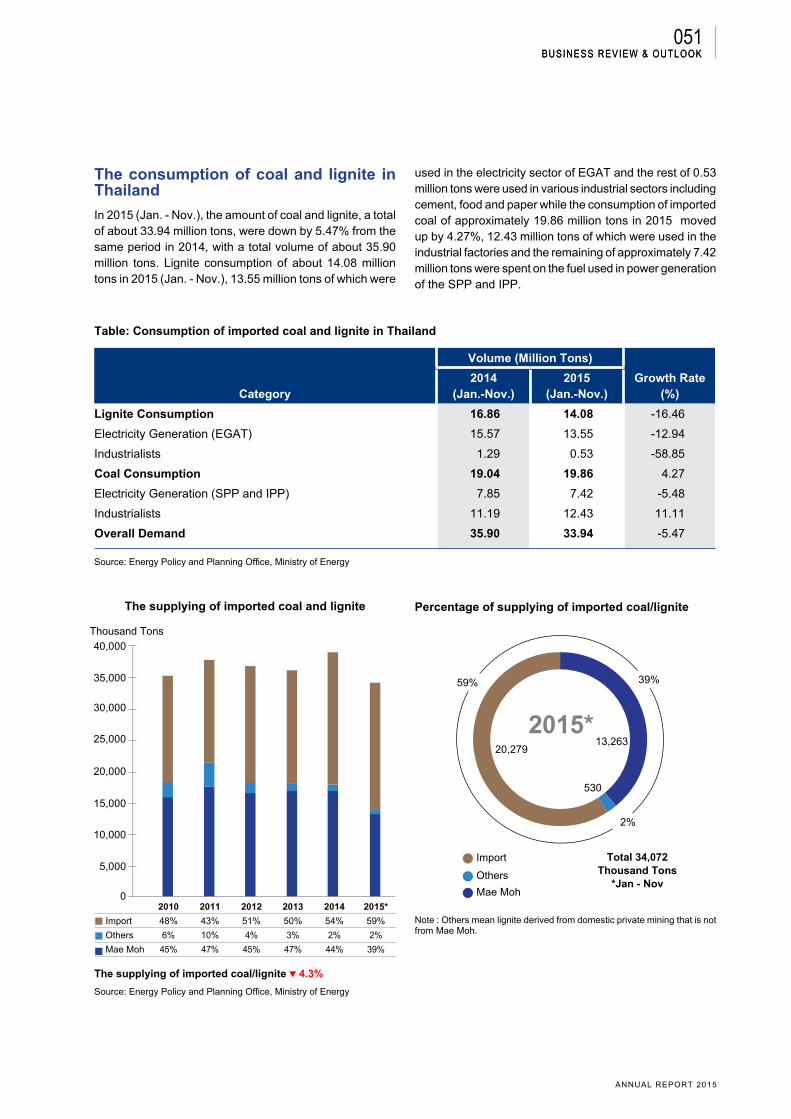
051
ANNUAL REPORT 2015
Business review & outlook
The consumption of coal and lignite in Thailand
In 2015 (Jan. - Nov.), the amount of coal and lignite, a total of about 33.94 million tons, were down by 5.47% from the same period in 2014, with a total volume of about 35.90 million tons. Lignite consumption of about 14.08 million tons in 2015 (Jan. - Nov.), 13.55 million tons of which were
used in the electricity sector of EGAT and the rest of 0.53 million tons were used in various industrial sectors including cement, food and paper while the consumption of imported coal of approximately 19.86 million tons in 2015 moved up by 4.27%, 12.43 million tons of which were used in the industrial factories and the remaining of approximately 7.42 million tons were spent on the fuel used in power generation of the SPP and IPP.
Table: Consumption of imported coal and lignite in Thailand
Category
Volume (Million Tons)
Growth Rate(%)
2014(Jan.-Nov.)
2015(Jan.-Nov.)
Lignite Consumption 16.86 14.08 -16.46
Electricity Generation (EGAT) 15.57 13.55 -12.94
Industrialists 1.29 0.53 -58.85
Coal Consumption 19.04 19.86 4.27
Electricity Generation (SPP and IPP) 7.85 7.42 -5.48
Industrialists 11.19 12.43 11.11
Overall Demand 35.90 33.94 -5.47
Source: Energy Policy and Planning Office, Ministry of Energy
Mae Moh
Import
Others
The supplying of imported coal and lignite
0
5,000
10,000
15,000
20,000
25,000
30,000
35,000
40,000Thousand Tons
39%
13,263
530
20,279
59%
2%
2015*
Percentage of supplying of imported coal/lignite
The supplying of imported coal/lignite 4.3%
Source: Energy Policy and Planning Office, Ministry of Energy
Note : Others mean lignite derived from domestic private mining that is not from Mae Moh.
Total 34,072 Thousand Tons
*Jan - Nov
Business review & outlook
2010 2011 2012 2013 2014 2015*
Import 48% 43% 51% 50% 54% 59%
Others 6% 10% 4% 3% 2% 2%
Mae Moh 45% 47% 45% 47% 44% 39%
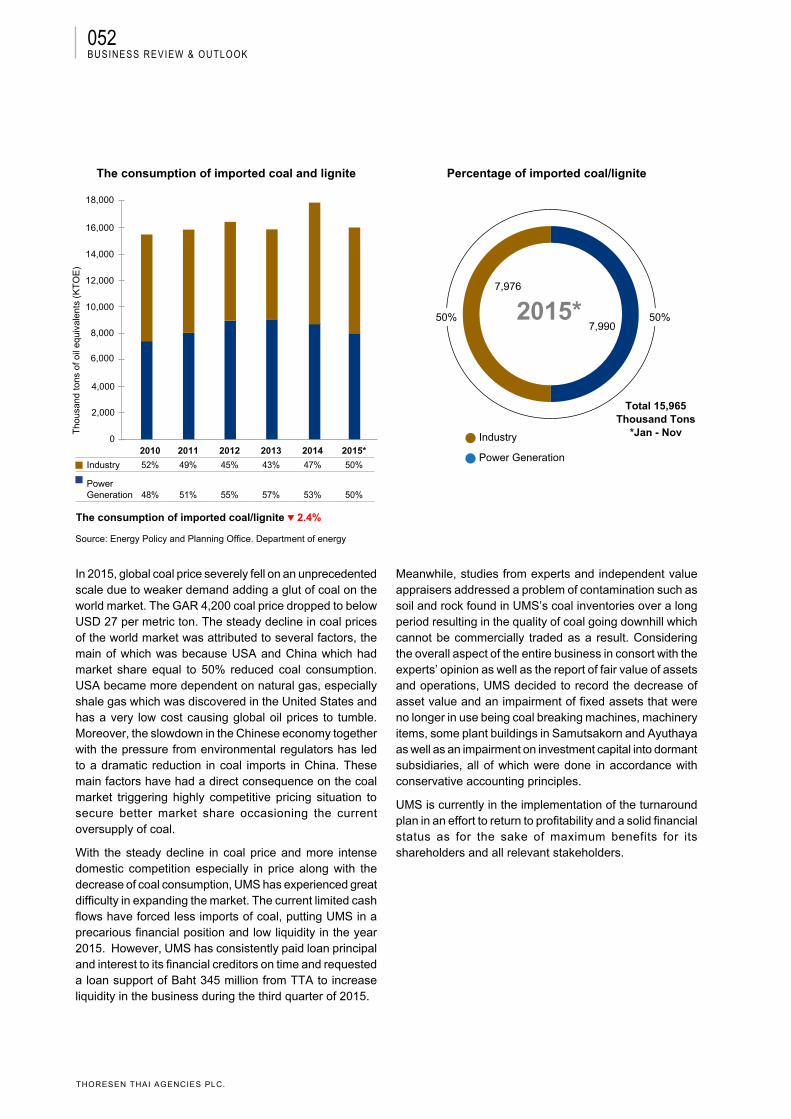
052
THORESEN THAI AGENCIES PLC.
In 2015, global coal price severely fell on an unprecedented scale due to weaker demand adding a glut of coal on the world market. The GAR 4,200 coal price dropped to below USD 27 per metric ton. The steady decline in coal prices of the world market was attributed to several factors, the main of which was because USA and China which had market share equal to 50% reduced coal consumption. USA became more dependent on natural gas, especially shale gas which was discovered in the United States and has a very low cost causing global oil prices to tumble. Moreover, the slowdown in the Chinese economy together with the pressure from environmental regulators has led to a dramatic reduction in coal imports in China. These main factors have had a direct consequence on the coal market triggering highly competitive pricing situation to secure better market share occasioning the current oversupply of coal.
With the steady decline in coal price and more intense domestic competition especially in price along with the decrease of coal consumption, UMS has experienced great difficulty in expanding the market. The current limited cash flows have forced less imports of coal, putting UMS in a precarious financial position and low liquidity in the year 2015. However, UMS has consistently paid loan principal and interest to its financial creditors on time and requested a loan support of Baht 345 million from TTA to increase liquidity in the business during the third quarter of 2015.
Percentage of imported coal/ligniteThe consumption of imported coal and lignite
2015* 50%50%7,990
7,976
Industry
Power Generation
Meanwhile, studies from experts and independent value appraisers addressed a problem of contamination such as soil and rock found in UMS’s coal inventories over a long period resulting in the quality of coal going downhill which cannot be commercially traded as a result. Considering the overall aspect of the entire business in consort with the experts’ opinion as well as the report of fair value of assets and operations, UMS decided to record the decrease of asset value and an impairment of fixed assets that were no longer in use being coal breaking machines, machinery items, some plant buildings in Samutsakorn and Ayuthaya as well as an impairment on investment capital into dormant subsidiaries, all of which were done in accordance with conservative accounting principles.
UMS is currently in the implementation of the turnaround plan in an effort to return to profitability and a solid financial status as for the sake of maximum benefits for its shareholders and all relevant stakeholders.
Business review & outlook
0
2,000
4,000
6,000
8,000
10,000
12,000
14,000
16,000
18,000
Source: Energy Policy and Planning Office. Department of energy
Tho
usan
d to
ns o
f oil
equi
vale
nts
(KT
OE
)
2010 2011 2012 2013 2014 2015*
Industry 52% 49% 45% 43% 47% 50%
PowerGeneration 48% 51% 55% 57% 53% 50%
Total 15,965Thousand Tons
*Jan - Nov
The consumption of imported coal/lignite 2.4%
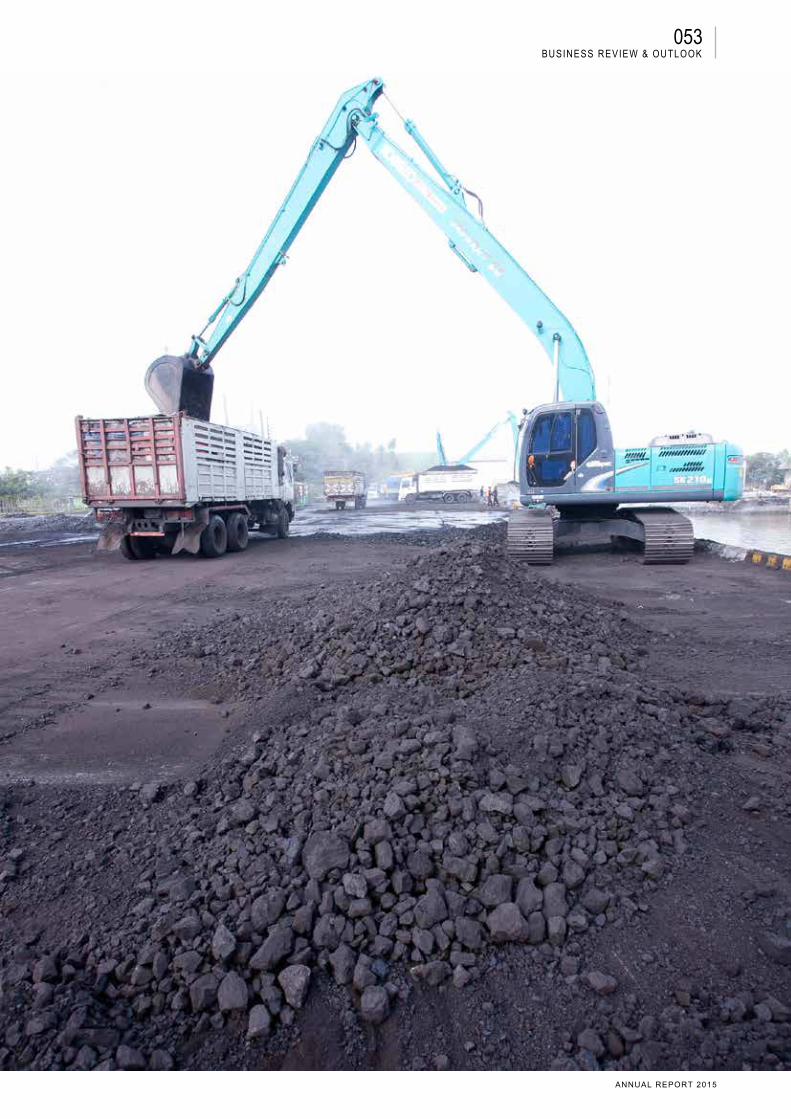
053
ANNUAL REPORT 2015
Business review & outlook

054
THORESEN THAI AGENCIES PLC.
sustainable development and Corporate social responsibility: policy and missionpolicyThoresen Thai Agencies Public Company Limited (“TTA” or the “Company”) adheres to the Corporate Governance (“CG”) under the ethical principles of transparency, equity and verifiability in conducting its business and meets all applicable laws and regulations. TTA also focuses on sustainably promoting well-being for employees and community neighbors, while improving energy conservation and environmental protection. All of these efforts are made to achieve its goal to be Asia’s leading, most trustworthy investment firm. TTA strives to deliver only the best to all external and internal stakeholders including shareholders, employees, business partners, communities and societies by creating balanced and positive aspects of social, economic and environmental dimensions that will lead to the sustainable development of TTA’s business.
054
THORESEN THAI AGENCIES PLC
sustainaBle development & csr

055
ANNUAL REPORT 2015
Economic DimensionThe Sustainable Value Creation concept is adopted as the sustainable business practice of TTA. The ultimate goal of this is to create value for all stakeholders in a balanced manner and provide them with benefits in return that are supportive to all parties and enable them to sustainably grow together with us.
Maintain the balanced investment portfolio and boost growth
Strengths and weaknesses of each business line are reviewed thoroughly and carefully with emphasis on proper risk management while added value and the highest level of benefits are set for all shareholders and stakeholders.
Explore new investments that reflect current circumstances
TTA is determined to seek promising investment opportunit ies and prepare proper investment plans that are of great benefit to all shareholders.
Foster employee development to drive TTA to be an investment company of excellence
TTA considers employees its great asset that is significant to the Company’s success and takes the priority to the enhancement of its employees’ professional skills and talents via a wide range of internal and external training programs.
Social DimensionTTA endeavors to make a sustainable c o n t r i b u t i o n t o s o c i a l a n d environmental development and improves the well-being of Thai people by continuing a diverse range of social and environmental activities. TTA believes that operating a business in a manner that accounts for the commitment to social contribution is a major driver for sustainable development at the organizational, social and national level.
Environmental DimensionAs many of its portfolio of companies heavily rely on natural resources, TTA is committed to maximizing the value of natural resources and minimizing the environmental impacts by using efficient, energy saving and environmentally friendly solutions as well as boosting the environmentally responsible awareness among its employees.
missionTTA’s business management platform is built upon the three dimensions of sustainability that include economic, social and environmental.To ensure that all operations are ideally integrated, business goals and guidelines are identified for all business groups of TTA to follow properly.
The Three Spheres of Sustainability
Environmental
Sustainability
EconomicSocial
Environmental-Economic
Social-Environmental
Economic-Social
055
ANNUAL REPORT 2015
sustainaBle development & csr
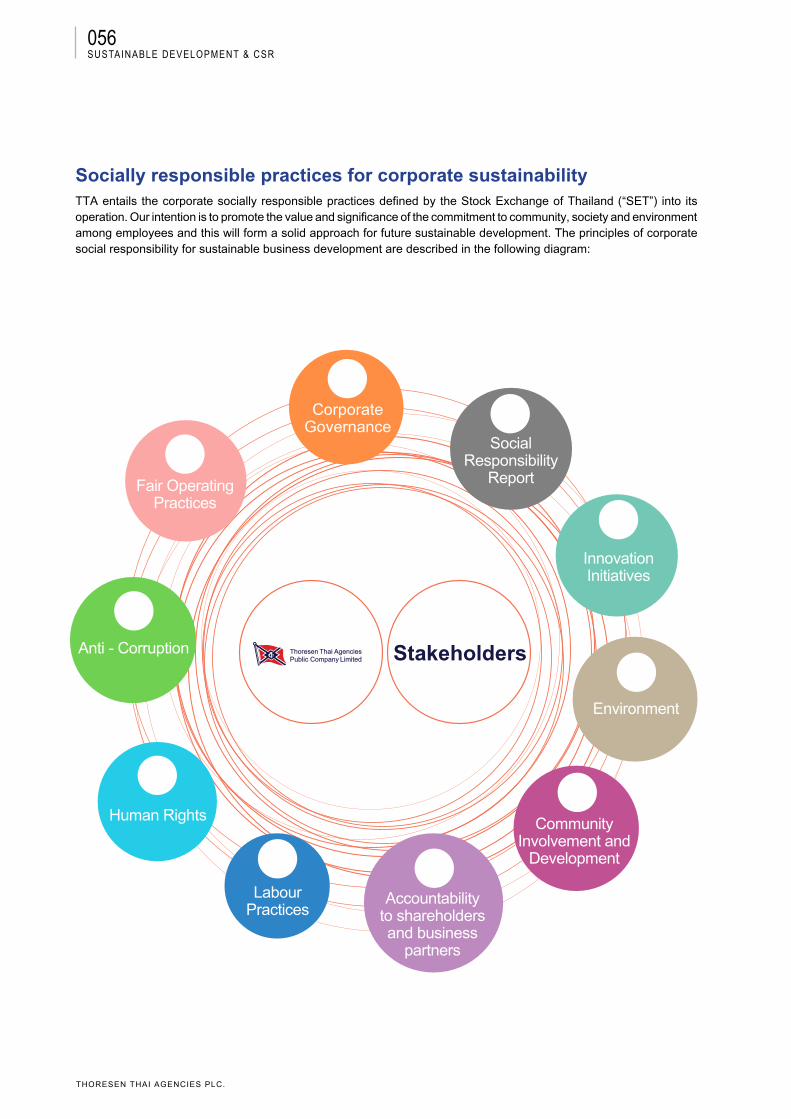
056
THORESEN THAI AGENCIES PLC.
Socially responsible practices for corporate sustainability TTA entails the corporate socially responsible practices defined by the Stock Exchange of Thailand (“SET”) into its operation. Our intention is to promote the value and significance of the commitment to community, society and environment among employees and this will form a solid approach for future sustainable development. The principles of corporate social responsibility for sustainable business development are described in the following diagram:
sustainaBle development & csr
CorporateGovernance
Fair OperatingPractices
Anti - Corruption
Human Rights
LabourPractices
Accountabilityto shareholdersand business
partners
CommunityInvolvement and
Development
Environment
InnovationInitiatives
SocialResponsibility
Report
Stakeholders
4
5 6
7
8
9
10
3
2
1
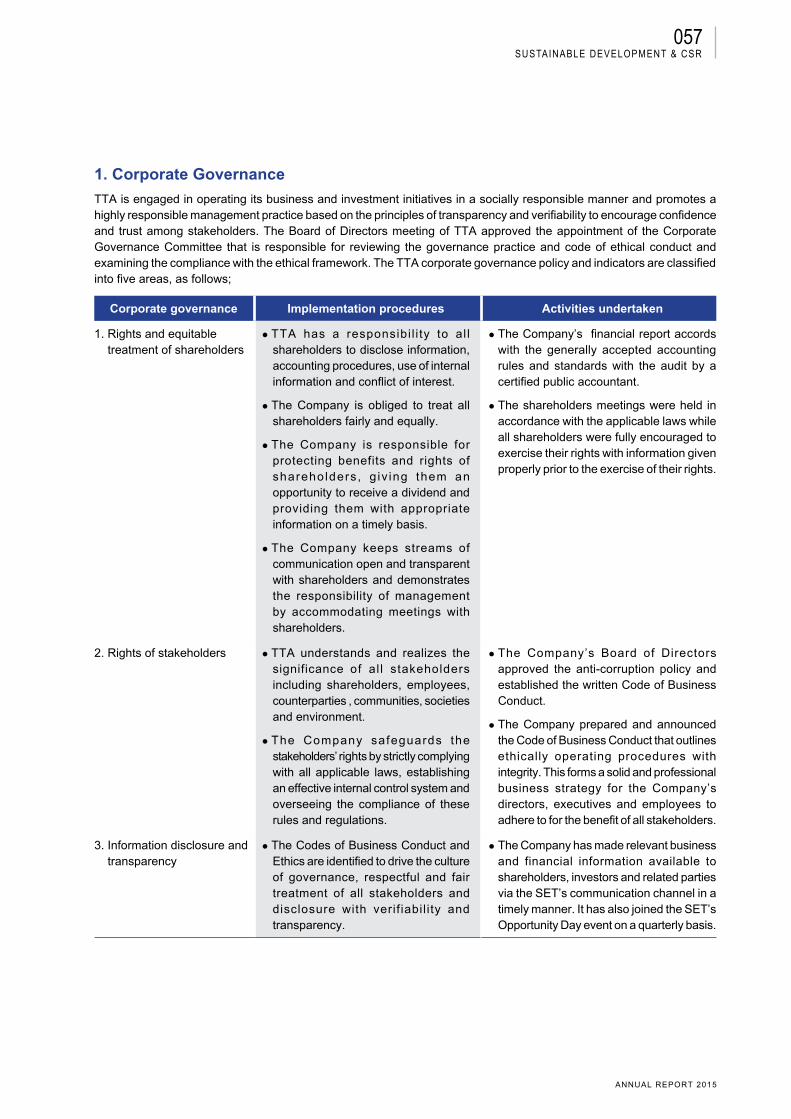
057
ANNUAL REPORT 2015
1. Corporate Governance
TTA is engaged in operating its business and investment initiatives in a socially responsible manner and promotes a highly responsible management practice based on the principles of transparency and verifiability to encourage confidence and trust among stakeholders. The Board of Directors meeting of TTA approved the appointment of the Corporate Governance Committee that is responsible for reviewing the governance practice and code of ethical conduct and examining the compliance with the ethical framework. The TTA corporate governance policy and indicators are classified into five areas, as follows;
Corporate governance Implementation procedures Activities undertaken
1. Rights and equitable treatment of shareholders
TTA has a responsibi l i ty to al l shareholders to disclose information, accounting procedures, use of internal information and conflict of interest.
The Company is obliged to treat all shareholders fairly and equally.
The Company is responsible for protecting benefits and rights of shareholders, g iv ing them an opportunity to receive a dividend and providing them with appropriate information on a timely basis.
The Company keeps streams of communication open and transparent with shareholders and demonstrates the responsibility of management by accommodating meetings with shareholders.
The Company’s financial report accords with the generally accepted accounting rules and standards with the audit by a certified public accountant.
The shareholders meetings were held in accordance with the applicable laws while all shareholders were fully encouraged to exercise their rights with information given properly prior to the exercise of their rights.
2. Rights of stakeholders TTA understands and realizes the significance of al l stakeholders including shareholders, employees, counterparties , communities, societies and environment.
The Company safeguards the stakeholders’ rights by strictly complying with all applicable laws, establishing an effective internal control system and overseeing the compliance of these rules and regulations.
The Company’s Board of Directors approved the anti-corruption policy and established the written Code of Business Conduct.
The Company prepared and announced the Code of Business Conduct that outlines ethically operating procedures with integrity. This forms a solid and professional business strategy for the Company’s directors, executives and employees to adhere to for the benefit of all stakeholders.
3. Information disclosure and transparency
The Codes of Business Conduct and Ethics are identified to drive the culture of governance, respectful and fair treatment of all stakeholders and disclosure with verif iabil ity and transparency.
The Company has made relevant business and financial information available to shareholders, investors and related parties via the SET’s communication channel in a timely manner. It has also joined the SET’s Opportunity Day event on a quarterly basis.
sustainaBle development & csr
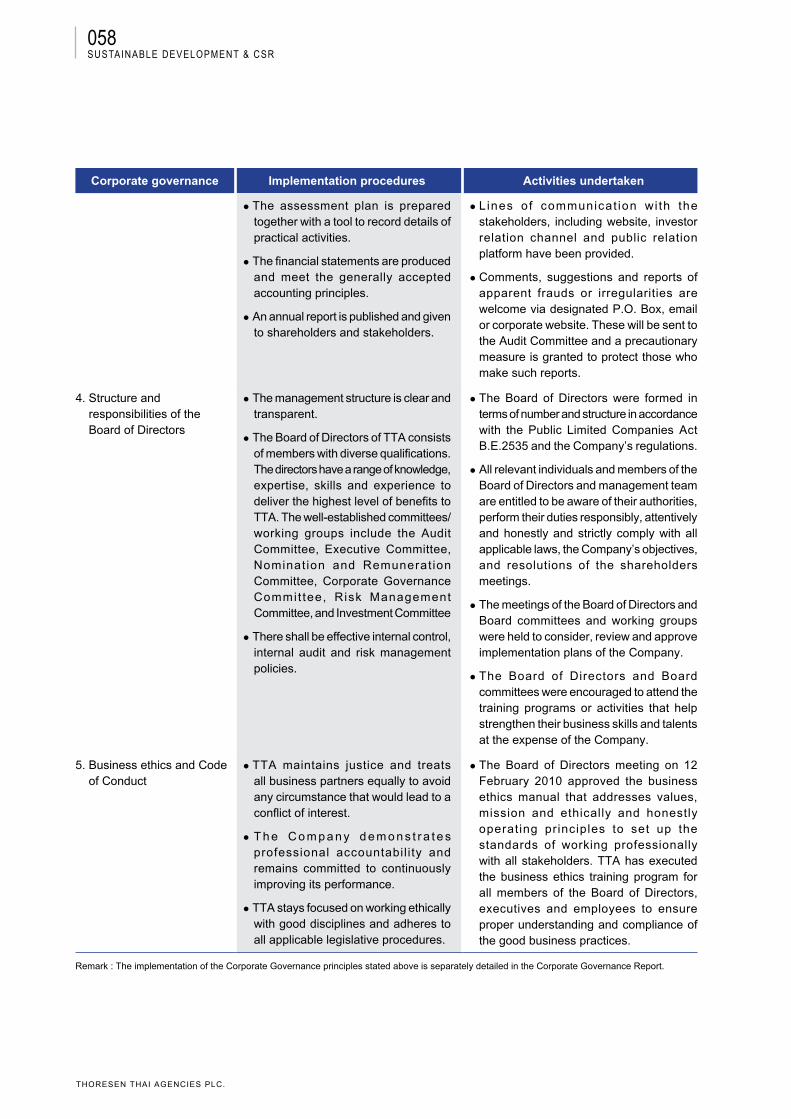
058
THORESEN THAI AGENCIES PLC.
Corporate governance Implementation procedures Activities undertaken
The assessment plan is prepared together with a tool to record details of practical activities.
The financial statements are produced and meet the generally accepted accounting principles.
An annual report is published and given to shareholders and stakeholders.
Lines of communicat ion wi th the stakeholders, including website, investor relation channel and public relation platform have been provided.
Comments, suggestions and reports of apparent frauds or irregularities are welcome via designated P.O. Box, email or corporate website. These will be sent to the Audit Committee and a precautionary measure is granted to protect those who make such reports.
4. Structure and responsibilities of the Board of Directors
The management structure is clear and transparent.
The Board of Directors of TTA consists of members with diverse qualifications. The directors have a range of knowledge, expertise, skills and experience to deliver the highest level of benefits to TTA. The well-established committees/working groups include the Audit Committee, Executive Committee, Nominat ion and Remunerat ion Committee, Corporate Governance Commit tee, Risk Management Committee, and Investment Committee
There shall be effective internal control, internal audit and risk management policies.
The Board of Directors were formed in terms of number and structure in accordance with the Public Limited Companies Act B.E.2535 and the Company’s regulations.
All relevant individuals and members of the Board of Directors and management team are entitled to be aware of their authorities, perform their duties responsibly, attentively and honestly and strictly comply with all applicable laws, the Company’s objectives, and resolutions of the shareholders meetings.
The meetings of the Board of Directors and Board committees and working groups were held to consider, review and approve implementation plans of the Company.
The Board of Directors and Board committees were encouraged to attend the training programs or activities that help strengthen their business skills and talents at the expense of the Company.
5. Business ethics and Code of Conduct
TTA maintains justice and treats all business partners equally to avoid any circumstance that would lead to a conflict of interest.
T h e C o m p a n y d e m o n s t r a t e s professional accountabil i ty and remains committed to continuously improving its performance.
TTA stays focused on working ethically with good disciplines and adheres to all applicable legislative procedures.
The Board of Directors meeting on 12 February 2010 approved the business ethics manual that addresses values, mission and ethically and honestly operating principles to set up the standards of working professionally with all stakeholders. TTA has executed the business ethics training program for all members of the Board of Directors, executives and employees to ensure proper understanding and compliance of the good business practices.
Remark : The implementation of the Corporate Governance principles stated above is separately detailed in the Corporate Governance Report.
sustainaBle development & csr

059
ANNUAL REPORT 2015
2. Fair Business Practices
TTA aims to work and invest ethically and promotes fair business practices. To this end, the operating framework and procedures were announced for all directors, executives and employees to follow.
Fair business practices Implementation procedures Activities undertaken
1. Fair competition The business and investment policies are in line with all applicable laws and regulations.
The Company embraces soc ia l responsibilities in its entire business chain.
TTA’s procurement po l icy and proce dures, taking effect since 2013, outl ine the elimination of unfair competitive advantage.
With its commitment to anti-corruption and anti-bribery, TTA prohibits directors, executives, employees and person who act on behalf of the Company from executing illegitimate or improper activities in order to generate competitive advantage.
2. Social responsibility for business partners
The transparent purchasing guidelines are designed for the sake of the Company’s ultimate benefit. The trade negotiations are made on the basis of accuracy and justice without using power in an unfair trading manner.
The written policy is established, implemented and disclosed to all employees.
3. Anti-corruption
TTA calls for the principles of Corporate Governance and Anti-corruption in its business and investment operations. All subsidiaries of the TTA Group shall adhere to the common guidelines to ensure trust and acceptance from business partners and customers. Directors, executives and employees are encouraged to avoid all formats of misconducts.
Anti-corruption Implementation procedures Activities undertaken
1. Risk management Classify risk types, outline the causes of corruption, take action for prevention and maintain and comply with the anti-corruption measure.
Introduce an accurate and transparent mean of reporting financial status.
The Risk Management Committee and team were established to assess, analyze, follow up and keep the whole risk status at the acceptable and controllable level.
2. Business operation and investment
As part of its business operating rules, directors, executives and employees are prohibited from paying bribes or kickbacks to individuals, government officials or businesses in order to receive improper benefits or have more influence to do business.
TTA prohibits calls for and acceptance of bribery and corruption for the interest of individuals, their families, friends and acquaintances.
TTA declares the anti-bribery and corruption measure and prohibits misconducts or improper activities of its directors, executives and employees in exchange of competitive advantage.
The procedures against corruption are defined in the Code of Business Conduct manual.
3. Endorse and maintain the anti-corruption system
The process and procedures are set up in order to prevent executives and employees from joining or supporting any action that is illegitimate and involves in corruption.
Education about the business ethics policy, rules, regulations and principles are provided for new staff.
Suspected wrongdoing can be reported via website and P.O. Box with fair investigation procedures.
sustainaBle development & csr
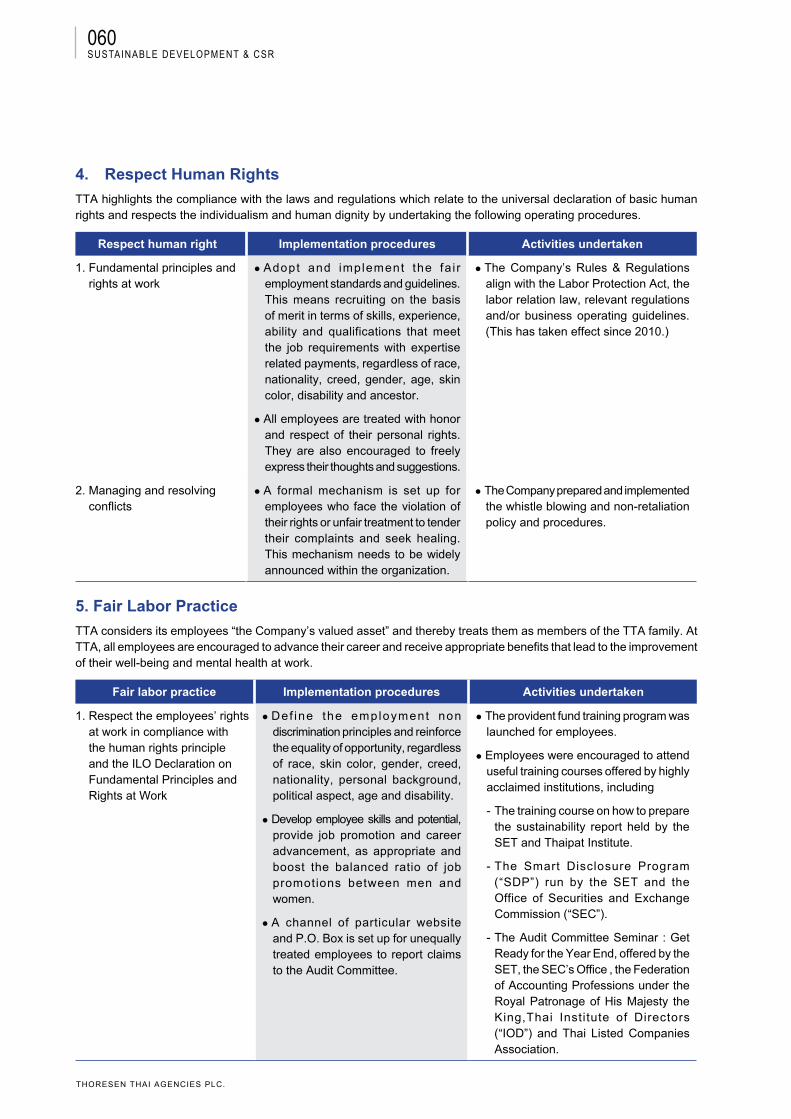
060
THORESEN THAI AGENCIES PLC.
4. Respect Human Rights
TTA highlights the compliance with the laws and regulations which relate to the universal declaration of basic human rights and respects the individualism and human dignity by undertaking the following operating procedures.
Respect human right Implementation procedures Activities undertaken
1. Fundamental principles and rights at work
Adopt and implement the fa i r employment standards and guidelines. This means recruiting on the basis of merit in terms of skills, experience, ability and qualifications that meet the job requirements with expertise related payments, regardless of race, nationality, creed, gender, age, skin color, disability and ancestor.
All employees are treated with honor and respect of their personal rights. They are also encouraged to freely express their thoughts and suggestions.
The Company’s Rules & Regulations align with the Labor Protection Act, the labor relation law, relevant regulations and/or business operating guidelines. (This has taken effect since 2010.)
2. Managing and resolving conflicts
A formal mechanism is set up for employees who face the violation of their rights or unfair treatment to tender their complaints and seek healing. This mechanism needs to be widely announced within the organization.
The Company prepared and implemented the whistle blowing and non-retaliation policy and procedures.
5. Fair Labor Practice
TTA considers its employees “the Company’s valued asset” and thereby treats them as members of the TTA family. At TTA, all employees are encouraged to advance their career and receive appropriate benefits that lead to the improvement of their well-being and mental health at work.
Fair labor practice Implementation procedures Activities undertaken
1. Respect the employees’ rights at work in compliance with the human rights principle and the ILO Declaration on
Fundamental Principles and Rights at Work
Def ine the employment non discrimination principles and reinforce the equality of opportunity, regardless of race, skin color, gender, creed, nationality, personal background, political aspect, age and disability.
Develop employee skills and potential, provide job promotion and career advancement, as appropriate and boost the balanced ratio of job promotions between men and women.
A channel of particular website and P.O. Box is set up for unequally treated employees to report claims to the Audit Committee.
The provident fund training program was launched for employees.
Employees were encouraged to attend useful training courses offered by highly acclaimed institutions, including
-The training course on how to prepare the sustainability report held by the SET and Thaipat Institute.
-The Smart Disclosure Program (“SDP”) run by the SET and the Office of Securities and Exchange Commission (“SEC”).
-The Audit Committee Seminar : Get Ready for the Year End, offered by the SET, the SEC’s Office , the Federation of Accounting Professions under the Royal Patronage of His Majesty the King,Thai Institute of Directors (“IOD”) and Thai Listed Companies Association.
sustainaBle development & csr
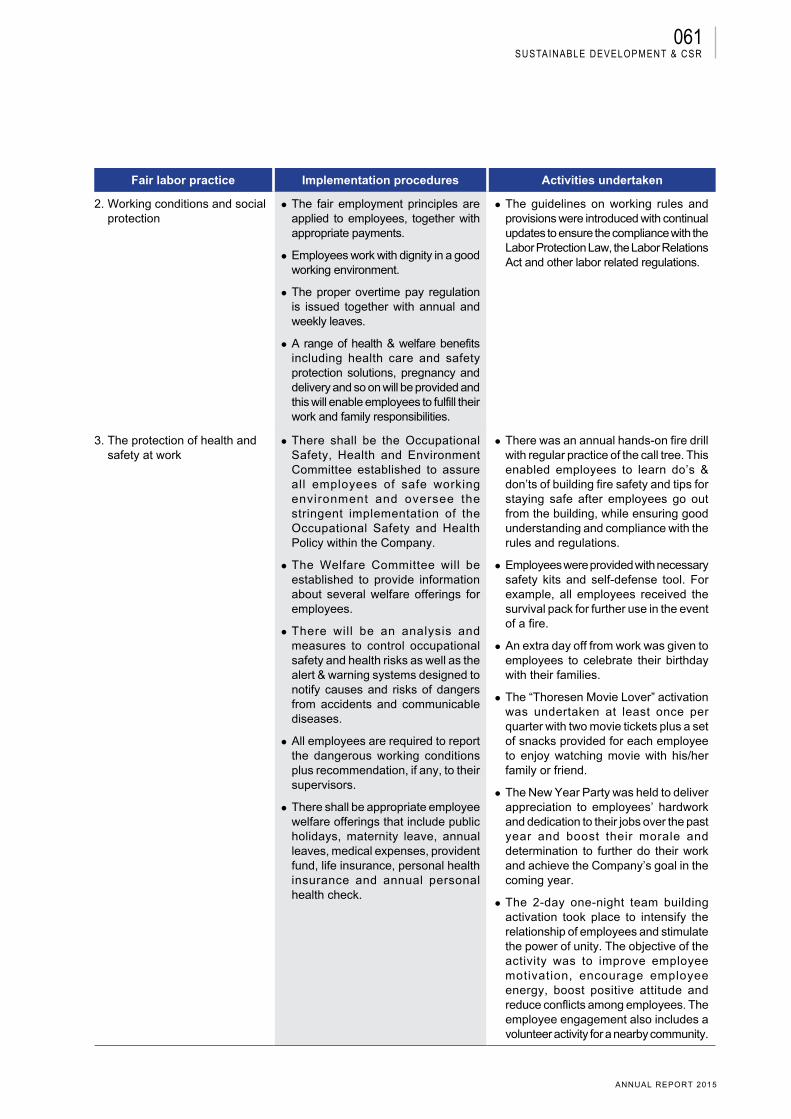
061
ANNUAL REPORT 2015
Fair labor practice Implementation procedures Activities undertaken
2. Working conditions and social protection
The fair employment principles are applied to employees, together with appropriate payments.
Employees work with dignity in a good working environment.
The proper overtime pay regulation is issued together with annual and weekly leaves.
A range of health & welfare benefits including health care and safety protection solutions, pregnancy and delivery and so on will be provided and this will enable employees to fulfill their work and family responsibilities.
The guidelines on working rules and provisions were introduced with continual updates to ensure the compliance with the Labor Protection Law, the Labor Relations Act and other labor related regulations.
3. The protection of health and safety at work
There shall be the Occupational Safety, Health and Environment Committee established to assure all employees of safe working environment and oversee the stringent implementation of the Occupational Safety and Health Policy within the Company.
The Welfare Committee will be established to provide information about several welfare offerings for employees.
There will be an analysis and measures to control occupational safety and health risks as well as the alert & warning systems designed to notify causes and risks of dangers from accidents and communicable diseases.
All employees are required to report the dangerous working conditions plus recommendation, if any, to their supervisors.
There shall be appropriate employee welfare offerings that include public holidays, maternity leave, annual leaves, medical expenses, provident fund, life insurance, personal health insurance and annual personal health check.
There was an annual hands-on fire drill with regular practice of the call tree. This enabled employees to learn do’s & don’ts of building fire safety and tips for staying safe after employees go out from the building, while ensuring good understanding and compliance with the rules and regulations.
Employees were provided with necessary safety kits and self-defense tool. For example, all employees received the survival pack for further use in the event of a fire.
An extra day off from work was given to employees to celebrate their birthday with their families.
The “Thoresen Movie Lover” activation was undertaken at least once per quarter with two movie tickets plus a set of snacks provided for each employee to enjoy watching movie with his/her family or friend.
The New Year Party was held to deliver appreciation to employees’ hardwork and dedication to their jobs over the past year and boost their morale and determination to further do their work and achieve the Company’s goal in the coming year.
The 2-day one-night team building activation took place to intensify the relationship of employees and stimulate the power of unity. The objective of the activity was to improve employee motivation, encourage employee energy, boost positive attitude and reduce conflicts among employees. The employee engagement also includes a volunteer activity for a nearby community.
sustainaBle development & csr
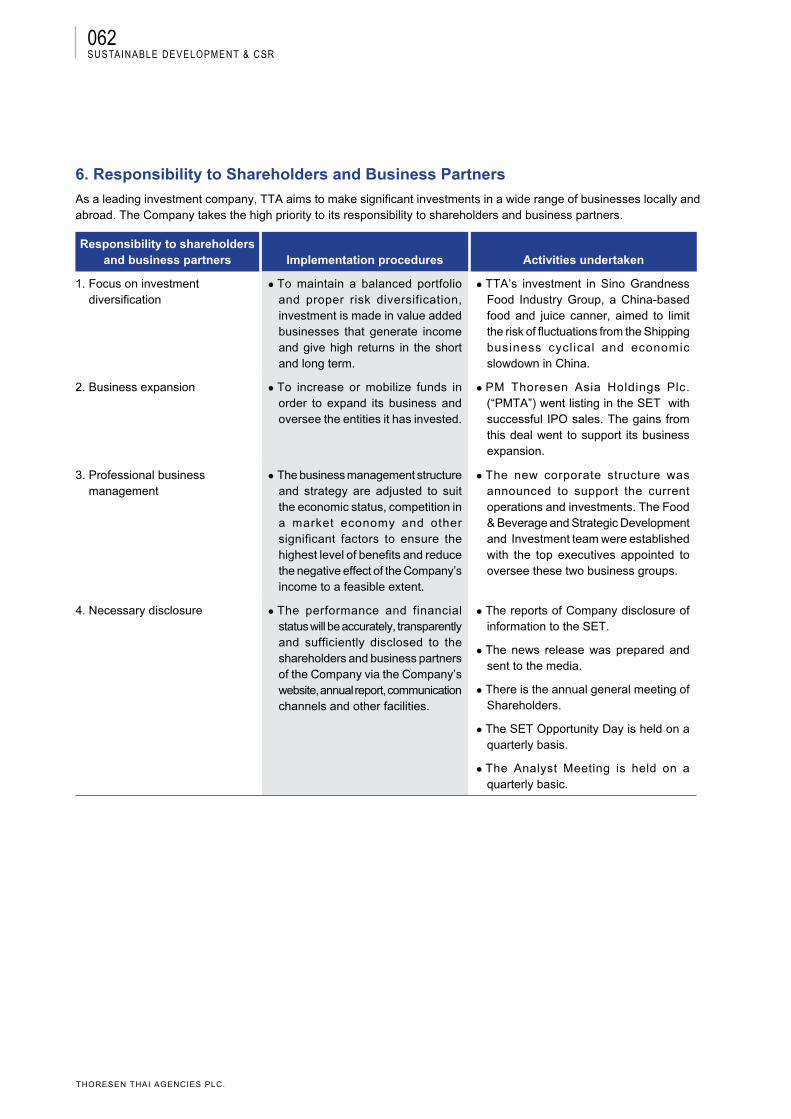
062
THORESEN THAI AGENCIES PLC.
6. Responsibility to Shareholders and Business Partners
As a leading investment company, TTA aims to make significant investments in a wide range of businesses locally and abroad. The Company takes the high priority to its responsibility to shareholders and business partners.
Responsibility to shareholders and business partners Implementation procedures Activities undertaken
1. Focus on investment diversification
To maintain a balanced portfolio and proper risk diversification, investment is made in value added businesses that generate income and give high returns in the short and long term.
TTA’s investment in Sino Grandness Food Industry Group, a China-based food and juice canner, aimed to limit the risk of fluctuations from the Shipping business cyclical and economic slowdown in China.
2. Business expansion To increase or mobilize funds in order to expand its business and oversee the entities it has invested.
PM Thoresen Asia Holdings Plc. (“PMTA”) went listing in the SET with successful IPO sales. The gains from this deal went to support its business expansion.
3. Professional business management
The business management structure and strategy are adjusted to suit the economic status, competition in a market economy and other significant factors to ensure the highest level of benefits and reduce the negative effect of the Company’s income to a feasible extent.
The new corporate structure was announced to support the current operations and investments. The Food & Beverage and Strategic Development and Investment team were established with the top executives appointed to oversee these two business groups.
4. Necessary disclosure The performance and financial status will be accurately, transparently and sufficiently disclosed to the shareholders and business partners of the Company via the Company’s website, annual report, communication channels and other facilities.
The reports of Company disclosure of information to the SET.
The news release was prepared and sent to the media.
There is the annual general meeting of Shareholders.
The SET Opportunity Day is held on a quarterly basis.
The Analyst Meeting is held on a quarterly basic.
sustainaBle development & csr
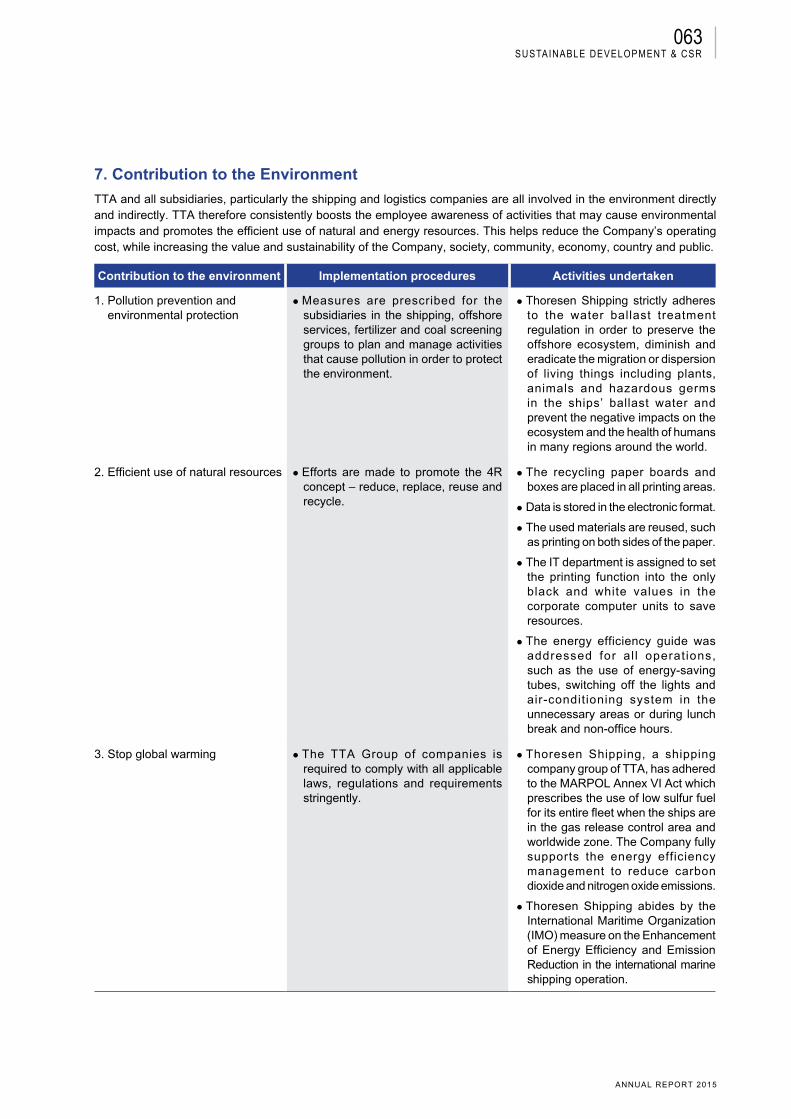
063
ANNUAL REPORT 2015
7. Contribution to the Environment
TTA and all subsidiaries, particularly the shipping and logistics companies are all involved in the environment directly and indirectly. TTA therefore consistently boosts the employee awareness of activities that may cause environmental impacts and promotes the efficient use of natural and energy resources. This helps reduce the Company’s operating cost, while increasing the value and sustainability of the Company, society, community, economy, country and public.
Contribution to the environment Implementation procedures Activities undertaken
1. Pollution prevention and environmental protection
Measures are prescribed for the subsidiaries in the shipping, offshore services, fertilizer and coal screening groups to plan and manage activities that cause pollution in order to protect the environment.
Thoresen Shipping strictly adheres to the water ballast treatment regulation in order to preserve the offshore ecosystem, diminish and eradicate the migration or dispersion of living things including plants, animals and hazardous germs in the ships’ ballast water and prevent the negative impacts on the ecosystem and the health of humans in many regions around the world.
2. Efficient use of natural resources Efforts are made to promote the 4R concept – reduce, replace, reuse and recycle.
The recycling paper boards and boxes are placed in all printing areas.
Data is stored in the electronic format.
The used materials are reused, such as printing on both sides of the paper.
The IT department is assigned to set the printing function into the only black and white values in the corporate computer units to save resources.
The energy efficiency guide was addressed for al l operat ions, such as the use of energy-saving tubes, switching off the lights and air-conditioning system in the unnecessary areas or during lunch break and non-office hours.
3. Stop global warming The TTA Group of companies is required to comply with all applicable laws, regulations and requirements stringently.
Thoresen Shipping, a shipping company group of TTA, has adhered to the MARPOL Annex VI Act which prescribes the use of low sulfur fuel for its entire fleet when the ships are in the gas release control area and worldwide zone. The Company fully supports the energy efficiency management to reduce carbon dioxide and nitrogen oxide emissions.
Thoresen Shipping abides by the International Maritime Organization (IMO) measure on the Enhancement of Energy Efficiency and Emission Reduction in the international marine shipping operation.
sustainaBle development & csr
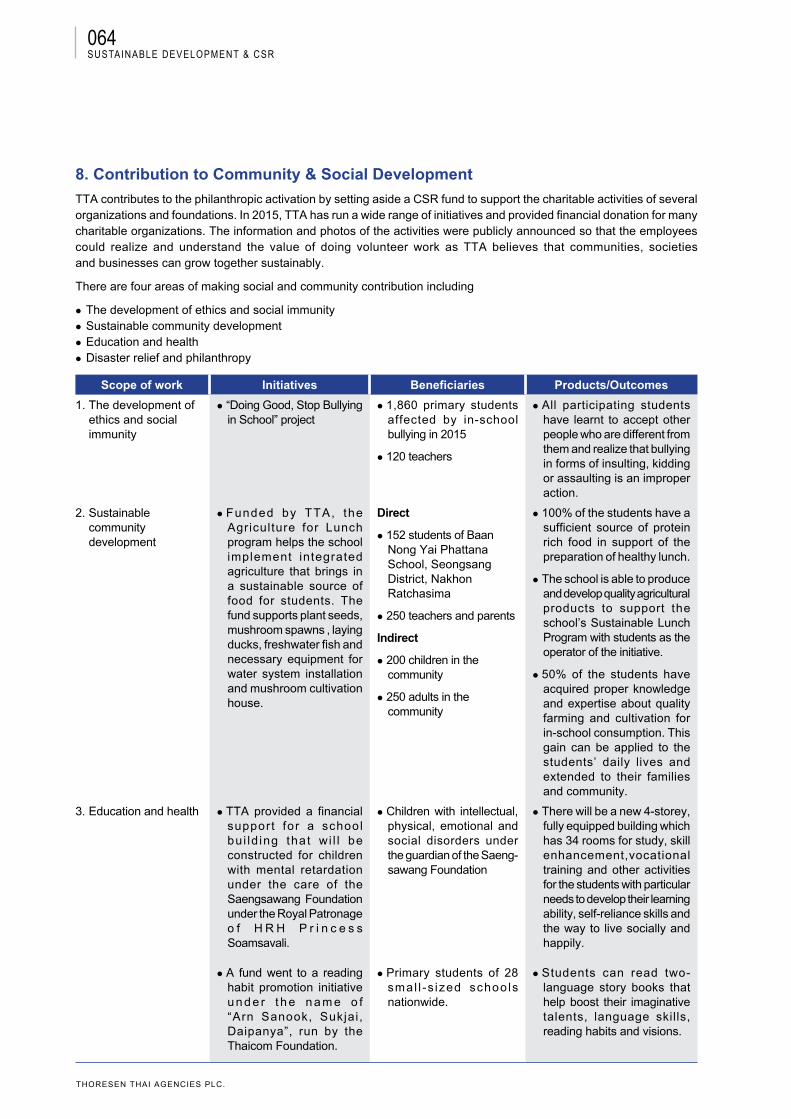
064
THORESEN THAI AGENCIES PLC.
8. Contribution to Community & Social Development
TTA contributes to the philanthropic activation by setting aside a CSR fund to support the charitable activities of several organizations and foundations. In 2015, TTA has run a wide range of initiatives and provided financial donation for many charitable organizations. The information and photos of the activities were publicly announced so that the employees could realize and understand the value of doing volunteer work as TTA believes that communities, societies and businesses can grow together sustainably.
There are four areas of making social and community contribution including
The development of ethics and social immunitySustainable community developmentEducation and healthDisaster relief and philanthropy
Scope of work Initiatives Beneficiaries Products/Outcomes
1. The development of ethics and social immunity
“Doing Good, Stop Bullying in School” project
1,860 primary students affected by in-school bullying in 2015
120 teachers
All participating students have learnt to accept other people who are different from them and realize that bullying in forms of insulting, kidding or assaulting is an improper action.
2. Sustainable community
development
Funded by TTA, the Agriculture for Lunch program helps the school implement integrated agriculture that brings in a sustainable source of food for students. The fund supports plant seeds, mushroom spawns , laying ducks, freshwater fish and necessary equipment for water system installation and mushroom cultivation house.
Direct
152 students of Baan Nong Yai Phattana School, Seongsang District, Nakhon Ratchasima
250 teachers and parents
Indirect
200 children in the community
250 adults in the community
100% of the students have a sufficient source of protein rich food in support of the preparation of healthy lunch.
The school is able to produce and develop quality agricultural products to support the school’s Sustainable Lunch Program with students as the operator of the initiative.
50% of the students have acquired proper knowledge and expertise about quality farming and cultivation for in-school consumption. This gain can be applied to the students’ daily lives and extended to their families and community.
3. Education and health TTA provided a financial support for a school bu i ld ing that wi l l be constructed for children with mental retardation under the care of the Saengsawang Foundation under the Royal Patronage o f H R H P r i n c e s s Soamsavali.
Children with intellectual, physical, emotional and social disorders under the guardian of the Saeng-sawang Foundation
There will be a new 4-storey, fully equipped building which has 34 rooms for study, skill enhancement,vocational training and other activities for the students with particular needs to develop their learning ability, self-reliance skills and the way to live socially and happily.
A fund went to a reading habit promotion initiative u n d e r t h e n a m e o f “Arn Sanook, Sukjai, Daipanya”, run by the Thaicom Foundation.
Primary students of 28 smal l -s ized schools nationwide.
Students can read two-language story books that help boost their imaginative talents, language skills, reading habits and visions.
sustainaBle development & csr
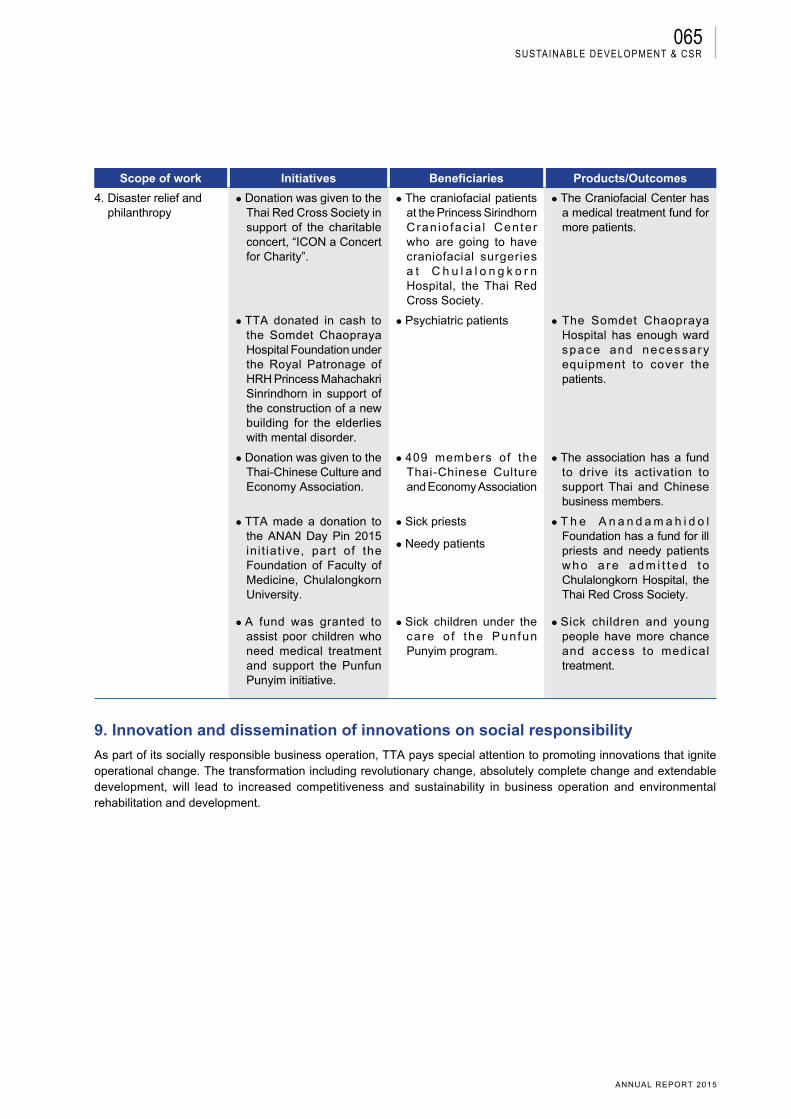
065
ANNUAL REPORT 2015
Scope of work Initiatives Beneficiaries Products/Outcomes
4. Disaster relief and philanthropy
Donation was given to the Thai Red Cross Society in support of the charitable concert, “ICON a Concert for Charity”.
The craniofacial patients at the Princess Sirindhorn Cran io fac ia l Center who are going to have craniofacial surgeries a t C h u l a l o n g k o r n Hospital, the Thai Red Cross Society.
The Craniofacial Center has a medical treatment fund for more patients.
TTA donated in cash to the Somdet Chaopraya Hospital Foundation under the Royal Patronage of HRH Princess Mahachakri Sinrindhorn in support of the construction of a new building for the elderlies with mental disorder.
Psychiatric patients The Somdet Chaopraya Hospital has enough ward space and necessary equipment to cover the patients.
Donation was given to the Thai-Chinese Culture and Economy Association.
409 members of the Thai-Chinese Culture and Economy Association
The association has a fund to drive its activation to support Thai and Chinese business members.
TTA made a donation to the ANAN Day Pin 2015 ini t iat ive, part of the Foundation of Faculty of Medicine, Chulalongkorn University.
Sick priests
Needy patients
T h e A n a n d a m a h i d o l Foundation has a fund for ill priests and needy patients w h o a r e a d m i t t e d t o Chulalongkorn Hospital, the Thai Red Cross Society.
A fund was granted to assist poor children who need medical treatment and support the Punfun Punyim initiative.
Sick children under the care o f the Punfun Punyim program.
Sick children and young people have more chance and access to medical treatment.
9. Innovation and dissemination of innovations on social responsibility
As part of its socially responsible business operation, TTA pays special attention to promoting innovations that ignite operational change. The transformation including revolutionary change, absolutely complete change and extendable development, will lead to increased competitiveness and sustainability in business operation and environmental rehabilitation and development.
sustainaBle development & csr
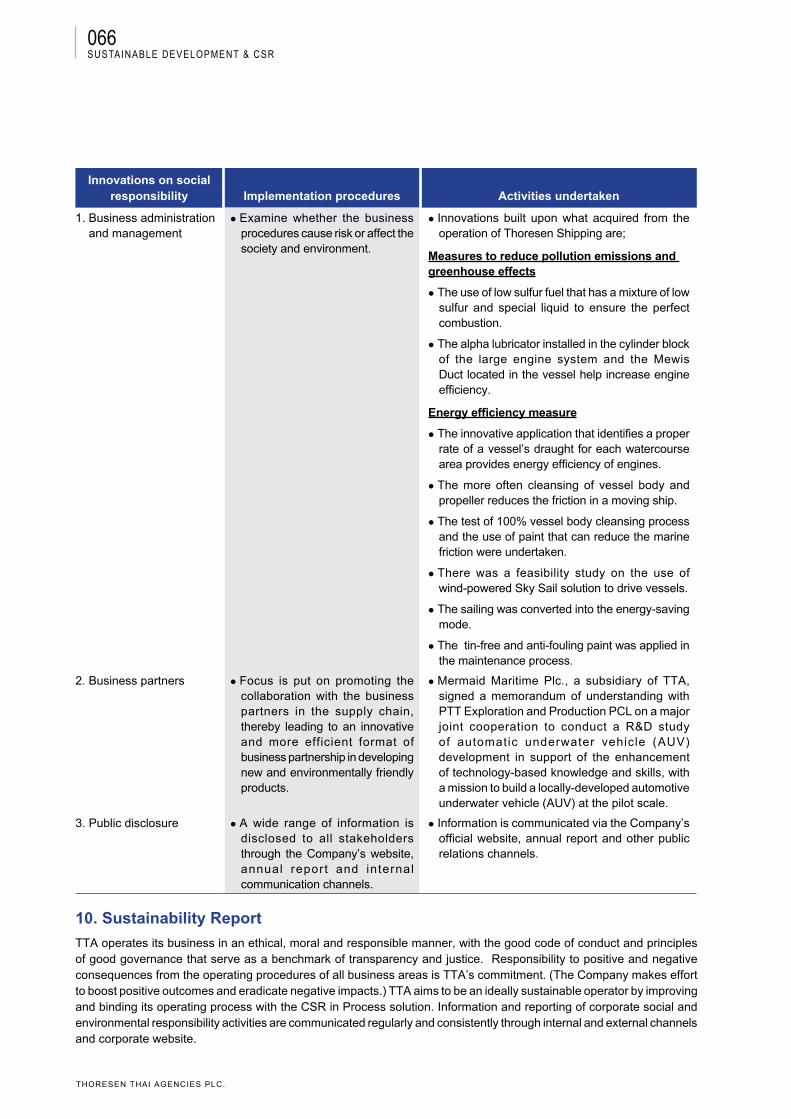
066
THORESEN THAI AGENCIES PLC.
Innovations on social responsibility Implementation procedures Activities undertaken
1. Business administration and management
Examine whether the business procedures cause risk or affect the society and environment.
Innovations built upon what acquired from the operation of Thoresen Shipping are;
Measures to reduce pollution emissions and greenhouse effects
The use of low sulfur fuel that has a mixture of low sulfur and special liquid to ensure the perfect combustion.
The alpha lubricator installed in the cylinder block of the large engine system and the Mewis Duct located in the vessel help increase engine efficiency.
Energy efficiency measure
The innovative application that identifies a proper rate of a vessel’s draught for each watercourse area provides energy efficiency of engines.
The more often cleansing of vessel body and propeller reduces the friction in a moving ship.
The test of 100% vessel body cleansing process and the use of paint that can reduce the marine friction were undertaken.
There was a feasibility study on the use of wind-powered Sky Sail solution to drive vessels.
The sailing was converted into the energy-saving mode.
The tin-free and anti-fouling paint was applied in the maintenance process.
2. Business partners Focus is put on promoting the collaboration with the business partners in the supply chain, thereby leading to an innovative and more efficient format of business partnership in developing new and environmentally friendly products.
Mermaid Maritime Plc., a subsidiary of TTA, signed a memorandum of understanding with PTT Exploration and Production PCL on a major joint cooperation to conduct a R&D study of automatic underwater vehicle (AUV) development in support of the enhancement of technology-based knowledge and skills, with a mission to build a locally-developed automotive underwater vehicle (AUV) at the pilot scale.
3. Public disclosure A wide range of information is disclosed to all stakeholders through the Company’s website, annual report and internal communication channels.
Information is communicated via the Company’s official website, annual report and other public relations channels.
10. Sustainability Report
TTA operates its business in an ethical, moral and responsible manner, with the good code of conduct and principles of good governance that serve as a benchmark of transparency and justice. Responsibility to positive and negative consequences from the operating procedures of all business areas is TTA’s commitment. (The Company makes effort to boost positive outcomes and eradicate negative impacts.) TTA aims to be an ideally sustainable operator by improving and binding its operating process with the CSR in Process solution. Information and reporting of corporate social and environmental responsibility activities are communicated regularly and consistently through internal and external channels and corporate website.
sustainaBle development & csr
067
ANNUAL REPORT 2015
Corporate Governance (“CG”) is a structure and process of relationships between a company’s management,
Board of Directors (“Board”), and its shareholders with underlying objectives to enhance its long-term competitiveness and value to shareholders.
At the Board meeting of Thoresen Thai Agencies Public Company Limited (the “Company” or “TTA”) on 28 November 2011, the Board established a Corporate Governance Committee (“CGC”) to review corporate governance practices and the Code of Business Conduct and to monitor compliance of the practices so that it remains within an ethical framework.
The CGC reviewed the Company’s Corporate Governance Policy, which was approved by the Board on 24 December 2012.
TTA’s corporate governance principles are as follows:
Rule of law: Management and operations shall be in line with relevant laws, charters, regulations, and Board resolutions
Accountability: All concerned parties, including the Board and management have to be aware of their duties and responsibilities
Transparency: Business activities and operations shall be auditable and transparent
Participation: Recognition of the rights of shareholders and stakeholders to participate in company activities
Value for money: All investments and resource utilization must meet targeted financial and economic returns
The main components of TTA’s Corporate Governance Policy set in accordance with the guidelines of the Stock Exchange of Thailand (“SET”) are as follows:
1. Rights of Shareholders2. Equitable Treatment of Shareholders3. Role of Stakeholders4. Information Disclosure and Transparency 5. Structure and Responsibilities of the Board of Directors
The CGC has reviewed this report and is of the opinion that TTA has generally followed the corporate governance practices discussed herein.
The CG practices for the financial period ended 31 December 2015 were as follows:
1. Rights of ShareholdersTTA is accountable and recognizes the duty to ensure fair treatment to all shareholders to safeguard their rights, TTA complies with all applicable laws and regulations and has established adequate internal controls and auditing systems to monitor compliance.
SHAREHOLDERS’ MEETINGS
TTA conducts shareholders’ meetings in accordance with applicable laws and generally accepted practices, which allow shareholders to exercise their rights fully and in an informed manner. Within four (4) months after our financial year-end, TTA organizes an Annual General Meeting of Shareholders (“AGM”) which is conducted in accordance with applicable laws and SET requirements, from the calling of the meeting, the notification of the meeting agendas, the dispatch of meeting materials, the conduct of the meeting, and the distribution of minutes. Besides the mentioned general shareholder’s meeting, for urgent matters that affect or involve the shareholders’ interest or involve conditions, regulations, or laws that require the shareholders’ approval, an Extraordinary General Meeting of Shareholders (“EGM”) shall be called on a case by case basis.
In addition, TTA publishes the notice of each meeting in at least one Thai language and one English language in a daily newspaper for three (3) consecutive days no later than three (3) days prior to each AGM. The Company also publishes the meeting notice on TTA’s website at http://www.thoresen.com.
In FY 2014, TTA held the Annual General Meeting of Shareholders (the “1/2015 AGM”) on 28 January 2015 at 1:30 P.M., at Athenee Crystal Hall, 3rd Floor, Plaza Athenee Bangkok, No. 61 Wireless Road (Witthayu) Bangkok 10330, Thailand.
TTA also held the second Annual General Meeting of Shareholders (the “2/2015 AGM”) for the three-month period ended 31 December 2014 on 27 April 2015 at 1:30 P.M., at Athenee Crystal Hall, 3rd Floor, Plaza Athenee Bangkok, No. 61 Wireless Road (Witthayu) Bangkok 10330, Thailand, due to the change of financial period from 1 October to 30 September of each year to 1 January to 31 December of each year as per the shareholders resolutions at the 1/2015 AGM. The first new financial period ended 31 December 2014 commenced from 1 October 2014 to 31 December 2014. TTA did not arrange an EGM in the financial year 2015 ended 31 December 2015 (1 January - 31 December 2015).
Procedures for the shareholders’ meeting were as follows:
(i) Procedures prior to the meeting
In FY 2014, at the Board of Directors meeting held on 22 December 2014, the Board resolved to have the 1/2015 AGM on 28 January 2015 at 1:30 P.M., at Athenee Crystal Hall, 3rd Floor, Plaza Athenee Bangkok, No. 61 Wireless Road (Witthayu) Bangkok 10330, Thailand.
At the Board of Directors meeting held on 17 March 2015, the Board resolved to have the 2/2015 AGM on 27 April 2015 at 1:30 P.M., at Athenee Crystal Hall, 3rd Floor, Plaza
Corporate governance reportcorporate Governance report

068
THORESEN THAI AGENCIES PLC.
Athenee Bangkok, No. 61 Wireless Road (Witthayu) Bangkok 10330, Thailand for the three-month financial year ended 31 December 2014.
The meeting venue was easily accessible through public transportation systems and convenient for shareholders to travel to the place of the meeting. The Company informed the shareholders of the date, time, place, and meeting agendas together with the rationales or details of all Board resolutions on each agenda via SET’s ELCID on the following day after the Board resolved to call the shareholders’ meeting.
TTA uses the shareholders record date to ensure sufficient time to scrutinize meeting notice or request additional information ahead of the meetings. The notice and relevant documents to the 1/2015 AGM were sent to shareholders and the SET on 7 January 2015, and the notice and relevant documents of the 2/2015 AGM were sent to shareholders and the SET on 7 April 2015, which was at least fourteen (14) days prior to the meeting. Going forward, the Company will make best efforts to send all meeting notices to shareholders more than fourteen (14) days prior to the meeting as per the SET’s best practices. The notice was also made available on TTA’s website in advance so that shareholders had sufficient time to study the information to make their decisions. Each agenda included the opinion of the Board.
The Company encourages all shareholders including institutional investors to attend the Company’s shareholders’ meetings. Apart from direct mailings, the Company notified its shareholders via SET’s ELCID that the notice of 1/2015 and 2/2015 AGM and relevant documents were available to download on the Company’s website at http://www.thoresen.com on 9 January and 8 April 2015, respectively.
The Company also advertises the meeting notice in at least one Thai language and one English language in a daily newspaper for three (3) consecutive days no later than three (3) days prior to the shareholders’ meeting date. The notice of the 1/2015 AGM was advertised on 21-23 January 2015 and the notice of the 2/2015 AGM was also advertised in both Thai and English languages on 8 - 10 April 2015.
In addition, details such as time and place of the meeting, the meeting agendas with rationale and opinion of the Board on each agenda item in the notice of the annual general meeting, proxy forms, and a list of documents required for attending the meeting were distributed to shareholders in advance of meeting to assist them in exercising their rights and casting their votes on each agenda item.
(ii) At the shareholders’ meeting
In the shareholders’ meeting, TTA facilitated registration by separating lines between shareholders and proxy holders. TTA used a bar code system to register meeting attendees and to count votes. Envelopes were made readily available for shareholders to mail their proxy forms. The e-voting programme of the Thailand Securities Depository Co., Ltd. (“TSD”) was also used in the registration and vote count, increasing efficiency and transparency.
(iii) During the meeting
The Chairman of the Board of Directors (“Chairman”) presides over the shareholders’ meeting. For shareholders’ convenience and clarification, multimedia presentations are shown during all meetings. TTA conducts the meeting in accordance with the agenda and offers an equal opportunity for each shareholder to cast their vote.
In the 1/2015 AGM which held on 28 January 2015 and the 2/2015 AGM which held on 27 April 2015, legal advisors from HNP Counsellors Limited were engaged to act as independent inspectors to monitor the registration and the counting of votes, and in both of the AGMs, the Chairman asked for two shareholders to bear witness to the vote counting, to ensure the meeting was transparent and complied with applicable laws.
TTA has been rated “Excellent” (scores ranging between 90-99) from the Corporate Governance Report of Thai Listed Companies for the quality of AGM arrangement since 2007. In 2015, TTA was rated Excellent, with a score for the quality of the 2/2015 AGM arrangement, held on 27 April 2015, of 98.00 points/1, an increase from that of 2014 of 96.125 points. The Company’s score was higher than the average score of all 575 listed companies participating. The assessment results were based on the assessment form conducted by the Thai Investors Association (“TIA”) in conjunction with the Securities and Exchange Commission (“SEC”) and the Listed Companies Association.
Note: /1 There was no assessment for the 1/2015 AGM which held on 28 January 2015 as TIA and SEC evaluated the quality of the latest AGM which was the 2/2015 AGM only.
(iv) Procedures following the meeting
The Company submitted to the SET the resolutions of the shareholders’ meeting with details of voting results of each agenda through the SET’s ELCID and also posted the resolutions immediately on TTA’s website at http://www.thoresen.com.
corporate Governance report
069
ANNUAL REPORT 2015
The Company prepared and submitted the minutes of 1/2015 and 2/2015 AGMs to the SET and the Department of Business Development, Ministry of Commerce within the required timeframe after the meeting. The minutes were also posted on TTA’s website.
2. Equitable Treatment of Shareholders
2.1 Equitable Treatment
TTA is accountable to its shareholders in terms of information disclosure, accounting methods, use of insider information, and conflict of interest.
TTA recognizes the duty to ensure fair treatment to all shareholders. TTA has a duty to protect shareholders’ benefits and rights, which include, among other things, the rights to receive dividends and obtain relevant and adequate information from the Company on a regular and timely basis. TTA also has a duty to disseminate transparent information and ensure management accountability through shareholders’ meeting arrangements.
Each shareholder shall receive, prior to any shareholders’ meeting, complete and sufficient information concerning the proposed agenda attached to the meeting notice.
All shareholders are given proxy forms, allowing them to appoint their authorized representative or select an independent director to attend and vote at the meetings on their behalf.
2.2 Prevention of Improper Use of Internal Information
The Board prohibits directors, executives, and employees from using an opportunity or information acquired while working in their positions to seek personal benefit or to establish a competing or related business with TTA. This includes a complete prohibition against using material insider information to buy or sell TTA’s shares and securities for their own interest and against giving insider information to other persons or entities to buy or sell TTA’s shares and securities.
The Company requires that directors and executives report trading transactions in TTA’s shares and securities, and their ownership position, whenever changes occur. The directors and executives shall notify the Company of their trading transactions on the same day on which the report is submitted to the Office of the Securities and Exchange Commission. The company prohibits all directors and senior executives from trading TTA’s shares and securities during the period of three (3) weeks before the release of our quarterly and annual financial results (the “Blackout Period”). This prohibition applies to entities in which our directors have a beneficial interest, are employed by, or act as a representative thereof. The Company Secretary
will remind directors and executives about the restriction at least seven (7) days in advance of the Blackout Period.
2.3 Information Disclosure of Stakeholders
Since 2009, directors and executives have been required to submit a report that summarizes the directorship and the securities ownership in other companies together with such a report of their related persons. This information is filed at TTA for monitoring potential related party or connected transactions. New TTA directors and senior executives shall submit this report within thirty (30) days after being appointed.
In case there are changes in related persons and close relatives, directors and executives shall submit a revised report to TTA within fourteen (14) days after changes occurred.
Directors, executives, and employees must refrain from any transactions that may lead to a conflict of interest with TTA. Any interested directors, executives, and employees are not allowed to participate in the decision-making process. In particular, directors are prohibited from considering or casting their votes on matters in which they may have a potential conflict of interest.
3. Roles of Stakeholders
3.1 Rights of Stakeholders
(A) SHAREHOLDERS
TTA always makes an effort to maximize shareholders’ long-term benefits through careful consideration of business risks. TTA shall fairly and transparently disclose all information in a timely manner and use best efforts to protect the Company’s assets and reputation.
Besides the basic rights of shareholders and the rights stipulated by law and the Articles of Association, such as the right to request a verification of the number of shares; the right to receive share certificates; the right to attend and vote at the shareholders’ meetings; the right to freely express opinions at the shareholders’ meetings; and the right to receive a fair return; TTA also gives shareholders the right, as the owners of the Company, to make suggestions and comments on the Company’s affairs to the independent directors. Each comment and suggestion will be carefully considered and presented to the Board.
(B) EMPLOYEES
Employees are regarded as valuable assets of the Company. TTA continually seeks to recruit and retain capable and experienced employees in accordance with the Company’s strategic and operating plans, focusing on retention of employees by creating a work-life balance for
corporate Governance report
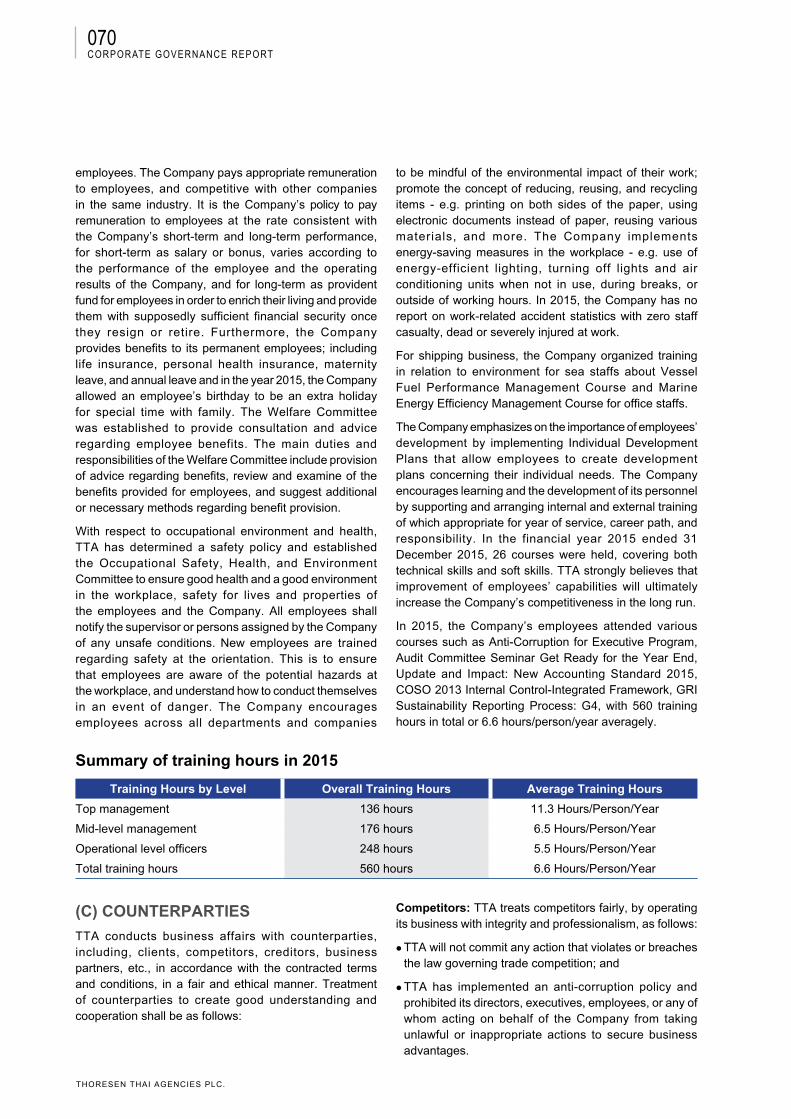
070
THORESEN THAI AGENCIES PLC.
employees. The Company pays appropriate remuneration to employees, and competitive with other companies in the same industry. It is the Company’s policy to pay remuneration to employees at the rate consistent with the Company’s short-term and long-term performance, for short-term as salary or bonus, varies according to the performance of the employee and the operating results of the Company, and for long-term as provident fund for employees in order to enrich their living and provide them with supposedly sufficient financial security once they resign or retire. Furthermore, the Company provides benefits to its permanent employees; including life insurance, personal health insurance, maternity leave, and annual leave and in the year 2015, the Company allowed an employee’s birthday to be an extra holiday for special time with family. The Welfare Committee was established to provide consultation and advice regarding employee benefits. The main duties and responsibilities of the Welfare Committee include provision of advice regarding benefits, review and examine of the benefits provided for employees, and suggest additional or necessary methods regarding benefit provision.
With respect to occupational environment and health, TTA has determined a safety policy and established the Occupational Safety, Health, and Environment Committee to ensure good health and a good environment in the workplace, safety for lives and properties of the employees and the Company. All employees shall notify the supervisor or persons assigned by the Company of any unsafe conditions. New employees are trained regarding safety at the orientation. This is to ensure that employees are aware of the potential hazards at the workplace, and understand how to conduct themselves in an event of danger. The Company encourages employees across all departments and companies
to be mindful of the environmental impact of their work; promote the concept of reducing, reusing, and recycling items - e.g. printing on both sides of the paper, using electronic documents instead of paper, reusing various materials, and more. The Company implements energy-saving measures in the workplace - e.g. use of energy-efficient lighting, turning off lights and air conditioning units when not in use, during breaks, or outside of working hours. In 2015, the Company has no report on work-related accident statistics with zero staff casualty, dead or severely injured at work.
For shipping business, the Company organized training in relation to environment for sea staffs about Vessel Fuel Performance Management Course and Marine Energy Efficiency Management Course for office staffs.
The Company emphasizes on the importance of employees’ development by implementing Individual Development Plans that allow employees to create development plans concerning their individual needs. The Company encourages learning and the development of its personnel by supporting and arranging internal and external training of which appropriate for year of service, career path, and responsibility. In the financial year 2015 ended 31 December 2015, 26 courses were held, covering both technical skills and soft skills. TTA strongly believes that improvement of employees’ capabilities will ultimately increase the Company’s competitiveness in the long run.
In 2015, the Company’s employees attended various courses such as Anti-Corruption for Executive Program, Audit Committee Seminar Get Ready for the Year End, Update and Impact: New Accounting Standard 2015, COSO 2013 Internal Control-Integrated Framework, GRI Sustainability Reporting Process: G4, with 560 training hours in total or 6.6 hours/person/year averagely.
Summary of training hours in 2015
Training Hours by Level Overall Training Hours Average Training Hours
Top management 136 hours 11.3 Hours/Person/Year
Mid-level management 176 hours 6.5 Hours/Person/Year
Operational level officers 248 hours 5.5 Hours/Person/Year
Total training hours 560 hours 6.6 Hours/Person/Year
(C) COUNTERPARTIES
TTA conducts business affairs with counterparties, including, clients, competitors, creditors, business partners, etc., in accordance with the contracted terms and conditions, in a fair and ethical manner. Treatment of counterparties to create good understanding and cooperation shall be as follows:
Competitors: TTA treats competitors fairly, by operating its business with integrity and professionalism, as follows:
TTA will not commit any action that violates or breaches the law governing trade competition; and
TTA has implemented an anti-corruption policy and prohibited its directors, executives, employees, or any of whom acting on behalf of the Company from taking unlawful or inappropriate actions to secure business advantages.
corporate Governance report
071
ANNUAL REPORT 2015
Creditors: TTA is always committed to maintaining sustainable relationships with its creditors with fair and equitable policy, by providing accurate, transparent, and traceable information for the creditors, and strictly adhering to the terms and conditions made with creditors, in terms of payment of the principal, interest, and fees, maintenance of the financial ratio, and other conditions. If TTA fails to comply with any such condition, the Company will promptly notify the creditor, in order to mutually agree on a solution. During the last year, there was no payment default occurred.
Business Partners: TTA sets criteria for choosing a business partner or a service provider, to ensure that the business strategy of a potential service provider is consistent with that of the Company, in terms of competitiveness, business continuity, protection and treatment of clients, and risk management approaches. The criteria for choosing a service provider are as follows:
Technical skills, including expertise and experience;Financial position;Business reputation;History on complaints and legal actions;Service policies;Risks posed by provision of services to several clients;Security and environment; andAnti-corruption efforts.
In turn, the Company treats its service providers fairly.
(D) CLIENTS
The Company recognizes that clients are crucial to the success of its operations. Accordingly, the Company aims at building clients’ satisfaction, provided with high-quality services that meet their needs and expectations in a fair and professional manner. The Company’s policy and practices on the treatment of clients as specified in the Code of Business Conduct are as follows:
Deliver quality services and goods as client’s satisfaction;
Provide accurate and complete information regarding the goods and services of the Company in a timely manner;
Strictly follow the terms and conditions agreed upon with the client;
Treat customers politely and effectively to gain their trust; and
Keep the client’s secrets confidential, and avoid using them to gain benefits for oneself or other persons.
(E) RESPONSIBILITY TO THE COMMUNITY, SOCIETY, AND ENVIRONMENT
TTA emphasizes on the most effective use of natural resources with the least environmental effect. TTA employs technology and develops work process that are environmentally-friendly, while raising awareness of effects of employee’s performance towards the environment to employees. The Company believes that to progress and grow in a sustainable manner, a business must develop its organization, taking into account responsibility to society and the environment. Details on the Company’s responsibility to community, society, and environment can be found under the heading “Sustainable Development and Corporate Social Responsibility: Policy and Mission”.
3.2 Anti-Corruption Efforts
TTA conducts business with strong ethics and responsibility for all concerned parties. The Board has approved the Anti-Corruption Policy as a guideline for anti-corruption practices. In addition, practices of anti-corruption have been collated since 2010 and published to provide guidelines for anti-corruption. These practices are in line with the Company’s Anti-Corruption Policy.
The Company published its anti-corruption policies internally to employee through TTA’s Intranet and also communicated the policies to Directors and management. An internal control system has been put into place to fight corruption and protect against corruption within TTA. It has set policy, criteria, and control processes such as the delegation of authorities in approving various types of transactions, the Company also set up procurement policies to prevent corruption in procurement by determining procedures of purchasing, power of procurement division and sub-committee who were engaged in good receiving.
TTA set up Risk Management division to estimate all potential risks, including risks on corruption, proceedings of risk management policies, follow-up the risk management policies and maintain appropriate frameworks, risk management structure and all recommendations. For internal control, the internal audit conducts the system of internal control every year to ensure an appropriate mandate of internal audit for the company’s business operation.
3.3 Measures against Corruption and Bribery
The Company has provided clear guidelines in the Code of Business Conduct on receiving gifts and entertainment. No gift, favor, or entertainment should be accepted or given, if it obligates or might be perceived as an attempt to influence fair judgement.
corporate Governance report
072
THORESEN THAI AGENCIES PLC.
No director, manager, employee, and their family members should accept or receive a gift or entertainment if it is (i) not consistent with customary business practices, (ii) extravagant in value, (iii) can be construed as a kickback, bribe, or payoff in violation of any laws, and (iv) violates any other laws or regulations.
3.4 Whistle blowing Procedures and Whistleblower Protection
The Company has also implemented the Whistle Blowing Policy to protect those who submit a report, grievance, or information regarding misconduct, or those who cooperate with the Company in providing information, under which they may choose not to disclose their identity if they deem that such disclosure may threaten safety or cause damage. The Company will keep all relevant information confidential, taking into account the safety of the whistleblowers. Under this policy, the Company protects employees who submit their grievances in good faith, in order to prevent retribution or retaliation. The Company will impose disciplinary action, including termination of employment, on any employee who makes or participates in such retribution or retaliation, in accordance with the Company’s Code of Business Conduct.
3.5 Communication Channel for Stakeholders
Any concern or information on violation of regulations or corruption may be submitted to the Audit Committee through the channels provided by the Company at http://www.thoresen.com, [email protected], or the mailing address below:
Thoresen Thai Agencies Plc.P.O. Box 12, SCB Post Office, Lumpinee, Pathumwan, Bangkok 10330, Thailand
The Internal Audit opens the mailboxes twice a month. All letters (if any) will be forwarded to the Audit Committee for report to the Board at the quarterly meeting.
4. Information Disclosure and TransparencyTTA has strong determination to reveal timely and updated information, both financial and general information related to the Company’s business. Such information is disclosed to shareholders, investors, and any related parties via SET’s ELCID, the Company’s website (http://www.thoresen.com), press releases, the Company’s Annual Information Disclosure Form (Form 56-1), and the Company’s Annual Report. TTA actively participates in “SET’s Opportunity Days” arranged by SET on a quarterly basis.
Disclosed Important information is as follows:
4.1 Corporate Governance Policy and Implementation Results
For the financial year 2015 ended 31 December 2015, the Company complied with good corporate governance principles, except for the following matters:
(1) The Company did not clearly determine the term of an independent director, as there are a limited number of external expertise with knowledge of the Company’s core businesses. However, the Company reviews the qualifications of each independent director every year. The Company believes that each of its elected directors is a highly qualified individual who is respected for being knowledgeable, moral, and effective. If shareholders show confidence in a director by re-electing him or her, the Board will honour that decision. Therefore, the Company does not set a limit on consecutive terms of service for a director or an independent director;
(2) The Company did not determine the number of companies each director and top-level executive can hold the directorship, otherwise it would minimize a chance to appoint highly qualified persons as a director. However, the Company reviews the number of companies in which each director holds the directorship every year.
4.2 Remuneration of Directors and Executives
The remuneration of directors and executives is detailed under the heading “Management Structure”.
4.3 Responsibilities of the Board for the Financial Statements
The Board is responsible for an accuracy of the Company’s financial statements, which must present sufficient financial information and transparency, and must disclose sufficient important information in the notes to the financial statements, in accordance with the appropriate accounting standards to be consistently adhered to. The financial statements must be audited by an authorized auditor with independence and credibility, which must be certified by the SEC and/or relevant authority, and must have been verified by the Audit Committee. The remuneration for the auditor regarding the audit and other services shall be disclosed in the annual report. The Board has prepared a report on the responsibilities of the Board for the financial statements, and included the same in the Company’s Annual Report and the Annual Information Disclosure Form (Form 56-1). Furthermore, the Company held a meeting with analysts, held a press conference, and prepared a newsletter presenting the financial position of the Company.
corporate Governance report
073
ANNUAL REPORT 2015
4.4 Roles and Duties of the Board
The Company disclosed the name and profile of each director with roles and duties of the Board, the Executive Committee, the Audit Committee, the Nomination and Remuneration Committee, the Risk Management Committee, and the Corporate Governance Committee, under this “Corporate Governance Report”, in order to inform the shareholders and relevant persons of the knowledge, skills, experience, and other important information regarding the directors who are behind the success of the Company’s business.
4.5 Relationship with Investors
The Company established Corporate Communications and Investor Relations to communicate with investors, shareholders, analysts, relevant agencies, and the general public, in an appropriate and equitable manner.
In the financial year 2015 ended 31 December 2015 (1 January - 31 December 2015), the Company met and provided information to interested parties on various occasions as follows:
1. One-on-one meetings with shareholders, creditors, and analysts 40 meetings;
2. Quarterly meetings with analysts and investors at the SET’s Opportunity Day to discuss the Company’s most recent financial performance 4 presentations;
3. Disclosure of periodic reports, such as quarterly financial statements, quarterly financial results, reports on reviewed quarterly financial statements (F45-3), the Company’s Annual Information Disclosure Form (Form 56-1), and the Company’s Annual Report, 14 disclosures;
4. Disclosure of non-periodic reports, such as the notification of general meeting of shareholders and its resolutions, asset dispositions and acquisitions, and investments 44 disclosures;
5. Press releases 29 releases; 22 press releases, 7 special reports/advertorials;
6. Distribution of news and photo releases about the Company’s activities 10 releases; 4 photo releases, social news 6 releases;
7. Media relations activities 20 times; 2 activities, 15 local and 3 international media interviews.
The Management always participates in investor relations activities. Both shareholders and investors can contact Investor Relations at Tel. 02-254-8437 extension 292, Fax. 02 655-5631, Email [email protected] or through our Website http://www.thoresen.com which both Thai and English significant information are updated regularly, consisting of following detail:
Corporate profile: including background, core values, vision, mission, nature of business, organization structure and list of Board of Directors and Executive officers;
Annual report (Form 56-2)/Form 56-1;
Corporate governance: corporate governance report, list of Board of Directors, Board’s committees and company secretary and code of business conduct;
Information for investors: significant financial data, financial statements, management discussion and analysis;
Information for shareholders: notice calling to an AGM, Minutes of Shareholders’ Meeting, and ELCID;
Corporate news and activities: business news, news about TTA’s social and environmental contribution projects;
Corporate social responsibilities: business concepts and directions, existing social contribution activities.
4.6 Whistle Blowing Policy and Whistleblower Protection Policy
The Company implements a Whistle Blowing Policy and Whistleblower Protection Policy as part of the Company’s Code of Business Conduct to ensure good corporate governance of the Company and equal rights of all employees and all stakeholders to directly communicate with the Audit Committee. In case that an employee has any concern, knowledge of violation or corruption or breach of the law, business ethics, or policies of the Company, grievance concerning violation of rights, opinion, complaint, or suggestion that may affect the good corporate governance or business ethics of the Company, they may report through the following channels:
Website: http://www.thoresen.comEmail: [email protected]: P.O. Box 12, SCB Post Office, Lumpinee, Pathumwan, Bangkok 10330, Thailand.
Information, grievances, and suggestions will be considered, and appropriate actions will be taken on a case-by-case basis, without disclosing the name of the whistleblower or the content of the complaint. Measures are put in place to protect the whistleblower, to ensure that they will not be affected by the submission of information or a complaint.
4.7 Corporate Social Responsibility Policy
Please see the heading “Sustainable Development and Corporate Social Responsibility: Policy and Mission”.
corporate Governance report
074
THORESEN THAI AGENCIES PLC.
5. Structure and Responsibilities of the Board of Directors
(A) BOARD STRUCTURE
The size of the Board complies with Public Limited Companies Act, B.E. 2535 and the Company’s Articles of Association.
All directors have a number of duties and responsibilities as specified in the Articles of Association. In conducting the Company’s business, a director shall perform his duties with responsibility, due care and loyalty, and shall comply with all laws, the Company’s objectives and the Articles of Association, including resolutions of the shareholders’ meetings.
(i) Independent Director
An independent director is a director who does not manage TTA or any of its subsidiaries, is independent from management and major shareholders, and has no business dealings with TTA, which may compromise the Company’s interests and/or the shareholders’ interests.
The qualifications of an independent director are as per the definition of the Notification of the Capital Market Supervisory Board which is also available on the Company’s website. Each independent director shall comply with the following rules:
1. Holding shares not exceeding one per cent of the total number of shares with voting rights of the Company, its subsidiary company, associate company, major shareholder or controlling person, including shares held by related persons of such independent director;
2. Neither being nor used to be an executive director, employee, staff, advisor who receives salary, or controlling person of the Company, its subsidiary company, associate company, same-level subsidiary company, major shareholder or controlling person, unless the foregoing status has ended not less than two years prior to the appointment. Such prohibited characteristic shall not include the case where the independent director used to be a government official or advisor of a government unit which is a major shareholder or controlling person of the Company;
3. Not being a person related by blood or legal registration as father, mother, spouse, sibling, and child, including spouse of child, executive, major shareholder, controlling person, or person to be nominated as executive or controlling person of the Company or its subsidiary company;
4. Neither having nor used to have a business relationship with the Company, its subsidiary company, associate company, major shareholder or controlling person, in
the manner which may interfere with his independent judgement, and neither being nor used to be a significant shareholder or controlling person of any person having a business relationship with the Company, its subsidiary company, associate company, major shareholder or controlling person, unless the foregoing relationship has ended not less than two years prior to the appointment;
5. Neither being nor used to be an auditor of the Company, its subsidiary company, associate company, major shareholder or controlling person, and not being a significant shareholder, controlling person, or partner of an audit firm which employs auditors of the Company, its subsidiary company, associate company, major shareholder or controlling person, unless the foregoing relationship has ended not less than two years prior to the appointment;
6. Neither being nor used to be a provider of any professional services including those as legal advisor or financial advisor who receives service fees exceeding two million Baht per year from the Company, its subsidiary company, associate company, major shareholder or controlling person, and not being a significant shareholder, controlling person or partner of the provider of professional services, unless the foregoing relationship has ended not less than two years prior to the appointment;
7. Not being a director appointed as representative of directors of the Company, major shareholder or shareholder who is related to major shareholder;
8. Not undertaking any business in the same nature and in competition to the business of the Company or its subsidiary company or not being a significant partner in a partnership or being an executive director, employee, staff, advisor who receives salary or holding shares exceeding one per cent of the total number of shares with voting rights of other company which undertakes business in the same nature and in competition to the business of the Company or its subsidiary company; and
9. Not having any other characteristics which cause the inability to express independent opinions with regard to the Company’s business operations.
After being appointed as independent director with the qualifications under (1) to (9), the independent director may be assigned by the Board to take part in the business decision of the Company, its subsidiary company, associate company, same-level subsidiary company, major shareholder or controlling person, provided that such decision shall be in the form of collective decision.
corporate Governance report

075
ANNUAL REPORT 2015
(ii) Members of the Board of Directors
The Board is composed of eleven (11) directors, consisting of one (1) executive director (9.10% of the total number of directors), five (5) non-executive directors (45.45% of the total number of directors), and five (5) independent directors (45.45% of the total number of directors). The Board as of 31 December 2015 consisted of the following persons:
Members of the Board as of 31 December 2015
Name Position First Appointment Date
1. Mr. Prasert Bunsumpun Chairman of the Board/Chairman of Executive Committee
31 Jan. 2012
2. Mr. Chalermchai Mahagitsiri President and Chief Executive Officer /Member of Executive Committee/ Chairman of Investment Committee
31 Jan. 2012
3. Mr. Chia Wan Huat Joseph Director/Member of Executive Committee/Chairman of Risk Management Committee/Member of Investment Committee
31 Jan. 2012
4. Mr. Jean Paul Thevenin Director/Member of Executive Committee/Member of Investment Committee
30 Jan. 2014
5. Mr. Krish Follett Independent Director/Chairman of Audit Committee/Member of Corporate Governance Committee
12 Apr. 2012
6. Mr. Santi Bangor Independent Director/Chairman of Nomination and Remuneration Committee/Chairman of Corporate Governance Committee/Member of Audit Committee
31 Jan. 2012
7. Ms. Ausana Mahagitsiri Director/Member of Nomination and Remuneration Committee/Member of Corporate Governance Committee
31 Jan. 2012
8. Mr. Mohammed Rashed Ahmad M. Al Nasseri
Independent Director/Member of Nomination and Remuneration Committee
30 Jan. 2013
9. Mr. Yves Barbieux Director 12 Jul. 2013
10. Mr. Cherdpong Siriwit Independent Director/Member of Audit Committee/Member of Risk Management Committee
30 Jan. 2013
11. Mr. Chitrapongse Kwangsukstith /1 Independent Director 13 May 2015
Note: /1 Mr. Chitrapongse Kwangsukstith was appointed a Board member on 13 May 2015 to replace Mr. Ghanim Saad M Alsaad Al-Kuwari, the resigned
director.
Authority and Duties of the Board
1) Review and approve the vision, mission, and Code of Business Conduct of the Company, including support and promote compliance of the Company’s management with the good corporate governance principles.
2) Review and approve the strategies, business plans, budgets, and policies, including annual business plans, investment budgets, and operational objectives of the Company.
3) Appoint sub-committees and assign authority and duties to each sub-committee to perform duties of the committees, as assigned by the Board.
4) Assign duties to the President and Chief Executive Officer concerning management of the Company in accordance with the policies, strategies, business plans, budgets, and objectives of the Company.
5) Ensure that the management consistently perform their duties under the work plan in accordance with the organizational direction and strategies.
corporate Governance report

076
THORESEN THAI AGENCIES PLC.
6) Review and approve human resources management strategies and human resources development plans, and determine an appropriate remuneration policy.
7) Ensure that the Company has proper systems in place to communicate effectively with its stakeholders and the public and monitor their application.
8) Determine the guidelines for evaluating the Board and hold regular evaluation of the performance of the Board.
(iii) Segregation of Positions
The Board elects one of its non-executive directors as Chairman. The Chairman, and President and Chief Executive Officer are two separate individuals. The Chairman oversees the implementation of policies and guidelines pursuant to the strategies established by the Board and management and ensures that Board meetings are successfully conducted. During each meeting, all directors are encouraged to actively participate and raise essential questions.
The authority of the Board and management are clearly defined and segregated. At the same time, the Board stays away from routine tasks or business activities under management responsibility.
Duties and Responsibilities of the Chairman
1) Convene Board meetings and assign the Company Secretary to arrange for delivery of notices of meetings and documents to ensure that the Board receives sufficient information in a timely manner.
2) Preside at the Board meetings.
3) Preside at the shareholders’ meetings and ensure that the meetings are conducted in accordance with the Articles of Association and the agenda specified.
4) Ensure efficient communication between the directors and the shareholders.
5) Perform duties specified by laws as the duties of a Chairman.
Duties and Responsibilities of the President and Chief Executive Officer
The President and Chief Executive Officer has the duties to manage the Company as assigned by the Board, and in accordance with the work plan or budget approved by the Board, in order to protect the best interests of the Company and its shareholders. The authority and duties of the President and Chief Executive Officer also cover other matters, namely:
1) Conduct necessary activities and manage daily tasks of the Company; and
2) Approve operating expenses and investment expenses in accordance with the budgets approved by the Board.
(iv) Term of Directors
Term of Directorship
Under the Articles of Association, at every AGM, one-third of the Board, or if the number is not a multiple of three, the number nearest to one-third, shall retire from office. In choosing those directors who retire, length of service on the Board should be considered, so that those who have served the longest are most eligible to retire. The term of each director is approximately three (3) years. A retiring director is eligible for re-election.
Number of Consecutive Terms of Directors
The Company believes that each of its elected directors is a highly qualified individual who is respected for being knowledgeable, moral, and effective. If shareholders show confidence in a director by re-electing him or her, the Board will honour that decision. Therefore, the Company does not set a limit on consecutive terms of service of a director or an independent director.
However, the Board will consider suitable solutions regarding consecutive terms of directors and independent directors in due course.
Nomination of Directors
The Board assigned the Nomination and Remuneration Committee to seek qualified candidates as a director of the Company. The Nomination and Remuneration Committee will consider the profile, age, knowledge, experience, potential, and other factors that may be required of a director of the Company.
Board Meetings
The Board schedules at least six Board meetings per year in advance, and notifies each director. The Chairman is authorized to approve the meeting agenda. Each director is entitled to propose matters that are beneficial to the Company to be discussed in the meetings. The Company Secretary will deliver the notice of meeting, agenda, and supporting documents to the directors no later than seven (7) days in advance, so that the directors have sufficient time to review the matters to be discussed. As per the Articles of Association of the Company, the quorum of a Board Meeting requires no less than a half of the total number of directors on the Board.
In the financial year 2015 ended 31 December 2015 (1 January - 31 December 2015), the Company held eleven (11) Board meetings and held unofficial eleven (11) meetings of non-executive directors.
corporate Governance report
077
ANNUAL REPORT 2015
(B) COMPANY SECRETARY AND BOARD COMMITTEES
The Board has appointed the Company Secretary and six (6) committees, namely 1) Audit Committee, 2) Executive Committee, 3) Nomination and Remuneration Committee, 4) Corporate Governance Committee, 5) Risk Management Committee and 6) Investment Committee.
(i) Company Secretary
The Board appointed Ms. Mantanee Surakarnkul as the Company Secretary on 14 August 2008 to take responsibility for matters connected with meetings of the Board and the shareholders and to contribute to best corporate governance practices. She also serves as the secretary of the Board, the Execvtive Committee and the Corporate Governance Committee to coordinate subsequent actions under the Board’s resolutions.
The Company Secretary’s duties and responsibilities include:
To provide advice pertaining to the Company’s regulations and Articles of Association, to monitor new laws and regulations on a regular basis, and to report any significant changes to the Board;
To arrange meetings of shareholders and the Board in accordance with applicable laws and regulations and the Company’s Articles of Association;
To prepare minutes of shareholders and Board meetings and to monitor execution of such resolutions on a regular basis;
To ensure that all public information disclosure is in accordance with laws and the SET’s and SEC’s regulations;
To facilitate the Board’s activities, including director orientation; and
To file and keep records of the Company’s key documents, such as directors’ registration, notice of the Board meetings, minutes of the Board meetings, annual reports, notice to shareholders’ meetings and the minutes of the meetings, and reports on directors’ and management’s interest.
Details of the Company Secretary
Name
% ofShareholding
as of 31 Dec. 2015 Education Training/Certification
WorkingExperience
Relation Among Family with Other
Directors and Executives
Ms. Mantanee Surakarnkul(Age 50)Company Secretary (14 August 2008 - present)
0.002% Master of Business Administration (MBA), Sasin Graduate Institute of Business Administration of Chulalongkorn University
Bachelor of Arts, Chulalongkorn University
Company Secretary Program (CSP), Class 15/2006, IOD
Effective Minutes Taking (EMT), Class 2/2006, IOD
Improving the Quality of Financial Reporting (QFR), Class 2/2006, IOD
Understanding the Fundamental of Financial Statements (UFS), Class 1/2006, IOD
Directors Certification Program (DCP), Class 1/2000, IOD
1990-present : Corporate Affairs Director, TTA
None
Details of the Company Secretary’s functions are also available on the Company’s website and in the Company’s Annual Information Disclosure Form (Form 56-1). The Company encourages the Company Secretary to attend courses relating to company secretarial functions.
(ii) Audit Committee
The Audit Committee (“AC”) is composed of at least three (3) independent directors. At the Board meeting held on 14 August 2012, the Board reviewed and approved the revised Audit Committee Charter.
The AC has full delegated authority from the Board to perform its tasks. An audit plan and meeting schedule are set each year to allow the AC to monitor financial information report procedures, the internal control and financial risk management system, and audit procedures, including the procedures for monitoring compliance with laws and regulations.
corporate Governance report
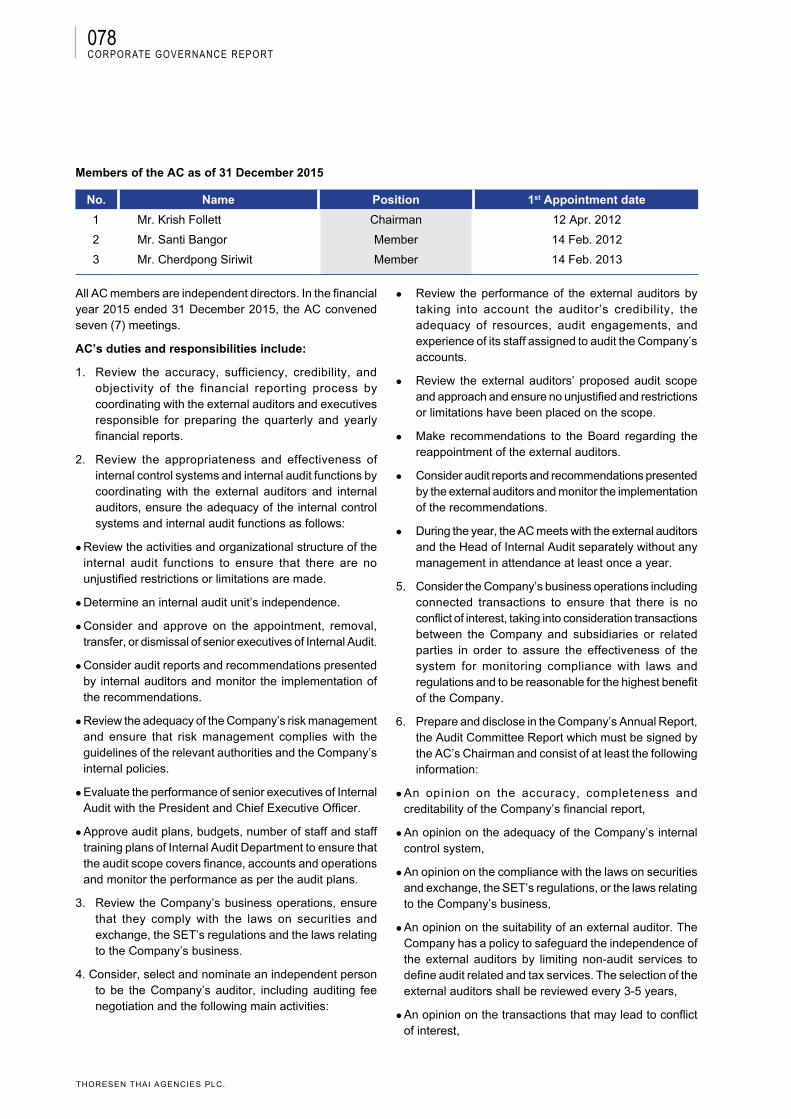
078
THORESEN THAI AGENCIES PLC.
Members of the AC as of 31 December 2015
No. Name Position 1st Appointment date
1 Mr. Krish Follett Chairman 12 Apr. 2012
2 Mr. Santi Bangor Member 14 Feb. 2012
3 Mr. Cherdpong Siriwit Member 14 Feb. 2013
All AC members are independent directors. In the financial year 2015 ended 31 December 2015, the AC convened seven (7) meetings.
AC’s duties and responsibilities include:
1. Review the accuracy, sufficiency, credibility, and objectivity of the financial reporting process by coordinating with the external auditors and executives responsible for preparing the quarterly and yearly financial reports.
2. Review the appropriateness and effectiveness of internal control systems and internal audit functions by coordinating with the external auditors and internal auditors, ensure the adequacy of the internal control systems and internal audit functions as follows:
Review the activities and organizational structure of the internal audit functions to ensure that there are no unjustified restrictions or limitations are made.
Determine an internal audit unit’s independence.
Consider and approve on the appointment, removal, transfer, or dismissal of senior executives of Internal Audit.
Consider audit reports and recommendations presented by internal auditors and monitor the implementation of the recommendations.
Review the adequacy of the Company’s risk management and ensure that risk management complies with the guidelines of the relevant authorities and the Company’s internal policies.
Evaluate the performance of senior executives of Internal Audit with the President and Chief Executive Officer.
Approve audit plans, budgets, number of staff and staff training plans of Internal Audit Department to ensure that the audit scope covers finance, accounts and operations and monitor the performance as per the audit plans.
3. Review the Company’s business operations, ensure that they comply with the laws on securities and exchange, the SET’s regulations and the laws relating to the Company’s business.
4. Consider, select and nominate an independent person to be the Company’s auditor, including auditing fee negotiation and the following main activities:
Review the performance of the external auditors by taking into account the auditor’s credibility, the adequacy of resources, audit engagements, and experience of its staff assigned to audit the Company’s accounts.
Review the external auditors’ proposed audit scope and approach and ensure no unjustified and restrictions or limitations have been placed on the scope.
Make recommendations to the Board regarding the reappointment of the external auditors.
Consider audit reports and recommendations presented by the external auditors and monitor the implementation of the recommendations.
During the year, the AC meets with the external auditors and the Head of Internal Audit separately without any management in attendance at least once a year.
5. Consider the Company’s business operations including connected transactions to ensure that there is no conflict of interest, taking into consideration transactions between the Company and subsidiaries or related parties in order to assure the effectiveness of the system for monitoring compliance with laws and regulations and to be reasonable for the highest benefit of the Company.
6. Prepare and disclose in the Company’s Annual Report, the Audit Committee Report which must be signed by the AC’s Chairman and consist of at least the following information:
An opinion on the accuracy, completeness and creditability of the Company’s financial report,
An opinion on the adequacy of the Company’s internal control system,
An opinion on the compliance with the laws on securities and exchange, the SET’s regulations, or the laws relating to the Company’s business,
An opinion on the suitability of an external auditor. The Company has a policy to safeguard the independence of the external auditors by limiting non-audit services to define audit related and tax services. The selection of the external auditors shall be reviewed every 3-5 years,
An opinion on the transactions that may lead to conflict of interest,
corporate Governance report

079
ANNUAL REPORT 2015
The number of the AC meetings, and the attendance of such meetings by each committee member,
An opinion or overview comment received by the AC regarding its performance of duties in accordance with the Charter, and
Other transactions which, according to the AC’s opinion, should be known to the shareholders and general investors, subject to the scope of duties and responsibilities assigned by the Board.
7. Perform any other duties as assigned by the Board, with the approval of the AC.
8. Report the performance of the AC at every Board’s quarterly meeting.
9. Review the summary and evidence of fraud of employees or executives which result in the damage to the Company and propose the reviewed report by the AC to the Board for consideration.
10. Review the AC’s performance on an annual basis.
11. Review and reassess the adequacy of this Charter periodically and recommend any proposed changes to the Board for approval.
Appointment of the Auditors and Fixing the Audit Fee
The Board assigned the AC to consider and propose the appointment of the external auditors and the audit fee to shareholders for approval at every AGM. At the 2/2015 AGM on 27 April 2015, the shareholders approved the following items:
1. The appointment of Mr. Veerachai Ratanajratkul, CPA No. 4323, Mrs. Siripen Sukcharoenyingyong, CPA No. 3636, Mr. Charoen Phosamritlert, CPA No. 4068, or Miss Pornthip Rimdusit, CPA No. 5565, of KPMG Phoomchai Audit Ltd. to be the Company’s auditors for the financial year 2015 ended 31 December 2015 (1 January - 31 December 2015).
2. The audit fee at the amount of Baht 3.63 million to review and audit TTA’s financial statements and consolidated financial statements.
Subsequent to the consideration of engagement terms and audit fee as proposed, the AC advised the Board of its assessment and recommendation for the appointment of the external auditors and the audit fee, which would be proposed to the shareholders’ meeting for approval.
The AC will propose to appoint KPMG Phoomchai Audit Ltd. as external auditors of the Company to the shareholders at the next AGM to be held on 27 April 2016.
(iii) Executive Committee
At the Board meeting held on 14 February 2012, the Board approved the appointment of the Executive Committee (“EC”) and on 15 March 2012, the Board approved the Executive Committee Charter.
The EC comprises a minimum of four (4) members from the Company’s directors and executives.
Members of the EC as of 31 December 2015
No. Name Position 1st Appointment date
1 Mr. Prasert Bunsumpun Chairman 14 Feb. 2012
2 Mr. Chalermchai Mahagitsiri Member 14 Feb. 2012
3 Mr. Chia Wan Huat Joseph Member 14 Feb. 2012
4 Mr. Jean Paul Thevenin Member 12 Feb. 2014
5 Mr. Jitender Pal Verma Member 13 May 2015
In the financial year 2015 ended 31 December 2015 (1 January - 31 December 2015), the EC convened thirteen (13) meetings.
The EC’s main tasks include considering the Company’s business plans and annual budget for presentation to the Board, considering overall investment and financing strategies, and the approval of transactions within its delegated authorities.
(iv) Nomination and Remuneration Committee
The Nomination and Remuneration Committee (“NRC”) comprises at least three (3) non-executive directors. At the Board meeting held on 13 May 2011, the Board approved the Nomination and Remuneration Committee Charter.
corporate Governance report
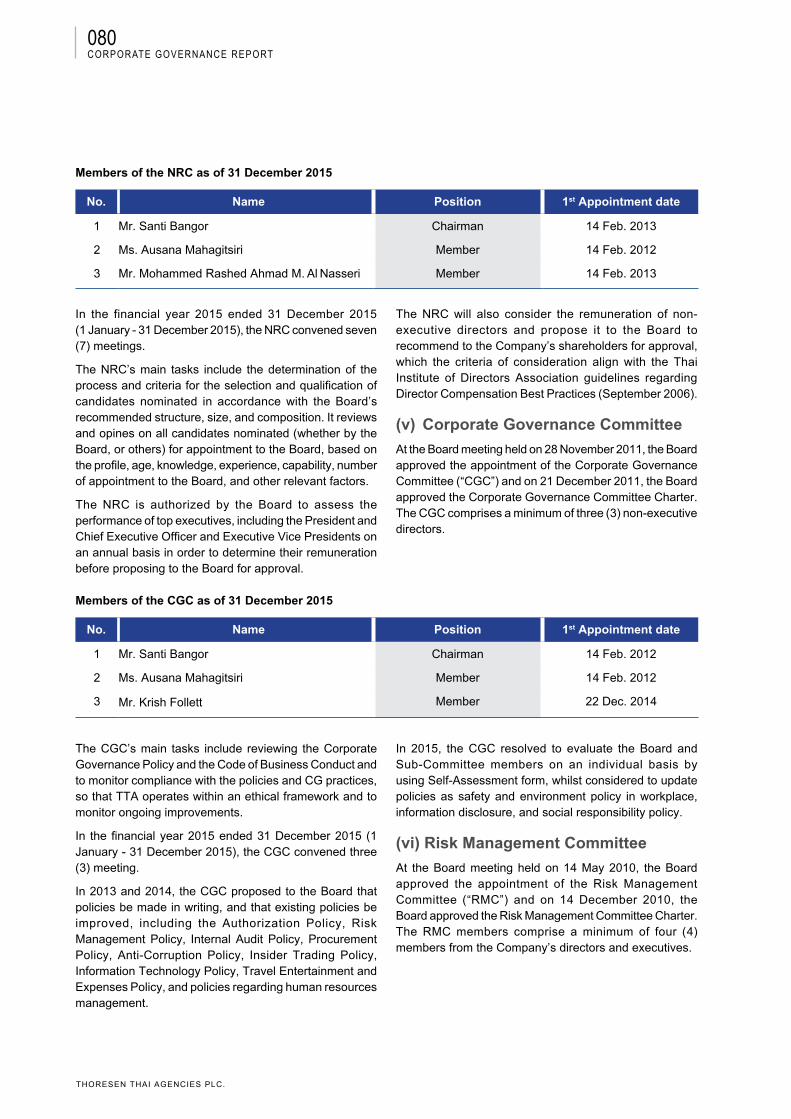
080
THORESEN THAI AGENCIES PLC.
Members of the NRC as of 31 December 2015
No. Name Position 1st Appointment date
1 Mr. Santi Bangor Chairman 14 Feb. 2013
2 Ms. Ausana Mahagitsiri Member 14 Feb. 2012
3 Mr. Mohammed Rashed Ahmad M. Al Nasseri Member 14 Feb. 2013
In the financial year 2015 ended 31 December 2015 (1 January - 31 December 2015), the NRC convened seven (7) meetings.
The NRC’s main tasks include the determination of the process and criteria for the selection and qualification of candidates nominated in accordance with the Board’s recommended structure, size, and composition. It reviews and opines on all candidates nominated (whether by the Board, or others) for appointment to the Board, based on the profile, age, knowledge, experience, capability, number of appointment to the Board, and other relevant factors.
The NRC is authorized by the Board to assess the performance of top executives, including the President and Chief Executive Officer and Executive Vice Presidents on an annual basis in order to determine their remuneration before proposing to the Board for approval.
The NRC will also consider the remuneration of non-executive directors and propose it to the Board to recommend to the Company’s shareholders for approval, which the criteria of consideration align with the Thai Institute of Directors Association guidelines regarding Director Compensation Best Practices (September 2006).
(v) Corporate Governance Committee
At the Board meeting held on 28 November 2011, the Board approved the appointment of the Corporate Governance Committee (“CGC”) and on 21 December 2011, the Board approved the Corporate Governance Committee Charter. The CGC comprises a minimum of three (3) non-executive directors.
Members of the CGC as of 31 December 2015
No. Name Position 1st Appointment date
1 Mr. Santi Bangor Chairman 14 Feb. 2012
2 Ms. Ausana Mahagitsiri Member 14 Feb. 2012
3 Mr. Krish Follett Member 22 Dec. 2014
The CGC’s main tasks include reviewing the Corporate Governance Policy and the Code of Business Conduct and to monitor compliance with the policies and CG practices, so that TTA operates within an ethical framework and to monitor ongoing improvements.
In the financial year 2015 ended 31 December 2015 (1 January - 31 December 2015), the CGC convened three (3) meeting.
In 2013 and 2014, the CGC proposed to the Board that policies be made in writing, and that existing policies be improved, including the Authorization Policy, Risk Management Policy, Internal Audit Policy, Procurement Policy, Anti-Corruption Policy, Insider Trading Policy, Information Technology Policy, Travel Entertainment and Expenses Policy, and policies regarding human resources management.
In 2015, the CGC resolved to evaluate the Board and Sub-Committee members on an individual basis by using Self-Assessment form, whilst considered to update policies as safety and environment policy in workplace, information disclosure, and social responsibility policy.
(vi) Risk Management Committee
At the Board meeting held on 14 May 2010, the Board approved the appointment of the Risk Management Committee (“RMC”) and on 14 December 2010, the Board approved the Risk Management Committee Charter. The RMC members comprise a minimum of four (4) members from the Company’s directors and executives.
corporate Governance report
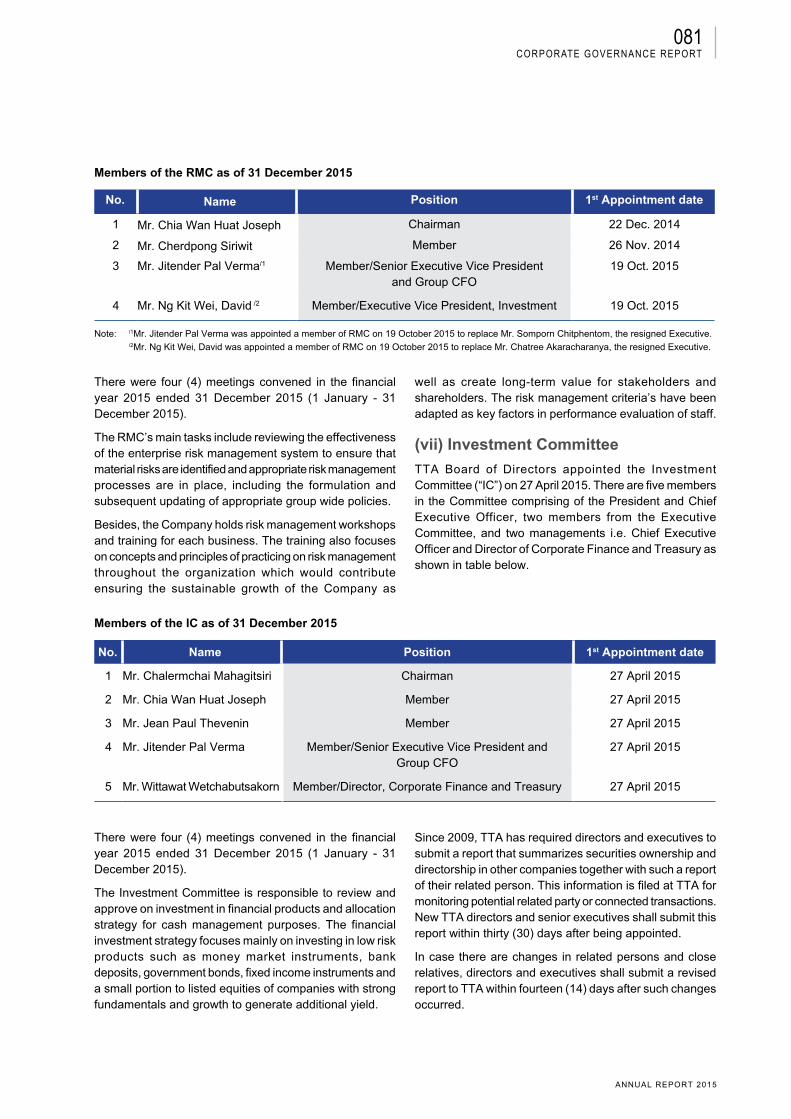
081
ANNUAL REPORT 2015
Members of the RMC as of 31 December 2015
No. Name Position 1st Appointment date
1 Mr. Chia Wan Huat Joseph Chairman 22 Dec. 2014
2 Mr. Cherdpong Siriwit Member 26 Nov. 2014
3 Mr. Jitender Pal Verma/1 Member/Senior Executive Vice Presidentand Group CFO
19 Oct. 2015
4 Mr. Ng Kit Wei, David /2 Member/Executive Vice President, Investment 19 Oct. 2015
Note: /1Mr. Jitender Pal Verma was appointed a member of RMC on 19 October 2015 to replace Mr. Somporn Chitphentom, the resigned Executive. /2Mr. Ng Kit Wei, David was appointed a member of RMC on 19 October 2015 to replace Mr. Chatree Akaracharanya, the resigned Executive.
There were four (4) meetings convened in the financial year 2015 ended 31 December 2015 (1 January - 31 December 2015).
The RMC’s main tasks include reviewing the effectiveness of the enterprise risk management system to ensure that material risks are identified and appropriate risk management processes are in place, including the formulation and subsequent updating of appropriate group wide policies.
Besides, the Company holds risk management workshops and training for each business. The training also focuses on concepts and principles of practicing on risk management throughout the organization which would contribute ensuring the sustainable growth of the Company as
well as create long-term value for stakeholders and shareholders. The risk management criteria’s have been adapted as key factors in performance evaluation of staff.
(vii) Investment Committee
TTA Board of Directors appointed the Investment Committee (“IC”) on 27 April 2015. There are five members in the Committee comprising of the President and Chief Executive Officer, two members from the Executive Committee, and two managements i.e. Chief Executive Officer and Director of Corporate Finance and Treasury as shown in table below.
Members of the IC as of 31 December 2015
No. Name Position 1st Appointment date
1 Mr. Chalermchai Mahagitsiri Chairman 27 April 2015
2 Mr. Chia Wan Huat Joseph Member 27 April 2015
3 Mr. Jean Paul Thevenin Member 27 April 2015
4 Mr. Jitender Pal Verma Member/Senior Executive Vice President and Group CFO
27 April 2015
5 Mr. Wittawat Wetchabutsakorn Member/Director, Corporate Finance and Treasury 27 April 2015
There were four (4) meetings convened in the financial year 2015 ended 31 December 2015 (1 January - 31 December 2015).
The Investment Committee is responsible to review and approve on investment in financial products and allocation strategy for cash management purposes. The financial investment strategy focuses mainly on investing in low risk products such as money market instruments, bank deposits, government bonds, fixed income instruments and a small portion to listed equities of companies with strong fundamentals and growth to generate additional yield.
Since 2009, TTA has required directors and executives to submit a report that summarizes securities ownership and directorship in other companies together with such a report of their related person. This information is filed at TTA for monitoring potential related party or connected transactions. New TTA directors and senior executives shall submit this report within thirty (30) days after being appointed.
In case there are changes in related persons and close relatives, directors and executives shall submit a revised report to TTA within fourteen (14) days after such changes occurred.
corporate Governance report
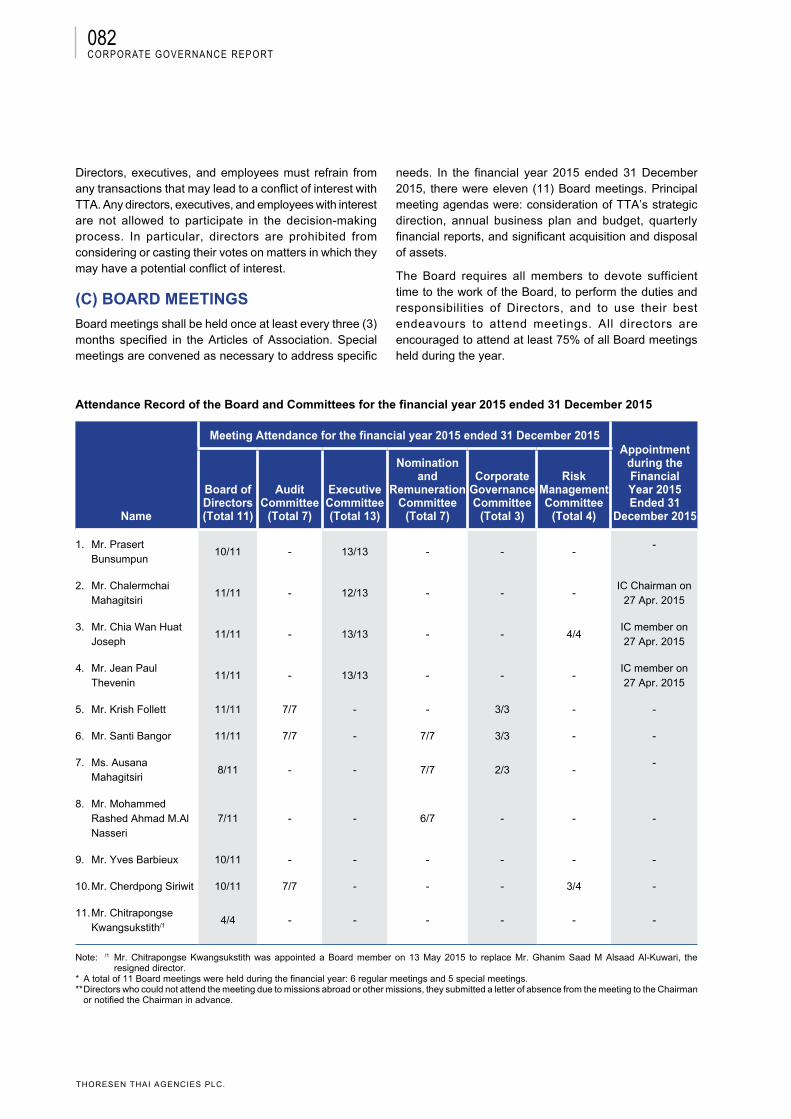
082
THORESEN THAI AGENCIES PLC.
Directors, executives, and employees must refrain from any transactions that may lead to a conflict of interest with TTA. Any directors, executives, and employees with interest are not allowed to participate in the decision-making process. In particular, directors are prohibited from considering or casting their votes on matters in which they may have a potential conflict of interest.
(C) BOARD MEETINGS
Board meetings shall be held once at least every three (3) months specified in the Articles of Association. Special meetings are convened as necessary to address specific
needs. In the financial year 2015 ended 31 December 2015, there were eleven (11) Board meetings. Principal meeting agendas were: consideration of TTA’s strategic direction, annual business plan and budget, quarterly financial reports, and significant acquisition and disposal of assets.
The Board requires all members to devote sufficient time to the work of the Board, to perform the duties and responsibilities of Directors, and to use their best endeavours to attend meetings. All directors are encouraged to attend at least 75% of all Board meetings held during the year.
Attendance Record of the Board and Committees for the financial year 2015 ended 31 December 2015
Name
Meeting Attendance for the financial year 2015 ended 31 December 2015 Appointment
during the Financial Year 2015 Ended 31
December 2015
Board of Directors(Total 11)
Audit Committee
(Total 7)
Executive Committee(Total 13)
Nomination and
Remuneration Committee
(Total 7)
Corporate Governance Committee
(Total 3)
Risk Management Committee
(Total 4)
1. Mr. Prasert Bunsumpun
10/11 - 13/13 - - --
2. Mr. Chalermchai Mahagitsiri
11/11 - 12/13 - - -IC Chairman on
27 Apr. 2015
3. Mr. Chia Wan Huat Joseph
11/11 - 13/13 - - 4/4IC member on 27 Apr. 2015
4. Mr. Jean Paul Thevenin
11/11 - 13/13 - - -IC member on 27 Apr. 2015
5. Mr. Krish Follett 11/11 7/7 - - 3/3 - -
6. Mr. Santi Bangor 11/11 7/7 - 7/7 3/3 - -
7. Ms. Ausana Mahagitsiri
8/11 - - 7/7 2/3 --
8. Mr. Mohammed Rashed Ahmad M.Al Nasseri
7/11 - - 6/7 - - -
9. Mr. Yves Barbieux 10/11 - - - - - -
10. Mr. Cherdpong Siriwit 10/11 7/7 - - - 3/4 -
11. Mr. Chitrapongse Kwangsukstith/1
4/4 - - - - - -
Note: /1 Mr. Chitrapongse Kwangsukstith was appointed a Board member on 13 May 2015 to replace Mr. Ghanim Saad M Alsaad Al-Kuwari, the resigned director. * A total of 11 Board meetings were held during the financial year: 6 regular meetings and 5 special meetings. ** Directors who could not attend the meeting due to missions abroad or other missions, they submitted a letter of absence from the meeting to the Chairman or notified the Chairman in advance.
corporate Governance report
083
ANNUAL REPORT 2015
(D) BOARD AND SUB-COMMITTEES ASSESSMENT
(D.1) Self Assessment of Board members on both as a whole and an individual basis
The Board conducted a formal evaluation of its own performance for the year that ended on 31 December 2015. The evaluation process was led by the Chairman of the CGC and was conducted by sending a board assessment form to each Director. The responses to the form were collected by the Company Secretary.
The percentage of each chapter in this assessment form is as follows:
1. “Excellent” has score range between 90 - 100 2. “Very Good” has score range between 80 - 893. “Good” has score range between 70 - 794. “Satisfactory” has score range below 69
There were six (6) major areas of evaluation of Self-Assessment of Board as a whole namely:
1. Structure and Qualifications of the Board2. Roles and Responsibilities of the Board3. Board of Directors Meetings4. Board of Directors’ Performance of Duties5. Relationship with Management6. Self-Development of Directors
There were three (3) major areas of evaluation of Self-Assessment of Board members on an individual basis as follows:
1. Structure and Qualifications of the Board2. Board of Directors Meetings3. Roles, Duties and Responsibilities of the Board
The Chairman of the CGC reported and discussed the assessment results with the Board of Directors. In 2015, the assessment results as a whole were “Very Good” with a percentage at 87.60, and the assessment results on an individual basis were “Very Good” with a percentage at 87.19. The Board discussed the results and possible improvements and asked different committees to propose measures to improve the efficiency of the Board.
(D.2) Self Assessment of Sub-Committee members on an individual basis
Sub-Committees namely, Audit Committee, Corporate Governance Committee, and Nomination and Remuneration Committee, conducted a formal evaluation of its own performance for the year that ended on 31 December 2015. The evaluation process was led by the Chairman of the CGC and was conducted by sending a sub-committee assessment form to each member. The responses to the form were collected by the Company Secretary and the
Chairman of the CGC would report the result to the Board of Directors.
There were three (3) main areas of evaluation of Self-Assessment of Sub-Committee members on both as a whole and an individual basis as follows:
1. Sub-Committees’ structure and qualifications2. Sub-Committees’ meeting3. Roles, duties and responsibilities of Sub-Committees
In 2015, the assessment results for both as a whole and an individual basis of the Audit Committee were “Excellent” and the results of those of the Corporate Governance Committee and the Nomination and Remuneration Committee were “Very Good”.
(E) REMUNERATION POLICY
(E.1) Remuneration policy for Directors
The Company has set remuneration policy for directors which is composed of salary, meeting attendance fee, travel allowance for foreign directors whose residency is outside of Thailand and bonus grant upon the Company’s performance. The remuneration is considered from the Board of Directors’ duties and responsibilities and has been designed to the Company’s directors at the similar level to the industry compensation of Thai listed companies. It is believed that such remuneration could attract, retain, and motivate the directors to perform their roles and carry out their responsibilities to accomplish the Company’s goals efficiently and transparently to assure the shareholders. The Nomination and Remuneration Committee will determine the fair and reasonable remuneration amount and propose this to the Board of Directors prior to obtain the shareholders’ approval.
(E.2) Remuneration policy for the President & Chief Executive Officer and Executives
Remunerations for the President and Chief Executive Officer and Executives are considered from the individual performance appraisal scores as well as the overall performance of the Company. The self-assessment results and performance are reported to the Nomination and Remuneration Committee to determine the monetary remuneration to obtain the Board’s approval accordingly.
Remuneration policy for the Executives is considered from the individual performance appraisal scores as well as the overall performance of the Company. The self-assessment results and performance are reported to the President and Chief Executive Officer. The considerations thereof are reported to the Nomination and Remuneration Committee to determine the monetary remuneration to obtain the Board’s approval accordingly.
corporate Governance report
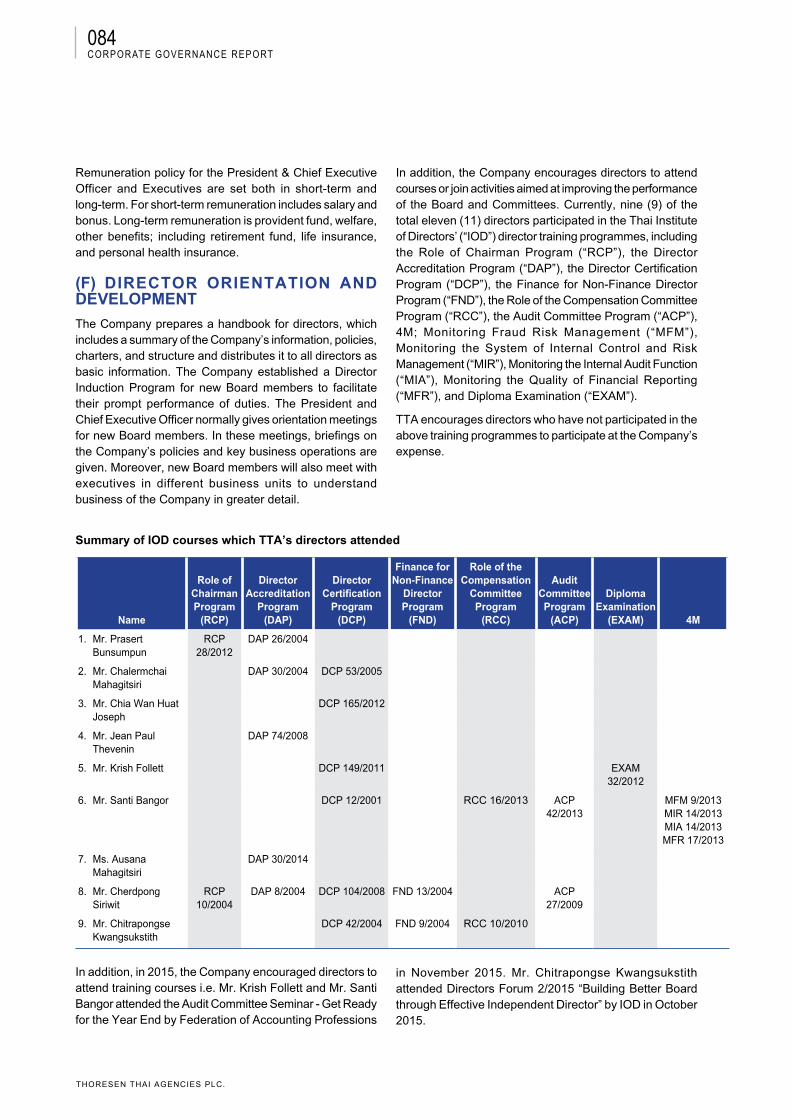
084
THORESEN THAI AGENCIES PLC.
Remuneration policy for the President & Chief Executive Officer and Executives are set both in short-term and long-term. For short-term remuneration includes salary and bonus. Long-term remuneration is provident fund, welfare, other benefits; including retirement fund, life insurance, and personal health insurance.
(F) DIRECTOR ORIENTATION AND DEVELOPMENT
The Company prepares a handbook for directors, which includes a summary of the Company’s information, policies, charters, and structure and distributes it to all directors as basic information. The Company established a Director Induction Program for new Board members to facilitate their prompt performance of duties. The President and Chief Executive Officer normally gives orientation meetings for new Board members. In these meetings, briefings on the Company’s policies and key business operations are given. Moreover, new Board members will also meet with executives in different business units to understand business of the Company in greater detail.
In addition, the Company encourages directors to attend courses or join activities aimed at improving the performance of the Board and Committees. Currently, nine (9) of the total eleven (11) directors participated in the Thai Institute of Directors’ (“IOD”) director training programmes, including the Role of Chairman Program (“RCP”), the Director Accreditation Program (“DAP”), the Director Certification Program (“DCP”), the Finance for Non-Finance Director Program (“FND”), the Role of the Compensation Committee Program (“RCC”), the Audit Committee Program (“ACP”), 4M; Monitoring Fraud Risk Management (“MFM”), Monitoring the System of Internal Control and Risk Management (“MIR”), Monitoring the Internal Audit Function (“MIA”), Monitoring the Quality of Financial Reporting (“MFR”), and Diploma Examination (“EXAM”).
TTA encourages directors who have not participated in the above training programmes to participate at the Company’s expense.
Summary of IOD courses which TTA’s directors attended
Name
Role of Chairman Program
(RCP)
Director Accreditation
Program(DAP)
Director Certification
Program(DCP)
Finance for Non-Finance
Director Program
(FND)
Role of the Compensation
Committee Program
(RCC)
Audit Committee Program
(ACP)
Diploma Examination
(EXAM) 4M
1. Mr. Prasert Bunsumpun
RCP 28/2012
DAP 26/2004
2. Mr. Chalermchai Mahagitsiri
DAP 30/2004 DCP 53/2005
3. Mr. Chia Wan Huat Joseph
DCP 165/2012
4. Mr. Jean Paul Thevenin
DAP 74/2008
5. Mr. Krish Follett DCP 149/2011 EXAM 32/2012
6. Mr. Santi Bangor DCP 12/2001 RCC 16/2013 ACP 42/2013
MFM 9/2013MIR 14/2013MIA 14/2013MFR 17/2013
7. Ms. Ausana Mahagitsiri
DAP 30/2014
8. Mr. Cherdpong Siriwit
RCP 10/2004
DAP 8/2004 DCP 104/2008 FND 13/2004 ACP 27/2009
9. Mr. Chitrapongse Kwangsukstith
DCP 42/2004 FND 9/2004 RCC 10/2010
corporate Governance report
In addition, in 2015, the Company encouraged directors to attend training courses i.e. Mr. Krish Follett and Mr. Santi Bangor attended the Audit Committee Seminar - Get Ready for the Year End by Federation of Accounting Professions
in November 2015. Mr. Chitrapongse Kwangsukstith attended Directors Forum 2/2015 “Building Better Board through Effective Independent Director” by IOD in October 2015.
085
ANNUAL REPORT 2015
(G) BUSINESS ETHICS AND CODE OF CONDUCT
TTA’s Ethical and Operational Guidelines
TTA has the following ethical and operational guidelines:
(i) Fairness
We believe in being fair to all parties having a business relationship with us and conscientiously avoid favouritism or a conflict of interest situation.
(ii) Professionalism
We carry out our responsibilities in a professional manner and are determined to achieve excellence by continuously increasing performance levels through new methods and technologies.
(iii) Proactiveness
We are responsive to client needs and social, technical, and economic changes and adapt to the circumstances.
(iv) Discipline and Compliance
We pursue business affairs with discipline and ethical principles and ensure that our undertakings comply with laws, rules, and regulations.
Code of Business Conduct
The Board has approved a Core Values, Mission and Vision (“VMV”) framework to guide business operations. A Code of Business Conduct was approved by the Board on 12 February 2010 to implement the VMV framework, emphasising our four (4) Core Values.
TTA has arranged Code of Business Conduct training to all employees to ensure that they understand good practices and has included the Code of Business Conduct training as part of the orientation for new employees.
The four (4) Core Values are:
(i) Integrity: We are open, honest, and ethical, deliver on our promises, and build and nurture trust in our relationships.
(ii) Excellence: We set high standards of quality, safety, environment, security, and service, are always prepared for challenges, and conduct our business professionally.
(iii) Team Spirit: We care for our clients, employees, and suppliers and behave in ways that build a spirit of teamwork and collaboration and show deep respect for one another.
(iv) Commitment: We are passionate about the future of this Company and feel accountable for business results and success.
The Board of Directors approved the Vision and Mission statements for the period of 2015-2020 of TTA as follows:
(a) The vision statement of TTA is “To be the most Trusted Asian Investment Group by 2020, consistently delivering enhanced stakeholder experience”; and
(b) The mission statement of TTA is:
1. To maximize shareholders value2. To create and facilitate sustainable growth3. To identify, invest, govern and grow our group business
portfolio4. To give back to the society
corporate Governance report

086
THORESEN THAI AGENCIES PLC.
risk FactorsIn pursuing our strategic direction, TTA is presented with numerous risks – both internally and externally driven. Understanding the nature of these risks, proactively identifying and effectively managing them is an imperative component of our strategies and operations. It fosters confidence for the Group to achieve its objectives and goals, and when implemented successfully, it can prevent potential losses and help the Group better capture new business opportunities. The Group manages risk under an overall direction determined by the board of directors, and supported by the board’s Risk Management Committee and Audit Committee. The TTA Enterprise Risk Management Framework assists the Group by providing a structured process for risk management and promoting a strong risk culture.
TTA Enterprise Risk Management FrameworkThe Group is committed to ensure it has an effective and practical enterprise risk management (“ERM”) framework in place to safeguard people and assets, protect shareholders’ interests and ultimately uphold and enhance the Group brand and reputation amongst its stakeholders. In designing the ERM framework, the Group has made reference to globally recognized industry risk management standard under the Committee of Sponsoring Organizations of the Treadway Commission (“COSO”) framework to ensure best practice and TTA Enterprise Risk Management framework has since evolved to provide a holistic and systematic process for identifying, analyzing and managing risks for the Group. By regularly communicating and training employees on the ERM framework, TTA has created a risk culture that ultimately helps add values to the entire value chain and enable the Group to be better equipped in managing risks against the dynamic market environment, both locally and internationally.
The TTA ERM Framework comprise of:
1. Risk Objective/ApproachTo ensure consistent risk management practices and standards throughout the Group, clear objectives and approach to manage risk including risk appetite acceptance levels are established.
2. TTA Risk Governance Structure and ResponsibilitiesThe Group adopts a governance structure that is integrated with its ERM framework, under which a logical and systematic approach is used to identify, analyze, treat and monitor key risks. Risk governance is driven by the Board of Directors, with the support of Risk Management
Committee and Audit Committee. The Risk Management Committee ultimately oversees, supports and monitors risk management in all areas of the Group.
2.1. The Board of Directors and Audit CommitteeRepresenting shareholders’ interests in managing the Group’s risk, the Board of Directors oversees and monitors the overall effectiveness of risk management of the Group where key risks of the businesses are reviewed, monitored and responded to, and overall risk appetite is set in line with the Group’s objectives and goals. The Board of Directors promotes the ‘tone-at-the-top’ to drive a culture of effective risk management and this includes endorsing the TTA Risk Management Framework, and ensuring risk management program is properly implemented within the Group as part of good corporate governance. The Audit Committee, which oversees the risk management process and practice throughout the Group, ensures the adequacy of control frameworks to manage risks and it remains effective and complies with the established framework.
2.2. TTA Risk Management CommitteeProviding an independent oversight on the risk exposures faced by the Group, the Risk Management Committee is to assist the Board of Directors to fulfill their responsibilities in managing the Group’s risk. The Risk Management Committee has responsibility to recommend risk appetite levels, risk policies and controls, and to monitor all risk categories including strategic, operational, financial and compliance. These material risks are reviewed and discussed extensively at the Risk Management Committee quarterly meetings, where the Risk Management Committee would ensure appropriate mitigation plans are in place and implemented. Other core responsibilities include:
Improves and determines risk management governance and reporting
Review and approve risk management framework, policies, strategies and plans
Review and monitor TTA risk exposure
Promote and provide support to the execution of risk management program within the Group
Share quarterly risk information to the Audit Committee for audit planning purposes
risk factors

087
ANNUAL REPORT 2015
2.3. Risk Management at the Group LevelTo facilitate risk governance support to the Board of Directors, TTA has established corporate functions at the Group Level with assigned responsibilities to focus and contribute to the implementation and improvement of risk management process. This includes the setting up of management and monitoring system for risks that may have a material and pervasive impact upon TTA’s businesses.
2.3.1. Corporate Risk ManagementReporting to the TTA Risk Management Committee, Corporate Risk Management is responsible for establishing policies, and implementing risk management strategies and policies approved by the TTA Risk Management Committee throughout the Group. This function includes the coordination with business unit risk champions to review risk management outcomes of key risks, which may impact TTA’s both short and long-term goals, and the reporting and monitoring of these risks and mitigation plan to the TTA Risk Management Committee. Apart from these, the corporate unit promotes sharing of risk management knowledge and creates risk management culture throughout the Group.
2.3.2. Corporate ComplianceCorporate compliance is tasked to ensure the Group and its processes are managed with sufficient policy and procedures designed to limit and mitigate risk. With the ultimate aim to safeguard people and protect assets, and shareholders’ interests, the unit ensures that business units/functions comply with laws and regulations, and all non-compliance is reported to the Audit Committee.
2.3.3. Corporate Internal AuditInternal Audit strengthens overall risk governance by evaluating the effectiveness and operation of the Group’s ERM Framework. Reporting to the Audit Committee, Internal Audit conduct independent validation of controls established to address risks and implementation status of agreed upon response plans. This provides an independent assurance that ERM-related activities are effectively performed, and there is adequate control framework to manage risks across the Group.
2.3.4. Other FunctionsThis includes corporate risk owners/units that may be responsible for managing risks which may have a pervasive impact upon TTA operations or reputation which require specialized expertise such as the Business Continuity
Management and Disaster Recovery Plan (to manage risks resulting in business interruption and information technology risk), or Corporate Communication unit (to manage risks affecting to the Company’s reputation and image).
2.4. Risk Management at the Business UnitTo ensure efficient risk management and timely and appropriate response to business risks, each business unit is tasked with the responsibility of identifying and mitigating key risks and ensures reporting to the Corporate Risk Management unit for onward reporting to the TTA Risk Management Committee. TTA plans to strengthen the business unit risk management governance further with the new requirement set by TTA Risk Management Committee for each business unit to establish its own Business Unit Risk Management Committee. Each of these committees will comprise executive officers of the business unit and will enable more early risk detection to generate proactive risk management. The Business Unit Risk Management Committee will be responsible to determine risk management structure and strategies, and drive the implementation of risk management program within its business unit and report to the TTA Risk Management Committee on a quarterly basis.
3. TTA Risk Management ProcessTTA Risk Management process is a systematic application of management policies, procedures and practices in identifying, assessing, responding, monitoring and reporting risks. Extreme/high risks exposure areas are identified and assessed with regards to their impact on the Group’s operations, financial performance and reputation and mitigating actions are established and closely monitored. The TTA Risk Management Process comprises:
3.1 Risk IdentificationAn ongoing process, it begins with having a clear understanding of business objectives and how the achievement of these objectives could be impacted. Facilitating the risk identification process, TTA developed a risk universe which covers all risks that could potentially impact business performance, and this includes strategic risk, operational risk, market risk, credit risk and external risk.
3.2 Risk AssessmentThis process involves considering the impact of risks identified to the organization and the likelihood that these risks will occur and ranking them in the order of significant to the business. Risk owners are supported with various
risk factors
088
THORESEN THAI AGENCIES PLC.
tools e.g. benchmarking, scenario analysis, among others to assess the likelihood, severity and manageability of risk and the results are compared to specified risk limits in accordance with risk appetite. Both risk criteria and limits by themselves are subject to periodic reviews to ensure that they continue to support business objectives, address business risks effectively and take into consideration the prevailing business climate, opportunity and risk appetite within TTA.
3.3 Risk ResponseWith the objective to reduce risks which are beyond the Group’s risk appetite and to achieve a target risk ranking acceptable to the Group, TTA adopts the appropriate risk mitigation strategy e.g. Accept, Avoid, Mitigate, Transfer and Exploit to manage risk. If the residual risk remains higher than specified risk limit, risk owners have to develop action plans to reduce either likelihood or impact of the identified risks until they are within acceptable level.
3.4 Risk Reporting and MonitoringRisk management outcome are reported to the management including business unit heads, and TTA Risk Management Committee. This will then be presented to the Board of Directors on a quarterly basis.
All investment proposals need to include an assessment of key factors which could carry potential risks, such as alignment with strategic objectives, operational controls, financial viability, potential contingent liabilities, specific country laws and regulations, technical competency and available resources, for the approving authority’s deliberation.
Key Risks and Mitigation Measures
1. Strategic Risk
1.1 Strategy Implementation RiskWhile the Group may take risks into account when making strategic decisions and planning, the failure to identify and implement the correct strategy may adversely impact the Group. This could be made worse if the Group fail to react smartly to changes in the business environment. TTA manages this risk by creating a system a process to periodically review its strategic plans which have been defined by each business unit with focus on preserving its competitiveness, investment expansion to supplement business value. Every month, TTA Executive Committee meets to monitor the Group performance and exchange
views on adjusting business plans and short-term strategies to ensure confidence in reaching such goals. This includes prompt report to the President & CEO if there is a need to change TTA’s business direction. In addition, information from reliable institutions and other sources are compared to check information creditability and analyze differences among various assumptions. TTA also consults with external experts and enhances internal skills to forecast economic, social and other related conditions.
1.2 New Investment RiskTTA is seeking new business investments as a means of business diversification and creating shareholder value. This may be difficult to source, and even if TTA is successfully in finding new business investment, the investment could be undermined by unfavorable factors arising from project funding, joint venture partners, project assumptions, business environment, regulations, markets and competition. To ensure that the necessary prudence is exercised in all investment decisions, the Group has in place an investment approval process whereby a disciplined approach is taken to review the key risks and opportunities presented by potential investments. As part of our investment approval process, all new investments and transactions are reviewed extensively by leveraging cross-functional teams so as to ensure best investment opportunities are presented to the Executive Committee and Board of Directors for final review and approval.
1.3 Joint Venture/Strategic Partner RiskThe Group participates in several joint venture and partnership arrangements which its partners could have economic or business interests or goals that are inconsistent with the Group, and may take action contrary to the Group interest. To mitigate the risk, the Group deliberates on selection of new joint venture and strategic partners extensively and ensures all relevant agreements in association with these joint ventures or strategic partners are legally water tight to protect the Group’s interest.
1.4 Reputation RiskTTA General Business Code of Conduct governs how TTA and its individual companies conduct their affairs. It is a challenge for us to ensure all these including our employees are been complied, and failure – real or perceived – to follow these principles, or other real or perceived failures of governance or regulatory compliance, could harm our reputation. This could impact our license to operate, damage our franchise, harm our ability of secure new resources, limit our ability to access the capital market and affect our operational performance and financial condition.
risk factors
089
ANNUAL REPORT 2015
Reputational risk could arise from a host of areas including transparency and fairness in business practices, workplace safety, environmental responsibility, community and social recognition.
To manage these risks, TTA constantly review its business conduct and define future business directions as to strike a balance in ensuring continued strong reputation among its stakeholders. The Group is also committed to an effective, appropriate and equitable communication with all relevant stakeholders. Though the Investor Relations and Corporate Communications unit, the Group communicates and disseminates information effectively to shareholders, analysts, relevant media agencies and the general public, and this includes quarterly meetings with analysts and investors, investor conference, road show, disclosure of periodic reports such as quarterly financial results and press release, as well as disclosure of non-periodic report such as asset disposition and acquisition, and investment.
2. Financial Risk
2.1 Market RiskThe Group’s business activities are exposed to various market risks, including those related to foreign exchange, commodity prices and interest rates which are inherently volatile and unpredictable. To manage these risks, the Group utilizes various financial instruments, including foreign exchange forwards, interest rate swap, freight forward agreement (FFA), bunker swap contracts and purchase of options. To the extent the group can naturally hedge its market risks, for example, matching foreign currency loans with foreign currency revenues, the Group will manage uncovered risk. The use of financial instruments is strictly controlled by policies and authority limits approved by the Board of Directors.
2.2 Credit RiskCredit risk arises when counterparties fail to fulfill their contractual obligations. The Group generally deals with counterparties with satisfactory creditworthiness and this is achieved by evaluating and monitoring default and credit risks of customers, suppliers, contractors, joint venture partners and financial institutions. Credit evaluations are performed on counterparties from time to time based on an appropriate approach. On a case-by-case basis, additional securities and shorter payment terms will be required as mitigation measures when dealing with counterparties of weaker credit standing. The Group also reviews material concentration risk with individual counterparties or geographically.
2.3 Liquidity/Funding RiskTTA manages this risk with the goal to ensure it has sufficient funds to meet working capital needs and to drive the company’s growth be it for business expansion or mergers and acquisitions. Apart from maintaining good relationship with financial institutions, TTA has established a well-functioning system for cash flow planning, budgeting, and forecasting to assess the short-term and medium to long-term liquidity needs. These measures include centralizing cash management, and maintaining a reasonable level of funds and access to credit facilities, and constant monitoring and stress testing cash flows to ensure financial stability. The Group has secured committed credit lines with reputable local and international banks.
3. Operational Risks
3.1 Health, Safety and Environmental (HSE) RiskTTA business operations may be subjected to increasingly tough legislation and regulations in relation to health, safety and environmental. Given the importance of HSE, TTA has been focused on actively managing the group-wide HSE risks associated with our activities and services where all business are required to strictly monitor, measure, and assess the compliance with applicable laws and regulations. If certain business fails to comply, corrective and preventive measures would be undertaken to mitigate the risk. Other group efforts include campaigns such as zero accident programs and audits where we systematically conduct health and environmental safety checks at all locations.
3.2 Human Resource RiskThe nature of the Group’s operation requires highly skilled and competent personnel to run the business. Some of these expertises can be limited, in particular certain markets; and the Group must compete against other companies inside and outside the industry for qualified and experienced employees. Failure to attract and retain these employees may affect the success of the Group’s operations and consequently impact on its performance. TTA believes that strong human capital talent is key to help the Group achieve its objectives, and TTA offers competitive compensation and benefit program to attract and retain talents. TTA has also recently initiated its succession planning program in order to ensure knowledge and skills to be passed on. TTA strives to create a positive environment for employees, where every employee can continue to develop their careers and have a healthy work-life balance.
risk factors
090
THORESEN THAI AGENCIES PLC.
3.3 Crisis Management and Business ContinuityIt is part of the Group’s risk management initiative to address and manage potential threats and disruptions to operations arising from events such as an epidemic outbreak, act of terrorism, natural calamities and damage to critical facilities. With the aim of resuming key business operations within a pre-established targeted timeframe, TTA is working towards each business unit establishing their specific business continuity and crisis response plans. This will ensure limited business disruption and provide effective response to unforeseen events.
4. Compliance and External Risks
4.1 Business Environment RiskWith operations extending across the globe, TTA continuously assess and monitor country- specific risks of the countries in which it operates, considering social-economic factors, legal and tax systems, to political climate, intra-country conflicts and natural calamities. These risk assessments are regularly conducted to enable the group to identify potential and emerging risks and respond by formulating appropriate risk management strategies. The Group also put in place various insurance policies to cover potential losses, which can mitigate the impact of these risks to some extent.
4.2 Regulatory ChangesThe Group operates globally and can be subjected to regulatory changes in multiple jurisdictions. TTA strive to fully comply with all laws and regulations and compliance checklists are developed for each business unit to ensure they comply with relevant laws and regulations.
Even in instances where there are still uncertainty on the potential change in regulations, TTA will take all possible measures to protect its own legal position and prevent the development of legal/regulatory risks.
Reflecting the Group’s commitment, TTA General Business Code of Conduct governs how TTA and its individual companies conduct their affairs and ensures compliance. The initiative is supplemented with a Whistle Blower Line for reporting compliance violations.
4.3 Social and Community RiskSome of the Group’s current and potential operations are located in or near communities that may regard the operation as being detrimental to their environment. Community expectations are typically complex with the potential for multiple inconsistent stakeholder views that may be difficult to resolve. Stakeholder opinion and community acceptance can be subject to many influences such as those from related industries, operations of other groups, local, regional or national events in other places where we operate. This could have significant impact to our operations, and to address these risks, TTA monitors and analyzes the impacts of changes in environmental and safety laws and regulations on our operations. We closely coordinate with government agencies, and apply available information to develop work plans and response measures including continuous CSR program to focus on community and ensure ongoing community relations activities in operating areas.
Building a Strong Corporate Risk CultureWhile the Group can continuously seek to strengthen its risk management practices, risk management will never succeed as much if the organization does not practice and instill a strong corporate risk culture. Starting from the top, TTA executives communicate the significance of risk management and make risk management the responsibility of every member of the organization. Such strong management commitment enables the Group to be better equipped in managing risks in the dynamic business environment, both locally and internationally and risk management is integrated into the day-to-day business operations. These contribute to a stronger risk culture which will ultimately help add value to the entire value chain.
risk factors
091
ANNUAL REPORT 2015
Audit Committee reportFor the year ended 31 December 2015
To the Shareholders
The Audit Committee (the “Committee”) consists of three independent directors, Mr. Krish Follett (the Chairman), Mr. Santi Bangor, and Mr. Cherdpong Siriwit who are independent and non-executive directors. The Secretary to the Committee is Mr. Somchart Surakittidamrong, who also serves as Director, Internal Audit (Chief Audit Executive “CAE”). All the Committee’s members have adequate qualifications and discharge their duties as set forth as specified by the Audit Committee Charter and in accordance with the Securities and Exchange Commission and the Stock Exchange of Thailand regulations.
In 2015, the Committee held seven meetings with 100% attendance by the members. The key responsibilities of the Committee are to assist the Board in fulfilling its oversight responsibilities in relation to financial reporting, the effectiveness of the system of risk management and internal control, compliance with relevant legal and regulatory requirements, monitoring the qualifications, expertise, resources and independence of both the internal and external auditors, and assessing the auditor’s performance and effectiveness. The Committee keeps the Board informed of the Committee’s activities and recommendations. Where the Committee is not satisfied with, or considered action or improvement are required concerning any aspect of risk management and internal control, financial reporting, or audit-related activities, it promptly reports these concerns to the Board. The Committee’s significant activities have been summarized below.
1. Review of Financial Statements
The Committee has reviewed and discussed with the external auditor and management responsible for preparing the financial report in relation with significant information for the Company’s and consolidated financial statements, including changes in significant accounting policy, significant related party transaction, significant acquisition and disposal of the Company’s asset, accuracy and adequacy of information disclosure, significant unusual and estimated transaction, if any, for the benefit of investors or users of such statements before submitted to the Board of Directors for approval. In carrying out the review, the Committee reviewed independent papers from both the management and the external auditor, highlighting any significant areas of risk or judgment that have arisen in the period.
In addition, the Committee held meetings with the external auditors without the presence of the Company’s management so as to freely discuss important issues which may arise including the problems or difficulties in performing their duties as well as to hear whether there was any suspicious information indicating potential fraud following Section 89/25 of the Securities and Exchange Act B.E.2535 as amended by the Securities and Exchange Act (No.4) B.E. 2551. In 2015, the external auditors did not discover any material misstatements or indications of suspicious incidents. The Committee is of the opinion that the Company has a proper financial reporting process to disclose its financial information, in which the financial statements were free from material misstatement and prepared in accordance with Thai Financial Reporting Standards.
2. Internal Control
The Committee approved the audit plan for 2015 as well as reviewed the Internal Audit Department’s independence, resource sufficiency and also evaluated the performance of Director of Internal Audit. The Committee evaluated management control systems, financial control systems and compliance control systems, based on guidelines from the office of the Securities and Exchange Commission. Internal auditors have also followed up on the results of the aforesaid review and the results of the audit and the recommendations were discussed with the related staff and management prior to report to the Committee in every quarter. In addition, the external auditor has also reported that was no significant deficiency impacting to the Company’s financial statements identified. The Committee, therefore, is of the opinion that the Company has proper and adequate internal control systems including organizational control and environment measure, risk management measure, management control activities, information and communication measure, and monitoring systems, as management determines is necessary and there are no significant deficiencies identified.
3. Regulatory Compliance
The Committee held meeting with the Compliance Department to review the Company’s compliance with the laws and regulations. The Internal Auditors have also reviewed the connected transactions or transactions that may lead to conflicts of interests ensuring that the occurred transactions have complied with the Securities and Exchange Commission and the Stock Exchange of Thailand regulations requirements, other regulatory bodies and are reasonable and for the highest benefit of the Company. The result of the review has been reported to the Committee and subsequently the Board of Directors. The Committee also ensures that transactions
audit committee report

092
THORESEN THAI AGENCIES PLC.
are transparency, reasonable, fair, without conflict of interest, in all material respects, and for the highest benefit of the Company. The Committee is of the opinion that the Company has been in compliance with significant laws and regulations to which the operations of the Company are subjected.
4. Whistleblowing
The Committee acknowledges any concern of misconduct or fraud and reviews the final investigation reported by Internal Auditors according to Whistleblower Policy. No concern on misconduct or fraud was reported during this year.
5. Appointment of the External Auditors
The Committee assessed the scope, objectivity and effectiveness of the audit process and also the appropriateness of the fees which included considering a number of areas such as the overall quality of services, timeliness of the resolution of issues, the quality of the audit resource including knowledge and experience in core businesses and whether the audit plan was followed.
After careful consideration, the Committee has recommended to re-appoint KPMG Phoomchai Audit Ltd. as external auditors to the Board of Directors before seeking approval at the Shareholders’ Meeting for the appointment of Mrs. Siripen Sukcharoenyingyong, Certified Public Accountant Registration No. 3636; and/or Mr. Charoen Phosamritlert, Certified Public Accountant Registration No. 4068; and/or Mr. Veerachai Ratanajratkul, Certified Public Accountant Registration No. 4323; and/or Miss. Pornthip Rimdusit, Certified Public Accountant Registration No. 5565; all of KPMG Phoomchai Audit Ltd., as the external auditors of the
Company for the year ended 31 December 2016 with the audit fees for TTA and the Group companies amounting to Baht 3.70 million and Baht 19.35 million, respectively.
6. The Audit Committee Self-Assessments
The Committee carried out its own performance assessment for both group and individual basis, against the Audit Committee Charter approved by the Board of Directors, relevant laws and regulations and assignment from the Board of Directors. The self-assessment was conducted as a benchmark against guidelines from the Securities and Exchange Commission and concluded that it was excellent and effective.
In summary, the Committee has continuously performed its duties and responsibilities with knowledge, ability, carefulness and sufficient independence, provided comments and recommendations which were beneficial to all of the Company’s stakeholders. The Committee values internal control and continuous risk management so that the Company may command good corporate governance as well as management excellence, adequate internal control compatible with its business, effective risk management, together with accurate and reliable accounting practices and financial statements, and compliance with relevant laws and regulations.
For and on behalf of the Audit Committee of Thoresen Thai Agencies Public Company Limited
Krish FollettChairman of the Audit Committee
audit committee report
093
ANNUAL REPORT 2015
internal Control and risk managementFor the year ended 31 December 2015
“TTA consistently recognizes the importance of internal control. The Management appoints the Internal Audit Department to assess the adequacy and effectiveness of internal control, whereas the Board of Directors appoints the Audit Committee to provide oversight to ensure that the internal control supports the achievement of business operations, accurate and reliable reporting, and compliance according to laws and regulations”
Internal ControlThe Company designed and followed the internal control system adequately in order to minimize key risks potentially harmful to the company’s operations, and once control deficiencies are detected, they will continuously be improved to suit the current and future businesses as well as to comply with related laws and regulations.
The Board of Directors (the “Board”) is ultimately responsible for TTA’s effective system of internal controls and risk management to safeguard the Company’s assets and all stakeholders’ interests, and it discharges its duties in this area by:
Determining the nature and extent of the significant risks it is willing to accept in achieving the Company’s strategic objectives (the Board’s risk appetite); and
Ensuring that management implements effective systems of risk identification, assessment and mitigation.
The Audit Committee (“AC”) has been delegated the responsibility for reviewing the effectiveness of the TTA’s internal controls. The AC uses information drawn from a various sources to carry out their responsibilities including:
Objective assurance provided by Internal Audit through its annual work plan, which is approved by the AC and focuses on the principal risks identified in the risk assessment and key internal controls;
Regular reported on the internal audit and internal control results, compliance approaches and highlighting any significant issues;
Further objective assurance is provided by external auditors.
The Internal Audit Department (“IAD”) is an independent department that functional reports directly to the AC and administratively reports to President & CEO. The IAD assists the AC and the Board by performing regular assessments and evaluations on TTA’s key internal controls system.
IAD has adopted a risk-based approach in formulating the annual audit plan which focuses on key business risks that might have an impact on business goals and the accuracy of financial reports. This plan is reviewed and approved by the AC on the annual basis. The AC also reviews the audit results and progress reports on a quarterly basis.
Issues arising are considered to identify pervasive themes. Significant issues are reported to the AC and the Board. The AC monitors resolution of any identified control issues through to a satisfactory conclusion. In addition, regular reports are made to the AC and the Board by management, internal audit and compliance functions covering in particular business, financial, operational controls and compliance.
TTA’s internal control procedure is based on the regulations of The Committee of Sponsoring Organizations of the Treadway Commission (COSO). The key control systems implemented by the Company are summarized below.
1. Control Environment
The control environment is the foundation of an effective internal control system, and provides discipline and structure for all the other components. The main elements of the Company’s control environment are as follows:
TTA clearly defines, encourages and promotes a good working environment by setting policy and planning, executing, controlling and monitoring all business activities.
TTA adheres to its business philosophies and ethics through the actions and behavior to support the functioning of the internal control system. The Codes of Conduct have also been developed as guidelines for directors, management and employees.
The Board and management at all levels demonstrate through their directives, actions, and behavior the important of integrity and ethical values. All stakeholders are treated with fairness and respect and in such a way that adheres to good corporate governance principles.
There is an organizational chart that clearly defines the lines of management authority and responsibility according to a suitable organizational structure, business size and operations.
The Company has implemented a Whistleblower Policy for reporting fraud, errors and misrepresentation or false statements made by the executives. Whistleblower reports are quarterly reviewed by the AC.
internal control and risk manaGement

094
THORESEN THAI AGENCIES PLC.
2. Risk Assessment
Risk management policy, standard and guideline are put in place, emphasizing that risk management is the responsibility of the directors, management and all employees which must follow to achieve the Company’s business objectives.
The Board appointed the Risk Management Committee who responsible for with the review of the risk management policy framework and structure, and with the provision of recommendations on risk management that agree with strategic business directions and business plan, while supervising, monitoring and reviewing key outcomes of risk management reporting to ensure their alignment with standards and prevailing circumstances.
3. Control Activities
TTA focuses on efficient control activities that are in line with acceptable risks and appropriate for the business circumstances and activities of each department. These control activities are implemented through regulation, policy and working procedures, which also reviewed and improved continuously. The transactions amongst the Company and its related parties have been carefully controlled and conformed to the Securities and Exchange Commission and the Stock Exchange of Thailand regulations requirements and other regulatory bodies. TTA employees are encouraged to recognize the important of strictly complying with the control activities as well as related laws and regulations. This is to reduce risks covering various aspects, especially fraud risk and preventing violation of the laws.
4. Information and Communication
Information technology has been developed to ensure efficient business operations. TTA recognizes the importance of accuracy, reliability, and prompt information for decision making. It also has an effective information security system, including a contingency plan to protect the information system when there are serious incidents that may cause system failure. Furthermore, TTA deploys an audit trail system that can track back and review historical data. TTA also maintains an information system to analyze data and indicate any risk area, for which comprehensive records and reports are available. Besides, TTA has complied the Computer Offense Act and computer traffic data as requires by the Ministry of
Information and Communications Technology. TTA also has invested in an effective communication system, including internal and external channels. The internal communication manages through various channels. Documents for the shareholders’ meetings and the Board’s meetings have been delivered ahead of the meetings and contain sufficient information for the shareholders or the Board to make decisions in appropriated time.
5. Monitoring
Since the existing systems provide prompt and reliable information on a regular basis, management and the Board can therefore achieve proper monitoring over relevant financial reports in an effective manner and support the business objectives and goal achievement. At the same time, they can also perform an accurate review and assessment, and suggest improvement over existing business plans, supported by effective internal supervision carried out by the IAD throughout the period.
The internal audit works according to audit plan that is approved and monitored by the AC. The plan is based on the risk assessment and encompasses prioritized companies, key business areas and processes. The results of the performed audits and following up observations are reported to the AC and the Board. No significant control deficiencies have been reported to date. However, recommendations regarding internal controls have been provided in some areas.
The Board formally reviews the effectiveness of the system of internal control at least annually. Processes are in place for identifying, evaluating and managing the significant risks facing the Company in accordance with the Internal Control Assessments Guidance published by the Securities and Exchange Commission.
At the Board’s meeting No. 3/2016, held on 29 February 2016 with the Audit Committee present, the Board assessed the above five components of the Company’s internal control systems. The Board concluded that the Company’s internal control systems were found to be adequate and effective, with no material deficiency.
KPMG Phoomchai Audit Ltd., the Company’s external auditors, who concluded the audit of the financial statements for the year ended 31 December 2015, concluded that there was no material deficiency in the Company’s accounting and financial control system.
internal control and risk manaGement
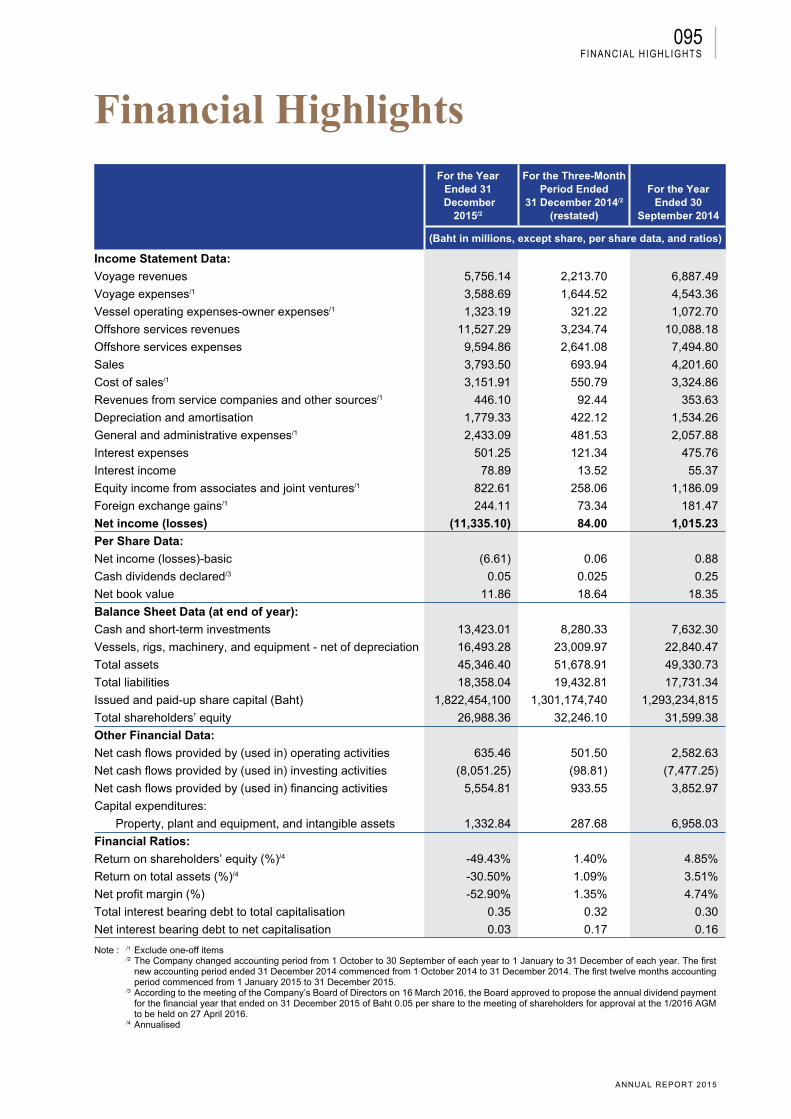
095
ANNUAL REPORT 2015
Financial highlightsFor the Year
Ended 31 December
2015/2
For the Three-Month Period Ended
31 December 2014/2
(restated)
For the YearEnded 30
September 2014
(Baht in millions, except share, per share data, and ratios)
Income Statement Data:
Voyage revenues 5,756.14 2,213.70 6,887.49
Voyage expenses/1 3,588.69 1,644.52 4,543.36
Vessel operating expenses-owner expenses/1 1,323.19 321.22 1,072.70
Offshore services revenues 11,527.29 3,234.74 10,088.18
Offshore services expenses 9,594.86 2,641.08 7,494.80
Sales 3,793.50 693.94 4,201.60
Cost of sales/1 3,151.91 550.79 3,324.86
Revenues from service companies and other sources/1 446.10 92.44 353.63
Depreciation and amortisation 1,779.33 422.12 1,534.26
General and administrative expenses/1 2,433.09 481.53 2,057.88
Interest expenses 501.25 121.34 475.76
Interest income 78.89 13.52 55.37
Equity income from associates and joint ventures/1 822.61 258.06 1,186.09
Foreign exchange gains/1 244.11 73.34 181.47
Net income (losses) (11,335.10) 84.00 1,015.23
Per Share Data:
Net income (losses)-basic (6.61) 0.06 0.88
Cash dividends declared/3 0.05 0.025 0.25
Net book value 11.86 18.64 18.35
Balance Sheet Data (at end of year):
Cash and short-term investments 13,423.01 8,280.33 7,632.30
Vessels, rigs, machinery, and equipment - net of depreciation 16,493.28 23,009.97 22,840.47
Total assets 45,346.40 51,678.91 49,330.73
Total liabilities 18,358.04 19,432.81 17,731.34
Issued and paid-up share capital (Baht) 1,822,454,100 1,301,174,740 1,293,234,815
Total shareholders’ equity 26,988.36 32,246.10 31,599.38
Other Financial Data:
Net cash flows provided by (used in) operating activities 635.46 501.50 2,582.63
Net cash flows provided by (used in) investing activities (8,051.25) (98.81) (7,477.25)
Net cash flows provided by (used in) financing activities 5,554.81 933.55 3,852.97
Capital expenditures:
Property, plant and equipment, and intangible assets 1,332.84 287.68 6,958.03
Financial Ratios:
Return on shareholders’ equity (%)/4 -49.43% 1.40% 4.85%
Return on total assets (%)/4 -30.50% 1.09% 3.51%
Net profit margin (%) -52.90% 1.35% 4.74%
Total interest bearing debt to total capitalisation 0.35 0.32 0.30
Net interest bearing debt to net capitalisation 0.03 0.17 0.16
Note : /1 Exclude one-off items /2 The Company changed accounting period from 1 October to 30 September of each year to 1 January to 31 December of each year. The first
new accounting period ended 31 December 2014 commenced from 1 October 2014 to 31 December 2014. The first twelve months accounting period commenced from 1 January 2015 to 31 December 2015.
/3 According to the meeting of the Company’s Board of Directors on 16 March 2016, the Board approved to propose the annual dividend payment for the financial year that ended on 31 December 2015 of Baht 0.05 per share to the meeting of shareholders for approval at the 1/2016 AGM to be held on 27 April 2016.
/4 Annualised
financial HiGHliGHts
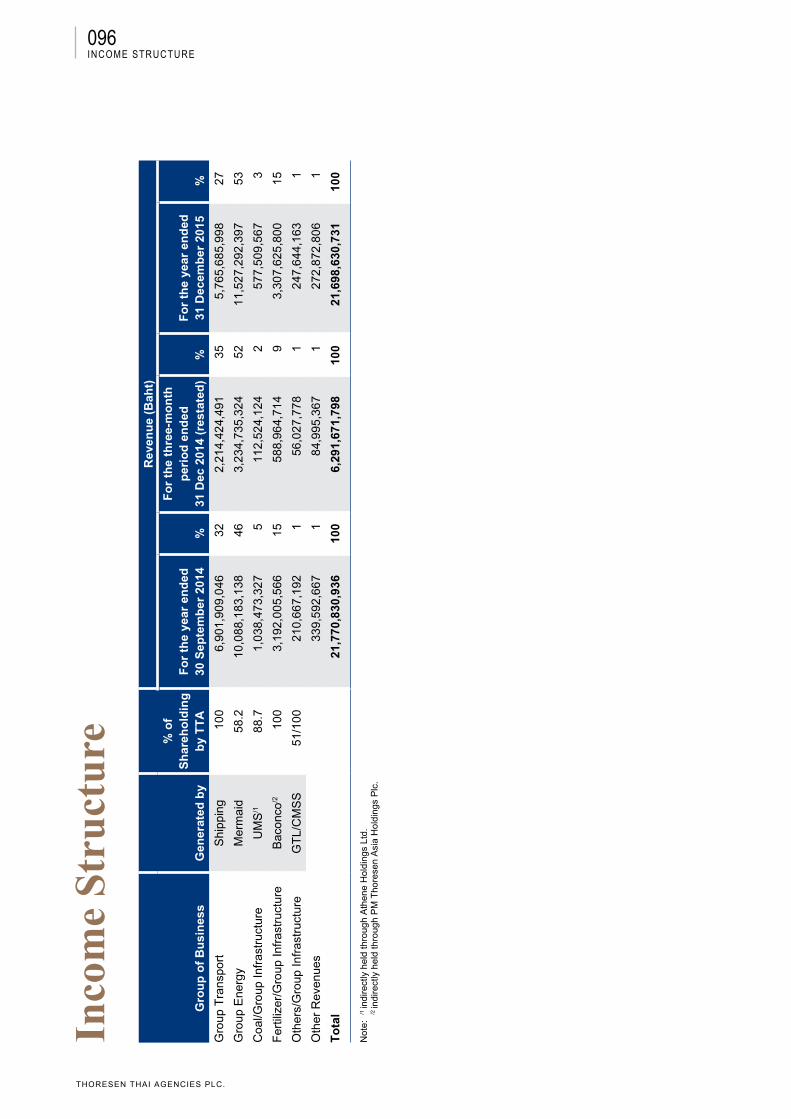
096
THORESEN THAI AGENCIES PLC.
Gro
up
of
Bu
sin
ess
Gen
erat
ed b
y
% o
f S
har
eho
ldin
g
by
TT
A
Rev
enu
e (B
aht)
Fo
r th
e ye
ar e
nd
ed
30 S
epte
mb
er 2
014
%
Fo
r th
e th
ree-
mo
nth
p
erio
d e
nd
ed
31 D
ec 2
014
(res
tate
d)
%F
or
the
year
en
ded
31
Dec
emb
er 2
015
%
Gro
up T
rans
port
S
hipp
ing
100
6,90
1,90
9,04
632
2,21
4,42
4,49
135
5,76
5,68
5,99
827
Gro
up E
nerg
yM
erm
aid
58.2
10,0
88,1
83,1
3846
3,23
4,73
5,32
452
11,5
27,2
92,3
9753
Coa
l/Gro
up In
fras
truc
ture
UM
S/1
88.7
1,03
8,47
3,32
75
112,
524,
124
257
7,50
9,56
73
Fer
tiliz
er/G
roup
Infr
astr
uctu
reB
acon
co/2
100
3,19
2,00
5,56
615
588,
964,
714
93,
307,
625,
800
15
Oth
ers/
Gro
up In
fras
truc
ture
GT
L/C
MS
S51
/100
210,
667,
192
156
,027
,778
124
7,64
4,16
31
Oth
er R
even
ues
339,
592,
667
184
,995
,367
127
2,87
2,80
61
To
tal
21,7
70,8
30,9
3610
06,
291,
671,
798
100
21,6
98,6
30,7
3110
0
Not
e:
/1 in
dire
ctly
hel
d th
roug
h A
then
e H
oldi
ngs
Ltd.
/2
indi
rect
ly h
eld
thro
ugh
PM
Tho
rese
n A
sia
Hol
ding
s P
lc.
inco
me
stru
ctur
eincome structure
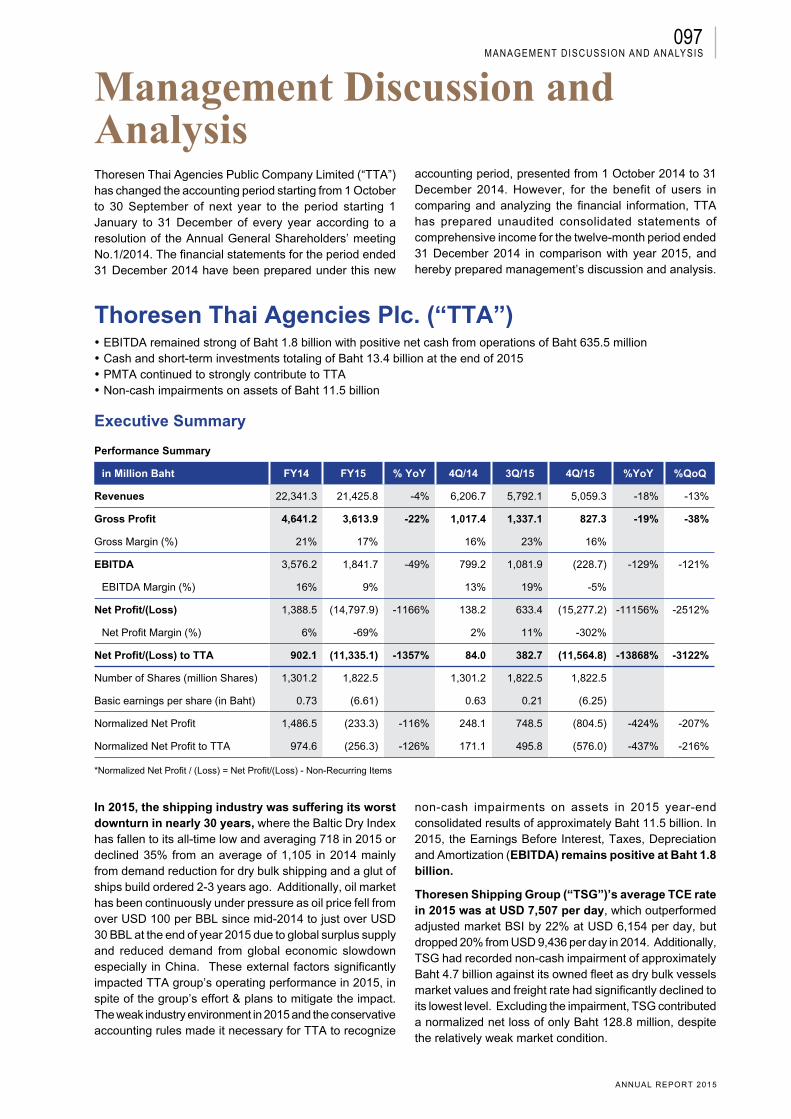
097
ANNUAL REPORT 2015
ManageMent Discussion anD analysis
management discussion and Analysis Thoresen Thai Agencies Public Company Limited (“TTA”) has changed the accounting period starting from 1 October to 30 September of next year to the period starting 1 January to 31 December of every year according to a resolution of the Annual General Shareholders’ meeting No.1/2014. The financial statements for the period ended 31 December 2014 have been prepared under this new
accounting period, presented from 1 October 2014 to 31 December 2014. However, for the benefit of users in comparing and analyzing the financial information, TTA has prepared unaudited consolidated statements of comprehensive income for the twelve-month period ended 31 December 2014 in comparison with year 2015, and hereby prepared management’s discussion and analysis.
Thoresen Thai Agencies Plc. (“TTA”)·EBITDA remained strong of Baht 1.8 billion with positive net cash from operations of Baht 635.5 million·Cash and short-term investments totaling of Baht 13.4 billion at the end of 2015·PMTA continued to strongly contribute to TTA·Non-cash impairments on assets of Baht 11.5 billion
Executive Summary
Performance Summary
in Million Baht FY14 FY15 % YoY 4Q/14 3Q/15 4Q/15 %YoY %QoQ
Revenues 22,341.3 21,425.8 -4% 6,206.7 5,792.1 5,059.3 -18% -13%
Gross Profit 4,641.2 3,613.9 -22% 1,017.4 1,337.1 827.3 -19% -38%
Gross Margin (%) 21% 17% 16% 23% 16%
EBITDA 3,576.2 1,841.7 -49% 799.2 1,081.9 (228.7) -129% -121%
EBITDA Margin (%) 16% 9% 13% 19% -5%
Net Profit/(Loss) 1,388.5 (14,797.9) -1166% 138.2 633.4 (15,277.2) -11156% -2512%
Net Profit Margin (%) 6% -69% 2% 11% -302%
Net Profit/(Loss) to TTA 902.1 (11,335.1) -1357% 84.0 382.7 (11,564.8) -13868% -3122%
Number of Shares (million Shares) 1,301.2 1,822.5 1,301.2 1,822.5 1,822.5
Basic earnings per share (in Baht) 0.73 (6.61) 0.63 0.21 (6.25)
Normalized Net Profit 1,486.5 (233.3) -116% 248.1 748.5 (804.5) -424% -207%
Normalized Net Profit to TTA 974.6 (256.3) -126% 171.1 495.8 (576.0) -437% -216%
*Normalized Net Profit / (Loss) = Net Profit/(Loss) - Non-Recurring Items
In 2015, the shipping industry was suffering its worst downturn in nearly 30 years, where the Baltic Dry Index has fallen to its all-time low and averaging 718 in 2015 or declined 35% from an average of 1,105 in 2014 mainly from demand reduction for dry bulk shipping and a glut of ships build ordered 2-3 years ago. Additionally, oil market has been continuously under pressure as oil price fell from over USD 100 per BBL since mid-2014 to just over USD 30 BBL at the end of year 2015 due to global surplus supply and reduced demand from global economic slowdown especially in China. These external factors significantly impacted TTA group’s operating performance in 2015, in spite of the group’s effort & plans to mitigate the impact. The weak industry environment in 2015 and the conservative accounting rules made it necessary for TTA to recognize
non-cash impairments on assets in 2015 year-end consolidated results of approximately Baht 11.5 billion. In 2015, the Earnings Before Interest, Taxes, Depreciation and Amortization (EBITDA) remains positive at Baht 1.8 billion.
Thoresen Shipping Group (“TSG”)’s average TCE rate in 2015 was at USD 7,507 per day, which outperformed adjusted market BSI by 22% at USD 6,154 per day, but dropped 20% from USD 9,436 per day in 2014. Additionally, TSG had recorded non-cash impairment of approximately Baht 4.7 billion against its owned fleet as dry bulk vessels market values and freight rate had significantly declined to its lowest level. Excluding the impairment, TSG contributed a normalized net loss of only Baht 128.8 million, despite the relatively weak market condition.
098
THORESEN THAI AGENCIES PLC.
ManageMent Discussion anD analysis
Mermaid Maritime Public Company Limited (“MML Group”) showed improved revenue of 8% in 2015 driven mainly from the growing cable laying business. The Subsea IRM - Vessels utilization rate maintained at 61% same as in 2014, while the tender rigs (MTR1 and MTR2) were put in cold stack throughout the year 2015. Furthermore, in line with MML Group’s principles of transparency and conservative accounting approach, MML Group had recorded non-cash impairment on assets totaling of Baht 6 billion in 2015 as the global oil and gas industry continues to experience significant challenges from the current oil price environment. Exclusive of the impairment, MML Group contributed a normalized net profit of Baht 52.8 million.
PMTA continued its outstanding profitable performance for TTA in 2015, despite the challenging year from drought in Southeast Asia region with gross profit margin of 24% and growing sales volume of fertilizer of 198,541 tons per year. The demand for factory area for leasing remained very high and faced increasing demand from current customers, the utilization rate achieved 100%. PMTA is constructing a new Baconco 5-B Phase 2 factory area for leasing (capacity of 8,200 sqm) and expected to complete in 1Q/16. PMTA contributed Baht 174.9 million to TTA in 2015.
During the fourth quarter of 2015, the management has of the opinion, based on changes in circumstances, that TTA no longer has significant influence in an associate, Sino Grandness Food Industry Group Limited (“Sino Grandness”), and investment was transferred to long-term investment as at 31 December 2015.
UMS’s sales volume decreased 24% YoY from 339 KTons in 2014 to 259 KTons in 2015. The decline in sales volume was mainly from lower volume of low-margin 0-5 mm size coal, compared to 2014 when the company had been focusing on selling 0-5 mm size coal inventories, and limited financial facilities in some quarters in 2015. Accordingly in 2015, UMS reported net loss of Baht 371.2 million with normalized loss of Baht 100.1 million
Overall in 2015, TTA reported net loss of Baht 11,335.1 million in 2015 with normalized net loss to TTA of Baht 256.3 million. TTA still maintained strong net cash flow from operation of Baht 635.5 million with cash and short-term investments on its consolidated balance sheet totaling to Baht 13.4 billion at the end of 2015.
Change in Accounting Policy
1. From 1 January 2015, TTA has adopted the following new and revised TFRS which have material effect on the TTA’s financial statements: a. TFRS 12 Disclosure of Interests in Other Entitiesb. TFRS 13 Fair Value Measurement
2. Starting from 1 January 2015, the Group changed its accounting policy regarding hedge of foreign currency transactions and interest rates. Therefore, the comparative financial statements for the period of 2014 needed to be restated accordingly.
Summary of events that had significant impact on financial statements in 2015
1. January 2015: TTA completed the 9% acquisition of interest in Sino Grandness via Soleado Holdings Pte. Ltd., a wholly own subsidary, with a value of Baht 610 million
2. March 2015: Capital increased from rights offering, with net amount received after expense of Baht 7,282 million
3. May 2015: IPO of PMTA stock, TTA hold 65% of paid up capital of PMTA (Post-IPO)
4. May 2015: Annual dividend payment of Baht 0.025 per share for the three-month period ended 31 December 2014.
5. July 2015: TTA issued a 3-yr debentures amounting to Baht 2 billion with 4.25% coupon rate to the public and/or institutional investors.

099
ANNUAL REPORT 2015
ManageMent Discussion anD analysis
Consolidated Performance SummaryConsolidated Income Statement
FY14 (Restate) FY15 %YoY
in million Baht (MB) MB % MB % MB %
Revenues 22,341.3 100.0 21,425.8 100.0 (915.5) -4%
Costs (17,700.1) (79.2) (17,811.8) (83.1) 111.8 1%
Gross Profit 4,641.2 20.8 3,613.9 16.9 (1,027.2) -22%
Other Income 164.0 0.7 176.2 0.8 12.2 7%
Gain/(Loss) on Investment (9.2) (0.0) (155.2) (0.7) 145.9 1577%
SG&A (2,401.8) (10.8) (2,615.9) (12.2) 214.1 9%
EBITDA from Operation 2,394.1 10.7 1,019.1 4.8 (1,375.0) -57%
Equity Income 1,182.1 5.3 822.6 3.8 (359.5) -30%
EBITDA 3,576.2 16.0 1,841.7 8.6 (1,734.5) -49%
Depreciation & Amortization (1,597.4) (7.1) (1,779.3) (8.3) 182.0 11%
EBIT 1,978.8 8.9 62.4 0.3 (1,916.5) -97%
Financial Cost (497.7) (2.2) (518.8) (2.4) 21.1 4%
Gain/(Loss) from Foreign Exchange 213.0 1.0 244.1 1.1 31.1 15%
Non-Recurring Items-Impairment on Assets (66.2) (0.3) (11,571.2) (54.0) 11,505.0 17367%
Non-Recurring Items-Other (31.7) (0.1) (2,993.4) (14.0) 2,961.7 9351%
Profit before income tax 1,596.2 7.1 (14,777.0) (69.0) (16,373.2) -1026%
Income Tax Expense (207.7) (0.9) (21.0) (0.1) (186.7) -90%
Net Profit/(Loss) 1,388.5 6.2 (14,797.9) (69.1) (16,186.5) -1166%
Net Profit/(Loss) attributable to Non-controlling interest 486.5 2.2 (3,462.8) (16.2) (3,949.3) -812%
Net Profit/(Loss) attributable to TTA 902.1 4.0 (11,335.1) (52.9) (12,237.2) -1357%
Non-Recurring Items-Impairment on Assets to TTA (49.5) (9,206.8) 9,157.3 18502%
Non-Recurring Items-Other to TTA (23.1) (1,872.1) 1,849.0 8014%
Normalized Net Profit to TTA 974.6 (256.3) (1,230.9) -126%
*Normalized Net Profit/(Loss) = Net Profit/(Loss) - Non-Recurring ItemsNon-Recurring Items - Other includes share of impairment losses from MML’s group drilling associate of Baht 2.2 billion in 2015.
In 2015, consolidated revenues slightly decreased 4% YoY to record at Baht 21,425 million which was mainly from lower revenue contribution from transport group led by dry bulk shipping business as freight rates have declined. Total costs slightly increased 1% YoY to Baht 17,811 million mainly from the energy group due to MML’s learning curve for the cable laying business, especially in the first half of the year. Consequently, gross profit decreased 22% YoY to Baht 3,613.9 million, gross margin of 17% in 2015.
Equity income decreased 30% YoY to Baht 822.6 million in 2015 primarily from lower profit sharing from Asia Offshore Drilling “AOD” (major contributor to the equity income in 2014) as it had to agree on a discount of day rates with the customer in Saudi Arabia starting April 1, 2015.

100
THORESEN THAI AGENCIES PLC.
ManageMent Discussion anD analysis
Statement of Financial Position
As of December 31, 2015, TTA had total assets of Baht 45,346.4 million, decreased by Baht 6,332.5 million from Baht 51,678.9 million as of December 31, 2014. Current assets increased mainly from net cash of Baht 7,282.3
Key Financial Ratio
Financial Ratios 2014 2015 2014* 2015*
Current Ratio (Times) 1.69 1.91 1.69 1.91
EBITDA to Revenue (%) 16.0% 8.6% 16.0% 8.6%
Net Profit to Revenue (%) 4.0% -52.9% 4.4% -1.2%
Return on Total Assets (%) 4.3% -29.4% 3.5% 0.6%
Return on Equity (%) 4.1% -49.4% 4.5% -1.1%
Interest Bearing Debt to Equity (Times) 0.46 0.53 0.46 0.53
Net Interest Bearing Debt to Equity (Times) 0.21 0.04 0.21 0.04
Net Interest Bearing Debt to EBITDA (Times) 1.87 0.53 1.87 0.53
*Normalized Net Profit/(Loss) = Net Profit/(Loss)-Non-Recurring Items
Note:Current ratio = Current assets divided by current liabilities EBITDA to sales revenue = EBITDA divided by sales revenue Net profit on sale revenue = Net profit divided by sales revenue Return on total assets = Net profit divided by average total assets Return on equity = Net profit divided by average total shareholder’s equity Interest Bearing Debt to Shareholders’ Equity = Interest Bearing Debt divided by shareholder’s equity Net Interest Bearing Debt to Shareholders’ Equity = Interest Bearing Debt net from cash and cash equivalent and current investments divided by shareholder’s equity Net Interest Bearing Debt to EBITDA = Interest Bearing Debt net from cash and cash equivalent and current investments divided by EBITDA
45,346
26,988
14,401
3,957
13,423
7,387
18,387
6,149
4,4548,280
51,679
7,128
9,010
27,261
14,979
32,246
Other Non-Current Assets
Property, Plant, and Equipment
Current Assets
Cash and Cash Equivalents +Short-term Investments
Total Equity
Interest Bearing Debt
Other Liabilities
As of December 31, 2014 As of December 31, 2015
million received from right offering, while non-current assets decreased by Baht 11,734.9 million mainly from the decline of property, plant and equipment due to depreciation and non-cash impairment of the assets.
Total liabilities, as of December 31, 2015, were at Baht 18,358 million, a slight decline of Baht 1,074.8 million from the end of 2014 at Baht 19,432.8 million. The decline was mainly from lower interest bearing debts. Total equity decreased by Baht 5,257.7 million from Baht 32,246.1 million at the end of 2014 to Baht 26,988.4 million as of December 31, 2015 mainly due to the decline of retained earnings from non-cash impairments.
Statement of Cash Flows
For the statement of cash flows for the year ended December 31, 2015, TTA had net cash from operating activities of Baht 635.5 million, net cash used in investing activities of Baht 8,051.3 million mainly for short-term investments in marketable securities, dry-docking, purchases of PPE, etc. In addition, TTA had net cash paid from financing activities of Baht 5,554.8 million from loan and debenture repayment, interest payment, dividend payout and etc. Adding up together with beginning cash and cash equivalents as at 1 January 2015, foreign currency translation differences for foreign operations, and the effect of exchange rate changes on balances held in foreign currencies of Baht 7,793.1 million, TTA had cash and cash equivalents at the end of 2015 of Baht 5,932.1 million. Including short-term investments, TTA reported cash and cash equivalents and short-term investments totaling Baht 13,423 million.
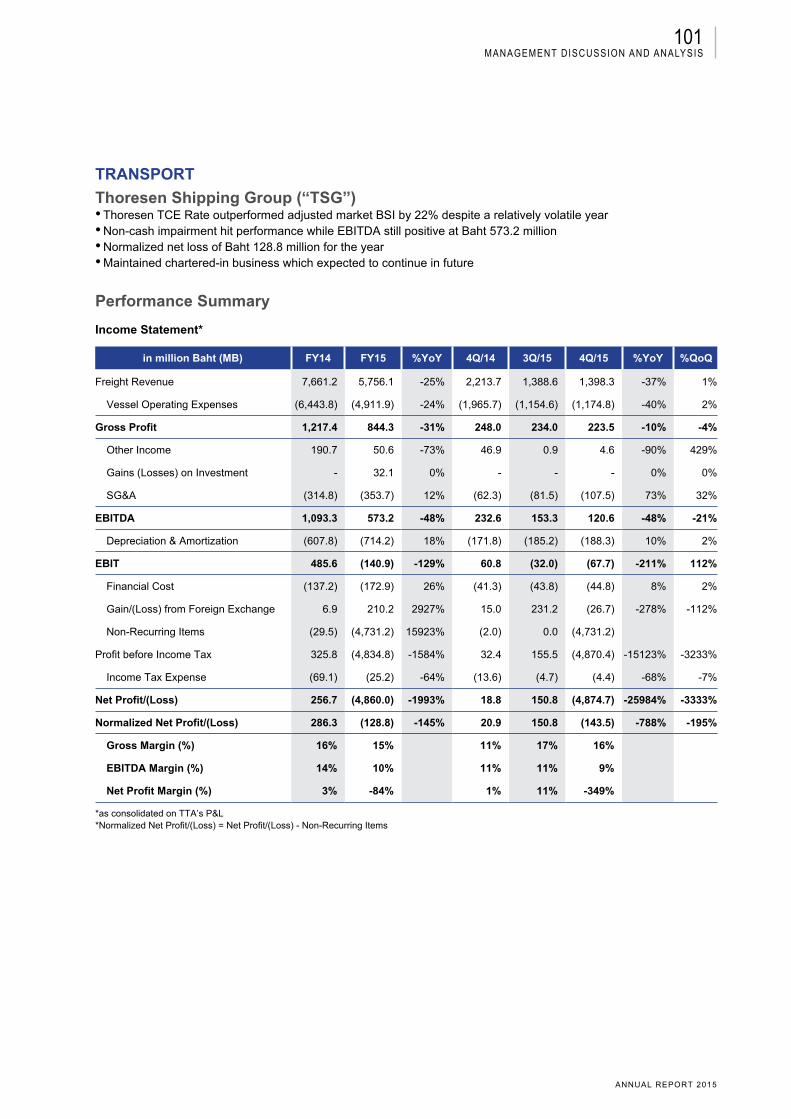
101
ANNUAL REPORT 2015
ManageMent Discussion anD analysis
TRANSPORT
Thoresen Shipping Group (“TSG”) • Thoresen TCE Rate outperformed adjusted market BSI by 22% despite a relatively volatile year• Non-cash impairment hit performance while EBITDA still positive at Baht 573.2 million• Normalized net loss of Baht 128.8 million for the year• Maintained chartered-in business which expected to continue in future
Performance Summary
Income Statement*
in million Baht (MB) FY14 FY15 %YoY 4Q/14 3Q/15 4Q/15 %YoY %QoQ
Freight Revenue 7,661.2 5,756.1 -25% 2,213.7 1,388.6 1,398.3 -37% 1%
Vessel Operating Expenses (6,443.8) (4,911.9) -24% (1,965.7) (1,154.6) (1,174.8) -40% 2%
Gross Profit 1,217.4 844.3 -31% 248.0 234.0 223.5 -10% -4%
Other Income 190.7 50.6 -73% 46.9 0.9 4.6 -90% 429%
Gains (Losses) on Investment - 32.1 0% - - - 0% 0%
SG&A (314.8) (353.7) 12% (62.3) (81.5) (107.5) 73% 32%
EBITDA 1,093.3 573.2 -48% 232.6 153.3 120.6 -48% -21%
Depreciation & Amortization (607.8) (714.2) 18% (171.8) (185.2) (188.3) 10% 2%
EBIT 485.6 (140.9) -129% 60.8 (32.0) (67.7) -211% 112%
Financial Cost (137.2) (172.9) 26% (41.3) (43.8) (44.8) 8% 2%
Gain/(Loss) from Foreign Exchange 6.9 210.2 2927% 15.0 231.2 (26.7) -278% -112%
Non-Recurring Items (29.5) (4,731.2) 15923% (2.0) 0.0 (4,731.2)
Profit before Income Tax 325.8 (4,834.8) -1584% 32.4 155.5 (4,870.4) -15123% -3233%
Income Tax Expense (69.1) (25.2) -64% (13.6) (4.7) (4.4) -68% -7%
Net Profit/(Loss) 256.7 (4,860.0) -1993% 18.8 150.8 (4,874.7) -25984% -3333%
Normalized Net Profit/(Loss) 286.3 (128.8) -145% 20.9 150.8 (143.5) -788% -195%
Gross Margin (%) 16% 15% 11% 17% 16%
EBITDA Margin (%) 14% 10% 11% 11% 9%
Net Profit Margin (%) 3% -84% 1% 11% -349%
*as consolidated on TTA’s P&L*Normalized Net Profit/(Loss) = Net Profit/(Loss) - Non-Recurring Items

102
THORESEN THAI AGENCIES PLC.
ManageMent Discussion anD analysis
After the relatively volatile year, the Baltic Dry Index (BDI), an indicator of international cargo trade, has fallen to its all-time low and averaging 718 in 2015 or declined 35% from an average of 1,105 in 2014. Generally, the BDI falls for two main reasons: a reduced demand for dry bulk ships or lower international trade and a glut of ships, as the supply of ships cannot increase suddenly - it takes at least two years to build new ones. Dry bulk ships carry dry goods which are mainly raw materials where the demand for transporting them is an indicator of how much production is planned for the future. Therefore, this gives clues about economic growth in the future. There has been a spate of bad news from China, whose economy relies on nearly USD 4 trillion worth of imports and exports. In 2015, China’s imports dropped by 13% and exports fell by about 2%. The import of coal and iron ore - both major components of the BDI - fell for the first time in over a decade. There is also a slowdown in steel production. The Chinese export slump is likely because of weak demand from the US and European nations.
Global commodity prices have also been falling, with copper prices at multi-year lows, as are aluminium, zinc, and tin, and also agricultural commodities like wheat, corn and soyabean. According to several reports, one reason for the BDI fall is a virtual collapse of cargo trade in the north Atlantic Ocean as a result of a slowdown in global ecomony. Consequently, the Capesize average TC drop 49% to USD 6,997 per day in 2015 from as high as USD 13,800 in 2014. Similarly, Panamax average TC spot rates were also
reduced by 28% from USD 7,718 per day in 2014 to USD 5,560 per day in 2015. Meanwhile, TC rates for the smaller bulkers were not quite as depressed as the Capesize rates, yet declined 29% for Supramax and 30% for Handysize. The Supramax average TC rates (key benchmark rates for TSG) averaging at USD 6,966 per day in 2015 comparing with USD 9,818 per day in 2014, while Handysize average TC rates averaging USD 5,381 per day in 2015 comparing with USD 7,681 per day in 2014. Thoresen Shipping Group (“TSG”), with most of its fleets are Supramax size, was less impacted from sharp market decline compared to dry bulk operators who operated with Capesize and Panamax.
In 2015, TSG’s average TCE rate was at USD 7,507 per day, outperformed the adjusted market TC Avg BSI of USD 6,154 per day by 22% although declined 20% YoY from USD 9,436 per day in 2014 as the dry bulk index weakened through the year. TSG’s average TCE rate for 2015 combined of owned fleet TCE rate of USD 6,753 per day and additional margin from chartered-in vessels of USD 754 per day. Totally, the group operated an average of 37.3 vessels (23.1 owned vessels(5) and 14.3 chartered-in vessels) in 2015, decreased from an average of 41 vessels (21.4 owned vessels(5) and 19.6 chartered-in vessels) in 2014, mainly due to limited market opportunities to do chartered-in vessels.
Accordingly, the freight revenue in 2015 decreased to Baht 5,756.1 million or reducing 25% YoY from Baht 7,661.2 million 2014, with gross profit of Baht 844.3 million or down 31% YoY. Gross margin was maintained at 15% in 2015 close to 16% in 2014. The operating cash cost per day in 2015 was at USD 5,794 per day, which is comparatively flat from 2014, despite the increase in dry-docking expenses.
TSG achieved a positive EBITDA of Baht 573.2 million (down 48% YoY) with EBITDA margin of 10% despite the relatively weak market in 2015. TSG recorded non-cash impairment of approximately Baht 4.7 billion against its owned fleet vessels. The market values of the dry bulk vessels and the forward rates for the coming years dropped drastically in the fourth quarter of 2015, which have negatively affected vessel values and TSG has therefore completed a routine impairment test and reflected value accordingly. In conclusion, TSG reported net loss of Baht 4,860.0 million in 2015 with normalized loss of Baht 128.8 million.
Dry Bulk Market Index
-
100
200
300
400
500
600
700
800
900
1,000
1,100
1,200
1,300
1,400
1,500
1,600
-
2,000
4,000
6,000
8,000
10,000
12,000
14,000
16,000
18,000
Jan-
13Fe
b-13
Mar
-13
Apr
-13
May
-13
Jun-
13Ju
l-13
Aug
-13
Sep
-13
Oct
-13
Nov
-13
Dec
-13
Jan-
14Fe
b-14
Mar
-14
Apr
-14
May
-14
Jun-
14Ju
l-14
Aug
-14
Sep
-14
Oct
-14
Nov
-14
Dec
-14
Jan-
15Fe
b-15
Mar
-15
Apr
-15
May
-15
Jun-
15Ju
l-15
Aug
-15
Sep
-15
Oct
-15
Nov
-15
Dec
-15
Jan-
16Fe
b-16
Mar
-16
BDI IndexTC RateUSD/Day
Dry Bulk Market IndexBDI (RHS) TC Avg BSI TC Avg BHSI
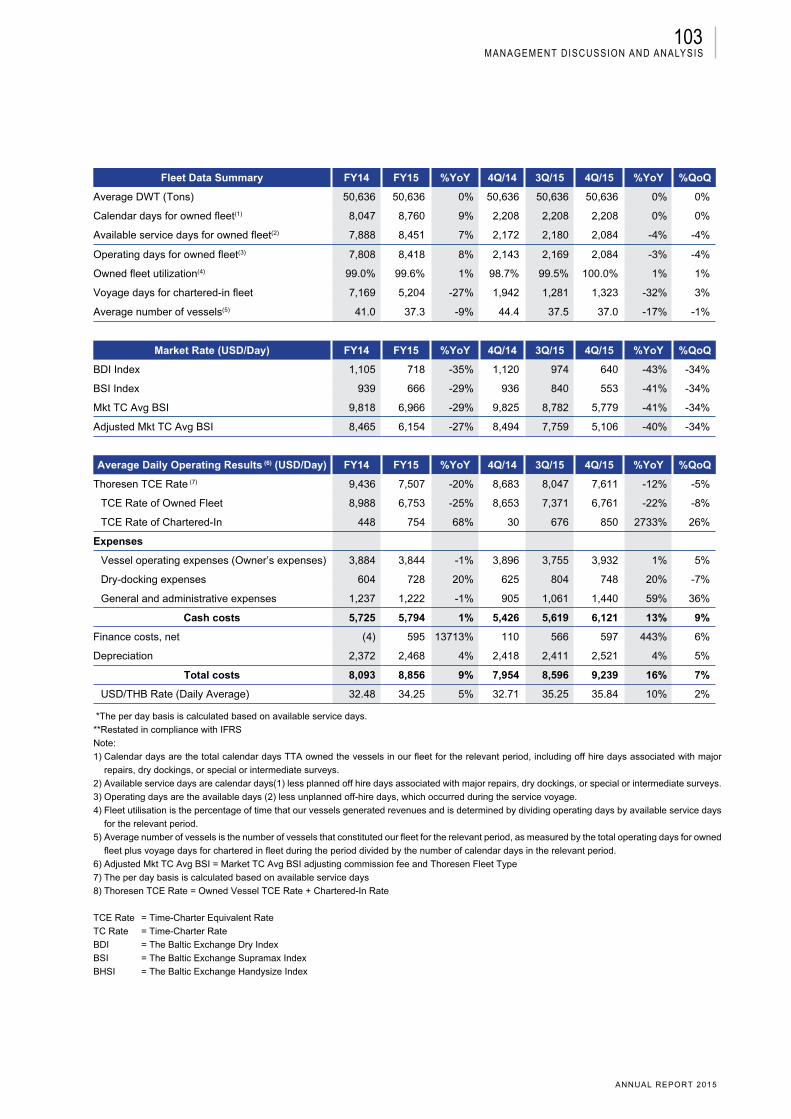
103
ANNUAL REPORT 2015
ManageMent Discussion anD analysis
Fleet Data Summary FY14 FY15 %YoY 4Q/14 3Q/15 4Q/15 %YoY %QoQ
Average DWT (Tons) 50,636 50,636 0% 50,636 50,636 50,636 0% 0%
Calendar days for owned fleet(1) 8,047 8,760 9% 2,208 2,208 2,208 0% 0%
Available service days for owned fleet(2) 7,888 8,451 7% 2,172 2,180 2,084 -4% -4%
Operating days for owned fleet(3) 7,808 8,418 8% 2,143 2,169 2,084 -3% -4%
Owned fleet utilization(4) 99.0% 99.6% 1% 98.7% 99.5% 100.0% 1% 1%
Voyage days for chartered-in fleet 7,169 5,204 -27% 1,942 1,281 1,323 -32% 3%
Average number of vessels(5) 41.0 37.3 -9% 44.4 37.5 37.0 -17% -1%
Market Rate (USD/Day) FY14 FY15 %YoY 4Q/14 3Q/15 4Q/15 %YoY %QoQ
BDI Index 1,105 718 -35% 1,120 974 640 -43% -34%
BSI Index 939 666 -29% 936 840 553 -41% -34%
Mkt TC Avg BSI 9,818 6,966 -29% 9,825 8,782 5,779 -41% -34%
Adjusted Mkt TC Avg BSI 8,465 6,154 -27% 8,494 7,759 5,106 -40% -34%
Average Daily Operating Results (6) (USD/Day) FY14 FY15 %YoY 4Q/14 3Q/15 4Q/15 %YoY %QoQ
Thoresen TCE Rate (7) 9,436 7,507 -20% 8,683 8,047 7,611 -12% -5%
TCE Rate of Owned Fleet 8,988 6,753 -25% 8,653 7,371 6,761 -22% -8%
TCE Rate of Chartered-In 448 754 68% 30 676 850 2733% 26%
Expenses
Vessel operating expenses (Owner’s expenses) 3,884 3,844 -1% 3,896 3,755 3,932 1% 5%
Dry-docking expenses 604 728 20% 625 804 748 20% -7%
General and administrative expenses 1,237 1,222 -1% 905 1,061 1,440 59% 36%
Cash costs 5,725 5,794 1% 5,426 5,619 6,121 13% 9%
Finance costs, net (4) 595 13713% 110 566 597 443% 6%
Depreciation 2,372 2,468 4% 2,418 2,411 2,521 4% 5%
Total costs 8,093 8,856 9% 7,954 8,596 9,239 16% 7%
USD/THB Rate (Daily Average) 32.48 34.25 5% 32.71 35.25 35.84 10% 2%
*The per day basis is calculated based on available service days.
**Restated in compliance with IFRS
Note:
1) Calendar days are the total calendar days TTA owned the vessels in our fleet for the relevant period, including off hire days associated with major
repairs, dry dockings, or special or intermediate surveys.
2) Available service days are calendar days(1) less planned off hire days associated with major repairs, dry dockings, or special or intermediate surveys.
3) Operating days are the available days (2) less unplanned off-hire days, which occurred during the service voyage.
4) Fleet utilisation is the percentage of time that our vessels generated revenues and is determined by dividing operating days by available service days
for the relevant period.
5) Average number of vessels is the number of vessels that constituted our fleet for the relevant period, as measured by the total operating days for owned
fleet plus voyage days for chartered in fleet during the period divided by the number of calendar days in the relevant period.
6) Adjusted Mkt TC Avg BSI = Market TC Avg BSI adjusting commission fee and Thoresen Fleet Type
7) The per day basis is calculated based on available service days
8) Thoresen TCE Rate = Owned Vessel TCE Rate + Chartered-In Rate
TCE Rate = Time-Charter Equivalent Rate
TC Rate = Time-Charter Rate
BDI = The Baltic Exchange Dry Index
BSI = The Baltic Exchange Supramax Index
BHSI = The Baltic Exchange Handysize Index
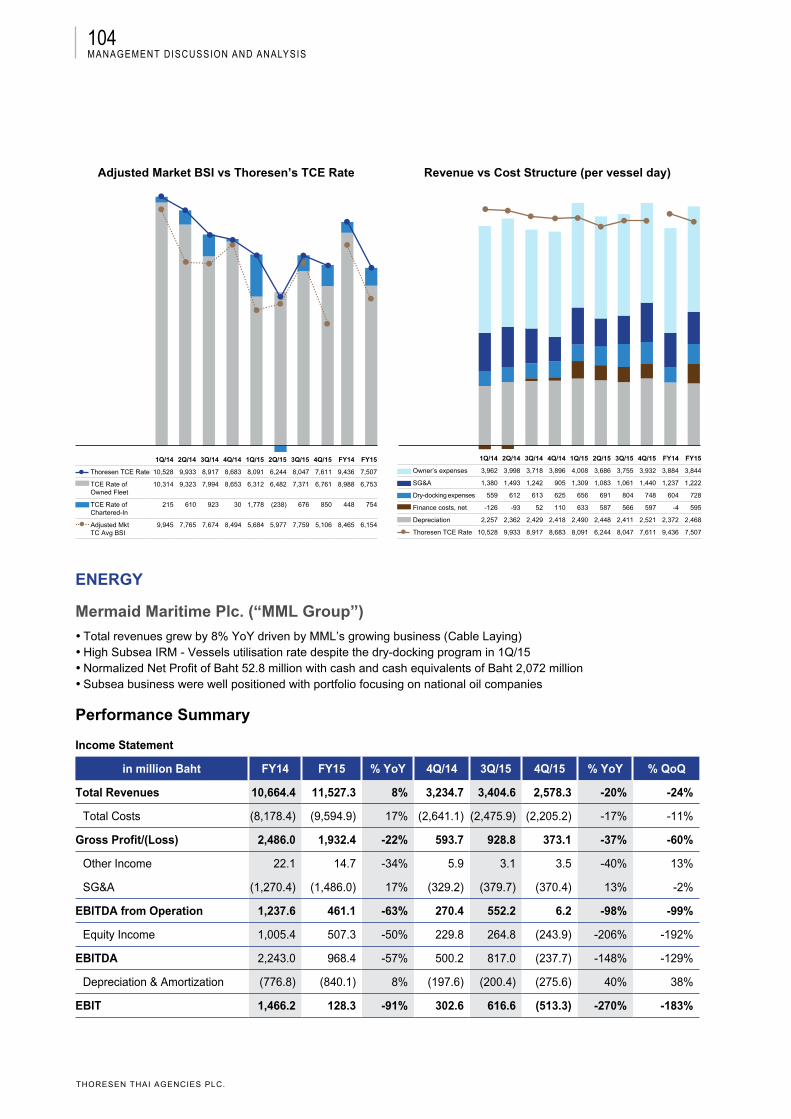
104
THORESEN THAI AGENCIES PLC.
ManageMent Discussion anD analysis
ENERGY
Mermaid Maritime Plc. (“MML Group”)
·Total revenues grew by 8% YoY driven by MML’s growing business (Cable Laying)·High Subsea IRM - Vessels utilisation rate despite the dry-docking program in 1Q/15 ·Normalized Net Profit of Baht 52.8 million with cash and cash equivalents of Baht 2,072 million·Subsea business were well positioned with portfolio focusing on national oil companies
Performance Summary
Income Statement
in million Baht FY14 FY15 % YoY 4Q/14 3Q/15 4Q/15 % YoY % QoQ
Total Revenues 10,664.4 11,527.3 8% 3,234.7 3,404.6 2,578.3 -20% -24%
Total Costs (8,178.4) (9,594.9) 17% (2,641.1) (2,475.9) (2,205.2) -17% -11%
Gross Profit/(Loss) 2,486.0 1,932.4 -22% 593.7 928.8 373.1 -37% -60%
Other Income 22.1 14.7 -34% 5.9 3.1 3.5 -40% 13%
SG&A (1,270.4) (1,486.0) 17% (329.2) (379.7) (370.4) 13% -2%
EBITDA from Operation 1,237.6 461.1 -63% 270.4 552.2 6.2 -98% -99%
Equity Income 1,005.4 507.3 -50% 229.8 264.8 (243.9) -206% -192%
EBITDA 2,243.0 968.4 -57% 500.2 817.0 (237.7) -148% -129%
Depreciation & Amortization (776.8) (840.1) 8% (197.6) (200.4) (275.6) 40% 38%
EBIT 1,466.2 128.3 -91% 302.6 616.6 (513.3) -270% -183%
1Q/14 2Q/14 3Q/14 4Q/14 1Q/15 2Q/15 3Q/15 4Q/15 FY14 FY15
Thoresen TCE Rate 10,528 9,933 8,917 8,683 8,091 6,244 8,047 7,611 9,436 7,507
TCE Rate of Owned Fleet
10,314 9,323 7,994 8,653 6,312 6,482 7,371 6,761 8,988 6,753
TCE Rate ofChartered-In
215 610 923 30 1,778 (238) 676 850 448 754
Adjusted Mkt TC Avg BSI
9,945 7,765 7,674 8,494 5,684 5,977 7,759 5,106 8,465 6,154
1Q/14 2Q/14 3Q/14 4Q/14 1Q/15 2Q/15 3Q/15 4Q/15 FY14 FY15
Owner’s expenses 3,962 3,998 3,718 3,896 4,008 3,686 3,755 3,932 3,884 3,844
SG&A 1,380 1,493 1,242 905 1,309 1,083 1,061 1,440 1,237 1,222
Dry-docking expenses 559 612 613 625 656 691 804 748 604 728
Finance costs, net -126 -93 52 110 633 587 566 597 -4 595
Depreciation 2,257 2,362 2,429 2,418 2,490 2,448 2,411 2,521 2,372 2,468
Thoresen TCE Rate 10,528 9,933 8,917 8,683 8,091 6,244 8,047 7,611 9,436 7,507
Adjusted Market BSI vs Thoresen’s TCE Rate Revenue vs Cost Structure (per vessel day)
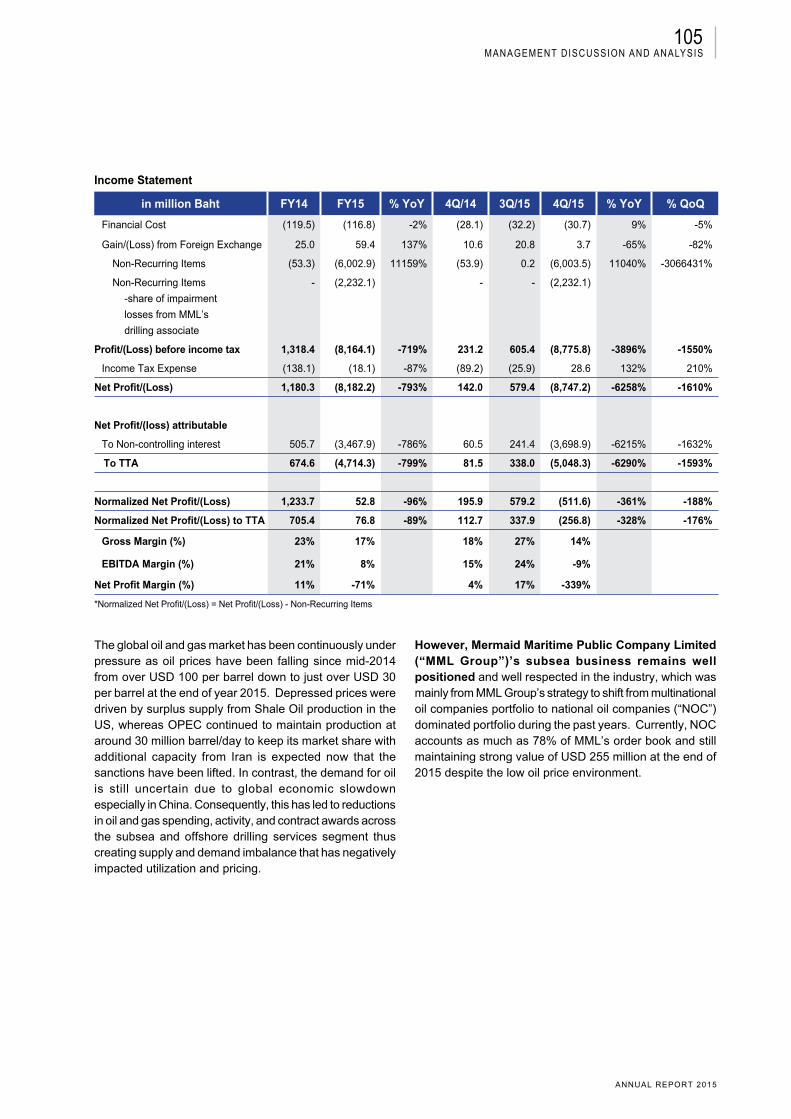
105
ANNUAL REPORT 2015
ManageMent Discussion anD analysis
Income Statement
in million Baht FY14 FY15 % YoY 4Q/14 3Q/15 4Q/15 % YoY % QoQ
Financial Cost (119.5) (116.8) -2% (28.1) (32.2) (30.7) 9% -5%
Gain/(Loss) from Foreign Exchange 25.0 59.4 137% 10.6 20.8 3.7 -65% -82%
Non-Recurring Items (53.3) (6,002.9) 11159% (53.9) 0.2 (6,003.5) 11040% -3066431%
Non-Recurring Items
-share of impairment
losses from MML’s
drilling associate
- (2,232.1) - - (2,232.1)
Profit/(Loss) before income tax 1,318.4 (8,164.1) -719% 231.2 605.4 (8,775.8) -3896% -1550%
Income Tax Expense (138.1) (18.1) -87% (89.2) (25.9) 28.6 132% 210%
Net Profit/(Loss) 1,180.3 (8,182.2) -793% 142.0 579.4 (8,747.2) -6258% -1610%
Net Profit/(loss) attributable
To Non-controlling interest 505.7 (3,467.9) -786% 60.5 241.4 (3,698.9) -6215% -1632%
To TTA 674.6 (4,714.3) -799% 81.5 338.0 (5,048.3) -6290% -1593%
Normalized Net Profit/(Loss) 1,233.7 52.8 -96% 195.9 579.2 (511.6) -361% -188%
Normalized Net Profit/(Loss) to TTA 705.4 76.8 -89% 112.7 337.9 (256.8) -328% -176%
Gross Margin (%) 23% 17% 18% 27% 14%
EBITDA Margin (%) 21% 8% 15% 24% -9%
Net Profit Margin (%) 11% -71% 4% 17% -339%
*Normalized Net Profit/(Loss) = Net Profit/(Loss) - Non-Recurring Items
The global oil and gas market has been continuously under pressure as oil prices have been falling since mid-2014 from over USD 100 per barrel down to just over USD 30 per barrel at the end of year 2015. Depressed prices were driven by surplus supply from Shale Oil production in the US, whereas OPEC continued to maintain production at around 30 million barrel/day to keep its market share with additional capacity from Iran is expected now that the sanctions have been lifted. In contrast, the demand for oil is still uncertain due to global economic slowdown especially in China. Consequently, this has led to reductions in oil and gas spending, activity, and contract awards across the subsea and offshore drilling services segment thus creating supply and demand imbalance that has negatively impacted utilization and pricing.
However, Mermaid Maritime Public Company Limited (“MML Group”)’s subsea business remains well positioned and well respected in the industry, which was mainly from MML Group’s strategy to shift from multinational oil companies portfolio to national oil companies (“NOC”) dominated portfolio during the past years. Currently, NOC accounts as much as 78% of MML’s order book and still maintaining strong value of USD 255 million at the end of 2015 despite the low oil price environment.

106
THORESEN THAI AGENCIES PLC.
ManageMent Discussion anD analysis
In 2015, MML Group’s total revenue was at Baht 11,527.3 million, an increase of 8% YoY from Baht 10,664.4 million despite the dry-docking program of MML group’s three high performing vessels (Mermaid Commander, Mermaid Endurer, and Mermaid Asiana) in 1Q/15. The increase in revenue for 2015 was mainly driven by the continued strong build out of the cable laying business which accounted 33% of total revenue or 162% increased from 2014. Meanwhile, the revenue from subsea
IRM-vessels and survey services decreased 10% from 2014 at Baht 6,602.8 million to Baht 5,949.1 million in 2015. In addition, despite the challenging conditions, the overall subsea utilization rate remained flat at 61% with 2,213 working days in 2015 (10 vessels) and 2,007 working days in 2014 (9 vessels). The additional vessel in 2015 was from the chartered in vessel “Windermere” which was discharged at the end of year. In drilling business, the utilization rates were solid at 73%, though lower than 2014
Revenues Breakdown by Services Subsea IRM-Vessels Revenue Breakdown
Vessel Working Days & U-Rate* Rigs Working Days & U-Rate*
1Q/14 2Q/14 3Q/14 4Q/14 1Q/15 2Q/15 3Q/15 4Q/15 FY14 FY15
Utillzattion rate 51% 71% 73% 48% 33% 74% 80% 55% 61% 61%
Chartered-in 121 165 183 81 74 152 203 205 550 634
Owned 295 420 424 318 222 523 532 302 1,457 1,579
1Q/14 2Q/14 3Q/14 4Q/14 1Q/15 2Q/15 3Q/15 4Q/15 FY14 FY15
Blended Rate 74% 76% 78% 78% 74% 72% 73% 74% 77% 73%
Tender rig 90 83 92 83 - - - - 348 -
Jack-up rig 244 265 266 275 266 263 267 274 1,050 1,070
1Q/14 2Q/14 3Q/14 4Q/14 1Q/15 2Q/15 3Q/15 4Q/15 FY14 FY15
Drilling (Tender Rigs) 14% 8% 4% 5% - - - - 7% -
Cable Laying 7% 1% 9% 30% 44% 37% 25% 29% 13% 33%
Subsea Services -Non Vessels
27% 21% 13% 14% 21% 11% 15% 17% 18% 15%
Subsea IRM - Vessels 53% 70% 74% 51% 34% 52% 60% 54% 62% 52%
1Q/14 2Q/14 3Q/14 4Q/14 1Q/15 2Q/15 3Q/15 4Q/15 FY14 FY15
Short Term Chartered-In
0.1 38.1 179.0 - 107.4 - - - 219.6 112.6
Long Term Chartered-In
280.1 417.3 405.3 261.0 105.9 402.8 566.1 548.1 1,365.4 1,599.9
Owned Fleet 824.8 1,315.0 1,488.0 1,385.5 470.3 1,460.4 1,479.3 835.2 5,017.9 4,236.5
Unit : Million BahtUnit : Million Baht
2,089.92,522.7
2,817.1
3,234.7
1,984.2
3,560.1 3,404.6
2,578.3
10,664.4
11,527.3
1,105.1
1,770.5
2,072.3
1,646.5
683.6
1,863.22,045.4
1,383.3
6,602.8
5,949.1
*Total Working Days/Total Vessel Calendar DaysUtilization Rate are blended Rate of Owned and Chartered-in In 2014, based on 9 vessels. In 2015, based on 10 vessels.
*Total Working Days/Total Vessels Calendar DaysUtilization Rate are blended Rate of Owned and Chartered-in In 2014, based on 5 rigs. In 2015, based on 4 rigs.
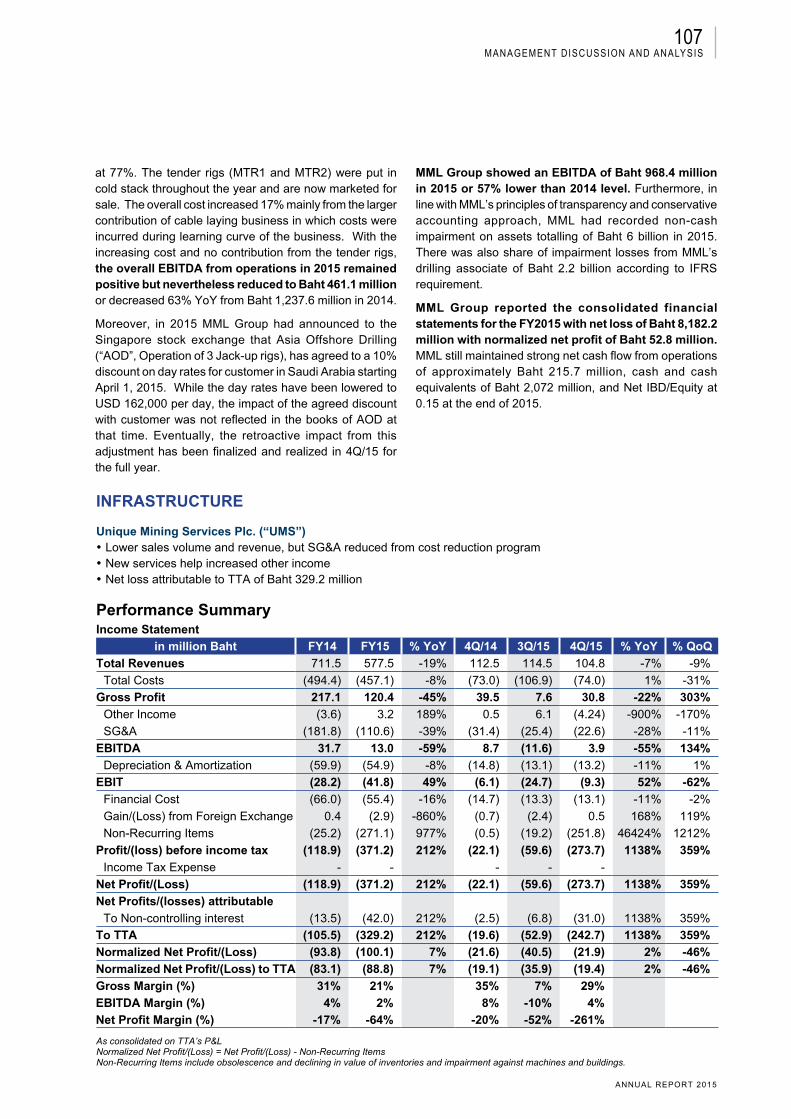
107
ANNUAL REPORT 2015
ManageMent Discussion anD analysis
at 77%. The tender rigs (MTR1 and MTR2) were put in cold stack throughout the year and are now marketed for sale. The overall cost increased 17% mainly from the larger contribution of cable laying business in which costs were incurred during learning curve of the business. With the increasing cost and no contribution from the tender rigs, the overall EBITDA from operations in 2015 remained positive but nevertheless reduced to Baht 461.1 million or decreased 63% YoY from Baht 1,237.6 million in 2014.
Moreover, in 2015 MML Group had announced to the Singapore stock exchange that Asia Offshore Drilling (“AOD”, Operation of 3 Jack-up rigs), has agreed to a 10% discount on day rates for customer in Saudi Arabia starting April 1, 2015. While the day rates have been lowered to USD 162,000 per day, the impact of the agreed discount with customer was not reflected in the books of AOD at that time. Eventually, the retroactive impact from this adjustment has been finalized and realized in 4Q/15 for the full year.
MML Group showed an EBITDA of Baht 968.4 million in 2015 or 57% lower than 2014 level. Furthermore, in line with MML’s principles of transparency and conservative accounting approach, MML had recorded non-cash impairment on assets totalling of Baht 6 billion in 2015. There was also share of impairment losses from MML’s drilling associate of Baht 2.2 billion according to IFRS requirement.
MML Group reported the consolidated financial statements for the FY2015 with net loss of Baht 8,182.2 million with normalized net profit of Baht 52.8 million. MML still maintained strong net cash flow from operations of approximately Baht 215.7 million, cash and cash equivalents of Baht 2,072 million, and Net IBD/Equity at 0.15 at the end of 2015.
INFRASTRUCTURE
Unique Mining Services Plc. (“UMS”) ·Lower sales volume and revenue, but SG&A reduced from cost reduction program·New services help increased other income·Net loss attributable to TTA of Baht 329.2 million
Performance SummaryIncome Statement
in million Baht FY14 FY15 % YoY 4Q/14 3Q/15 4Q/15 % YoY % QoQTotal Revenues 711.5 577.5 -19% 112.5 114.5 104.8 -7% -9%
Total Costs (494.4) (457.1) -8% (73.0) (106.9) (74.0) 1% -31%Gross Profit 217.1 120.4 -45% 39.5 7.6 30.8 -22% 303%
Other Income (3.6) 3.2 189% 0.5 6.1 (4.24) -900% -170%
SG&A (181.8) (110.6) -39% (31.4) (25.4) (22.6) -28% -11%
EBITDA 31.7 13.0 -59% 8.7 (11.6) 3.9 -55% 134%Depreciation & Amortization (59.9) (54.9) -8% (14.8) (13.1) (13.2) -11% 1%
EBIT (28.2) (41.8) 49% (6.1) (24.7) (9.3) 52% -62%Financial Cost (66.0) (55.4) -16% (14.7) (13.3) (13.1) -11% -2%
Gain/(Loss) from Foreign Exchange 0.4 (2.9) -860% (0.7) (2.4) 0.5 168% 119%
Non-Recurring Items (25.2) (271.1) 977% (0.5) (19.2) (251.8) 46424% 1212%
Profit/(loss) before income tax (118.9) (371.2) 212% (22.1) (59.6) (273.7) 1138% 359%Income Tax Expense - - - - -
Net Profit/(Loss) (118.9) (371.2) 212% (22.1) (59.6) (273.7) 1138% 359%Net Profits/(losses) attributable
To Non-controlling interest (13.5) (42.0) 212% (2.5) (6.8) (31.0) 1138% 359%To TTA (105.5) (329.2) 212% (19.6) (52.9) (242.7) 1138% 359%Normalized Net Profit/(Loss) (93.8) (100.1) 7% (21.6) (40.5) (21.9) 2% -46%Normalized Net Profit/(Loss) to TTA (83.1) (88.8) 7% (19.1) (35.9) (19.4) 2% -46%Gross Margin (%) 31% 21% 35% 7% 29%EBITDA Margin (%) 4% 2% 8% -10% 4%Net Profit Margin (%) -17% -64% -20% -52% -261%
As consolidated on TTA’s P&LNormalized Net Profit/(Loss) = Net Profit/(Loss) - Non-Recurring ItemsNon-Recurring Items include obsolescence and declining in value of inventories and impairment against machines and buildings.
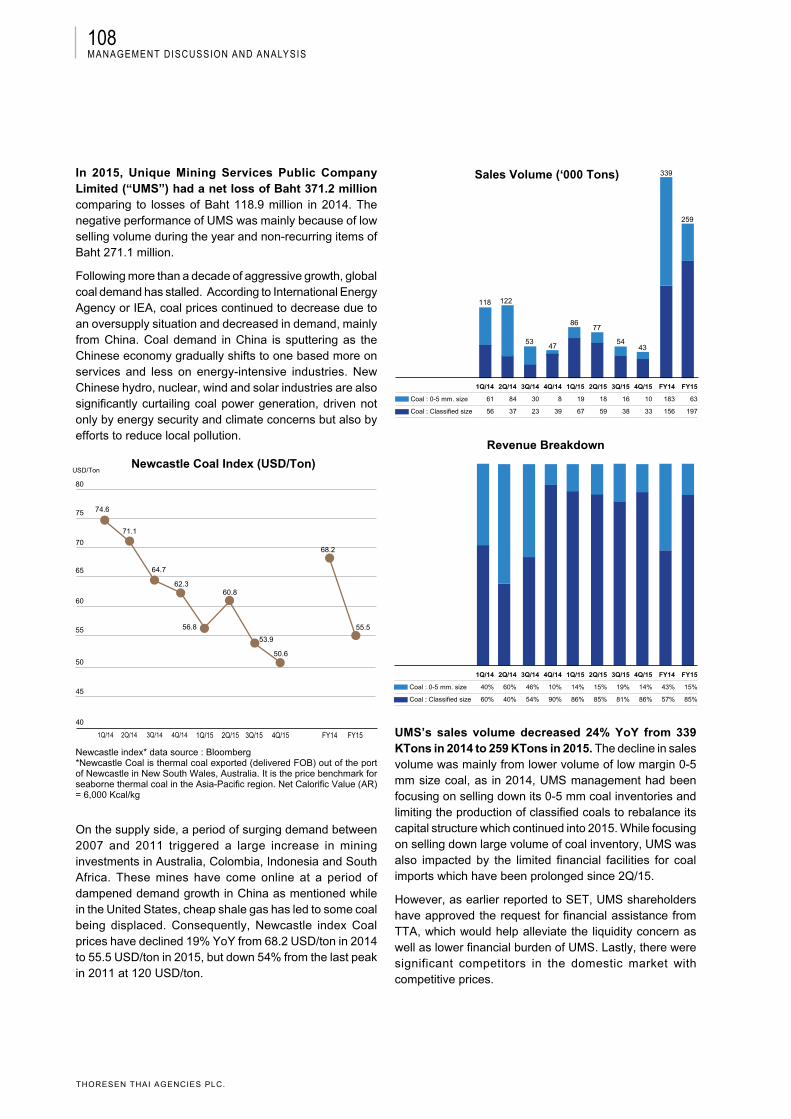
108
THORESEN THAI AGENCIES PLC.
ManageMent Discussion anD analysis
In 2015, Unique Mining Services Public Company Limited (“UMS”) had a net loss of Baht 371.2 million comparing to losses of Baht 118.9 million in 2014. The negative performance of UMS was mainly because of low selling volume during the year and non-recurring items of Baht 271.1 million.
Following more than a decade of aggressive growth, global coal demand has stalled. According to International Energy Agency or IEA, coal prices continued to decrease due to an oversupply situation and decreased in demand, mainly from China. Coal demand in China is sputtering as the Chinese economy gradually shifts to one based more on services and less on energy-intensive industries. New Chinese hydro, nuclear, wind and solar industries are also significantly curtailing coal power generation, driven not only by energy security and climate concerns but also by efforts to reduce local pollution.
On the supply side, a period of surging demand between 2007 and 2011 triggered a large increase in mining investments in Australia, Colombia, Indonesia and South Africa. These mines have come online at a period of dampened demand growth in China as mentioned while in the United States, cheap shale gas has led to some coal being displaced. Consequently, Newcastle index Coal prices have declined 19% YoY from 68.2 USD/ton in 2014 to 55.5 USD/ton in 2015, but down 54% from the last peak in 2011 at 120 USD/ton.
UMS’s sales volume decreased 24% YoY from 339 KTons in 2014 to 259 KTons in 2015. The decline in sales volume was mainly from lower volume of low margin 0-5 mm size coal, as in 2014, UMS management had been focusing on selling down its 0-5 mm coal inventories and limiting the production of classified coals to rebalance its capital structure which continued into 2015. While focusing on selling down large volume of coal inventory, UMS was also impacted by the limited financial facilities for coal imports which have been prolonged since 2Q/15.
However, as earlier reported to SET, UMS shareholders have approved the request for financial assistance from TTA, which would help alleviate the liquidity concern as well as lower financial burden of UMS. Lastly, there were significant competitors in the domestic market with competitive prices.
1Q/14
74.6
80
75
70
65
60
55
50
45
40
71.1
64.7
62.3
56.8
60.8
53.9
50.6
68.2
55.5
2Q/14 3Q/14 4Q/14 1Q/15 2Q/15 3Q/15 4Q/15 FY14 FY15
Newcastle Coal Index (USD/Ton)
Newcastle index* data source : Bloomberg*Newcastle Coal is thermal coal exported (delivered FOB) out of the port of Newcastle in New South Wales, Australia. It is the price benchmark for seaborne thermal coal in the Asia-Pacific region. Net Calorific Value (AR) = 6,000 Kcal/kg
Revenue Breakdown
1Q/14 2Q/14 3Q/14 4Q/14 1Q/15 2Q/15 3Q/15 4Q/15 FY14 FY15
Coal : 0-5 mm. size 40% 60% 46% 10% 14% 15% 19% 14% 43% 15%
Coal : Classified size 60% 40% 54% 90% 86% 85% 81% 86% 57% 85%
Sales Volume (‘000 Tons)
1Q/14 2Q/14 3Q/14 4Q/14 1Q/15 2Q/15 3Q/15 4Q/15 FY14 FY15
Coal : 0-5 mm. size 61 84 30 8 19 18 16 10 183 63
Coal : Classified size 56 37 23 39 67 59 38 33 156 197
USD/Ton
118 122
5347
8677
5443
339
259
109
ANNUAL REPORT 2015
ManageMent Discussion anD analysis
In 2015, total revenues reduced 19% YoY while the cost reduced by only 8% YoY, therefore, the gross profit consequently decreased 45% YoY to Baht 120.4 million comparing with Baht 217.1 million in 2014. The other income increased 189% YoY as UMS have started implementing business turnaround plans to improve the performance back to profitability. According to the plan, UMS aim to
1. Increase coal sales volume for both classified coal and non-classified coal (0-5 mm) to both existing and new customers, which mostly are SME manufacturers, subject to the market conditions and profitability.
2. Improve asset utilization of UMS and its subsidiaries including leasing out coal storage area and offering coal screening service to coal traders. Increase lighter service and related logistic services. Manage and control to reduce maintenance cost and financial cost of UMS.
3. Reduce operation cost by cutting fixed overheads by revisiting cost items to ensure most benefit of such spending and cut down unnecessary cost. In addition, increasing sales volume will allow for the economy of scale.
4. Revise capital structure of UMS such as capital increase.
From the cost reducing program conducted during 2015, UMS was able to reduce SG&A by 39% YoY. EBITDA in 2015 has weakened to Baht 13 million, with EBITDA margin of 2%. In addition, depreciation and amortization reduced
8% from last year, while financial cost reduces 16%. Moreover, there was non-recurring item losses of Baht 271.1 million mainly from non-cash impairment and provision, comprising mainly from
1. Baht 198 million of non-cash allowance will be taken for obsolescence and declining in value of inventories. The decision is a result of the deterioration in quality of such coal inventory which has been accumulated up and has no movement for several years. Such coal is sited on floor and underground of the coal storage area and become contaminated with all soil and rock causing deterioration of its quality (including its calorific value and ash content) according to the report from coal specialist. This coal inventory may not be sold in the market.
2. Non-cash impairment of 57 million against the machines and buildings, including both factories in Samutsakorn and Ayuthaya Provinces. The machines are mostly the old machines and have not been utilized for several years. The valuation by the independent appraisal firm indicated that the book value of such assets is higher than the fair value.
3. Non-cash impairment of Baht 3.5 million against its investment UMS Distribution Company Limited (“UMSD”), a subsidiary of UMS, which is no longer in business operation.
Accordingly in 2015, UMS reported net loss of Baht 371.2 million and attributable net losses to TTA of Baht 329.2 million.
PM Thoresen Asia Holdings Plc. (“PMTA”)
·Fertilizer sales revenue rose by Baht 170.5 million or increased 6% YoY ·Domestic sales remained strong in spite of drought condition within the region·Completion of new granulation unit (100,000 tons capacity) to support growth in export market ·Expansion of factory area for leasing from 31,000 sq. m. with additional 11,300 sq. m. to 42,300 sq. m., and further
8,200 sq. m. (named Baconco 5-B Phase 2) under construction opening early 2016, achieved 100% occupancy rate while the demand from current customers still keeps rising
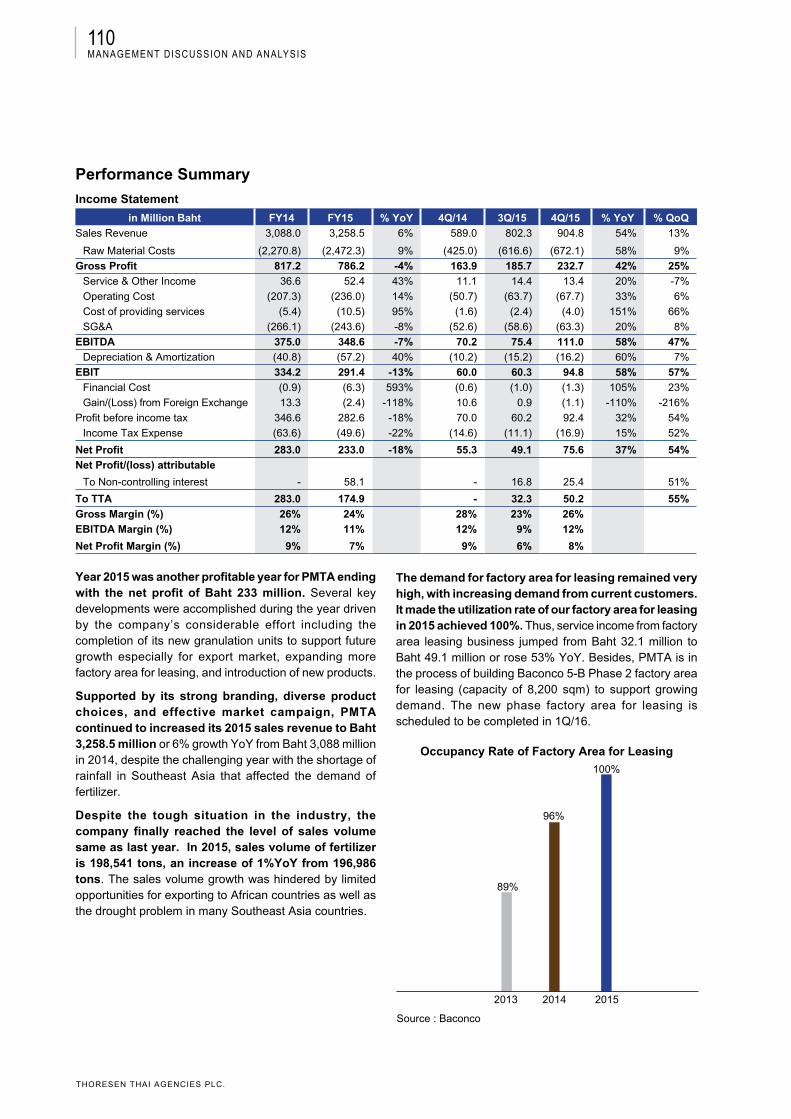
110
THORESEN THAI AGENCIES PLC.
ManageMent Discussion anD analysis
Performance Summary
Income Statement
in Million Baht FY14 FY15 % YoY 4Q/14 3Q/15 4Q/15 % YoY % QoQSales Revenue 3,088.0 3,258.5 6% 589.0 802.3 904.8 54% 13%
Raw Material Costs (2,270.8) (2,472.3) 9% (425.0) (616.6) (672.1) 58% 9%
Gross Profit 817.2 786.2 -4% 163.9 185.7 232.7 42% 25%Service & Other Income 36.6 52.4 43% 11.1 14.4 13.4 20% -7%
Operating Cost (207.3) (236.0) 14% (50.7) (63.7) (67.7) 33% 6%
Cost of providing services (5.4) (10.5) 95% (1.6) (2.4) (4.0) 151% 66%
SG&A (266.1) (243.6) -8% (52.6) (58.6) (63.3) 20% 8%
EBITDA 375.0 348.6 -7% 70.2 75.4 111.0 58% 47%Depreciation & Amortization (40.8) (57.2) 40% (10.2) (15.2) (16.2) 60% 7%
EBIT 334.2 291.4 -13% 60.0 60.3 94.8 58% 57%Financial Cost (0.9) (6.3) 593% (0.6) (1.0) (1.3) 105% 23%
Gain/(Loss) from Foreign Exchange 13.3 (2.4) -118% 10.6 0.9 (1.1) -110% -216%
Profit before income tax 346.6 282.6 -18% 70.0 60.2 92.4 32% 54%
Income Tax Expense (63.6) (49.6) -22% (14.6) (11.1) (16.9) 15% 52%
Net Profit 283.0 233.0 -18% 55.3 49.1 75.6 37% 54%Net Profit/(loss) attributable
To Non-controlling interest - 58.1 - 16.8 25.4 51%
To TTA 283.0 174.9 - 32.3 50.2 55%Gross Margin (%) 26% 24% 28% 23% 26%EBITDA Margin (%) 12% 11% 12% 9% 12%
Net Profit Margin (%) 9% 7% 9% 6% 8%
Year 2015 was another profitable year for PMTA ending with the net profit of Baht 233 million. Several key developments were accomplished during the year driven by the company’s considerable effort including the completion of its new granulation units to support future growth especially for export market, expanding more factory area for leasing, and introduction of new products.
Supported by its strong branding, diverse product choices, and effective market campaign, PMTA continued to increased its 2015 sales revenue to Baht 3,258.5 million or 6% growth YoY from Baht 3,088 million in 2014, despite the challenging year with the shortage of rainfall in Southeast Asia that affected the demand of fertilizer.
Despite the tough situation in the industry, the company finally reached the level of sales volume same as last year. In 2015, sales volume of fertilizer is 198,541 tons, an increase of 1%YoY from 196,986 tons. The sales volume growth was hindered by limited opportunities for exporting to African countries as well as the drought problem in many Southeast Asia countries.
The demand for factory area for leasing remained very high, with increasing demand from current customers. It made the utilization rate of our factory area for leasing in 2015 achieved 100%. Thus, service income from factory area leasing business jumped from Baht 32.1 million to Baht 49.1 million or rose 53% YoY. Besides, PMTA is in the process of building Baconco 5-B Phase 2 factory area for leasing (capacity of 8,200 sqm) to support growing demand. The new phase factory area for leasing is scheduled to be completed in 1Q/16.
2013
89%
96%
100%
2014 2015
Occupancy Rate of Factory Area for Leasing
Source : Baconco

111
ANNUAL REPORT 2015
ManageMent Discussion anD analysis
Fertilizer Sales Volume
Unit: Tons FY14 FY15 % YoY 4Q/14 3Q/15 4Q/15 % YoY % QoQ
Fertilizer NPK 191,743 193,075 1% 34,243 46,013 48,733 42% 6%
Single fertilizer 2,642 3,224 22% 201 553 2,549 1170% 361%
Pesticide 2,601 2,242 -14% 790 546 587 -26% 7%
Total 196,986 198,541 1% 35,235 47,112 51,869 47% 10%
Sales Volume Breakdown
Unit: Tons FY14 FY15 % YoY 4Q/14 3Q/15 4Q/15 % YoY % QoQ
Domestic 117,432 118,851 1% 23,453 26,620 32,673 39% 23%
Export 79,554 79,690 0% 11,781 20,492 19,196 63% -6%
Total 196,986 198,541 1% 35,235 47,112 51,869 47% 10%
In 2015, fertilizer sales revenue rose 6% YoY from Baht 3,088 million to Baht 3,258.5 million, contributed mainly from increasing of revenue per ton sales from 15,676 Baht per ton to 16,412 Baht per ton or increased 5% YoY, while the volume of fertilizer sales increased only 1% YoY from 196,986 tons to 198,541 tons. On the other hand, cost of raw material rose 9% YoY from Baht 2,270.8 million to 2,472.3 million, resulting in raw material cost per ton increased from 11,528 Baht per ton to 12,452 Baht per ton or increased 8% YoY. The higher growth rate of raw material cost than that of sales revenue diminished the gross margin in 2015 to 24% compared with 26% in 2014. In order to support the farmers, on 8 December 2014 Vietnamese government issued a decree cancelling the 5% VAT on sales of all types of fertilizers effective from 1 January 2015.
Service and other income dramatically increased 43% YoY to Baht 52.4 million from Baht 36.6 million in 2014. The majority source of service and other income was from factory area for leasing rental fee. With 100% occupancy rate of current factory area for leasing and growing demand for rental space, the new factory area for leasing named 5-B Phase 2 is now under construction.
Operating cost increased 14% YoY from Baht 207.3 million in 2014 to Baht 236 million in 2015 as the new capacity addition was still not fully utilized, while the SG&A, due to effective cost control, reduced from Baht 266.1 million in 2014 to Baht 243.6 million in 2015 or decreased 8% YoY.
Therefore, EBITDA was at Baht 348.6 million in 2015 reducing from Baht 375 million in 2014 or decreasing 7% YoY. As a result, EBITDA margin dropped from 12% to 11% in 2015. Depreciation and amortization significantly grew 40% YoY from Baht 40.8 million to Baht 57.2 million in 2015, from the new granulation unit installed.
Consequently, PMTA reported the consolidated financial statements for the year 2015 with net profit of Baht 233 million decreased 18% YoY from Baht 283 million in 2014.

statement of the board of directorsresponsibilities for the Financial statements 29 February 2016
To: The Shareholders of Thoresen Thai Agencies Public Company Limited
The Board of Directors realizes the significance of its duties and responsibilities in supervising the Company’s business to ensure good management with integrity and prudence in accordance with laws, detailed objectives, Articles of Association, and resolutions of the shareholders meetings. The Board of Directors protects the benefits of the Company and its stakeholders by ensuring that the Company’s financial report contains accurate and full accounting records that reflect its actual financial status and operational results.
The Board of Directors has established the Audit Committee comprising independent directors fully qualified in accordance with the requirements of the Stock Exchange of Thailand to review and ensure accuracy and sufficiency of the financial report, to review the internal control systems including compliance with securities law, regulations of the Stock Exchange of Thailand or laws relating to the business of the Company. In this regard, the Audit Committee has already reported its performance to the Board of Directors.
The Board of Directors is of the opinion that the Company’s internal control system has been proven to be satisfactory. The Board was able to obtain reasonable assurance on the credibility of the financial statements for the financial year 2015 ended 31 December 2015 (1 January - 31 December 2015) of the Company and its subsidiaries, which the Company’s auditor has audited based on the generally-accepted accounting standards. The auditor is of the opinion that the financial statements present fairly the Company’s financial position and the results of its operations in accordance with generally accepted accounting principles.
Mr. Prasert BunsumpunChairman of the Board of Directors
Mr. Chalermchai MahagitsiriPresident and Chief Executive Officer
112statement of tHe Board for tHe financial statements
THORESEN THAI AGENCIES PLC.
Annua l Repo r t 2015
Consolidated and Company FinanCial statements113
Independent Auditor’s Report
To the Shareholders of Thoresen Thai Agencies Public Company Limited
I have audited the accompanying consolidated and separate financial statements of Thoresen Thai Agencies Public Company Limited and its subsidiaries (the “Group”) , and of Thoresen Thai Agencies Public Company Limited (the “Company”), respectively, which comprise the consolidated and separate statements of financial position as at 31December 2015, the consolidated and separate statements of income, comprehensive income, changes in equity and cash flows for the year then ended, and notes, comprising a summary of significant accounting policies and other explanatory information.
Management’s Responsibility for the Consolidated and Separate Financial Statements
Management is responsible for the preparation and fair presentation of these consolidated and separate financial statements in accordance with Thai Financial Reporting Standards, and for such internal control as management determines is necessary to enable the preparation of consolidated and separate financial statements that are free from material misstatement, whether due to fraud or error.
Auditor’s Responsibility
My responsibility is to express an opinion on these consolidated and separate financial statements based on my audit. I conducted my audit in accordance with Thai Standards on Auditing. Those standards require that I comply with ethical requirements and plan and perform the audit to obtain reasonable assurance about whether the consolidated and separate financial statements are free from material misstatement.
An audit involves performing procedures to obtain audit evidence about the amounts and disclosures in the financial statements. The procedures selected depend on the auditor’s judgment, including the assessment of the risks of material misstatement of the financial statements, whether due to fraud or error. In making those risk assessments, the auditor considers internal control relevant to the entity’s preparation and fair presentation of the financial statements in order todesign audit procedures that are appropriate in the circumstances, but not for the purpose of expressing an opinion on the effectiveness of the entity’s internal control. An audit also includes evaluating the appropriateness of accounting policiesused and the reasonableness of accounting estimates made by management, as well as evaluating the overall presentation of the financial statements.
I believe that the audit evidence I have obtained is sufficient and appropriate to provide a basis for my audit opinion.
independent Auditor’s reportThoresen Thai Agencies Plc.
THORESEN THAI AGENCIES PLC.
Consolidated and Company FinanCial statements114
Opinion
In my opinion, the consolidated and separate financial statements present fairly, in all material respects, the financial position of the Group and the Company, respectively, as at 31 December 2015 and their financial performance and cash flows for year then ended in accordance with Thai Financial Reporting Standards.
Emphasis of Matter
Without qualifying my opinion, I draw attention to note 28 to these financial statements which states that the Group and the Company recorded impairment charges and write-offs of Baht 11,571 million and Baht 3,582 million, respectively for the year ended 31 December 2015.
In addition, I draw attention to note 3(d) to these financial statements which describes the effect of the Group and Company’s change of accounting policy regarding hedges of foreign currency transactions and interest rates effective from 1 January 2015. The corresponding figures presented are based on the audited consolidated and separate financial statements as at and for the three-month period ended 31 December 2014 after making the adjustments described in note 3(d).
Other matter
I draw attention to the following; the Group changed its financial year end from 30 September to 31 December. Consequently, the corresponding information presented for the three-month period ended 31 December 2014 is not comparable with the twelve-month period ended 31 December 2015. Supplementary information which consists of an unaudited consolidated statement of income for the twelve-month period ended 31 December 2014 is presented in note 39. I have not audited the supplementary information and do not express any opinion on that information.
(Veerachai Ratanajaratkul)Certified Public AccountantRegistration No. 4323
KPMG Phoomchai Audit Ltd.Bangkok29 February 2016
2

Annua l Repo r t 2015
Consolidated and Company FinanCial statements115
The accompanying notes are an integral part of these financial statements.
3
Thoresen Thai Agencies Public Company Limited and its Subsidiaries
Statement of financial position
1 October 1 OctoberAssets Note 2015 2014 2014 2015 2014 2014
(restated) (restated) (restated) (restated)
Current assets
Cash and cash equivalents 6 5,939,570 7,710,089 6,289,847 126,967 2,919,996 2,052,840
Short-term investments 7 7,483,440 570,243 1,323,849 5,507,151 44,848 47,792
Trade accounts receivable 5, 8 4,822,952 4,439,868 4,243,971 - - -
Other accounts receivable 225,420 349,535 428,153 3,066 364 12,799
Receivables from related parties 5 8,687 10,802 6,774 120,917 466,639 495,690
Short-term loans to related parties 5 - - - 5,517,012 1,462,280 2,083,753
Current portion of long-term
loans to related parties 5 2,073 2,073 2,073 9,573 6,573 607,723
Deferred contract costs 9 134,750 190,275 203,385 - - -
Inventories 10 743,973 770,657 659,058 - - -
Vessel supplies and spare parts 334,320 673,102 696,790 - - -
Prepayments 134,942 227,591 195,651 4,386 4,925 4,591
Non-current assets held for sale - - 149,416 - - -
Other current assets 11 980,198 463,743 386,726 24,679 20,200 20,978
Total current assets 20,810,325 15,407,978 14,585,693 11,313,751 4,925,825 5,326,166
Non-current assets
Long-term loans to related parties 5 - - - 7,500 694,508 734,876
Long-term investment 7 663,245 - - - - -
Investments in associates and joint ventures 12 4,574,552 7,102,538 5,972,030 62,352 62,352 60,336
Investments in subsidiaries 13 - - - 20,720,857 23,328,744 27,733,152
Goodwill 15 74,568 984,598 978,620 - - -
Property, plant, and equipment 16 18,386,615 27,260,692 26,924,236 147,500 179,374 182,404
Intangible assets 17 50,874 225,765 246,558 26,460 49,360 53,396
Deferred tax assets 18 301,413 259,730 217,454 189,105 161,545 119,646
Other non-current assets 19 484,807 437,609 445,506 13,031 1,691 511
Total non-current assets 24,536,074 36,270,932 34,784,404 21,166,805 24,477,574 28,884,321
Total assets 45,346,399 51,678,910 49,370,097 32,480,556 29,403,399 34,210,487
Consolidated
financial statements
Separate
financial statements
(in thousand Baht)
31 December31 December
The accompanying notes are an integral part of these financial statements.
3
Thoresen Thai Agencies Public Company Limited and its Subsidiaries
Statement of financial position
1 October 1 OctoberAssets Note 2015 2014 2014 2015 2014 2014
(restated) (restated) (restated) (restated)
Current assets
Cash and cash equivalents 6 5,939,570 7,710,089 6,289,847 126,967 2,919,996 2,052,840
Short-term investments 7 7,483,440 570,243 1,323,849 5,507,151 44,848 47,792
Trade accounts receivable 5, 8 4,822,952 4,439,868 4,243,971 - - -
Other accounts receivable 225,420 349,535 428,153 3,066 364 12,799
Receivables from related parties 5 8,687 10,802 6,774 120,917 466,639 495,690
Short-term loans to related parties 5 - - - 5,517,012 1,462,280 2,083,753
Current portion of long-term
loans to related parties 5 2,073 2,073 2,073 9,573 6,573 607,723
Deferred contract costs 9 134,750 190,275 203,385 - - -
Inventories 10 743,973 770,657 659,058 - - -
Vessel supplies and spare parts 334,320 673,102 696,790 - - -
Prepayments 134,942 227,591 195,651 4,386 4,925 4,591
Non-current assets held for sale - - 149,416 - - -
Other current assets 11 980,198 463,743 386,726 24,679 20,200 20,978
Total current assets 20,810,325 15,407,978 14,585,693 11,313,751 4,925,825 5,326,166
Non-current assets
Long-term loans to related parties 5 - - - 7,500 694,508 734,876
Long-term investment 7 663,245 - - - - -
Investments in associates and joint ventures 12 4,574,552 7,102,538 5,972,030 62,352 62,352 60,336
Investments in subsidiaries 13 - - - 20,720,857 23,328,744 27,733,152
Goodwill 15 74,568 984,598 978,620 - - -
Property, plant, and equipment 16 18,386,615 27,260,692 26,924,236 147,500 179,374 182,404
Intangible assets 17 50,874 225,765 246,558 26,460 49,360 53,396
Deferred tax assets 18 301,413 259,730 217,454 189,105 161,545 119,646
Other non-current assets 19 484,807 437,609 445,506 13,031 1,691 511
Total non-current assets 24,536,074 36,270,932 34,784,404 21,166,805 24,477,574 28,884,321
Total assets 45,346,399 51,678,910 49,370,097 32,480,556 29,403,399 34,210,487
Consolidated
financial statements
Separate
financial statements
(in thousand Baht)
31 December31 Decemberstatement of Financial positionThoresen Thai Agencies Plc. and its Subsidiaries

THORESEN THAI AGENCIES PLC.
Consolidated and Company FinanCial statements116
The accompanying notes are an integral part of these financial statements.
4
Thoresen Thai Agencies Public Company Limited and its Subsidiaries
Statement of financial position
1 October 1 OctoberLiabilities and equity Note 2015 2014 2014 2015 2014 2014
(restated) (restated) (restated) (restated)
Current liabilities
Bank overdrafts 20 7,479 8,525 4,244 - - -
Short-term loans 20 380,385 473,279 284,044 - - -
Trade accounts payable 953,792 1,702,766 1,229,828 3,858 6,584 9,686
Other accounts payable 119,285 193,288 152,607 2 - 61
Payables to related parties 5 9,632 5,698 7,576 57,905 55,407 365,001
Advances from customers 151,159 190,640 171,248 - - -
Short-term loans from related parties 5, 20 3,300 - - 1,403,305 1,287,653 5,816,657
Current portion of long-term loans 20 6,861,751 2,480,309 2,284,284 418,652 316,765 371,649
Current portion of bonds 20 - 2,055,386 2,017,010 - 2,055,386 2,017,010
Current portion of finance lease liabilities 20 6,064 6,693 6,264 - - -
Share subscription payable - 57,310 66,047 - - -
Accrued income taxes 119,008 165,548 154,030 - - -
Accrued expenses 1,928,335 1,465,201 1,580,498 58,343 43,791 102,438
Other current liabilities 371,796 322,807 363,114 10,614 16,647 137,308
Total current liabilities 10,911,986 9,127,450 8,320,794 1,952,679 3,782,233 8,819,810
Non-current liabilities
Long-term loans 20 2,640,446 7,764,888 7,181,210 - 510,798 604,869
Bonds 20 4,496,034 2,180,267 2,141,589 4,496,034 2,180,267 2,141,589
Finance lease liabilities 20 5,812 9,332 9,186 - - -
Deferred tax liabilities 18 125,366 195,860 163,757 - - -
Employee benefit obligations 21 178,395 155,016 111,663 17,458 13,196 12,343
Total non-current liabilities 7,446,053 10,305,363 9,607,405 4,513,492 2,704,261 2,758,801
Total liabilities 18,358,039 19,432,813 17,928,199 6,466,171 6,486,494 11,578,611
Consolidated
(in thousand Baht)
31 December
financial statements financial statements
Separate
31 December
statement of Financial positionThoresen Thai Agencies Plc. and its Subsidiaries
The accompanying notes are an integral part of these financial statements.
3
Thoresen Thai Agencies Public Company Limited and its Subsidiaries
Statement of financial position
1 October 1 OctoberAssets Note 2015 2014 2014 2015 2014 2014
(restated) (restated) (restated) (restated)
Current assets
Cash and cash equivalents 6 5,939,570 7,710,089 6,289,847 126,967 2,919,996 2,052,840
Short-term investments 7 7,483,440 570,243 1,323,849 5,507,151 44,848 47,792
Trade accounts receivable 5, 8 4,822,952 4,439,868 4,243,971 - - -
Other accounts receivable 225,420 349,535 428,153 3,066 364 12,799
Receivables from related parties 5 8,687 10,802 6,774 120,917 466,639 495,690
Short-term loans to related parties 5 - - - 5,517,012 1,462,280 2,083,753
Current portion of long-term
loans to related parties 5 2,073 2,073 2,073 9,573 6,573 607,723
Deferred contract costs 9 134,750 190,275 203,385 - - -
Inventories 10 743,973 770,657 659,058 - - -
Vessel supplies and spare parts 334,320 673,102 696,790 - - -
Prepayments 134,942 227,591 195,651 4,386 4,925 4,591
Non-current assets held for sale - - 149,416 - - -
Other current assets 11 980,198 463,743 386,726 24,679 20,200 20,978
Total current assets 20,810,325 15,407,978 14,585,693 11,313,751 4,925,825 5,326,166
Non-current assets
Long-term loans to related parties 5 - - - 7,500 694,508 734,876
Long-term investment 7 663,245 - - - - -
Investments in associates and joint ventures 12 4,574,552 7,102,538 5,972,030 62,352 62,352 60,336
Investments in subsidiaries 13 - - - 20,720,857 23,328,744 27,733,152
Goodwill 15 74,568 984,598 978,620 - - -
Property, plant, and equipment 16 18,386,615 27,260,692 26,924,236 147,500 179,374 182,404
Intangible assets 17 50,874 225,765 246,558 26,460 49,360 53,396
Deferred tax assets 18 301,413 259,730 217,454 189,105 161,545 119,646
Other non-current assets 19 484,807 437,609 445,506 13,031 1,691 511
Total non-current assets 24,536,074 36,270,932 34,784,404 21,166,805 24,477,574 28,884,321
Total assets 45,346,399 51,678,910 49,370,097 32,480,556 29,403,399 34,210,487
Consolidated
financial statements
Separate
financial statements
(in thousand Baht)
31 December31 December

Annua l Repo r t 2015
Consolidated and Company FinanCial statements117
The accompanying notes are an integral part of these financial statements.
5
Thoresen Thai Agencies Public Company Limited and its Subsidiaries
Statement of financial position
1 October 1 OctoberLiabilities and equity Note 2015 2014 2014 2015 2014 2014
(restated) (restated) (restated) (restated)
Equity
Share capital 22
Authorised share capital 2,276,847 1,544,106 1,544,106 2,276,847 1,544,106 1,544,106
Issued and paid-up share capital 1,822,454 1,301,175 1,293,235 1,822,454 1,301,175 1,293,235
Premium on ordinary shares 16,059,845 9,282,187 9,161,644 16,059,845 9,282,187 9,161,644
Retained earnings
Appropriated - legal reserves 23 110,340 110,340 98,830 110,340 110,340 98,830
Unappropriated 522,476 12,223,812 12,151,324 8,045,019 12,233,775 12,085,938
Other components of equity 3,101,332 1,332,079 863,262 (23,273) (10,572) (7,771)
Equity attributable to owners
of the Company 21,616,447 24,249,593 23,568,295 26,014,385 22,916,905 22,631,876
Non-controlling interests 14 5,371,913 7,996,504 7,873,603 - - -
Total equity 26,988,360 32,246,097 31,441,898 26,014,385 22,916,905 22,631,876
Total liabilities and equity 45,346,399 51,678,910 49,370,097 32,480,556 29,403,399 34,210,487
(in thousand Baht)
31 December 31 December
financial statements
Separate
financial statements
Consolidated
statement of Financial positionThoresen Thai Agencies Plc. and its Subsidiaries
The accompanying notes are an integral part of these financial statements.
3
Thoresen Thai Agencies Public Company Limited and its Subsidiaries
Statement of financial position
1 October 1 OctoberAssets Note 2015 2014 2014 2015 2014 2014
(restated) (restated) (restated) (restated)
Current assets
Cash and cash equivalents 6 5,939,570 7,710,089 6,289,847 126,967 2,919,996 2,052,840
Short-term investments 7 7,483,440 570,243 1,323,849 5,507,151 44,848 47,792
Trade accounts receivable 5, 8 4,822,952 4,439,868 4,243,971 - - -
Other accounts receivable 225,420 349,535 428,153 3,066 364 12,799
Receivables from related parties 5 8,687 10,802 6,774 120,917 466,639 495,690
Short-term loans to related parties 5 - - - 5,517,012 1,462,280 2,083,753
Current portion of long-term
loans to related parties 5 2,073 2,073 2,073 9,573 6,573 607,723
Deferred contract costs 9 134,750 190,275 203,385 - - -
Inventories 10 743,973 770,657 659,058 - - -
Vessel supplies and spare parts 334,320 673,102 696,790 - - -
Prepayments 134,942 227,591 195,651 4,386 4,925 4,591
Non-current assets held for sale - - 149,416 - - -
Other current assets 11 980,198 463,743 386,726 24,679 20,200 20,978
Total current assets 20,810,325 15,407,978 14,585,693 11,313,751 4,925,825 5,326,166
Non-current assets
Long-term loans to related parties 5 - - - 7,500 694,508 734,876
Long-term investment 7 663,245 - - - - -
Investments in associates and joint ventures 12 4,574,552 7,102,538 5,972,030 62,352 62,352 60,336
Investments in subsidiaries 13 - - - 20,720,857 23,328,744 27,733,152
Goodwill 15 74,568 984,598 978,620 - - -
Property, plant, and equipment 16 18,386,615 27,260,692 26,924,236 147,500 179,374 182,404
Intangible assets 17 50,874 225,765 246,558 26,460 49,360 53,396
Deferred tax assets 18 301,413 259,730 217,454 189,105 161,545 119,646
Other non-current assets 19 484,807 437,609 445,506 13,031 1,691 511
Total non-current assets 24,536,074 36,270,932 34,784,404 21,166,805 24,477,574 28,884,321
Total assets 45,346,399 51,678,910 49,370,097 32,480,556 29,403,399 34,210,487
Consolidated
financial statements
Separate
financial statements
(in thousand Baht)
31 December31 December
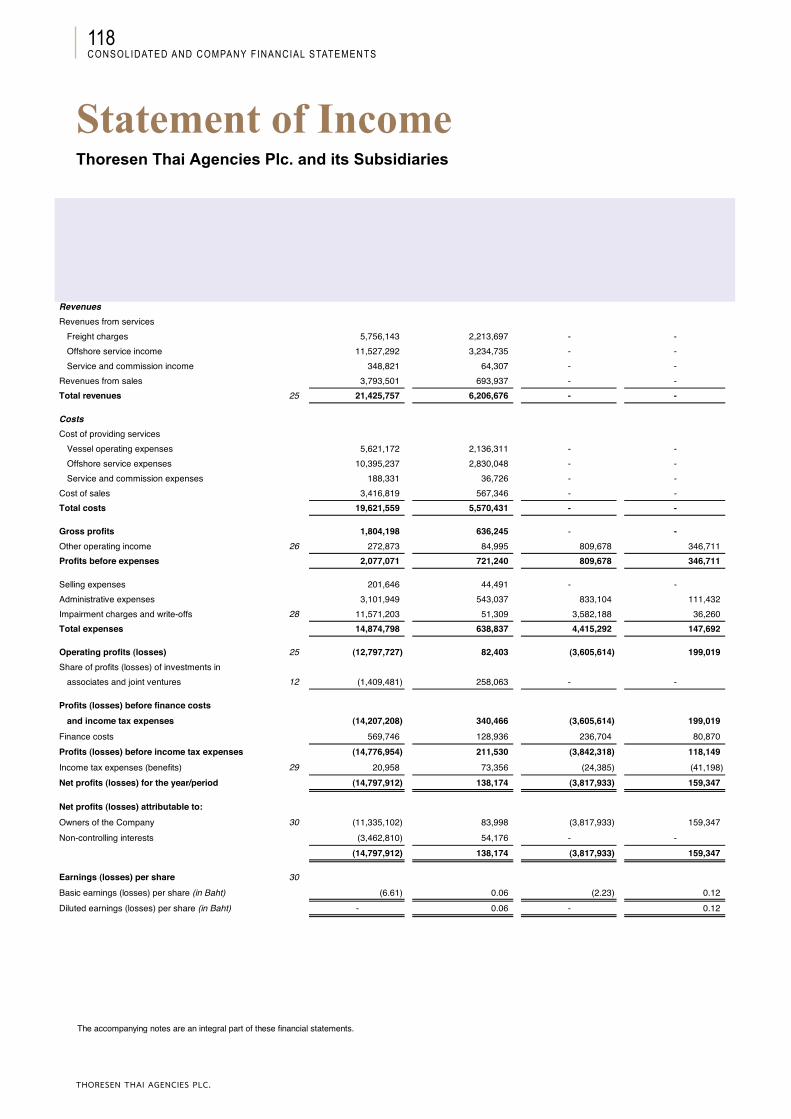
THORESEN THAI AGENCIES PLC.
Consolidated and Company FinanCial statements118
The accompanying notes are an integral part of these financial statements.
6
Thoresen Thai Agencies Public Company Limited and its Subsidiaries
Statement of income
For the year For the three-month For the year For the three-month ended period ended ended period ended
31 December 2015 31 December 2014 31 December 2015 31 December 2014Note (restated) (restated)
RevenuesRevenues from services
Freight charges 5,756,143 2,213,697 - -Offshore service income 11,527,292 3,234,735 - -Service and commission income 348,821 64,307 - -
Revenues from sales 3,793,501 693,937 - -Total revenues 25 21,425,757 6,206,676 - -
CostsCost of providing services
Vessel operating expenses 5,621,172 2,136,311 - -Offshore service expenses 10,395,237 2,830,048 - -Service and commission expenses 188,331 36,726 - -
Cost of sales 3,416,819 567,346 - -Total costs 19,621,559 5,570,431 - -
Gross profits 1,804,198 636,245 - -Other operating income 26 272,873 84,995 809,678 346,711Profits before expenses 2,077,071 721,240 809,678 346,711
Selling expenses 201,646 44,491 - -Administrative expenses 3,101,949 543,037 833,104 111,432Impairment charges and write-offs 28 11,571,203 51,309 3,582,188 36,260Total expenses 14,874,798 638,837 4,415,292 147,692
Operating profits (losses) 25 (12,797,727) 82,403 (3,605,614) 199,019Share of profits (losses) of investments in
associates and joint ventures 12 (1,409,481) 258,063 - -
Profits (losses) before finance costsand income tax expenses (14,207,208) 340,466 (3,605,614) 199,019
Finance costs 569,746 128,936 236,704 80,870Profits (losses) before income tax expenses (14,776,954) 211,530 (3,842,318) 118,149Income tax expenses (benefits) 29 20,958 73,356 (24,385) (41,198)Net profits (losses) for the year/period (14,797,912) 138,174 (3,817,933) 159,347
Net profits (losses) attributable to:Owners of the Company 30 (11,335,102) 83,998 (3,817,933) 159,347Non-controlling interests (3,462,810) 54,176 - -
(14,797,912) 138,174 (3,817,933) 159,347
Earnings (losses) per share 30Basic earnings (losses) per share (in Baht) (6.61) 0.06 (2.23) 0.12Diluted earnings (losses) per share (in Baht) - 0.06 - 0.12
(in thousand Baht)
Consolidated Separatefinancial statements financial statements
statement of incomeThoresen Thai Agencies Plc. and its Subsidiaries
The accompanying notes are an integral part of these financial statements.
3
Thoresen Thai Agencies Public Company Limited and its Subsidiaries
Statement of financial position
1 October 1 OctoberAssets Note 2015 2014 2014 2015 2014 2014
(restated) (restated) (restated) (restated)
Current assets
Cash and cash equivalents 6 5,939,570 7,710,089 6,289,847 126,967 2,919,996 2,052,840
Short-term investments 7 7,483,440 570,243 1,323,849 5,507,151 44,848 47,792
Trade accounts receivable 5, 8 4,822,952 4,439,868 4,243,971 - - -
Other accounts receivable 225,420 349,535 428,153 3,066 364 12,799
Receivables from related parties 5 8,687 10,802 6,774 120,917 466,639 495,690
Short-term loans to related parties 5 - - - 5,517,012 1,462,280 2,083,753
Current portion of long-term
loans to related parties 5 2,073 2,073 2,073 9,573 6,573 607,723
Deferred contract costs 9 134,750 190,275 203,385 - - -
Inventories 10 743,973 770,657 659,058 - - -
Vessel supplies and spare parts 334,320 673,102 696,790 - - -
Prepayments 134,942 227,591 195,651 4,386 4,925 4,591
Non-current assets held for sale - - 149,416 - - -
Other current assets 11 980,198 463,743 386,726 24,679 20,200 20,978
Total current assets 20,810,325 15,407,978 14,585,693 11,313,751 4,925,825 5,326,166
Non-current assets
Long-term loans to related parties 5 - - - 7,500 694,508 734,876
Long-term investment 7 663,245 - - - - -
Investments in associates and joint ventures 12 4,574,552 7,102,538 5,972,030 62,352 62,352 60,336
Investments in subsidiaries 13 - - - 20,720,857 23,328,744 27,733,152
Goodwill 15 74,568 984,598 978,620 - - -
Property, plant, and equipment 16 18,386,615 27,260,692 26,924,236 147,500 179,374 182,404
Intangible assets 17 50,874 225,765 246,558 26,460 49,360 53,396
Deferred tax assets 18 301,413 259,730 217,454 189,105 161,545 119,646
Other non-current assets 19 484,807 437,609 445,506 13,031 1,691 511
Total non-current assets 24,536,074 36,270,932 34,784,404 21,166,805 24,477,574 28,884,321
Total assets 45,346,399 51,678,910 49,370,097 32,480,556 29,403,399 34,210,487
Consolidated
financial statements
Separate
financial statements
(in thousand Baht)
31 December31 December
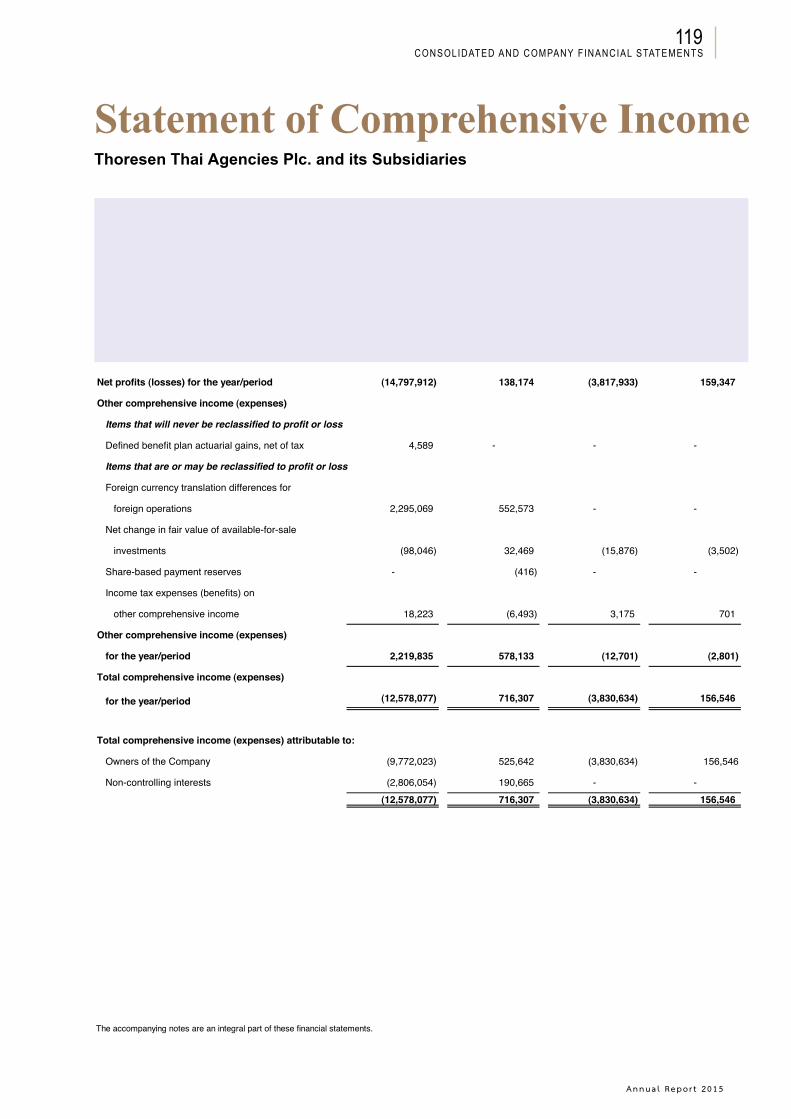
Annua l Repo r t 2015
Consolidated and Company FinanCial statements119
The accompanying notes are an integral part of these financial statements.
7
Thoresen Thai Agencies Public Company Limited and its Subsidiaries
Statement of comprehensive income
For the year For the three-month For the year For the three-month
ended period ended ended period ended
31 December 2015 31 December 2014 31 December 2015 31 December 2014
(restated) (restated)
Net profits (losses) for the year/period (14,797,912) 138,174 (3,817,933) 159,347
Other comprehensive income (expenses)
Items that will never be reclassified to profit or loss
Defined benefit plan actuarial gains, net of tax 4,589 - - -
Items that are or may be reclassified to profit or loss
Foreign currency translation differences for
foreign operations 2,295,069 552,573 - -
Net change in fair value of available-for-sale
investments (98,046) 32,469 (15,876) (3,502)
Share-based payment reserves - (416) - -
Income tax expenses (benefits) on
other comprehensive income 18,223 (6,493) 3,175 701
Other comprehensive income (expenses)
for the year/period 2,219,835 578,133 (12,701) (2,801)
Total comprehensive income (expenses)
for the year/period (12,578,077) 716,307 (3,830,634) 156,546
Total comprehensive income (expenses) attributable to:
Owners of the Company (9,772,023) 525,642 (3,830,634) 156,546
Non-controlling interests (2,806,054) 190,665 - -(12,578,077) 716,307 (3,830,634) 156,546
(in thousand Baht)
Consolidated Separate
financial statements financial statements
statement of Comprehensive incomeThoresen Thai Agencies Plc. and its Subsidiaries
The accompanying notes are an integral part of these financial statements.
3
Thoresen Thai Agencies Public Company Limited and its Subsidiaries
Statement of financial position
1 October 1 OctoberAssets Note 2015 2014 2014 2015 2014 2014
(restated) (restated) (restated) (restated)
Current assets
Cash and cash equivalents 6 5,939,570 7,710,089 6,289,847 126,967 2,919,996 2,052,840
Short-term investments 7 7,483,440 570,243 1,323,849 5,507,151 44,848 47,792
Trade accounts receivable 5, 8 4,822,952 4,439,868 4,243,971 - - -
Other accounts receivable 225,420 349,535 428,153 3,066 364 12,799
Receivables from related parties 5 8,687 10,802 6,774 120,917 466,639 495,690
Short-term loans to related parties 5 - - - 5,517,012 1,462,280 2,083,753
Current portion of long-term
loans to related parties 5 2,073 2,073 2,073 9,573 6,573 607,723
Deferred contract costs 9 134,750 190,275 203,385 - - -
Inventories 10 743,973 770,657 659,058 - - -
Vessel supplies and spare parts 334,320 673,102 696,790 - - -
Prepayments 134,942 227,591 195,651 4,386 4,925 4,591
Non-current assets held for sale - - 149,416 - - -
Other current assets 11 980,198 463,743 386,726 24,679 20,200 20,978
Total current assets 20,810,325 15,407,978 14,585,693 11,313,751 4,925,825 5,326,166
Non-current assets
Long-term loans to related parties 5 - - - 7,500 694,508 734,876
Long-term investment 7 663,245 - - - - -
Investments in associates and joint ventures 12 4,574,552 7,102,538 5,972,030 62,352 62,352 60,336
Investments in subsidiaries 13 - - - 20,720,857 23,328,744 27,733,152
Goodwill 15 74,568 984,598 978,620 - - -
Property, plant, and equipment 16 18,386,615 27,260,692 26,924,236 147,500 179,374 182,404
Intangible assets 17 50,874 225,765 246,558 26,460 49,360 53,396
Deferred tax assets 18 301,413 259,730 217,454 189,105 161,545 119,646
Other non-current assets 19 484,807 437,609 445,506 13,031 1,691 511
Total non-current assets 24,536,074 36,270,932 34,784,404 21,166,805 24,477,574 28,884,321
Total assets 45,346,399 51,678,910 49,370,097 32,480,556 29,403,399 34,210,487
Consolidated
financial statements
Separate
financial statements
(in thousand Baht)
31 December31 December
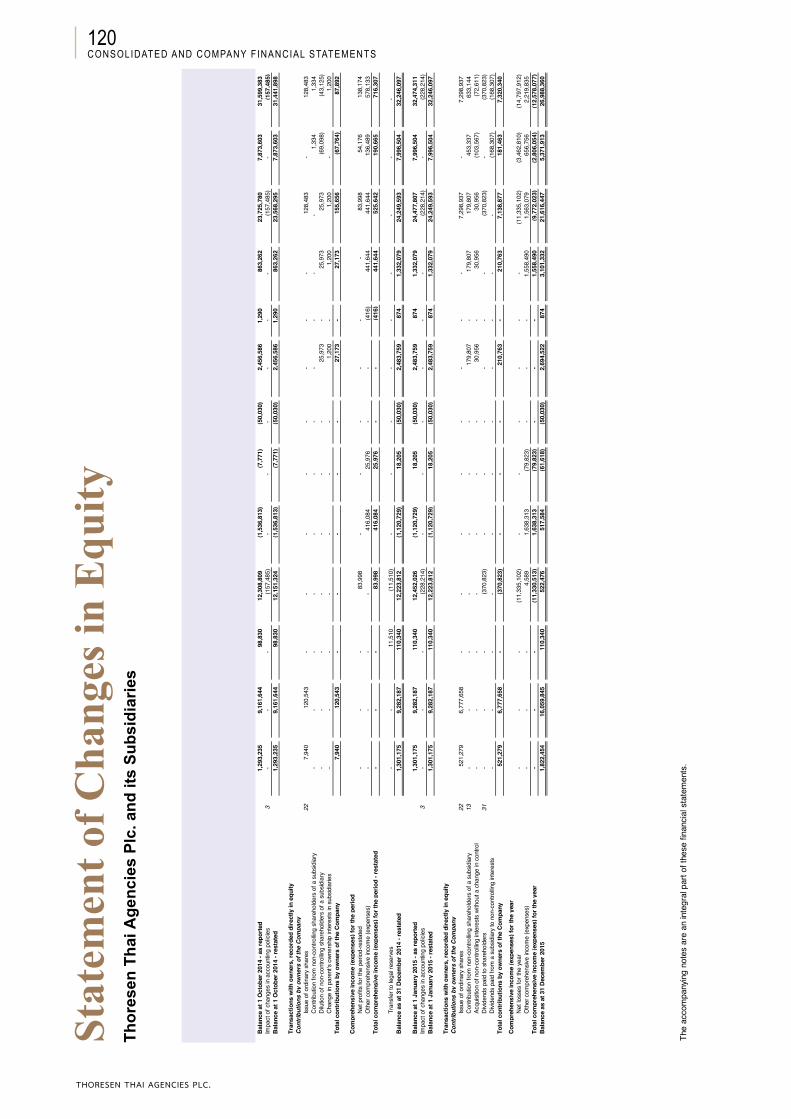
THORESEN THAI AGENCIES PLC.
Consolidated and Company FinanCial statements120
The
acco
mpa
nyin
g no
tes
are
an in
tegr
al p
art o
f the
se fi
nanc
ial s
tate
men
ts.
8
Thor
esen
Tha
i Age
ncie
s Pu
blic
Com
pany
Lim
ited
and
its S
ubsi
diar
ies
Stat
emen
t of c
hang
es in
equ
ity
Cap
ital
Fore
ign
curre
ncy
Fair
valu
ere
serv
es -
Cha
nge
intra
nsla
tion
chan
ge in
adju
stm
ent
pare
nt's
Shar
e-Eq
uity
Is
sued
and
Prem
ium
diffe
renc
es
avai
labl
e-fo
r-sal
ear
ising
from
owne
rshi
pba
sed
Tota
l oth
erat
tribu
tabl
e to
Non
-pa
id-u
p sh
are
on o
rdin
ary
Lega
lfo
r for
eign
inve
stm
ents
,bu
sines
sin
tere
sts
inpa
ymen
tco
mpo
nent
sow
ners
of
cont
rollin
gTo
tal
Not
e c
apita
lsh
ares
rese
rves
Una
ppro
pria
ted
oper
atio
nsne
t of t
axre
stru
ctur
ing
subs
idia
ries
rese
rves
of e
quity
the
Com
pany
inte
rest
seq
uity
Bal
ance
at 1
Oct
ober
201
4 - a
s re
port
ed1,
293,
235
9,16
1,64
498
,830
12,3
08,8
09(1
,536
,813
)(7
,771
)(5
0,03
0)2,
456,
586
1,29
086
3,26
223
,725
,780
7,87
3,60
331
,599
,383
Impa
ct o
f cha
nges
in a
ccou
ntin
g po
licie
s3
--
-(1
57,4
85)
--
--
--
(157
,485
)-
(157
,485
)B
alan
ce a
t 1 O
ctob
er 2
014
- res
tate
d1,
293,
235
9,16
1,64
498
,830
12,1
51,3
24(1
,536
,813
)(7
,771
)(5
0,03
0)2,
456,
586
1,29
086
3,26
223
,568
,295
7,87
3,60
331
,441
,898
Tran
sact
ions
with
ow
ners
, rec
orde
d di
rect
ly in
equ
ityC
ontr
ibut
ions
by
owne
rs o
f the
Com
pany
Issu
e of
ord
inar
y sh
ares
22
7,94
012
0,54
3-
--
--
--
-12
8,48
3-
128,
483
Con
tribu
tion
from
non
-con
trollin
g sh
areh
olde
rs o
f a s
ubsid
iary
-
--
--
--
--
--
1,33
41,
334
Dilu
tion
of n
on-c
ontro
lling
shar
ehol
ders
of a
sub
sidia
ry-
--
--
--
25,9
73-
25,9
7325
,973
(69,
098)
(43,
125)
Cha
nge
in p
aren
t's o
wne
rshi
p in
tere
sts
in s
ubsid
iarie
s-
--
--
--
1,20
0-
1,20
01,
200
-1,
200
Tota
l con
trib
utio
ns b
y ow
ners
of t
he C
ompa
ny7,
940
120,
543
--
--
-27
,173
-27
,173
155,
656
(67,
764)
87,8
92
Com
preh
ensi
ve in
com
e (e
xpen
ses)
for t
he p
erio
dN
et p
rofit
s fo
r the
per
iod-
rest
ated
--
-83
,998
--
--
--
83,9
9854
,176
138,
174
Oth
er c
ompr
ehen
sive
inco
me
(exp
ense
s)-
--
-41
6,08
425
,976
--
(416
)44
1,64
444
1,64
413
6,48
957
8,13
3To
tal c
ompr
ehen
sive
inco
me
(exp
ense
s) fo
r the
per
iod
- res
tate
d-
--
83,9
9841
6,08
425
,976
--
(416
)44
1,64
452
5,64
219
0,66
571
6,30
7
Tran
sfer
to le
gal r
eser
ves
--
11,5
10(1
1,51
0)-
--
--
--
--
Bal
ance
as
at 3
1 D
ecem
ber 2
014
- res
tate
d1,
301,
175
9,28
2,18
711
0,34
012
,223
,812
(1,1
20,7
29)
18,2
05(5
0,03
0)2,
483,
759
874
1,33
2,07
924
,249
,593
7,99
6,50
432
,246
,097
Bal
ance
at 1
Jan
uary
201
5 - a
s re
port
ed1,
301,
175
9,28
2,18
711
0,34
012
,452
,026
(1,1
20,7
29)
18,2
05(5
0,03
0)2,
483,
759
874
1,33
2,07
924
,477
,807
7,99
6,50
432
,474
,311
Impa
ct o
f cha
nges
in a
ccou
ntin
g po
licie
s3
--
-(2
28,2
14)
--
--
--
(228
,214
)-
(228
,214
)B
alan
ce a
t 1 J
anua
ry 2
015
- res
tate
d1,
301,
175
9,28
2,18
711
0,34
012
,223
,812
(1,1
20,7
29)
18,2
05(5
0,03
0)2,
483,
759
874
1,33
2,07
924
,249
,593
7,99
6,50
432
,246
,097
Tran
sact
ions
with
ow
ners
, rec
orde
d di
rect
ly in
equ
ityC
ontr
ibut
ions
by
owne
rs o
f the
Com
pany
Issu
e of
ord
inar
y sh
ares
22
521,
279
6,77
7,65
8-
--
--
--
-7,
298,
937
-7,
298,
937
Con
tribu
tion
from
non
-con
trollin
g sh
areh
olde
rs o
f a s
ubsid
iary
13-
--
--
--
179,
807
-17
9,80
717
9,80
745
3,33
763
3,14
4Ac
quisi
tion
of n
on-c
ontro
lling
inte
rest
s w
ithou
t a c
hang
e in
con
trol
--
--
--
-30
,956
-30
,956
30,9
56(1
03,5
67)
(72,
611)
Divi
dend
s pa
id to
sha
reho
lder
s31
--
-(3
70,8
23)
--
--
--
(370
,823
)-
(370
,823
)D
ivide
nds
paid
from
a s
ubsid
iary
to n
on-c
ontro
lling
inte
rest
s-
--
--
--
--
--
(168
,307
)(1
68,3
07)
Tota
l con
trib
utio
ns b
y ow
ners
of t
he C
ompa
ny52
1,27
96,
777,
658
-(3
70,8
23)
--
-21
0,76
3-
210,
763
7,13
8,87
718
1,46
37,
320,
340
Com
preh
ensi
ve in
com
e (e
xpen
ses)
for t
he y
ear
Net
loss
es fo
r the
yea
r-
--
(11,
335,
102)
--
--
--
(11,
335,
102)
(3,4
62,8
10)
(14,
797,
912)
Oth
er c
ompr
ehen
sive
inco
me
(exp
ense
s)-
--
4,58
91,
638,
313
(79,
823)
--
-1,
558,
490
1,56
3,07
965
6,75
62,
219,
835
Tota
l com
preh
ensi
ve in
com
e (e
xpen
ses)
for t
he y
ear
--
-(1
1,33
0,51
3)1,
638,
313
(79,
823)
--
-1,
558,
490
(9,7
72,0
23)
(2,8
06,0
54)
(12,
578,
077)
Bal
ance
as
at 3
1 D
ecem
ber 2
015
1,82
2,45
416
,059
,845
110,
340
522,
476
517,
584
(61,
618)
(50,
030)
2,69
4,52
287
43,
101,
332
21,6
16,4
475,
371,
913
26,9
88,3
60
Con
solid
ated
fina
ncia
l sta
tem
ents
Oth
er c
ompo
nent
s of
equ
ity
Ret
aine
d ea
rnin
gs
(in th
ousa
nd B
aht)
stat
emen
t of C
hang
es in
equ
ityT
ho
rese
n T
hai
Ag
enci
es P
lc. a
nd
its
Su
bsi
dia
ries
The
acco
mpa
nyin
g no
tes
are
an in
tegr
al p
art o
f the
se fi
nanc
ial s
tate
men
ts.
3
Thor
esen
Tha
i Age
ncie
s Pu
blic
Com
pany
Lim
ited
and
its S
ubsi
diar
ies
Stat
emen
t of f
inan
cial
pos
ition
1 O
ctob
er1
Oct
ober
Asse
tsNo
te20
1520
1420
1420
1520
1420
14
(rest
ated
)(re
stat
ed)
(rest
ated
)(re
stat
ed)
Curr
ent a
sset
s
Cash
and
cas
h eq
uiva
lent
s6
5,93
9,57
07,
710,
089
6,28
9,84
712
6,96
72,
919,
996
2,05
2,84
0
Shor
t-ter
m in
vest
men
ts7
7,48
3,44
057
0,24
31,
323,
849
5,50
7,15
144
,848
47,7
92
Trad
e ac
coun
ts re
ceiva
ble
5, 8
4,82
2,95
24,
439,
868
4,24
3,97
1-
--
Oth
er a
ccou
nts
rece
ivabl
e22
5,42
034
9,53
542
8,15
33,
066
364
12,7
99
Rec
eiva
bles
from
rela
ted
parti
es5
8,68
710
,802
6,77
412
0,91
746
6,63
949
5,69
0
Shor
t-ter
m lo
ans
to re
late
d pa
rties
5-
--
5,51
7,01
21,
462,
280
2,08
3,75
3
Curre
nt p
ortio
n of
long
-term
lo
ans
to re
late
d pa
rties
52,
073
2,07
32,
073
9,57
36,
573
607,
723
Def
erre
d co
ntra
ct c
osts
913
4,75
019
0,27
520
3,38
5-
--
Inve
ntor
ies
1074
3,97
377
0,65
765
9,05
8-
--
Vess
el s
uppl
ies
and
spar
e pa
rts33
4,32
067
3,10
269
6,79
0-
--
Prep
aym
ents
134,
942
227,
591
195,
651
4,38
64,
925
4,59
1
Non-
curre
nt a
sset
s he
ld fo
r sal
e-
-14
9,41
6-
--
Oth
er c
urre
nt a
sset
s11
980,
198
463,
743
386,
726
24,6
7920
,200
20,9
78
Tota
l cur
rent
ass
ets
20,8
10,3
2515
,407
,978
14,5
85,6
9311
,313
,751
4,92
5,82
55,
326,
166
Non-
curr
ent a
sset
s
Long
-term
loan
s to
rela
ted
parti
es5
--
-7,
500
694,
508
734,
876
Long
-term
inve
stm
ent
766
3,24
5-
--
--
Inve
stm
ents
in a
ssoc
iate
s an
d jo
int v
entu
res
124,
574,
552
7,10
2,53
85,
972,
030
62,3
5262
,352
60,3
36
Inve
stm
ents
in s
ubsid
iarie
s13
--
-20
,720
,857
23,3
28,7
4427
,733
,152
Goo
dwill
1574
,568
984,
598
978,
620
--
-
Prop
erty
, pla
nt, a
nd e
quip
men
t16
18,3
86,6
1527
,260
,692
26,9
24,2
3614
7,50
017
9,37
418
2,40
4
Inta
ngib
le a
sset
s17
50,8
7422
5,76
524
6,55
826
,460
49,3
6053
,396
Def
erre
d ta
x as
sets
1830
1,41
325
9,73
021
7,45
418
9,10
516
1,54
511
9,64
6
Oth
er n
on-c
urre
nt a
sset
s19
484,
807
437,
609
445,
506
13,0
311,
691
511
Tota
l non
-cur
rent
ass
ets
24,5
36,0
7436
,270
,932
34,7
84,4
0421
,166
,805
24,4
77,5
7428
,884
,321
Tota
l ass
ets
45,3
46,3
9951
,678
,910
49,3
70,0
9732
,480
,556
29,4
03,3
9934
,210
,487
Cons
olid
ated
finan
cial
sta
tem
ents
Sepa
rate
finan
cial
sta
tem
ents
(in th
ousa
nd B
aht)
31 D
ecem
ber
31 D
ecem
ber

Annua l Repo r t 2015
Consolidated and Company FinanCial statements121
The
acco
mpa
nyin
g no
tes
are
an in
tegr
al p
art o
f the
se fi
nanc
ial s
tate
men
ts.
3
Thor
esen
Tha
i Age
ncie
s Pu
blic
Com
pany
Lim
ited
and
its S
ubsi
diar
ies
Stat
emen
t of c
hang
es in
equ
ity
Issu
ed a
ndFa
ir va
lue
chan
ge in
paid
-up
shar
ePr
emiu
mRe
tain
ed e
arni
ngs
avai
labl
e-fo
r-sal
eTo
tal o
ther
on o
rdin
ary
Lega
lin
vest
men
ts,
com
pone
nts
ofTo
tal
Note
cap
ital
shar
esre
serv
esUn
appr
opria
ted
net o
f tax
equi
tyeq
uity
Bala
nce
at 1
Oct
ober
201
4 - a
s re
port
ed1,
293,
235
9,16
1,64
498
,830
12,2
43,4
23(7
,771
)(7
,771
)22
,789
,361
Impa
ct o
f cha
nges
in a
ccou
ntin
g po
licie
s3
--
-(1
57,4
85)
--
(157
,485
)
Bala
nce
at 1
Oct
ober
201
4 - r
esta
ted
1,29
3,23
59,
161,
644
98,8
3012
,085
,938
(7,7
71)
(7,7
71)
22,6
31,8
76
Tran
sact
ions
with
ow
ners
, rec
orde
d di
rect
ly in
equ
ity
Cont
ribut
ions
by
owne
rs o
f the
Com
pany
Issu
e of
ord
inar
y sh
ares
227,
940
120,
543
--
--
128,
483
Tota
l con
trib
utio
ns b
y ow
ners
of t
he C
ompa
ny7,
940
120,
543
--
--
128,
483
Com
preh
ensi
ve in
com
e (e
xpen
ses)
for t
he p
erio
d
Net p
rofit
s fo
r the
per
iod
- res
tate
d-
--
159,
347
--
159,
347
Oth
er c
ompr
ehen
sive
exp
ense
s-
--
-(2
,801
)(2
,801
)(2
,801
)
Tota
l com
preh
ensi
ve in
com
e (e
xpen
ses)
for t
he p
erio
d - r
esta
ted
--
-15
9,34
7(2
,801
)(2
,801
)15
6,54
6
Tran
sfer
to le
gal r
eser
ves
--
11,5
10(1
1,51
0)-
--
Bala
nce
as a
t 31
Dece
mbe
r 201
4 - r
esta
ted
1,30
1,17
59,
282,
187
110,
340
12,2
33,7
75(1
0,57
2)(1
0,57
2)22
,916
,905
Bala
nce
at 1
Jan
uary
201
5 - a
s re
port
ed1,
301,
175
9,28
2,18
711
0,34
012
,461
,989
(10,
572)
(10,
572)
23,1
45,1
19Im
pact
of c
hang
es in
acc
ount
ing
polic
ies
3-
--
(228
,214
)-
-(2
28,2
14)
Bala
nce
at 1
Jan
uary
201
5 - r
esta
ted
1,30
1,17
59,
282,
187
110,
340
12,2
33,7
75(1
0,57
2)(1
0,57
2)22
,916
,905
Tran
sact
ions
with
ow
ners
, rec
orde
d di
rect
ly in
equ
ity
Cont
ribut
ions
by
owne
rs o
f the
Com
pany
Issu
e of
ord
inar
y sh
ares
2252
1,27
96,
777,
658
--
--
7,29
8,93
7
Divi
dend
s pa
id to
sha
reho
lder
s31
--
-(3
70,8
23)
--
(370
,823
)
Tota
l con
trib
utio
ns b
y ow
ners
of t
he C
ompa
ny52
1,27
96,
777,
658
-(3
70,8
23)
--
6,92
8,11
4
Com
preh
ensi
ve e
xpen
ses
for t
he y
ear
Net l
osse
s fo
r the
yea
r-
--
(3,8
17,9
33)
--
(3,8
17,9
33)
Oth
er c
ompr
ehen
sive
exp
ense
s-
--
-(1
2,70
1)(1
2,70
1)(1
2,70
1)
Tota
l com
preh
ensi
ve e
xpen
ses
for t
he y
ear
--
-(3
,817
,933
)(1
2,70
1)(1
2,70
1)(3
,830
,634
)
Bala
nce
as a
t 31
Dece
mbe
r 201
51,
822,
454
16,0
59,8
4511
0,34
08,
045,
019
(23,
273)
(23,
273)
26,0
14,3
85
Sepa
rate
fina
ncia
l sta
tem
ents
Oth
er c
ompo
nent
s of
equ
ity
(in th
ousa
nd B
aht)
stat
emen
t of C
hang
es in
equ
ityT
ho
rese
n T
hai
Ag
enci
es P
lc. a
nd
its
Su
bsi
dia
ries
The
acco
mpa
nyin
g no
tes
are
an in
tegr
al p
art o
f the
se fi
nanc
ial s
tate
men
ts.
3
Thor
esen
Tha
i Age
ncie
s Pu
blic
Com
pany
Lim
ited
and
its S
ubsi
diar
ies
Stat
emen
t of f
inan
cial
pos
ition
1 O
ctob
er1
Oct
ober
Asse
tsNo
te20
1520
1420
1420
1520
1420
14
(rest
ated
)(re
stat
ed)
(rest
ated
)(re
stat
ed)
Curr
ent a
sset
s
Cash
and
cas
h eq
uiva
lent
s6
5,93
9,57
07,
710,
089
6,28
9,84
712
6,96
72,
919,
996
2,05
2,84
0
Shor
t-ter
m in
vest
men
ts7
7,48
3,44
057
0,24
31,
323,
849
5,50
7,15
144
,848
47,7
92
Trad
e ac
coun
ts re
ceiva
ble
5, 8
4,82
2,95
24,
439,
868
4,24
3,97
1-
--
Oth
er a
ccou
nts
rece
ivabl
e22
5,42
034
9,53
542
8,15
33,
066
364
12,7
99
Rec
eiva
bles
from
rela
ted
parti
es5
8,68
710
,802
6,77
412
0,91
746
6,63
949
5,69
0
Shor
t-ter
m lo
ans
to re
late
d pa
rties
5-
--
5,51
7,01
21,
462,
280
2,08
3,75
3
Curre
nt p
ortio
n of
long
-term
lo
ans
to re
late
d pa
rties
52,
073
2,07
32,
073
9,57
36,
573
607,
723
Def
erre
d co
ntra
ct c
osts
913
4,75
019
0,27
520
3,38
5-
--
Inve
ntor
ies
1074
3,97
377
0,65
765
9,05
8-
--
Vess
el s
uppl
ies
and
spar
e pa
rts33
4,32
067
3,10
269
6,79
0-
--
Prep
aym
ents
134,
942
227,
591
195,
651
4,38
64,
925
4,59
1
Non-
curre
nt a
sset
s he
ld fo
r sal
e-
-14
9,41
6-
--
Oth
er c
urre
nt a
sset
s11
980,
198
463,
743
386,
726
24,6
7920
,200
20,9
78
Tota
l cur
rent
ass
ets
20,8
10,3
2515
,407
,978
14,5
85,6
9311
,313
,751
4,92
5,82
55,
326,
166
Non-
curr
ent a
sset
s
Long
-term
loan
s to
rela
ted
parti
es5
--
-7,
500
694,
508
734,
876
Long
-term
inve
stm
ent
766
3,24
5-
--
--
Inve
stm
ents
in a
ssoc
iate
s an
d jo
int v
entu
res
124,
574,
552
7,10
2,53
85,
972,
030
62,3
5262
,352
60,3
36
Inve
stm
ents
in s
ubsid
iarie
s13
--
-20
,720
,857
23,3
28,7
4427
,733
,152
Goo
dwill
1574
,568
984,
598
978,
620
--
-
Prop
erty
, pla
nt, a
nd e
quip
men
t16
18,3
86,6
1527
,260
,692
26,9
24,2
3614
7,50
017
9,37
418
2,40
4
Inta
ngib
le a
sset
s17
50,8
7422
5,76
524
6,55
826
,460
49,3
6053
,396
Def
erre
d ta
x as
sets
1830
1,41
325
9,73
021
7,45
418
9,10
516
1,54
511
9,64
6
Oth
er n
on-c
urre
nt a
sset
s19
484,
807
437,
609
445,
506
13,0
311,
691
511
Tota
l non
-cur
rent
ass
ets
24,5
36,0
7436
,270
,932
34,7
84,4
0421
,166
,805
24,4
77,5
7428
,884
,321
Tota
l ass
ets
45,3
46,3
9951
,678
,910
49,3
70,0
9732
,480
,556
29,4
03,3
9934
,210
,487
Cons
olid
ated
finan
cial
sta
tem
ents
Sepa
rate
finan
cial
sta
tem
ents
(in th
ousa
nd B
aht)
31 D
ecem
ber
31 D
ecem
ber
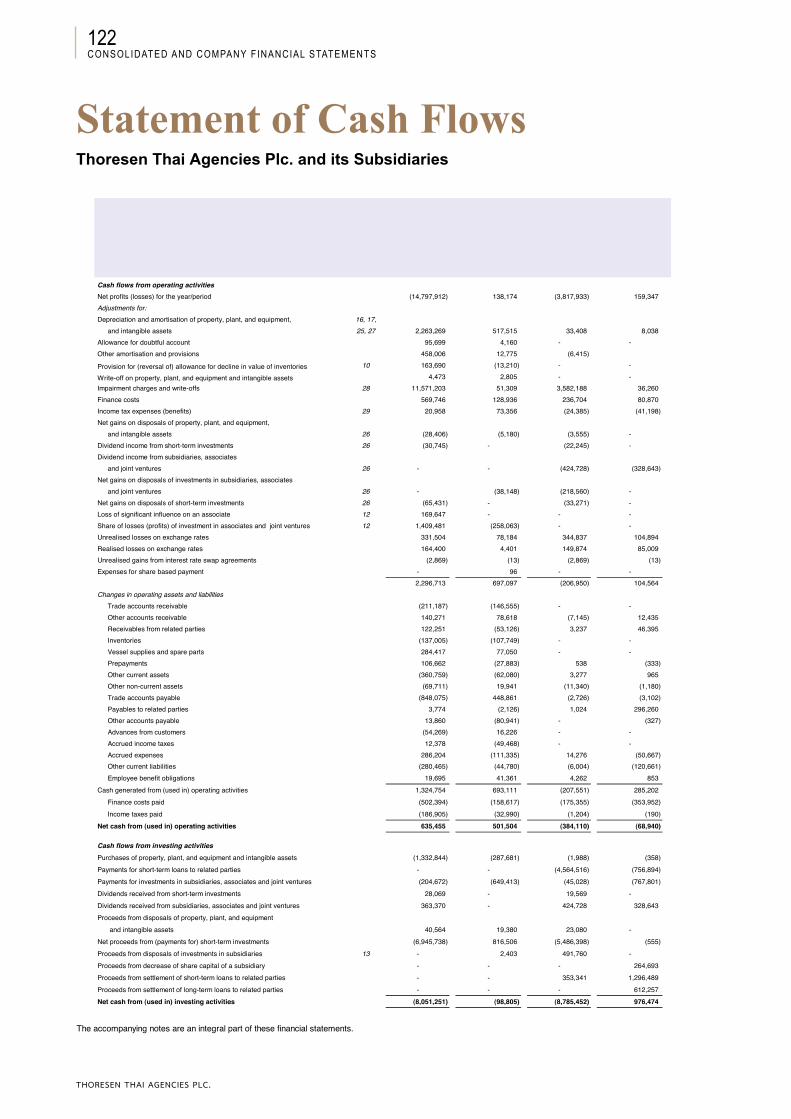
THORESEN THAI AGENCIES PLC.
Consolidated and Company FinanCial statements122
The accompanying notes are an integral part of these financial statements.
10
Thoresen Thai Agencies Public Company Limited and its Subsidiaries
Statement of cash flows
For the year For the three-month For the year For the three-month ended period ended ended period ended
31 December 2015 31 December 2014 31 December 2015 31 December 2014Note (restated) (restated)
Cash flows from operating activitiesNet profits (losses) for the year/period (14,797,912) 138,174 (3,817,933) 159,347Adjustments for:Depreciation and amortisation of property, plant, and equipment, 16, 17,
and intangible assets 25, 27 2,263,269 517,515 33,408 8,038Allowance for doubtful account 95,699 4,160 - -Other amortisation and provisions 458,006 12,775 (6,415)
Provision for (reversal of) allowance for decline in value of inventories 10 163,690 (13,210) - -
Write-off on property, plant, and equipment and intangible assets 4,473 2,805 - -Impairment charges and write-offs 28 11,571,203 51,309 3,582,188 36,260Finance costs 569,746 128,936 236,704 80,870Income tax expenses (benefits) 29 20,958 73,356 (24,385) (41,198)Net gains on disposals of property, plant, and equipment,
and intangible assets 26 (28,406) (5,180) (3,555) -Dividend income from short-term investments 26 (30,745) - (22,245) -Dividend income from subsidiaries, associates
and joint ventures 26 - - (424,728) (328,643)Net gains on disposals of investments in subsidiaries, associates
and joint ventures 26 - (38,148) (218,560) -Net gains on disposals of short-term investments 26 (65,431) - (33,271) -Loss of significant influence on an associate 12 169,647 - - -Share of losses (profits) of investment in associates and joint ventures 12 1,409,481 (258,063) - -Unrealised losses on exchange rates 331,504 78,184 344,837 104,894Realised losses on exchange rates 164,400 4,401 149,874 85,009Unrealised gains from interest rate swap agreements (2,869) (13) (2,869) (13)Expenses for share based payment - 96 - -
2,296,713 697,097 (206,950) 104,564Changes in operating assets and liabilities
Trade accounts receivable (211,187) (146,555) - -Other accounts receivable 140,271 78,618 (7,145) 12,435Receivables from related parties 122,251 (53,126) 3,237 46,395Inventories (137,005) (107,749) - -Vessel supplies and spare parts 284,417 77,050 - -Prepayments 106,662 (27,883) 538 (333)Other current assets (360,759) (62,080) 3,277 965Other non-current assets (69,711) 19,941 (11,340) (1,180)Trade accounts payable (848,075) 448,861 (2,726) (3,102)Payables to related parties 3,774 (2,126) 1,024 296,260Other accounts payable 13,860 (80,941) - (327)Advances from customers (54,269) 16,226 - -Accrued income taxes 12,378 (49,468) - -Accrued expenses 286,204 (111,335) 14,276 (50,667)Other current liabilities (280,465) (44,780) (6,004) (120,661)Employee benefit obligations 19,695 41,361 4,262 853
Cash generated from (used in) operating activities 1,324,754 693,111 (207,551) 285,202Finance costs paid (502,394) (158,617) (175,355) (353,952)Income taxes paid (186,905) (32,990) (1,204) (190)
Net cash from (used in) operating activities 635,455 501,504 (384,110) (68,940)
Cash flows from investing activitiesPurchases of property, plant, and equipment and intangible assets (1,332,844) (287,681) (1,988) (358)Payments for short-term loans to related parties - - (4,564,516) (756,894)Payments for investments in subsidiaries, associates and joint ventures (204,672) (649,413) (45,028) (767,801)Dividends received from short-term investments 28,069 - 19,569 -Dividends received from subsidiaries, associates and joint ventures 363,370 - 424,728 328,643Proceeds from disposals of property, plant, and equipment
and intangible assets 40,564 19,380 23,080 -Net proceeds from (payments for) short-term investments (6,945,738) 816,506 (5,486,398) (555)Proceeds from disposals of investments in subsidiaries 13 - 2,403 491,760 -Proceeds from decrease of share capital of a subsidiary - - - 264,693Proceeds from settlement of short-term loans to related parties - - 353,341 1,296,489Proceeds from settlement of long-term loans to related parties - - - 612,257Net cash from (used in) investing activities (8,051,251) (98,805) (8,785,452) 976,474
Consolidated Separatefinancial statements financial statements
(in thousand Baht)
statement of Cash FlowsThoresen Thai Agencies Plc. and its Subsidiaries
The accompanying notes are an integral part of these financial statements.
3
Thoresen Thai Agencies Public Company Limited and its Subsidiaries
Statement of financial position
1 October 1 OctoberAssets Note 2015 2014 2014 2015 2014 2014
(restated) (restated) (restated) (restated)
Current assets
Cash and cash equivalents 6 5,939,570 7,710,089 6,289,847 126,967 2,919,996 2,052,840
Short-term investments 7 7,483,440 570,243 1,323,849 5,507,151 44,848 47,792
Trade accounts receivable 5, 8 4,822,952 4,439,868 4,243,971 - - -
Other accounts receivable 225,420 349,535 428,153 3,066 364 12,799
Receivables from related parties 5 8,687 10,802 6,774 120,917 466,639 495,690
Short-term loans to related parties 5 - - - 5,517,012 1,462,280 2,083,753
Current portion of long-term
loans to related parties 5 2,073 2,073 2,073 9,573 6,573 607,723
Deferred contract costs 9 134,750 190,275 203,385 - - -
Inventories 10 743,973 770,657 659,058 - - -
Vessel supplies and spare parts 334,320 673,102 696,790 - - -
Prepayments 134,942 227,591 195,651 4,386 4,925 4,591
Non-current assets held for sale - - 149,416 - - -
Other current assets 11 980,198 463,743 386,726 24,679 20,200 20,978
Total current assets 20,810,325 15,407,978 14,585,693 11,313,751 4,925,825 5,326,166
Non-current assets
Long-term loans to related parties 5 - - - 7,500 694,508 734,876
Long-term investment 7 663,245 - - - - -
Investments in associates and joint ventures 12 4,574,552 7,102,538 5,972,030 62,352 62,352 60,336
Investments in subsidiaries 13 - - - 20,720,857 23,328,744 27,733,152
Goodwill 15 74,568 984,598 978,620 - - -
Property, plant, and equipment 16 18,386,615 27,260,692 26,924,236 147,500 179,374 182,404
Intangible assets 17 50,874 225,765 246,558 26,460 49,360 53,396
Deferred tax assets 18 301,413 259,730 217,454 189,105 161,545 119,646
Other non-current assets 19 484,807 437,609 445,506 13,031 1,691 511
Total non-current assets 24,536,074 36,270,932 34,784,404 21,166,805 24,477,574 28,884,321
Total assets 45,346,399 51,678,910 49,370,097 32,480,556 29,403,399 34,210,487
Consolidated
financial statements
Separate
financial statements
(in thousand Baht)
31 December31 December
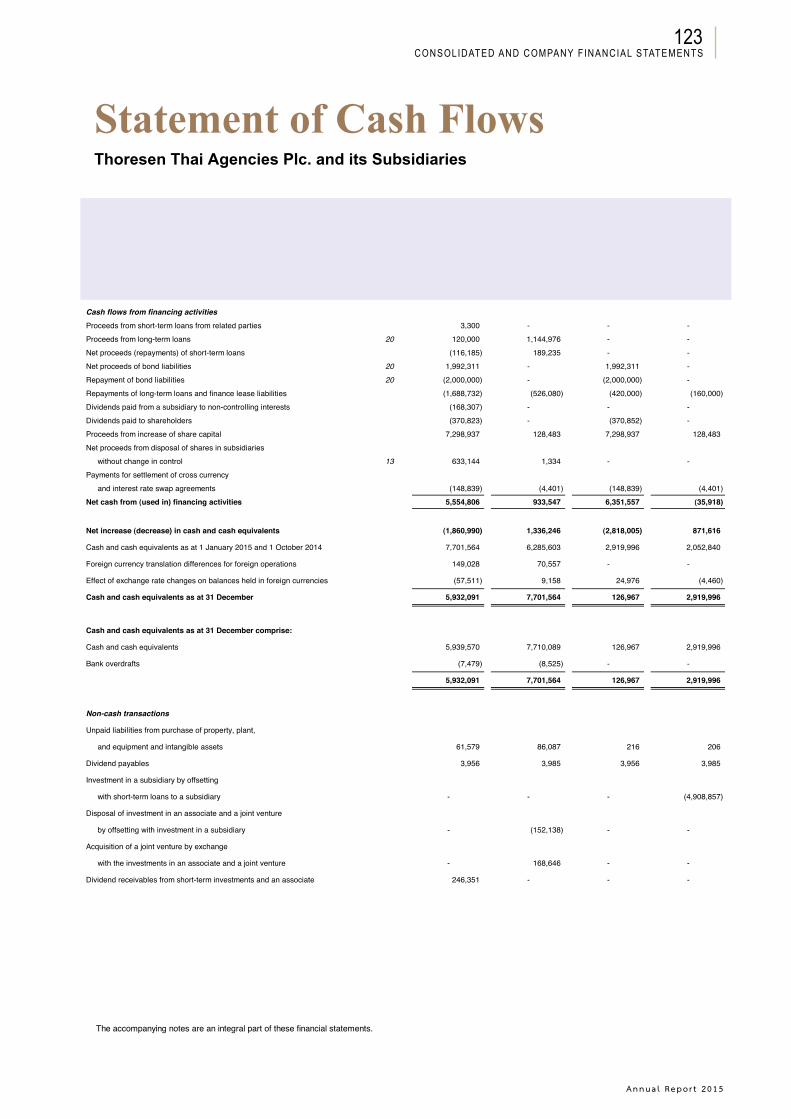
Annua l Repo r t 2015
Consolidated and Company FinanCial statements123
The accompanying notes are an integral part of these financial statements.
11
Thoresen Thai Agencies Public Company Limited and its Subsidiaries
Statement of cash flows
For the year For the three-month For the year For the three-month ended period ended ended period ended
31 December 2015 31 December 2014 31 December 2015 31 December 2014Note (restated) (restated)
Cash flows from financing activitiesProceeds from short-term loans from related parties 3,300 - - -Proceeds from long-term loans 20 120,000 1,144,976 - -Net proceeds (repayments) of short-term loans (116,185) 189,235 - -Net proceeds of bond liabilities 20 1,992,311 - 1,992,311 -Repayment of bond liabilities 20 (2,000,000) - (2,000,000) -Repayments of long-term loans and finance lease liabilities (1,688,732) (526,080) (420,000) (160,000)Dividends paid from a subsidiary to non-controlling interests (168,307) - - -Dividends paid to shareholders (370,823) - (370,852) -Proceeds from increase of share capital 7,298,937 128,483 7,298,937 128,483Net proceeds from disposal of shares in subsidiaries
without change in control 13 633,144 1,334 - -Payments for settlement of cross currency
and interest rate swap agreements (148,839) (4,401) (148,839) (4,401)Net cash from (used in) financing activities 5,554,806 933,547 6,351,557 (35,918)
Net increase (decrease) in cash and cash equivalents (1,860,990) 1,336,246 (2,818,005) 871,616
Cash and cash equivalents as at 1 January 2015 and 1 October 2014 7,701,564 6,285,603 2,919,996 2,052,840
Foreign currency translation differences for foreign operations 149,028 70,557 - -
Effect of exchange rate changes on balances held in foreign currencies (57,511) 9,158 24,976 (4,460)
Cash and cash equivalents as at 31 December 5,932,091 7,701,564 126,967 2,919,996
Cash and cash equivalents as at 31 December comprise:
Cash and cash equivalents 5,939,570 7,710,089 126,967 2,919,996
Bank overdrafts (7,479) (8,525) - -
5,932,091 7,701,564 126,967 2,919,996
Non-cash transactions
Unpaid liabilities from purchase of property, plant,
and equipment and intangible assets 61,579 86,087 216 206
Dividend payables 3,956 3,985 3,956 3,985
Investment in a subsidiary by offsetting
with short-term loans to a subsidiary - - - (4,908,857)
Disposal of investment in an associate and a joint venture
by offsetting with investment in a subsidiary - (152,138) - -
Acquisition of a joint venture by exchange
with the investments in an associate and a joint venture - 168,646 - -
Dividend receivables from short-term investments and an associate 246,351 - - -
(in thousand Baht)
Consolidated Separatefinancial statements financial statements
statement of Cash FlowsThoresen Thai Agencies Plc. and its Subsidiaries
The accompanying notes are an integral part of these financial statements.
3
Thoresen Thai Agencies Public Company Limited and its Subsidiaries
Statement of financial position
1 October 1 OctoberAssets Note 2015 2014 2014 2015 2014 2014
(restated) (restated) (restated) (restated)
Current assets
Cash and cash equivalents 6 5,939,570 7,710,089 6,289,847 126,967 2,919,996 2,052,840
Short-term investments 7 7,483,440 570,243 1,323,849 5,507,151 44,848 47,792
Trade accounts receivable 5, 8 4,822,952 4,439,868 4,243,971 - - -
Other accounts receivable 225,420 349,535 428,153 3,066 364 12,799
Receivables from related parties 5 8,687 10,802 6,774 120,917 466,639 495,690
Short-term loans to related parties 5 - - - 5,517,012 1,462,280 2,083,753
Current portion of long-term
loans to related parties 5 2,073 2,073 2,073 9,573 6,573 607,723
Deferred contract costs 9 134,750 190,275 203,385 - - -
Inventories 10 743,973 770,657 659,058 - - -
Vessel supplies and spare parts 334,320 673,102 696,790 - - -
Prepayments 134,942 227,591 195,651 4,386 4,925 4,591
Non-current assets held for sale - - 149,416 - - -
Other current assets 11 980,198 463,743 386,726 24,679 20,200 20,978
Total current assets 20,810,325 15,407,978 14,585,693 11,313,751 4,925,825 5,326,166
Non-current assets
Long-term loans to related parties 5 - - - 7,500 694,508 734,876
Long-term investment 7 663,245 - - - - -
Investments in associates and joint ventures 12 4,574,552 7,102,538 5,972,030 62,352 62,352 60,336
Investments in subsidiaries 13 - - - 20,720,857 23,328,744 27,733,152
Goodwill 15 74,568 984,598 978,620 - - -
Property, plant, and equipment 16 18,386,615 27,260,692 26,924,236 147,500 179,374 182,404
Intangible assets 17 50,874 225,765 246,558 26,460 49,360 53,396
Deferred tax assets 18 301,413 259,730 217,454 189,105 161,545 119,646
Other non-current assets 19 484,807 437,609 445,506 13,031 1,691 511
Total non-current assets 24,536,074 36,270,932 34,784,404 21,166,805 24,477,574 28,884,321
Total assets 45,346,399 51,678,910 49,370,097 32,480,556 29,403,399 34,210,487
Consolidated
financial statements
Separate
financial statements
(in thousand Baht)
31 December31 December
THORESEN THAI AGENCIES PLC.
Consolidated and Company FinanCial statements124
Thoresen Thai Agencies Public Company Limited and its SubsidiariesNotes to the financial statements
Note Contents
1 General information2 Basis of preparation of the financial statements3 Changes in accounting policies4 Significant accounting policies5 Related parties6 Cash and cash equivalents7 Other investments8 Trade accounts receivable9 Deferred contract costs10 Inventories11 Other current assets12 Investments in associates and joint ventures13 Investments in subsidiaries14 Non-controlling interests15 Goodwill16 Property, plant, and equipment17 Intangible assets18 Deferred tax19 Other non-current assets20 Interest-bearing liabilities21 Employee benefit obligations22 Share capital and warrants23 Reserves24 Share-based payment25 Segment information26 Other operating income27 Expenses by nature28 Impairment charges and write-offs29 Income tax expenses (benefits)30 Earnings (losses) per share31 Dividends32 Promotional privileges33 Financial instruments34 Commitments and contingent liabilities35 Establishment of a multicurrency debt issuance programme36 Events after the reporting period37 Reclassification of accounts38 Thai Financial Reporting Standards (TFRS) not yet adopted39 Supplementary information (Unaudited)
12
notes to the Financial statementsThoresen Thai Agencies Plc. and its Subsidiaries
The accompanying notes are an integral part of these financial statements.
3
Thoresen Thai Agencies Public Company Limited and its Subsidiaries
Statement of financial position
1 October 1 OctoberAssets Note 2015 2014 2014 2015 2014 2014
(restated) (restated) (restated) (restated)
Current assets
Cash and cash equivalents 6 5,939,570 7,710,089 6,289,847 126,967 2,919,996 2,052,840
Short-term investments 7 7,483,440 570,243 1,323,849 5,507,151 44,848 47,792
Trade accounts receivable 5, 8 4,822,952 4,439,868 4,243,971 - - -
Other accounts receivable 225,420 349,535 428,153 3,066 364 12,799
Receivables from related parties 5 8,687 10,802 6,774 120,917 466,639 495,690
Short-term loans to related parties 5 - - - 5,517,012 1,462,280 2,083,753
Current portion of long-term
loans to related parties 5 2,073 2,073 2,073 9,573 6,573 607,723
Deferred contract costs 9 134,750 190,275 203,385 - - -
Inventories 10 743,973 770,657 659,058 - - -
Vessel supplies and spare parts 334,320 673,102 696,790 - - -
Prepayments 134,942 227,591 195,651 4,386 4,925 4,591
Non-current assets held for sale - - 149,416 - - -
Other current assets 11 980,198 463,743 386,726 24,679 20,200 20,978
Total current assets 20,810,325 15,407,978 14,585,693 11,313,751 4,925,825 5,326,166
Non-current assets
Long-term loans to related parties 5 - - - 7,500 694,508 734,876
Long-term investment 7 663,245 - - - - -
Investments in associates and joint ventures 12 4,574,552 7,102,538 5,972,030 62,352 62,352 60,336
Investments in subsidiaries 13 - - - 20,720,857 23,328,744 27,733,152
Goodwill 15 74,568 984,598 978,620 - - -
Property, plant, and equipment 16 18,386,615 27,260,692 26,924,236 147,500 179,374 182,404
Intangible assets 17 50,874 225,765 246,558 26,460 49,360 53,396
Deferred tax assets 18 301,413 259,730 217,454 189,105 161,545 119,646
Other non-current assets 19 484,807 437,609 445,506 13,031 1,691 511
Total non-current assets 24,536,074 36,270,932 34,784,404 21,166,805 24,477,574 28,884,321
Total assets 45,346,399 51,678,910 49,370,097 32,480,556 29,403,399 34,210,487
Consolidated
financial statements
Separate
financial statements
(in thousand Baht)
31 December31 December
Annua l Repo r t 2015
Consolidated and Company FinanCial statements125
Thoresen Thai Agencies Public Company Limited and its SubsidiariesNotes to the financial statements
These notes form an integral part of the financial statements.
The financial statements issued for Thai statutory and regulatory reporting purposes are prepared in the Thai language. These English language financial statements have been prepared from the Thai language statutory financial statements, and were approved and authorized for issue by the Board of Directors on 29 February 2016.
1 General information
Thoresen Thai Agencies Public Company Limited (the “Company”) is incorporated in Thailand and has its registered office at 26/26-27 Orakarn Building, 8th Floor, Soi Chidlom, Ploenchit Road, Lumpinee, Pathumwan, Bangkok 10330.
The Company was listed on the Stock Exchange of Thailand (the “SET”) on 25 September 1995.
The principal business operations of the Company and its subsidiaries (the “Group”) involve the ownership of dry bulk vessels, certain shipping services, offshore oil and gas services, production and sales of fertilisers, coal trading, and warehouse and logistics services. The Group’s activities can be separated into four main categories, namely transport, infrastructure, energy, and the holding company.
Details of the Company’s subsidiaries, associates, and joint ventures as at 31 December 2015 and 2014 are given in notes 12 and 13.
2 Basis of preparation of the financial statements
(a) Statement of compliance
The financial statements are prepared in accordance with Thai Financial Reporting Standards (“TFRS”); guidelines promulgated by the Federation of Accounting Professions (“FAP”); and applicable rules and regulations of the Thai Securities and Exchange Commission.
The FAP has issued new and revised TFRS effective for annual accounting periods beginning on or after 1 January 2015. The initial application of new and revised TFRS has resulted in changes in certain of the Group’s accounting policies. The effects of these changes, where such effects are considered material to the financial statements, are disclosed in note 3.
In addition to the above new and revised TFRS, the FAP has issued a number of other new and revised TFRS which are effective for annual financial periods beginning on or after 1 January 2016 and have not been adopted in the preparation of these financial statements. Those new and revised TFRS that are relevant to the Group’s operations are disclosed in note 38.
(b) Basis of measurement
The financial statements have been prepared on the historical cost basis except as stated in the accounting policies.
(c) Functional and presentation currency
The financial statements are presented in Thai Baht, which is the Company’s functional currency. All financial information presented in Thai Baht has been rounded in the notes to the financial statements to the nearest thousand unless otherwise stated.
(d) Use of judgement and estimates
The preparation of financial statements in conformity with TFRS requires management to make judgements, estimates, and assumptions that affect the application of accounting policies and reported amounts of assets, liabilities, income, and expenses. Actual results may differ from these estimates.
Estimates and underlying assumptions are reviewed on an ongoing basis. Revisions to accounting estimates are recognised prospectively.
13
THORESEN THAI AGENCIES PLC.
Consolidated and Company FinanCial statements126
Thoresen Thai Agencies Public Company Limited and its SubsidiariesNotes to the financial statements
Information about significant areas of estimation uncertainties that have a significant risk of resulting in a material adjustments to the amount recognised in the financial statements is included in the note 28, regarding to key assumptions used in discounted cash flow projections.
Measurement of fair values
A number of the Group’s accounting policies and disclosures require the measurement of fair values, for both financial and non-financial assets and liabilities.
The Group has an established control framework with respect to the measurement of fair values. This includes a valuation team that has overall responsibility for overseeing all significant fair value measurements, including Level 3 fair values, and reports directly to the CFO.
The valuation team regularly reviews significant unobservable inputs and valuation adjustments. If third party information, such as broker quotes or pricing services, is used to measure fair values, then the valuation team assesses the evidence obtained from the third parties to support the conclusion that such valuations meet the requirements of TFRS, including the level in the fair value hierarchy in which such valuations should be classified.
Significant valuation issues are reported to the Group Audit Committee.
When measuring the fair value of an asset or a liability, the Group uses market observable data as far as possible. Fair values are categorised into different levels in a fair value hierarchy based on the inputs used in the valuationtechniques as follows:
• Level 1 : quoted prices (unadjusted) in active markets for identical assets or liabilities.• Level 2 : inputs other than quoted prices included in Level 1 that are observable for the asset or liability,
either directly (i.e. as prices) or indirectly (i.e. derived from prices).• Level 3 : inputs for the asset or liability that are not based on observable market data (unobservable
inputs).
If the inputs used to measure the fair value of an asset or liability might be categorised in different levels of the fair value hierarchy, then the fair value measurement is categorised in its entirely in the same level of the fair value hierarchy as the lowest level input that is significant to the entire measurement.
Further information about the assumptions made in measuring fair values is included in the following notes:Note 7 Other investmentsNote 33 Financial instruments
(e) Change in accounting period
At the Annual General Meeting of Shareholders of the Company held on 30 January 2014, the shareholders approved to change the Company’s accounting period from the period starting from1 October to 30 September to the period starting from 1 January to 31 December. The Company completed the registration with Department of Business Development, Ministry of Commerce and obtained an approval from Revenue Department for this change which has an effect on the Company’s first change of accounting period ended 31 December 2014. Consequently, the corresponding information presented for the three-month period ended 31 December 2014 is not comparable with the year ended 31 December 2015. Supplementary information which consists of an unaudited consolidated statement of income for the twelve-month period ended 31 December 2014 is presented in note 39.
14
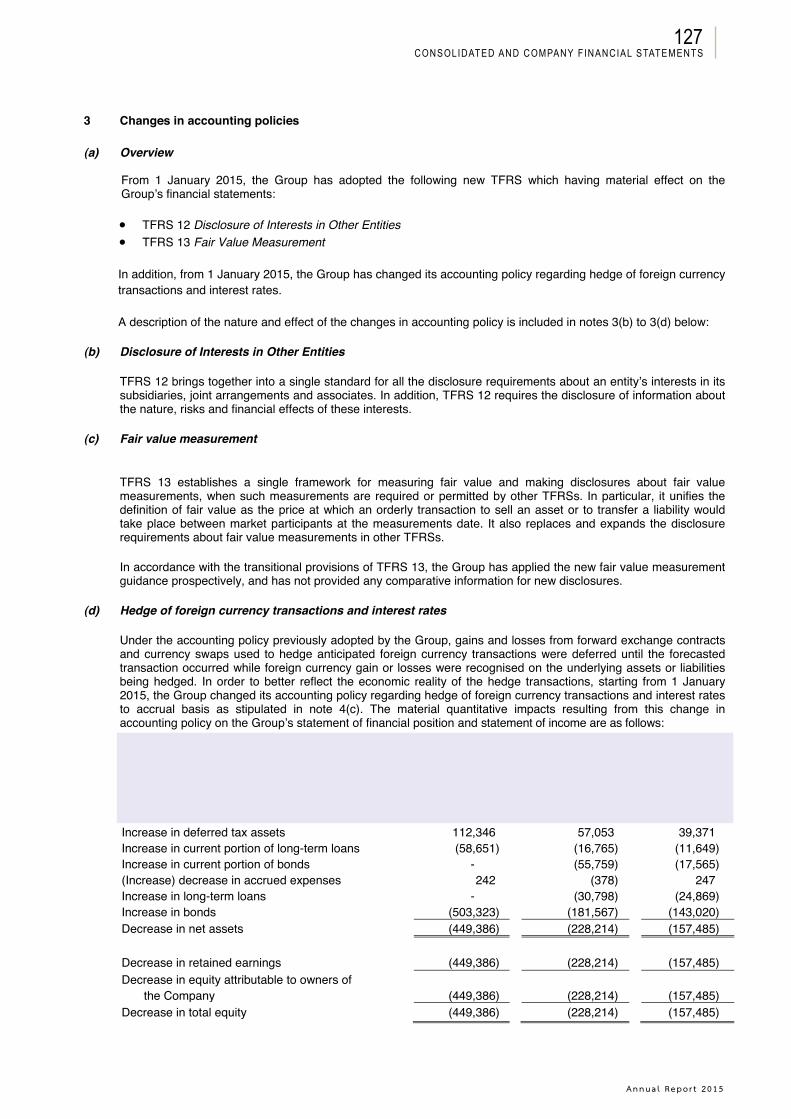
Annua l Repo r t 2015
Consolidated and Company FinanCial statements127
Thoresen Thai Agencies Public Company Limited and its SubsidiariesNotes to the financial statements
3 Changes in accounting policies
(a) Overview
From 1 January 2015, the Group has adopted the following new TFRS which having material effect on the Group’s financial statements:
• TFRS 12 Disclosure of Interests in Other Entities• TFRS 13 Fair Value Measurement
In addition, from 1 January 2015, the Group has changed its accounting policy regarding hedge of foreign currency transactions and interest rates.
A description of the nature and effect of the changes in accounting policy is included in notes 3(b) to 3(d) below:
(b) Disclosure of Interests in Other Entities
TFRS 12 brings together into a single standard for all the disclosure requirements about an entity’s interests in its subsidiaries, joint arrangements and associates. In addition, TFRS 12 requires the disclosure of information about the nature, risks and financial effects of these interests.
(c) Fair value measurement
TFRS 13 establishes a single framework for measuring fair value and making disclosures about fair value measurements, when such measurements are required or permitted by other TFRSs. In particular, it unifies the definition of fair value as the price at which an orderly transaction to sell an asset or to transfer a liability would take place between market participants at the measurements date. It also replaces and expands the disclosure requirements about fair value measurements in other TFRSs.
In accordance with the transitional provisions of TFRS 13, the Group has applied the new fair value measurement guidance prospectively, and has not provided any comparative information for new disclosures.
(d) Hedge of foreign currency transactions and interest rates
Under the accounting policy previously adopted by the Group, gains and losses from forward exchange contracts and currency swaps used to hedge anticipated foreign currency transactions were deferred until the forecasted transaction occurred while foreign currency gain or losses were recognised on the underlying assets or liabilities being hedged. In order to better reflect the economic reality of the hedge transactions, starting from 1 January 2015, the Group changed its accounting policy regarding hedge of foreign currency transactions and interest ratesto accrual basis as stipulated in note 4(c). The material quantitative impacts resulting from this change in accounting policy on the Group’s statement of financial position and statement of income are as follows:
Consolidated and separatefinancial statements
Statement of financial position as at 31 December 31 December 1 October2015 2014 2014
(in thousand Baht)Increase in deferred tax assets 112,346 57,053 39,371Increase in current portion of long-term loans (58,651) (16,765) (11,649)Increase in current portion of bonds - (55,759) (17,565)(Increase) decrease in accrued expenses 242 (378) 247Increase in long-term loans - (30,798) (24,869)Increase in bonds (503,323) (181,567) (143,020)Decrease in net assets (449,386) (228,214) (157,485)
Decrease in retained earnings (449,386) (228,214) (157,485)Decrease in equity attributable to owners of
the Company (449,386) (228,214) (157,485)Decrease in total equity (449,386) (228,214) (157,485)
15
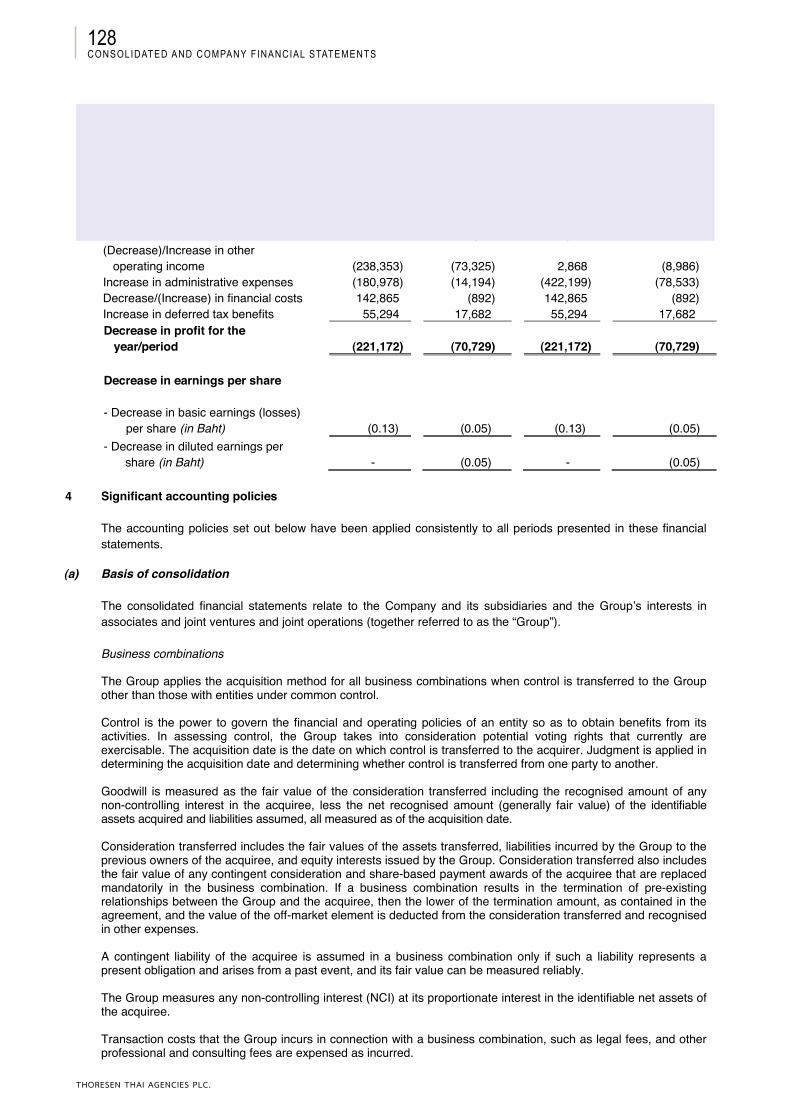
THORESEN THAI AGENCIES PLC.
Consolidated and Company FinanCial statements128
Thoresen Thai Agencies Public Company Limited and its SubsidiariesNotes to the financial statements
Statement of income for theyear/period
Consolidated financial statements
Separate financial statements
For the For the For the For the year ended three-month year ended three-month
31 December period 31 December period2015 31 December
20142015 31 December
2014(in thousand Baht)
(Decrease)/Increase in other operating income (238,353) (73,325) 2,868 (8,986)
Increase in administrative expenses (180,978) (14,194) (422,199) (78,533)Decrease/(Increase) in financial costs 142,865 (892) 142,865 (892)Increase in deferred tax benefits 55,294 17,682 55,294 17,682Decrease in profit for the
year/period (221,172) (70,729) (221,172) (70,729)
Decrease in earnings per share
- Decrease in basic earnings (losses) per share (in Baht) (0.13) (0.05) (0.13) (0.05)
- Decrease in diluted earnings pershare (in Baht) - (0.05) - (0.05)
4 Significant accounting policies
The accounting policies set out below have been applied consistently to all periods presented in these financial statements.
(a) Basis of consolidation
The consolidated financial statements relate to the Company and its subsidiaries and the Group’s interests in associates and joint ventures and joint operations (together referred to as the “Group”).
Business combinations
The Group applies the acquisition method for all business combinations when control is transferred to the Group other than those with entities under common control.
Control is the power to govern the financial and operating policies of an entity so as to obtain benefits from its activities. In assessing control, the Group takes into consideration potential voting rights that currently are exercisable. The acquisition date is the date on which control is transferred to the acquirer. Judgment is applied in determining the acquisition date and determining whether control is transferred from one party to another.
Goodwill is measured as the fair value of the consideration transferred including the recognised amount of any non-controlling interest in the acquiree, less the net recognised amount (generally fair value) of the identifiable assets acquired and liabilities assumed, all measured as of the acquisition date.
Consideration transferred includes the fair values of the assets transferred, liabilities incurred by the Group to the previous owners of the acquiree, and equity interests issued by the Group. Consideration transferred also includes the fair value of any contingent consideration and share-based payment awards of the acquiree that are replaced mandatorily in the business combination. If a business combination results in the termination of pre-existing relationships between the Group and the acquiree, then the lower of the termination amount, as contained in the agreement, and the value of the off-market element is deducted from the consideration transferred and recognised in other expenses.
A contingent liability of the acquiree is assumed in a business combination only if such a liability represents a present obligation and arises from a past event, and its fair value can be measured reliably.
The Group measures any non-controlling interest (NCI) at its proportionate interest in the identifiable net assets of the acquiree.
Transaction costs that the Group incurs in connection with a business combination, such as legal fees, and other professional and consulting fees are expensed as incurred.
16
Annua l Repo r t 2015
Consolidated and Company FinanCial statements129
Thoresen Thai Agencies Public Company Limited and its SubsidiariesNotes to the financial statements
Acquisitions from entities under common control
Business combinations of entities or businesses under common control are accounted for using a method similar to the pooling of interest method and in accordance with the Guideline issued in 2009 by the FAP.
Subsidiaries
Subsidiaries are entities controlled by the Group. The Group controls an entity when it is exposed to, or has rights to, variable returns from its involvement with the entity and has the ability to affect those returns through its power over the entity. The financial statements of subsidiaries are included in the consolidated financial statements from the date on which control commences until the date on which control ceases.
Loss of control
When the Group loses control over a subsidiary, it derecognises the assets and liabilities of the subsidiary, and any related non-controlling interests and other components of equity. Any resulting gain or loss is recognised in profit or loss. Any interest retained in the former subsidiary is measured at fair value when control is lost.
Interests in equity–accounted investees
The Group’s interests in equity-accounted investees comprise interests in associates and a joint venture.
Associates are those entities in which the Group has significant influence, but not control or joint control, over the financial and operating policies. A joint venture is an arrangement in which the Group has joint control, whereby the Group has rights to the net assets of the arrangement, rather than rights to its assets and obligations for its liabilities.
Interests in associates and joint ventures are accounted for using the equity method. They are recognised initially at cost, which includes transaction costs. Subsequent to initial recognition, the consolidated financial statements include the Group’s share of the profit or loss and other comprehensive income of equity–accounted investees, until the date on which significant influence or joint control ceases.
Transactions eliminated on consolidation
Intra-group balances and transactions, and any unrealised income or expenses arising from intra-group transactions, are eliminated. Unrealised gains arising from transactions with equity-accounted investees are eliminated against the investment to the extent of the Group’s interest in the investee. Unrealised losses are eliminated in the same way as unrealised gains, but only to the extent that there is no evidence of impairment.
(b) Foreign currencies
Foreign currency transactions
Transactions in foreign currencies are translated to the respective functional currencies of the Group entities at the dates of the transactions.
Monetary assets and liabilities denominated in foreign currencies are translated to the functional currency at the exchange rate at the reporting date.
Non-monetary assets and liabilities measured at cost in foreign currencies are translated to the functional currency at the exchange rates at the dates of the transactions.
Non-monetary assets and liabilities measured at fair value in foreign currencies are translated to the functional currency at the exchange rates at the dates that fair value was determined.
Foreign currency differences are generally recognised in profit or loss. However, foreign currency differences arising from the translation of available-for-sale equity investments are recognised in other comprehensive income(except on impairment in which case foreign currency differences that have been recognised in other comprehensive income are reclassified to profit or loss).
17
THORESEN THAI AGENCIES PLC.
Consolidated and Company FinanCial statements130
Thoresen Thai Agencies Public Company Limited and its SubsidiariesNotes to the financial statements
Foreign operations
The assets and liabilities of foreign operations, including goodwill and fair value adjustments arising on acquisition, are translated to Thai Baht at the exchange rates at the reporting date.
Goodwill and fair value adjustments arising on the acquisition of foreign operations are stated at exchange rates at transaction date.
The revenues and expenses of foreign operations are translated to Thai Baht at rates approximating the exchange rates at the dates of the transactions.
Foreign exchange differences are recognised in other comprehensive income and accumulated in the translation reserve, except to extent that the translation difference is allocated to non-controlling interest.
When a foreign operation is disposed of in its entirety or partially such that control, significant influence or joint control is lost, the cumulative amount in the translation reserve related to that foreign operation is reclassified to profit or loss as part of the gain or loss on disposal. If the Group disposes of part of its interest in a subsidiary but retains control, then the relevant proportion of the cumulative amount is reattributed to non-controlling interests. When the Group disposes of only part of an associate or joint venture while retaining significant influence or joint control, the relevant proportion of the cumulative amount is reclassified to profit or loss.
When the settlement of a monetary item receivable from or payable to a foreign operation is neither planned nor likely in the foreseeable future, exchange gains and losses arising from such a monetary item are considered to form part of a net investment in a foreign operation and are recognised in other comprehensive income, and presented in the foreign currency translation reserve in equity until disposal of the investment.
(c) Hedging
Hedge of future foreign currency transactions
Forward foreign exchange contracts protect the Group from fluctuations in exchange rates by establishing the rates at which foreign currency assets will be realised or foreign currency liabilities will be settled. Forward foreign exchange contracts are recognised in the financial statements on inception and revalued at the reporting date at the foreign exchange rate ruling on that date. The premium or discount on the establishment of each agreement is amortised over the contract period.
Cross currency and interest rate swap agreements
Cross currency and interest rate swap agreements are contracts between the Group and counterparties to exchange amounts of principal denominated in different currencies upon inception of the agreements, either over the term of the agreement or on maturity, depending on the terms of the agreements made with the counterparties. In addition, each counterparty receives or pays interest in amounts calculated on the basis of the pre-determined principal and interest rates throughout the term of the agreements.
With regard to amounts receivable or payable under cross currency and interest rate swap agreements which the Group use to manage foreign exchange and interest rate risk, receivables or payables under cross currency agreements are translated at the rate of exchange applying on the end of reporting period, with unrealised gains or losses on such translation included in profit or loss. The differential to be paid or received by the Group under interest rate swap agreements is recognised as an adjustment to interest income or interest expense over the term of the agreement. Gains or losses arising upon the termination of agreements or the early settlement of the underlying liabilities are recognised in profit or loss.
Hedge of bunker prices and freight rates
Differentials under bunker swap arrangements are accrued and recorded as adjustments to the cost of bunker relating to the hedged bunker. For forward freight agreements, the amounts received or paid on cash settlements, representing the gain or loss, are deferred and recognised over the life of the underlying monetary asset or liability as an adjustment to revenues from freight charges. For purchased freight rate options, the premiums paid are included in the statement of financial position under other assets or other liabilities. The premiums are amortised to interest income or expense over the life of the agreements.
18
Annua l Repo r t 2015
Consolidated and Company FinanCial statements131
Thoresen Thai Agencies Public Company Limited and its SubsidiariesNotes to the financial statements
(d) Cash and cash equivalents
Cash and cash equivalents in the statements of cash flows comprise cash balances, call deposits, and highly liquid short-term investments. Bank overdrafts that are repayable on demand are a component of cash and cash equivalents for the purpose of the statement of cash flows.
(e) Trade and other accounts receivable
Trade and other accounts receivable are stated at their invoice value less allowance for doubtful accounts.
The allowance for doubtful accounts is assessed primarily on analysis of payment histories and future expectations of customer payments. Bad debts are written off when incurred.
(f) Inventories
Inventories are measured at the lower of cost and net realisable value.
Cost is calculated using the weighted average cost principle and comprises all costs of purchase, costs of conversion, and other costs incurred in bringing the inventories to their present location and condition. In the case of manufactured inventories and work-in-progress, cost includes an appropriate share of production overheads based on normal operating capacity.
Net realisable value is the estimated selling price in the ordinary course of business less the estimated costs to complete and to make the sale.
(g) Vessel supplies and spare parts
Vessel supplies and spare parts mainly comprise bunker, vessel supplies, and spare parts. Bunker supplies are stated at cost, determined on the first-in, first-out basis. Vessel supplies and vessel spare parts are stated at cost, determined on the weighted-average basis. Rig supplies and rig spare parts are stated at historical cost, determined on the specific identification basis. The vessel and rig supplies and spare parts purchased to replace those used during the year are reported as vessel operating expenses and offshore service expenses in profit or loss.
(h) Non-current assets held for sale
Non-current assets (or disposal groups comprising assets and liabilities) that are expected to be recovered primarily through sale rather than through continuing use, are classified as held for sale. The assets (or disposal group) are measured at the lower of their carrying value and fair value less cost to sell. Any impairment loss on a disposal group is first allocated to goodwill, and then to remaining assets and liabilities on a pro rata basis, except that no loss is allocated to inventories, financial assets, deferred tax assets and investment properties. Impairment losses on initial classification as held for sale and subsequent gains and losses on remeasurement are recognised in profit or loss. Gains are not recognised in excess of any cumulative impairment loss.
(i) Investments
Investments in subsidiaries, associates, and joint ventures
Investments in subsidiaries, associates, and joint ventures in the separate financial statements of the Company are accounted for using the cost method. Investments in associates and jointly ventures in the consolidated financial statements are accounted for using the equity method.
Investments in other debt and equity securities
Debt securities and marketable equity securities held for trading are classified as current assets and are stated at fair value, with any resultant gain or loss recognised in profit or loss.
Debt securities that the Group has the positive intent and ability to hold to maturity are classified as held-to-maturity investments. Held-to-maturity investments are stated at amortised cost, less any impairment losses. The difference between the acquisition cost and redemption value of such debt securities is amortised using the effective interest rate method over the period to maturity.
19

THORESEN THAI AGENCIES PLC.
Consolidated and Company FinanCial statements132
Thoresen Thai Agencies Public Company Limited and its SubsidiariesNotes to the financial statements
Debt securities and marketable equity securities, other than those securities held for trading or intended to be held to maturity, are classified as available-for-sale investments. Available-for-sale investments are, subsequent to initial recognition, stated at fair value, and changes therein, other than impairment losses and foreign currency differences on available-for-sale monetary items, are recognised directly in equity. Impairment losses and foreign exchange differences are recognised in profit or loss. When these investments are derecognised, the cumulative gain or loss previously recognised directly in equity is recognised in profit or loss. Where these investments are interest-bearing, interest calculated using the effective interest method is recognised in profit or loss.
Equity securities which are not marketable are stated at cost less any impairment losses.
The fair value of financial instruments classified as held-for-trading and available-for-sale is determined as the quoted bid price on the reporting date.
Disposal of investments
On disposal of an investment, the difference between net disposal proceeds and the carrying amount together with the associated cumulative gain or loss that was reported in equity is recognised in profit or loss.
If the Group disposes of part of its holding of a particular investment, the deemed cost of the part sold is determined using the weighted average method applied to the carrying value of the total holding of the investment.
(j) Property, plant, and equipment
Recognition and measurement
Owned assets
Property, plant, and equipment are stated at cost less accumulated depreciation and impairment losses (if any).
Cost includes expenditure that is directly attributable to the acquisition of the asset. The cost of self-constructed assets includes the cost of materials and direct labour, any other costs directly attributable to bringing the assets to a working condition for their intended use, the costs of dismantling and removing the items and restoring the site on which they are located, and capitalised borrowing costs. Purchased software that is integral to the functionality of the related equipment is capitalised as part of that equipment.
When parts of an item of property, plant, and equipment have different useful lives, they are accounted for as separate items (major components) of property, plant, and equipment.
Gains and losses on disposal of an item of property, plant, and equipment are determined by comparing the proceeds from disposal with the carrying amount of property, plant, and equipment, and are recognised net within other income or administrative expenses in profit or loss.
Leased assets
Leases in terms of which the Group substantially assumes all the risk and rewards of ownership are classified as finance leases. Property, plant, and equipment acquired by way of finance leases is capitalised at the lower of its fair value and the present value of the minimum lease payments at the inception of the lease, less accumulated depreciation and impairment losses. Lease payments are apportioned between the finance charges and reduction of the lease liability so as to achieve a constant rate of interest on the remaining balance of the liability. Finance charges are charged directly to the profit or loss.
Subsequent costs
The cost of replacing a part of an item of property, plant, and equipment is recognised in the carrying amount of the item if it is probable that the future economic benefits embodied within the part will flow to the Group, and its cost can be measured reliably. The carrying amount of the replaced part is derecognised. The costs of the day-to-day servicing of property, plant, and equipment are recognised in profit or loss as incurred.
20
Annua l Repo r t 2015
Consolidated and Company FinanCial statements133
Thoresen Thai Agencies Public Company Limited and its SubsidiariesNotes to the financial statements
Depreciation
Depreciation is calculated based on the depreciable amount, which is the cost of an asset, or other amount substituted for cost, less its residual value.
Depreciation is charged to profit or loss on a straight-line basis over the estimated useful lives of each component of an item of property, plant, and equipment. The estimated useful lives are as follows:
Buildings and factories 3 - 20 yearsBuilding improvements 3 - 20 yearsOffshore support vessels 5 - 30 yearsOcean vessels (second-hand and new) 4 - 25 yearsSecond-hand tender rigs 1 - 20 yearsDry-docking 2 - 5 yearsMachinery and equipment 1 - 20 yearsFurniture, fixtures, and office equipment 2 - 10 yearsMotor vehicles 3 - 10 yearsMotor launches 10 yearsBarges 15 - 29 years
No depreciation is provided on freehold land or assets under construction.
Depreciation methods, useful lives, and residual values are reviewed at each financial year-end and adjusted, if appropriate.
(k) Goodwill
The measurement of goodwill at initial recognition is described in note 4(a). Subsequent to initial recognition, goodwill is measured at cost less accumulated impairment losses. In respect of equity-accounted investees, the carrying amount of goodwill is included in the carrying amount of the investment, and an impairment loss on such an investment is not allocated to any asset, including goodwill, that forms part of the carrying amount of the equity-accounted investee.
(l) Intangible assets
Computer software
Acquired computer software licenses are capitalised on the basis of the costs incurred to acquire and bring to use the specific software.
Customer relationships
Customer relationships acquired in a business combination are recognised at fair value at the acquisition date. Customer relationships have a finite useful life and are carried at cost less accumulated amortisation and impairment losses (if any).
Amortisation
Amortisation is based on the cost of the asset, or other amount substituted for cost, less its residual value.
Amortisation is recognised in profit or loss on a straight-line basis over the estimated useful lives of intangible assets from the date that they are available for use, since this most closely reflects the expected pattern of consumption of the future economic benefits embodied in the asset. The estimated useful lives for the current and comparative periods are as follows:
Computer software 1 - 10 yearsCustomer relationships 8.2 years
Amortisation methods, useful lives, and residual values are reviewed at each financial year-end and adjusted, if appropriate.
21

THORESEN THAI AGENCIES PLC.
Consolidated and Company FinanCial statements134
Thoresen Thai Agencies Public Company Limited and its SubsidiariesNotes to the financial statements
(m) Impairment
The carrying amounts of the Group’s assets are reviewed at each reporting date to determine whether there is any indication of impairment. If any such indication exists, the assets’ recoverable amounts are estimated.
An impairment loss is recognised if the carrying amount of an asset or its cash-generating unit exceeds its recoverable amount. The impairment loss is recognised in profit or loss .
When a decline in the fair value of an available-for-sale investment has been recognised directly in equity and there is objective evidence that the value of the asset is impaired, the cumulative loss that had been recognised directly in equity is recognised in profit or loss even though the financial asset has not been derecognised. The amount of the cumulative loss that is recognised in profit or loss is the difference between the acquisition cost and current fair value, less any impairment loss on that financial asset previously recognised in profit or loss.
Calculation of recoverable amount
The recoverable amount of held-to-maturity securities carried at amortised cost is calculated as the present value of the estimated future cash flows discounted at the original effective interest rate.
The recoverable amount of available-for-sale financial assets is calculated by reference to the fair value.
The recoverable amount of a non-financial asset is the greater of the asset’s value in use and fair value less costs to sell. In assessing value in use, the estimated future cash flows are discounted to their present value using a pre-tax discount rate that reflects current market assessments of the time value of money and the risks specific to the asset. For an asset that does not generate cash inflows largely independent of those from other assets, the recoverable amount is determined for the cash-generating unit to which the asset belongs.
Reversals of impairment
An impairment loss in respect of a financial asset is reversed if the subsequent increase in recoverable amount can be related objectively to an event occurring after the impairment loss was recognised in profit or loss. For financial assets carried at amortised cost and available-for-sale financial assets that are debt securities, the reversal is recognised in profit or loss. For available-for-sale financial assets that are equity securities, the reversal is recognised in other comprehensive income.
An impairment loss in respect of goodwill is not reversed. Impairment losses recognised in prior periods in respect of other non-financial assets are assessed at each reporting date for any indications that the loss has decreased or no longer exists. An impairment loss is reversed if there has been a change in the estimates used to determine the recoverable amount. An impairment loss is reversed only to the extent that the asset’s carrying amount does not exceed the carrying amount that would have been determined, net of depreciation or amortisation, if no impairment loss had been recognised.
(n) Interest-bearing liabilities
Interest-bearing liabilities are recognised initially at fair value less attributable transaction charges. Subsequent to initial recognition, interest-bearing liabilities are stated at amortised cost with any difference between cost and redemption value being recognised in profit or loss over the period of the borrowings on an effective interest basis.
(o) Trade and other accounts payable
Trade and other accounts payable are stated at cost.
(p) Employee benefits
Defined contribution plans
A defined contribution plan is a post-employment benefit plan under which an entity pays fixed contributions into a separate entity and will have no legal or constructive obligation to pay further amounts. Obligations for contributions to defined contribution pension plans are recognised as an employee benefit expense in the periods during which services are rendered by employees.
22
Annua l Repo r t 2015
Consolidated and Company FinanCial statements135
Thoresen Thai Agencies Public Company Limited and its SubsidiariesNotes to the financial statements
Defined benefit plans
A defined benefit plan is a post-employment benefit plan other than a defined contribution plan. The defined benefit plan is calculated by an independent actuary using the projected unit credit method. The present value of the benefit obligations is determined by discounting the estimated future cash outflows using interest rates of referred government bonds that are denominated in the currency in which the benefits will be paid and that have terms to maturity approximating to the terms of the related retirement liabilities. Actuarial gains and losses arising from experience adjustments and changes in actuarial assumptions are recognised in other comprehensive income.
Termination benefits
Termination benefits are expensed at the earlier of when the Group can no longer withdraw the offer of those benefits and when the Group recognises costs for a restructuring. If benefits are not expected to be settled wholly within 12 months of the end of the reporting period, then they are discounted.
Short-term employee benefits
Short-term employee benefit obligations are measured on an undiscounted basis and are expensed as the related service is provided.
A liability is recognised for the amount expected to be paid under a short-term cash bonus plan, if the Group has a present legal or constructive obligation to pay this amount as a result of past service provided by the employee, and the obligation can be estimated reliably.
Share-based payments
The Group operates a number of equity-settled, share-based compensation plans, under which the entity that receives services from employees compensates in part through equity instruments (options) of the Group. The fair value of the employee services received in exchange for the grant of the options is recognised as an expense. The total amount to be expensed is determined by reference to the fair value of the options granted:
- including any market performance conditions;- excluding the impact of any service and non-market performance vesting conditions (for example, profitability,
sales growth targets, and remaining an employee of the entity over a specified time period); and- excluding the impact of any non-vesting conditions (for example, the requirement for employees to save).
Non-market vesting conditions are included in assumptions about the number of options that are expected to vest. The total expense is recognised over the vesting period, which is the period over which all of the specified vesting conditions are to be satisfied. At the end of each reporting period, the entity revises its estimates of the number of options that are expected to vest based on the non-marketing vesting conditions. It recognises the impact of the revision to original estimates, if any, in profit or loss, with a corresponding adjustment to equity.
When the options are exercised, the Group issues new shares. The proceeds received net of any directly attributable transaction costs are credited to share capital (nominal value) and share premium when the options are exercised.
The grant by the Group of options over its equity instruments to the employees of the Group is treated as a capital contribution. The fair value of employee services received, measured by reference to the grant date fair value, is recognised over the vesting period as an increase to investment in subsidiary undertakings, with a corresponding credit to equity.
(q) Provisions
A provision is recognised if, as a result of a past event, the Group has a present legal or constructive obligation that can be estimated reliably, and it is probable that an outflow of economic benefits will be required to settle the obligation. Provisions are determined by discounting the expected future cash flows at a pre-tax rate that reflects current market assessments of the time value of money and the risks specific to the liability.
Onerous contracts
A provision for onerous contracts is recognised when the expected benefits to be derived by the Group from a contract are lower than the unavoidable cost of meeting the Group’s obligations under the contract. The provision is measured at the present value of the lower of the expected net cost of terminating the contract and the expected net cost of continuing with the contract.
23
THORESEN THAI AGENCIES PLC.
Consolidated and Company FinanCial statements136
Thoresen Thai Agencies Public Company Limited and its SubsidiariesNotes to the financial statements
(r) Share capital
Ordinary shares
Ordinary shares are classified as equity. Incremental costs directly attributable to the issue of ordinary shares and share options are recognised as a deduction from equity, net of any tax effects.
(s) Revenue
Revenue excludes value added taxes and is arrived at after deduction of trade discounts and volume rebates.
Rendering of services
Freight charges of each voyage are generally recognised as revenues at the completion of the voyage. Where a voyage is incomplete as of the statements of financial position date, freight charges are recognised as revenue in proportion to the lapsed time of the voyage. Freight charges shown in profit or loss represent the net freight charges after deduction of related commissions.
Offshore service income is recognised as services are performed based upon (a) contracted day rates and the number of operating days during the period or (b) agreed service charges.
Mobilisation activities related to drilling rig activity to mobilise a rig from one geographic area to another are linked to the underlying contracts. Certain contracts include mobilisation fees paid at the start of the contracts. Where the mobilisation fee covers a general or specific upgrade of a rig or equipment, the fee is recognised as revenue over the contract period. In cases where the fee covers specific operating expenses at the start up of the contract, the fee is recognised in the same period as the expenses.
Sale of goods
Revenue from sales of goods is recognised when the significant risks and rewards of ownership have been transferred to the buyer. No revenue is recognised if there is continuing management involvement with the goods or there are significant uncertainties regarding recovery of the consideration due, associated costs, or the probable return of goods.
Commissions
Commissions for services rendered to vessels and service income are generally recognised as revenues when services are completed and billed.
Rental income
Rental income is recognised as revenue on an accrual basis at the amount as specified under each lease agreement.
Dividend income
Dividend income is recognised in profit or loss on the date the Group’s right to receive payments is established.
Interest income
Interest income is recognised in profit or loss as it accrues.
(t) Finance costs
Finance costs comprise interest expense on borrowings, losses on disposal of available-for-sale financial assets, and fair value losses on financial assets at fair value through profit or loss.
Borrowing costs that are not directly attributable to the acquisition, construction, or production of a qualifying asset are recognised in profit or loss using the effective interest method.
24
Annua l Repo r t 2015
Consolidated and Company FinanCial statements137
Thoresen Thai Agencies Public Company Limited and its SubsidiariesNotes to the financial statements
(u) Lease payments
Payments made under operating leases are recognised in profit or loss on a straight line basis over the term of the lease.
Contingent lease payments are accounted for by revising the minimum lease payments over the remaining term of the lease when the lease adjustment is confirmed.
(v) Income tax
Income tax expense for the year comprises current and deferred tax. Current and deferred tax are recognised in profit or loss except to the extent that they relate to a business combination, or items recognised directly in equity or in other comprehensive income.Current tax is the expected tax payable or receivable on the taxable income or loss for the year, using tax rates enacted or substantively enacted at the reporting date, and any adjustment to tax payable in respect of previous years.
Deferred tax is recognised in respect of temporary differences between the carrying amounts of assets and liabilities for financial reporting purposes and the amounts used for taxation purposes. Deferred tax is not recognised for the following temporary differences: the initial recognition of goodwill; the initial recognition of assets or liabilities in a transaction that is not a business combination and that affects neither accounting nor taxable profit or loss; and differences relating to investments in subsidiaries and joint ventures to the extent that it is probable that they will not reverse in the foreseeable future.
The measurement of deferred tax reflects the tax consequences that would follow the manner in which the Group expects, at the end of the reporting period, to recover or settle the carrying amount of its assets and liabilities.
Deferred tax is measured at the tax rates that are expected to be applied to the temporary differences when they reverse, using tax rates enacted or substantively enacted at the reporting date.
In determining the amount of current and deferred tax, the Group takes into account the impact of uncertain tax positions and whether additional taxes and interest may be due. The Group believes that its accruals for tax liabilities are adequate for all open tax years based on its assessment of many factors, including interpretations of tax law and prior experience. This assessment relies on estimates and assumptions and may involve a series of judgements about future events. New information may become available that causes the Group to change its judgement regarding the adequacy of existing tax liabilities; such changes to tax liabilities will impact tax expense in the period that such a determination is made.
Deferred tax assets and liabilities are offset if there is a legally enforceable right to offset current tax liabilities and assets, and they relate to income taxes levied by the same tax authority on the same taxable entity, or on different tax entities, but they intend to settle current tax liabilities and assets on a net basis or their tax assets and liabilities will be realised simultaneously.
A deferred tax asset is recognised to the extent that it is probable that future taxable profits will be available against which the temporary differences can be utilised. Deferred tax assets are reviewed at each reporting date and reduced to the extent that it is no longer probable that the related tax benefit will be realised.
(w) Earnings per share
The Group presents basic and diluted earnings per share (“EPS”) data for its ordinary shares. Basic EPS is calculated by dividing the profit or loss attributable to ordinary shareholders of the Company by the weighted average number of ordinary shares outstanding during the period. Diluted EPS is determined by adjusting the profit or loss attributable to ordinary shareholders by the weighted average number of ordinary shares outstanding for the effects of all dilutive potential ordinary shares, which comprise warrants.
(x) Dividend distribution
Dividend to the Company’s shareholders is recognised as a liability in the consolidated and separate financial statements in the period in which the interim dividends are approved by the Board of Directors and the annual dividends are approved by the Company’s shareholders.
25
THORESEN THAI AGENCIES PLC.
Consolidated and Company FinanCial statements138
Thoresen Thai Agencies Public Company Limited and its SubsidiariesNotes to the financial statements
(y) Segment reporting
Segment results that are reported to the Group’s CEO (the chief operating decision maker) include items directly attributable to a segment as well as those that can be allocated on a reasonable basis.
5 Related parties
For the purposes of these financial statements, parties are considered to be related to the Group if the Group has the ability, directly or indirectly, to control or jointly control the party or exercise significant influence over the partyin making financial and operating decisions, or vice versa, or where the Group and the party are subject to common control or common significant influence. Related parties may be individuals or other entities.
Relationships with related parties, except for subsidiaries, associates, and joint ventures described in notes 12 and13 are as follows:
Name of entities/persons Country of Nature of relationshipsincorporation/nationality
Key management personnel Multi-nationalities Persons having authority and responsibility for planning, directing, and controlling the activities of the entity, directly or indirectly, including any director (whether executive or otherwise) of the Group.
The pricing policies for particular types of transactions are explained further below:
Transactions Pricing policiesIT service and office and office equipment Prices normally charged to a third party rental incomeOffshore service income Prices normally charged to a third partyService income Prices normally charged to a third partyManagement fee income Actual cost plus marginInterest income/interest expenses Market linked rate/the borrowing costs of the lenderManagement and administrative fees Actual cost plus marginIT service and service expenses Prices normally charged by a third partyVessel operating expenses, offshore Prices normally charged by a third party
service expenses, and cost of sales
Significant transactions for the year ended 31 December 2015 and for the three-month period ended 31 December 2014 with related parties were as follows:
Consolidated Separatefinancial statements financial statements
For the For the For the For the year ended three- month year ended three- month
31 December period ended 31 December period ended2015 31 December 2015 31 December
2014 2014(in thousand Baht)
SubsidiariesIT service and office and office equipment
rental income - - 18,451 4,534Other income - - 997 160Interest income - - 22,964 4,732IT service and service expenses - - 1,432 481Interest expenses - - 1,468 33,661
26
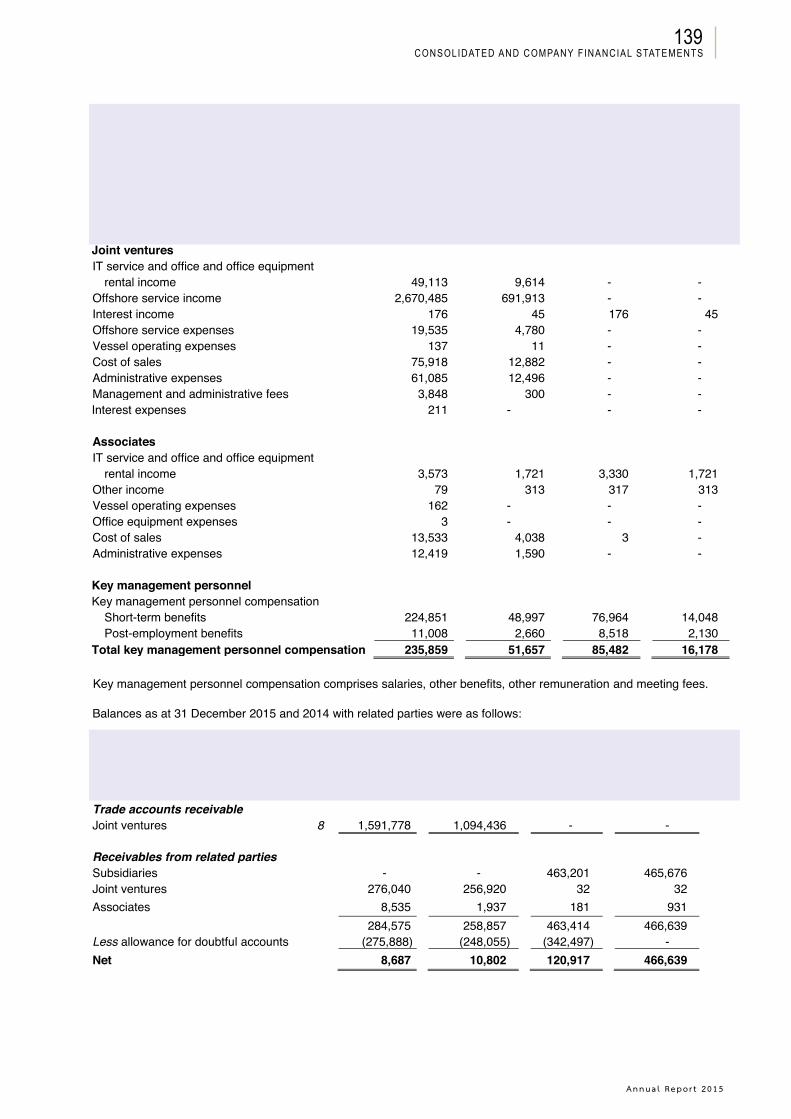
Annua l Repo r t 2015
Consolidated and Company FinanCial statements139
Thoresen Thai Agencies Public Company Limited and its SubsidiariesNotes to the financial statements
Consolidated Separatefinancial statements financial statements
For the For the For the For the year ended three- month year ended three- month
31 December period ended 31 December period ended2015 31 December 2015 31 December
2014 2014(in thousand Baht)
Joint venturesIT service and office and office equipment
rental income 49,113 9,614 - -Offshore service income 2,670,485 691,913 - -Interest income 176 45 176 45Offshore service expenses 19,535 4,780 - -Vessel operating expenses 137 11 - -Cost of sales 75,918 12,882 - -Administrative expenses 61,085 12,496 - -Management and administrative fees 3,848 300 - -Interest expenses 211 - - -
AssociatesIT service and office and office equipment
rental income 3,573 1,721 3,330 1,721Other income 79 313 317 313Vessel operating expenses 162 - - -Office equipment expenses 3 - - -Cost of sales 13,533 4,038 3 -Administrative expenses 12,419 1,590 - -
Key management personnelKey management personnel compensation
Short-term benefits 224,851 48,997 76,964 14,048Post-employment benefits 11,008 2,660 8,518 2,130
Total key management personnel compensation 235,859 51,657 85,482 16,178
Key management personnel compensation comprises salaries, other benefits, other remuneration and meeting fees.
Balances as at 31 December 2015 and 2014 with related parties were as follows:
Consolidated Separatefinancial statements financial statements
Note 2015 2014 2015 2014(in thousand Baht)
Trade accounts receivableJoint ventures 8 1,591,778 1,094,436 - -
Receivables from related partiesSubsidiaries - - 463,201 465,676Joint ventures 276,040 256,920 32 32Associates 8,535 1,937 181 931
284,575 258,857 463,414 466,639Less allowance for doubtful accounts (275,888) (248,055) (342,497) -Net 8,687 10,802 120,917 466,639
27

THORESEN THAI AGENCIES PLC.
Consolidated and Company FinanCial statements140
Thoresen Thai Agencies Public Company Limited and its SubsidiariesNotes to the financial statements
Consolidated Separatefinancial statements financial statements
2015 2014 2015 2014(in thousand Baht)
Short-term loans to related partiesSubsidiaries - - 5,689,152 1,462,280Joint ventures 155,181 141,741 - -
155,181 141,741 5,689,152 1,462,280Less allowance for impairment (155,181) (141,741) (172,140) -Net - - 5,517,012 1,462,280
The Company
Short-term loans to subsidiaries are at call and unsecured, which loans to a subsidiary bear interest at 4.6% -4.7% per annum (31 December 2014: 4.6% per annum).
Movements of short-term loans to related parties during the year ended 31 December 2015 and the three-month period ended 31 December 2014 are as follows:
Consolidated financial statements
Separatefinancial statements
Note 2015 2014 2015 2014(in thousand Baht)
Short-term loans to related partiesSubsidiariesAt 1 January / 1 October - - 1,462,280 2,083,753IncreaseRepaymentsRealised gains on exchange rates
---
---
4,564,516(353,341)
(1,035)
756,894(1,296,489)
(90,965)
Impairment charges 28 - - (172,140) -Foreign currency translation
differences - - 16,732 9,087At 31 December - - 5,517,012 1,462,280
Consolidated Separatefinancial statements financial statements
2015 2014 2015 2014(in thousand Baht)
Long-term loans to related partiesSubsidiaries - - 3,977,053 3,977,053Joint ventures 644,450 588,814 2,073 2,073
644,450 588,814 3,979,126 3,979,126Less allowance for impairment (642,377) (586,741) (3,962,053) (3,278,045)Net 2,073 2,073 17,073 701,081
The Company
As at 31 December 2015, long-term loans to subsidiaries represented unsecured long-term loans in Baht currency totalling Baht 3,977 million (31 December 2014: Baht 3,977 million), which loans to a subsidiary carry interest at Minimum Overdraft Rate (“MOR”) plus a certain margin per annum (31 December 2014: MOR plus a certain margin per annum).
In addition, long-term loans to a joint venture amounting to Baht 2.1 million (31 December 2014: Baht 2.1 million)are unsecured carry interest at MOR plus a certain margin per annum (31 December 2014: MOR plus a certain margin per annum).
28
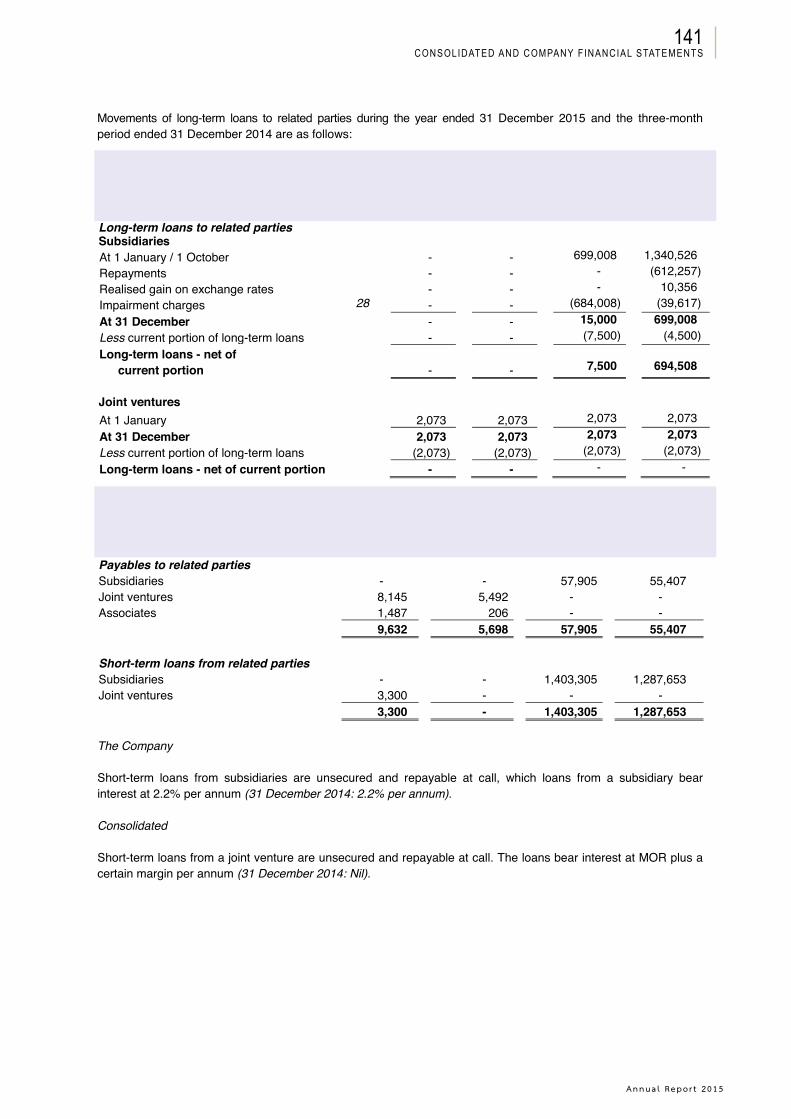
Annua l Repo r t 2015
Consolidated and Company FinanCial statements141
Thoresen Thai Agencies Public Company Limited and its SubsidiariesNotes to the financial statements
Movements of long-term loans to related parties during the year ended 31 December 2015 and the three-month period ended 31 December 2014 are as follows:
Consolidated financial statements
Separatefinancial statementsNote
2015 2014 2015 2014(in thousand Baht)
Long-term loans to related partiesSubsidiariesAt 1 January / 1 October - - 699,008 1,340,526Repayments - - - (612,257)Realised gain on exchange rates - - - 10,356Impairment charges 28 - - (684,008) (39,617)At 31 December - - 15,000 699,008Less current portion of long-term loans - - (7,500) (4,500)Long-term loans - net of
current portion - - 7,500 694,508
Joint venturesAt 1 January 2,073 2,073 2,073 2,073At 31 December 2,073 2,073 2,073 2,073Less current portion of long-term loans (2,073) (2,073) (2,073) (2,073)Long-term loans - net of current portion - - - -
Consolidated Separatefinancial statements financial statements2015 2014 2015 2014
(in thousand Baht)Payables to related partiesSubsidiaries - - 57,905 55,407Joint ventures 8,145 5,492 - -Associates 1,487 206 - -
9,632 5,698 57,905 55,407
Short-term loans from related partiesSubsidiaries - - 1,403,305 1,287,653Joint ventures 3,300 - - -
3,300 - 1,403,305 1,287,653
The Company
Short-term loans from subsidiaries are unsecured and repayable at call, which loans from a subsidiary bear interest at 2.2% per annum (31 December 2014: 2.2% per annum).
Consolidated
Short-term loans from a joint venture are unsecured and repayable at call. The loans bear interest at MOR plus a certain margin per annum (31 December 2014: Nil).
29
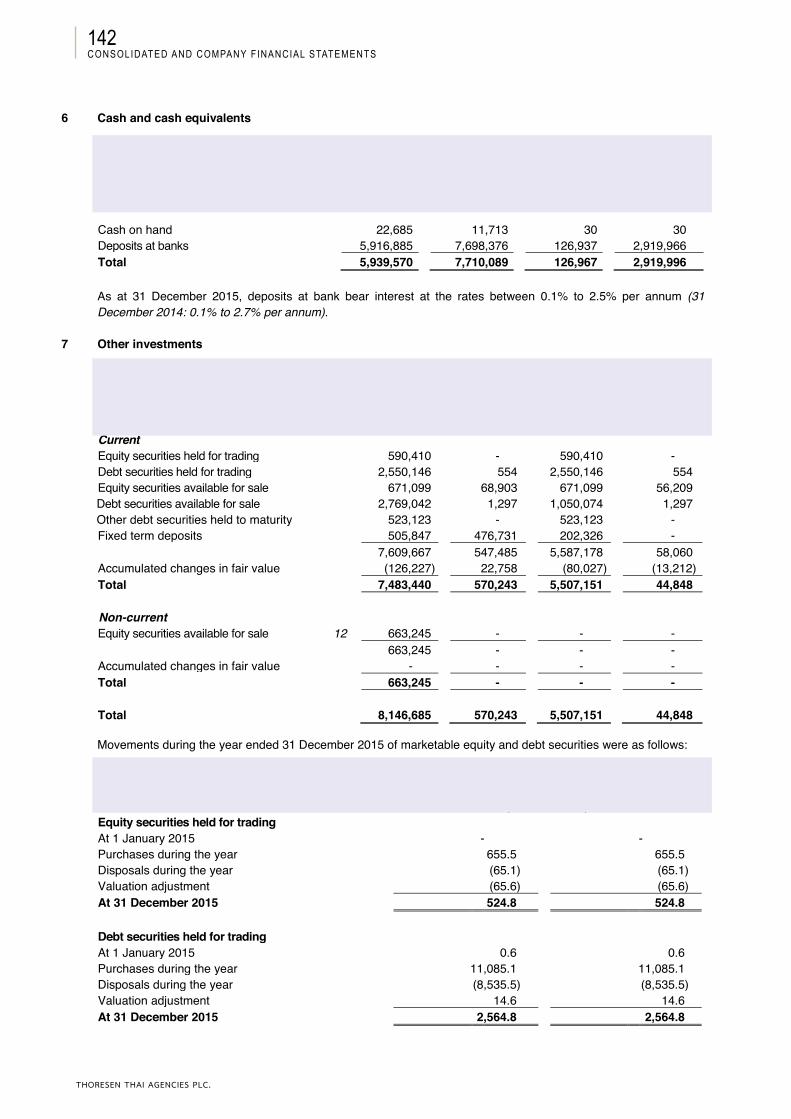
THORESEN THAI AGENCIES PLC.
Consolidated and Company FinanCial statements142
Thoresen Thai Agencies Public Company Limited and its SubsidiariesNotes to the financial statements
6 Cash and cash equivalents
Consolidated Separatefinancial statements financial statements2015 2014 2015 2014
(in thousand Baht)
Cash on hand 22,685 11,713 30 30Deposits at banks 5,916,885 7,698,376 126,937 2,919,966Total 5,939,570 7,710,089 126,967 2,919,996
As at 31 December 2015, deposits at bank bear interest at the rates between 0.1% to 2.5% per annum (31 December 2014: 0.1% to 2.7% per annum).
7 Other investments
Consolidated Separatefinancial statements financial statements
Note 2015 2014 2015 2014(in thousand Baht)
CurrentEquity securities held for trading 590,410 - 590,410 -Debt securities held for trading 2,550,146 554 2,550,146 554Equity securities available for sale 671,099 68,903 671,099 56,209Debt securities available for sale 2,769,042 1,297 1,050,074 1,297Other debt securities held to maturity 523,123 - 523,123 -Fixed term deposits 505,847 476,731 202,326 -
7,609,667 547,485 5,587,178 58,060Accumulated changes in fair value (126,227) 22,758 (80,027) (13,212)Total 7,483,440 570,243 5,507,151 44,848
Non-currentEquity securities available for sale 12 663,245 - - -
663,245 - - -Accumulated changes in fair value - - - -Total 663,245 - - -
Total 8,146,685 570,243 5,507,151 44,848
Movements during the year ended 31 December 2015 of marketable equity and debt securities were as follows:
Consolidated Separatefinancial statements financial statements
(in million Baht)Equity securities held for tradingAt 1 January 2015 - -Purchases during the year 655.5 655.5Disposals during the year (65.1) (65.1)Valuation adjustment (65.6) (65.6)At 31 December 2015 524.8 524.8
Debt securities held for tradingAt 1 January 2015 0.6 0.6Purchases during the year 11,085.1 11,085.1Disposals during the year (8,535.5) (8,535.5)Valuation adjustment 14.6 14.6At 31 December 2015 2,564.8 2,564.8
30
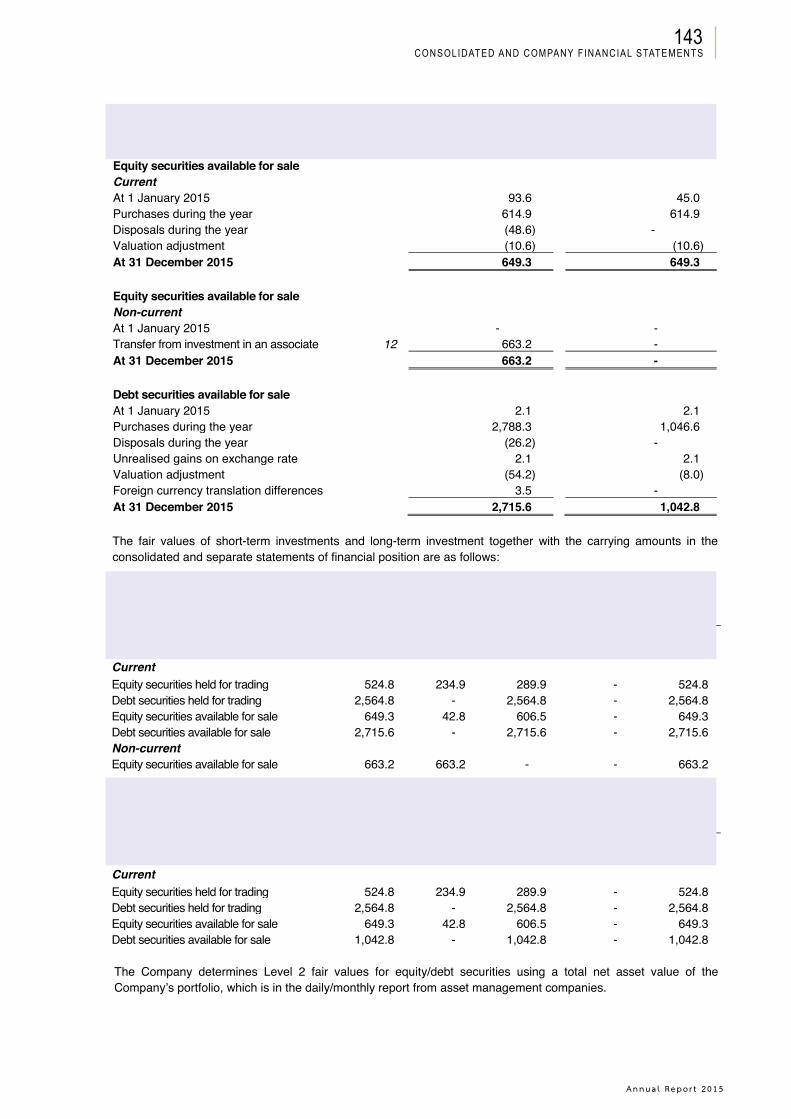
Annua l Repo r t 2015
Consolidated and Company FinanCial statements143
Thoresen Thai Agencies Public Company Limited and its SubsidiariesNotes to the financial statements
Consolidated SeparateNote financial statements financial statements
(in million Baht)Equity securities available for saleCurrentAt 1 January 2015 93.6 45.0Purchases during the year 614.9 614.9Disposals during the year (48.6) -Valuation adjustment (10.6) (10.6)At 31 December 2015 649.3 649.3
Equity securities available for saleNon-currentAt 1 January 2015 - -Transfer from investment in an associate 12 663.2 -At 31 December 2015 663.2 -
Debt securities available for saleAt 1 January 2015 2.1 2.1Purchases during the year 2,788.3 1,046.6Disposals during the year (26.2) -Unrealised gains on exchange rate 2.1 2.1Valuation adjustment (54.2) (8.0)Foreign currency translation differences 3.5 -At 31 December 2015 2,715.6 1,042.8
The fair values of short-term investments and long-term investment together with the carrying amounts in the consolidated and separate statements of financial position are as follows:
Consolidated financial statementsCarrying amount Fair value
Level 1 Level 2 Level 3 Total31 December 2015 (in million Baht)CurrentEquity securities held for trading 524.8 234.9 289.9 - 524.8Debt securities held for trading 2,564.8 - 2,564.8 - 2,564.8Equity securities available for sale 649.3 42.8 606.5 - 649.3Debt securities available for sale 2,715.6 - 2,715.6 - 2,715.6Non-currentEquity securities available for sale 663.2 663.2 - - 663.2
Separate financial statementsCarrying amount Fair value
Level 1 Level 2 Level 3 Total31 December 2015 (in million Baht)CurrentEquity securities held for trading 524.8 234.9 289.9 - 524.8Debt securities held for trading 2,564.8 - 2,564.8 - 2,564.8Equity securities available for sale 649.3 42.8 606.5 - 649.3Debt securities available for sale 1,042.8 - 1,042.8 - 1,042.8
The Company determines Level 2 fair values for equity/debt securities using a total net asset value of the Company’s portfolio, which is in the daily/monthly report from asset management companies.
31
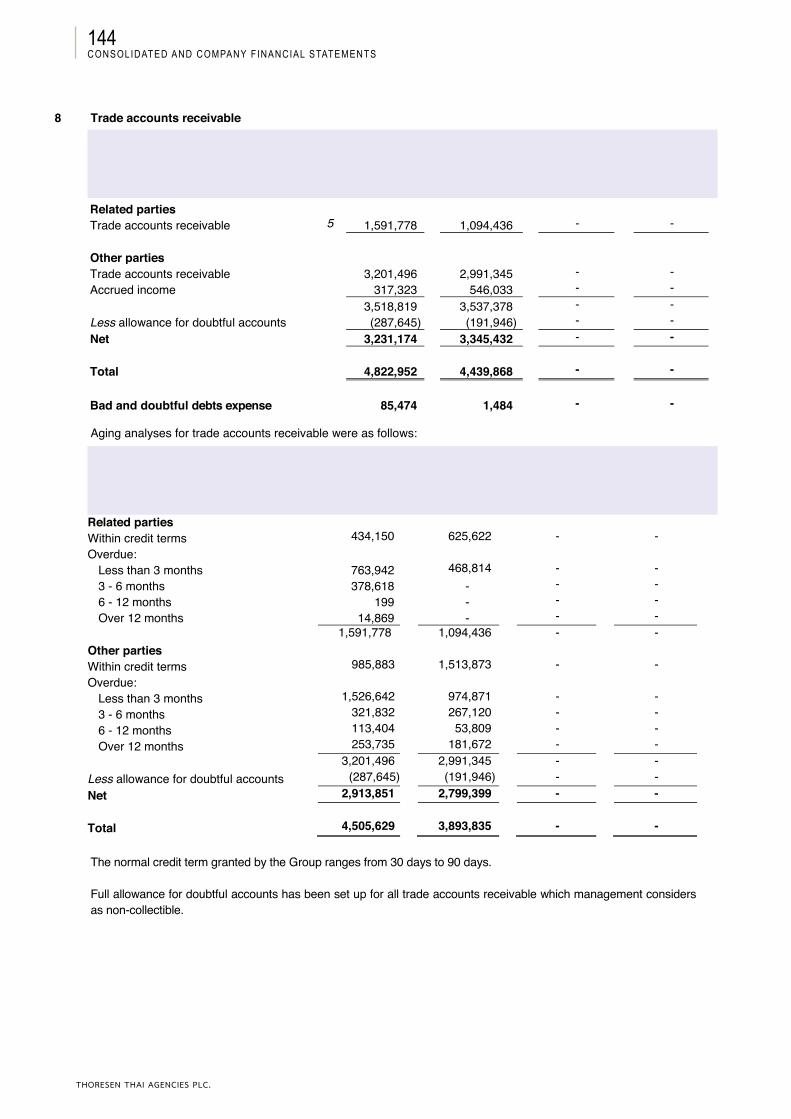
THORESEN THAI AGENCIES PLC.
Consolidated and Company FinanCial statements144
Thoresen Thai Agencies Public Company Limited and its SubsidiariesNotes to the financial statements
8 Trade accounts receivable
Consolidated Separatefinancial statements financial statements
Note 2015 2014 2015 2014(in thousand Baht)
Related partiesTrade accounts receivable 5 1,591,778 1,094,436 - -
Other partiesTrade accounts receivable 3,201,496 2,991,345 - -Accrued income 317,323 546,033 - -
3,518,819 3,537,378 - -Less allowance for doubtful accounts (287,645) (191,946) - -Net 3,231,174 3,345,432 - -
Total 4,822,952 4,439,868 - -
Bad and doubtful debts expense 85,474 1,484 - -
Aging analyses for trade accounts receivable were as follows:
Consolidated Separatefinancial statements financial statements
2015 2014 2015 2014(in thousand Baht)
Related partiesWithin credit terms 434,150 625,622 - -Overdue:
Less than 3 months 763,942 468,814 - -3 - 6 months 378,618 - - -6 - 12 months 199 - - -Over 12 months 14,869 - - -
1,591,778 1,094,436 - -Other partiesWithin credit terms 985,883 1,513,873 - -Overdue:
Less than 3 months 1,526,642 974,871 - -3 - 6 months 321,832 267,120 - -6 - 12 months 113,404 53,809 - -Over 12 months 253,735 181,672 - -
3,201,496 2,991,345 - -Less allowance for doubtful accounts (287,645) (191,946) - -Net 2,913,851 2,799,399 - -
Total 4,505,629 3,893,835 - -
The normal credit term granted by the Group ranges from 30 days to 90 days.
Full allowance for doubtful accounts has been set up for all trade accounts receivable which management considers as non-collectible.
32
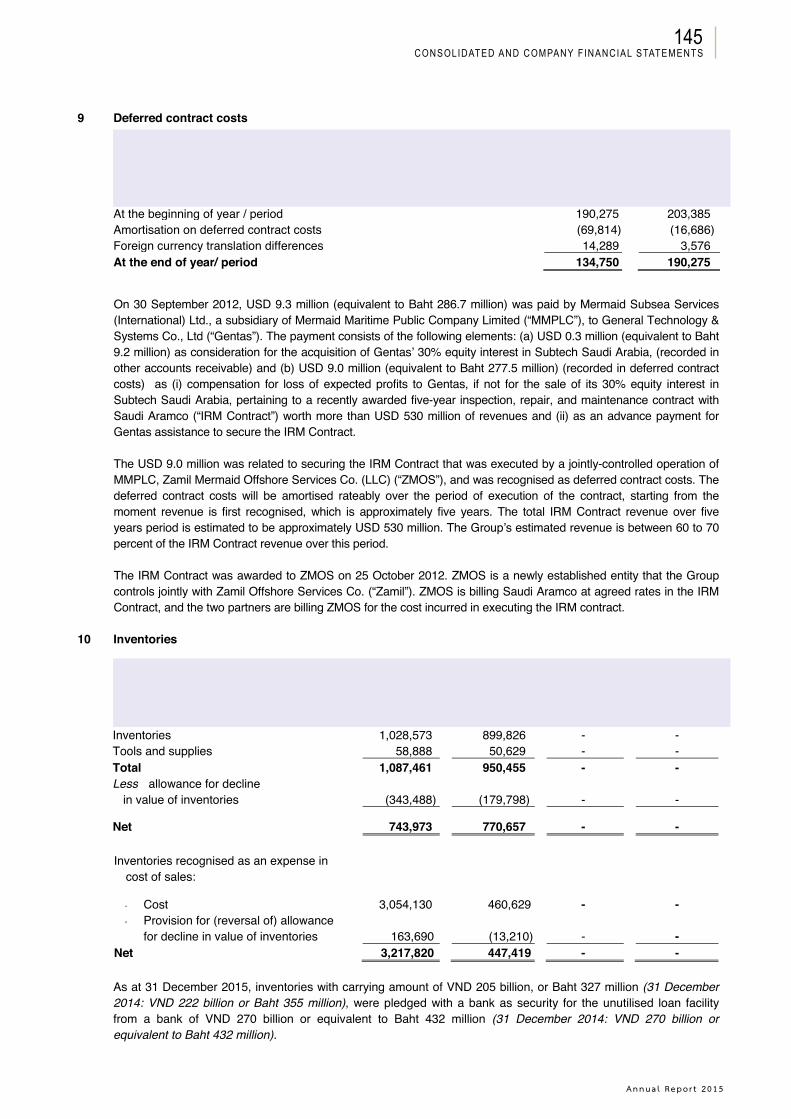
Annua l Repo r t 2015
Consolidated and Company FinanCial statements145
Thoresen Thai Agencies Public Company Limited and its SubsidiariesNotes to the financial statements
9 Deferred contract costs
Consolidatedfinancial statements
2015 2014(in thousand Baht)
At the beginning of year / period 190,275 203,385Amortisation on deferred contract costs (69,814) (16,686)Foreign currency translation differences 14,289 3,576At the end of year/ period 134,750 190,275
On 30 September 2012, USD 9.3 million (equivalent to Baht 286.7 million) was paid by Mermaid Subsea Services (International) Ltd., a subsidiary of Mermaid Maritime Public Company Limited (“MMPLC”), to General Technology & Systems Co., Ltd (“Gentas”). The payment consists of the following elements: (a) USD 0.3 million (equivalent to Baht 9.2 million) as consideration for the acquisition of Gentas’ 30% equity interest in Subtech Saudi Arabia, (recorded in other accounts receivable) and (b) USD 9.0 million (equivalent to Baht 277.5 million) (recorded in deferred contract costs) as (i) compensation for loss of expected profits to Gentas, if not for the sale of its 30% equity interest in Subtech Saudi Arabia, pertaining to a recently awarded five-year inspection, repair, and maintenance contract with Saudi Aramco (“IRM Contract”) worth more than USD 530 million of revenues and (ii) as an advance payment for Gentas assistance to secure the IRM Contract.
The USD 9.0 million was related to securing the IRM Contract that was executed by a jointly-controlled operation of MMPLC, Zamil Mermaid Offshore Services Co. (LLC) (“ZMOS”), and was recognised as deferred contract costs. The deferred contract costs will be amortised rateably over the period of execution of the contract, starting from the moment revenue is first recognised, which is approximately five years. The total IRM Contract revenue over five years period is estimated to be approximately USD 530 million. The Group’s estimated revenue is between 60 to 70 percent of the IRM Contract revenue over this period.
The IRM Contract was awarded to ZMOS on 25 October 2012. ZMOS is a newly established entity that the Group controls jointly with Zamil Offshore Services Co. (“Zamil”). ZMOS is billing Saudi Aramco at agreed rates in the IRM Contract, and the two partners are billing ZMOS for the cost incurred in executing the IRM contract.
10 Inventories
Consolidated Separatefinancial statements financial statements2015 2014 2015 2014
(in thousand Baht)Inventories 1,028,573 899,826 - -Tools and supplies 58,888 50,629 - -Total 1,087,461 950,455 - -Less allowance for decline in value of inventories (343,488) (179,798) - -
Net 743,973 770,657 - -
Inventories recognised as an expense in cost of sales:
- Cost 3,054,130 460,629 - -- Provision for (reversal of) allowance
for decline in value of inventories 163,690 (13,210) - -Net 3,217,820 447,419 - -
As at 31 December 2015, inventories with carrying amount of VND 205 billion, or Baht 327 million (31 December 2014: VND 222 billion or Baht 355 million), were pledged with a bank as security for the unutilised loan facilityfrom a bank of VND 270 billion or equivalent to Baht 432 million (31 December 2014: VND 270 billion orequivalent to Baht 432 million).
33

THORESEN THAI AGENCIES PLC.
Consolidated and Company FinanCial statements146
Thoresen Thai Agencies Public Company Limited and its SubsidiariesNotes to the financial statements
11 Other current assets
Consolidated Separatefinancial statements financial statements2015 2014 2015 2014
(in thousand Baht)Dividend receivables from an associate 243,675 - - -Prepaid tax and value added tax
refundable, net 377,598 315,423 1,204 -Cash at bank collateralised for
short-term loans 320,755 - - -Other current assets, net 38,170 148,320 23,475 20,200Total 980,198 463,743 24,679 20,200
On 23 December 2015, Asia Offshore Drilling Limited (“AOD”), an associate under energy group, declared dividends of USD 0.333 per share and remained receivable of USD 6.8 million or equivalent to Baht 243.7 million as at 31 December 2015. The payment has been made to the Group on 14 January 2016.
12 Investments in associates and joint ventures
Investments in associates and joint ventures as at 31 December 2015 and 2014 comprise investments in the following companies:
Nature of Country of % Ownership interestName of associates / joint ventures business incorporation 2015 2014
Name of associates
The CompanyTransport- Fearnleys (Thailand) Ltd. Ship brokerage Thailand 49.0 49.0
With subsidiaries as follows:- PT. Fearnleys Indonesia ” Indonesia- Fearnleys Shipbroking Private
Limited” India
Transport (continued)- Thoresen Shipping and Logistics Ltd. Ship agency Thailand 49.0 49.0
With subsidiaries as follows:- Thoresen Shipping and Logistics
(Myanmar) Company Limited ” Myanmar
ConsolidatedTransport- Sharjah Ports Services LLC (invested
by Thoresen Shipping FZE) Port operations UAE 49.0 49.0
Energy- Asia Offshore Drilling Limited (invested
by MMPLC)Drilling services Bermuda 33.8 33.8
With subsidiaries as follows:- Asia Offshore Rig 1 Limited ” Bermuda- Asia Offshore Rig 2 Limited ” Bermuda- Asia Offshore Rig 3 Limited ” Bermuda
34

Annua l Repo r t 2015
Consolidated and Company FinanCial statements147
Thoresen Thai Agencies Public Company Limited and its SubsidiariesNotes to the financial statements
Nature of Country of % Ownership interestName of associates / joint ventures business incorporation 2015 2014
Infrastructure- Baria Serece (invested by Soleado) Port Vietnam 20.0 20.0 operations- Sino Grandness Food Industry Group Food and beverage Singapore - 9.0
Limited (invested by Soleado) manufacturing and Distribution
Name of joint ventures
The CompanyTransport- Thoresen (Indochina) S.A. Ship agency Panama 50.0 50.0
With a subsidiary as follow:- Thoresen-Vinama Ship agency and Vietnam
Agencies Co., Ltd. related servicestransportation
Infrastructure- Gulf Agency Company (Thailand) Ltd.
(“GAC”) Ship agency Thailand 51.0 51.0
Consolidated Transport- Petrolift Inc. (invested by Soleado) Maritime
transportationPhilippines 40.0 40.0
Energy
- Zamil Mermaid Offshore Services Co. (LLC) (invested by MMPLC)
Inspection, installation, repair and maintenance services for Offshore Oil and
Gas industry
Saudi Arabia 40.0 40.0
- SKI Energy Resources Inc. (invested by MIN)
Coal mining Philippines 40.0 40.0
Consolidated Separate financial statements financial statements
Note 2015 2014 2015 2014(in thousand Baht)
AssociatesAt the beginning of year / period 5,804,516 4,861,412 42,368 42,368Acquisition 75,299 606,661 - -Dividend income (495,331) - - -Share of profits of associates 682,171 241,698 - -Share of loss from impairment of an
associate (2,232,095) - - -Transfer to long-term investment (869,108) - - -Foreign currency translation differences 358,409 94,745 - -At 31 December 3,323,861 5,804,516 42,368 42,368
35

THORESEN THAI AGENCIES PLC.
Consolidated and Company FinanCial statements148
Thoresen Thai Agencies Public Company Limited and its SubsidiariesNotes to the financial statements
Consolidated Separate financial statements financial statements
Note 2015 2014 2015 2014Joint venturesAt the beginning of year / period 1,298,022 1,110,618 19,984 17,968Acquisition - 168,647 - -Dividend income (99,284) - - -Share of profits of joint ventures 140,443 16,365 - -Net (allowance) reversal of impairment 28 (153,881) - - 2,016Foreign currency translation differences 65,391 2,392 - -At 31 December 1,250,691 1,298,022 19,984 19,984
TotalAt the beginning of year / period 7,102,538 5,972,030 62,352 60,336Acquisition 75,299 775,308 - -Dividend income (594,615) - - -Share of profits of associates and joint
ventures 822,614 258,063 - -Share of loss from impairment of an
associate (2,232,095) - - -Net (allowance) reversal of impairment (153,881) - - 2,016Transfer to long-term investment (869,108) - - -Foreign currency translation differences 423,800 97,137 - -At 31 December 4,574,552 7,102,538 62,352 62,352
During the year ended 31 December 2015, there were the following changes in investments in associates and joint ventures.
Acquisition
During the year ended 31 December 2015, Soleado subscribed for 10,603,700 shares of Sino Grandness Food Industry Group Limited (“SGFI”) from the Stock Exchange of Singapore at average price of SGD 0.28 per sharefor total consideration of SGD 3.0 million, or Baht 75.3 million, bringing the Group’s total interest in Sino Grandness Food Industry Group Limited from 9.0% as at 31 December 2014 to 10.6% as at 31 December 2015.
Transfer to long-term investment
During the fourth quarter of 2015, the management has become of the opinion, based on changes in circumstances that the Group no longer has significant influence in an the associate and the investment in anassociate was transferred to long-term investment available for sale with loss recognised as at 31 December 2015as follow:
ConsolidatedNote financial statements
(in thousand Baht)Decrease in carrying amount of investment in an associate (869,108)Increase in long-term investment available for sale 7 663,245Amounts previously recorded in other comprehensive income 36,216Loss recognised on transfer of investment in an associate to
long-term investment available for sale (169,647)
Dilution of interest in an associate
The Group’s interest in an associate, while maintaining equity accounting in the associate, was diluted in July 2011. The loss on dilution of USD 5.7 million or equivalent to Baht 195.0 million was recognised in the Group’s share of profits before impairment loss of associates for the year ended 31 December 2015.
36
Annua l Repo r t 2015
Consolidated and Company FinanCial statements149
Thoresen Thai Agencies Public Company Limited and its SubsidiariesNotes to the financial statements
Share of loss from impairment of an associate
The continuing drop in oil prices during the year 2015 impacted the overall business of an associate of the Group as it led to reduced activity and contracts for offshore drilling services. Additionally, with more offshore rigs in the market coming off contract and new builds yet to be delivered, the drilling rig supply and demand imbalance will continue to have a negative impact on utilisation and day rates. These have been important factors indicating that the assets held by the associate may be impaired.
During the year 2015, the associate recognised an impairment charge of USD 193.0 million or equivalent to Baht 6,610.0 million on certain drilling rigs as a result of lower recoverable amounts compared to carrying amounts. The Group’s share of this impairment charge amounted to USD 65.2 million or equivalent to Baht 2,232.1 million.
37

THORESEN THAI AGENCIES PLC.
Consolidated and Company FinanCial statements150
Thor
esen
Tha
i Age
ncie
s Pu
blic
Com
pany
Lim
ited
and
its S
ubsi
diar
ies
Note
s to
the
finan
cial
sta
tem
ents
Inve
stm
ents
in a
ssoc
iate
s an
d jo
int v
entu
res
as a
t 31
Dec
embe
r20
15 a
nd 2
014,
and
div
iden
d in
com
e fro
m th
ose
inve
stm
ents
for
the
year
then
end
ed a
nd fo
r th
e th
ree-
mon
th p
erio
d,
resp
ectiv
ely,
were
as fo
llows
:
Cons
olid
ated
fina
ncia
l sta
tem
ents
Paid
-up
capi
tal
Cos
tEq
uity
Impa
irmen
tAt
equ
ity -
net
Div
iden
d in
com
e20
1520
1420
1520
1420
1520
1420
1520
1420
1520
1420
1520
14(in
milli
on B
aht)
Asso
ciat
esFe
arnl
eys
(Tha
iland
) Ltd
.14
1418
1859
60-
-59
60-
-Th
ores
en S
hipp
ing
and
Logi
stic
s Lt
d.50
5024
2421
35-
-21
359
-Sh
arja
h Po
rts S
ervi
ces
LLC
(in
vest
ed b
y Th
ores
en
Ship
ping
FZE
)14
713
555
5511
311
3-
-11
311
324
-As
ia O
ffsho
re D
rillin
g Li
mite
d(in
veste
d by
MM
PLC)
1,97
81,
978
2,96
42,
964
2,66
14,
557
--
2,66
14,
557
462
-Ba
ria S
erec
e(in
vest
ed b
y So
lead
o)32
632
633
433
447
043
2-
-47
043
2-
-Si
no G
rand
ness
Foo
d In
dust
ry
Gro
up L
imite
d(in
vest
ed b
y So
lead
o)2,
445
2,33
7-
607
-60
7-
--
607
--
3,39
54,
002
3,32
45,
804
--
3,32
45,
804
495
-
Join
t ven
ture
sTh
ores
en (I
ndoc
hina
) S.A
.9
89
918
312
9-
-18
312
910
-G
ulf A
genc
y C
ompa
ny
(Tha
iland
) Ltd
.22
2211
1117
11-
-17
11-
-Pe
trolif
t Inc
.(inv
este
d by
So
lead
o)97
593
693
093
01,
011
975
--
1,01
197
589
-Za
mil
Mer
mai
d O
ffsho
re
Serv
ices
Co.
(LLC
) (in
vest
ed
by M
MPL
C)
1818
77
3914
--
3914
--
SKI E
nerg
y R
esou
rces
Inc.
(inve
sted
by M
IN)
461
443
169
169
154
169
(154
)-
-16
9-
-1,
126
1,12
61,
404
1,29
8(1
54)
-1,
250
1,29
899
-
Tota
l4,
521
5,12
84,
728
7,10
2(1
54)
-4,
574
7,10
259
4-
38
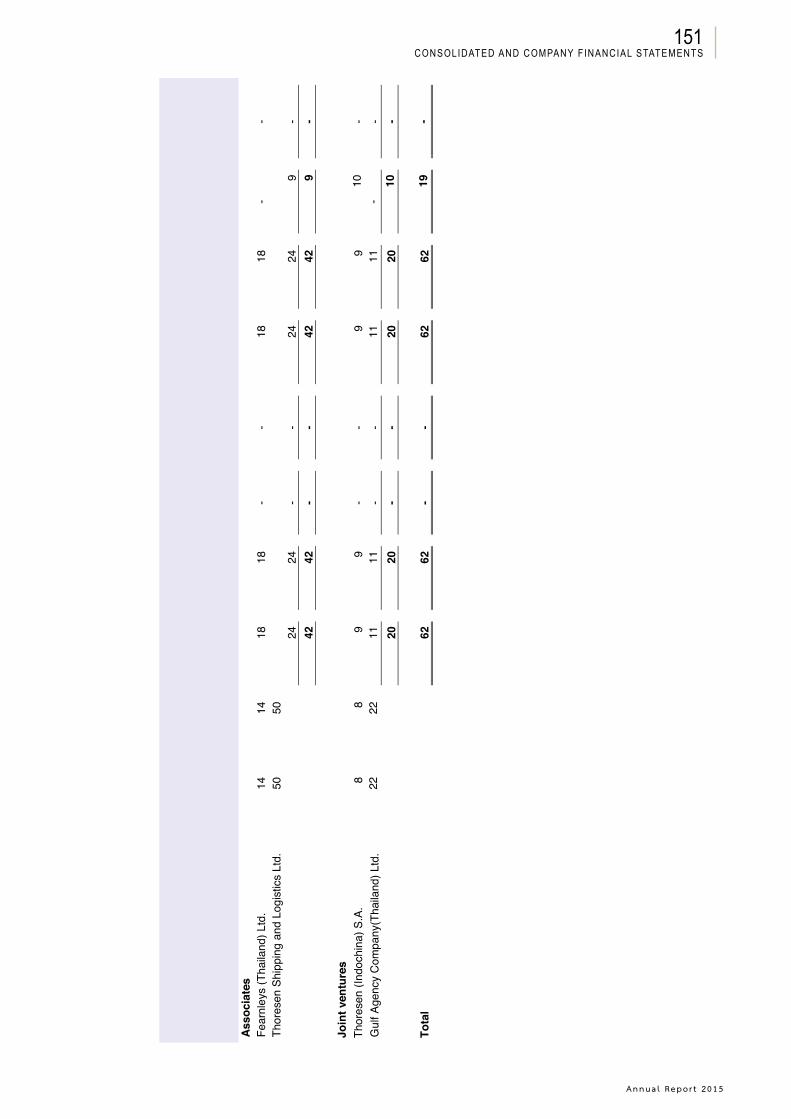
Annua l Repo r t 2015
Consolidated and Company FinanCial statements151
Thor
esen
Tha
i Age
ncie
s Pu
blic
Com
pany
Lim
ited
and
its S
ubsi
diar
ies
Note
s to
the
finan
cial
sta
tem
ents
Sepa
rate
fina
ncia
l sta
tem
ents
Paid
-up
capi
tal
Cos
tIm
pairm
ent
At c
ost -
net
Div
iden
d in
com
e 20
1520
1420
1520
1420
1520
1420
1520
1420
1520
14(in
milli
on B
aht)
Asso
ciat
esFe
arnl
eys
(Tha
iland
) Ltd
.14
1418
18-
-18
18-
-Th
ores
en S
hipp
ing
and
Logi
stic
s Lt
d.50
5024
24-
-24
249
-42
42-
-42
429
-
Join
t ven
ture
sTh
ores
en (I
ndoc
hina
) S.A
.8
89
9-
-9
910
-G
ulf A
genc
y C
ompa
ny(T
haila
nd) L
td.
2222
1111
--
1111
--
2020
--
2020
10-
Tota
l62
62-
-62
6219
-
39
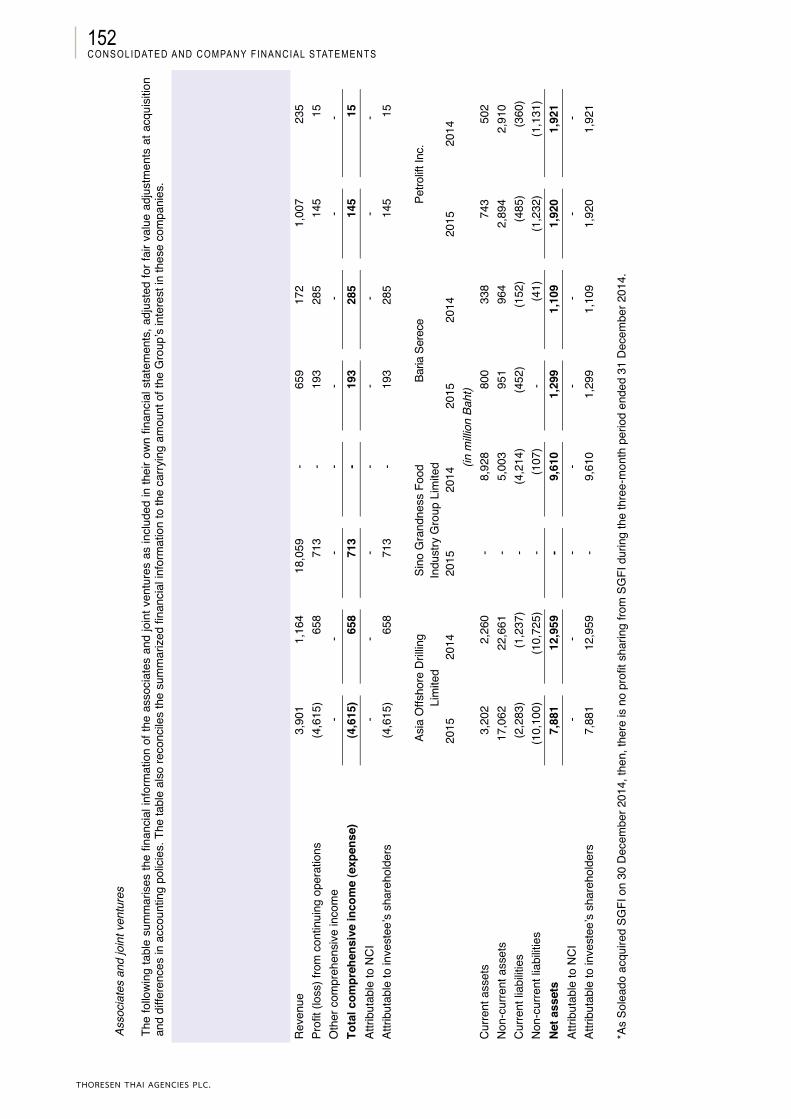
THORESEN THAI AGENCIES PLC.
Consolidated and Company FinanCial statements152
Thor
esen
Tha
i Age
ncie
s Pu
blic
Com
pany
Lim
ited
and
its S
ubsi
diar
ies
Note
s to
the
finan
cial
sta
tem
ents
Asso
ciat
es a
nd jo
int v
entu
res
The
follo
wing
tabl
e su
mm
aris
es th
e fin
anci
al in
form
atio
n of
the
asso
ciat
es a
nd jo
int v
entu
res
as in
clud
ed in
thei
r own
fina
ncia
l sta
tem
ents
, adj
uste
d fo
r fai
r val
ue a
djus
tmen
ts a
t acq
uisi
tion
and
diffe
renc
es in
acc
ount
ing
polic
ies.
The
tabl
e al
so re
conc
iles
the
sum
mar
ized
fina
ncia
l inf
orm
atio
n to
the
carry
ing
amou
nt o
f the
Gro
up’s
inte
rest
in th
ese
com
pani
es.
Asia
Offs
hore
Dril
ling
Lim
ited
Sino
Gra
ndne
ss F
ood
Indu
stry
Gro
up L
imite
dBa
ria S
erec
ePe
trolift
Inc.
For t
he y
ear
ende
dFo
r the
th
ree-
mon
thFo
r the
yea
r en
ded
For t
he
thre
e-m
onth
For t
he y
ear
ende
dFo
r the
th
ree-
mon
thFo
r the
yea
r en
ded
For t
he
thre
e-m
onth
31 D
ec 2
015
perio
d en
ded
31 D
ec 2
015
perio
d en
ded
31D
ec 2
015
perio
d en
ded
31 D
ec 2
015
perio
d en
ded
31 D
ec 2
014
31 D
ec 2
014*
31 D
ec 2
014
31 D
ec 2
014
(in m
illion
Bah
t)R
even
ue3,
901
1,16
418
,059
-65
917
21,
007
235
Prof
it (lo
ss) f
rom
con
tinui
ng o
pera
tions
(4,6
15)
658
713
-19
328
514
515
Oth
er c
ompr
ehen
sive
inco
me
--
--
--
--
Tota
l com
preh
ensi
ve in
com
e (e
xpen
se)
(4,6
15)
658
713
-19
328
514
515
Attri
buta
ble
to N
CI
--
--
--
--
Attri
buta
ble
to in
vest
ee’s
sha
reho
lder
s(4
,615
)65
871
3-
193
285
145
15
Asia
Offs
hore
Dril
ling
Lim
ited
Sino
Gra
ndne
ss F
ood
Indu
stry
Gro
up L
imite
dBa
ria S
erec
ePe
trolift
Inc.
2015
2014
2015
2014
2015
2014
2015
2014
(in m
illion
Bah
t)C
urre
nt a
sset
s3,
202
2,26
0-
8,92
880
033
874
350
2N
on-c
urre
nt a
sset
s17
,062
22,6
61-
5,00
395
196
42,
894
2,91
0C
urre
nt li
abilit
ies
(2,2
83)
(1,2
37)
-(4
,214
)(4
52)
(152
)(4
85)
(360
)N
on-c
urre
nt li
abilit
ies
(10,
100)
(10,
725)
-(1
07)
-(4
1)(1
,232
)(1
,131
)Ne
t ass
ets
7,88
112
,959
-9,
610
1,29
91,
109
1,92
01,
921
Attri
buta
ble
to N
CI
--
--
--
--
Attri
buta
ble
to in
vest
ee’s
sha
reho
lder
s7,
881
12,9
59-
9,61
01,
299
1,10
91,
920
1,92
1
*As
Sole
ado
acqu
ired
SGFI
on
30 D
ecem
ber 2
014,
then
, the
re is
no
prof
it sh
arin
g fro
m S
GFI
dur
ing
the
thre
e-m
onth
per
iod
ende
d 31
Dec
embe
r 201
4.
40
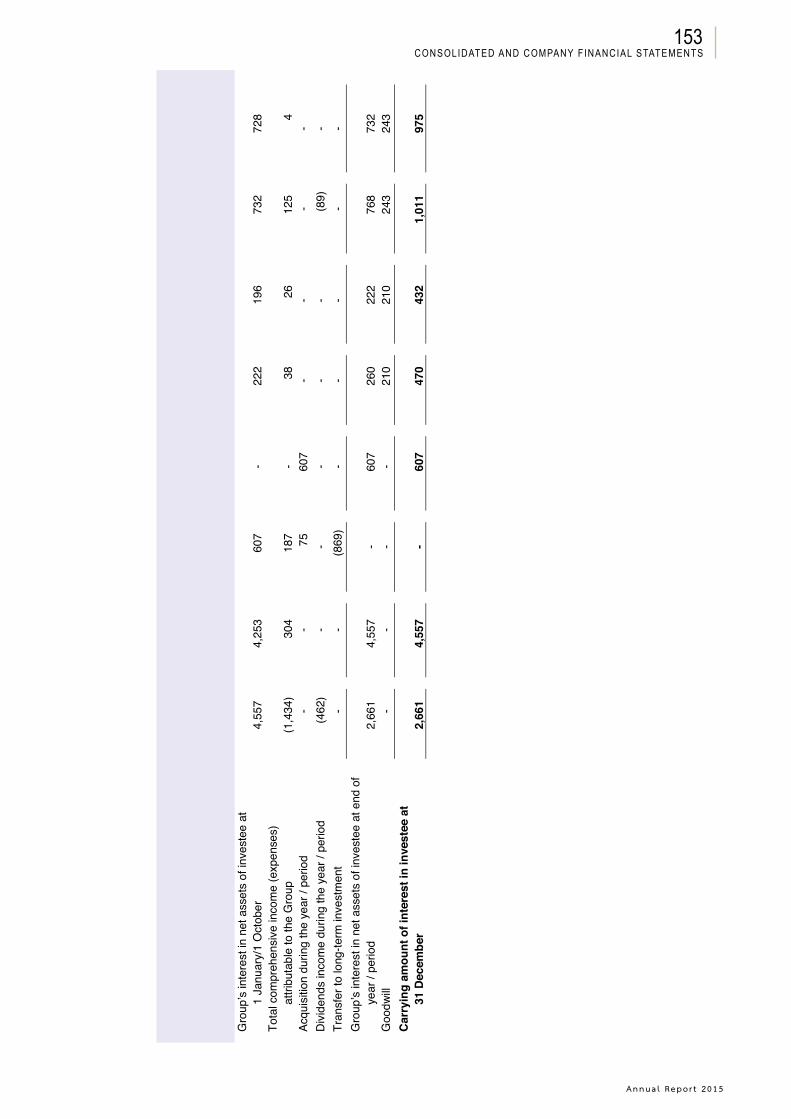
Annua l Repo r t 2015
Consolidated and Company FinanCial statements153
Thor
esen
Tha
i Age
ncie
s Pu
blic
Com
pany
Lim
ited
and
its S
ubsi
diar
ies
Note
s to
the
finan
cial
sta
tem
ents
Asia
Offs
hore
Dril
ling
Lim
ited
Sino
Gra
ndne
ss F
ood
Indu
stry
Gro
up L
imite
dBa
ria S
erec
e Pe
trolift
Inc.
2015
2014
2015
2014
2015
2014
2015
2014
(in m
illion
Bah
t)G
roup
’s in
tere
st in
net
ass
ets
of in
vest
ee a
t
1
Janu
ary/
1 O
ctob
er4,
557
4,25
360
7-
222
196
732
728
Tota
l com
preh
ensi
ve in
com
e (e
xpen
ses)
attri
buta
ble
to th
e G
roup
(1,4
34)
304
187
-38
2612
54
Acqu
isiti
on d
urin
g th
e ye
ar /
perio
d-
-75
607
--
--
Div
iden
ds in
com
e du
ring
the
year
/ pe
riod
(462
)-
--
--
(89)
-Tr
ansf
er to
long
-term
inve
stm
ent
--
(869
)-
--
--
Gro
up’s
inte
rest
in n
et a
sset
s of
inve
stee
at e
nd o
f ye
ar /
perio
d2,
661
4,55
7-
607
260
222
768
732
Goo
dwill
--
--
210
210
243
243
Carr
ying
am
ount
of i
nter
est i
n in
vest
ee a
t
31
Dec
embe
r2,
661
4,55
7-
607
470
432
1,01
197
5
41
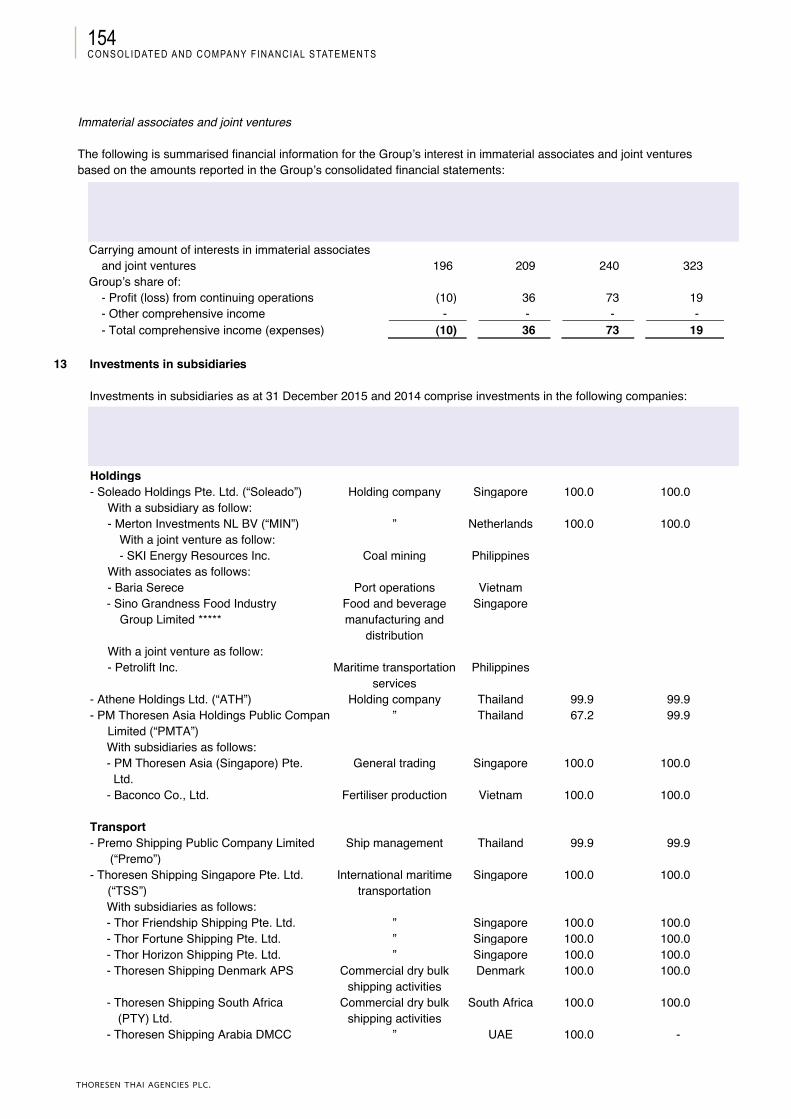
THORESEN THAI AGENCIES PLC.
Consolidated and Company FinanCial statements154
Thoresen Thai Agencies Public Company Limited and its SubsidiariesNotes to the financial statements
Immaterial associates and joint ventures
The following is summarised financial information for the Group’s interest in immaterial associates and joint ventures based on the amounts reported in the Group’s consolidated financial statements:
Immaterial Associates Immaterial Joint ventures2015 2014 2015 2014
(in million Baht)Carrying amount of interests in immaterial associates
and joint ventures 196 209 240 323Group’s share of:
- Profit (loss) from continuing operations (10) 36 73 19- Other comprehensive income - - - -- Total comprehensive income (expenses) (10) 36 73 19
13 Investments in subsidiaries
Investments in subsidiaries as at 31 December 2015 and 2014 comprise investments in the following companies:
Nature of Country of % Ownership interestName of subsidiaries Business incorporation 2015 2014
Holdings- Soleado Holdings Pte. Ltd. (“Soleado”) Holding company Singapore 100.0 100.0
With a subsidiary as follow:- Merton Investments NL BV (“MIN”) ” Netherlands 100.0 100.0
With a joint venture as follow:- SKI Energy Resources Inc. Coal mining Philippines
With associates as follows:- Baria Serece Port operations Vietnam- Sino Grandness Food Industry Food and beverage Singapore
Group Limited ***** manufacturing anddistribution
With a joint venture as follow:- Petrolift Inc. Maritime transportation
servicesPhilippines
- Athene Holdings Ltd. (“ATH”) Holding company Thailand 99.9 99.9- PM Thoresen Asia Holdings Public Company
Limited (“PMTA”)” Thailand 67.2 99.9
With subsidiaries as follows:- PM Thoresen Asia (Singapore) Pte.
Ltd. General trading Singapore 100.0 100.0
- Baconco Co., Ltd. Fertiliser production Vietnam 100.0 100.0
Transport- Premo Shipping Public Company Limited (“Premo”)
Ship management Thailand 99.9 99.9
- Thoresen Shipping Singapore Pte. Ltd. International maritime Singapore 100.0 100.0(“TSS”) transportationWith subsidiaries as follows:- Thor Friendship Shipping Pte. Ltd. ” Singapore 100.0 100.0- Thor Fortune Shipping Pte. Ltd. ” Singapore 100.0 100.0- Thor Horizon Shipping Pte. Ltd. ” Singapore 100.0 100.0- Thoresen Shipping Denmark APS Commercial dry bulk Denmark 100.0 100.0
shipping activities- Thoresen Shipping South Africa Commercial dry bulk South Africa 100.0 100.0
(PTY) Ltd. shipping activities- Thoresen Shipping Arabia DMCC ” UAE 100.0 -
42

Annua l Repo r t 2015
Consolidated and Company FinanCial statements155
Thoresen Thai Agencies Public Company Limited and its SubsidiariesNotes to the financial statements
Nature of Country of % Ownership interestName of subsidiaries Business incorporation 2015 2014
Transport (continued)- Thoresen & Company (Bangkok) Limited
Ship management Thailand 99.9 99.9
- Thoresen Chartering (HK) Ltd.** International maritime Hong Kong 99.9 99.9transportation
- Thoresen Shipping Germany GmbH ” Germany 100.0 100.0- Herakles Shipping Co., Ltd.* ” Thailand 99.9 99.9- Heron Shipping Co., Ltd.* ” Thailand 99.9 99.9- Thoresen Chartering (PTE) Ltd.** Ship brokerage Singapore 100.0 100.0- PMFB Ltd. (formerly Thoresen Service Center Ltd.)****
Service provider Thailand - 99.9
- Asia Coating Services Ltd.** Coating services Thailand 99.9 99.9- Thoresen Shipping FZE Ship agency UAE 100.0 100.0
With an associate as follow:- Sharjah Ports Services LLC Port operations UAE
Energy- Mermaid Maritime Public Company Limited Offshore services Thailand 58.2 57.8
(“MMPLC”) investmentsWith subsidiaries as follows:- Mermaid Subsea Services (Thailand) Subsea service provider, Thailand 100.0 100.0
Ltd. diving, ROV services and subsea contractor
to the offshore oiland gas industry
With subsidiaries as follows:- Seascape Surveys (Thailand) Ltd. Subsea service
provider, hydrographicsurvey and positioning
to the offshore oiland gas industry
Thailand 100.0 100.0
- Seascape Surveys Pte. Ltd. ” Singapore 100.0 100.0With a subsidiary as follow:- PT Seascape Surveys Indonesia*** ” Indonesia 49.0 49.0
- Mermaid Offshore Services Pte. Ltd. Subsea service provider,diving, ROV services
and subsea contractor to the offshore oil and gas
industry
Singapore 100.0 100.0
- Mermaid Drilling Ltd. Production and exploration drilling
services
Thailand 95.0 95.0
With subsidiaries as follows:- MTR-1 Ltd. Drilling services Thailand 95.0 95.0- MTR-2 Ltd. ” Thailand 95.0 95.0- Mermaid Drilling (Malaysia) Sdn. Bhd. ” Malaysia 95.0 95.0- MTR-1 (Singapore) Pte. Ltd. ” Singapore 95.0 95.0- MTR-2 (Singapore) Pte. Ltd. ” Singapore 95.0 95.0
- Mermaid Drilling (Singapore) Pte. Ltd. Production and exploration drilling
services
Singapore 100.0 100.0
- MTR-3 (Singapore) Pte. Ltd. Production and exploration drilling
services
Singapore 100.0 100.0
- MTR-4 (Singapore) Pte. Ltd. ” Singapore 100.0 100.0- Mermaid MTN Pte. Ltd. ” Singapore 100.0 100.0
43
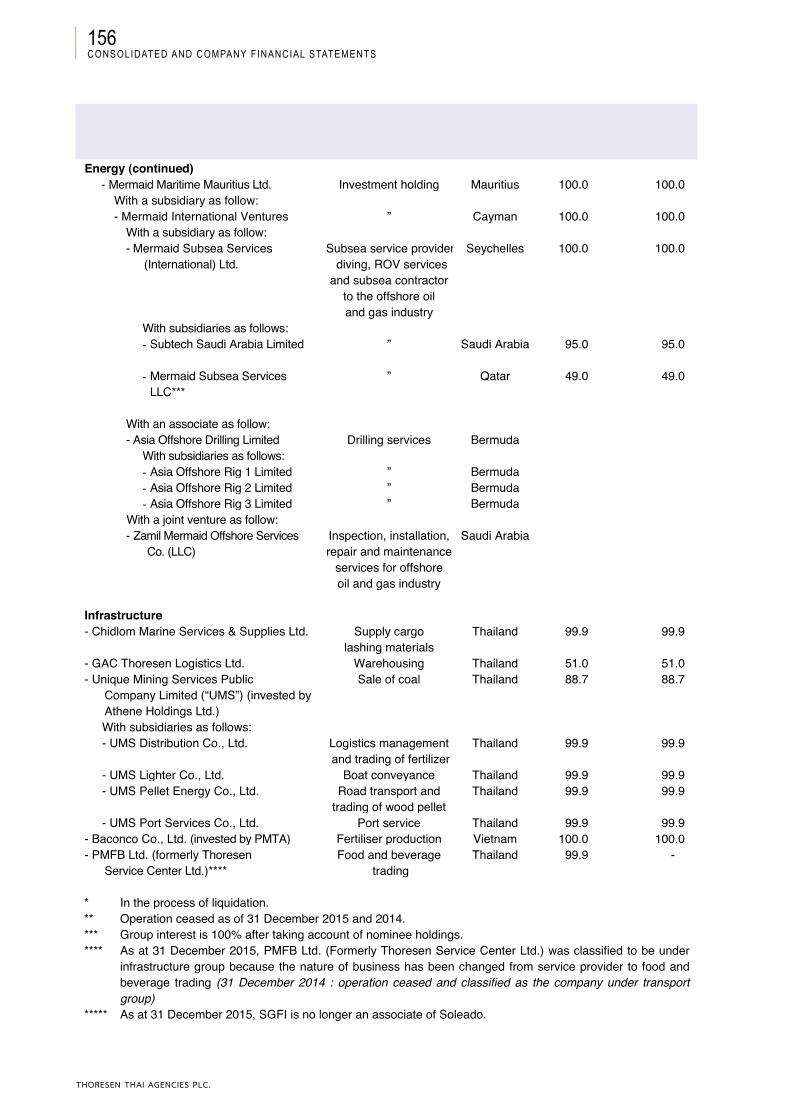
THORESEN THAI AGENCIES PLC.
Consolidated and Company FinanCial statements156
Thoresen Thai Agencies Public Company Limited and its SubsidiariesNotes to the financial statements
Nature of Country of % Ownership interestName of subsidiaries Business incorporation 2015 2014
Energy (continued)- Mermaid Maritime Mauritius Ltd. Investment holding Mauritius 100.0 100.0
With a subsidiary as follow:- Mermaid International Ventures ” Cayman 100.0 100.0
With a subsidiary as follow:- Mermaid Subsea Services
(International) Ltd. Subsea service provider
diving, ROV servicesSeychelles 100.0 100.0
and subsea contractorto the offshore oiland gas industry
With subsidiaries as follows:- Subtech Saudi Arabia Limited ” Saudi Arabia 95.0 95.0
- Mermaid Subsea Services LLC***
” Qatar 49.0 49.0
With an associate as follow:- Asia Offshore Drilling Limited
With subsidiaries as follows:Drilling services Bermuda
- Asia Offshore Rig 1 Limited ” Bermuda- Asia Offshore Rig 2 Limited ” Bermuda- Asia Offshore Rig 3 Limited ” Bermuda
With a joint venture as follow:- Zamil Mermaid Offshore Services Co. (LLC)
Inspection, installation, repair and maintenance
services for offshore oil and gas industry
Saudi Arabia
Infrastructure- Chidlom Marine Services & Supplies Ltd. Supply cargo Thailand 99.9 99.9
lashing materials- GAC Thoresen Logistics Ltd. Warehousing Thailand 51.0 51.0- Unique Mining Services Public Sale of coal Thailand 88.7 88.7 Company Limited (“UMS”) (invested by Athene Holdings Ltd.)
With subsidiaries as follows:- UMS Distribution Co., Ltd. Logistics management
and trading of fertilizerThailand 99.9 99.9
- UMS Lighter Co., Ltd. Boat conveyance Thailand 99.9 99.9- UMS Pellet Energy Co., Ltd. Road transport and
trading of wood pelletThailand 99.9 99.9
- UMS Port Services Co., Ltd. Port service Thailand 99.9 99.9- Baconco Co., Ltd. (invested by PMTA) Fertiliser production Vietnam 100.0 100.0- PMFB Ltd. (formerly Thoresen Service Center Ltd.)****
Food and beveragetrading
Thailand 99.9 -
* In the process of liquidation.** Operation ceased as of 31 December 2015 and 2014.*** Group interest is 100% after taking account of nominee holdings.**** As at 31 December 2015, PMFB Ltd. (Formerly Thoresen Service Center Ltd.) was classified to be under
infrastructure group because the nature of business has been changed from service provider to food and beverage trading (31 December 2014 : operation ceased and classified as the company under transport group)
***** As at 31 December 2015, SGFI is no longer an associate of Soleado.
44
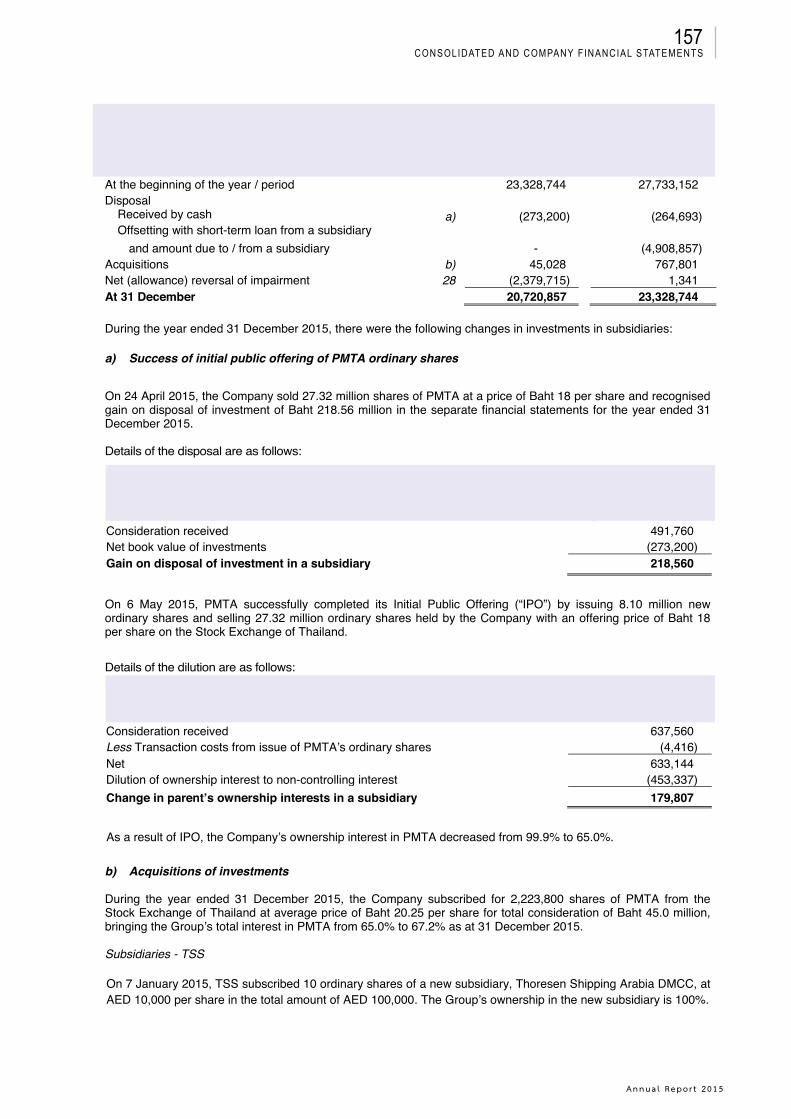
Annua l Repo r t 2015
Consolidated and Company FinanCial statements157
Thoresen Thai Agencies Public Company Limited and its SubsidiariesNotes to the financial statements
Separatefinancial statements
Note 2015 2014(in thousand Baht)
At the beginning of the year / period 23,328,744 27,733,152Disposal
Received by cash a) (273,200) (264,693)Offsetting with short-term loan from a subsidiary
and amount due to / from a subsidiary - (4,908,857)Acquisitions b) 45,028 767,801Net (allowance) reversal of impairment 28 (2,379,715) 1,341At 31 December 20,720,857 23,328,744
During the year ended 31 December 2015, there were the following changes in investments in subsidiaries:
a) Success of initial public offering of PMTA ordinary shares
On 24 April 2015, the Company sold 27.32 million shares of PMTA at a price of Baht 18 per share and recognised gain on disposal of investment of Baht 218.56 million in the separate financial statements for the year ended 31 December 2015.
Details of the disposal are as follows:
Separatefinancial statements
(in thousand Baht)Consideration received 491,760Net book value of investments (273,200)Gain on disposal of investment in a subsidiary 218,560
On 6 May 2015, PMTA successfully completed its Initial Public Offering (“IPO”) by issuing 8.10 million new ordinary shares and selling 27.32 million ordinary shares held by the Company with an offering price of Baht 18 per share on the Stock Exchange of Thailand.
Details of the dilution are as follows:Consolidated
financial statements(in thousand Baht)
Consideration received 637,560Less Transaction costs from issue of PMTA’s ordinary shares (4,416)Net 633,144Dilution of ownership interest to non-controlling interest (453,337)Change in parent’s ownership interests in a subsidiary 179,807
As a result of IPO, the Company’s ownership interest in PMTA decreased from 99.9% to 65.0%.
b) Acquisitions of investments
During the year ended 31 December 2015, the Company subscribed for 2,223,800 shares of PMTA from the Stock Exchange of Thailand at average price of Baht 20.25 per share for total consideration of Baht 45.0 million, bringing the Group’s total interest in PMTA from 65.0% to 67.2% as at 31 December 2015.
Subsidiaries - TSS
On 7 January 2015, TSS subscribed 10 ordinary shares of a new subsidiary, Thoresen Shipping Arabia DMCC, at AED 10,000 per share in the total amount of AED 100,000. The Group’s ownership in the new subsidiary is 100%.
45
THORESEN THAI AGENCIES PLC.
Consolidated and Company FinanCial statements158
Thoresen Thai Agencies Public Company Limited and its SubsidiariesNotes to the financial statements
Subsidiaries - Soleado
During the year ended 31 December 2015, Soleado subscribed for 5,603,900 shares of MMPLC from the Stock Exchange of Singapore at average price of SGD 0.20 per share for total consideration of SGD 1.1 million, or Baht 27.6 million, bringing the Group’s total interest in MMPLC from 57.8% as at 31 December 2014 to 58.2% as at 31 December 2015.
46
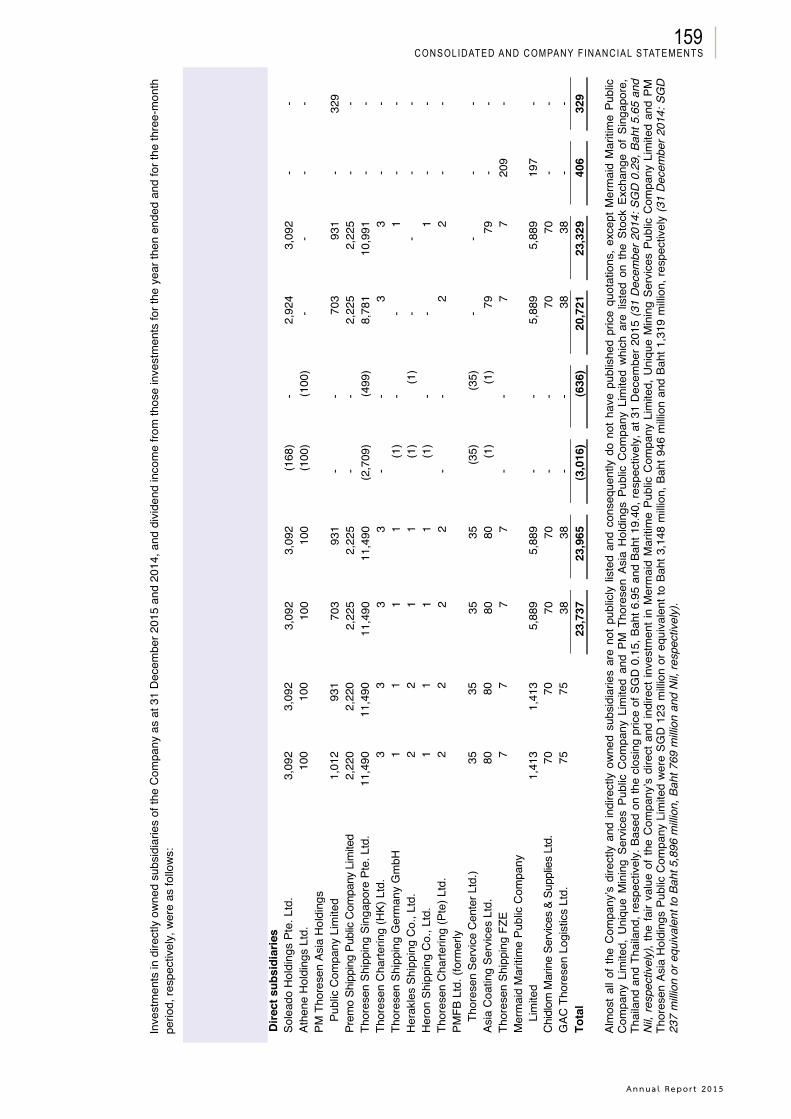
Annua l Repo r t 2015
Consolidated and Company FinanCial statements159
Thor
esen
Tha
i Age
ncie
s Pu
blic
Com
pany
Lim
ited
and
its S
ubsi
diar
ies
Not
es to
the
finan
cial
sta
tem
ents
Inve
stm
ents
indi
rect
ly o
wne
dsu
bsid
iarie
sof
the
Com
pany
as a
t 31
Dec
embe
r201
5 an
d 20
14, a
nd d
ivid
end
inco
me
from
thos
e in
vest
men
ts fo
r the
yea
rthe
n en
ded
and
for t
he th
ree-
mon
th
perio
d,re
spec
tivel
y,w
ere
as fo
llow
s:
Sepa
rate
fina
ncia
l st
atem
ents
Nam
e of
sub
sidi
arie
sPa
id-u
p ca
pita
lC
ost
Impa
irmen
tAt
cos
t -ne
tD
ivid
end
inco
me
2015
2014
2015
2014
2015
2014
2015
2014
2015
2014
(in m
illion
Bah
t)D
irect
sub
sidi
arie
sSo
lead
o H
oldi
ngs
Pte.
Ltd
.3,
092
3,09
23,
092
3,09
2(1
68)
-2,
924
3,09
2-
-At
hene
Hol
ding
s Lt
d.10
010
010
010
0(1
00)
(100
)-
--
-PM
Tho
rese
n As
ia H
oldi
ngs
Publ
ic C
ompa
ny L
imite
d1,
012
931
703
931
--
703
931
-32
9Pr
emo
Ship
ping
Pub
lic C
ompa
ny L
imite
d2,
220
2,22
02,
225
2,22
5-
-2,
225
2,22
5-
-Th
ores
en S
hipp
ing
Sing
apor
e Pt
e. L
td.
11,4
9011
,490
11,4
9011
,490
(2,7
09)
(499
)8,
781
10,9
91-
-Th
ores
en C
harte
ring
(HK)
Ltd
.3
33
3-
-3
3-
-Th
ores
en S
hipp
ing
Ger
man
y G
mbH
11
11
(1)
--
1-
-H
erak
les
Ship
ping
Co.
, Ltd
.2
21
1(1
)(1
)-
--
-H
eron
Shi
ppin
g C
o., L
td.
11
11
(1)
--
1-
-Th
ores
en C
harte
ring
(Pte
) Ltd
.2
22
2-
-2
2-
-PM
FB L
td. (
form
erly
Thor
esen
Serv
ice
Cen
ter L
td.)
3535
3535
(35)
(35)
--
--
Asia
Coa
ting
Serv
ices
Ltd
.80
8080
80(1
)(1
)79
79-
-Th
ores
en S
hipp
ing
FZE
77
77
--
77
209
-M
erm
aid
Mar
itim
e Pu
blic
Com
pany
Li
mite
d1,
413
1,41
35,
889
5,88
9-
-5,
889
5,88
919
7-
Chi
dlom
Mar
ine
Serv
ices
& Su
pplie
s Lt
d.70
7070
70-
-70
70-
-G
AC T
hore
sen
Logi
stic
s Lt
d.75
7538
38-
-38
38-
-To
tal
23,7
3723
,965
(3,0
16)
(636
)20
,721
23,3
2940
632
9
Alm
ost a
ll of
the
Com
pany
’s d
irect
ly a
nd in
dire
ctly
ow
ned
subs
idia
ries
are
not p
ublic
ly li
sted
and
con
sequ
ently
do
not h
ave
publ
ishe
d pr
ice
quot
atio
ns, e
xcep
t Mer
mai
d M
ariti
me
Publ
ic
Com
pany
Lim
ited,
Uni
que
Min
ing
Serv
ices
Pub
lic C
ompa
ny L
imite
d an
d PM
Tho
rese
n As
ia H
oldi
ngs
Publ
ic C
ompa
ny L
imite
d w
hich
are
liste
d on
the
Sto
ck E
xcha
nge
of S
inga
pore
, Th
aila
nd a
nd T
haila
nd, r
espe
ctiv
ely.
Bas
ed o
n th
e cl
osin
g pr
ice
of S
GD
0.1
5, B
aht6
.95
and
Baht
19.4
0, re
spec
tivel
y, a
t 31
Dec
embe
r 201
5 (3
1 D
ecem
ber 2
014:
SG
D 0
.29,
Bah
t 5.6
5 an
d N
il, r
espe
ctiv
ely)
, the
fair
valu
e of
the
Com
pany
’s d
irect
and
indi
rect
inve
stm
ent i
n M
erm
aid
Mar
itim
e Pu
blic
Com
pany
Lim
ited,
Uni
que
Min
ing
Serv
ices
Pub
lic C
ompa
ny L
imite
d an
d PM
Th
ores
en A
sia
Hol
ding
s Pu
blic
Com
pany
Lim
ited
wer
e SG
D 1
23m
illion
or e
quiv
alen
t to
Baht
3,1
48 m
illion
, Bah
t 946
milli
on a
nd B
aht 1
,319
milli
on, r
espe
ctiv
ely
(31
Dec
embe
r 201
4: S
GD
23
7 m
illion
or e
quiv
alen
t to
Baht
5,8
96 m
illion
, Bah
t 769
milli
on a
nd N
il, re
spec
tivel
y).
47
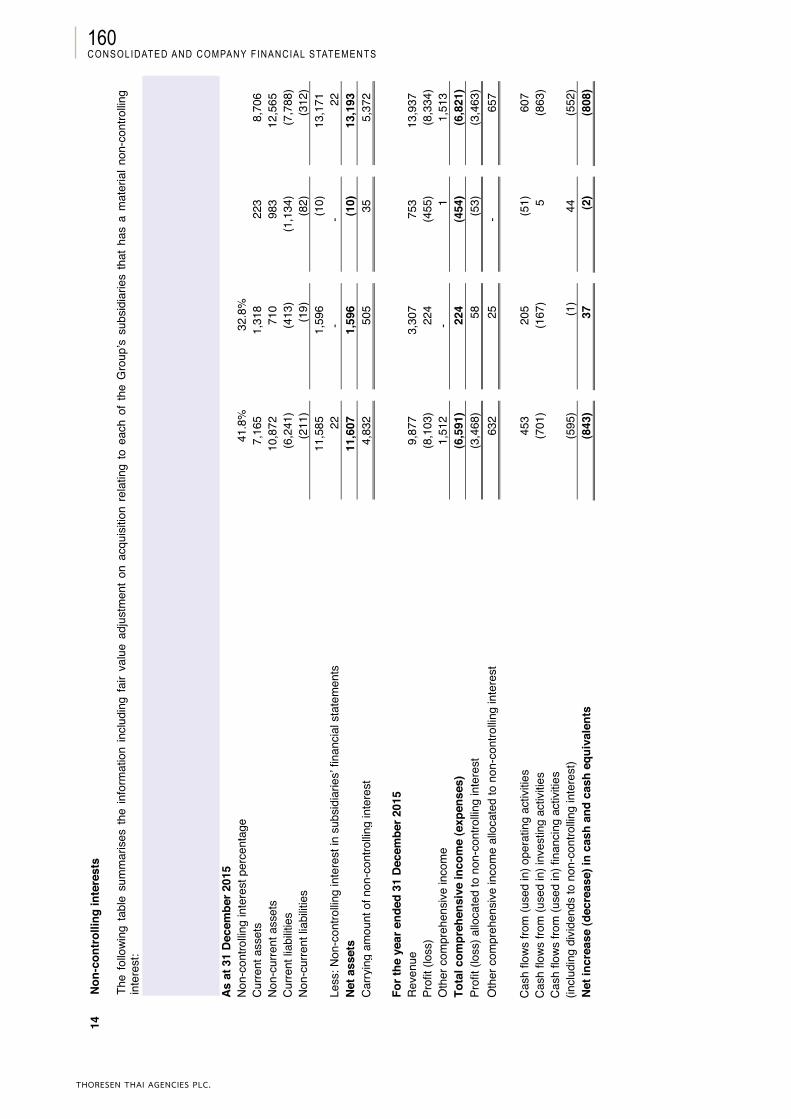
THORESEN THAI AGENCIES PLC.
Consolidated and Company FinanCial statements160Th
ores
en T
hai A
genc
ies
Publ
ic C
ompa
ny L
imite
d an
d its
Sub
sidi
arie
sNo
tes
to th
e fin
anci
al s
tate
men
ts
14No
n-co
ntro
lling
inte
rest
s
The
follo
wing
tabl
e su
mm
aris
es th
e in
form
atio
n in
clud
ing
fair
valu
e ad
just
men
t on
acqu
isiti
on r
elat
ing
to e
ach
of th
e G
roup
’s s
ubsi
diar
ies
that
has
a m
ater
ial n
on-c
ontro
lling
inte
rest
:
MM
PLC
PMTA
Oth
er
indi
vidu
ally
imm
ater
ial
subs
idia
ries
Tota
l(in
milli
on B
aht)
As a
t 31
Dec
embe
r 201
5N
on-c
ontro
lling
inte
rest
per
cent
age
41.8
%32
.8%
Cur
rent
ass
ets
7,16
51,
318
223
8,70
6N
on-c
urre
nt a
sset
s10
,872
710
983
12,5
65C
urre
nt li
abilit
ies
(6,2
41)
(413
)(1
,134
)(7
,788
)N
on-c
urre
nt li
abilit
ies
(211
)(1
9)(8
2)(3
12)
11,5
851,
596
(10)
13,1
71Le
ss: N
on-c
ontro
lling
inte
rest
in s
ubsi
diar
ies’
fina
ncia
l sta
tem
ents
22-
-22
Net a
sset
s11
,607
1,59
6(1
0)13
,193
Car
ryin
g am
ount
of n
on-c
ontro
lling
inte
rest
4,83
250
535
5,37
2
For t
he y
ear e
nded
31
Dece
mbe
r 201
5R
even
ue9,
877
3,30
775
313
,937
Prof
it(lo
ss)
(8,1
03)
224
(455
)(8
,334
)O
ther
com
preh
ensi
ve in
com
e1,
512
-1
1,51
3To
tal c
ompr
ehen
sive
inco
me
(exp
ense
s)(6
,591
)22
4(4
54)
(6,8
21)
Prof
it (lo
ss) a
lloca
ted
to n
on-c
ontro
lling
inte
rest
(3,4
68)
58(5
3)(3
,463
)O
ther
com
preh
ensi
ve in
com
e al
loca
ted
to n
on-c
ontro
lling
inte
rest
63
225
-65
7
Cas
h flo
ws fr
om (u
sed
in) o
pera
ting
activ
ities
45
320
5(5
1)60
7C
ash
flows
from
(use
d in
) inv
estin
g ac
tiviti
es
(701
)(1
67)
5(8
63)
Cas
h flo
ws fr
om (u
sed
in) f
inan
cing
act
iviti
es
(incl
udin
g di
vide
nds
to n
on-c
ontro
lling
inte
rest
)(5
95)
(1)
44(5
52)
Net i
ncre
ase
(dec
reas
e) in
cas
h an
d ca
sh e
quiv
alen
ts(8
43)
37(2
)(8
08)
48
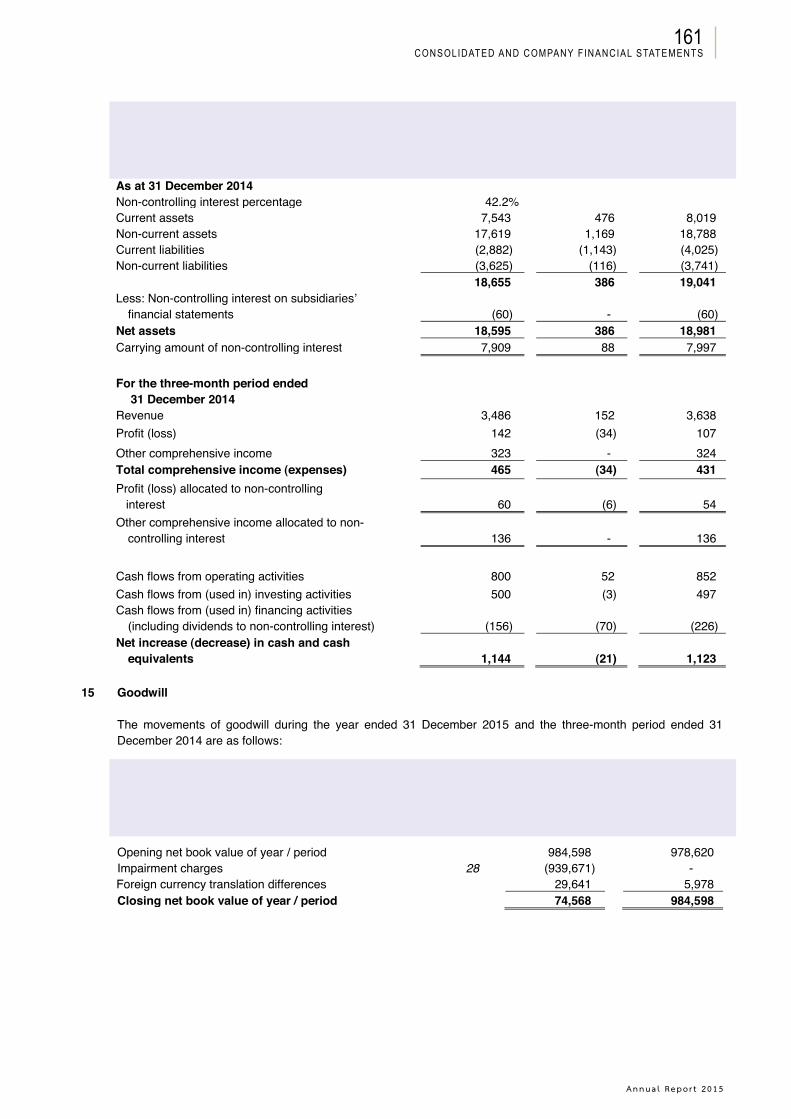
Annua l Repo r t 2015
Consolidated and Company FinanCial statements161
Thoresen Thai Agencies Public Company Limited and its SubsidiariesNotes to the financial statements
MMPLC
Other individually immaterial
subsidiaries Total(in million Baht)
As at 31 December 2014Non-controlling interest percentage 42.2%Current assets 7,543 476 8,019Non-current assets 17,619 1,169 18,788Current liabilities (2,882) (1,143) (4,025)Non-current liabilities (3,625) (116) (3,741)
18,655 386 19,041Less: Non-controlling interest on subsidiaries’
financial statements (60) - (60)Net assets 18,595 386 18,981Carrying amount of non-controlling interest 7,909 88 7,997
For the three-month period ended 31 December 2014
Revenue 3,486 152 3,638Profit (loss) 142 (34) 107Other comprehensive income 323 - 324Total comprehensive income (expenses) 465 (34) 431Profit (loss) allocated to non-controlling
interest 60 (6) 54Other comprehensive income allocated to non-
controlling interest 136 - 136
Cash flows from operating activities 800 52 852Cash flows from (used in) investing activities 500 (3) 497Cash flows from (used in) financing activities
(including dividends to non-controlling interest) (156) (70) (226)Net increase (decrease) in cash and cash
equivalents 1,144 (21) 1,123
15 Goodwill
The movements of goodwill during the year ended 31 December 2015 and the three-month period ended 31 December 2014 are as follows:
Consolidated financial statements
Note 2015 2014(in thousand Baht)
Opening net book value of year / period 984,598 978,620Impairment charges 28 (939,671) -Foreign currency translation differences 29,641 5,978Closing net book value of year / period 74,568 984,598
49
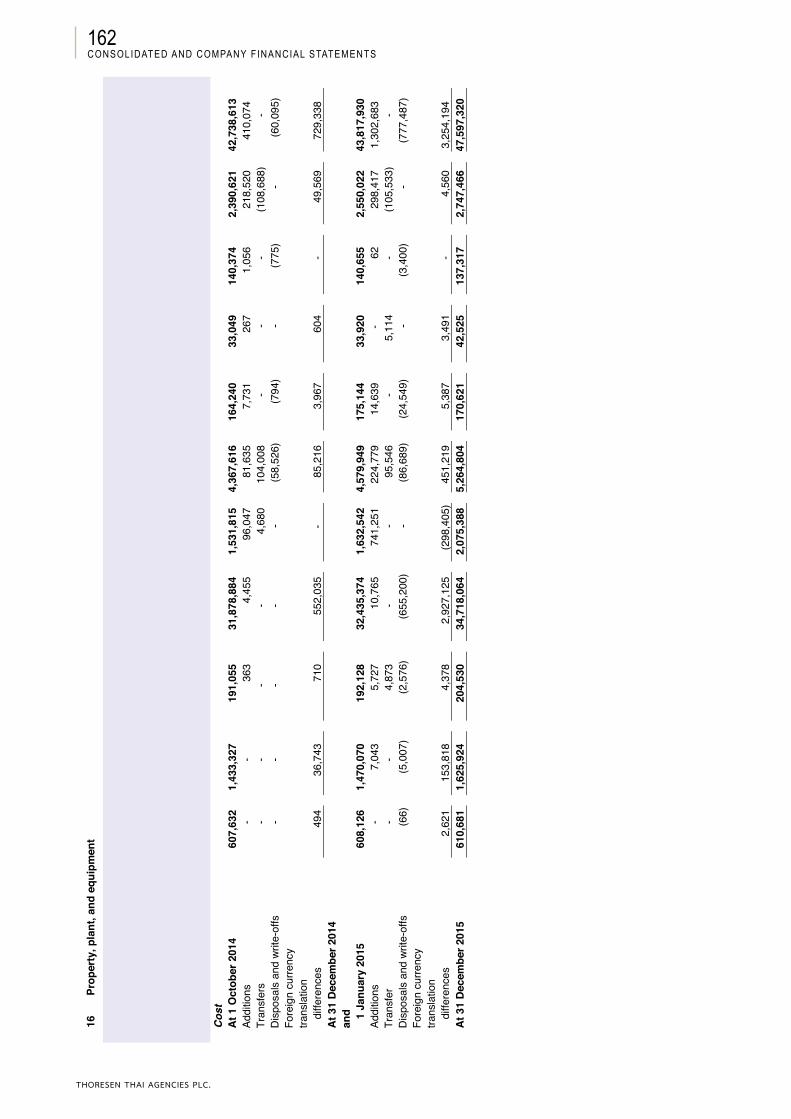
THORESEN THAI AGENCIES PLC.
Consolidated and Company FinanCial statements162Th
ores
en T
hai A
genc
ies
Publ
ic C
ompa
ny L
imite
d an
d its
Sub
sidi
arie
sNo
tes
to th
e fin
anci
al s
tate
men
ts
16Pr
oper
ty, p
lant
,and
equ
ipm
ent
Cons
olid
ated
fina
ncia
l sta
tem
ents
Furn
iture
,O
cean
vess
els,
fixtu
res,
Build
ings
supp
ort v
esse
ls,m
achi
nery
,an
dBu
ildin
gsu
pply
vess
els,
and
Mot
orM
otor
Con
stru
ctio
nLa
ndfa
ctor
ies
impr
ovem
ents
and
tend
er ri
gsDr
y-do
ckin
geq
uipm
ent
vehi
cles
laun
ches
Barg
esin
pro
gres
sTo
tal
(in th
ousa
nd B
aht)
Cost
At 1
Oct
ober
201
460
7,63
21,
433,
327
191,
055
31,8
78,8
841,
531,
815
4,36
7,61
616
4,24
033
,049
140,
374
2,39
0,62
142
,738
,613
Addi
tions
--
363
4,45
596
,047
81,6
357,
731
267
1,05
621
8,52
041
0,07
4Tr
ansf
ers
--
--
4,68
010
4,00
8-
--
(108
,688
)-
Dis
posa
ls a
nd w
rite-
offs
--
--
-(5
8,52
6)(7
94)
-(7
75)
-(6
0,09
5)Fo
reig
n cu
rrenc
y tra
nsla
tion
diffe
renc
es49
436
,743
710
552,
035
-85
,216
3,96
760
4-
49,5
6972
9,33
8At
31
Dec
embe
r 201
4 an
d 1 Ja
nuar
y 20
1560
8,12
61,
470,
070
192,
128
32,4
35,3
741,
632,
542
4,57
9,94
917
5,14
433
,920
140,
655
2,55
0,02
243
,817
,930
Addi
tions
-7,
043
5,72
710
,765
741,
251
224,
779
14,6
39-
6229
8,41
71,
302,
683
Tran
sfer
--
4,87
3-
-95
,546
-5,
114
-(1
05,5
33)
-D
ispo
sals
and
writ
e-of
fs(6
6)(5
,007
)(2
,576
)(6
55,2
00)
-(8
6,68
9)(2
4,54
9)-
(3,4
00)
-(7
77,4
87)
Fore
ign
curre
ncy
trans
latio
n di
ffere
nces
2,62
115
3,81
84,
378
2,92
7,12
5(2
98,4
05)
451,
219
5,38
73,
491
-4,
560
3,25
4,19
4At
31
Dec
embe
r 201
561
0,68
11,
625,
924
204,
530
34,7
18,0
642,
075,
388
5,26
4,80
417
0,62
142
,525
137,
317
2,74
7,46
647
,597
,320
50
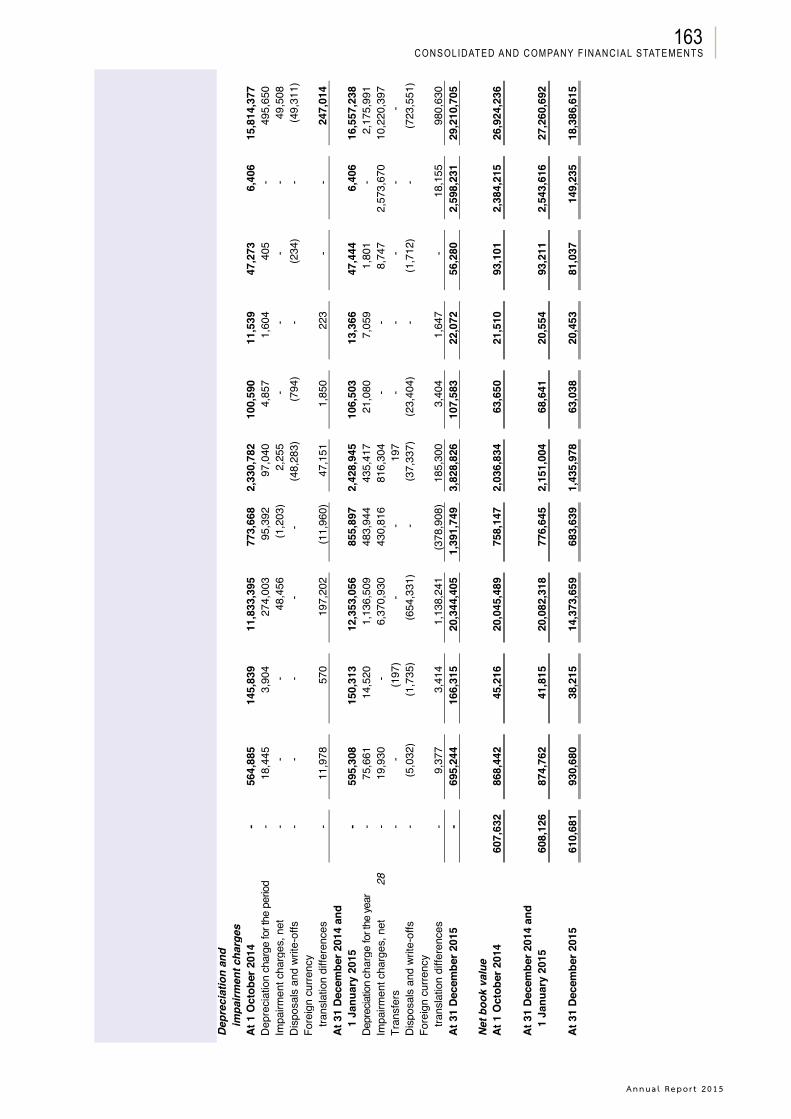
Annua l Repo r t 2015
Consolidated and Company FinanCial statements163
Thor
esen
Tha
i Age
ncie
s Pu
blic
Com
pany
Lim
ited
and
its S
ubsi
diar
ies
Note
s to
the
finan
cial
sta
tem
ents
Con
solid
ated
fina
ncia
l sta
tem
ents
Furn
iture
,Fu
rnitu
re,
Oce
an ve
ssels
,fix
ture
s,Bu
ildin
gssu
ppor
t ves
sels,
mac
hine
ry,
and
Build
ing
supp
ly ve
ssel
s,an
dM
otor
Mot
orC
onst
ruct
ion
Not
eLa
ndfa
ctor
ies
impr
ovem
ents
and
tend
er ri
gsDr
y-do
ckin
geq
uipm
ent
vehi
cles
laun
ches
Barg
esin
pro
gres
sTo
tal
(in th
ousa
nd B
aht)
Depr
ecia
tion
and
impa
irmen
t cha
rges
At 1
Oct
ober
201
4-
564,
885
145,
839
11,8
33,3
9577
3,66
82,
330,
782
100,
590
11,5
3947
,273
6,40
615
,814
,377
Dep
reci
atio
nch
arge
for t
he p
eriod
-
18,4
453,
904
274,
003
95,3
9297
,040
4,85
71,
604
405
-49
5,65
0Im
pairm
ent c
harg
es, n
et-
--
48,4
56(1
,203
)2,
255
--
--
49,5
08D
ispo
sals
and
writ
e-of
fs-
--
--
(48,
283)
(794
)-
(234
)-
(49,
311)
Fore
ign
curre
ncy
trans
latio
n di
ffere
nces
-11
,978
570
197,
202
(11,
960)
47,1
511,
850
223
--
247,
014
At 3
1 De
cem
ber 2
014
and
1 Ja
nuar
y 20
15-
595,
308
150,
313
12,3
53,0
5685
5,89
72,
428,
945
106,
503
13,3
6647
,444
6,40
616
,557
,238
Depr
eciat
ion c
harg
efo
r the
year
-75
,661
14,5
201,
136,
509
483,
944
435,
417
21,0
807,
059
1,80
1-
2,17
5,99
1Im
pairm
ent c
harg
es, n
et28
-19
,930
-6,
370,
930
430,
816
816,
304
--
8,74
72,
573,
670
10,2
20,3
97Tr
ansf
ers
--
(197
)-
-19
7-
--
--
Dis
posa
ls a
nd w
rite-
offs
-(5
,032
)(1
,735
)(6
54,3
31)
-(3
7,33
7)(2
3,40
4)-
(1,7
12)
-(7
23,5
51)
Fore
ign
curre
ncy
trans
latio
n di
ffere
nces
-9,
377
3,41
41,
138,
241
(378
,908
)18
5,30
03,
404
1,64
7-
18,1
5598
0,63
0At
31
Dece
mbe
r 201
5-
695,
244
166,
315
20,3
44,4
051,
391,
749
3,82
8,82
610
7,58
322
,072
56,2
802,
598,
231
29,2
10,7
05
Net b
ook
valu
eAt
1 O
ctob
er 2
014
607,
632
868,
442
45,2
1620
,045
,489
758,
147
2,03
6,83
463
,650
21,5
1093
,101
2,38
4,21
526
,924
,236
At 3
1 De
cem
ber 2
014
and
1 Ja
nuar
y 20
1560
8,12
687
4,76
241
,815
20,0
82,3
1877
6,64
52,
151,
004
68,6
4120
,554
93,2
112,
543,
616
27,2
60,6
92
At 3
1 De
cem
ber 2
015
610,
681
930,
680
38,2
1514
,373
,659
683,
639
1,43
5,97
863
,038
20,4
5381
,037
149,
235
18,3
86,6
15
51
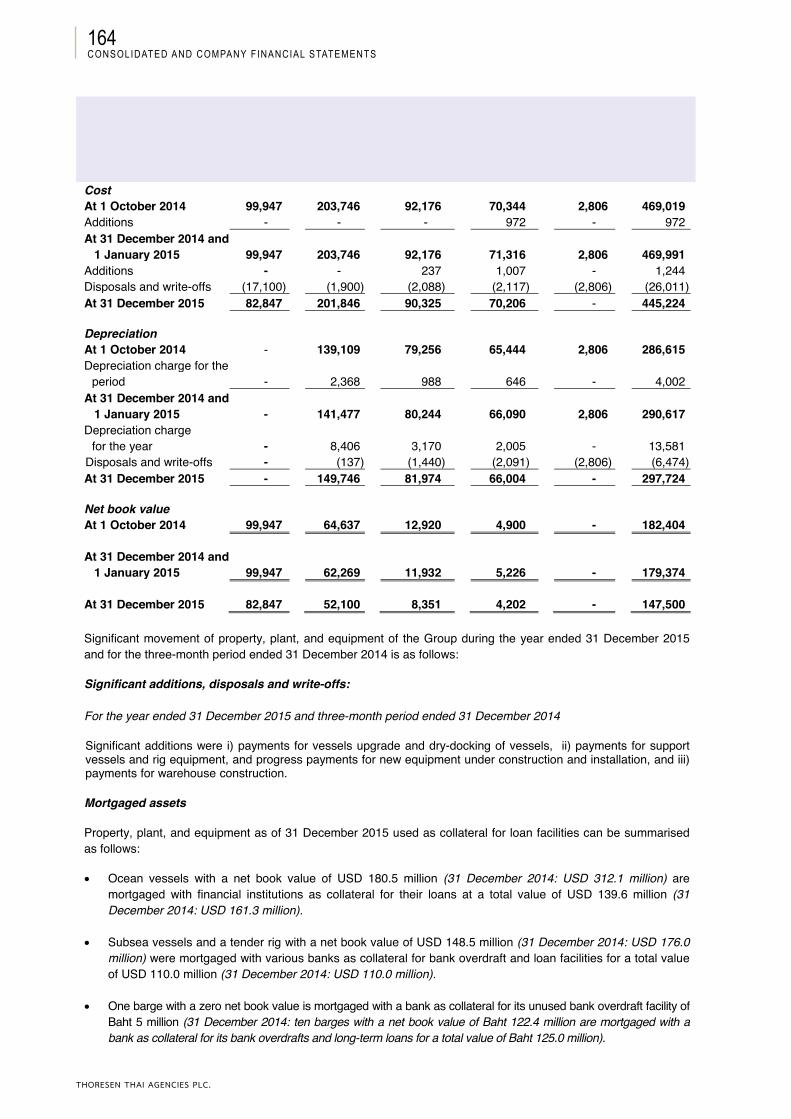
THORESEN THAI AGENCIES PLC.
Consolidated and Company FinanCial statements164
Thoresen Thai Agencies Public Company Limited and its SubsidiariesNotes to the financial statements
Separate financial statementsFurniture,
Building fixtures, and MotorLand Buildings improvements equipment vehicles Total
(in thousand Baht)CostAt 1 October 2014 99,947 203,746 92,176 70,344 2,806 469,019Additions - - - 972 - 972At 31 December 2014 and
1 January 2015 99,947 203,746 92,176 71,316 2,806 469,991Additions - - 237 1,007 - 1,244Disposals and write-offs (17,100) (1,900) (2,088) (2,117) (2,806) (26,011)At 31 December 2015 82,847 201,846 90,325 70,206 - 445,224
Depreciation At 1 October 2014 - 139,109 79,256 65,444 2,806 286,615Depreciation charge for the
period - 2,368 988 646 - 4,002At 31 December 2014 and
1 January 2015 - 141,477 80,244 66,090 2,806 290,617Depreciation charge
for the year - 8,406 3,170 2,005 - 13,581Disposals and write-offs - (137) (1,440) (2,091) (2,806) (6,474)At 31 December 2015 - 149,746 81,974 66,004 - 297,724
Net book valueAt 1 October 2014 99,947 64,637 12,920 4,900 - 182,404
At 31 December 2014 and 1 January 2015 99,947 62,269 11,932 5,226 - 179,374
At 31 December 2015 82,847 52,100 8,351 4,202 - 147,500
Significant movement of property, plant, and equipment of the Group during the year ended 31 December 2015 and for the three-month period ended 31 December 2014 is as follows:
Significant additions, disposals and write-offs:
For the year ended 31 December 2015 and three-month period ended 31 December 2014
Significant additions were i) payments for vessels upgrade and dry-docking of vessels, ii) payments for support vessels and rig equipment, and progress payments for new equipment under construction and installation, and iii) payments for warehouse construction.
Mortgaged assets
Property, plant, and equipment as of 31 December 2015 used as collateral for loan facilities can be summarised as follows:
• Ocean vessels with a net book value of USD 180.5 million (31 December 2014: USD 312.1 million) are mortgaged with financial institutions as collateral for their loans at a total value of USD 139.6 million (31 December 2014: USD 161.3 million).
• Subsea vessels and a tender rig with a net book value of USD 148.5 million (31 December 2014: USD 176.0million) were mortgaged with various banks as collateral for bank overdraft and loan facilities for a total value of USD 110.0 million (31 December 2014: USD 110.0 million).
• One barge with a zero net book value is mortgaged with a bank as collateral for its unused bank overdraft facility of Baht 5 million (31 December 2014: ten barges with a net book value of Baht 122.4 million are mortgaged with a bank as collateral for its bank overdrafts and long-term loans for a total value of Baht 125.0 million).
52
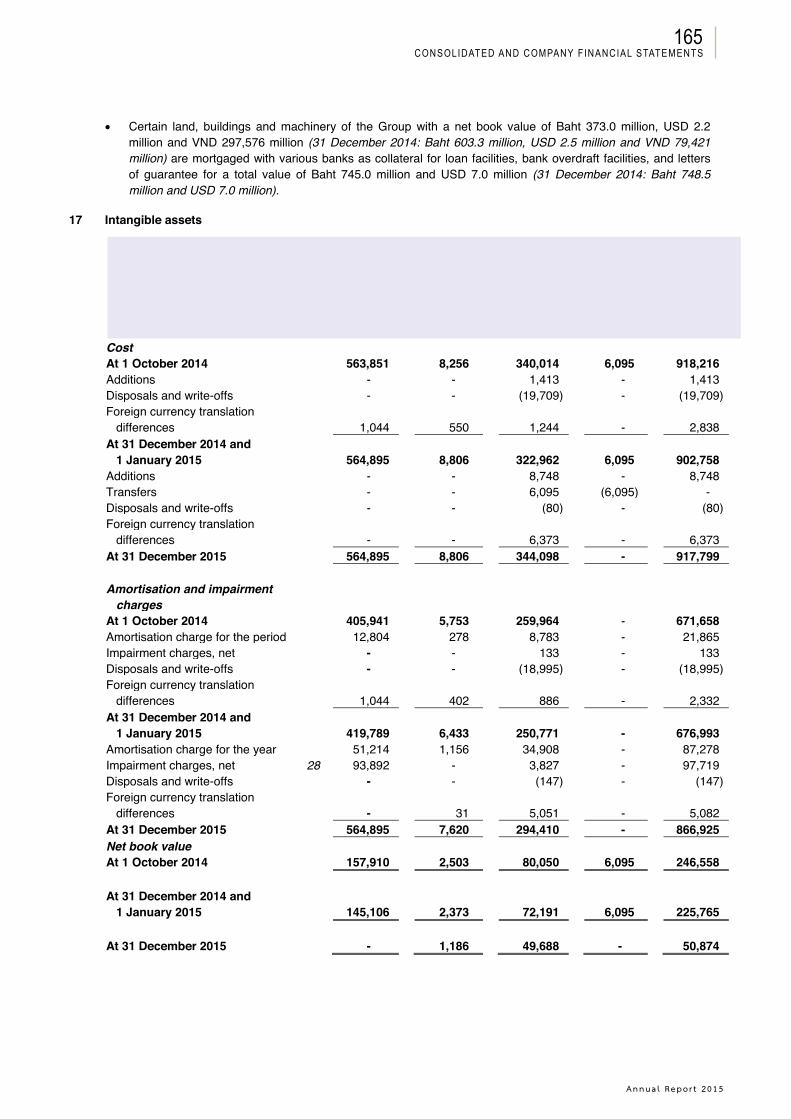
Annua l Repo r t 2015
Consolidated and Company FinanCial statements165
Thoresen Thai Agencies Public Company Limited and its SubsidiariesNotes to the financial statements
• Certain land, buildings and machinery of the Group with a net book value of Baht 373.0 million, USD 2.2million and VND 297,576 million (31 December 2014: Baht 603.3 million, USD 2.5 million and VND 79,421million) are mortgaged with various banks as collateral for loan facilities, bank overdraft facilities, and letters of guarantee for a total value of Baht 745.0 million and USD 7.0 million (31 December 2014: Baht 748.5million and USD 7.0 million).
17 Intangible assets
Consolidated financial statements
NoteCustomer
relationship
Otherintangible
assetsComputer software
Computer software
under installation Total
(in thousand Baht)CostAt 1 October 2014 563,851 8,256 340,014 6,095 918,216Additions - - 1,413 - 1,413Disposals and write-offs - - (19,709) - (19,709)Foreign currency translation
differences 1,044 550 1,244 - 2,838At 31 December 2014 and
1 January 2015 564,895 8,806 322,962 6,095 902,758Additions - - 8,748 - 8,748Transfers - - 6,095 (6,095) -Disposals and write-offs - - (80) - (80)Foreign currency translation
differences - - 6,373 - 6,373At 31 December 2015 564,895 8,806 344,098 - 917,799
Amortisation and impairment charges
At 1 October 2014 405,941 5,753 259,964 - 671,658Amortisation charge for the period 12,804 278 8,783 - 21,865Impairment charges, net - - 133 - 133Disposals and write-offs - - (18,995) - (18,995)Foreign currency translation
differences 1,044 402 886 - 2,332At 31 December 2014 and
1 January 2015 419,789 6,433 250,771 - 676,993Amortisation charge for the year 51,214 1,156 34,908 - 87,278Impairment charges, net 28 93,892 - 3,827 - 97,719Disposals and write-offs - - (147) - (147)Foreign currency translation
differences - 31 5,051 - 5,082At 31 December 2015 564,895 7,620 294,410 - 866,925Net book valueAt 1 October 2014 157,910 2,503 80,050 6,095 246,558
At 31 December 2014 and 1 January 2015 145,106 2,373 72,191 6,095 225,765
At 31 December 2015 - 1,186 49,688 - 50,874
53
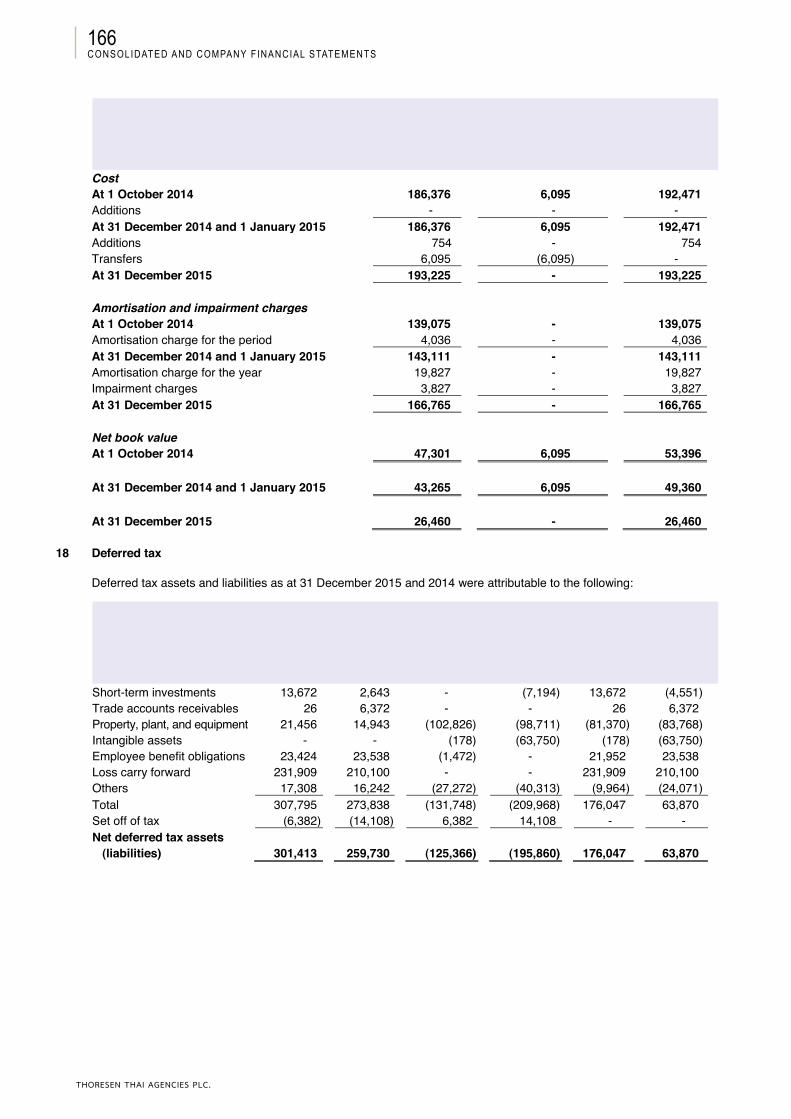
THORESEN THAI AGENCIES PLC.
Consolidated and Company FinanCial statements166
Thoresen Thai Agencies Public Company Limited and its SubsidiariesNotes to the financial statements
Separate financial statementsComputer software
Computer software under installation Total
(in thousand Baht)CostAt 1 October 2014 186,376 6,095 192,471Additions - - -At 31 December 2014 and 1 January 2015 186,376 6,095 192,471Additions 754 - 754Transfers 6,095 (6,095) -At 31 December 2015 193,225 - 193,225
Amortisation and impairment chargesAt 1 October 2014 139,075 - 139,075Amortisation charge for the period 4,036 - 4,036At 31 December 2014 and 1 January 2015 143,111 - 143,111Amortisation charge for the year 19,827 - 19,827Impairment charges 3,827 - 3,827At 31 December 2015 166,765 - 166,765
Net book valueAt 1 October 2014 47,301 6,095 53,396
At 31 December 2014 and 1 January 2015 43,265 6,095 49,360
At 31 December 2015 26,460 - 26,460
18 Deferred tax
Deferred tax assets and liabilities as at 31 December 2015 and 2014 were attributable to the following:
Consolidated financial statementsAssets Liabilities Net
2015 2014 2015 2014 2015 2014(restated) (restated) (restated)
(in thousand Baht)Short-term investments 13,672 2,643 - (7,194) 13,672 (4,551)Trade accounts receivables 26 6,372 - - 26 6,372Property, plant, and equipment 21,456 14,943 (102,826) (98,711) (81,370) (83,768)Intangible assets - - (178) (63,750) (178) (63,750)Employee benefit obligations 23,424 23,538 (1,472) - 21,952 23,538Loss carry forward 231,909 210,100 - - 231,909 210,100Others 17,308 16,242 (27,272) (40,313) (9,964) (24,071)Total 307,795 273,838 (131,748) (209,968) 176,047 63,870Set off of tax (6,382) (14,108) 6,382 14,108 - -Net deferred tax assets
(liabilities) 301,413 259,730 (125,366) (195,860) 176,047 63,870
54
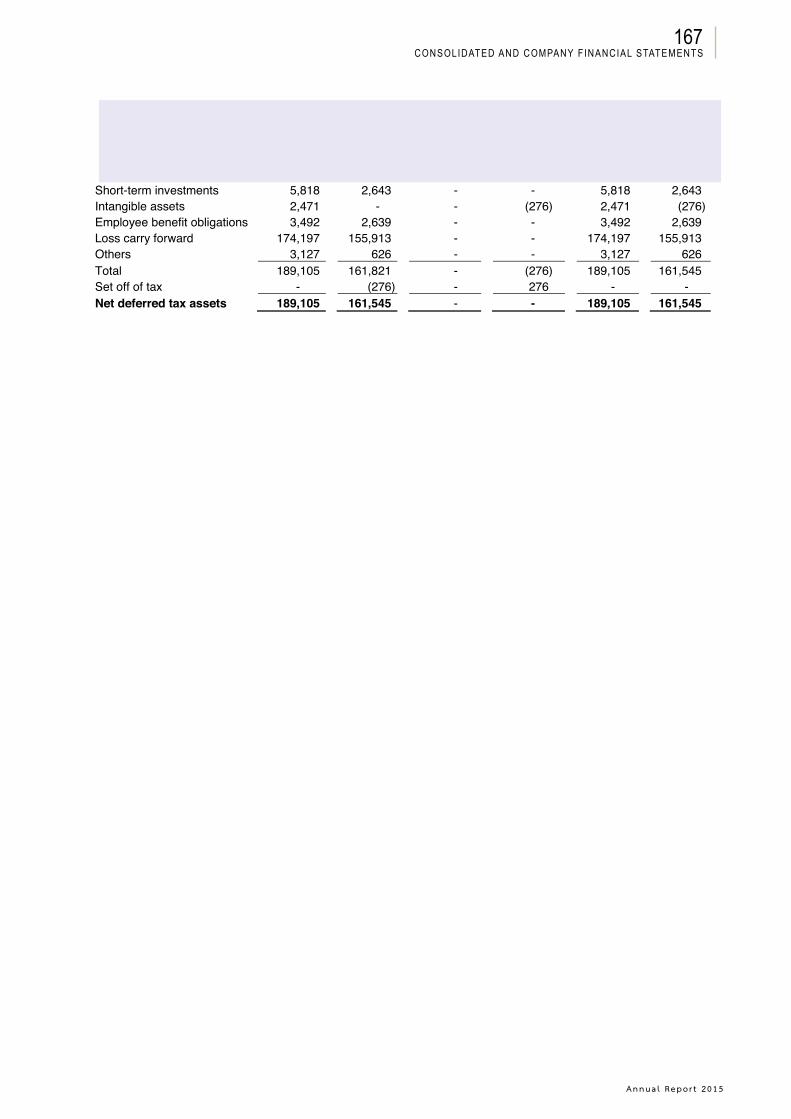
Annua l Repo r t 2015
Consolidated and Company FinanCial statements167
Thoresen Thai Agencies Public Company Limited and its SubsidiariesNotes to the financial statements
Separate financial statementsAssets Liabilities Net
2015 2014 2015 2014 2015 2014(restated) (restated) (restated)
(in thousand Baht)Short-term investments 5,818 2,643 - - 5,818 2,643Intangible assets 2,471 - - (276) 2,471 (276)Employee benefit obligations 3,492 2,639 - - 3,492 2,639Loss carry forward 174,197 155,913 - - 174,197 155,913Others 3,127 626 - - 3,127 626Total 189,105 161,821 - (276) 189,105 161,545Set off of tax - (276) - 276 - -Net deferred tax assets 189,105 161,545 - - 189,105 161,545
55
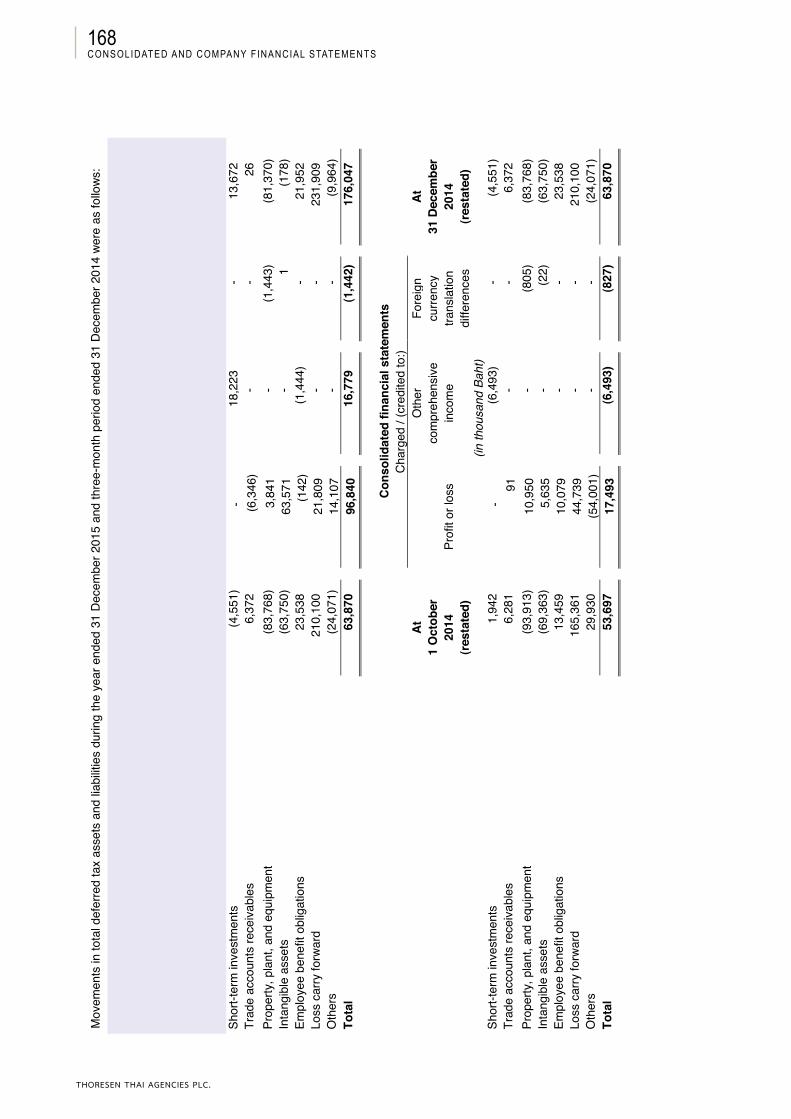
THORESEN THAI AGENCIES PLC.
Consolidated and Company FinanCial statements168
Thor
esen
Tha
i Age
ncie
s Pu
blic
Com
pany
Lim
ited
and
its S
ubsi
diar
ies
Note
s to
the
finan
cial
sta
tem
ents
Mov
emen
ts in
tota
l def
erre
d ta
x as
sets
and
liab
ilitie
s du
ring
the
year
end
ed 3
1 D
ecem
ber 2
015
and
thre
e-m
onth
per
iod
ende
d 31
Dec
embe
r 201
4 we
re a
s fo
llows
:
Cons
olid
ated
fina
ncia
l sta
tem
ents
Cha
rged
/ (c
redi
ted
to:)
AtO
ther
Fore
ign
At1
Janu
ary
com
preh
ensi
vecu
rrenc
y31
Dec
embe
r20
15Pr
ofit
or lo
ssin
com
etra
nsla
tion
2015
(rest
ated
)di
ffere
nces
(in th
ousa
nd B
aht)
Shor
t-ter
m in
vest
men
ts(4
,551
)-
18,2
23-
13,6
72Tr
ade
acco
unts
rece
ivab
les
6,37
2(6
,346
)-
-26
Prop
erty
, pla
nt, a
nd e
quip
men
t(8
3,76
8)3,
841
-(1
,443
)(8
1,37
0)In
tang
ible
ass
ets
(63,
750)
63,5
71-
1(1
78)
Empl
oyee
ben
efit
oblig
atio
ns
23,5
38(1
42)
(1,4
44)
-21
,952
Loss
car
ry fo
rwar
d21
0,10
021
,809
--
231,
909
Oth
ers
(24,
071)
14,1
07-
-(9
,964
)To
tal
63,8
7096
,840
16,7
79(1
,442
)17
6,04
7
Cons
olid
ated
fina
ncia
l sta
tem
ents
Cha
rged
/ (c
redi
ted
to:)
AtO
ther
Fore
ign
At1
Oct
ober
com
preh
ensi
vecu
rrenc
y31
Dec
embe
r20
14Pr
ofit
or lo
ssin
com
etra
nsla
tion
2014
(rest
ated
)di
ffere
nces
(rest
ated
)(in
thou
sand
Bah
t)Sh
ort-t
erm
inve
stm
ents
1,94
2-
(6,4
93)
-(4
,551
)Tr
ade
acco
unts
rece
ivab
les
6,28
191
--
6,37
2Pr
oper
ty, p
lant
, and
equ
ipm
ent
(93,
913)
10,9
50-
(805
)(8
3,76
8)In
tang
ible
ass
ets
(69,
363)
5,63
5-
(22)
(63,
750)
Empl
oyee
ben
efit
oblig
atio
ns
13,4
5910
,079
--
23,5
38Lo
ss c
arry
forw
ard
165,
361
44,7
39-
-21
0,10
0O
ther
s29
,930
(54,
001)
--
(24,
071)
Tota
l53
,697
17,4
93(6
,493
)(8
27)
63,8
70
56
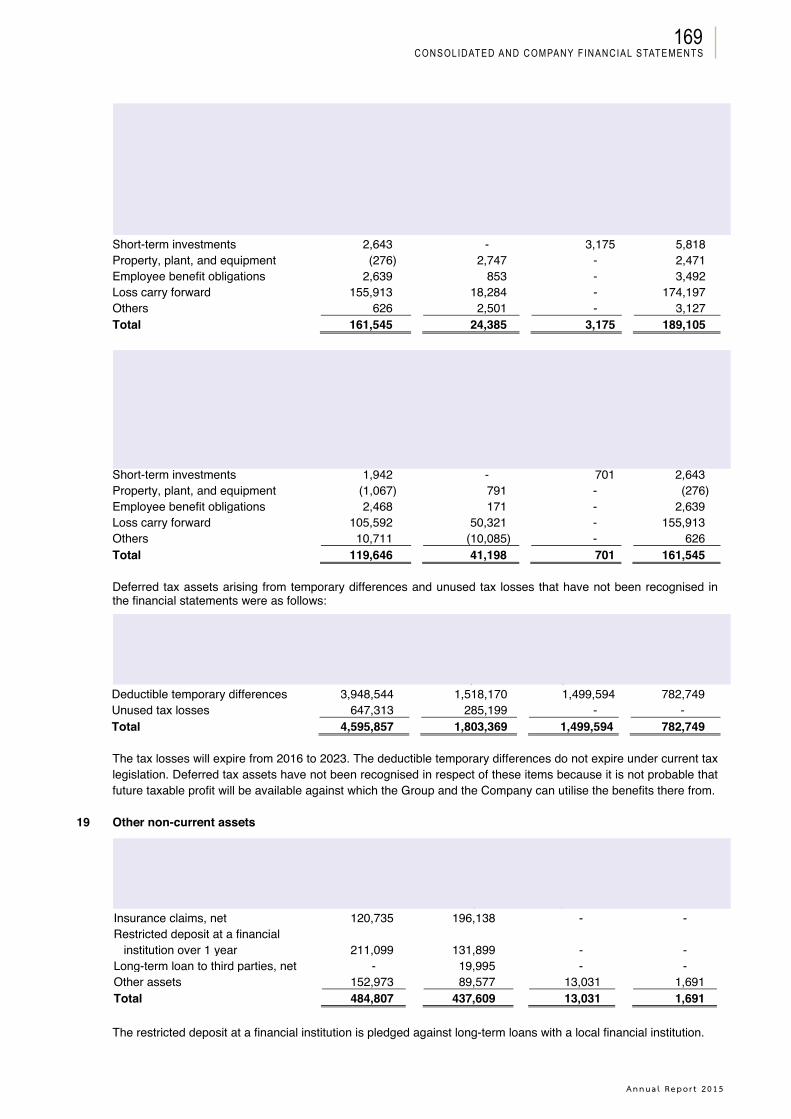
Annua l Repo r t 2015
Consolidated and Company FinanCial statements169
Thoresen Thai Agencies Public Company Limited and its SubsidiariesNotes to the financial statements
Separate financial statementsCharged / (credited to):
At 1 January
2015 Profit or loss
Other comprehensive
income
At 31 December
2015(restated)
(in thousand Baht)Short-term investments 2,643 - 3,175 5,818Property, plant, and equipment (276) 2,747 - 2,471Employee benefit obligations 2,639 853 - 3,492Loss carry forward 155,913 18,284 - 174,197Others 626 2,501 - 3,127Total 161,545 24,385 3,175 189,105
Separate financial statementsCharged / (credited to):
At 1 October
2014 Profit or loss
Other comprehensive
income
At 31 December
2014(restated) (restated)
(in thousand Baht)Short-term investments 1,942 - 701 2,643Property, plant, and equipment (1,067) 791 - (276)Employee benefit obligations 2,468 171 - 2,639Loss carry forward 105,592 50,321 - 155,913Others 10,711 (10,085) - 626Total 119,646 41,198 701 161,545
Deferred tax assets arising from temporary differences and unused tax losses that have not been recognised in the financial statements were as follows:
Consolidated financial statements
Separate financial statements
2015 2014 2015 2014(in thousand Baht)
Deductible temporary differences 3,948,544 1,518,170 1,499,594 782,749Unused tax losses 647,313 285,199 - -Total 4,595,857 1,803,369 1,499,594 782,749
The tax losses will expire from 2016 to 2023. The deductible temporary differences do not expire under current tax legislation. Deferred tax assets have not been recognised in respect of these items because it is not probable that future taxable profit will be available against which the Group and the Company can utilise the benefits there from.
19 Other non-current assets
Consolidated Separatefinancial statements financial statements
2015 2014 2015 2014(in thousand Baht)
Insurance claims, net 120,735 196,138 - -Restricted deposit at a financial
institution over 1 year 211,099 131,899 - -Long-term loan to third parties, net - 19,995 - -Other assets 152,973 89,577 13,031 1,691Total 484,807 437,609 13,031 1,691
The restricted deposit at a financial institution is pledged against long-term loans with a local financial institution.
57
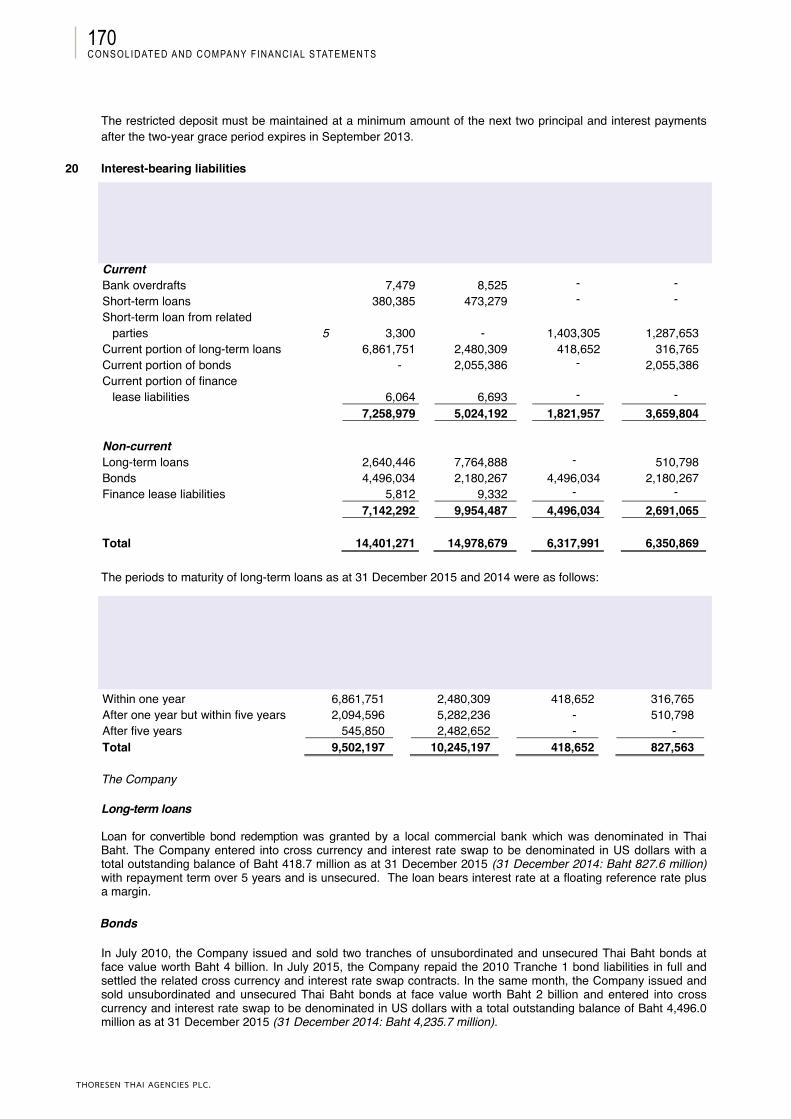
THORESEN THAI AGENCIES PLC.
Consolidated and Company FinanCial statements170
Thoresen Thai Agencies Public Company Limited and its SubsidiariesNotes to the financial statements
The restricted deposit must be maintained at a minimum amount of the next two principal and interest payments after the two-year grace period expires in September 2013.
20 Interest-bearing liabilities
Consolidated Separatefinancial statements financial statements
Note 2015 2014(restated)
2015 2014(restated)
(in thousand Baht)CurrentBank overdrafts 7,479 8,525 - -Short-term loans 380,385 473,279 - -Short-term loan from related
parties 5 3,300 - 1,403,305 1,287,653Current portion of long-term loans 6,861,751 2,480,309 418,652 316,765Current portion of bonds - 2,055,386 - 2,055,386Current portion of finance
lease liabilities 6,064 6,693 - -7,258,979 5,024,192 1,821,957 3,659,804
Non-currentLong-term loans 2,640,446 7,764,888 - 510,798Bonds 4,496,034 2,180,267 4,496,034 2,180,267Finance lease liabilities 5,812 9,332 - -
7,142,292 9,954,487 4,496,034 2,691,065
Total 14,401,271 14,978,679 6,317,991 6,350,869
The periods to maturity of long-term loans as at 31 December 2015 and 2014 were as follows:
Consolidated Separatefinancial statements financial statements
2015 2014 2015 2014(restated) (restated)
(in thousand Baht)Within one year 6,861,751 2,480,309 418,652 316,765After one year but within five years 2,094,596 5,282,236 - 510,798After five years 545,850 2,482,652 - -Total 9,502,197 10,245,197 418,652 827,563
The Company
Long-term loans
Loan for convertible bond redemption was granted by a local commercial bank which was denominated in Thai Baht. The Company entered into cross currency and interest rate swap to be denominated in US dollars with a total outstanding balance of Baht 418.7 million as at 31 December 2015 (31 December 2014: Baht 827.6 million)with repayment term over 5 years and is unsecured. The loan bears interest rate at a floating reference rate plus a margin.
Bonds
In July 2010, the Company issued and sold two tranches of unsubordinated and unsecured Thai Baht bonds at face value worth Baht 4 billion. In July 2015, the Company repaid the 2010 Tranche 1 bond liabilities in full and settled the related cross currency and interest rate swap contracts. In the same month, the Company issued and sold unsubordinated and unsecured Thai Baht bonds at face value worth Baht 2 billion and entered into cross currency and interest rate swap to be denominated in US dollars with a total outstanding balance of Baht 4,496.0 million as at 31 December 2015 (31 December 2014: Baht 4,235.7 million).
58
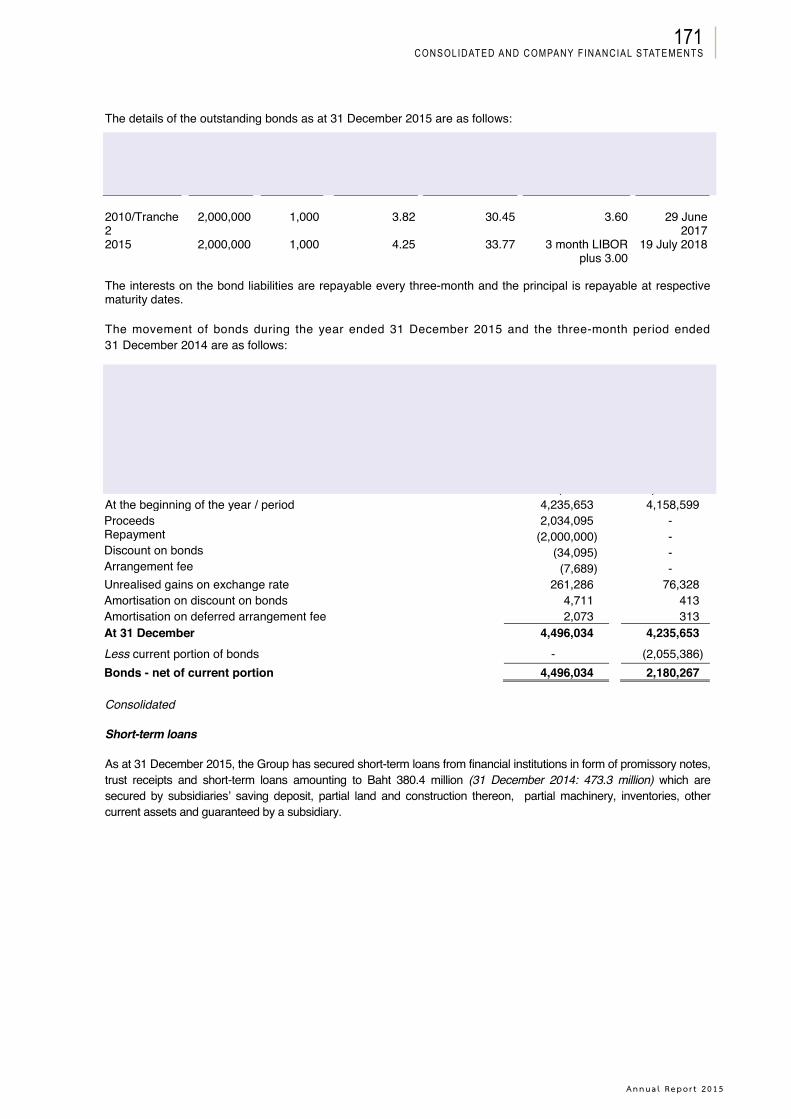
Annua l Repo r t 2015
Consolidated and Company FinanCial statements171
Thoresen Thai Agencies Public Company Limited and its SubsidiariesNotes to the financial statements
The details of the outstanding bonds as at 31 December 2015 are as follows:
Issued yearNumber of
units
Face value/
unit (Baht)
Interest rate (% per
annum) Swap exchange rate (Baht/USD)
Swap interest rate
(% per annum) Maturity
dated
2010/Tranche 2
2,000,000 1,000 3.82 30.45 3.60 29 June 2017
2015 2,000,000 1,000 4.25 33.77 3 month LIBORplus 3.00
19 July 2018
The interests on the bond liabilities are repayable every three-month and the principal is repayable at respective maturity dates.
The movement of bonds during the year ended 31 December 2015 and the three-month period ended 31 December 2014 are as follows:
Consolidated and separate financial statements
Three-monthYear ended period ended31 December 31 December
2015 2014(restated)
(in thousand Baht)At the beginning of the year / period 4,235,653 4,158,599Proceeds 2,034,095 -Repayment (2,000,000) -Discount on bonds (34,095) -Arrangement fee (7,689) -Unrealised gains on exchange rate 261,286 76,328Amortisation on discount on bonds 4,711 413Amortisation on deferred arrangement fee 2,073 313At 31 December 4,496,034 4,235,653Less current portion of bonds - (2,055,386)Bonds - net of current portion 4,496,034 2,180,267
Consolidated
Short-term loans
As at 31 December 2015, the Group has secured short-term loans from financial institutions in form of promissory notes,trust receipts and short-term loans amounting to Baht 380.4 million (31 December 2014: 473.3 million) which are secured by subsidiaries’ saving deposit, partial land and construction thereon, partial machinery, inventories, other current assets and guaranteed by a subsidiary.
59
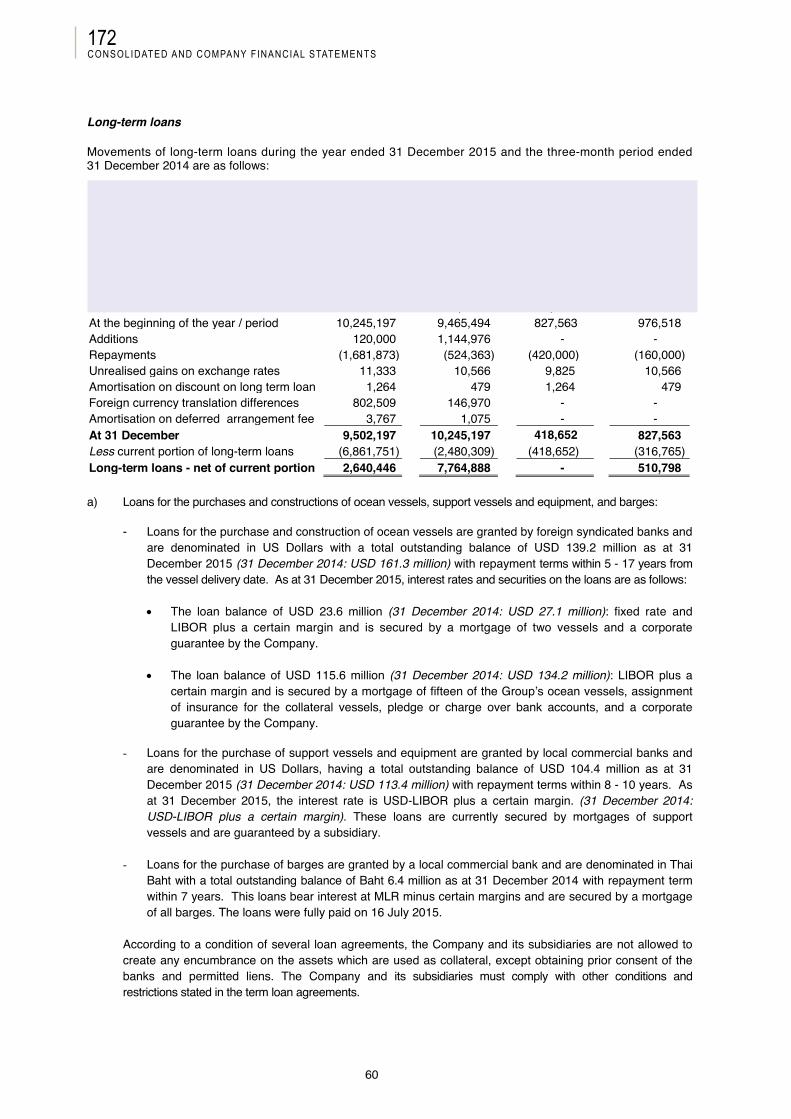
THORESEN THAI AGENCIES PLC.
Consolidated and Company FinanCial statements172
Thoresen Thai Agencies Public Company Limited and its SubsidiariesNotes to the financial statements
Long-term loans
Movements of long-term loans during the year ended 31 December 2015 and the three-month period ended 31 December 2014 are as follows:
Consolidated Separatefinancial statements financial statements
Three-month Three-monthYear ended period ended Year ended period ended
31 December 31 December 31 December 31 December2015 2014 2015 2014
(restated) (restated)(in thousand Baht)
At the beginning of the year / period 10,245,197 9,465,494 827,563 976,518Additions 120,000 1,144,976 - -Repayments (1,681,873) (524,363) (420,000) (160,000)Unrealised gains on exchange rates 11,333 10,566 9,825 10,566Amortisation on discount on long term loan 1,264 479 1,264 479Foreign currency translation differences 802,509 146,970 - -Amortisation on deferred arrangement fee 3,767 1,075 - -At 31 December 9,502,197 10,245,197 418,652 827,563Less current portion of long-term loans (6,861,751) (2,480,309) (418,652) (316,765)Long-term loans - net of current portion 2,640,446 7,764,888 - 510,798
a) Loans for the purchases and constructions of ocean vessels, support vessels and equipment, and barges:
- Loans for the purchase and construction of ocean vessels are granted by foreign syndicated banks and are denominated in US Dollars with a total outstanding balance of USD 139.2 million as at 31December 2015 (31 December 2014: USD 161.3 million) with repayment terms within 5 - 17 years from the vessel delivery date. As at 31 December 2015, interest rates and securities on the loans are as follows:
• The loan balance of USD 23.6 million (31 December 2014: USD 27.1 million): fixed rate and LIBOR plus a certain margin and is secured by a mortgage of two vessels and a corporate guarantee by the Company.
• The loan balance of USD 115.6 million (31 December 2014: USD 134.2 million): LIBOR plus a certain margin and is secured by a mortgage of fifteen of the Group’s ocean vessels, assignment of insurance for the collateral vessels, pledge or charge over bank accounts, and a corporate guarantee by the Company.
- Loans for the purchase of support vessels and equipment are granted by local commercial banks and are denominated in US Dollars, having a total outstanding balance of USD 104.4 million as at 31December 2015 (31 December 2014: USD 113.4 million) with repayment terms within 8 - 10 years. As at 31 December 2015, the interest rate is USD-LIBOR plus a certain margin. (31 December 2014:USD-LIBOR plus a certain margin). These loans are currently secured by mortgages of support vessels and are guaranteed by a subsidiary.
- Loans for the purchase of barges are granted by a local commercial bank and are denominated in Thai Baht with a total outstanding balance of Baht 6.4 million as at 31 December 2014 with repayment term within 7 years. This loans bear interest at MLR minus certain margins and are secured by a mortgage of all barges. The loans were fully paid on 16 July 2015.
According to a condition of several loan agreements, the Company and its subsidiaries are not allowed to create any encumbrance on the assets which are used as collateral, except obtaining prior consent of the banks and permitted liens. The Company and its subsidiaries must comply with other conditions and restrictions stated in the term loan agreements.
60
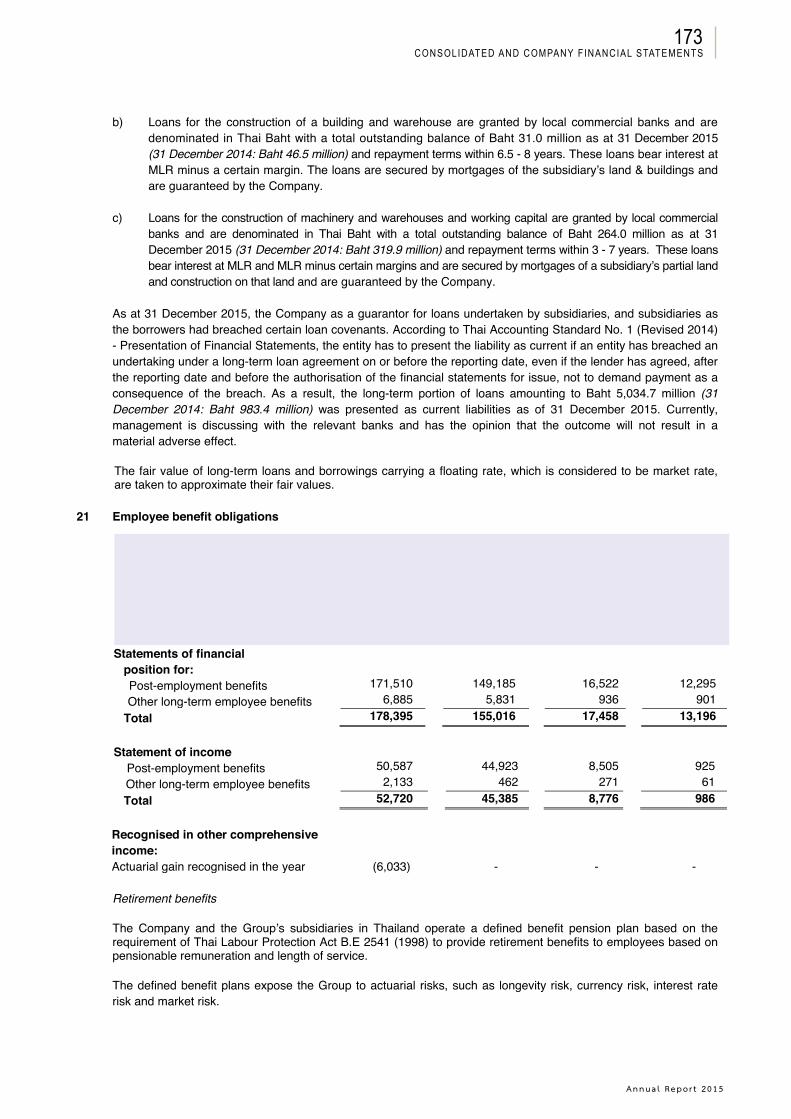
Annua l Repo r t 2015
Consolidated and Company FinanCial statements173
Thoresen Thai Agencies Public Company Limited and its SubsidiariesNotes to the financial statements
b) Loans for the construction of a building and warehouse are granted by local commercial banks and are denominated in Thai Baht with a total outstanding balance of Baht 31.0 million as at 31 December 2015(31 December 2014: Baht 46.5 million) and repayment terms within 6.5 - 8 years. These loans bear interest at MLR minus a certain margin. The loans are secured by mortgages of the subsidiary’s land & buildings and are guaranteed by the Company.
c) Loans for the construction of machinery and warehouses and working capital are granted by local commercial banks and are denominated in Thai Baht with a total outstanding balance of Baht 264.0 million as at 31 December 2015 (31 December 2014: Baht 319.9 million) and repayment terms within 3 - 7 years. These loans bear interest at MLR and MLR minus certain margins and are secured by mortgages of a subsidiary’s partial land and construction on that land and are guaranteed by the Company.
As at 31 December 2015, the Company as a guarantor for loans undertaken by subsidiaries, and subsidiaries as the borrowers had breached certain loan covenants. According to Thai Accounting Standard No. 1 (Revised 2014)- Presentation of Financial Statements, the entity has to present the liability as current if an entity has breached an undertaking under a long-term loan agreement on or before the reporting date, even if the lender has agreed, after the reporting date and before the authorisation of the financial statements for issue, not to demand payment as a consequence of the breach. As a result, the long-term portion of loans amounting to Baht 5,034.7 million (31 December 2014: Baht 983.4 million) was presented as current liabilities as of 31 December 2015. Currently, management is discussing with the relevant banks and has the opinion that the outcome will not result in a material adverse effect.
The fair value of long-term loans and borrowings carrying a floating rate, which is considered to be market rate, are taken to approximate their fair values.
21 Employee benefit obligations
Consolidated Separatefinancial statements financial statements
Three-month Three-monthYear ended period ended Year ended period ended
31 December 31 December 31 December 31 December2015 2014 2015 2014
(in thousand Baht)Statements of financial
position for:Post-employment benefits 171,510 149,185 16,522 12,295Other long-term employee benefits 6,885 5,831 936 901
Total 178,395 155,016 17,458 13,196
Statement of incomePost-employment benefits 50,587 44,923 8,505 925Other long-term employee benefits 2,133 462 271 61Total 52,720 45,385 8,776 986
Recognised in other comprehensive income:Actuarial gain recognised in the year (6,033) - - -
Retirement benefits
The Company and the Group’s subsidiaries in Thailand operate a defined benefit pension plan based on the requirement of Thai Labour Protection Act B.E 2541 (1998) to provide retirement benefits to employees based on pensionable remuneration and length of service.
The defined benefit plans expose the Group to actuarial risks, such as longevity risk, currency risk, interest rate risk and market risk.
61

THORESEN THAI AGENCIES PLC.
Consolidated and Company FinanCial statements174
Thoresen Thai Agencies Public Company Limited and its SubsidiariesNotes to the financial statements
The movement in the defined benefit obligations during the year ended 31 December 2015 and the three-month period ended 31 December 2014 are as follows:
Consolidated Separatefinancial statements financial statements
2015 2014 2015 2014(in thousand Baht)
Defined benefit obligations at1 January / 1 October 155,016 111,663 13,196 12,343
Include in profit or loss:Current service costs 49,131 10,169 4,040 904Interest on obligation 2,022 425 458 82Retention bonus 120 - - -Loss / (gain) on settlement (8,696) - 4,278 -Reclassify from accrued expenses 427 32,800 - -Foreign currency translation
differences 9,958 1,991 - -52,962 45,385 8,776 986
Included in other comprehensive income:
Actuarial gain (5,791) - - -Foreign currency translation
differences (242) - - -(6,033) - - -
Other
Benefit paid by the plan (23,550) (2,032) (4,514) (133)
(23,550) (2,032) (4,514) (133)Defined benefit obligations at
31 December 178,395 155,016 17,458 13,196
Actuarial gains and losses recognised in other comprehensive income arising from:
Consolidated financial statements
Separate financial statements
2015 2014 2015 2014(in thousand Baht)
Demographic assumptions (245) - - -Financial assumptions 96 - - -Experience adjustment (5,884) - - -Total (6,033) - - -
Actuarial assumptions
The following were the principal actuarial assumptions at the reporting date (expressed as weighted averages).
Consolidated Separatefinancial statements financial statements
2015 2014 2015 2014Discount rate 1.7% - 9.1% 2.1% - 8.4% 3.5% 3.5%Future salary increases 4.5% - 8% 4% - 8% 6% 6%Mortality rate 0.1% - 1.0% 0.1% - 1.0% TMO2008* TMO2008*
and TMO2008* and TMO2008*Resignation rate 0% - 30% 0% - 34% 0% - 23% 0% - 23%
* Male and Female Thai Mortality Ordinary Table of 2008 which is the latest mortality table from the Office of Insurance Commission in Thailand.
62

Annua l Repo r t 2015
Consolidated and Company FinanCial statements175
Thoresen Thai Agencies Public Company Limited and its SubsidiariesNotes to the financial statements
Sensitivity analysis
Reasonably possible changes at the reporting date to one of the relevant actuarial assumptions, holding other assumptions constant, would have affected the defined benefit obligation by the amounts shown below.
Consolidated financial statements
Separate financial statements
(in thousand Baht)Defined benefit obligation 31 December 2015 Increase Decrease Increase DecreaseDiscount rate (1% movement) (4,422) 4,776 (1,440) 1,528Future salary growth (1% movement) 5,228 (4,457) 1,422 (1,354)Resignation rate (1% movement) (445) 429 - -Life expectancy (1 year movement) 823 (816) 275 (273)
Although the analysis does not take account of the full distribution of cash flows expected under the plan, it does providean approximation of the sensitivity of the assumptions shown.
22 Share capital and warrants
Consolidated and separate financial statements
Par value 2015 2014per share Number Baht Number Baht(in Baht) (thousand shares / thousand Baht)
AuthorisedAt 1 January 2015 and
1 October 2014- ordinary shares 1 1,544,106 1,544,106 1,544,106 1,544,106Reduction of shares 1 (6,642) (6,642) - -Increase of new shares 1 739,383 739,383 - -At 31 December - ordinary shares 1 2,276,847 2,276,847 1,544,106 1,544,106
Issued and paid-upAt 1 January 2015 and
1 October 2014- ordinary shares 1 1,301,175 1,301,175 1,293,235 1,293,235Issue of new shares 1 520,470 520,470 - -Exercise of warrants 1 809 809 7,940 7,940At 31 December- ordinary shares 1 1,822,454 1,822,454 1,301,175 1,301,175
Exercise of warrants
During the year ended 31 December 2015, TTA-W3, TTA-W4 and TTA-W5 were exercised and registered as paid-up share capital in the amount of Baht 807,433, Baht 1,412 and Baht 56, respectively, resulting in an increase of the Company’s paid-up share capital to Baht 1,301.98 million. On 31 December 2015, the remaining warrants of TTA-W3 were fully expired.
At the Annual General Meeting of Shareholders No. 1/2015 held on 28 January 2015, shareholders approved the following resolutions:
Reduction and increase of authorised share capital
• The reduction in the registered capital of the Company by cancelling 6,642,035 authorised but unissued shares, resulting in a decrease from the existing authorised share capital of Baht 1,544,105,835 to a new authorised share capital of Baht 1,537,463,800 divided into 1,537,463,800 ordinary shares each of par value of Baht 1.
• Increase of the authorised share capital by 739,383,450 shares at a par value of Baht 1 each from theexisting authorised share capital of Baht 1,537,463,800. The new authorised share capital of Baht 2,276,847,250 is divided into 2,276,847,250 shares at the par value of Baht 1 each, and Clause 4 of the Memorandum of Association has been amended to reflect the increase of the authorised share capital.
63

THORESEN THAI AGENCIES PLC.
Consolidated and Company FinanCial statements176
Thoresen Thai Agencies Public Company Limited and its SubsidiariesNotes to the financial statements
Issue of ordinary shares and warrants
• Issuance and offering of the following securities:- No more than 520,470,459 new ordinary shares at a par value of Baht 1 each in combination with - No more than 173,490,153 units of warrants to purchase new ordinary shares of the Company No. 5
(“TTA-W5” or “Warrants”)The above securities will be offered to existing shareholders in proportion to their shareholding percentage (Right Offering: RO) in a ratio of 15 existing ordinary shares to 6 new ordinary shares in combination with 2 units of Warrant (15:6:2). The RO price is Baht 14 per one share. The offering price for the Warrants is Baht 0 per one unit. The exercise price for the Warrants is Baht 18.5 per share (except in case of rights adjustments). Existing shareholders exercising the right to subscribe for the capital increase shares must exercise their right simultaneously and proportionately to subscribe for Warrants.
• Allocation of capital increase ordinary shares as follows:
Offering of new ordinary shares
- No more than 520,470,459 new ordinary shares at the par value of Baht 1 per share must be offered to existing shareholders of the Company in proportion to their shareholding percentage at a ratio of 15 existing ordinary shares to 6 new ordinary shares at an offering price of Baht 14 per share.
- Existing shareholders shall have the right to oversubscribe in the RO based on the ratio specified above by indicating their intention to oversubscribe by no more than 20 percent of existing ordinary shares held by them. Shareholders may oversubscribe, and oversubscription shares may be allocated to such oversubscribing shareholders only when there are shares left after allocation to all shareholders who have subscribed to shares proportionately to their shareholding percentage in the RO. Such allocation of oversubscription shares shall be proportionate to their shareholding percentage and shall be subject to the foreign shareholding limit as prescribed under the Articles of Association of the Company, which currently provide that foreign shareholders may hold shares in the Company up to 49 percent of total issued shares of the Company.
Any new ordinary shares left after allocation to existing shareholders shall be allocated in a private placement (the “Private Placement”) at the offering price which is not lower than 90 percent of market price. However, the Private Placement offering price will not be lower than the RO price.
Allocation of new ordinary shares for the exercise of Warrants
- No more than 173,490,153 new ordinary shares shall be allocated for the exercise of warrants No. 5 to purchase ordinary shares of the Company to be offered proportionately to existing shareholders of the Company.
- No more than 29,367,109 new ordinary shares shall be allocated as a reserve to support the adjustment of rights for holders of TTA-W3 in connection with the Rights Offering.
- No more than 16,055,729 new ordinary shares shall be allocated as a reserve to support theadjustment of rights for holders of TTA-W4 in connection with the Rights Offering.
On 17 March 2015, the Company announced the subscription result to the existing shareholders of 520,470,459 rights shares, resulting in proceeds of Baht 7,286.59 million (paid-up share capital of Baht 520.47 million and premium on ordinary shares of Baht 6,766.12 million).
On 23 March 2015, the Company announced the result of issuance and allocation of TTA-W5 to the existing shareholders who subscribed for newly issued ordinary shares and were allocated 173,482,938 units of TTA-W5,at an offering price of Baht 0 per unit.
The new ordinary shares and TTA-W5 were traded on the SET on 20 March 2015 and 7 April 2015, respectively.
64
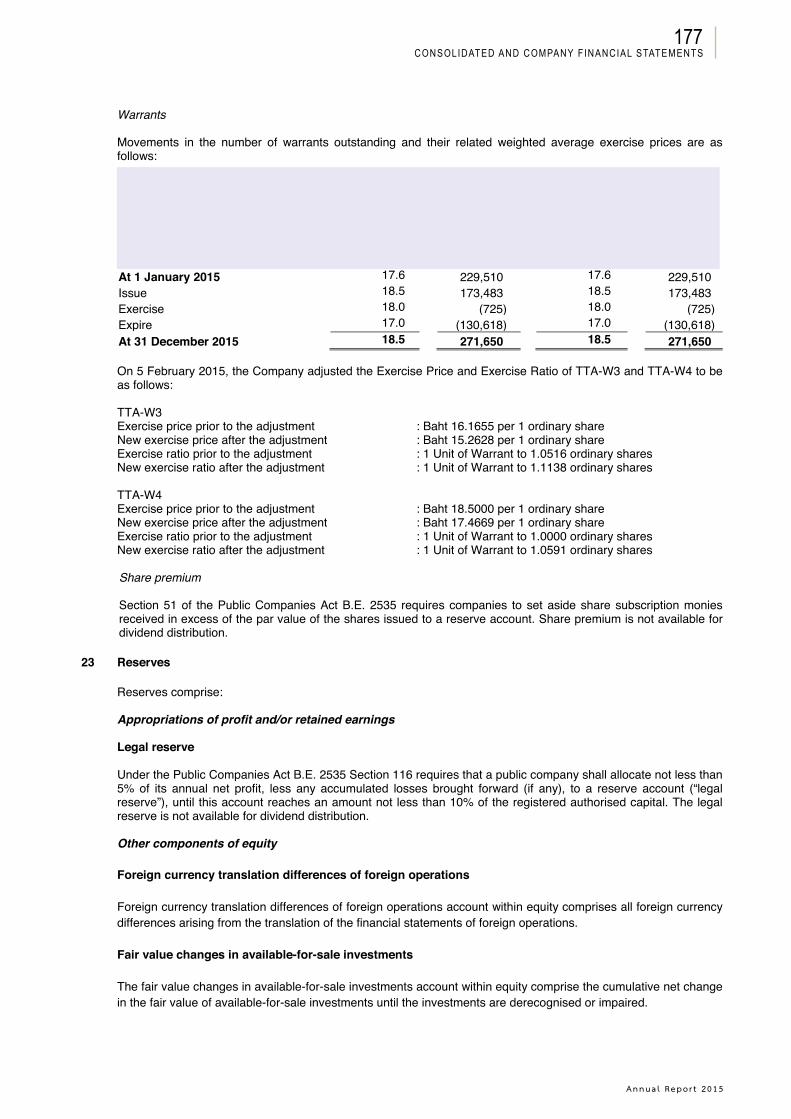
Annua l Repo r t 2015
Consolidated and Company FinanCial statements177
Thoresen Thai Agencies Public Company Limited and its SubsidiariesNotes to the financial statements
Warrants
Movements in the number of warrants outstanding and their related weighted average exercise prices are as follows:
Consolidated Separatefinancial statements financial statements
Average exercise priceper warrant Number of
Average exercise priceper warrant Number of
(in Baht) units’000 (in Baht) units’000At 1 January 2015 17.6 229,510 17.6 229,510Issue 18.5 173,483 18.5 173,483Exercise 18.0 (725) 18.0 (725)Expire 17.0 (130,618) 17.0 (130,618)At 31 December 2015 18.5 271,650 18.5 271,650
On 5 February 2015, the Company adjusted the Exercise Price and Exercise Ratio of TTA-W3 and TTA-W4 to be as follows:
TTA-W3Exercise price prior to the adjustment : Baht 16.1655 per 1 ordinary shareNew exercise price after the adjustment : Baht 15.2628 per 1 ordinary shareExercise ratio prior to the adjustment : 1 Unit of Warrant to 1.0516 ordinary sharesNew exercise ratio after the adjustment : 1 Unit of Warrant to 1.1138 ordinary shares
TTA-W4Exercise price prior to the adjustment : Baht 18.5000 per 1 ordinary shareNew exercise price after the adjustment : Baht 17.4669 per 1 ordinary shareExercise ratio prior to the adjustment : 1 Unit of Warrant to 1.0000 ordinary sharesNew exercise ratio after the adjustment : 1 Unit of Warrant to 1.0591 ordinary shares
Share premium
Section 51 of the Public Companies Act B.E. 2535 requires companies to set aside share subscription monies received in excess of the par value of the shares issued to a reserve account. Share premium is not available for dividend distribution.
23 Reserves
Reserves comprise:
Appropriations of profit and/or retained earnings
Legal reserve
Under the Public Companies Act B.E. 2535 Section 116 requires that a public company shall allocate not less than 5% of its annual net profit, less any accumulated losses brought forward (if any), to a reserve account (“legal reserve”), until this account reaches an amount not less than 10% of the registered authorised capital. The legal reserve is not available for dividend distribution.
Other components of equity
Foreign currency translation differences of foreign operations
Foreign currency translation differences of foreign operations account within equity comprises all foreign currency differences arising from the translation of the financial statements of foreign operations.
Fair value changes in available-for-sale investments
The fair value changes in available-for-sale investments account within equity comprise the cumulative net change in the fair value of available-for-sale investments until the investments are derecognised or impaired.
65
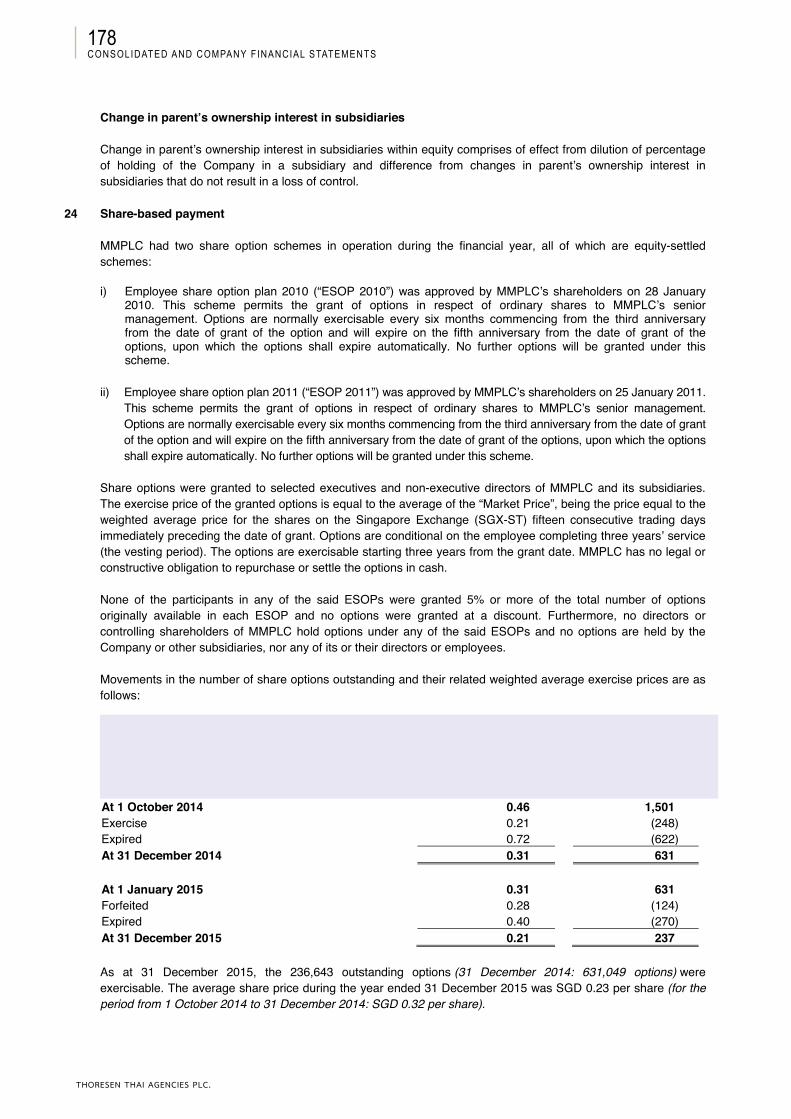
THORESEN THAI AGENCIES PLC.
Consolidated and Company FinanCial statements178
Thoresen Thai Agencies Public Company Limited and its SubsidiariesNotes to the financial statements
Change in parent’s ownership interest in subsidiaries
Change in parent’s ownership interest in subsidiaries within equity comprises of effect from dilution of percentage of holding of the Company in a subsidiary and difference from changes in parent’s ownership interest in subsidiaries that do not result in a loss of control.
24 Share-based payment
MMPLC had two share option schemes in operation during the financial year, all of which are equity-settled schemes:
i) Employee share option plan 2010 (“ESOP 2010”) was approved by MMPLC’s shareholders on 28 January 2010. This scheme permits the grant of options in respect of ordinary shares to MMPLC’s senior management. Options are normally exercisable every six months commencing from the third anniversary from the date of grant of the option and will expire on the fifth anniversary from the date of grant of the options, upon which the options shall expire automatically. No further options will be granted under this scheme.
ii) Employee share option plan 2011 (“ESOP 2011”) was approved by MMPLC’s shareholders on 25 January 2011. This scheme permits the grant of options in respect of ordinary shares to MMPLC’s senior management.Options are normally exercisable every six months commencing from the third anniversary from the date of grant of the option and will expire on the fifth anniversary from the date of grant of the options, upon which the options shall expire automatically. No further options will be granted under this scheme.
Share options were granted to selected executives and non-executive directors of MMPLC and its subsidiaries. The exercise price of the granted options is equal to the average of the “Market Price”, being the price equal to the weighted average price for the shares on the Singapore Exchange (SGX-ST) fifteen consecutive trading days immediately preceding the date of grant. Options are conditional on the employee completing three years’ service (the vesting period). The options are exercisable starting three years from the grant date. MMPLC has no legal or constructive obligation to repurchase or settle the options in cash.
None of the participants in any of the said ESOPs were granted 5% or more of the total number of options originally available in each ESOP and no options were granted at a discount. Furthermore, no directors or controlling shareholders of MMPLC hold options under any of the said ESOPs and no options are held by the Company or other subsidiaries, nor any of its or their directors or employees.
Movements in the number of share options outstanding and their related weighted average exercise prices are as follows:
Consolidatedfinancial statements
Average Optionexercise priceSGD per share
Shares’000
At 1 October 2014 0.46 1,501Exercise 0.21 (248)Expired 0.72 (622)At 31 December 2014 0.31 631
At 1 January 2015 0.31 631Forfeited 0.28 (124)Expired 0.40 (270)At 31 December 2015 0.21 237
As at 31 December 2015, the 236,643 outstanding options (31 December 2014: 631,049 options) were exercisable. The average share price during the year ended 31 December 2015 was SGD 0.23 per share (for the period from 1 October 2014 to 31 December 2014: SGD 0.32 per share).
66
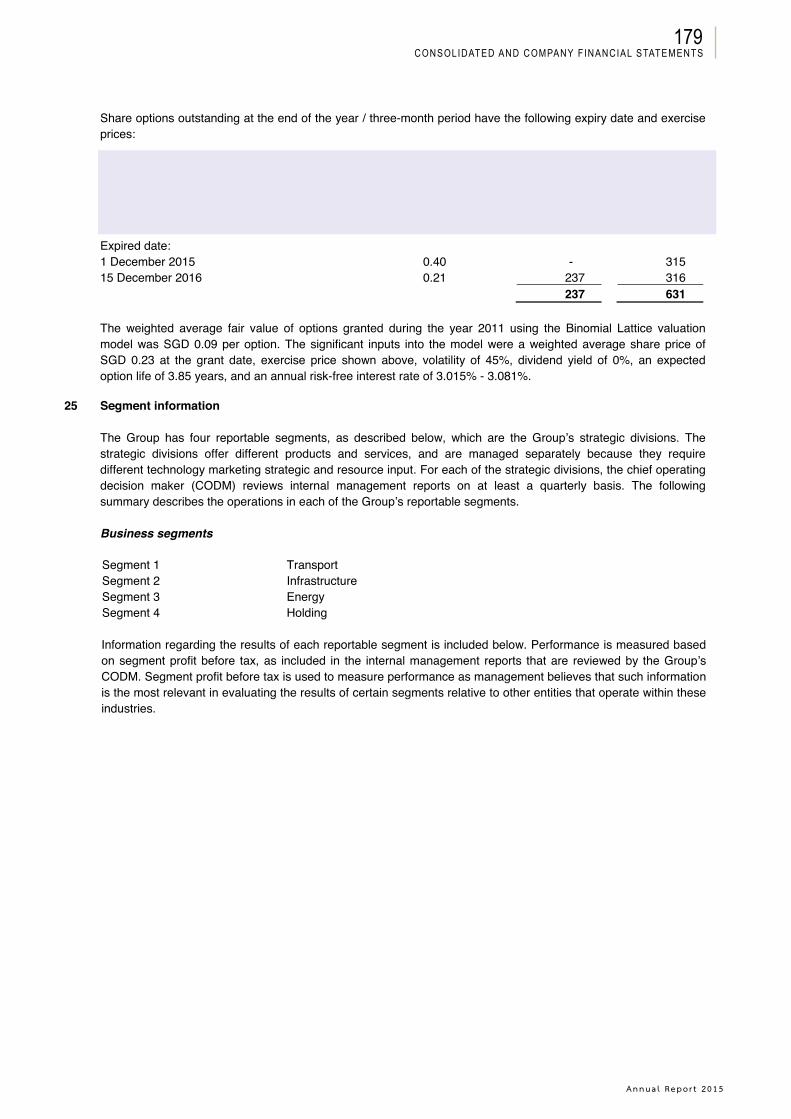
Annua l Repo r t 2015
Consolidated and Company FinanCial statements179
Thoresen Thai Agencies Public Company Limited and its SubsidiariesNotes to the financial statements
Share options outstanding at the end of the year / three-month period have the following expiry date and exercise prices:
Consolidatedfinancial statements
Exercise Price 31 December 31 DecemberSGD per 2015 2014
Share Shares’000 Shares’000Expired date:1 December 2015 0.40 - 31515 December 2016 0.21 237 316
237 631
The weighted average fair value of options granted during the year 2011 using the Binomial Lattice valuation model was SGD 0.09 per option. The significant inputs into the model were a weighted average share price of SGD 0.23 at the grant date, exercise price shown above, volatility of 45%, dividend yield of 0%, an expected option life of 3.85 years, and an annual risk-free interest rate of 3.015% - 3.081%.
25 Segment information
The Group has four reportable segments, as described below, which are the Group’s strategic divisions. The strategic divisions offer different products and services, and are managed separately because they require different technology marketing strategic and resource input. For each of the strategic divisions, the chief operating decision maker (CODM) reviews internal management reports on at least a quarterly basis. The following summary describes the operations in each of the Group’s reportable segments.
Business segments
Segment 1 TransportSegment 2 InfrastructureSegment 3 EnergySegment 4 Holding
Information regarding the results of each reportable segment is included below. Performance is measured based on segment profit before tax, as included in the internal management reports that are reviewed by the Group’s CODM. Segment profit before tax is used to measure performance as management believes that such information is the most relevant in evaluating the results of certain segments relative to other entities that operate within these industries.
67
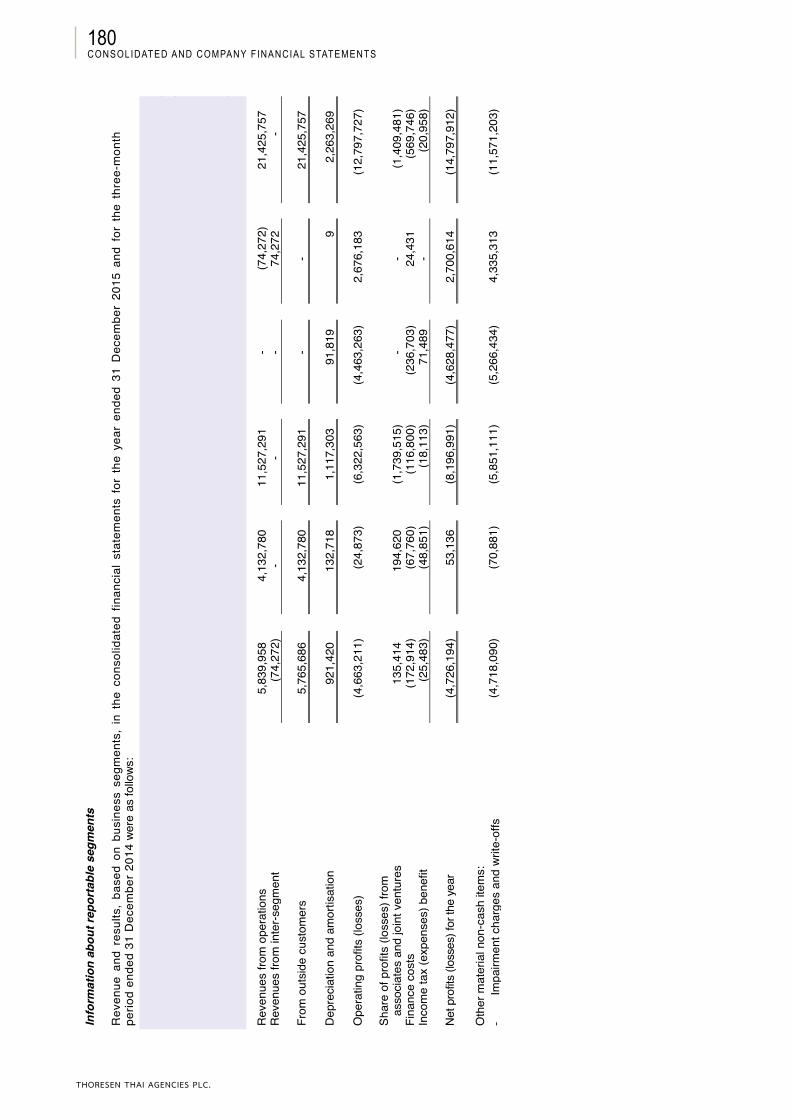
THORESEN THAI AGENCIES PLC.
Consolidated and Company FinanCial statements180
Thor
esen
Tha
i Age
ncie
s Pu
blic
Com
pany
Lim
ited
and
its S
ubsi
diar
ies
Not
es to
the
finan
cial
sta
tem
ents
Info
rmat
ion
abou
t rep
orta
ble
segm
ents
Rev
enue
and
res
ults
, ba
sed
on b
usin
ess
segm
ents
, in
the
con
solid
ated
fin
anci
al s
tate
men
ts f
or t
he y
ear
ende
d 31
Dec
embe
r 20
15 a
nd f
or t
he t
hree
-mon
th
perio
d en
ded
31 D
ecem
ber 2
014
wer
e as
follo
ws:
Con
solid
ated
fina
ncia
l sta
tem
ents
For t
he y
ear e
nded
31
Dec
embe
r 201
5El
imin
atio
n of
inte
r-se
gmen
tTr
ansp
ort
Infr
astr
uctu
reEn
ergy
Hol
ding
tran
sact
ions
Tota
l(in
thou
sand
Bah
t)
Rev
enue
s fro
m o
pera
tions
5,83
9,95
84,
132,
780
11,5
27,2
91-
(74,
272)
21,4
25,7
57R
even
ues
from
inte
r-seg
men
t(7
4,27
2)-
--
74,2
72-
From
out
side
cus
tom
ers
5,76
5,68
64,
132,
780
11,5
27,2
91-
-21
,425
,757
Dep
reci
atio
n an
d am
ortis
atio
n92
1,42
013
2,71
81,
117,
303
91,8
199
2,26
3,26
9
Ope
ratin
g pr
ofits
(los
ses)
(4,6
63,2
11)
(24,
873)
(6,3
22,5
63)
(4,4
63,2
63)
2,67
6,18
3(1
2,79
7,72
7)
Shar
e of
pro
fits
(loss
es)f
rom
as
soci
ates
and
join
t ven
ture
s13
5,41
419
4,62
0(1
,739
,515
)-
-(1
,409
,481
)Fi
nanc
e co
sts
(172
,914
)(6
7,76
0)(1
16,8
00)
(236
,703
)24
,431
(569
,746
)In
com
e ta
x (e
xpen
ses)
bene
fit(2
5,48
3)(4
8,85
1)(1
8,11
3)71
,489
-(2
0,95
8)
Net
pro
fits
(loss
es)f
or th
e ye
ar(4
,726
,194
)53
,136
(8,1
96,9
91)
(4,6
28,4
77)
2,70
0,61
4(1
4,79
7,91
2)
Oth
er m
ater
ial n
on-c
ash
item
s:-
Impa
irmen
t cha
rges
and
writ
e-of
fs(4
,718
,090
)(7
0,88
1)(5
,851
,111
)(5
,266
,434
)4,
335,
313
(11,
571,
203)
68
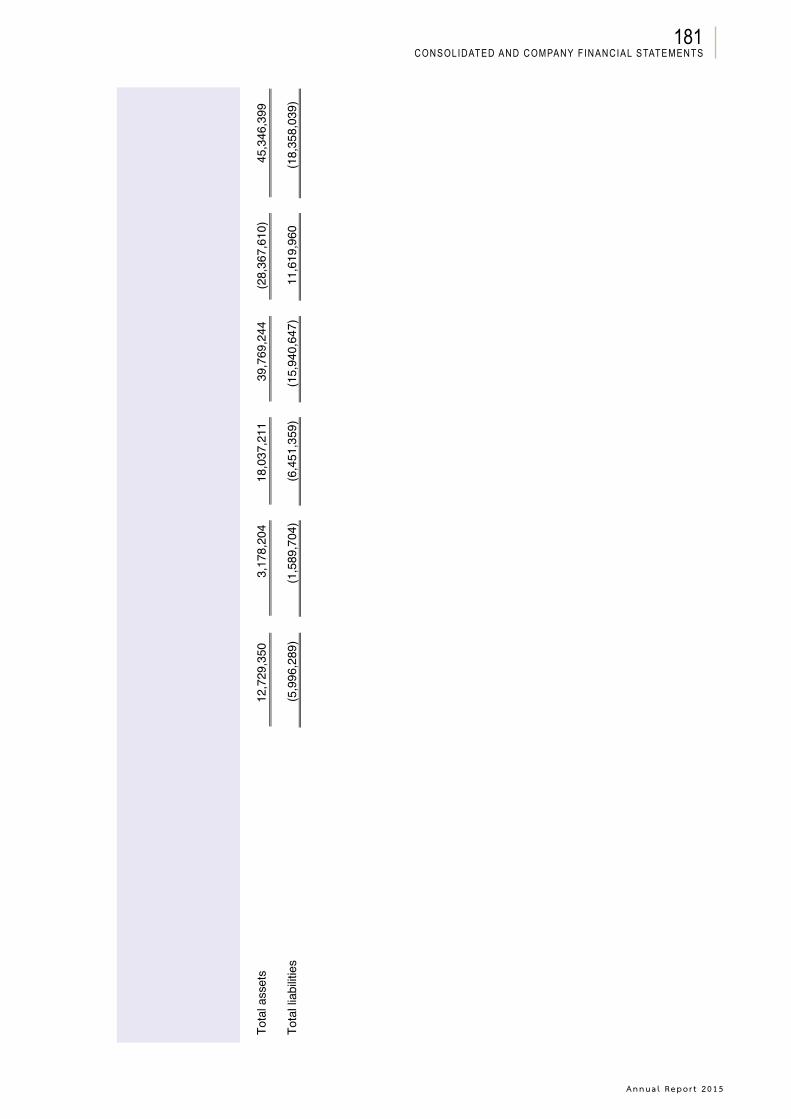
Annua l Repo r t 2015
Consolidated and Company FinanCial statements181
Thor
esen
Tha
i Age
ncie
s Pu
blic
Com
pany
Lim
ited
and
its S
ubsi
diar
ies
Note
s to
the
finan
cial
sta
tem
ents
Cons
olid
ated
fina
ncia
l sta
tem
ents
As a
t 31
Dec
embe
r 201
5El
imin
atio
n of
inte
r-se
gmen
tTr
ansp
ort
Infr
astru
ctur
eEn
ergy
Hold
ing
tran
sact
ions
Tota
l(in
thou
sand
Bah
t)
Tota
l ass
ets
12,7
29,3
503,
178,
204
18,0
37,2
1139
,769
,244
(28,
367,
610)
45,3
46,3
99
Tota
l lia
bilit
ies
(5,9
96,2
89)
(1,5
89,7
04)
(6,4
51,3
59)
(15,
940,
647)
11,6
19,9
60(1
8,35
8,03
9)
69
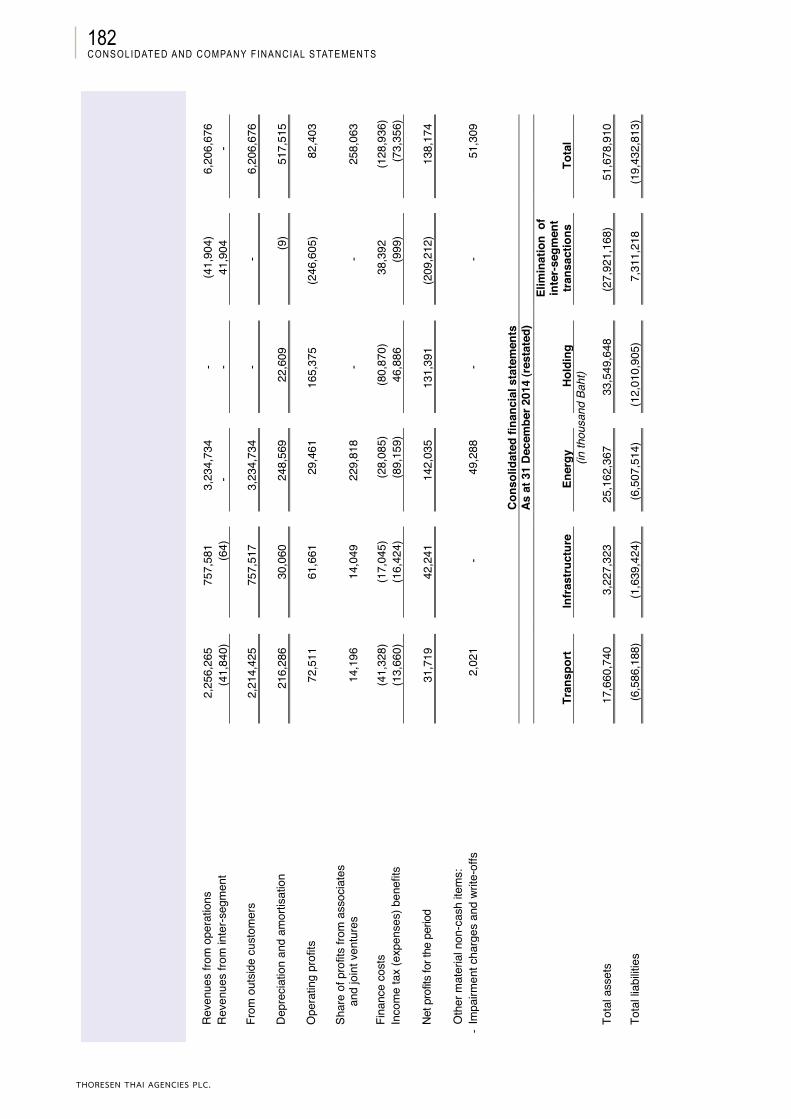
THORESEN THAI AGENCIES PLC.
Consolidated and Company FinanCial statements182
Thor
esen
Tha
i Age
ncie
s Pu
blic
Com
pany
Lim
ited
and
its S
ubsi
diar
ies
Note
s to
the
finan
cial
sta
tem
ents
Cons
olid
ated
fina
ncia
l sta
tem
ents
For t
he th
ree-
mon
th p
erio
d en
ded
31 D
ecem
ber 2
014
(res
tate
d)El
imin
atio
n of
inte
r-se
gmen
tTr
ansp
ort
Infr
astru
ctur
eEn
ergy
Hold
ing
trans
actio
nsTo
tal
(in th
ousa
nd B
aht)
Rev
enue
s fro
m o
pera
tions
2,25
6,26
575
7,58
13,
234,
734
-(4
1,90
4)6,
206,
676
Rev
enue
s fro
m in
ter-s
egm
ent
(41,
840)
(64)
--
41,9
04-
From
out
side
cus
tom
ers
2,21
4,42
575
7,51
73,
234,
734
--
6,20
6,67
6
Dep
reci
atio
n an
d am
ortis
atio
n21
6,28
630
,060
248,
569
22,6
09(9
)51
7,51
5
Ope
ratin
g pr
ofits
72
,511
61,6
6129
,461
165,
375
(246
,605
)82
,403
Shar
e of
pro
fits
from
ass
ocia
tes
and
join
t ven
ture
s14
,196
14,0
4922
9,81
8-
-25
8,06
3
Fina
nce
cost
s(4
1,32
8)(1
7,04
5)(2
8,08
5)(8
0,87
0)38
,392
(128
,936
)In
com
e ta
x (e
xpen
ses)
ben
efits
(13,
660)
(16,
424)
(89,
159)
46,8
86(9
99)
(73,
356)
Net p
rofits
for t
he p
erio
d31
,719
42,2
4114
2,03
513
1,39
1(2
09,2
12)
138,
174
Oth
er m
ater
ial n
on-c
ash
item
s:-
Impa
irmen
t cha
rges
and
writ
e-of
fs2,
021
-49
,288
--
51,3
09
Cons
olid
ated
fina
ncia
l sta
tem
ents
As a
t 31
Dec
embe
r 201
4 (r
esta
ted)
Elim
inat
ion
of
inte
r-se
gmen
tTr
ansp
ort
Infr
astru
ctur
eEn
ergy
Hold
ing
trans
actio
nsTo
tal
(in th
ousa
nd B
aht)
Tota
l ass
ets
17,6
60,7
403,
227,
323
25,1
62,3
6733
,549
,648
(27,
921,
168)
51,6
78,9
10
Tota
l lia
bilit
ies
(6,5
86,1
88)
(1,6
39,4
24)
(6,5
07,5
14)
(12,
010,
905)
7,31
1,21
8(1
9,43
2,81
3)
70
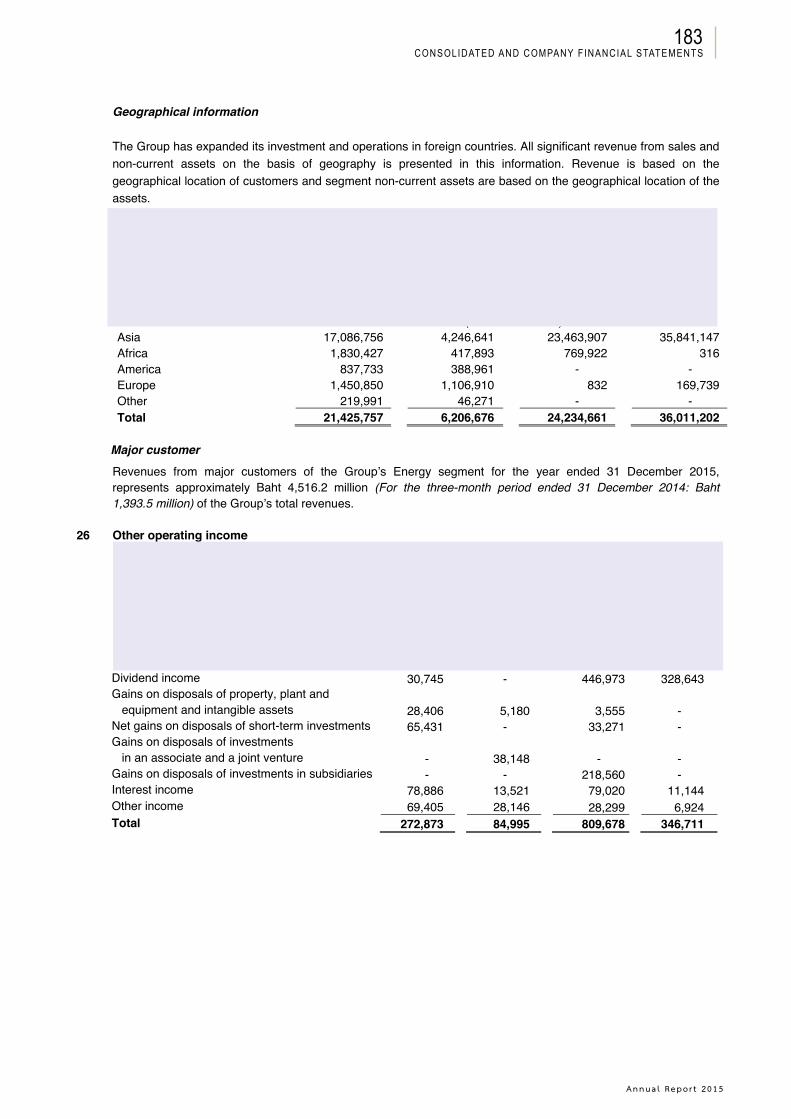
Annua l Repo r t 2015
Consolidated and Company FinanCial statements183
Thoresen Thai Agencies Public Company Limited and its SubsidiariesNotes to the financial statements
Geographical information
The Group has expanded its investment and operations in foreign countries. All significant revenue from sales and non-current assets on the basis of geography is presented in this information. Revenue is based on the geographical location of customers and segment non-current assets are based on the geographical location of the assets.
Major customer
Revenues from major customers of the Group’s Energy segment for the year ended 31 December 2015, represents approximately Baht 4,516.2 million (For the three-month period ended 31 December 2014: Baht 1,393.5 million) of the Group’s total revenues.
26 Other operating incomeConsolidated Separate
financial statements financial statementsFor the Three-month For the Three-month
year ended period ended year ended period ended31 December 31 December 31 December 31 December
2015 2014 2015 2014(restated) (restated)
(in thousand Baht)Dividend income 30,745 - 446,973 328,643Gains on disposals of property, plant and
equipment and intangible assets 28,406 5,180 3,555 -Net gains on disposals of short-term investments 65,431 - 33,271 -Gains on disposals of investments
in an associate and a joint venture - 38,148 - -Gains on disposals of investments in subsidiaries - - 218,560 -Interest income 78,886 13,521 79,020 11,144Other income 69,405 28,146 28,299 6,924Total 272,873 84,995 809,678 346,711
Consolidated financial statementsRevenue from sales Non-current assets
For the Three-monthyear ended period ended As at As at
31 December 31 December 31 December 31 December2015 2014 2015 2014
(in thousand Baht)Asia 17,086,756 4,246,641 23,463,907 35,841,147Africa 1,830,427 417,893 769,922 316America 837,733 388,961 - -Europe 1,450,850 1,106,910 832 169,739Other 219,991 46,271 - -Total 21,425,757 6,206,676 24,234,661 36,011,202
71
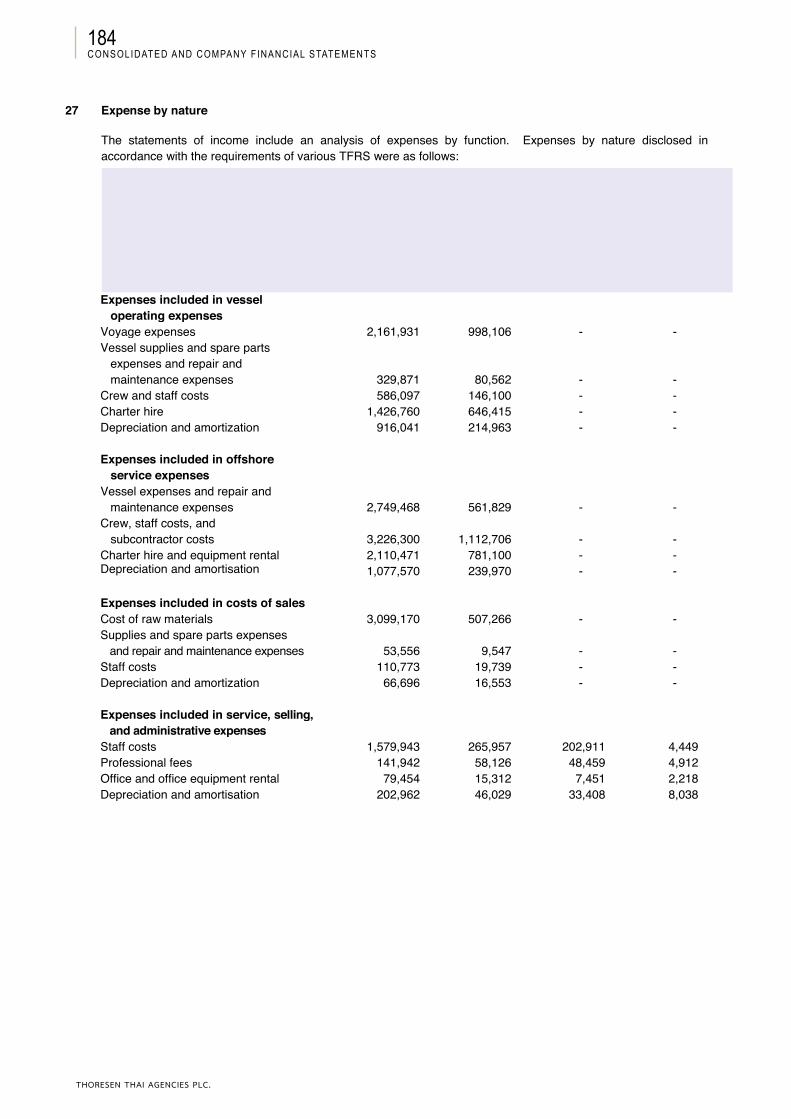
THORESEN THAI AGENCIES PLC.
Consolidated and Company FinanCial statements184
Thoresen Thai Agencies Public Company Limited and its SubsidiariesNotes to the financial statements
27 Expense by nature
The statements of income include an analysis of expenses by function. Expenses by nature disclosed in accordance with the requirements of various TFRS were as follows:
Consolidated Separate financial statements financial statements
For the Three-month For the Three-monthyear ended period ended year ended period ended
31 December 31 December 31 December 31 December2015 2014 2015 2014
(in thousand Baht)Expenses included in vessel
operating expensesVoyage expenses 2,161,931 998,106 - -Vessel supplies and spare parts
expenses and repair and maintenance expenses 329,871 80,562 - -
Crew and staff costs 586,097 146,100 - -Charter hire 1,426,760 646,415 - -Depreciation and amortization 916,041 214,963 - -
Expenses included in offshore service expenses
Vessel expenses and repair and maintenance expenses 2,749,468 561,829 - -
Crew, staff costs, and subcontractor costs 3,226,300 1,112,706 - -
Charter hire and equipment rental 2,110,471 781,100 - -Depreciation and amortisation 1,077,570 239,970 - -
Expenses included in costs of salesCost of raw materials 3,099,170 507,266 - -Supplies and spare parts expenses and repair and maintenance expenses 53,556 9,547 - -Staff costs 110,773 19,739 - -Depreciation and amortization 66,696 16,553 - -
Expenses included in service, selling, and administrative expensesStaff costs 1,579,943 265,957 202,911 4,449Professional fees 141,942 58,126 48,459 4,912Office and office equipment rental 79,454 15,312 7,451 2,218Depreciation and amortisation 202,962 46,029 33,408 8,038
72
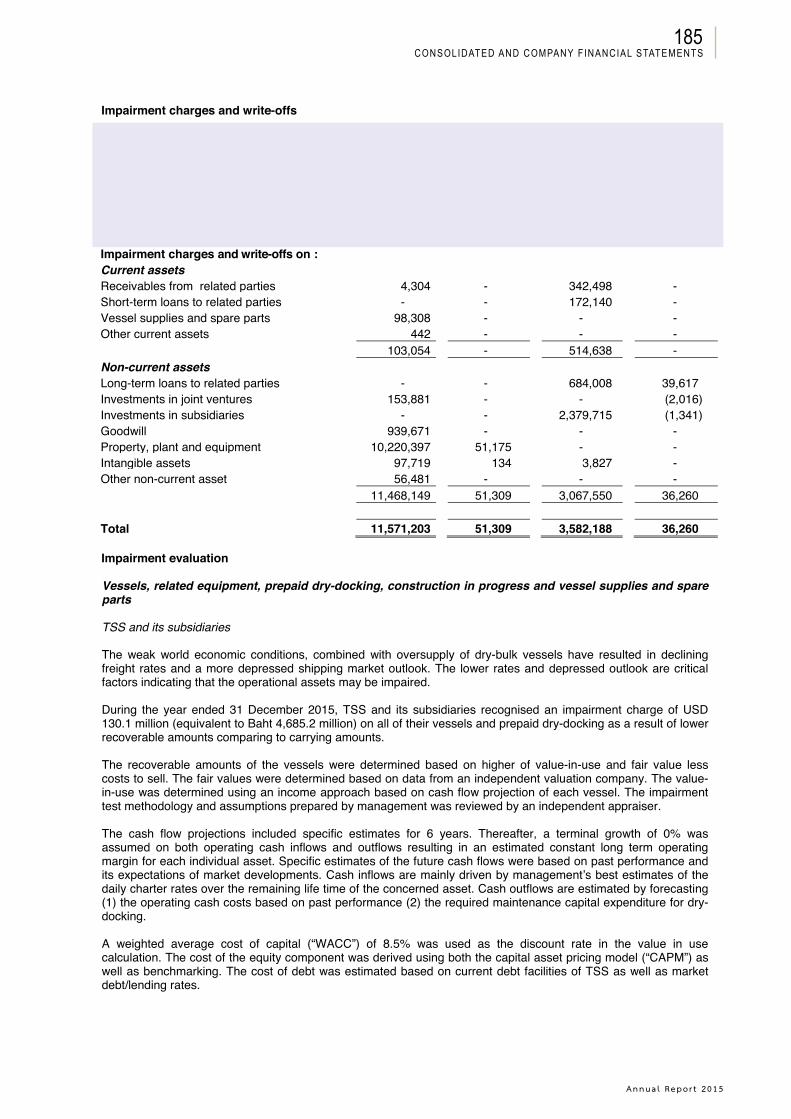
Annua l Repo r t 2015
Consolidated and Company FinanCial statements185
Thoresen Thai Agencies Public Company Limited and its SubsidiariesNotes to the financial statements
28 Impairment charges and write-offs
Consolidated Separate financial statements financial statements
For the Three-month For the Three-monthyear ended period ended year ended period ended
31 December 31 December 31 December 31 December2015 2014 2015 2014
(in thousand Baht)Impairment charges and write-offs on :Current assetsReceivables from related parties 4,304 - 342,498 -Short-term loans to related parties - - 172,140 -Vessel supplies and spare parts 98,308 - - -Other current assets 442 - - -
103,054 - 514,638 -Non-current assetsLong-term loans to related parties - - 684,008 39,617Investments in joint ventures 153,881 - - (2,016)Investments in subsidiaries - - 2,379,715 (1,341)Goodwill 939,671 - - -Property, plant and equipment 10,220,397 51,175 - -Intangible assets 97,719 134 3,827 -Other non-current asset 56,481 - - -
11,468,149 51,309 3,067,550 36,260
Total 11,571,203 51,309 3,582,188 36,260
Impairment evaluation
Vessels, related equipment, prepaid dry-docking, construction in progress and vessel supplies and spare parts
TSS and its subsidiaries
The weak world economic conditions, combined with oversupply of dry-bulk vessels have resulted in declining freight rates and a more depressed shipping market outlook. The lower rates and depressed outlook are critical factors indicating that the operational assets may be impaired.
During the year ended 31 December 2015, TSS and its subsidiaries recognised an impairment charge of USD 130.1 million (equivalent to Baht 4,685.2 million) on all of their vessels and prepaid dry-docking as a result of lower recoverable amounts comparing to carrying amounts.
The recoverable amounts of the vessels were determined based on higher of value-in-use and fair value less costs to sell. The fair values were determined based on data from an independent valuation company. The value-in-use was determined using an income approach based on cash flow projection of each vessel. The impairment test methodology and assumptions prepared by management was reviewed by an independent appraiser.
The cash flow projections included specific estimates for 6 years. Thereafter, a terminal growth of 0% was assumed on both operating cash inflows and outflows resulting in an estimated constant long term operating margin for each individual asset. Specific estimates of the future cash flows were based on past performance and its expectations of market developments. Cash inflows are mainly driven by management’s best estimates of the daily charter rates over the remaining life time of the concerned asset. Cash outflows are estimated by forecasting (1) the operating cash costs based on past performance (2) the required maintenance capital expenditure for dry-docking.
A weighted average cost of capital (“WACC”) of 8.5% was used as the discount rate in the value in use calculation. The cost of the equity component was derived using both the capital asset pricing model (“CAPM”) as well as benchmarking. The cost of debt was estimated based on current debt facilities of TSS as well as market debt/lending rates.
73
THORESEN THAI AGENCIES PLC.
Consolidated and Company FinanCial statements186
Thoresen Thai Agencies Public Company Limited and its SubsidiariesNotes to the financial statements
MMPLC
The continuing drop in oil prices during the year 2015 impacted MMPLC’s overall business as it led to reduced activity and contracts for subsea and offshore drilling services. Additionally, with more offshore rigs and subsea vessels in the market coming off contract and new builds yet to be delivered, the vessel supply and demand imbalance will continue to have a negative impact on utilisation and day rates. These have been important factors indicating that MMPLC’s assets may be impaired
During the year ended 31 December 2015, MMPLC recognised an impairment charge of USD 152.5 million (equivalent to Baht 5,463.6 million) on certain offshore support vessels and tender rigs, tools and equipment, related dry-docking, and construction in progress as a result of lower recoverable amounts compared to carrying amounts.
The recoverable amounts of the property, plant and equipment were determined based on the higher of values in use and fair values less costs to sell. The fair values were determined based on data from an independent valuation company. The value-in-use was determined using an income approach based on cash flow projection of each asset. The impairment test methodology and assumptions prepared by management was reviewed by an independent appraiser.
The key assumptions affecting cash flow projections include future utilisation rates, day rates, operating cash costs, remaining useful life and discount factor. A terminal growth rate of 0% was applied. A weighted average cost of capital (“WACC”) of 10.75% was used as the discount rate in the value in use calculations. The cost of equity component was derived using the capital asset pricing model (“CAPM”). The cost of debt was estimated based on current debt facilities of MMPLC.
Investments in subsidiaries and a joint venture
Consolidated
During the year ended 31 December 2015, the Group recognised an impairment loss on investment of SERI of Baht 153.9 million regarding investment in SERI as management is of the view the operations of SERI are not expected to be adequately financed in order to produce sufficient coal to achieve break-even performance.
The Company
During the year ended 31 December 2015, the Company recognised an impairment loss on the investment in TSS totalling Baht 2,210.7 million in the separate financial statements as a result of recoverable amount in investment in TSS was less than its carrying amount. The recoverable amount of TSS was determined based on the equity value of TSS estimated using income approach by using weight average cost of capital (“WACC”) of 8.5%.
In addition, during the year ended 31 December 2015, the Company recognised an impairment loss of Baht 167.8 million on investment in Soleado who has an indirect investment in SERI through MIN as management is of the view the operations of SERI are not expected to be adequately financed in order to produce sufficient coal to achieve break-even performance.
Goodwill
Consolidated
For the purpose of impairment testing, the Group has allocated the goodwill of Baht 650.5 million arising from acquisition of MMPLC to cash generating unit (“CGU”) of MMPLC. The recoverable amount of this CGU was based on its value in use, determined by future cash flows to be generated from the continuing use of the CGU. The carrying amount of the CGU was determined to be higher than its recoverable and the impairment loss of Baht 650.5 were allocated to goodwill.
The key assumptions used in the estimation of value in use were as follows:
Key assumptions Value Approach used to determine the valueDiscount rate 10.75% External sources of informationTerminal value growth rate 0% Constant inflationAverage budgeted EBITDA growth rate 3.21% Past experience
74

Annua l Repo r t 2015
Consolidated and Company FinanCial statements187
Thoresen Thai Agencies Public Company Limited and its SubsidiariesNotes to the financial statements
MMPLC
MMPLC’s subsidiary - Seascape CGU
The recoverable amount of Seascape CGU estimated using the value in use method was less than the total carrying amount of Seascape CGU and the goodwill allocated to it. As a result, goodwill allocated to Seascape CGU of USD 8.1 million (equivalent to Baht 289.2 million) was fully impaired as at 31 December 2015. The cash flows were projected over a period of 25 years before a terminal growth rate was applied to reflect management’s estimate of the cyclic nature of day rates earned by Seascape CGU.
The key assumptions used in the estimation of value in use were as follows:
Key assumptions Value Approach used to determine the valueDiscount rate 10.75% External sources of informationTerminal value growth rate 0% Constant inflationEBITDA growth rate Up to 4.3% Past experience
MPLC’s subsidiary - Mermaid Subsea Services (International) (“MSSI”) CGU
The recoverable amount of MSSI CGU estimated using the value in use method was greater than the total carrying amount of MSSI CGU and the goodwill allocated to it. As a result, goodwill allocated to MSSI CGU was not impaired as at 31 December 2015. The cash flows were projected over a period of 25 years before a terminal growth rate was applied to reflect management’s estimate of the cyclic nature of day rates earned by MSSI CGU.The key assumptions used in the estimation of MSSI CGU’s value in use were as follows:
Key assumptions Value Approach used to determine the valueDiscount rate 10.75% External sources of informationTerminal value growth rate 0% Constant inflationEBITDA growth rate Up to10.0% Past experience
Loans and amounts due from related parties
The Company
During the year ended 31 December 2015, the Company recognised an impairment loss of Baht 85.4 million onshort-term loan to ATH as the recoverable amount of its indirect investment in MMPLC was less than its carrying amount. The recoverable amount of MMPLC was determined based on the equity value of MMPLC estimated using income approach by using weight average cost of capital (“WACC”) of 10.75%.
In addition, the Company recognised impairment losses on amounts due from, short-term loans and long-term loans to ATH of Baht 342.0 million, Baht 86.7 million, and Baht 684.0 million, respectively, as a result of recoverable amount of its indirect investment in UMS was less than its carrying amount due to negative shareholders’ equity position of UMS as at 31 December 2015.
Intangible assets
Consolidated
During the year ended 31 December 2015, the Group recognised a further impairment loss of Baht 93.9 million on customer relationship arising from acquisition of UMS as the management expected no future economic benefitswould be generated from this customer relationship.
75
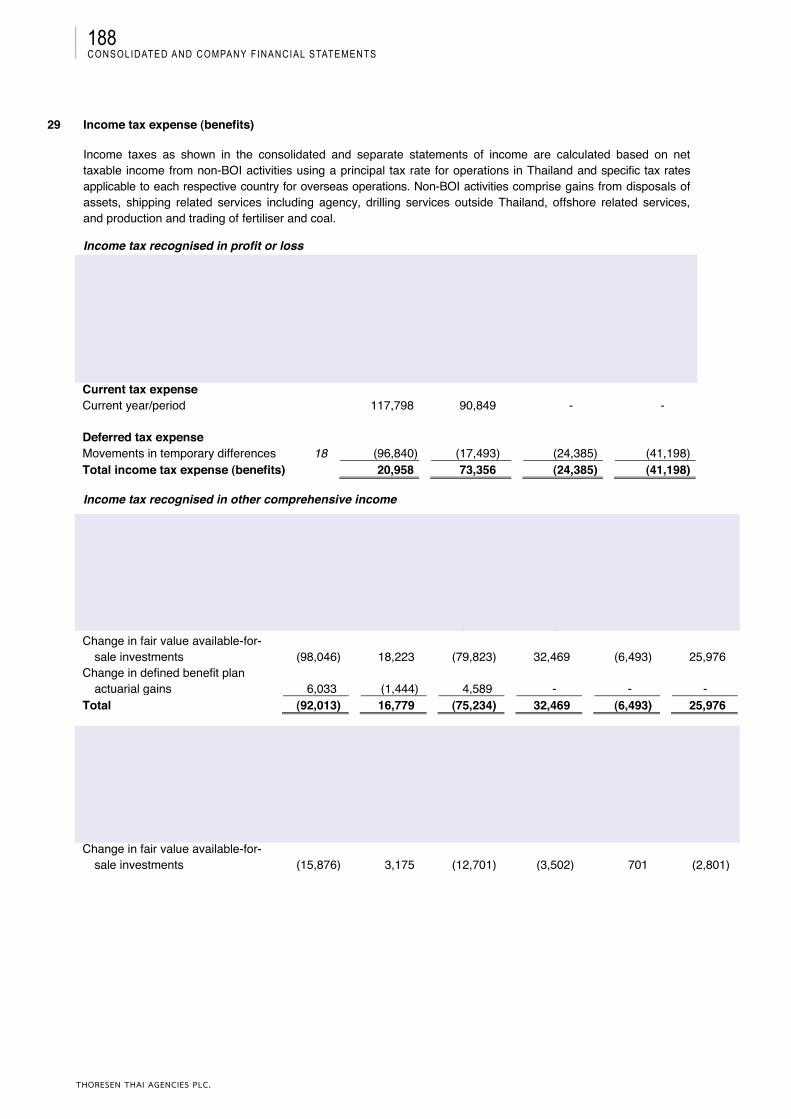
THORESEN THAI AGENCIES PLC.
Consolidated and Company FinanCial statements188
Thoresen Thai Agencies Public Company Limited and its SubsidiariesNotes to the financial statements
29 Income tax expense (benefits)
Income taxes as shown in the consolidated and separate statements of income are calculated based on net taxable income from non-BOI activities using a principal tax rate for operations in Thailand and specific tax rates applicable to each respective country for overseas operations. Non-BOI activities comprise gains from disposals of assets, shipping related services including agency, drilling services outside Thailand, offshore related services, and production and trading of fertiliser and coal.
Income tax recognised in profit or lossConsolidated
financial statementsSeparate
financial statementsFor the Three-month For the Three-month
year ended period ended year ended period ended31 December 31 December 31 December 31 December
Note 2015 2014 2015 2014(restated) (restated)
(in thousand Baht)Current tax expenseCurrent year/period 117,798 90,849 - -
Deferred tax expenseMovements in temporary differences 18 (96,840) (17,493) (24,385) (41,198)Total income tax expense (benefits) 20,958 73,356 (24,385) (41,198)
Income tax recognised in other comprehensive income
Consolidated financial statementsFor the year For the three-month period
ended 31 December 2015 ended 31 December 2014Tax Tax
Before (expense) Net of Before (expense) Net oftax benefit tax tax benefit tax
(in thousand Baht)Change in fair value available-for-
sale investments (98,046) 18,223 (79,823) 32,469 (6,493) 25,976Change in defined benefit plan
actuarial gains 6,033 (1,444) 4,589 - - -Total (92,013) 16,779 (75,234) 32,469 (6,493) 25,976
Separate financial statementsFor the year For the three-month period
ended 31 December 2015 ended 31 December 2014Tax Tax
Before (expense) Net of Before (expense) Net oftax benefit tax tax benefit tax
(in thousand Baht)Change in fair value available-for-
sale investments (15,876) 3,175 (12,701) (3,502) 701 (2,801)
76

Annua l Repo r t 2015
Consolidated and Company FinanCial statements189
Thoresen Thai Agencies Public Company Limited and its SubsidiariesNotes to the financial statements
Reconciliation of effective tax rate
Consolidated financial statements For the year
endedFor the three-month period
ended31 December 2015 31 December 2014
(restated)Rate(%)
(in thousand Baht)
Rate(%)
(in thousandBaht)
Profit (loss) before income tax expense (14,776,954) 211,530Income tax using the Thai corporation tax rate 20 (2,955,391) 20 42,306Change in tax rate - (9,022) 5 14,982Effect of different tax rates in foreign
jurisdictions (7) 1,073,119 19 57,568Income not subject to tax 7 (1,046,834) (46) (136,228)Expenses not deductible for tax purposes (1) 96,600 24 71,814Recognition of previously unrecognised
tax losses - (48,019) (1) (2,606)Current year losses and temporary differences
which no deferred tax was recognised (19) 2,853,616 11 32,019Withholding tax not recoverable
written-off - - - 148Under (over) provided in prior years - 2,437 (7) (20,876)Foreign currency translation differences (1) 54,452 5 14,229Total (1) 20,958 30 73,356
Separate financial statements For the year
endedFor the three-month period
ended31 December 2015 31 December 2014
(restated)Rate(%)
(in thousand Baht)
Rate(%)
(in thousand Baht)
Profit (loss) before income tax expense (3,842,318) 118,149Income tax using the Thai corporation tax rate 20 (768,464) 20 23,630Income not subject to tax 1 (41,553) (21) (43,986)Expenses not deductible for tax purposes (2) 68,784 4 7,618Under (over) provided in prior years - 4 (14) (28,460)Current year losses and temporary differences for which
no deferred tax asset was recognised (18) 716,844 - -Total 1 (24,385) (11) (41,198)
Income tax reduction
Royal Decree No. 577 B.E. 2557 dated 10 November 2014 grants the reduction to 20% of the next taxable profit for the accounting period 2015 which begins on or after 1 January 2015.
On 22 January 2016, the National Legislative Assembly has approved the corporate income tax rate from 30% to 20% of the net taxable profit for the accounting period which begins on or after 1 January 2016
The Group has applied the tax rate of 20% in measuring deferred tax assets and liabilities as at 31 December2015 and 2014 in accordance with the clarification issued by the FAP in 2012.
77
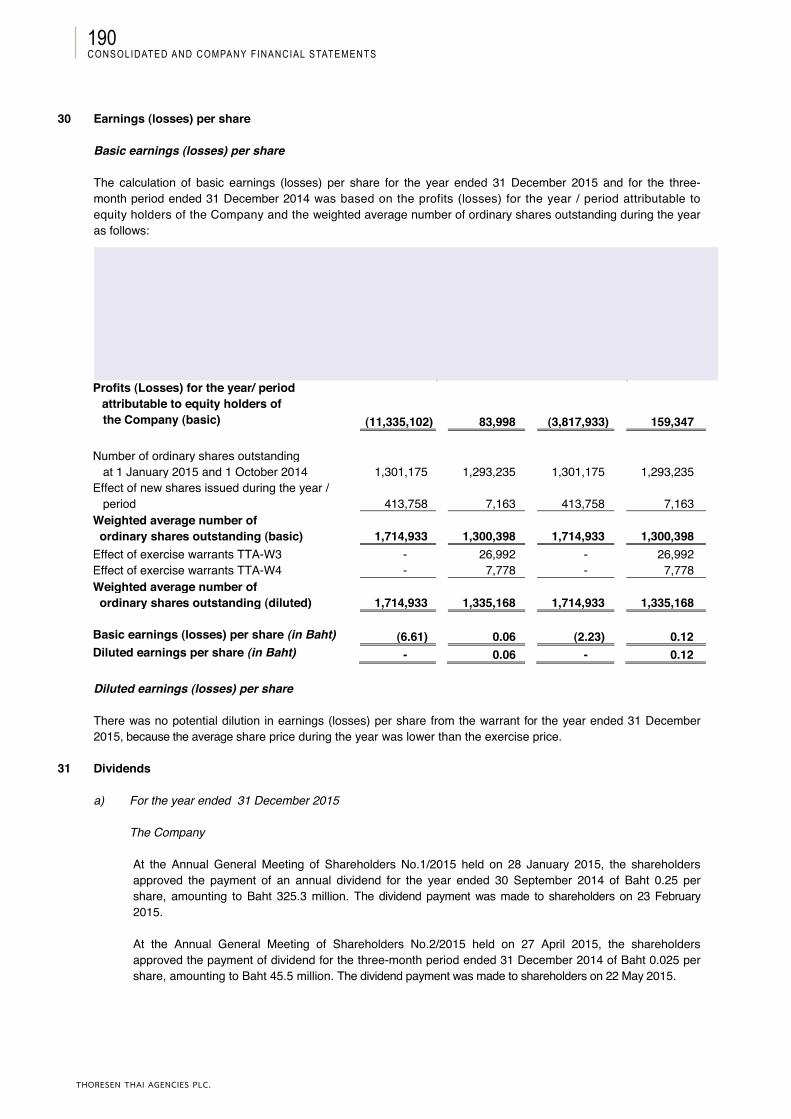
THORESEN THAI AGENCIES PLC.
Consolidated and Company FinanCial statements190
Thoresen Thai Agencies Public Company Limited and its SubsidiariesNotes to the financial statements
30 Earnings (losses) per share
Basic earnings (losses) per share
The calculation of basic earnings (losses) per share for the year ended 31 December 2015 and for the three-month period ended 31 December 2014 was based on the profits (losses) for the year / period attributable to equity holders of the Company and the weighted average number of ordinary shares outstanding during the yearas follows:
Consolidated Separatefinancial statements financial statements
For the Three-month For the Three-monthyear ended period ended year ended period ended
31 December 31 December 31 December 31 December2015 2014
(restated)2015 2014
(restated)(in thousand Baht / thousand shares)
Profits (Losses) for the year/ periodattributable to equity holders ofthe Company (basic) (11,335,102) 83,998 (3,817,933) 159,347
Number of ordinary shares outstanding at 1 January 2015 and 1 October 2014 1,301,175 1,293,235 1,301,175 1,293,235
Effect of new shares issued during the year /period 413,758 7,163 413,758 7,163
Weighted average number ofordinary shares outstanding (basic) 1,714,933 1,300,398 1,714,933 1,300,398
Effect of exercise warrants TTA-W3 - 26,992 - 26,992Effect of exercise warrants TTA-W4 - 7,778 - 7,778Weighted average number of
ordinary shares outstanding (diluted) 1,714,933 1,335,168 1,714,933 1,335,168
Basic earnings (losses) per share (in Baht) (6.61) 0.06 (2.23) 0.12Diluted earnings per share (in Baht) - 0.06 - 0.12
Diluted earnings (losses) per share
There was no potential dilution in earnings (losses) per share from the warrant for the year ended 31 December2015, because the average share price during the year was lower than the exercise price.
31 Dividends
a) For the year ended 31 December 2015
The Company
At the Annual General Meeting of Shareholders No.1/2015 held on 28 January 2015, the shareholders approved the payment of an annual dividend for the year ended 30 September 2014 of Baht 0.25 per share, amounting to Baht 325.3 million. The dividend payment was made to shareholders on 23 February2015.
At the Annual General Meeting of Shareholders No.2/2015 held on 27 April 2015, the shareholders approved the payment of dividend for the three-month period ended 31 December 2014 of Baht 0.025 per share, amounting to Baht 45.5 million. The dividend payment was made to shareholders on 22 May 2015.
78
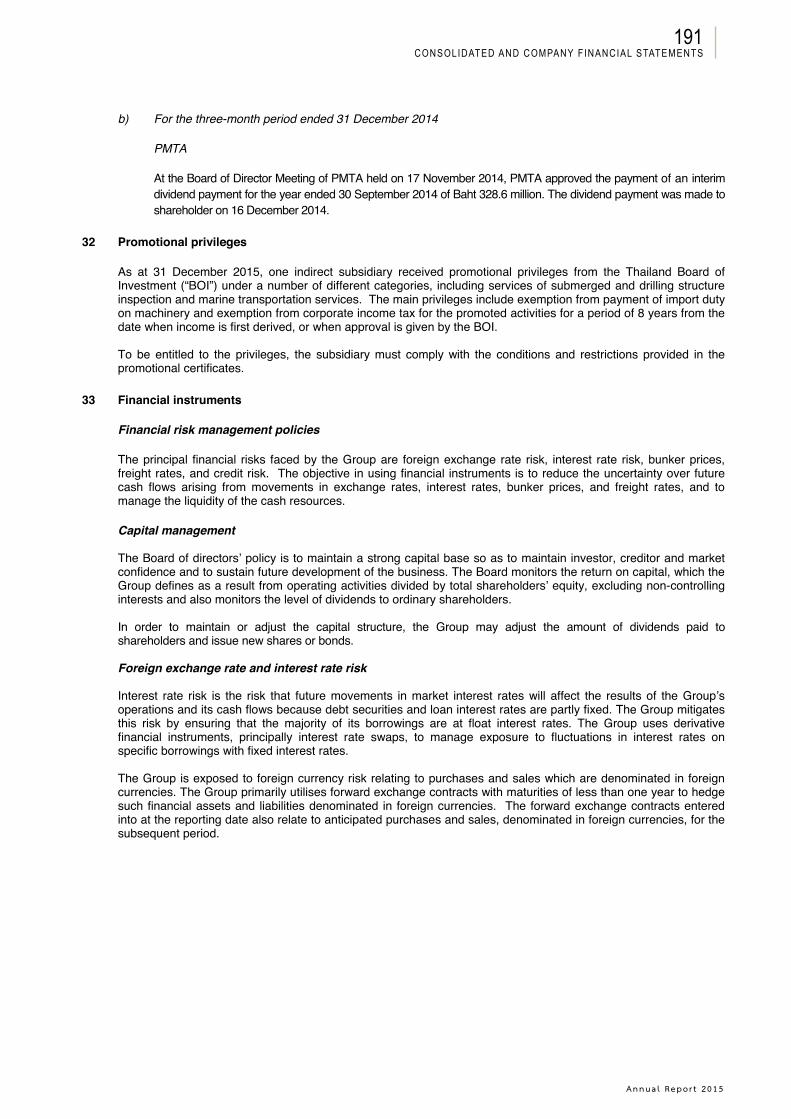
Annua l Repo r t 2015
Consolidated and Company FinanCial statements191
Thoresen Thai Agencies Public Company Limited and its SubsidiariesNotes to the financial statements
b) For the three-month period ended 31 December 2014
PMTA
At the Board of Director Meeting of PMTA held on 17 November 2014, PMTA approved the payment of an interim dividend payment for the year ended 30 September 2014 of Baht 328.6 million. The dividend payment was made to shareholder on 16 December 2014.
32 Promotional privileges
As at 31 December 2015, one indirect subsidiary received promotional privileges from the Thailand Board of Investment (“BOI”) under a number of different categories, including services of submerged and drilling structure inspection and marine transportation services. The main privileges include exemption from payment of import duty on machinery and exemption from corporate income tax for the promoted activities for a period of 8 years from the date when income is first derived, or when approval is given by the BOI.
To be entitled to the privileges, the subsidiary must comply with the conditions and restrictions provided in the promotional certificates.
33 Financial instruments
Financial risk management policies
The principal financial risks faced by the Group are foreign exchange rate risk, interest rate risk, bunker prices, freight rates, and credit risk. The objective in using financial instruments is to reduce the uncertainty over future cash flows arising from movements in exchange rates, interest rates, bunker prices, and freight rates, and to manage the liquidity of the cash resources.
Capital management
The Board of directors’ policy is to maintain a strong capital base so as to maintain investor, creditor and market confidence and to sustain future development of the business. The Board monitors the return on capital, which the Group defines as a result from operating activities divided by total shareholders’ equity, excluding non-controlling interests and also monitors the level of dividends to ordinary shareholders.
In order to maintain or adjust the capital structure, the Group may adjust the amount of dividends paid to shareholders and issue new shares or bonds.
Foreign exchange rate and interest rate risk
Interest rate risk is the risk that future movements in market interest rates will affect the results of the Group’s operations and its cash flows because debt securities and loan interest rates are partly fixed. The Group mitigates this risk by ensuring that the majority of its borrowings are at float interest rates. The Group uses derivative financial instruments, principally interest rate swaps, to manage exposure to fluctuations in interest rates on specific borrowings with fixed interest rates.
The Group is exposed to foreign currency risk relating to purchases and sales which are denominated in foreign currencies. The Group primarily utilises forward exchange contracts with maturities of less than one year to hedge such financial assets and liabilities denominated in foreign currencies. The forward exchange contracts entered into at the reporting date also relate to anticipated purchases and sales, denominated in foreign currencies, for the subsequent period.
79
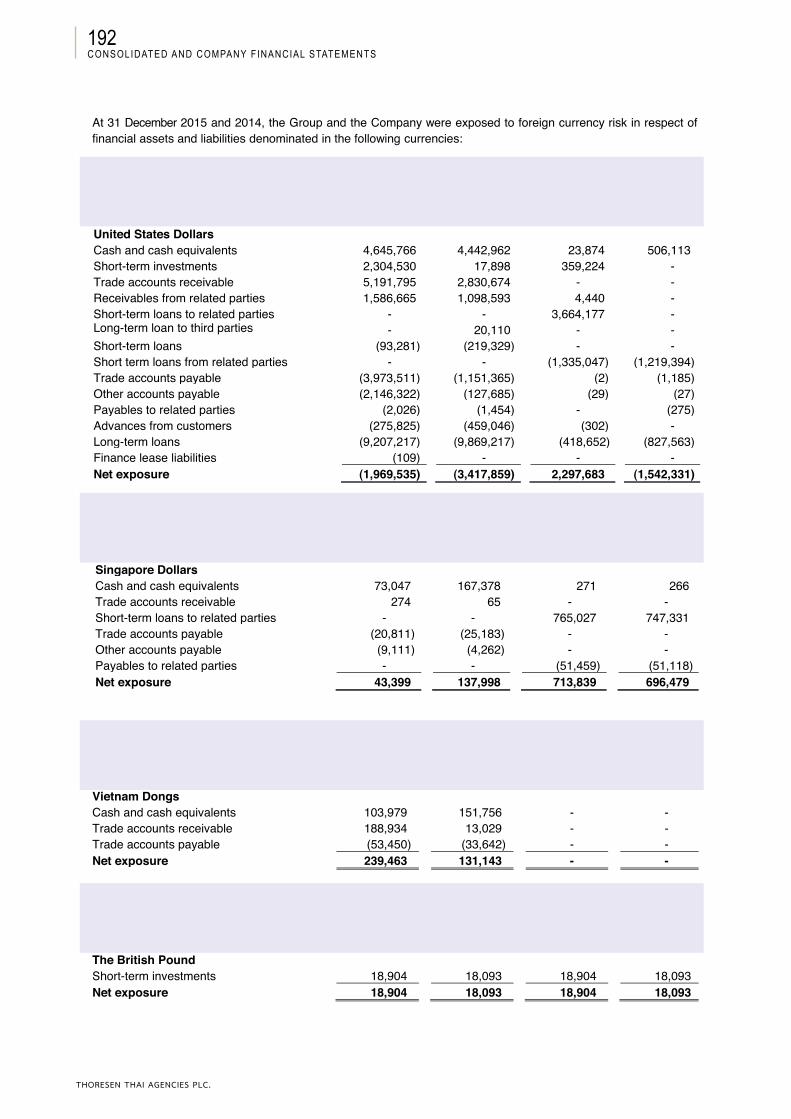
THORESEN THAI AGENCIES PLC.
Consolidated and Company FinanCial statements192
Thoresen Thai Agencies Public Company Limited and its SubsidiariesNotes to the financial statements
At 31 December 2015 and 2014, the Group and the Company were exposed to foreign currency risk in respect of financial assets and liabilities denominated in the following currencies:
Consolidated financial statements
Separate financial statements
2015 2014 2015 2014(in thousand Baht)
United States DollarsCash and cash equivalents 4,645,766 4,442,962 23,874 506,113Short-term investments 2,304,530 17,898 359,224 -Trade accounts receivable 5,191,795 2,830,674 - -Receivables from related parties 1,586,665 1,098,593 4,440 -Short-term loans to related parties - - 3,664,177 -Long-term loan to third parties - 20,110 - -Short-term loans (93,281) (219,329) - -Short term loans from related parties - - (1,335,047) (1,219,394)Trade accounts payable (3,973,511) (1,151,365) (2) (1,185)Other accounts payable (2,146,322) (127,685) (29) (27)Payables to related parties (2,026) (1,454) - (275)Advances from customers (275,825) (459,046) (302) -Long-term loans (9,207,217) (9,869,217) (418,652) (827,563)Finance lease liabilities (109) - - -Net exposure (1,969,535) (3,417,859) 2,297,683 (1,542,331)
Consolidated financial statements
Separate financial statements
2015 2014 2015 2014(in thousand Baht)
Singapore DollarsCash and cash equivalents 73,047 167,378 271 266Trade accounts receivable 274 65 - -Short-term loans to related parties - - 765,027 747,331Trade accounts payable (20,811) (25,183) - -Other accounts payable (9,111) (4,262) - -Payables to related parties - - (51,459) (51,118)Net exposure 43,399 137,998 713,839 696,479
Consolidated financial statements
Separate financial statements
2015 2014 2015 2014(in thousand Baht)
Vietnam DongsCash and cash equivalents 103,979 151,756 - -Trade accounts receivable 188,934 13,029 - -Trade accounts payable (53,450) (33,642) - -Net exposure 239,463 131,143 - -
Consolidated financial statements
Separate financial statements
2015 2014 2015 2014(in thousand Baht)
The British PoundShort-term investments 18,904 18,093 18,904 18,093Net exposure 18,904 18,093 18,904 18,093
80
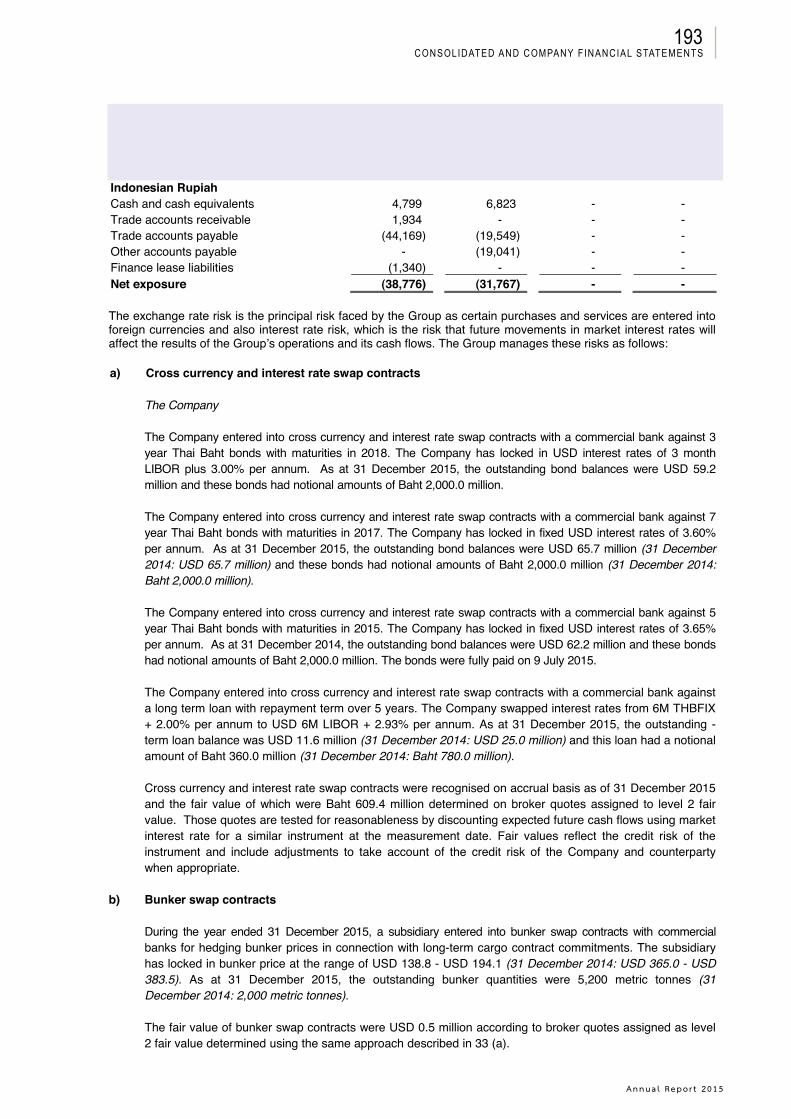
Annua l Repo r t 2015
Consolidated and Company FinanCial statements193
Thoresen Thai Agencies Public Company Limited and its SubsidiariesNotes to the financial statements
Consolidated financial statements
Separate financial statements
2015 2014 2015 2014(in thousand Baht)
Indonesian RupiahCash and cash equivalents 4,799 6,823 - -Trade accounts receivable 1,934 - - -Trade accounts payable (44,169) (19,549) - -Other accounts payable - (19,041) - -Finance lease liabilities (1,340) - - -Net exposure (38,776) (31,767) - -
The exchange rate risk is the principal risk faced by the Group as certain purchases and services are entered into foreign currencies and also interest rate risk, which is the risk that future movements in market interest rates will affect the results of the Group’s operations and its cash flows. The Group manages these risks as follows:
a) Cross currency and interest rate swap contracts
The Company
The Company entered into cross currency and interest rate swap contracts with a commercial bank against 3 year Thai Baht bonds with maturities in 2018. The Company has locked in USD interest rates of 3 month LIBOR plus 3.00% per annum. As at 31 December 2015, the outstanding bond balances were USD 59.2 million and these bonds had notional amounts of Baht 2,000.0 million.
The Company entered into cross currency and interest rate swap contracts with a commercial bank against 7 year Thai Baht bonds with maturities in 2017. The Company has locked in fixed USD interest rates of 3.60% per annum. As at 31 December 2015, the outstanding bond balances were USD 65.7 million (31 December 2014: USD 65.7 million) and these bonds had notional amounts of Baht 2,000.0 million (31 December 2014: Baht 2,000.0 million).
The Company entered into cross currency and interest rate swap contracts with a commercial bank against 5 year Thai Baht bonds with maturities in 2015. The Company has locked in fixed USD interest rates of 3.65% per annum. As at 31 December 2014, the outstanding bond balances were USD 62.2 million and these bonds had notional amounts of Baht 2,000.0 million. The bonds were fully paid on 9 July 2015.
The Company entered into cross currency and interest rate swap contracts with a commercial bank against a long term loan with repayment term over 5 years. The Company swapped interest rates from 6M THBFIX + 2.00% per annum to USD 6M LIBOR + 2.93% per annum. As at 31 December 2015, the outstanding -term loan balance was USD 11.6 million (31 December 2014: USD 25.0 million) and this loan had a notional amount of Baht 360.0 million (31 December 2014: Baht 780.0 million).
Cross currency and interest rate swap contracts were recognised on accrual basis as of 31 December 2015 and the fair value of which were Baht 609.4 million determined on broker quotes assigned to level 2 fair value. Those quotes are tested for reasonableness by discounting expected future cash flows using market interest rate for a similar instrument at the measurement date. Fair values reflect the credit risk of the instrument and include adjustments to take account of the credit risk of the Company and counterparty when appropriate.
b) Bunker swap contracts
During the year ended 31 December 2015, a subsidiary entered into bunker swap contracts with commercialbanks for hedging bunker prices in connection with long-term cargo contract commitments. The subsidiary has locked in bunker price at the range of USD 138.8 - USD 194.1 (31 December 2014: USD 365.0 - USD 383.5). As at 31 December 2015, the outstanding bunker quantities were 5,200 metric tonnes (31 December 2014: 2,000 metric tonnes).
The fair value of bunker swap contracts were USD 0.5 million according to broker quotes assigned as level 2 fair value determined using the same approach described in 33 (a).
81

THORESEN THAI AGENCIES PLC.
Consolidated and Company FinanCial statements194
Thoresen Thai Agencies Public Company Limited and its SubsidiariesNotes to the financial statements
c) Forward freight agreements
TSS entered into forward freight agreements with financial institutions and exchange traded derivatives for hedging freight rates in connection with chartered-in vessels. TSS has locked in freight rates at a range of USD 5,110 - USD 6,190 per day (31 December 2014: USD 8,750 - USD 9,500 per day). As at 31 December 2015, the outstanding forward freight agreements to sell are 240 days (31 December 2014: 420 days).
The fair value of forward freight agreements were USD 0.4 million determined on broker quotes assigned as level 2 fair value using the same approach described in 33 (a).
Credit risk
Credit risk is the potential financial loss resulting from the failure of a customer or counterparty to settle its financial and contractual obligations to the Group as and when they fall due.
Management has a credit policy in place and the exposure to credit risk is monitored on an ongoing basis. Credit evaluations are performed on all customers requiring credit over a certain amount. At the reporting date there were no significant concentrations of credit risk. The maximum exposure to credit risk is represented by the carrying amount of each financial asset in the statement of financial position. However, due to the large number of parties comprising the Group’s customer base, Management does not anticipate material losses from its debt collection.
Liquidity risk
The Group monitors its liquidity risk and maintains a level of cash and cash equivalents deemed adequate by management to finance the Group’s operations and to mitigate the effects of fluctuations in cash flows.
Fair values of financial assets and liabilities
Apart from those mentioned in note 7, 20 and 33(a) to 33(c), the fair value of financial assets and liabilities as of 31 December 2015 are taken to approximate the carrying values due to the relatively short-term maturity of these financial assets and liabilities.
34 Commitments and contingent liabilities
34.1 Capital commitments
The Group has significant capital commitments towards building, machinery, warehouse construction, ship building, dry-docking, and vessel equipment contracts but not yet recognised as liabilities as at 31 December2015 and 2014 as follows:
Consolidated Separatefinancial statements financial statements
2015 2014 2015 2014(in millions Baht)
- USD 373.6 374.4 - -- VND 5,220.3 47,752.6 - -- THB 1.9 1.9 - -
82
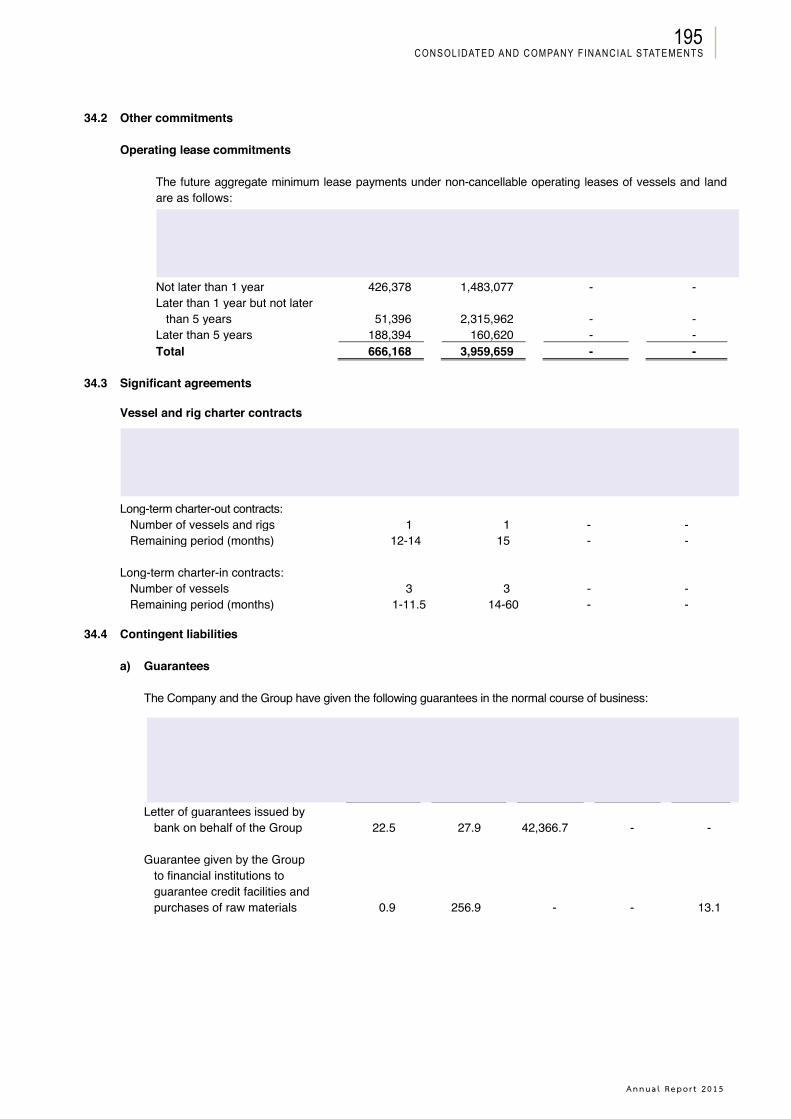
Annua l Repo r t 2015
Consolidated and Company FinanCial statements195
Thoresen Thai Agencies Public Company Limited and its SubsidiariesNotes to the financial statements
34.2 Other commitments
Operating lease commitments
The future aggregate minimum lease payments under non-cancellable operating leases of vessels and land are as follows:
Consolidated Separatefinancial statements financial statements
2015 2014 2015 2014(in thousand Baht)
Not later than 1 year 426,378 1,483,077 - -Later than 1 year but not later
than 5 years 51,396 2,315,962 - -Later than 5 years 188,394 160,620 - -Total 666,168 3,959,659 - -
34.3 Significant agreements
Vessel and rig charter contracts
Consolidated financial statements
Separatefinancial statements
2015 2014 2015 2014
Long-term charter-out contracts:Number of vessels and rigs 1 1 - -Remaining period (months) 12-14 15 - -
Long-term charter-in contracts:Number of vessels 3 3 - -Remaining period (months) 1-11.5 14-60 - -
34.4 Contingent liabilities
a) Guarantees
The Company and the Group have given the following guarantees in the normal course of business:
31 December 2015Consolidated
financial statementsBaht
millionUSD
millionVND
millionAED
millionQAR
millionLetter of guarantees issued by
bank on behalf of the Group 22.5 27.9 42,366.7 - -
Guarantee given by the Group to financial institutions to guarantee credit facilities andpurchases of raw materials 0.9 256.9 - - 13.1
83
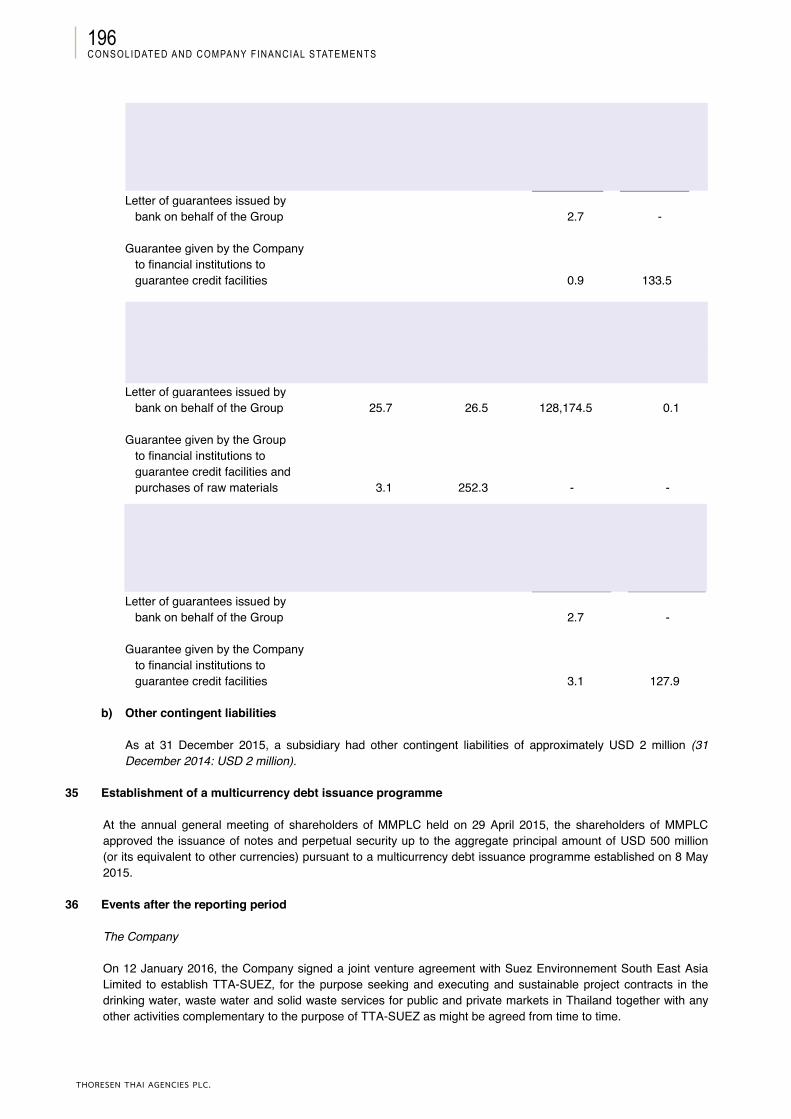
THORESEN THAI AGENCIES PLC.
Consolidated and Company FinanCial statements196
Thoresen Thai Agencies Public Company Limited and its SubsidiariesNotes to the financial statements
31 December 2015Separate
financial statementsBaht
millionUSD
millionLetter of guarantees issued by
bank on behalf of the Group 2.7 -
Guarantee given by the Companyto financial institutions to guarantee credit facilities 0.9 133.5
31 December 2014Consolidated
financial statementsBaht
millionUSD
millionVND
millionAED
millionLetter of guarantees issued by
bank on behalf of the Group 25.7 26.5 128,174.5 0.1
Guarantee given by the Group to financial institutions to guarantee credit facilities andpurchases of raw materials 3.1 252.3 - -
31 December 2014Separate
financial statementsBaht
millionUSD
millionLetter of guarantees issued by
bank on behalf of the Group 2.7 -
Guarantee given by the Companyto financial institutions to guarantee credit facilities 3.1 127.9
b) Other contingent liabilities
As at 31 December 2015, a subsidiary had other contingent liabilities of approximately USD 2 million (31December 2014: USD 2 million).
35 Establishment of a multicurrency debt issuance programme
At the annual general meeting of shareholders of MMPLC held on 29 April 2015, the shareholders of MMPLC approved the issuance of notes and perpetual security up to the aggregate principal amount of USD 500 million (or its equivalent to other currencies) pursuant to a multicurrency debt issuance programme established on 8 May 2015.
36 Events after the reporting period
The Company
On 12 January 2016, the Company signed a joint venture agreement with Suez Environnement South East Asia Limited to establish TTA-SUEZ, for the purpose seeking and executing and sustainable project contracts in the drinking water, waste water and solid waste services for public and private markets in Thailand together with any other activities complementary to the purpose of TTA-SUEZ as might be agreed from time to time.
84
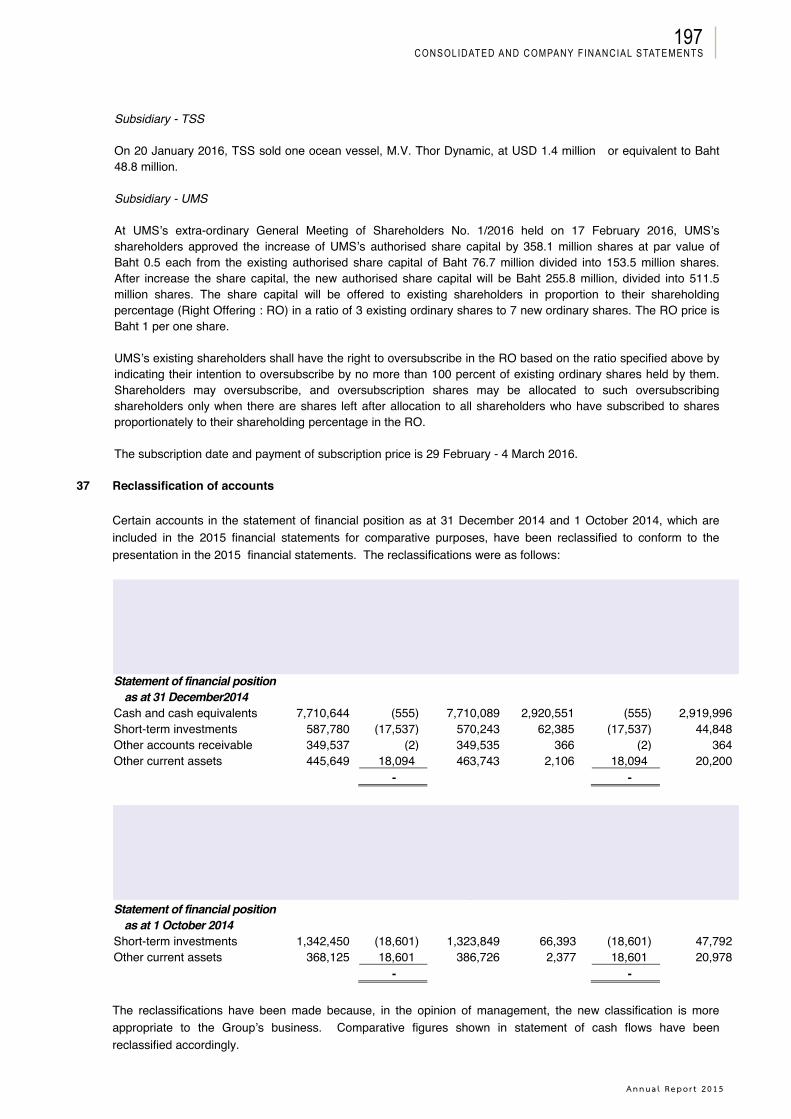
Annua l Repo r t 2015
Consolidated and Company FinanCial statements197
Thoresen Thai Agencies Public Company Limited and its SubsidiariesNotes to the financial statements
Subsidiary - TSS
On 20 January 2016, TSS sold one ocean vessel, M.V. Thor Dynamic, at USD 1.4 million or equivalent to Baht 48.8 million.
Subsidiary - UMS
At UMS’s extra-ordinary General Meeting of Shareholders No. 1/2016 held on 17 February 2016, UMS’s shareholders approved the increase of UMS’s authorised share capital by 358.1 million shares at par value of Baht 0.5 each from the existing authorised share capital of Baht 76.7 million divided into 153.5 million shares. After increase the share capital, the new authorised share capital will be Baht 255.8 million, divided into 511.5 million shares. The share capital will be offered to existing shareholders in proportion to their shareholding percentage (Right Offering : RO) in a ratio of 3 existing ordinary shares to 7 new ordinary shares. The RO price is Baht 1 per one share.
UMS’s existing shareholders shall have the right to oversubscribe in the RO based on the ratio specified above by indicating their intention to oversubscribe by no more than 100 percent of existing ordinary shares held by them. Shareholders may oversubscribe, and oversubscription shares may be allocated to such oversubscribing shareholders only when there are shares left after allocation to all shareholders who have subscribed to shares proportionately to their shareholding percentage in the RO.
The subscription date and payment of subscription price is 29 February - 4 March 2016.
37 Reclassification of accounts
Certain accounts in the statement of financial position as at 31 December 2014 and 1 October 2014, which are included in the 2015 financial statements for comparative purposes, have been reclassified to conform to the presentation in the 2015 financial statements. The reclassifications were as follows:
As at 31 December 2014Consolidated
financial statementsSeparate
financial statementsBeforereclass. Reclass.
Afterreclass.
Beforereclass. Reclass.
Afterreclass.
(in thousand Baht)Statement of financial position
as at 31 December2014Cash and cash equivalents 7,710,644 (555) 7,710,089 2,920,551 (555) 2,919,996Short-term investments 587,780 (17,537) 570,243 62,385 (17,537) 44,848Other accounts receivable 349,537 (2) 349,535 366 (2) 364Other current assets 445,649 18,094 463,743 2,106 18,094 20,200
- -
As at 1 October 2014Consolidated
financial statementsSeparate
financial statementsBeforereclass. Reclass.
Afterreclass.
Beforereclass. Reclass.
Afterreclass.
(in thousand Baht)Statement of financial position
as at 1 October 2014 Short-term investments 1,342,450 (18,601) 1,323,849 66,393 (18,601) 47,792Other current assets 368,125 18,601 386,726 2,377 18,601 20,978
- -
The reclassifications have been made because, in the opinion of management, the new classification is more appropriate to the Group’s business. Comparative figures shown in statement of cash flows have been reclassified accordingly.
85

THORESEN THAI AGENCIES PLC.
Consolidated and Company FinanCial statements198
Thoresen Thai Agencies Public Company Limited and its SubsidiariesNotes to the financial statements
38 Thai Financial Reporting Standards (TFRS) not yet adopted
A number of new and revised TFRS have been issued but are not yet effective and have not been applied in preparing these financial statements. Those new and revised TFRS that may be relevant to the Group’s operations, which become effective for annual financial periods beginning on or after 1 January 2016, are set out below. The Group does not plan to adopt these TFRS early.
TFRS TopicYear
effective
TAS 1 (revised 2015) Presentation of Financial Statements 2016TAS 2 (revised 2015) Inventories 2016TAS 7 (revised 2015) Statement of Cash Flows 2016TAS 8 (revised 2015) Accounting Policies, Changes in Accounting Estimates
and Errors2016
TAS 10 (revised 2015) Events After the Reporting Period 2016TAS 12 (revised 2015) Income Taxes 2016TAS 16 (revised 2015) Property, Plant and Equipment 2016TAS 17 (revised 2015) Leases 2016TAS 18 (revised 2015) Revenue 2016TAS 19 (revised 2015) Employee Benefits 2016TAS 21 (revised 2015) The Effects of Changes in Foreign Exchange Rates 2016TAS 23 (revised 2015) Borrowing Costs 2016TAS 24 (revised 2015) Related Party Disclosures 2016TAS 26 (revised 2015) Accounting and Reporting by Retirement Benefit Plans 2016TAS 27 (revised 2015) Separate Financial Statements 2016TAS 28 (revised 2015) Investments in Associates and Joint Ventures 2016TAS 33 (revised 2015) Earnings Per Share 2016TAS 34 (revised 2015) Interim Financial Reporting 2016TAS 36 (revised 2015) Impairment of Assets 2016TAS 37 (revised 2015) Provisions, Contingent Liabilities and Contingent Assets 2016TAS 38 (revised 2015) Intangible Assets 2016TFRS 2 (revised 2015) Share-based Payment 2016TFRS 3 (revised 2015) Business Combinations 2016TFRS 5 (revised 2015) Non-current Assets Held for Sale and Discontinued
Operations2016
TFRS 8 (revised 2015) Operating Segments 2016TFRS 10 (revised 2015) Consolidated Financial Statements 2016TFRS 11 (revised 2015) Joint Arrangements 2016TFRS 12 (revised 2015) Disclosure of Interests in Other Entities 2016TFRS 13 (revised 2015) Fair Value Measurement 2016TSIC 25 (revised 2015) Income Taxes - Changes in the Tax Status of an
Enterprise or its Shareholders2016
TSIC 27 (revised 2015) Evaluating the Substance of Transactions in the Legal Form of a Lease
2016
TFRIC 4 (revised 2015) Determining Whether an Arrangement Contains a Lease 2016TFRIC 10 (revised 2015) Interim Financial Reporting and Impairment 2016TFRIC 14 (revised 2015) TAS 19 (revised 2015) Employee Benefits – The
Limit on a Defined Benefit Asset, Minimum Funding Requirements and their Interaction
2016
Management is presently considering the potential impact of adopting and initially applying the revised Conceptual Framework for Financial Reporting and these new and revised TFRS on the consolidated and separate financial statements.
86
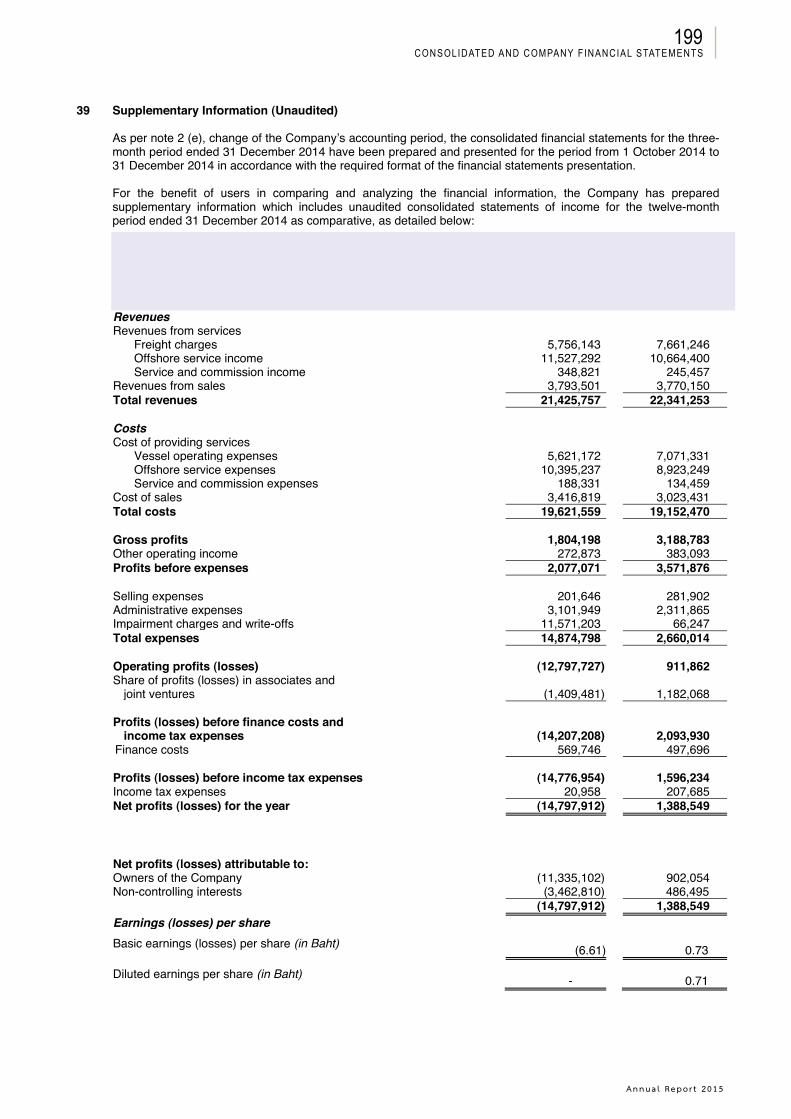
Annua l Repo r t 2015
Consolidated and Company FinanCial statements199
Thoresen Thai Agencies Public Company Limited and its SubsidiariesNotes to the financial statements
39 Supplementary Information (Unaudited)
As per note 2 (e), change of the Company’s accounting period, the consolidated financial statements for the three-month period ended 31 December 2014 have been prepared and presented for the period from 1 October 2014 to 31 December 2014 in accordance with the required format of the financial statements presentation.
For the benefit of users in comparing and analyzing the financial information, the Company has prepared supplementary information which includes unaudited consolidated statements of income for the twelve-month period ended 31 December 2014 as comparative, as detailed below:
Consolidated Statements of income2015 2014
(Restated and Unaudited )
(in thousand Baht)RevenuesRevenues from services
Freight charges 5,756,143 7,661,246 Offshore service income 11,527,292 10,664,400 Service and commission income 348,821 245,457
Revenues from sales 3,793,501 3,770,150 Total revenues 21,425,757 22,341,253
CostsCost of providing services
Vessel operating expenses 5,621,172 7,071,331 Offshore service expenses 10,395,237 8,923,249 Service and commission expenses 188,331 134,459
Cost of sales 3,416,819 3,023,431Total costs 19,621,559 19,152,470
Gross profits 1,804,198 3,188,783Other operating income 272,873 383,093Profits before expenses 2,077,071 3,571,876
Selling expenses 201,646 281,902Administrative expenses 3,101,949 2,311,865Impairment charges and write-offs 11,571,203 66,247Total expenses 14,874,798 2,660,014
Operating profits (losses) (12,797,727) 911,862 Share of profits (losses) in associates and
joint ventures (1,409,481) 1,182,068
Profits (losses) before finance costs andincome tax expenses (14,207,208) 2,093,930
Finance costs 569,746 497,696
Profits (losses) before income tax expenses (14,776,954) 1,596,234Income tax expenses 20,958 207,685Net profits (losses) for the year (14,797,912) 1,388,549
Net profits (losses) attributable to:Owners of the Company (11,335,102) 902,054Non-controlling interests (3,462,810) 486,495
(14,797,912) 1,388,549Earnings (losses) per shareBasic earnings (losses) per share (in Baht) (6.61) 0.73
Diluted earnings per share (in Baht) - 0.71
87
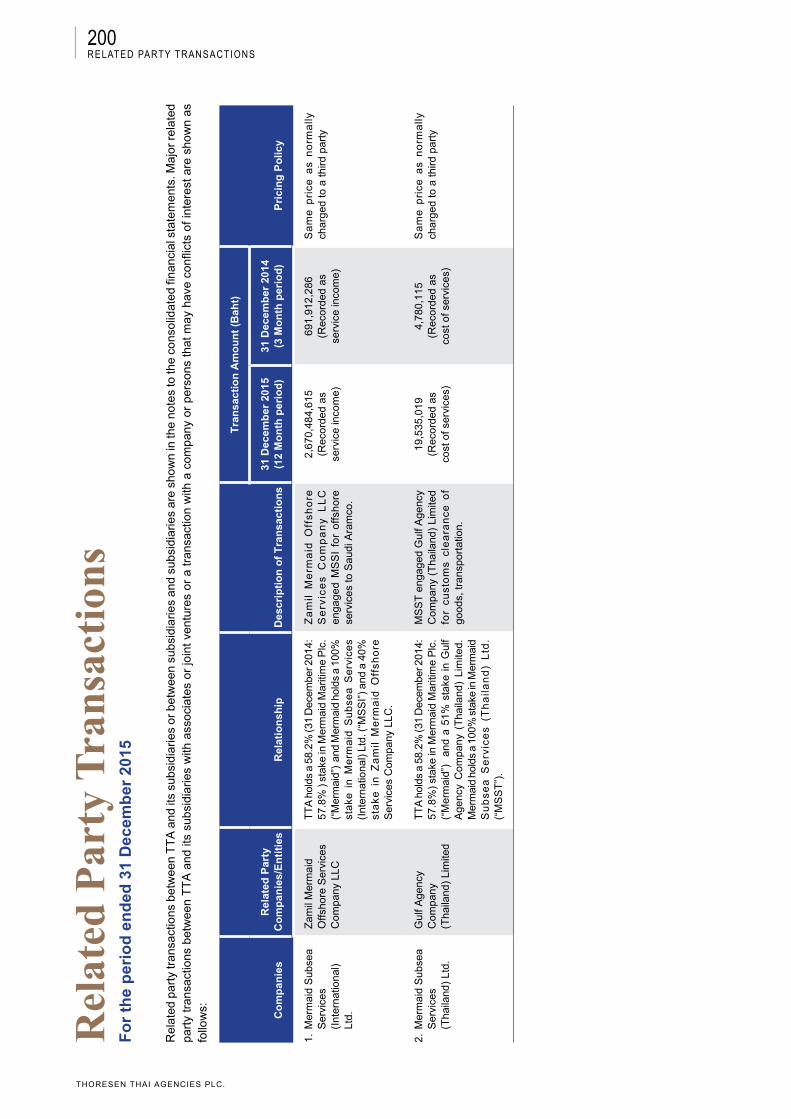
200
THORESEN THAI AGENCIES PLC.
Rel
ated
par
ty tr
ansa
ctio
ns b
etw
een
TT
A a
nd it
s su
bsid
iarie
s or
bet
wee
n su
bsid
iarie
s an
d su
bsid
iarie
s ar
e sh
own
in th
e no
tes
to th
e co
nsol
idat
ed fi
nanc
ial s
tate
men
ts. M
ajor
rel
ated
pa
rty
tran
sact
ions
bet
wee
n T
TA
and
its
subs
idia
ries
with
ass
ocia
tes
or jo
int
vent
ures
or
a tr
ansa
ctio
n w
ith a
com
pany
or
pers
ons
that
may
hav
e co
nflic
ts o
f in
tere
st a
re s
how
n as
fo
llow
s:
Co
mp
anie
sR
elat
ed P
arty
Co
mp
anie
s/E
nti
ties
Rel
atio
nsh
ipD
escr
ipti
on
of
Tra
nsa
ctio
ns
Tra
nsa
ctio
n A
mo
un
t (B
aht)
Pri
cin
g P
olic
y31
Dec
emb
er 2
015
(12
Mo
nth
per
iod
)31
Dec
emb
er 2
014
(3 M
on
th p
erio
d)
1. M
erm
aid
Sub
sea
Ser
vice
s (I
nter
natio
nal)
Ltd.
Zam
il M
erm
aid
Offs
hore
Ser
vice
s C
ompa
ny L
LC
TT
A h
olds
a 5
8.2%
(31
Dec
embe
r 201
4:
57.8
% )
stak
e in
Mer
mai
d M
ariti
me
Plc
. (“
Mer
mai
d”)
and
Mer
mai
d ho
lds
a 10
0%
sta
ke i
n M
erm
aid
Su
bse
a S
erv
ice
s (I
nter
natio
nal)
Ltd.
(“M
SS
I”) a
nd a
40%
st
ake
in
Za
mil
Me
rma
id O
ffsh
ore
S
ervi
ces
Com
pany
LLC
.
Za
mil
Me
rma
id O
ffs
ho
re
Se
rvic
es
Co
mp
an
y L
LC
en
gage
d M
SS
I fo
r of
fsho
re
serv
ices
to S
audi
Ara
mco
.
2,67
0,48
4,61
5(R
ecor
ded
as
serv
ice
inco
me)
691,
912,
286
(Rec
orde
d as
se
rvic
e in
com
e)
Sa
me
pri
ce a
s n
orm
ally
ch
arge
d to
a th
ird p
arty
2. M
erm
aid
Sub
sea
Ser
vice
s (T
haila
nd)
Ltd.
Gul
f Age
ncy
Com
pany
(T
haila
nd)
Lim
ited
TT
A h
olds
a 5
8.2%
(31
Dec
embe
r 201
4:
57.8
%)
stak
e in
Mer
mai
d M
ariti
me
Plc
. (“
Mer
mai
d”)
and
a 5
1% s
take
in
Gul
f A
genc
y C
ompa
ny (
Tha
iland
) Li
mite
d.
Mer
mai
d ho
lds
a 10
0% s
take
in M
erm
aid
Su
bs
ea
Se
rvic
es
(T
ha
ila
nd
) L
td.
(“M
SS
T”)
.
MS
ST
eng
aged
Gul
f Age
ncy
Com
pany
(T
haila
nd)
Lim
ited
for
cust
om
s cl
ea
ran
ce o
f go
ods,
tran
spor
tatio
n.
19,5
35,0
19(R
ecor
ded
as
cost
of s
ervi
ces)
4,78
0,11
5(R
ecor
ded
as
cost
of s
ervi
ces)
Sa
me
pri
ce a
s n
orm
ally
ch
arge
d to
a th
ird p
arty
rel
ated
par
ty T
rans
actio
nsF
or
the
per
iod
en
ded
31
Dec
emb
er 2
015
related party transactions
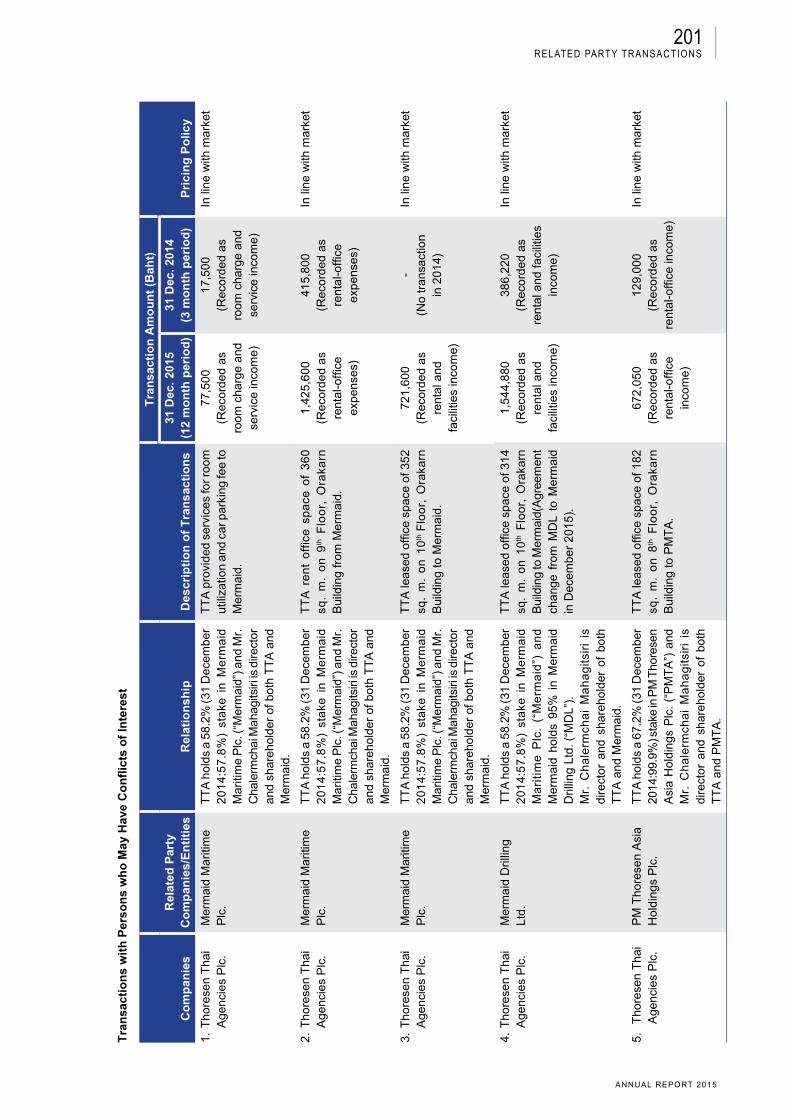
201
ANNUAL REPORT 2015
Tra
nsa
ctio
ns
wit
h P
erso
ns
wh
o M
ay H
ave
Co
nfl
icts
of
Inte
rest
Co
mp
anie
sR
elat
ed P
arty
Co
mp
anie
s/E
nti
ties
Rel
atio
nsh
ipD
escr
ipti
on
of
Tra
nsa
ctio
ns
Tra
nsa
ctio
n A
mo
un
t (B
aht)
Pri
cin
g P
olic
y31
Dec
. 201
5(1
2 m
on
th p
erio
d)
31 D
ec. 2
014
(3 m
on
th p
erio
d)
1. T
hore
sen
Tha
i
Age
ncie
s P
lc.
Mer
mai
d M
ariti
me
Plc
.T
TA
hol
ds a
58.
2% (3
1 D
ecem
ber
20
14
:57
.8%
) st
ake
in
Me
rma
id
Mar
itim
e P
lc. (
“Mer
mai
d”) a
nd M
r.
Cha
lerm
chai
Mah
agits
iri is
dire
ctor
an
d sh
areh
olde
r of
bot
h T
TA
and
M
erm
aid.
TT
A p
rovi
ded
serv
ices
for r
oom
ut
iliza
tion
and
car p
arki
ng fe
e to
M
erm
aid.
77,5
00(R
ecor
ded
as
room
cha
rge
and
serv
ice
inco
me)
17,5
00(R
ecor
ded
as
room
cha
rge
and
serv
ice
inco
me)
In li
ne w
ith m
arke
t
2. T
hore
sen
Tha
i
Age
ncie
s P
lc.
Mer
mai
d M
ariti
me
Plc
.T
TA
hol
ds a
58.
2% (3
1 D
ecem
ber
20
14
:57
.8%
) st
ake
in
Me
rma
id
Mar
itim
e P
lc. (
“Mer
mai
d”) a
nd M
r.
Cha
lerm
chai
Mah
agits
iri is
dire
ctor
an
d sh
areh
olde
r of
bot
h T
TA
and
M
erm
aid.
TT
A r
en
t o
ffic
e s
pa
ce o
f 3
60
sq.
m.
on
9th F
loo
r, O
raka
rn
Bui
ldin
g fr
om M
erm
aid.
1,42
5,60
0(R
ecor
ded
as
rent
al-o
ffice
ex
pens
es)
415,
800
(Rec
orde
d as
re
ntal
-offi
ce
expe
nses
)
In li
ne w
ith m
arke
t
3. T
hore
sen
Tha
i
Age
ncie
s P
lc.
Mer
mai
d M
ariti
me
Plc
.T
TA
hol
ds a
58.
2% (3
1 D
ecem
ber
20
14
:57
.8%
) st
ake
in
Me
rma
id
Mar
itim
e P
lc. (
“Mer
mai
d”) a
nd M
r.
Cha
lerm
chai
Mah
agits
iri is
dire
ctor
an
d sh
areh
olde
r of
bot
h T
TA
and
M
erm
aid.
TT
A le
ased
offi
ce s
pace
of 3
52
sq.
m.
on
10
th F
loo
r, O
raka
rn
Bui
ldin
g to
Mer
mai
d.
721,
600
(Rec
orde
d as
re
ntal
and
fa
cilit
ies
inco
me)
-(N
o tr
ansa
ctio
nin
201
4)
In li
ne w
ith m
arke
t
4. T
hore
sen
Tha
i
Age
ncie
s P
lc.
Mer
mai
d D
rillin
g Lt
d.T
TA
hol
ds a
58.
2% (3
1 D
ecem
ber
20
14
:57
.8%
) st
ake
in
Me
rma
id
Ma
riti
me
Plc
. (“
Me
rma
id”)
an
d M
erm
aid
hold
s 95
% i
n M
erm
aid
Dril
ling
Ltd.
(“M
DL”
).M
r. C
ha
lerm
cha
i M
ah
ag
itsir
i is
di
rect
or a
nd s
hare
hold
er o
f bo
th
TT
A a
nd M
erm
aid.
TT
A le
ased
offi
ce s
pace
of 3
14
sq.
m.
on 1
0th F
loor
, O
raka
rn
Bui
ldin
g to
Mer
mai
d(A
gree
men
t ch
ange
fro
m M
DL
to M
erm
aid
in D
ecem
ber
2015
).
1,54
4,88
0(R
ecor
ded
as
rent
al a
nd
faci
litie
s in
com
e)
386,
220
(Rec
orde
d as
re
ntal
and
faci
litie
s in
com
e)
In li
ne w
ith m
arke
t
5.
Tho
rese
n T
hai
Age
ncie
s P
lc.
PM
Tho
rese
n A
sia
Hol
ding
s P
lc.
TT
A h
olds
a 6
7.2%
(31
Dec
embe
r 20
14:9
9.9%
) sta
ke in
PM
Tho
rese
n A
sia
Hol
ding
s P
lc.
(“P
MT
A”)
and
M
r. C
ha
lerm
cha
i M
ah
ag
itsir
i is
di
rect
or a
nd s
hare
hold
er o
f bo
th
TT
A a
nd P
MT
A.
TT
A le
ased
offi
ce s
pace
of 1
82
sq.
m.
on
8th F
loo
r, O
raka
rn
Bui
ldin
g to
PM
TA
.
672,
050
(Rec
orde
d as
re
ntal
-offi
ce
inco
me)
129,
000
(Rec
orde
d as
re
ntal
-offi
ce in
com
e)
In li
ne w
ith m
arke
t
related party transactions
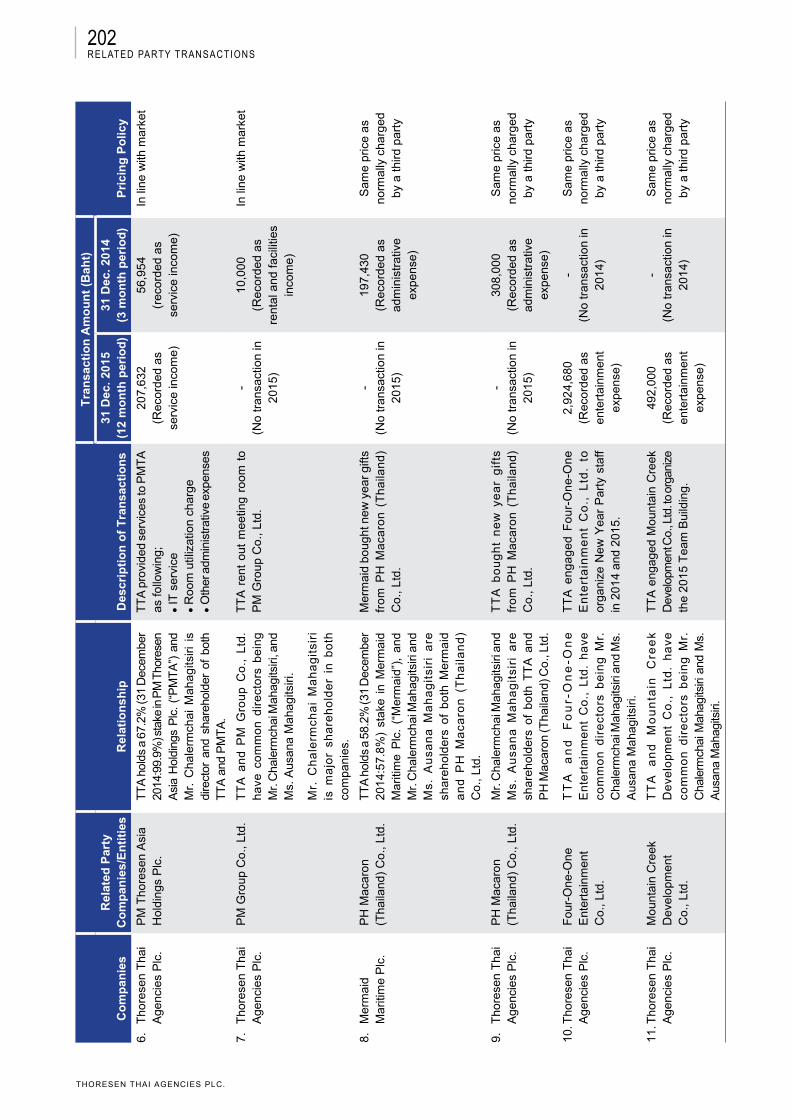
202
THORESEN THAI AGENCIES PLC.
Co
mp
anie
sR
elat
ed P
arty
Co
mp
anie
s/E
nti
ties
Rel
atio
nsh
ipD
escr
ipti
on
of
Tra
nsa
ctio
ns
Tra
nsa
ctio
n A
mo
un
t (B
aht)
Pri
cin
g P
olic
y31
Dec
. 201
5(1
2 m
on
th p
erio
d)
31 D
ec. 2
014
(3 m
on
th p
erio
d)
6.
Tho
rese
n T
hai
Age
ncie
s P
lc.
PM
Tho
rese
n A
sia
Hol
ding
s P
lc.
TT
A h
olds
a 6
7.2%
(31
Dec
embe
r 20
14:9
9.9%
) sta
ke in
PM
Tho
rese
n A
sia
Hol
ding
s P
lc.
(“P
MT
A”)
and
M
r. C
hale
rmch
ai M
ahag
itsiri
is
dire
ctor
and
sha
reho
lder
of
both
T
TA
and
PM
TA
.
TT
A p
rovi
ded
serv
ices
to P
MT
A
as fo
llow
ing;
IT
ser
vice
R
oom
util
izat
ion
char
geO
ther
adm
inis
trat
ive
expe
nses
207,
632
(Rec
orde
d as
se
rvic
e in
com
e)
56,9
54(r
ecor
ded
asse
rvic
e in
com
e)
In li
ne w
ith m
arke
t
7.
Tho
rese
n T
hai
Age
ncie
s P
lc.
PM
Gro
up C
o., L
td.
TT
A a
nd
PM
Gro
up
Co
., L
td.
ha
ve c
om
mo
n d
ire
cto
rs b
ein
g M
r. C
hale
rmch
ai M
ahag
itsiri
, and
M
s. A
usan
a M
ahag
itsiri
.
Mr.
Ch
ale
rmch
ai
Ma
ha
git
siri
is
ma
jor
sha
reh
old
er
in b
oth
co
mpa
nies
.
TT
A r
ent
out
mee
ting
room
to
PM
Gro
up C
o., L
td.
-(N
o tr
ansa
ctio
n in
20
15)
10,0
00(R
ecor
ded
as
rent
al a
nd fa
cilit
ies
inco
me)
In li
ne w
ith m
arke
t
8.
Mer
mai
d M
ariti
me
Plc
.P
H M
acar
on
(Tha
iland
) C
o., L
td.
TT
A h
olds
a 5
8.2%
(31
Dec
embe
r 20
14:5
7.8%
) st
ake
in M
erm
aid
Mar
itim
e P
lc.
(“M
erm
aid”
), a
nd
Mr.
Cha
lerm
chai
Mah
agits
iri a
nd
Ms.
Au
san
a M
ah
ag
itsi
ri a
re
sha
reh
old
ers
of
bo
th M
erm
aid
a
nd
PH
Ma
caro
n (
Th
aila
nd
) C
o., L
td.
Mer
mai
d bo
ught
new
yea
r gi
fts
fro
m P
H M
aca
ron
(T
ha
ilan
d)
Co.
, Ltd
.
-(N
o tr
ansa
ctio
n in
20
15)
197,
430
(Rec
orde
d as
ad
min
istr
ativ
e ex
pens
e)
Sam
e pr
ice
as
norm
ally
cha
rged
by
a th
ird p
arty
9.
Tho
rese
n T
hai
Age
ncie
s P
lc.
PH
Mac
aron
(T
haila
nd)
Co.
, Ltd
.M
r. C
hale
rmch
ai M
ahag
itsiri
and
M
s. A
usa
na
Ma
ha
git
siri
are
sh
areh
olde
rs o
f bo
th T
TA
and
P
H M
acar
on (T
haila
nd) C
o., L
td.
TT
A b
ou
gh
t n
ew
ye
ar
gif
ts
fro
m P
H M
aca
ron
(T
ha
ilan
d)
Co.
, Ltd
.
-(N
o tr
ansa
ctio
n in
20
15)
308,
000
(Rec
orde
d as
ad
min
istr
ativ
e ex
pens
e)
Sam
e pr
ice
as
norm
ally
cha
rged
by
a th
ird p
arty
10. T
hore
sen
Tha
i A
genc
ies
Plc
.F
our-
One
-One
E
nter
tain
men
t C
o., L
td.
TT
A
an
d
Fo
ur-
On
e-O
ne
En
tert
ain
me
nt
Co
., L
td.
ha
ve
com
mo
n d
ire
cto
rs b
ein
g M
r.
Cha
lerm
chai
Mah
agits
iri a
nd M
s.
Aus
ana
Mah
agits
iri.
TT
A e
ng
ag
ed
Fo
ur-
On
e-O
ne
En
tert
ain
me
nt
Co
., L
td.
to
orga
nize
New
Yea
r P
arty
sta
ff in
201
4 an
d 20
15.
2,92
4,68
0(R
ecor
ded
as
ente
rtai
nmen
t ex
pens
e)
-(N
o tr
ansa
ctio
n in
20
14)
Sam
e pr
ice
as
norm
ally
cha
rged
by
a th
ird p
arty
11. T
hore
sen
Tha
i A
genc
ies
Plc
.M
ount
ain
Cre
ek
Dev
elop
men
t C
o., L
td.
TT
A
an
d
Mo
un
tain
C
ree
k D
eve
lop
me
nt
Co
., L
td.
ha
ve
com
mo
n d
ire
cto
rs b
ein
g M
r.
Cha
lerm
chai
Mah
agits
iri a
nd M
s.
Aus
ana
Mah
agits
iri.
TT
A e
ngag
ed M
ount
ain
Cre
ek
Dev
elop
men
t Co.
, Ltd
. to
orga
nize
th
e 20
15 T
eam
Bui
ldin
g.
492,
000
(Rec
orde
d as
en
tert
ainm
ent
expe
nse)
-(N
o tr
ansa
ctio
n in
20
14)
Sam
e pr
ice
as
norm
ally
cha
rged
by
a th
ird p
arty
related party transactions

203
ANNUAL REPORT 2015
Necessity and Rationale of Related Party Transactions
In case TTA or its subsidiary signs an agreement or conducts a related party transaction with a subsidiary company, affiliated company and/or third party, TTA or a subsidiary will consider the necessity and rationale of such agreement based mainly on TTA’s interests.
related party transactions
Approval Measures or Procedures of Related Party Transactions
If TTA or its subsidiary is to execute an agreement or if there is any related party transaction between TTA and its subsidiary, affiliated company, related company, third party and/or anyone with possible conflict of interests, the Board of Directors requires TTA or a subsidiary, for the purpose of its benefits, to comply with the rules and regulations of the SET and the SEC regarding disclosure of information of listed companies concerning connected transactions. Prices and other conditions shall be on an arm’s length basis and are conducted in the best interests of TTA and all shareholders. Directors, executives, or employees having an interest in such transaction are not allowed to participate in the decision-making process and in any approval process.
Policy for Future Related Party Transactions
The Audit Committee and TTA will jointly consider and review any related party transactions that may arise in the future to ensure their necessity and fair price basis.
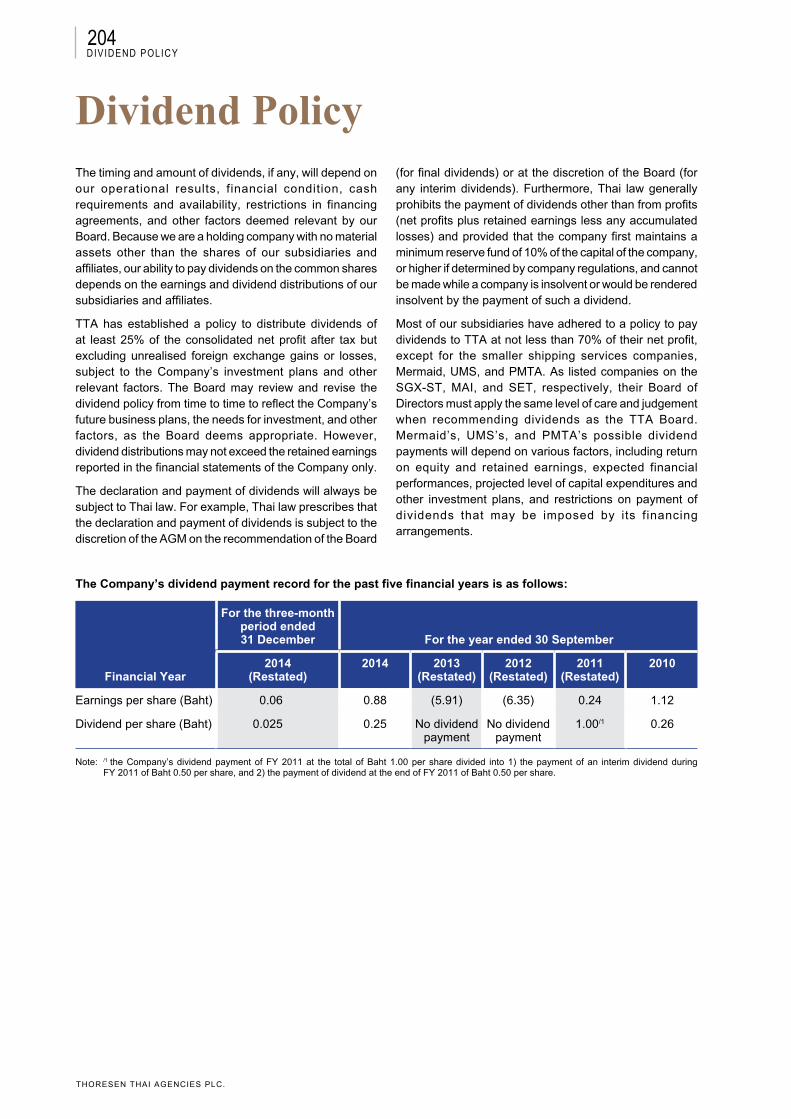
204
THORESEN THAI AGENCIES PLC.
dividend policyThe timing and amount of dividends, if any, will depend on our operational results, financial condition, cash requirements and availability, restrictions in financing agreements, and other factors deemed relevant by our Board. Because we are a holding company with no material assets other than the shares of our subsidiaries and affiliates, our ability to pay dividends on the common shares depends on the earnings and dividend distributions of our subsidiaries and affiliates.
TTA has established a policy to distribute dividends of at least 25% of the consolidated net profit after tax but excluding unrealised foreign exchange gains or losses, subject to the Company’s investment plans and other relevant factors. The Board may review and revise the dividend policy from time to time to reflect the Company’s future business plans, the needs for investment, and other factors, as the Board deems appropriate. However, dividend distributions may not exceed the retained earnings reported in the financial statements of the Company only.
The declaration and payment of dividends will always be subject to Thai law. For example, Thai law prescribes that the declaration and payment of dividends is subject to the discretion of the AGM on the recommendation of the Board
(for final dividends) or at the discretion of the Board (for any interim dividends). Furthermore, Thai law generally prohibits the payment of dividends other than from profits (net profits plus retained earnings less any accumulated losses) and provided that the company first maintains a minimum reserve fund of 10% of the capital of the company, or higher if determined by company regulations, and cannot be made while a company is insolvent or would be rendered insolvent by the payment of such a dividend.
Most of our subsidiaries have adhered to a policy to pay dividends to TTA at not less than 70% of their net profit, except for the smaller shipping services companies, Mermaid, UMS, and PMTA. As listed companies on the SGX-ST, MAI, and SET, respectively, their Board of Directors must apply the same level of care and judgement when recommending dividends as the TTA Board. Mermaid’s, UMS’s, and PMTA’s possible dividend payments will depend on various factors, including return on equity and retained earnings, expected financial performances, projected level of capital expenditures and other investment plans, and restrictions on payment of dividends that may be imposed by its financing arrangements.
The Company’s dividend payment record for the past five financial years is as follows:
Financial Year
For the three-month period ended 31 December For the year ended 30 September
2014(Restated)
2014 2013(Restated)
2012(Restated)
2011(Restated)
2010
Earnings per share (Baht) 0.06 0.88 (5.91) (6.35) 0.24 1.12
Dividend per share (Baht) 0.025 0.25 No dividend payment
No dividend payment
1.00/1 0.26
Note: /1 the Company’s dividend payment of FY 2011 at the total of Baht 1.00 per share divided into 1) the payment of an interim dividend during FY 2011 of Baht 0.50 per share, and 2) the payment of dividend at the end of FY 2011 of Baht 0.50 per share.
dividend policy
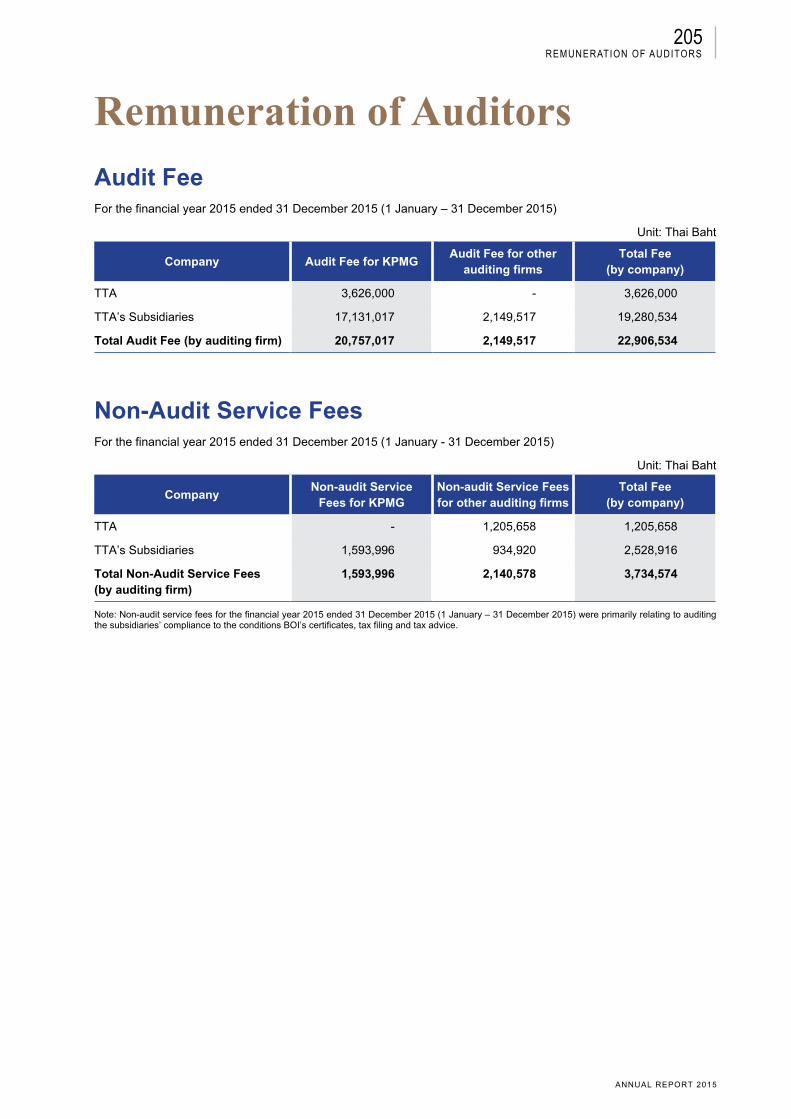
205
ANNUAL REPORT 2015
remuneration of Auditors Audit Fee For the financial year 2015 ended 31 December 2015 (1 January – 31 December 2015)
Unit: Thai Baht
Company Audit Fee for KPMGAudit Fee for other
auditing firmsTotal Fee
(by company)
TTA 3,626,000 - 3,626,000
TTA’s Subsidiaries 17,131,017 2,149,517 19,280,534
Total Audit Fee (by auditing firm) 20,757,017 2,149,517 22,906,534
Non-Audit Service FeesFor the financial year 2015 ended 31 December 2015 (1 January - 31 December 2015)
Unit: Thai Baht
CompanyNon-audit Service
Fees for KPMGNon-audit Service Fees for other auditing firms
Total Fee(by company)
TTA - 1,205,658 1,205,658
TTA’s Subsidiaries 1,593,996 934,920 2,528,916
Total Non-Audit Service Fees(by auditing firm)
1,593,996 2,140,578 3,734,574
Note: Non-audit service fees for the financial year 2015 ended 31 December 2015 (1 January – 31 December 2015) were primarily relating to auditing the subsidiaries’ compliance to the conditions BOI’s certificates, tax filing and tax advice.
remuneration of auditors

206
THORESEN THAI AGENCIES PLC.
The Company’s management structure comprises of the Board of Directors and six (6) sub-committees namely 1) Executive Committee, 2) Audit Committee, 3) Nomination and Remuneration Committee, 4) Risk Management Committee, 5) Corporate Governance Committee, and 6) Investment Committee.
1. Board of Directors as of 31 December 2015
Thoresen Thai Agencies Public Company Limited
No. Name Position No. of MeetingMeeting
Attendance
1. Mr. Prasert Bunsumpun Chairman of the Board/Chairman of Executive Committee
11 10
2. Mr. Chalermchai Mahagitsiri President and Chief Executive Officer/Member of Executive Committee/ Chairman of Investment Committee
11 11
3. Mr. Chia Wan Huat Joseph Director/Member of Executive Committee/Chairman of Risk Management Committee/Member of Investment Committee
11 11
4. Mr. Jean Paul Thevenin Director/Member of Executive Committee/Member of Investment Committee
11 11
5. Mr. Krish Follett Independent Director/Chairman of Audit Committee/Member of Corporate Governance Committee
11 11
6. Mr. Santi Bangor Independent Director/Chairman of Nomination and Remuneration Committee/Chairman of Corporate Governance Committee/Member of Audit Committee
11 11
7. Ms. Ausana Mahagitsiri Director/Member of Nomination and Remuneration Committee/Member of Corporate Governance Committee
11 8
8. Mr. Mohammed Rashed Ahmad M. Al Nasseri
Independent Director/Member of Nomination and Remuneration Committee
11 7
9. Mr. Yves Barbieux Director 11 10
10. Mr. Cherdpong Siriwit Independent Director/ Member of Audit Committee/Member of Risk Management Committee
11 10
11. Mr. Chitrapongse Kwangsukstith *
Independent Director 4 4
Note : * Mr. Chitrapongse Kwangsukstith was appointed a Board member on 13 May 2015 to replace Mr. Ghanim Saad M Alsaad Al-Kuwari, the resigned director.
management structure manaGement structure

207
ANNUAL REPORT 2015
Authorized Directors
According to the Company’s Certificate of Incorporation issued on 15 February 2016 from the Department of Business Development of the Ministry of Commerce, the directors who are authorized to sign to bind the Company are: Mr. Jean Paul Thevenin or Mr. Chia Wan Huat Joseph to jointly sign with Mr. Chalermchai Mahagitsiri or Ms. Ausana Mahagitsiri, totaling two persons, with the Company seal affixed.
The Board of Directors of four core subsidiaries: Thoresen Shipping Singapore Pte. Ltd., Mermaid Maritime Public Company Limited, Unique Mining Services Public Company Limited, and Baconco Co., Ltd., are shown as below:
a) Thoresen Shipping Singapore Pte. Ltd.
No. Name Position No. of MeetingMeeting
Attendance
1. Mr. Chalermchai Mahagitsiri Director 11 11
2. Ms. Ausana Mahagitsiri Director 11 11
3. Mr. Ian Clifford Claxton Director 11 11
4. Mr. Sigmund Stromme * Director 7 7
5. Mr. Chia Wan Huat Joseph ** Director - -
6. Mr. Jean Paul Thevenin ** Director - -
7. Mr. Jitender Pal Verma ** Director - -
8. Mr. Lee Wei Hsiung Director 11 11
9. Mr. Tan King Chang Alternate Director - -
Note: * Mr. Sigmund Stromme was appointed the company’s directors effective on 13 May 2015. ** Mr. Jean Paul Thevenin, Mr. Chia Wan Huat Joseph, and Mr. Jitender Pal Verma, they were appointed the company’s directors effective on 28 December 2015.
b) Mermaid Maritime Public Company Limited
No. Name Position No. of MeetingMeeting
Attendance
1. Mr. Prasert Bunsumpun Chairman of the Board/Chairman of Executive Committee
12 11
2. Mr. Chalermchai Mahagitsiri Executive Vice Chairman/Chief Executive Officer
12 11
3. Mr. Chia Wan Huat Joseph Executive Director 12 12
4. Mr. Jean Paul Thevenin Director 12 12
5. Mr. Toh Wen Keong Joachim Independent Director 12 11
6. Mr. Ng Cher Yan Independent Director 12 12
7. Mr. Jan Joseph Skorupa Independent Director 12 9
manaGement structure
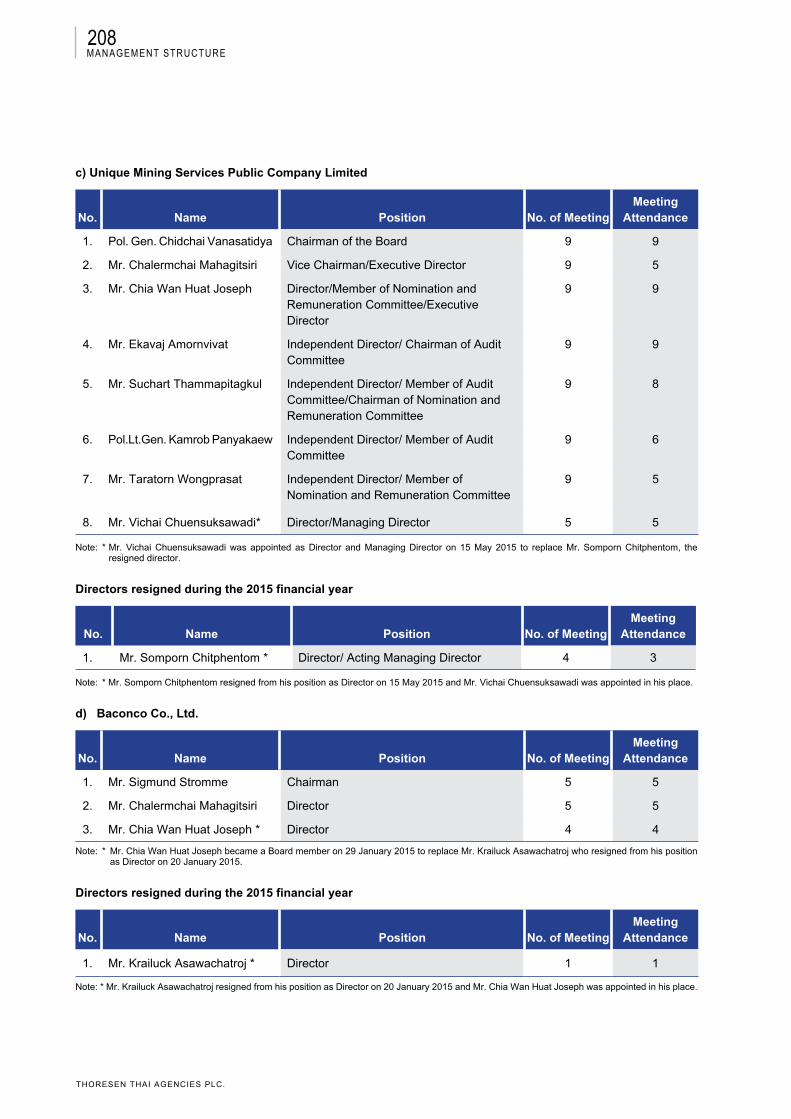
208
THORESEN THAI AGENCIES PLC.
c) Unique Mining Services Public Company Limited
No. Name Position No. of MeetingMeeting
Attendance
1. Pol. Gen. Chidchai Vanasatidya Chairman of the Board 9 9
2. Mr. Chalermchai Mahagitsiri Vice Chairman/Executive Director 9 5
3. Mr. Chia Wan Huat Joseph Director/Member of Nomination and Remuneration Committee/Executive Director
9 9
4. Mr. Ekavaj Amornvivat Independent Director/ Chairman of Audit Committee
9 9
5. Mr. Suchart Thammapitagkul Independent Director/ Member of Audit Committee/Chairman of Nomination and Remuneration Committee
9 8
6. Pol.Lt.Gen. Kamrob Panyakaew Independent Director/ Member of Audit Committee
9 6
7. Mr. Taratorn Wongprasat Independent Director/ Member of Nomination and Remuneration Committee
9 5
8. Mr. Vichai Chuensuksawadi* Director/Managing Director 5 5
Note: * Mr. Vichai Chuensuksawadi was appointed as Director and Managing Director on 15 May 2015 to replace Mr. Somporn Chitphentom, the resigned director.
Directors resigned during the 2015 financial year
No. Name Position No. of MeetingMeeting
Attendance
1. Mr. Somporn Chitphentom * Director/ Acting Managing Director 4 3
Note: * Mr. Somporn Chitphentom resigned from his position as Director on 15 May 2015 and Mr. Vichai Chuensuksawadi was appointed in his place.
d) Baconco Co., Ltd.
No. Name Position No. of MeetingMeeting
Attendance
1. Mr. Sigmund Stromme Chairman 5 5
2. Mr. Chalermchai Mahagitsiri Director 5 5
3. Mr. Chia Wan Huat Joseph * Director 4 4
Note: * Mr. Chia Wan Huat Joseph became a Board member on 29 January 2015 to replace Mr. Krailuck Asawachatroj who resigned from his position as Director on 20 January 2015.
Directors resigned during the 2015 financial year
No. Name Position No. of MeetingMeeting
Attendance
1. Mr. Krailuck Asawachatroj * Director 1 1
Note: * Mr. Krailuck Asawachatroj resigned from his position as Director on 20 January 2015 and Mr. Chia Wan Huat Joseph was appointed in his place.
manaGement structure
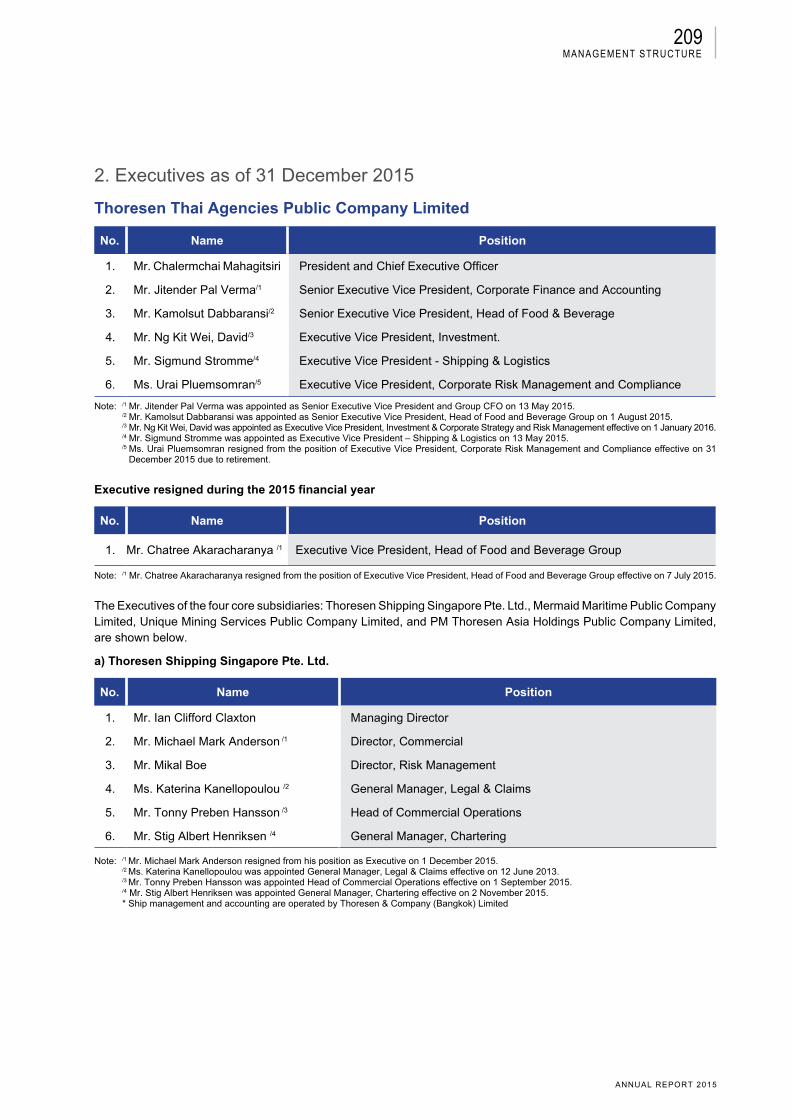
209
ANNUAL REPORT 2015
2. Executives as of 31 December 2015
Thoresen Thai Agencies Public Company Limited
No. Name Position
1. Mr. Chalermchai Mahagitsiri President and Chief Executive Officer
2. Mr. Jitender Pal Verma/1 Senior Executive Vice President, Corporate Finance and Accounting
3. Mr. Kamolsut Dabbaransi/2 Senior Executive Vice President, Head of Food & Beverage
4. Mr. Ng Kit Wei, David/3 Executive Vice President, Investment.
5. Mr. Sigmund Stromme/4 Executive Vice President - Shipping & Logistics
6. Ms. Urai Pluemsomran/5 Executive Vice President, Corporate Risk Management and Compliance
Note: /1 Mr. Jitender Pal Verma was appointed as Senior Executive Vice President and Group CFO on 13 May 2015. /2 Mr. Kamolsut Dabbaransi was appointed as Senior Executive Vice President, Head of Food and Beverage Group on 1 August 2015. /3 Mr. Ng Kit Wei, David was appointed as Executive Vice President, Investment & Corporate Strategy and Risk Management effective on 1 January 2016. /4 Mr. Sigmund Stromme was appointed as Executive Vice President – Shipping & Logistics on 13 May 2015. /5 Ms. Urai Pluemsomran resigned from the position of Executive Vice President, Corporate Risk Management and Compliance effective on 31 December 2015 due to retirement.
Executive resigned during the 2015 financial year
No. Name Position
1. Mr. Chatree Akaracharanya /1 Executive Vice President, Head of Food and Beverage Group
Note: /1 Mr. Chatree Akaracharanya resigned from the position of Executive Vice President, Head of Food and Beverage Group effective on 7 July 2015.
The Executives of the four core subsidiaries: Thoresen Shipping Singapore Pte. Ltd., Mermaid Maritime Public Company Limited, Unique Mining Services Public Company Limited, and PM Thoresen Asia Holdings Public Company Limited, are shown below.
a) Thoresen Shipping Singapore Pte. Ltd.
No. Name Position
1. Mr. Ian Clifford Claxton Managing Director
2. Mr. Michael Mark Anderson /1 Director, Commercial
3. Mr. Mikal Boe Director, Risk Management
4. Ms. Katerina Kanellopoulou /2 General Manager, Legal & Claims
5. Mr. Tonny Preben Hansson /3 Head of Commercial Operations
6. Mr. Stig Albert Henriksen /4 General Manager, Chartering
Note: /1 Mr. Michael Mark Anderson resigned from his position as Executive on 1 December 2015. /2 Ms. Katerina Kanellopoulou was appointed General Manager, Legal & Claims effective on 12 June 2013. /3 Mr. Tonny Preben Hansson was appointed Head of Commercial Operations effective on 1 September 2015. /4 Mr. Stig Albert Henriksen was appointed General Manager, Chartering effective on 2 November 2015. * Ship management and accounting are operated by Thoresen & Company (Bangkok) Limited
manaGement structure
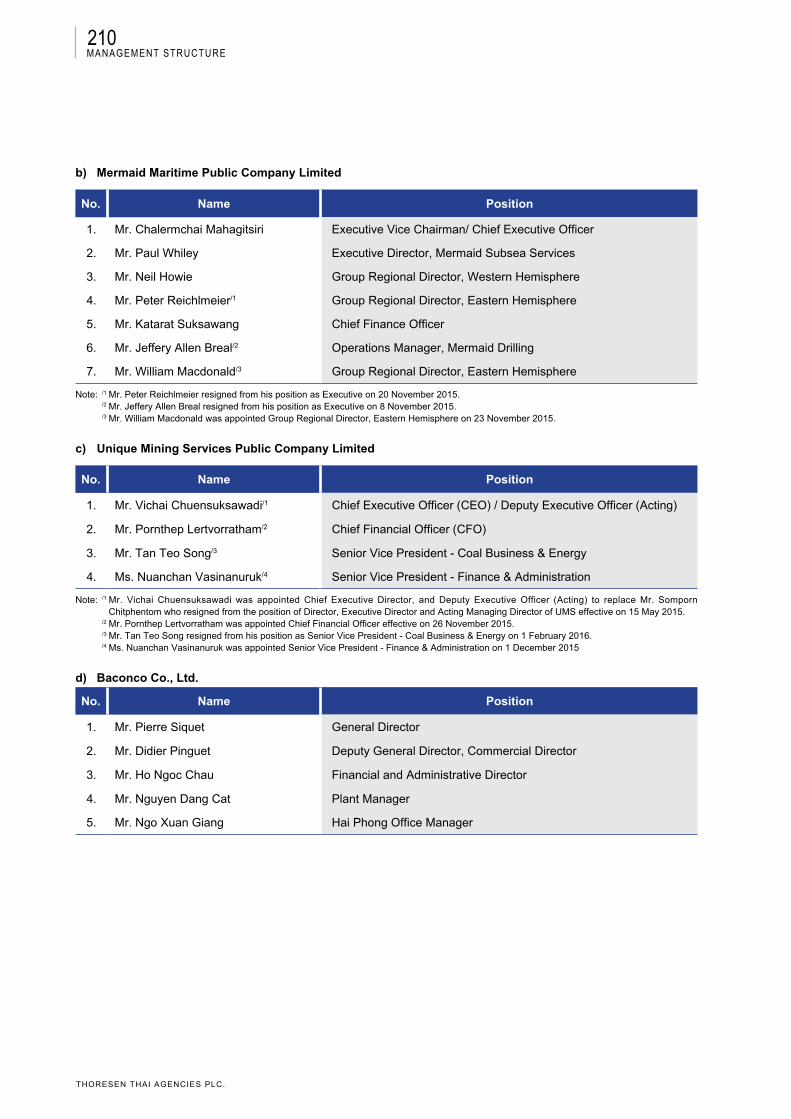
210
THORESEN THAI AGENCIES PLC.
b) Mermaid Maritime Public Company Limited
No. Name Position
1. Mr. Chalermchai Mahagitsiri Executive Vice Chairman/ Chief Executive Officer
2. Mr. Paul Whiley Executive Director, Mermaid Subsea Services
3. Mr. Neil Howie Group Regional Director, Western Hemisphere
4. Mr. Peter Reichlmeier/1 Group Regional Director, Eastern Hemisphere
5. Mr. Katarat Suksawang Chief Finance Officer
6. Mr. Jeffery Allen Breal/2 Operations Manager, Mermaid Drilling
7. Mr. William Macdonald/3 Group Regional Director, Eastern Hemisphere
Note: /1 Mr. Peter Reichlmeier resigned from his position as Executive on 20 November 2015. /2 Mr. Jeffery Allen Breal resigned from his position as Executive on 8 November 2015. /3 Mr. William Macdonald was appointed Group Regional Director, Eastern Hemisphere on 23 November 2015.
c) Unique Mining Services Public Company Limited
No. Name Position
1. Mr. Vichai Chuensuksawadi/1 Chief Executive Officer (CEO) / Deputy Executive Officer (Acting)
2. Mr. Pornthep Lertvorratham/2 Chief Financial Officer (CFO)
3. Mr. Tan Teo Song/3 Senior Vice President - Coal Business & Energy
4. Ms. Nuanchan Vasinanuruk/4 Senior Vice President - Finance & Administration
Note: /1 Mr. Vichai Chuensuksawadi was appointed Chief Executive Director, and Deputy Executive Officer (Acting) to replace Mr. Somporn Chitphentom who resigned from the position of Director, Executive Director and Acting Managing Director of UMS effective on 15 May 2015.
/2 Mr. Pornthep Lertvorratham was appointed Chief Financial Officer effective on 26 November 2015. /3 Mr. Tan Teo Song resigned from his position as Senior Vice President - Coal Business & Energy on 1 February 2016. /4 Ms. Nuanchan Vasinanuruk was appointed Senior Vice President - Finance & Administration on 1 December 2015
d) Baconco Co., Ltd.
No. Name Position
1. Mr. Pierre Siquet General Director
2. Mr. Didier Pinguet Deputy General Director, Commercial Director
3. Mr. Ho Ngoc Chau Financial and Administrative Director
4. Mr. Nguyen Dang Cat Plant Manager
5. Mr. Ngo Xuan Giang Hai Phong Office Manager
manaGement structure
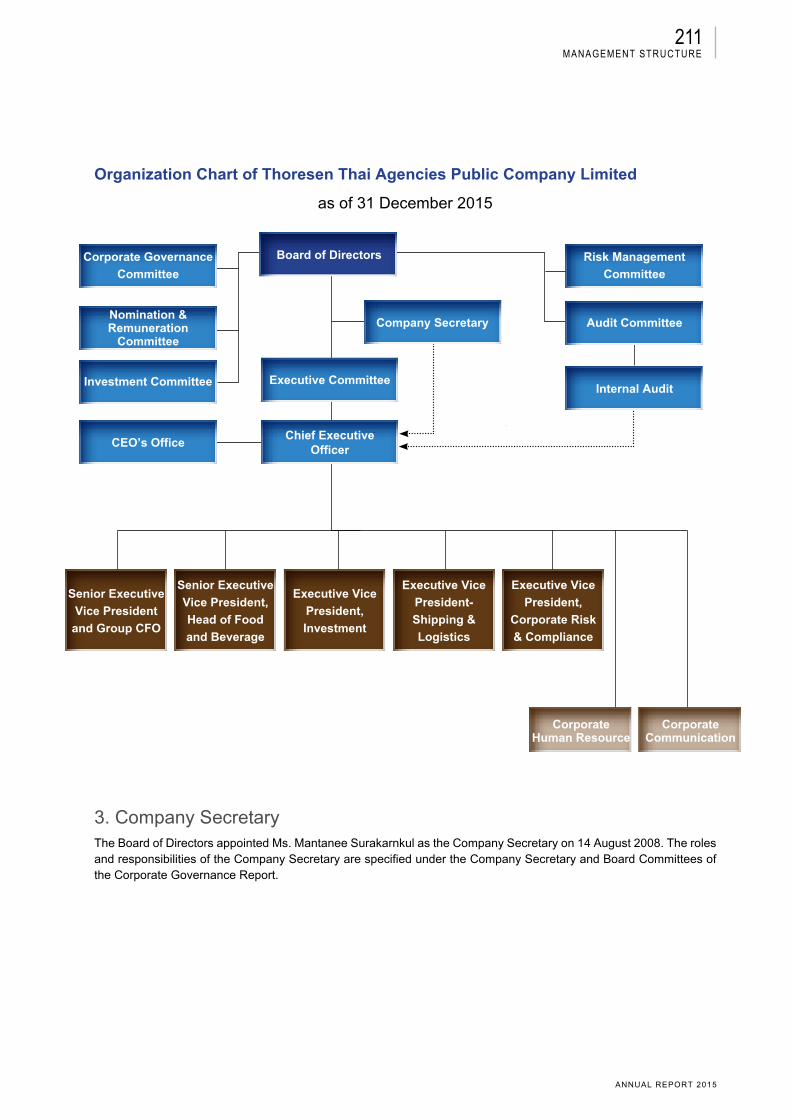
211
ANNUAL REPORT 2015
Organization Chart of Thoresen Thai Agencies Public Company Limited
as of 31 December 2015
3. Company SecretaryThe Board of Directors appointed Ms. Mantanee Surakarnkul as the Company Secretary on 14 August 2008. The roles and responsibilities of the Company Secretary are specified under the Company Secretary and Board Committees of the Corporate Governance Report.
Board of Directors Risk Management
Committee
Audit Committee
Internal Audit
Corporate Governance
Committee
Nomination & Remuneration
Committee
Investment Committee
CEO’s Office
Senior Executive
Vice President
and Group CFO
Senior Executive
Vice President,
Head of Food
and Beverage
Executive Vice
President,
Investment
Executive Vice
President-
Shipping &
Logistics
Executive Vice
President,
Corporate Risk
& Compliance
Corporate Human Resource
CorporateCommunication
Chief Executive Officer
Executive Committee
Company Secretary
manaGement structure

212
THORESEN THAI AGENCIES PLC.
4. Remuneration of the Directors and Executives
4.1 Thoresen Thai Agencies Public Company Limited
Remuneration for the Board, Sub-Committees, and Executives.
The remuneration structure for the Board consists of:
The non-executive director (s) shall receive a monthly fee and an attendance fee for each meeting. The Chairman of the Board and sub-committees shall receive an attendance fee equal to 1.20 times of the attendance
fee paid to non-executive directors and other sub-committee members. A foreign director, residing outside of Thailand shall receive travel allowance when travelling to Thailand to attend a
meeting of the Board or sub-committee. The executive director shall receive no standard monthly fee or other forms of remuneration. An incentive in the form of annual reward (bonus) shall be paid to directors, corresponded to the Company’s goal
achievement in compliance with the Director Bonus Policy approved by the Company’s shareholders.
The executives’ remuneration consists of cash compensation (salary), bonus and other benefits which are long-term incentives, provident fund, and social security contributions.
Remuneration in Cash
Remuneration of the Board and Sub-Committees
The remuneration package for directors and members of sub-committees for the 2015 calendar year/1 was acknowledged by the shareholders at the 2/2015 AGM on 27 April 2015 as following details:
Remuneration for the Board of Directors and Sub-Committees for the 2015 Calendar Year
Committees Type of Remuneration Rate
Non-executive directors Standard monthly fee Baht 150,000 - Chairperson Baht 35,000 per director
Attendance fee per meeting Baht 54,000 - Chairperson Baht 45,000 per director
Travelling allowance for directors who reside outside Thailand
From Asia : USD 500/day From Europe/USA/others : USD 1,000/day
Bonus A bonus for all non-executive directors shall be paid at a rate of not exceeding 1% of the consolidated net profit of the Company (after deducting unrealized gains/losses).
The board of directors will fix the appropriate amount of the bonus to be payable to the directors (in compliance with the above director bonus policy).
Audit Committee Attendance fee per meeting Baht 48,000 - Chairperson Baht 40,000 per member
Nomination and Remuneration Committee
Attendance fee per meeting Baht 36,000 - Chairperson Baht 30,000 per member
Risk Management Committee
Attendance fee per meeting Baht 21,600 - ChairpersonBaht 18,000 per member
Corporate Governance Committee
Attendance fee per meeting Baht 21,600 - ChairpersonBaht 18,000 per member
manaGement structure
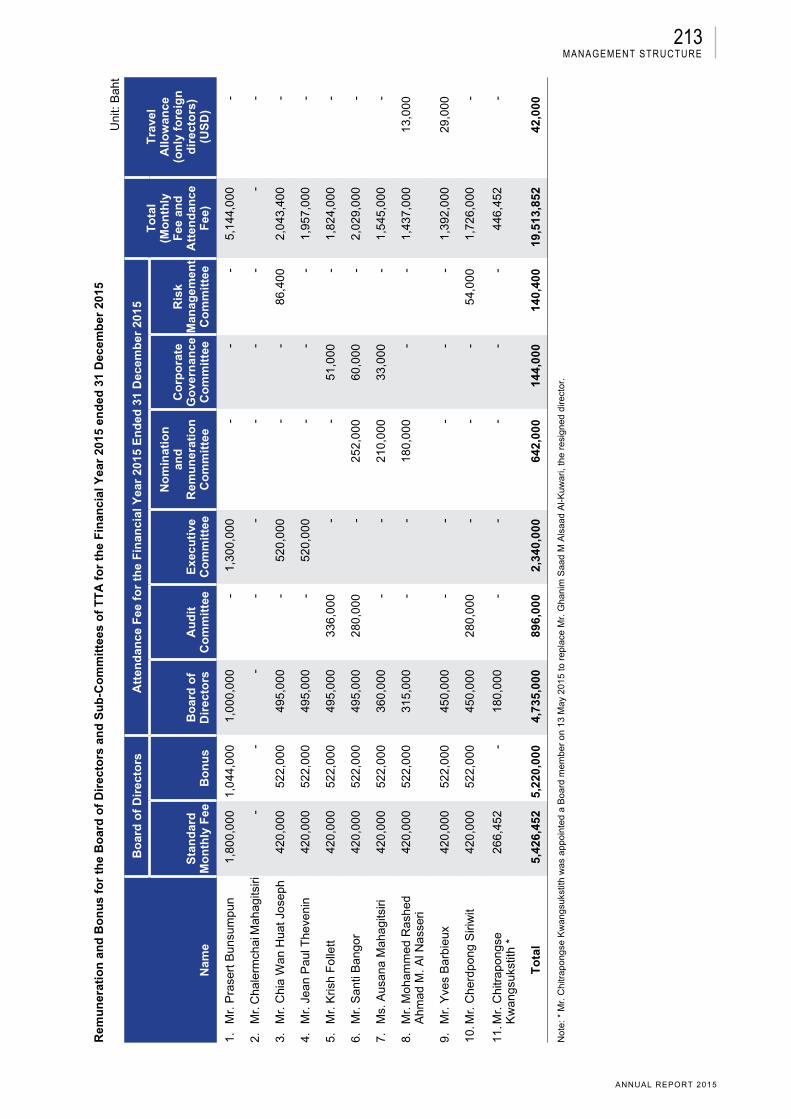
213
ANNUAL REPORT 2015
Rem
un
erat
ion
an
d B
on
us
for
the
Bo
ard
of
Dir
ecto
rs a
nd
Su
b-C
om
mit
tees
of
TT
A f
or
the
Fin
anci
al Y
ear
2015
en
ded
31
Dec
emb
er 2
015
Uni
t: B
aht
Nam
e
Bo
ard
of
Dir
ecto
rsA
tten
dan
ce F
ee f
or
the
Fin
anci
al Y
ear
2015
En
ded
31
Dec
emb
er 2
015
To
tal
(Mo
nth
ly
Fee
an
dA
tten
dan
ce
Fee
)
Tra
vel
Allo
wan
ce
(on
ly f
ore
ign
d
irec
tors
)(U
SD
)S
tan
dar
d
Mo
nth
ly F
eeB
on
us
Bo
ard
of
Dir
ecto
rsA
ud
it
Co
mm
itte
eE
xecu
tive
C
om
mit
tee
No
min
atio
n
and
R
emu
ner
atio
nC
om
mit
tee
Co
rpo
rate
G
ove
rnan
ceC
om
mit
tee
Ris
kM
anag
emen
t C
om
mit
tee
1.
Mr.
Pra
sert
Bun
sum
pun
1,80
0,00
01,
044,
000
1,00
0,00
0-
1,30
0,00
0-
--
5,14
4,00
0-
2.
Mr.
Cha
lerm
chai
Mah
agits
iri-
--
--
--
--
-
3.
Mr.
Chi
a W
an H
uat J
osep
h 42
0,00
052
2,00
049
5,00
0-
520,
000
--
86,4
002,
043,
400
-
4.
Mr.
Jea
n P
aul T
heve
nin
420,
000
522,
000
495,
000
-52
0,00
0-
--
1,95
7,00
0-
5.
Mr.
Kris
h F
olle
tt 42
0,00
052
2,00
049
5,00
033
6,00
0-
-51
,000
-1,
824,
000
-
6.
Mr.
San
ti B
ango
r42
0,00
052
2,00
049
5,00
028
0,00
0-
252,
000
60,0
00-
2,02
9,00
0-
7.
Ms.
Aus
ana
Mah
agits
iri42
0,00
052
2,00
036
0,00
0-
-21
0,00
033
,000
-1,
545,
000
-
8.
Mr.
Moh
amm
ed R
ashe
d
Ahm
ad M
. Al N
asse
ri 42
0,00
052
2,00
031
5,00
0-
-18
0,00
0-
-1,
437,
000
13,0
00
9.
Mr.
Yve
s B
arbi
eux
420,
000
522,
000
450,
000
--
--
-1,
392,
000
29,0
00
10. M
r. C
herd
pong
Siri
wit
420,
000
522,
000
450,
000
280,
000
--
-54
,000
1,72
6,00
0-
11. M
r. C
hitr
apon
gse
Kw
angs
ukst
ith *
266,
452
-18
0,00
0-
--
--
446,
452
-
To
tal
5,42
6,45
25,
220,
000
4,73
5,00
089
6,00
02,
340,
000
642,
000
144,
000
140,
400
19,5
13,8
5242
,000
Not
e: *
Mr.
Chi
trap
ongs
e K
wan
gsuk
stith
was
app
oint
ed a
Boa
rd m
embe
r on
13
May
201
5 to
rep
lace
Mr.
Gha
nim
Saa
d M
Als
aad
Al-K
uwar
i, th
e re
sign
ed d
irect
or.
manaGement structure

214
THORESEN THAI AGENCIES PLC.
Remuneration of Executives
Remuneration of executives of TTA in the form of salary and bonus and other benefits are as follows:
Remuneration
For the Year Ended 31 Dec. 2015*
For the Three-Month PeriodEnded 31 Dec. 2014
For the YearEnded 31 Dec. 2014
Total number of executives
during financial year Amount
Total number of executives
during financial year Amount
Total number of executives
during financial year Amount
Total salary and bonus 7 persons Baht 41.274Million
5 persons Baht 9.296Million
10 persons Baht 56.32 Million
Other benefits (which include social security and provident fund contributions by TTA)
7 persons Baht 2.620 million
5 persons Baht 0.808 million
10 persons Baht 6.45 Million
Note: There are total seven (7) executives for FY 2015. There are total six (6) executives at the end of FY 2015.
Remuneration of the directors and executives of four core subsidiaries being Thoresen Shipping Singapore Pte. Ltd., Mermaid Maritime Plc., Unique Mining Services Plc., and Baconco Co., Ltd. are as follows:
4.2 Thoresen Shipping Singapore Pte. Ltd.
(1) Remuneration in Cash
a) No cash remuneration paid to directors of Thoresen Shipping Singapore Pte. Ltd.
b) Total cash remuneration for three executives of Thoresen Shipping Singapore Pte. Ltd. for the financial year 2015 ended 31 December 2015 consisted of salary and bonus amounted to SGD 1,085,346.48 (for the three-month period ended 31 December 2014: SGD 530,755).
(2) Other remuneration
Other remuneration of directors
- None -
Other remuneration of executives
- None -
4.3 Mermaid Maritime Public Company Limited
(1) Remuneration in Cash
a) Total remuneration of seven directors of Mermaid Maritime Public Company Limited for the financial year 2015 ended 31 December 2015
NameBelow
SGD 100,000SGD 100,000 to
SGD 200,000SGD 200,000 to
SGD 300,000SGD 300,000 to
SGD 400,000
1. Mr. Prasert Bunsumpun - - -
2. Mr. Chalermchai Mahagitsiri - - - -
3. Mr. Chia Wan Huat Joseph - - -
4. Mr. Jean Paul Thevenin - - -
5. Mr. Toh Wen Keong Joachim - - -
6. Mr. Ng Cher Yan - - -
7. Mr. Jan Joseph Skorupa - - -
manaGement structure
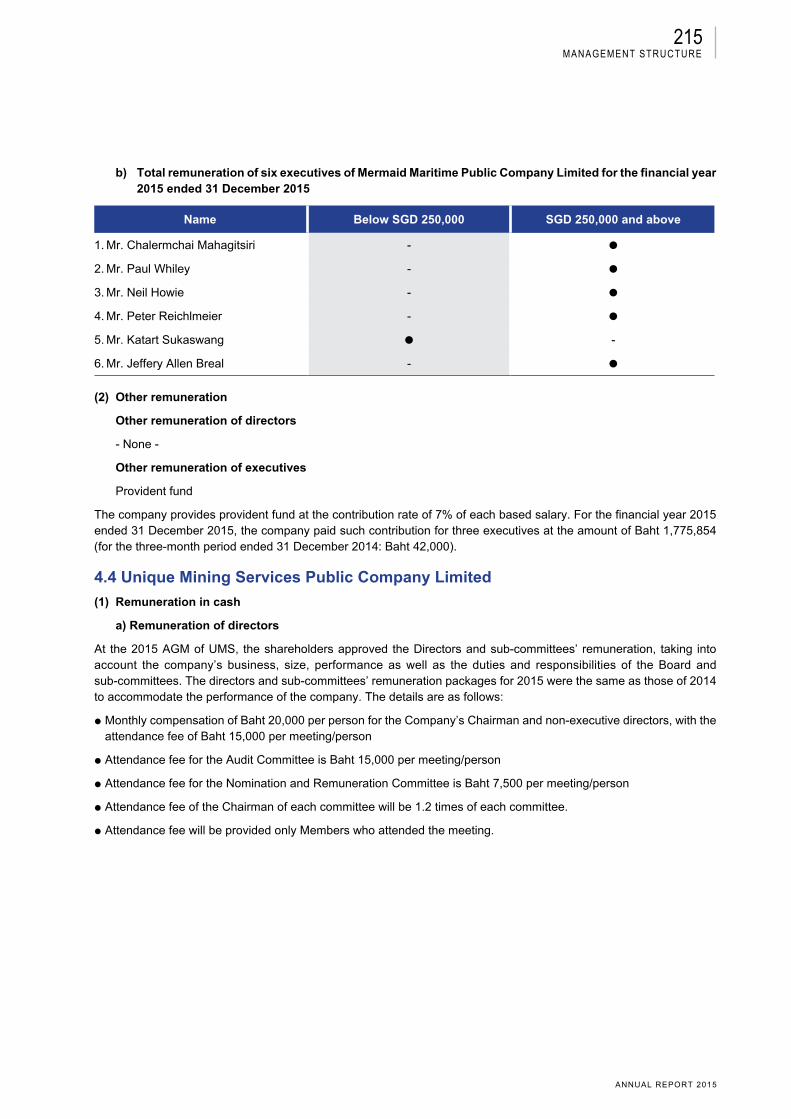
215
ANNUAL REPORT 2015
b) Total remuneration of six executives of Mermaid Maritime Public Company Limited for the financial year 2015 ended 31 December 2015
Name Below SGD 250,000 SGD 250,000 and above
1. Mr. Chalermchai Mahagitsiri -
2. Mr. Paul Whiley -
3. Mr. Neil Howie -
4. Mr. Peter Reichlmeier -
5. Mr. Katart Sukaswang -
6. Mr. Jeffery Allen Breal -
(2) Other remuneration
Other remuneration of directors
- None -
Other remuneration of executives
Provident fund
The company provides provident fund at the contribution rate of 7% of each based salary. For the financial year 2015 ended 31 December 2015, the company paid such contribution for three executives at the amount of Baht 1,775,854 (for the three-month period ended 31 December 2014: Baht 42,000).
4.4 Unique Mining Services Public Company Limited
(1) Remuneration in cash
a) Remuneration of directors
At the 2015 AGM of UMS, the shareholders approved the Directors and sub-committees’ remuneration, taking into account the company’s business, size, performance as well as the duties and responsibilities of the Board and sub-committees. The directors and sub-committees’ remuneration packages for 2015 were the same as those of 2014 to accommodate the performance of the company. The details are as follows:
Monthly compensation of Baht 20,000 per person for the Company’s Chairman and non-executive directors, with the attendance fee of Baht 15,000 per meeting/person
Attendance fee for the Audit Committee is Baht 15,000 per meeting/person
Attendance fee for the Nomination and Remuneration Committee is Baht 7,500 per meeting/person
Attendance fee of the Chairman of each committee will be 1.2 times of each committee.
Attendance fee will be provided only Members who attended the meeting.
manaGement structure
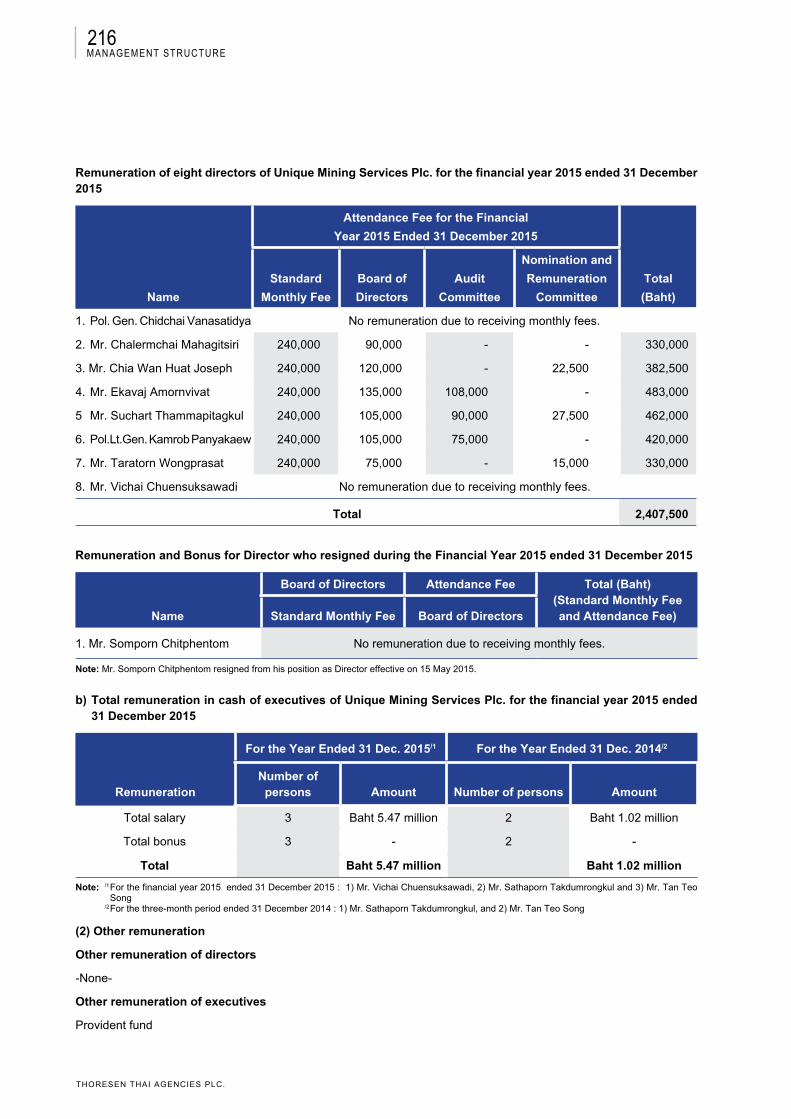
216
THORESEN THAI AGENCIES PLC.
Remuneration of eight directors of Unique Mining Services Plc. for the financial year 2015 ended 31 December 2015
Name
Attendance Fee for the Financial
Year 2015 Ended 31 December 2015
Total
(Baht)
Standard
Monthly Fee
Board of
Directors
Audit
Committee
Nomination and
Remuneration
Committee
1. Pol. Gen. Chidchai Vanasatidya No remuneration due to receiving monthly fees.
2. Mr. Chalermchai Mahagitsiri 240,000 90,000 - - 330,000
3. Mr. Chia Wan Huat Joseph 240,000 120,000 - 22,500 382,500
4. Mr. Ekavaj Amornvivat 240,000 135,000 108,000 - 483,000
5 Mr. Suchart Thammapitagkul 240,000 105,000 90,000 27,500 462,000
6. Pol.Lt.Gen. Kamrob Panyakaew 240,000 105,000 75,000 - 420,000
7. Mr. Taratorn Wongprasat 240,000 75,000 - 15,000 330,000
8. Mr. Vichai Chuensuksawadi No remuneration due to receiving monthly fees.
Total 2,407,500
Remuneration and Bonus for Director who resigned during the Financial Year 2015 ended 31 December 2015
Name
Board of Directors Attendance Fee Total (Baht) (Standard Monthly Fee and Attendance Fee)Standard Monthly Fee Board of Directors
1. Mr. Somporn Chitphentom No remuneration due to receiving monthly fees.
Note: Mr. Somporn Chitphentom resigned from his position as Director effective on 15 May 2015.
b) Total remuneration in cash of executives of Unique Mining Services Plc. for the financial year 2015 ended 31 December 2015
Remuneration
For the Year Ended 31 Dec. 2015/1 For the Year Ended 31 Dec. 2014/2
Number of persons Amount Number of persons Amount
Total salary 3 Baht 5.47 million 2 Baht 1.02 million
Total bonus 3 - 2 -
Total Baht 5.47 million Baht 1.02 million
Note: /1 For the financial year 2015 ended 31 December 2015 : 1) Mr. Vichai Chuensuksawadi, 2) Mr. Sathaporn Takdumrongkul and 3) Mr. Tan Teo Song /2 For the three-month period ended 31 December 2014 : 1) Mr. Sathaporn Takdumrongkul, and 2) Mr. Tan Teo Song
(2) Other remuneration
Other remuneration of directors
-None-
Other remuneration of executives
Provident fund
manaGement structure
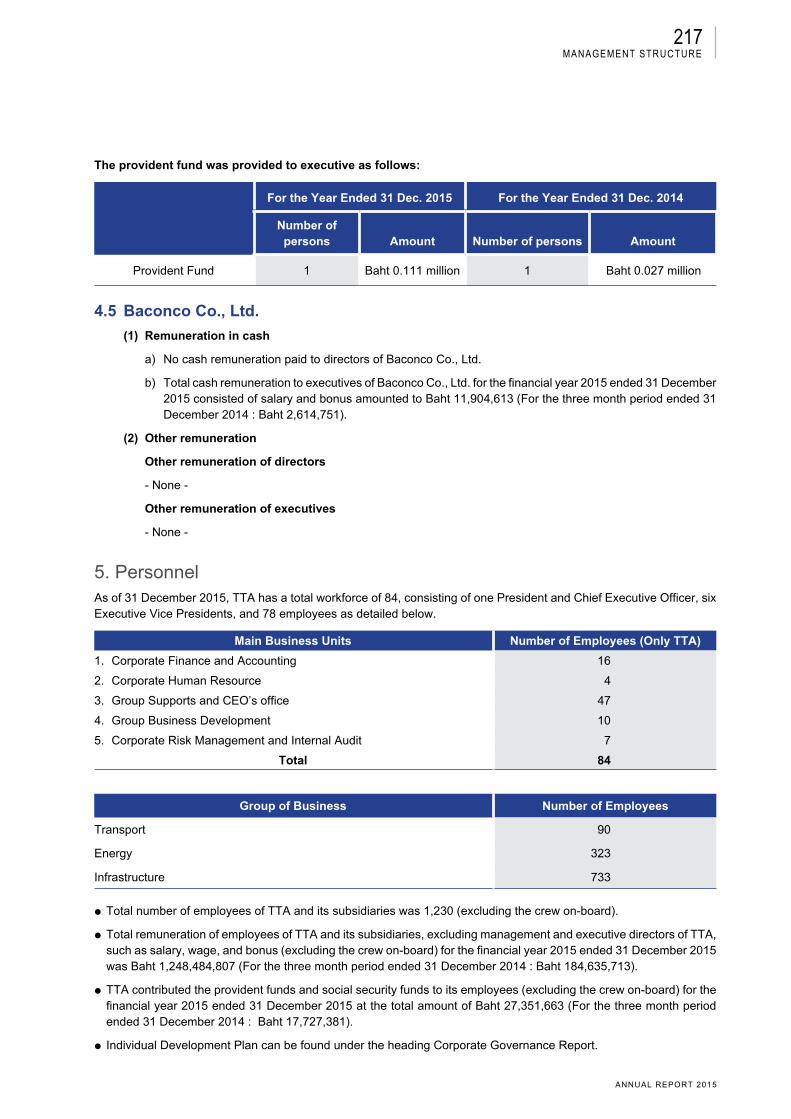
217
ANNUAL REPORT 2015
The provident fund was provided to executive as follows:
For the Year Ended 31 Dec. 2015 For the Year Ended 31 Dec. 2014
Number of persons Amount Number of persons Amount
Provident Fund 1 Baht 0.111 million 1 Baht 0.027 million
4.5 Baconco Co., Ltd.
(1) Remuneration in cash
a) No cash remuneration paid to directors of Baconco Co., Ltd.
b) Total cash remuneration to executives of Baconco Co., Ltd. for the financial year 2015 ended 31 December 2015 consisted of salary and bonus amounted to Baht 11,904,613 (For the three month period ended 31 December 2014 : Baht 2,614,751).
(2) Other remuneration
Other remuneration of directors
- None -
Other remuneration of executives
- None -
5. PersonnelAs of 31 December 2015, TTA has a total workforce of 84, consisting of one President and Chief Executive Officer, six Executive Vice Presidents, and 78 employees as detailed below.
Main Business Units Number of Employees (Only TTA)
1. Corporate Finance and Accounting 16
2. Corporate Human Resource 4
3. Group Supports and CEO’s office 47
4. Group Business Development 10
5. Corporate Risk Management and Internal Audit 7
Total 84
Group of Business Number of Employees
Transport 90
Energy 323
Infrastructure 733
Total number of employees of TTA and its subsidiaries was 1,230 (excluding the crew on-board).
Total remuneration of employees of TTA and its subsidiaries, excluding management and executive directors of TTA, such as salary, wage, and bonus (excluding the crew on-board) for the financial year 2015 ended 31 December 2015 was Baht 1,248,484,807 (For the three month period ended 31 December 2014 : Baht 184,635,713).
TTA contributed the provident funds and social security funds to its employees (excluding the crew on-board) for the financial year 2015 ended 31 December 2015 at the total amount of Baht 27,351,663 (For the three month period ended 31 December 2014 : Baht 17,727,381).
Individual Development Plan can be found under the heading Corporate Governance Report.
manaGement structure
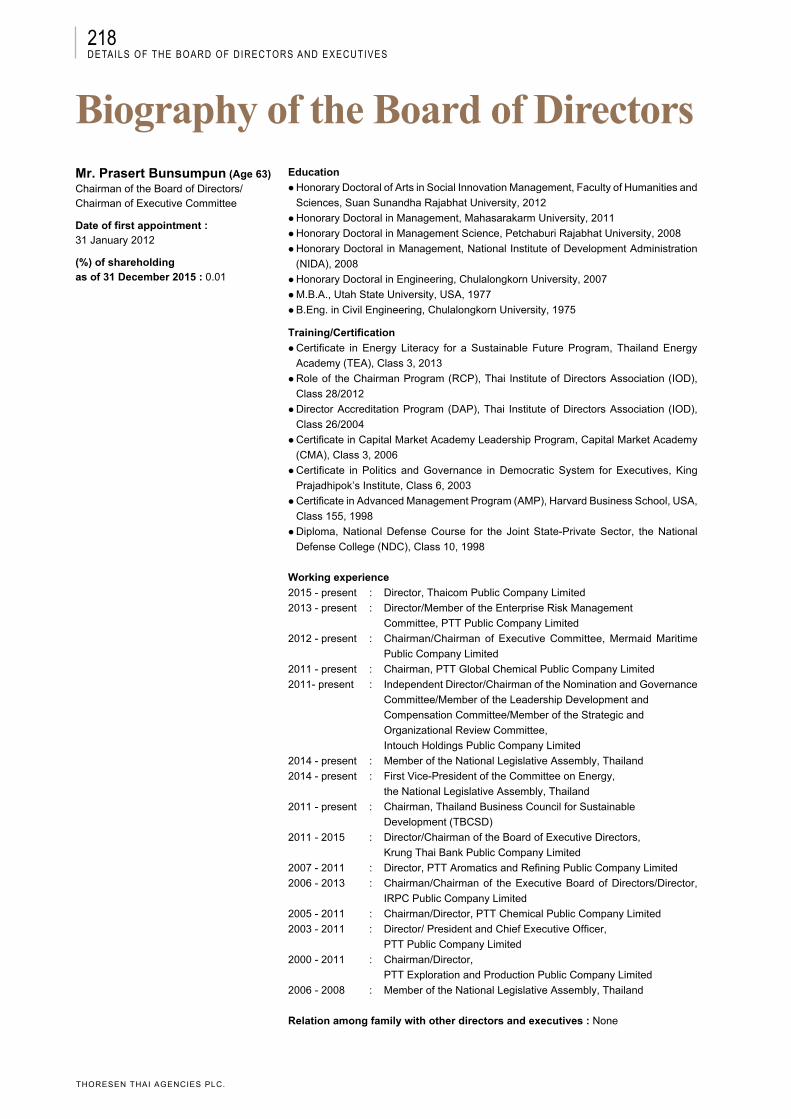
218
THORESEN THAI AGENCIES PLC.
Mr. Prasert Bunsumpun (Age 63)Chairman of the Board of Directors/Chairman of Executive Committee
Date of first appointment : 31 January 2012
(%) of shareholding as of 31 December 2015 : 0.01
Education
Honorary Doctoral of Arts in Social Innovation Management, Faculty of Humanities and
Sciences, Suan Sunandha Rajabhat University, 2012
Honorary Doctoral in Management, Mahasarakarm University, 2011
Honorary Doctoral in Management Science, Petchaburi Rajabhat University, 2008
Honorary Doctoral in Management, National Institute of Development Administration
(NIDA), 2008
Honorary Doctoral in Engineering, Chulalongkorn University, 2007
M.B.A., Utah State University, USA, 1977
B.Eng. in Civil Engineering, Chulalongkorn University, 1975
Training/Certification
Certificate in Energy Literacy for a Sustainable Future Program, Thailand Energy
Academy (TEA), Class 3, 2013
Role of the Chairman Program (RCP), Thai Institute of Directors Association (IOD),
Class 28/2012
Director Accreditation Program (DAP), Thai Institute of Directors Association (IOD),
Class 26/2004
Certificate in Capital Market Academy Leadership Program, Capital Market Academy
(CMA), Class 3, 2006
Certificate in Politics and Governance in Democratic System for Executives, King
Prajadhipok’s Institute, Class 6, 2003
Certificate in Advanced Management Program (AMP), Harvard Business School, USA,
Class 155, 1998
Diploma, National Defense Course for the Joint State-Private Sector, the National
Defense College (NDC), Class 10, 1998
Working experience
2015 - present : Director, Thaicom Public Company Limited
2013 - present : Director/Member of the Enterprise Risk Management
Committee, PTT Public Company Limited
2012 - present : Chairman/Chairman of Executive Committee, Mermaid Maritime
Public Company Limited
2011 - present : Chairman, PTT Global Chemical Public Company Limited
2011- present : Independent Director/Chairman of the Nomination and Governance
Committee/Member of the Leadership Development and
Compensation Committee/Member of the Strategic and
Organizational Review Committee,
Intouch Holdings Public Company Limited
2014 - present : Member of the National Legislative Assembly, Thailand
2014 - present : First Vice-President of the Committee on Energy,
the National Legislative Assembly, Thailand
2011 - present : Chairman, Thailand Business Council for Sustainable
Development (TBCSD)
2011 - 2015 : Director/Chairman of the Board of Executive Directors,
Krung Thai Bank Public Company Limited
2007 - 2011 : Director, PTT Aromatics and Refining Public Company Limited
2006 - 2013 : Chairman/Chairman of the Executive Board of Directors/Director,
IRPC Public Company Limited
2005 - 2011 : Chairman/Director, PTT Chemical Public Company Limited
2003 - 2011 : Director/ President and Chief Executive Officer,
PTT Public Company Limited
2000 - 2011 : Chairman/Director,
PTT Exploration and Production Public Company Limited
2006 - 2008 : Member of the National Legislative Assembly, Thailand
Relation among family with other directors and executives : None
biography of the board of directorsdetails of tHe Board of directors and executives
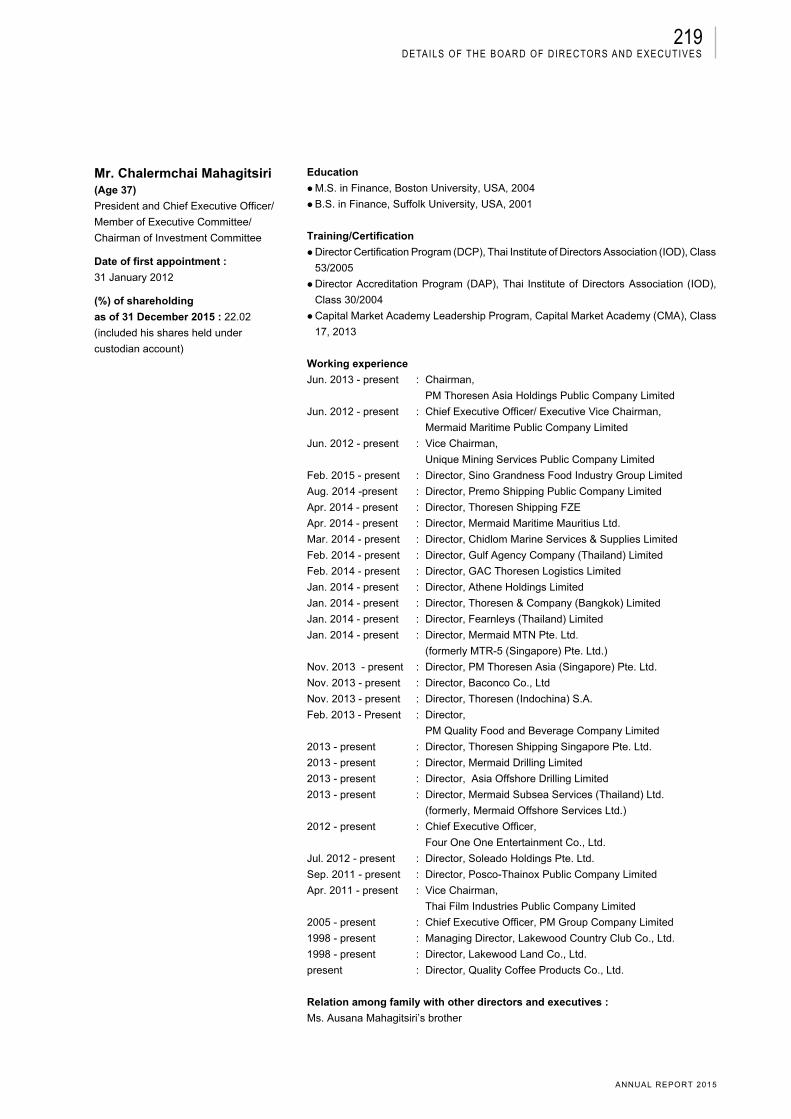
219
ANNUAL REPORT 2015
Mr. Chalermchai Mahagitsiri (Age 37)
President and Chief Executive Officer/
Member of Executive Committee/
Chairman of Investment Committee
Date of first appointment :
31 January 2012
(%) of shareholding
as of 31 December 2015 : 22.02
(included his shares held under
custodian account)
Education
M.S. in Finance, Boston University, USA, 2004
B.S. in Finance, Suffolk University, USA, 2001
Training/Certification
Director Certification Program (DCP), Thai Institute of Directors Association (IOD), Class
53/2005
Director Accreditation Program (DAP), Thai Institute of Directors Association (IOD),
Class 30/2004
Capital Market Academy Leadership Program, Capital Market Academy (CMA), Class
17, 2013
Working experience
Jun. 2013 - present : Chairman,
PM Thoresen Asia Holdings Public Company Limited
Jun. 2012 - present : Chief Executive Officer/ Executive Vice Chairman,
Mermaid Maritime Public Company Limited
Jun. 2012 - present : Vice Chairman,
Unique Mining Services Public Company Limited
Feb. 2015 - present : Director, Sino Grandness Food Industry Group Limited
Aug. 2014 -present : Director, Premo Shipping Public Company Limited
Apr. 2014 - present : Director, Thoresen Shipping FZE
Apr. 2014 - present : Director, Mermaid Maritime Mauritius Ltd.
Mar. 2014 - present : Director, Chidlom Marine Services & Supplies Limited
Feb. 2014 - present : Director, Gulf Agency Company (Thailand) Limited
Feb. 2014 - present : Director, GAC Thoresen Logistics Limited
Jan. 2014 - present : Director, Athene Holdings Limited
Jan. 2014 - present : Director, Thoresen & Company (Bangkok) Limited
Jan. 2014 - present : Director, Fearnleys (Thailand) Limited
Jan. 2014 - present : Director, Mermaid MTN Pte. Ltd.
(formerly MTR-5 (Singapore) Pte. Ltd.)
Nov. 2013 - present : Director, PM Thoresen Asia (Singapore) Pte. Ltd.
Nov. 2013 - present : Director, Baconco Co., Ltd
Nov. 2013 - present : Director, Thoresen (Indochina) S.A.
Feb. 2013 - Present : Director,
PM Quality Food and Beverage Company Limited
2013 - present : Director, Thoresen Shipping Singapore Pte. Ltd.
2013 - present : Director, Mermaid Drilling Limited
2013 - present : Director, Asia Offshore Drilling Limited
2013 - present : Director, Mermaid Subsea Services (Thailand) Ltd.
(formerly, Mermaid Offshore Services Ltd.)
2012 - present : Chief Executive Officer,
Four One One Entertainment Co., Ltd.
Jul. 2012 - present : Director, Soleado Holdings Pte. Ltd.
Sep. 2011 - present : Director, Posco-Thainox Public Company Limited
Apr. 2011 - present : Vice Chairman,
Thai Film Industries Public Company Limited
2005 - present : Chief Executive Officer, PM Group Company Limited
1998 - present : Managing Director, Lakewood Country Club Co., Ltd.
1998 - present : Director, Lakewood Land Co., Ltd.
present : Director, Quality Coffee Products Co., Ltd.
Relation among family with other directors and executives :
Ms. Ausana Mahagitsiri’s brother
details of tHe Board of directors and executives

220
THORESEN THAI AGENCIES PLC.
Mr. Jean Paul Thevenin (Age 75)Director/ Member of Executive Committee/Member of Investment Committee
Date of first appointment : 30 January 2014
(%) of shareholding as of 31 December 2015 : Own : NoneSpouse : 0.0006Total : 0.0006
EducationPh.D. in Metallurgy, Orsay University, France Honorary Ph.D., King Mongkut Institute of Technology, Thailand
Training/CertificationDirector Accreditation Program (DAP), Thai Institute of Directors Association (IOD), Class 74/2008
Working experienceJan. 2013 - present : Director, Mermaid Maritime Public Company Limited2005 - 2010 : Managing Director, Thainox Stainless Public Company Limited31 Dec. 2015 - present : Director, Mermaid Subsea Services (International) Ltd. (formerly, Subtech Ltd.)28 Dec. 2015 - present : Director, Thoresen Shipping Singapore Pte. Ltd.Jun. 2015 - present : Director, Mermaid Subsea Services (Thailand) Ltd.Jun. 2015 - present : Director, Seascape Surveys (Thailand) Ltd.Nov. 2014 - present : Mermaid MTN Pte. Ltd. (formerly, MTR-5 (Singapore) Pte. Ltd.)Sep. 2014 - present : Director, Mermaid Drilling Ltd.Sep. 2014 - present : Director, MTR-1 Ltd.Sep. 2014 - present : Director, MTR-2 Ltd.1998 - 2004 : President, Franco - Thai Chamber of Commerce
Relation among family with other directors and executives : None
Mr. Chia Wan Huat Joseph (Age 56)Director/ Member of Executive Committee/Chairman of Risk Management Committee/Member of Investment Committee
Date of first appointment : 31 January 2012
(%) of shareholding as of 31 December 2015 : None
EducationMaster’s Degree (EMBA), Sasin Institute of Business Administration of Chulalongkorn University in a joint program with Kellogg Graduate School of Management of Northwestern University, USA Training/CertificationDirector Certification Program (DCP), Thai Institute of Directors Association (IOD), Class 165/2012
Working experienceJun. 2012 - present : Director and Member of Executive Committee, Mermaid Maritime Public Company LimitedJun. 2012 - present : Director and Member of Executive Committee, Unique Mining Services Public Company LimitedDec. 2015 - present : Director, Thoresen Shipping Singapore Pte. Ltd.Jan. 2015 - present : Director, Baconco Co., Ltd.Feb. 2015 - present : Director, Thoresen & Company (Bangkok) LimitedFeb. 2015 - present : Director, Thoresen Shipping & Logistics Ltd.Aug. 2014 - present : Director, Thoresen Shipping FZE2013 - present : Director, PM Thoresen Asia Holdings Public Company Limited Jan. 2012 - present : Senior Executive Vice President, PM Group Company Limited2005 - 2011 : Senior Executive Vice President, Structured Finance Group, Advance Finance Plc.
Relation among family with other directors and executives : None
details of tHe Board of directors and executives
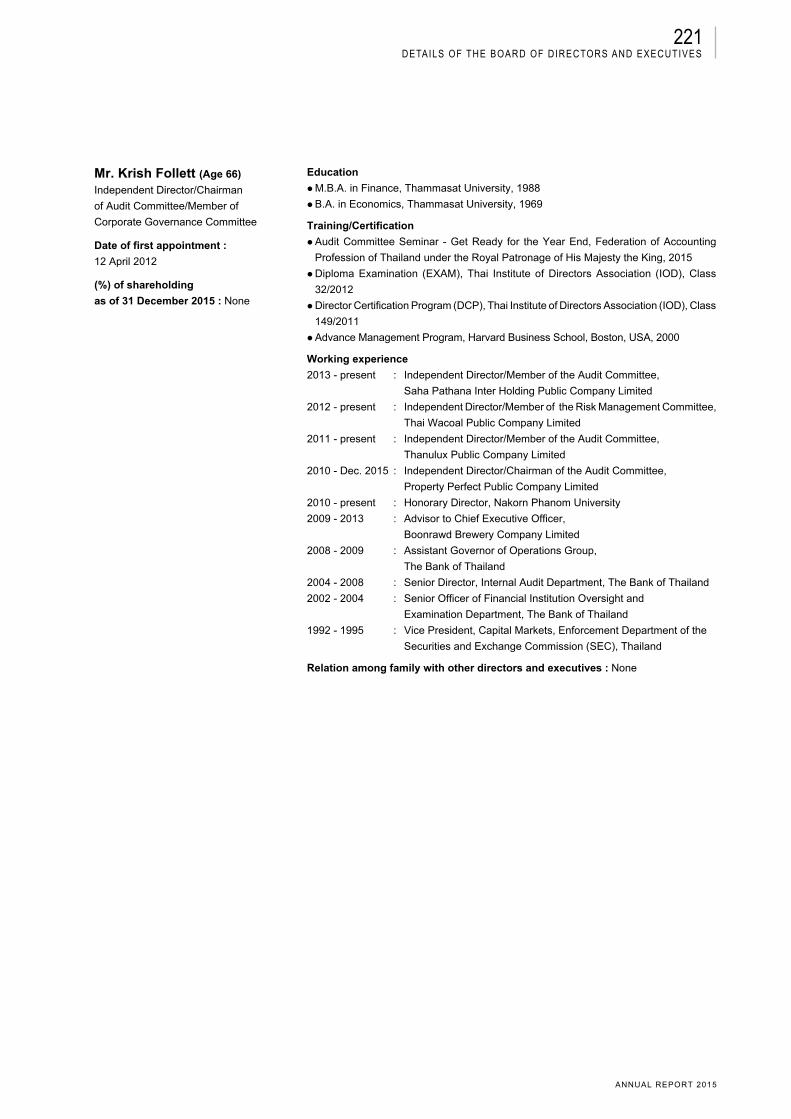
221
ANNUAL REPORT 2015
Mr. Krish Follett (Age 66)
Independent Director/Chairman
of Audit Committee/Member of
Corporate Governance Committee
Date of first appointment :
12 April 2012
(%) of shareholding
as of 31 December 2015 : None
Education
M.B.A. in Finance, Thammasat University, 1988
B.A. in Economics, Thammasat University, 1969
Training/Certification
Audit Committee Seminar - Get Ready for the Year End, Federation of Accounting
Profession of Thailand under the Royal Patronage of His Majesty the King, 2015
Diploma Examination (EXAM), Thai Institute of Directors Association (IOD), Class
32/2012
Director Certification Program (DCP), Thai Institute of Directors Association (IOD), Class
149/2011
Advance Management Program, Harvard Business School, Boston, USA, 2000
Working experience
2013 - present : Independent Director/Member of the Audit Committee,
Saha Pathana Inter Holding Public Company Limited
2012 - present : Independent Director/Member of the Risk Management Committee,
Thai Wacoal Public Company Limited
2011 - present : Independent Director/Member of the Audit Committee,
Thanulux Public Company Limited
2010 - Dec. 2015 : Independent Director/Chairman of the Audit Committee,
Property Perfect Public Company Limited
2010 - present : Honorary Director, Nakorn Phanom University
2009 - 2013 : Advisor to Chief Executive Officer,
Boonrawd Brewery Company Limited
2008 - 2009 : Assistant Governor of Operations Group,
The Bank of Thailand
2004 - 2008 : Senior Director, Internal Audit Department, The Bank of Thailand
2002 - 2004 : Senior Officer of Financial Institution Oversight and
Examination Department, The Bank of Thailand
1992 - 1995 : Vice President, Capital Markets, Enforcement Department of the
Securities and Exchange Commission (SEC), Thailand
Relation among family with other directors and executives : None
details of tHe Board of directors and executives

222
THORESEN THAI AGENCIES PLC.
Mr. Cherdpong Siriwit (Age 69)Independent Director/Member of Audit Committee/Member of Risk Management Committee
Date of first appointment : 30 January 2013
(%) of shareholding as of 31 December 2015 : None
EducationM.A. Economics, Georgetown University, USAB.A. Economics (Honor), Thammasat University
Training/CertificationAudit Committee Program (ACP), Thai Institute of Directors Association (IOD), Class 27/2009Directors Certification Program (DCP), Thai Institute of Directors Association (IOD), Class 104/2008 Finance of Non-Finance Directors (FND), Thai Institute of Directors Association (IOD), Class 13/2004Role of Chairman Program (RCP), Thai Institute of Directors Association (IOD), Class 10/2004Director Accreditation Program (DAP), Thai Institute of Directors Association (IOD), Class 8/2004Diploma, The Joint State-Private Sector Course, National Defense College, Class 40Advanced Certificate Course in Politics and Governance in Democratic System for
Executives, King Prajadhipok’s Institute, Class 5The Civil Service Executive Development Program I, The Civil Service Training Institute,
Class 13/1993Capital Market Academy Leadership Program, Capital Market Academy (CMA), Class 5
Working experienceMay 2009 - present : Chairman of Audit Committee, IRPC Public Company LimitedApr. 2009 - present : Independent Director, IRPC Public Company Limited2010 - present : Chairman, Solartron Public Company Limited2009 - present : Chairman and Audit Committee, Advance Finance Public Company Limited2012 - Present : Chairman, Thai Sugar Millers Corporation Limited 2011 - present : Chairman, Vithai Biopower Company Limited2009 - present : Director, Evergreen Plus Company LimitedNov. 2011 - Oct. 2014 : Chairman of Corporate Governance Committee, IRPC Public Company Limited2006 - 2009 : Independent Director/Audit Committee/Remuneration Director,
PTT Chemical Public Company Limited2005 - 2007 : Chairman, Rayong Refinery Public Company Limited 2004 - 2008 : Chairman, PTT Exploration and Production Public Company
Limited 2004 - 2008 : Chairman, Thai Oil Public Company Limited 2003 - 2007 : Chairman, PTT Public Company Limited2003 - 2007 : Chairman, Ratchaburi Electricity Generating Holding Public
Company Limited2003 - 2004 : Chairman, Electricity Generating Authority of Thailand (EGAT) 2002 - 2006 : Permanent Secretary, Ministry of Energy
Relation among family with other directors and executives : None
details of tHe Board of directors and executives

223
ANNUAL REPORT 2015
Mr. Santi Bangor (Age 69)
Independent Director/Chairman of
Nomination and Remuneration
Committee/Chairman of Corporate
Governance Committee/Member of
Audit Committee
Date of first appointment :
31 January 2012
(%) of shareholding
as of 31 December 2015 : None
Education
M.A. in Agricultural Economics, Texas Tech University, USA, 1980
B.A. in Political Science (Fiscal), Chulalongkorn University, 1968
Training/Certification
Audit Committee Seminar - Get Ready for the Year End, Federation of Accounting
Profession of Thailand under the Royal Patronage of His Majesty the King, 2015
Audit Committee Program (ACP), Thai Institute of Directors Association (IOD),
Class 42/2013
Monitoring Fraud Risk Management (MFM), Thai Institute of Directors Association (IOD),
Class 9/2013
Monitoring the System of Internal Control and Risk Management (MIR), Thai Institute
of Directors Association (IOD), Class 14/2013
Monitoring the Internal Audit Function (MIA), Thai Institute of Directors Association
(IOD), Class 14/2013
Monitoring the Quality of Financial Reporting (MFR), Thai Institute of Directors
Association (IOD), Class 17/2013
Role of the Compensation Committee Program (RCC), Thai Institute of Directors
Association (IOD), Class 16/2013
Director Certification Program (DCP), Thai Institute of Directors Association (IOD),
Class 12/2001
Diploma, National Defense College (NDC), Class 38, 1995
Development Certificate, Cambridge University, England, 1975
Working experience
2013 - present : Independent Director/Chairman of the Corporate Governance
Committee, People’s Garment Public Company Limited
2010 - present : Member of the Audit Committee,
People’s Garment Public Company Limited
2012 - present : Member of State Enterprise Performance Agreement and Performance
Appraisal Sub-Committee on Communication and Energy Sector,
Performance Appraisal Committee, Ministry of Finance
2006 - 2009 : President, Yonok University (Nation University)
2001- 2002 : Director, State Railway Authority
1999 - 2001 : Director, Metropolitan Electricity Authority
1997 - 2006 : Deputy Secretary General to the National Economic and Social
Development Board, Office of the Prime Minister
1996 - 1999 : Director, Government Pension Board
Relation among family with other directors and executives: None
details of tHe Board of directors and executives
224
THORESEN THAI AGENCIES PLC.
Ms. Ausana Mahagitsiri (Age 35)Director/Member of Nomination and Remuneration Committee/Member of Corporate Governance Committee
Date of first appointment : 31 January 2012
(%) of shareholding as of 31 December 2015 : 3.89
Mr. Mohammed Bin Rashed Bin Ahmad Bin Muftah Al Nasseri (Age 45)
Independent Director/Member of
Nomination and Remuneration Committee
Date of first appointment :
30 January 2013
(%) of shareholding
as of 31 December 2015 : None
Education
M.B.A., Sasin Graduate Institute of Business Administration of Chulalongkorn
University in a joint program with Kellogg Graduate School of Management of
Northwestern University, USA, 2005
B.S. in Business Administration, Boston University School of Management, USA, 2002
Training/Certification
Director Accreditation Program (DAP), Thai Institute of Directors Association (IOD),
Class 30/2004
Working experience
2013 - present : Director, Thai Film Industries Public Company Limited
Mar. 2014 - present : Director, Chidlom Marine Services & Supplies Ltd.
Feb. 2014 - present : Director, GAC Thoresen Logistics Ltd.
Jan. 2014 - present : Director, Athene Holdings Ltd.
Jan. 2014 - present : Director, Soleado Holdings Pte. Ltd.
Jan. 2014 - present : Director, Thoresen Shipping Singapore Pte. Ltd.
2011 - present : Chief Operating Officer, PM Group Co., Ltd.
2010 - present : Managing Director, The Nest Property Co., Ltd.
2010 - present : Director, Quality Coffee Products Co., Ltd.
2008 - present : Director, Four One One Entertainment Co., Ltd.
2006 - present : Managing Director, Mountain Creek Development Co. Ltd.
1998 - present : Director, Lakewood Country Club Co., Ltd.
1998 - present : Director, Lakewood Land Co., Ltd.
Relation among family with other directors and executives:
Mr. Chalermchai Mahagitsiri’ s sister and Mr. Kamolsut Dabbaransi’ s spouse
Education
License of Law, Emirates University
Training/Certification : None
Working experience
Present : Member of the National Consulting Council, UAE
Present : Assistant-Undersecretary in the Financial Department of Abu Dhabi, UAE
Present : Director General of Pvt. & Official office of H.H Sheikh Mohammed Bin
Khalifa Bin Zayed Al Nahyan, UAE
Present : Vice President of Youth Hostel Society, UAE
Present : Board’s Member of The Emirates Insurance Company, UAE
Present : Board’s Member of The National Investor Company, UAE
Present : Board’s Member of Alwifaq Finance Company, UAE
Present : General Manager of Al Ain Equestrian, Shooting & Golf Club, UAE
Present : Chairman of Gulf Islamic Investment Company, UAE
Relation among family with other directors and executives: None
details of tHe Board of directors and executives
225
ANNUAL REPORT 2015
Mr. Yves Barbieux (Age 77)Director
Date of first appointment : 12 July 2013
(%) of shareholding as of 31 December 2015 : None
EducationM.B.A., Harvard Business School, USA, 1973M.B.A., Institut d’Administration des Entreprises de Paris, France, 1967Bachelor’s Degree, Civil Engineer, Ecole Centrale de Paris, France, 1961
Training/CertificationNone
Working ExperiencePresent : Member of the Executive Board, Claranor, FrancePresent : Member of the Executive Board, Lucibel, France2003 - Present : Executive Chairman, Elsa Consultant S.A. 2000 - 2004 : Executive Chairman, CPG Market S.A.1996 - 2000 : Chairman and Chief Executive Officer, NESTLE ITALY1993 - 1996 : Chairman and Chief Executive Officer, NESTLE FRANCE1989 - 1992 : Chairman and Chief Executive Officer, SOPAD NESTLE, France1988 - 1989 : Chairman and Chief Executive Officer, NESTLE THAILAND1978 - 1981 : Chairman and Chief Executive Officer, NESTLE BELGIUM1976 - 1978 : Chief Executive Officer, NESTLE VENEZUELA
Relation among family with other directors and executives : None
Mr. Chitrapongse Kwangsukstith (Age 66)
Independent Director
Date of first appointment :
13 May 2015
(%) of shareholding
as of 31 December 2015 : None
Education
Doctorate Degree in Industrial Engineering, Lamar University, USA, 1979
Master Degree in Industrial Engineering, Lamar University, USA, 1974
Bachelor Degree in Mechanical Engineering, Chulalongkorn University, 1970
Training/Certification
Role of the Compensation Committee Program (RCC),
Thai Institute of Directors Association (IOD), Class 10/2010
Directors Certification Program (DCP),
Thai Institute of Directors Association (IOD), Class 42/2004
Finance for Non-Finance Director Program (FND),
Thai Institute of Directors Association (IOD), Class 9/2004
National Corporate Governance Committee (NCGC),
Thai Institute of Directors Association (IOD)
Diploma in National Defense Course for the Joint State-Private Sector,
the National Defense College (NDC/4212), Class 12
Stanford Executive Program, Stanford University, USA
Working experience
2012 - 2014 : Chairman of the Board, PTT Energy Resources Limited
2009 - 2012 : Chairman and Acting President of PTT Energy Resources Limited
2008 - 2009 : Chief Operating Officer, Upstream Petroleum and Gas Business Group,
PTT Public Company Limited
2003 - 2007 : Senior Executive Vice President, Exploration & Production and Gas
Business Unit, PTT Public Company Limited
2000 - 2003 : Senior Executive Vice President, PTT Public Company Limited,
working as President, PTT Exploration & Production Public
Company Limited
Relation among family with other directors and executives : None
details of tHe Board of directors and executives
226
THORESEN THAI AGENCIES PLC.
Biography of the Executive OfficersMr. Chalermchai Mahagitsiri (Age 37)President and Chief Executive Officer/ Member of Executive Committee/Chairman of Investment Committee
Date of first appointment as Executive : 31 January 2012
(%) of shareholding as of 31 December 2015 : 22.02 (included his shares held under custodian account)
EducationMaster in Computer Science Finance/Administration, EDB Hoeyskolen, Norway
Training/CertificationDirector Certification Program (DCP), Thai Institute of Directors Association (IOD),
Class 182/2013
Working experience2015 - present : Director/ Managing Director/Executive Committee/Nomination
and Remuneration Committee, PM Thoresen Asia Holdings Public Company Limited
2015 - present : Director,Thoresen Shipping Singapore Pte. Ltd.2015 - present : Director, Fearnleys (Thailand) Ltd.2015 - present : Director, Gulf Agency Company (Thailand) Co., Ltd.2015 - present : Director, GAC Thoresen Logistics Ltd. 2015 - present : Director, Thoresen Shipping and Logistics Ltd.2015 - present : Director, Petrolift Inc.2014 - present : Chairman, Thoresen-Vinama Agencies Co., Ltd.2013 - present : Director, Sharjah Ports Services LLC2013 - 2014 : Director, PM Thoresen Asia Holdings Ltd.2013 - present : Director, PM Thoresen Asia (Singapore) Pte. Ltd.2013 - present : Director, Thoresen Shipping FZE2010 - present : Director, Baria Joint Stock Company of Services for Import
Export of Agro-Forestry Products and Fertilizers (“Baria Serece”)2012 - present : Chairman, Thoresen-Vinama Logistics Co., Ltd.2009 - present : Chairman, Baconco Co., Ltd.2003 - present : Director, Thoresen (Indochina) S.A.2000 - present : Chairman, The NORDIC Chamber of Commerce in HCMC,
Vietnam
Relation among family with other directors and executives : None
Mr. Sigmund Stromme (Age 59)Executive Vice President - Shipping & Logistics
Date of appointment : 6 May 2015
(%) of shareholding as of 31 December 2015 : 0.0079
EducationBachelor of Commerce (Honors), University of Delhi, IndiaFellow Chartered Accountant (FCA)
Training/CertificationDirector Certification Program (DCP), Thai Institute of Directors Association (IOD),
Class 78/2006The Board’s Role in Mergers and Acquisition (M&A), Thai Institute of Directors
Association (IOD), Class 1/2011
Working experienceDec. 2015 - present : Board’s Member, Thoresen Shipping Singapore Pte. Ltd.Jun. 2015 - present : Board’s Member, Soleado Holdings Pte. Ltd.Jun. 2015 - present : Board’s Member, Thoresen Shipping FZENov. 2011 - Mar. 2015 : Executive Director & CFO, Jindal Stainless Limited Board’s
Member, Jindal Stainless LimitedAug. 2005 - Oct. 2011 : CFO and Acting Managing Director, Thainox Stainless Public
Company Limited (now renamed as POSCO - Thainox Public Company Limited)
Aug. 2003 - Aug. 2005 : Finance Director Asia, Dole Asia, PhilippinesApr. 2002 - Aug. 2003 : Asia Regional Treasurer, Dole Food Company, Hong KongApr. 1998 - Apr. 2002 : Finance Director and Controller, Dole Thailand LimitedAug. 1996 - Feb. 1998 : Finance Director, Seagate Technology, ThailandAug. 1988 - Aug. 1996 : Various other positions in India and overseas at progressive
levels
Relation among family with other directors and executives : None
Mr. Jitender Pal Verma (Age 51)Senior Executive Vice President and Group CFO/Member of Executive Committee
Date of first appointment : 13 May 2015
(%) of shareholding as of 31 December 2015 : 0.0030(shares held under Thai NVDR)
details of tHe Board of directors and executives
His biography appears in the section
“Biography of the Board of Directors”.
227
ANNUAL REPORT 2015
Education
Master of Science in Actuarial Science, Boston University, USA
Bachelor of Science in Industrial Engineering and Operation Research, University of
Massachusetts, USA
Training/Certification
Director Certification Program (DCP), Thai Institute of Directors Association (IOD),
Class 119/2009
Pacific Basin Economic Council Thailand (PBEC) - Director General 2002 - 2004
Working experience
2013 - present : Chief Business Development Officer, PM Group Co., Ltd.
2010 - present : CEO/Founder, Mugendai Co., Ltd.
2007 - 2013 : Vice President: Business Development, SCB Securities Co., Ltd.
2001 - 2004 : Marketing Analyst, Green Spot Co., Ltd.
Relation among family with other directors and executives:
Ms. Ausana Mahagitsiri’ s spouse
Education
Bachelor of Commerce & Management, Lincoln University, New Zealand, 1998
Training/Certification
Chartered Financial Analyst (CFA), CFA Institute
CPA Australia
Working experience
2013 - 2014 : Senior Vice President, Maybank Kim Eng, Singapore
2005 - 2012 : Executive Director, Goldman Sachs, Singapore
2004 - 2005 : Vice President, ECM Libra, Malaysia
2000 - 2004 : Analyst, HSBC Securities, Malaysia
1998 - 2000 : Auditor, Ernst & Young, Malaysia
Relation among family with other directors and executives : None
Mr. Kamolsut Dabbaransi (Age 38)
Senior Executive Vice President,
Head of Food & Beverage
Date of appointment : 1 June 2015
(%) of shareholding
as of 31 December 2015 :
Own : None
Spouse : 3.89
Total : 3.89
Mr. Ng Kit Wei, David (Age 38)
Executive Vice President, Investment
Member of Investment Committee
(Appointed as Executive Vice President,
Investment & Corporate Strategy and
Risk Management effective on
1 January 2016)
Date of appointment : 20 January 2015
(%) of shareholding
as of 31 December 2015 : None
details of tHe Board of directors and executives

228
THORESEN THAI AGENCIES PLC.
Sec
uri
ties
Ho
ldin
g b
y D
irec
tors
T
he
secu
riti
es h
old
ing
by
TT
A’s
dir
ecto
rs a
s o
f 31
Dec
emb
er 2
015
Nam
e
No
. of
Sh
ares
No
. of
War
ran
ts #
TT
A-W
4N
o. o
f W
arra
nts
# T
TA
-W5/3
As
of
31 D
ec. 2
014
As
of
31 D
ec. 2
015
Ch
ang
es
Du
rin
g t
he
Yea
rA
s o
f 31
Dec
. 201
4A
s o
f 31
Dec
. 201
5C
han
ges
Du
rin
g t
he
Yea
rA
s o
f 31
Dec
. 201
5
1.
Mr.
Pra
sert
Bun
sum
pun
130,
000
182,
000
52,0
0010
,000
0(1
0,00
0)0
S
pous
e0
00
00
00
2.
Mr.
Cha
lerm
chai
Mah
agits
iri/1
283,
231,
202
401,
348,
382
118,
117,
180
23,4
90,6
4523
,490
,645
038
,430
,826
3.
Mr.
Jea
n P
aul T
heve
nin
00
00
00
0
S
pous
e8,
000
11,2
003,
200
1,00
01,
000
01,
066
4.
Mr.
Chi
a W
an H
uat J
osep
h0
00
00
00
S
pous
e0
00
00
00
5.
Mr.
Kris
h F
olle
tt0
00
00
00
S
pous
e0
00
00
00
6.
Mr.
San
ti B
ango
r0
00
00
00
S
pous
e0
00
00
00
7.
Ms.
Aus
ana
Mah
agits
iri50
,568
,384
70,7
95,7
3720
,227
,353
4,22
8,14
84,
228,
148
06,
742,
451
S
pous
e0
00
00
00
8.
Mr.
Moh
amm
ed R
ashe
d
Ahm
ad M
. Al N
asse
ri 0
00
00
00
S
pous
e0
00
00
00
9.
Mr.
Yve
s B
arbi
eux
00
00
00
0
Spo
use
00
00
00
0
10.
Mr.
Che
rdpo
ng S
iriw
it 0
00
00
00
S
pous
e0
00
00
00
11.
Mr.
Chi
trap
ongs
e K
wan
gsuk
stith
/20
00
00
00
S
pous
e0
00
00
00
To
tal
333,
937,
586
472,
337,
319
138,
399,
733
27,7
29,7
9327
,719
,793
(10,
000)
45,1
74,3
43
Not
e :
/1 T
he n
umbe
r of
sha
res
as o
f 31
Dec
embe
r 20
15 in
clud
ed h
is s
hare
s he
ld u
nder
cus
todi
an a
ccou
nt.
/2
Mr.
Chi
trap
ongs
e K
wan
gsuk
stith
was
app
oint
ed a
s a
dire
ctor
on
13 M
ay 2
015
to r
epla
ce M
r. G
hani
m S
aad
M. A
lsaa
d A
l-Kuw
ari,
the
resi
gned
dire
ctor
.
/3 T
TA
-W5
was
issu
ed a
nd a
llotte
d in
201
5.
rep
ort o
n th
e se
curi
ties h
oldi
ng o
f the
d
irec
tors
and
exe
cutiv
es
securities HoldinG By tHe directors and executives
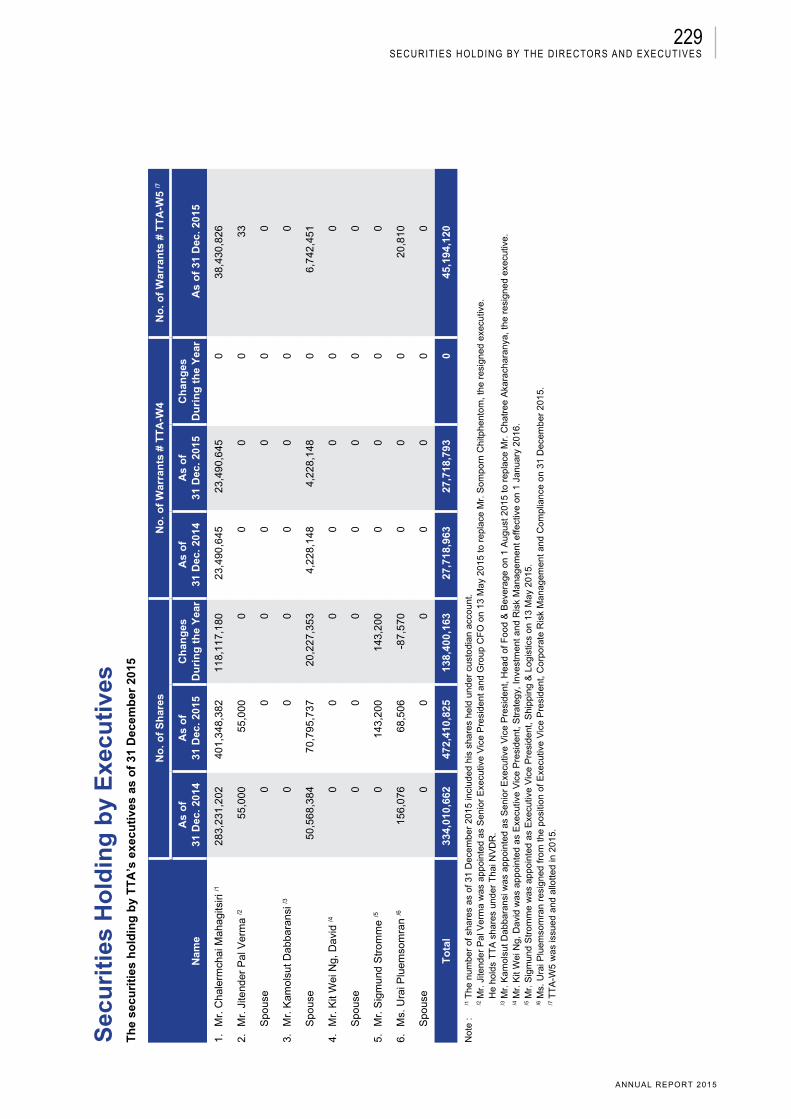
229
ANNUAL REPORT 2015
Sec
uri
ties
Ho
ldin
g b
y E
xecu
tive
sT
he
secu
riti
es h
old
ing
by
TT
A’s
exe
cuti
ves
as o
f 31
Dec
emb
er 2
015
Nam
e
No
. of
Sh
ares
No
. of
War
ran
ts #
TT
A-W
4N
o. o
f W
arra
nts
# T
TA
-W5
/7
As
of
31 D
ec. 2
014
As
of
31 D
ec. 2
015
Ch
ang
esD
uri
ng
th
e Y
ear
As
of
31 D
ec. 2
014
As
of
31 D
ec. 2
015
Ch
ang
esD
uri
ng
th
e Y
ear
As
of
31 D
ec. 2
015
1.
Mr.
Cha
lerm
chai
Mah
agits
iri /1
283,
231,
202
401,
348,
382
118,
117,
180
23,4
90,6
4523
,490
,645
038
,430
,826
2.
Mr.
Jite
nder
Pal
Ver
ma
/255
,000
55,0
000
00
033
S
pous
e0
00
00
00
3.
Mr.
Kam
olsu
t Dab
bara
nsi /3
00
00
00
0
S
pous
e50
,568
,384
70,7
95,7
3720
,227
,353
4,22
8,14
84,
228,
148
06,
742,
451
4.
Mr.
Kit
Wei
Ng,
Dav
id /4
00
00
00
0
S
pous
e0
00
00
00
5.
Mr.
Sig
mun
d S
trom
me
/50
143,
200
143,
200
00
00
6.
Ms.
Ura
i Plu
emso
mra
n /6
156,
076
68,5
06-8
7,57
00
00
20,8
10
S
pous
e0
00
00
00
To
tal
334,
010,
662
472,
410,
825
138,
400,
163
27,7
18,9
6327
,718
,793
045
,194
,120
Not
e :
/1 T
he n
umbe
r of
sha
res
as o
f 31
Dec
embe
r 20
15 in
clud
ed h
is s
hare
s he
ld u
nder
cus
todi
an a
ccou
nt.
/2
Mr.
Jite
nder
Pal
Ver
ma
was
app
oint
ed a
s S
enio
r E
xecu
tive
Vic
e P
resi
dent
and
Gro
up C
FO
on
13 M
ay 2
015
to r
epla
ce M
r. S
ompo
rn C
hitp
hent
om, t
he r
esig
ned
exec
utiv
e.
He
hold
s T
TA
sha
res
unde
r T
hai N
VD
R.
/3 M
r. K
amol
sut D
abba
rans
i was
app
oint
ed a
s S
enio
r E
xecu
tive
Vic
e P
resi
dent
, Hea
d of
Foo
d &
Bev
erag
e on
1 A
ugus
t 201
5 to
rep
lace
Mr.
Cha
tree
Aka
rach
aran
ya, t
he r
esig
ned
exec
utiv
e.
/4 M
r. K
it W
ei N
g, D
avid
was
app
oint
ed a
s E
xecu
tive
Vic
e P
resi
dent
, Str
ateg
y, In
vest
men
t and
Ris
k M
anag
emen
t effe
ctiv
e on
1 J
anua
ry 2
016.
/5 M
r. S
igm
und
Str
omm
e w
as a
ppoi
nted
as
Exe
cutiv
e V
ice
Pre
side
nt, S
hipp
ing
& L
ogis
tics
on 1
3 M
ay 2
015.
/6 M
s. U
rai P
luem
som
ran
resi
gned
from
the
posi
tion
of E
xecu
tive
Vic
e P
resi
dent
, Cor
pora
te R
isk
Man
agem
ent a
nd C
ompl
ianc
e on
31
Dec
embe
r 20
15.
/7 T
TA
-W5
was
issu
ed a
nd a
llotte
d in
201
5.
securities HoldinG By tHe directors and executives
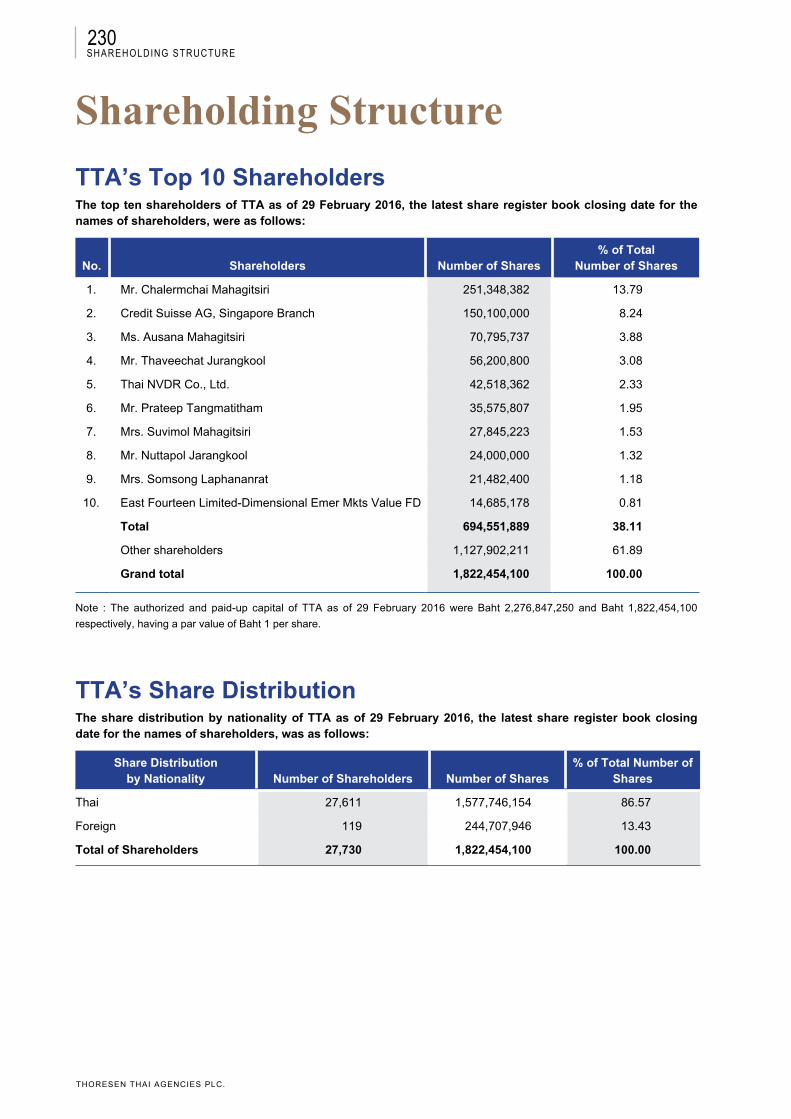
230
THORESEN THAI AGENCIES PLC.
shareholding structureTTA’s Top 10 ShareholdersThe top ten shareholders of TTA as of 29 February 2016, the latest share register book closing date for the names of shareholders, were as follows:
No. Shareholders Number of Shares% of Total
Number of Shares
1. Mr. Chalermchai Mahagitsiri 251,348,382 13.79
2. Credit Suisse AG, Singapore Branch 150,100,000 8.24
3. Ms. Ausana Mahagitsiri 70,795,737 3.88
4. Mr. Thaveechat Jurangkool 56,200,800 3.08
5. Thai NVDR Co., Ltd. 42,518,362 2.33
6. Mr. Prateep Tangmatitham 35,575,807 1.95
7. Mrs. Suvimol Mahagitsiri 27,845,223 1.53
8. Mr. Nuttapol Jarangkool 24,000,000 1.32
9. Mrs. Somsong Laphananrat 21,482,400 1.18
10. East Fourteen Limited-Dimensional Emer Mkts Value FD 14,685,178 0.81
Total 694,551,889 38.11
Other shareholders 1,127,902,211 61.89
Grand total 1,822,454,100 100.00
Note : The authorized and paid-up capital of TTA as of 29 February 2016 were Baht 2,276,847,250 and Baht 1,822,454,100
respectively, having a par value of Baht 1 per share.
TTA’s Share DistributionThe share distribution by nationality of TTA as of 29 February 2016, the latest share register book closing date for the names of shareholders, was as follows:
Share Distribution by Nationality Number of Shareholders Number of Shares
% of Total Number of Shares
Thai 27,611 1,577,746,154 86.57
Foreign 119 244,707,946 13.43
Total of Shareholders 27,730 1,822,454,100 100.00
sHareHoldinG structure
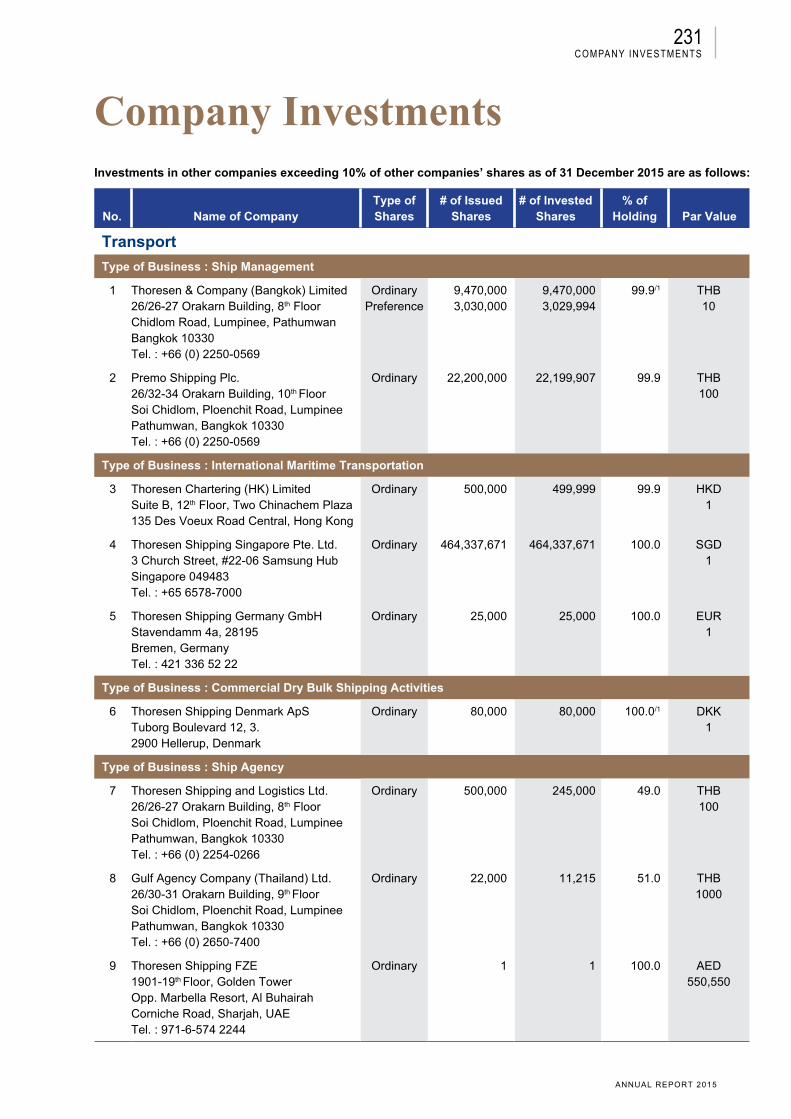
231
ANNUAL REPORT 2015
Company investments
No. Name of CompanyType ofShares
# of IssuedShares
# of InvestedShares
% of Holding Par Value
Transport
Type of Business : Ship Management
1 Thoresen & Company (Bangkok) Limited26/26-27 Orakarn Building, 8th FloorChidlom Road, Lumpinee, PathumwanBangkok 10330Tel. : +66 (0) 2250-0569
OrdinaryPreference
9,470,0003,030,000
9,470,0003,029,994
99.9/1 THB10
2 Premo Shipping Plc.26/32-34 Orakarn Building, 10th FloorSoi Chidlom, Ploenchit Road, LumpineePathumwan, Bangkok 10330Tel. : +66 (0) 2250-0569
Ordinary 22,200,000 22,199,907 99.9 THB100
Type of Business : International Maritime Transportation
3 Thoresen Chartering (HK) LimitedSuite B, 12th Floor, Two Chinachem Plaza135 Des Voeux Road Central, Hong Kong
Ordinary 500,000 499,999 99.9 HKD1
4 Thoresen Shipping Singapore Pte. Ltd.3 Church Street, #22-06 Samsung HubSingapore 049483Tel. : +65 6578-7000
Ordinary 464,337,671 464,337,671 100.0 SGD1
5 Thoresen Shipping Germany GmbHStavendamm 4a, 28195 Bremen, GermanyTel. : 421 336 52 22
Ordinary 25,000 25,000 100.0 EUR1
Type of Business : Commercial Dry Bulk Shipping Activities
6 Thoresen Shipping Denmark ApSTuborg Boulevard 12, 3.2900 Hellerup, Denmark
Ordinary 80,000 80,000 100.0/1 DKK 1
Type of Business : Ship Agency
7 Thoresen Shipping and Logistics Ltd.26/26-27 Orakarn Building, 8th FloorSoi Chidlom, Ploenchit Road, LumpineePathumwan, Bangkok 10330Tel. : +66 (0) 2254-0266
Ordinary 500,000 245,000 49.0 THB100
8 Gulf Agency Company (Thailand) Ltd.26/30-31 Orakarn Building, 9th FloorSoi Chidlom, Ploenchit Road, LumpineePathumwan, Bangkok 10330Tel. : +66 (0) 2650-7400
Ordinary 22,000 11,215 51.0 THB1000
9 Thoresen Shipping FZE1901-19th Floor, Golden TowerOpp. Marbella Resort, Al Buhairah Corniche Road, Sharjah, UAE Tel. : 971-6-574 2244
Ordinary 1 1 100.0 AED550,550
Investments in other companies exceeding 10% of other companies’ shares as of 31 December 2015 are as follows:
company investments
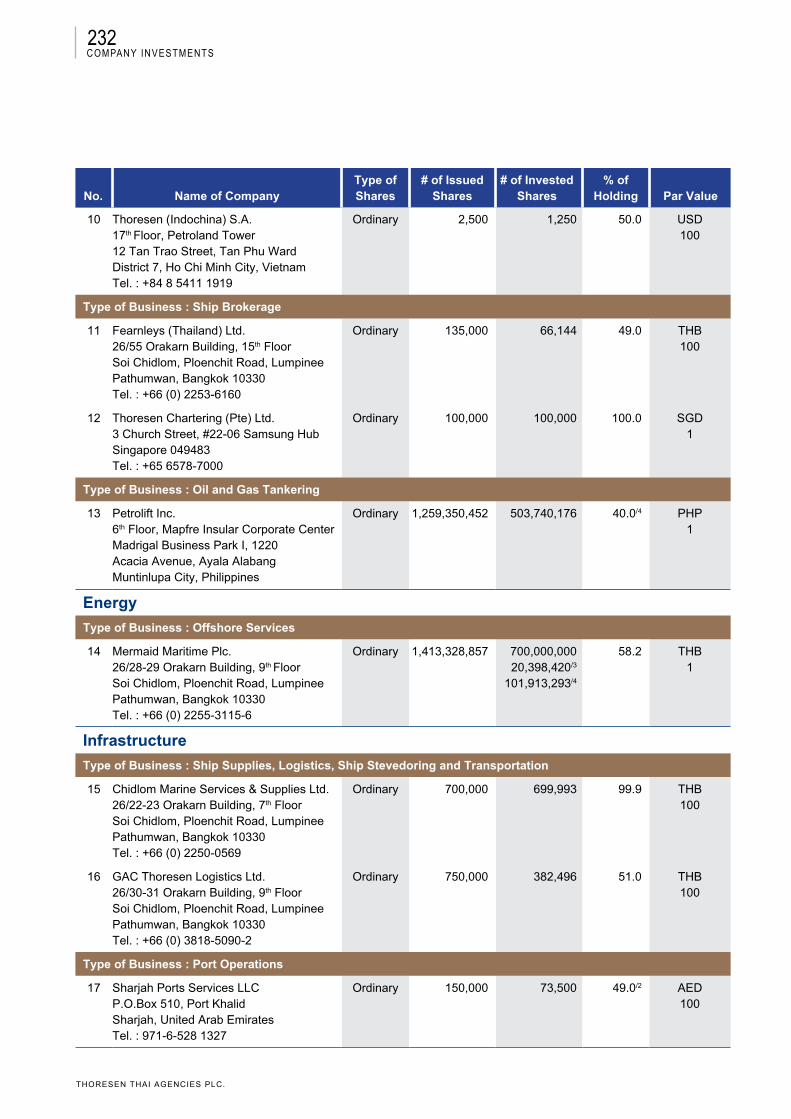
232
THORESEN THAI AGENCIES PLC.
No. Name of CompanyType ofShares
# of IssuedShares
# of InvestedShares
% of Holding Par Value
10 Thoresen (Indochina) S.A.17th Floor, Petroland Tower12 Tan Trao Street, Tan Phu WardDistrict 7, Ho Chi Minh City, VietnamTel. : +84 8 5411 1919
Ordinary 2,500 1,250 50.0 USD100
Type of Business : Ship Brokerage
11 Fearnleys (Thailand) Ltd.26/55 Orakarn Building, 15th FloorSoi Chidlom, Ploenchit Road, LumpineePathumwan, Bangkok 10330Tel. : +66 (0) 2253-6160
Ordinary 135,000 66,144 49.0 THB100
12 Thoresen Chartering (Pte) Ltd.3 Church Street, #22-06 Samsung HubSingapore 049483Tel. : +65 6578-7000
Ordinary 100,000 100,000 100.0 SGD1
Type of Business : Oil and Gas Tankering
13 Petrolift Inc.6th Floor, Mapfre Insular Corporate CenterMadrigal Business Park I, 1220Acacia Avenue, Ayala AlabangMuntinlupa City, Philippines
Ordinary 1,259,350,452 503,740,176 40.0/4 PHP1
Energy
Type of Business : Offshore Services
14 Mermaid Maritime Plc.26/28-29 Orakarn Building, 9th FloorSoi Chidlom, Ploenchit Road, LumpineePathumwan, Bangkok 10330Tel. : +66 (0) 2255-3115-6
Ordinary 1,413,328,857 700,000,00020,398,420/3
101,913,293/4
58.2 THB1
Infrastructure
Type of Business : Ship Supplies, Logistics, Ship Stevedoring and Transportation
15 Chidlom Marine Services & Supplies Ltd.26/22-23 Orakarn Building, 7th FloorSoi Chidlom, Ploenchit Road, LumpineePathumwan, Bangkok 10330Tel. : +66 (0) 2250-0569
Ordinary 700,000 699,993 99.9 THB100
16 GAC Thoresen Logistics Ltd.26/30-31 Orakarn Building, 9th FloorSoi Chidlom, Ploenchit Road, LumpineePathumwan, Bangkok 10330Tel. : +66 (0) 3818-5090-2
Ordinary 750,000 382,496 51.0 THB100
Type of Business : Port Operations
17 Sharjah Ports Services LLCP.O.Box 510, Port Khalid Sharjah, United Arab EmiratesTel. : 971-6-528 1327
Ordinary 150,000 73,500 49.0/2 AED100
company investments
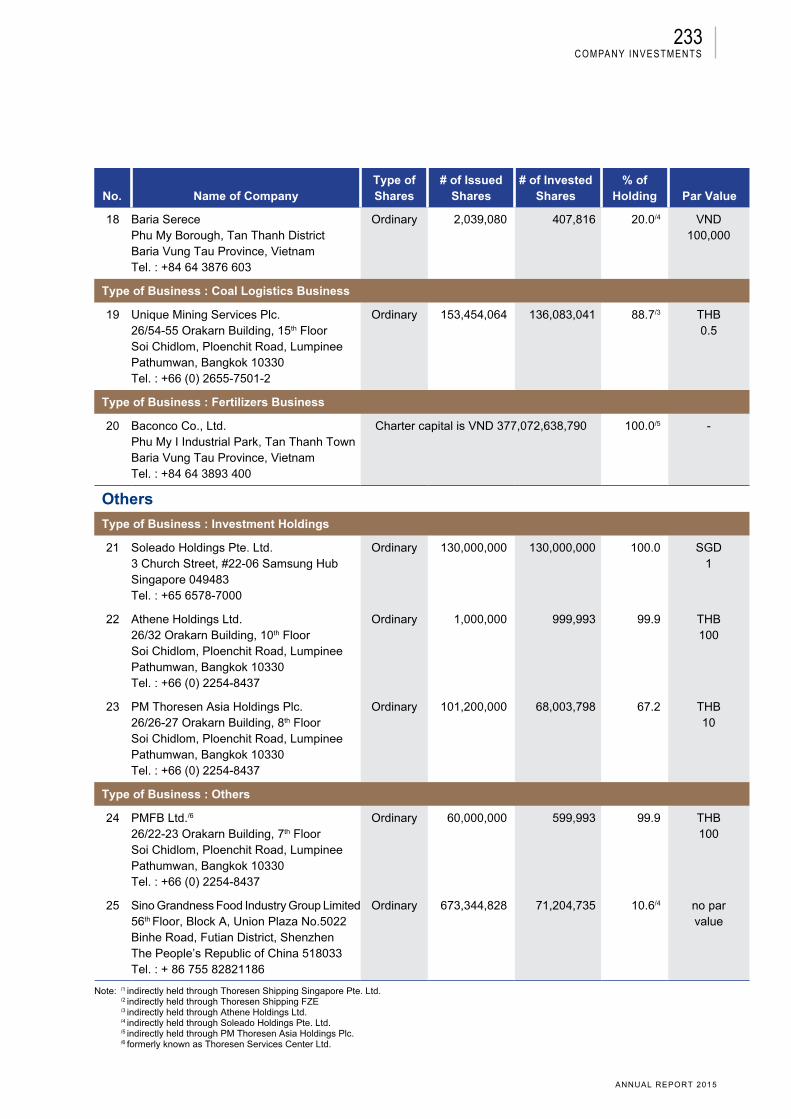
233
ANNUAL REPORT 2015
No. Name of CompanyType ofShares
# of IssuedShares
# of InvestedShares
% of Holding Par Value
18 Baria SerecePhu My Borough, Tan Thanh DistrictBaria Vung Tau Province, VietnamTel. : +84 64 3876 603
Ordinary 2,039,080 407,816 20.0/4 VND100,000
Type of Business : Coal Logistics Business
19 Unique Mining Services Plc.26/54-55 Orakarn Building, 15th FloorSoi Chidlom, Ploenchit Road, LumpineePathumwan, Bangkok 10330Tel. : +66 (0) 2655-7501-2
Ordinary 153,454,064 136,083,041 88.7/3 THB0.5
Type of Business : Fertilizers Business
20 Baconco Co., Ltd.Phu My I Industrial Park, Tan Thanh TownBaria Vung Tau Province, VietnamTel. : +84 64 3893 400
Charter capital is VND 377,072,638,790 100.0/5 -
Others
Type of Business : Investment Holdings
21 Soleado Holdings Pte. Ltd.3 Church Street, #22-06 Samsung HubSingapore 049483Tel. : +65 6578-7000
Ordinary 130,000,000 130,000,000 100.0 SGD1
22 Athene Holdings Ltd.26/32 Orakarn Building, 10th FloorSoi Chidlom, Ploenchit Road, LumpineePathumwan, Bangkok 10330Tel. : +66 (0) 2254-8437
Ordinary 1,000,000 999,993 99.9 THB100
23 PM Thoresen Asia Holdings Plc.26/26-27 Orakarn Building, 8th FloorSoi Chidlom, Ploenchit Road, LumpineePathumwan, Bangkok 10330Tel. : +66 (0) 2254-8437
Ordinary 101,200,000 68,003,798 67.2 THB10
Type of Business : Others
24 PMFB Ltd./6
26/22-23 Orakarn Building, 7th FloorSoi Chidlom, Ploenchit Road, LumpineePathumwan, Bangkok 10330Tel. : +66 (0) 2254-8437
Ordinary 60,000,000 599,993 99.9 THB100
25 Sino Grandness Food Industry Group Limited56th Floor, Block A, Union Plaza No.5022Binhe Road, Futian District, ShenzhenThe People’s Republic of China 518033Tel. : + 86 755 82821186
Ordinary 673,344,828 71,204,735 10.6/4 no parvalue
Note: /1 indirectly held through Thoresen Shipping Singapore Pte. Ltd. /2 indirectly held through Thoresen Shipping FZE /3 indirectly held through Athene Holdings Ltd. /4 indirectly held through Soleado Holdings Pte. Ltd. /5 indirectly held through PM Thoresen Asia Holdings Plc. /6 formerly known as Thoresen Services Center Ltd.
company investments
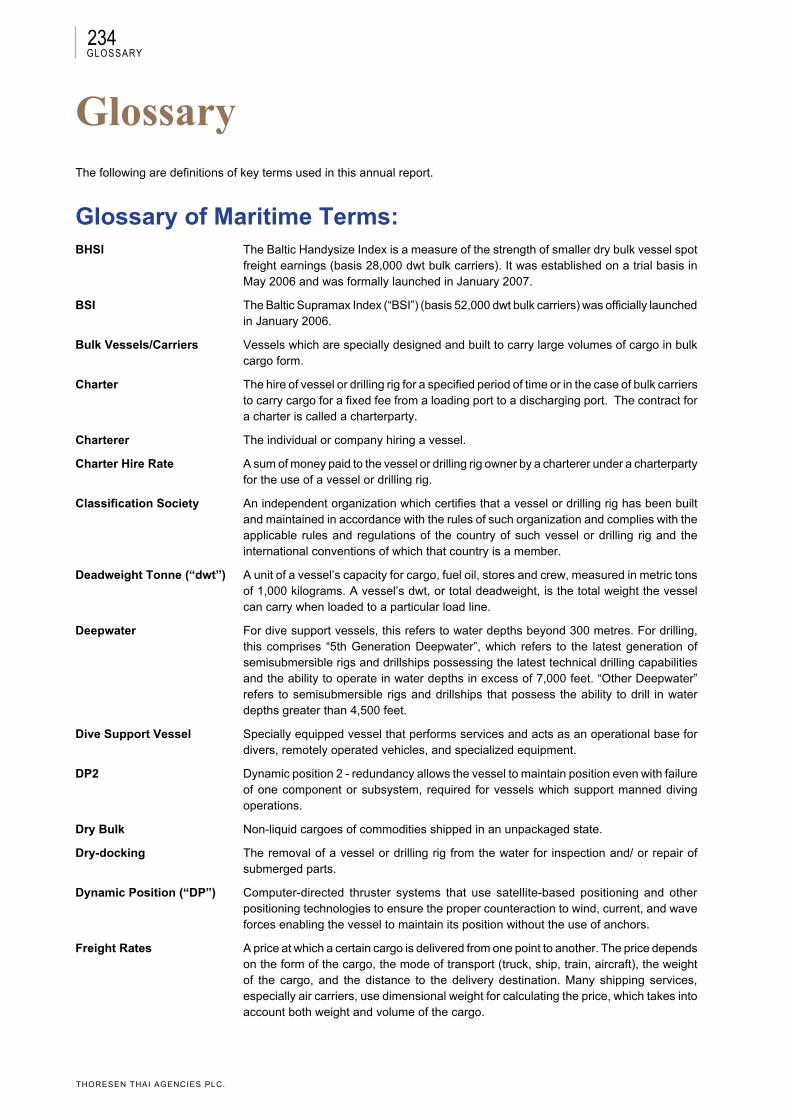
234
THORESEN THAI AGENCIES PLC.
glossary The following are definitions of key terms used in this annual report.
Glossary of Maritime Terms:BHSI The Baltic Handysize Index is a measure of the strength of smaller dry bulk vessel spot
freight earnings (basis 28,000 dwt bulk carriers). It was established on a trial basis in May 2006 and was formally launched in January 2007.
BSI The Baltic Supramax Index (“BSI”) (basis 52,000 dwt bulk carriers) was officially launched in January 2006.
Bulk Vessels/Carriers Vessels which are specially designed and built to carry large volumes of cargo in bulk cargo form.
Charter The hire of vessel or drilling rig for a specified period of time or in the case of bulk carriers to carry cargo for a fixed fee from a loading port to a discharging port. The contract for a charter is called a charterparty.
Charterer The individual or company hiring a vessel.
Charter Hire Rate A sum of money paid to the vessel or drilling rig owner by a charterer under a charterparty for the use of a vessel or drilling rig.
Classification Society An independent organization which certifies that a vessel or drilling rig has been built and maintained in accordance with the rules of such organization and complies with the applicable rules and regulations of the country of such vessel or drilling rig and the international conventions of which that country is a member.
Deadweight Tonne (“dwt”) A unit of a vessel’s capacity for cargo, fuel oil, stores and crew, measured in metric tons of 1,000 kilograms. A vessel’s dwt, or total deadweight, is the total weight the vessel can carry when loaded to a particular load line.
Deepwater For dive support vessels, this refers to water depths beyond 300 metres. For drilling, this comprises “5th Generation Deepwater”, which refers to the latest generation of semisubmersible rigs and drillships possessing the latest technical drilling capabilities and the ability to operate in water depths in excess of 7,000 feet. “Other Deepwater” refers to semisubmersible rigs and drillships that possess the ability to drill in water depths greater than 4,500 feet.
Dive Support Vessel Specially equipped vessel that performs services and acts as an operational base for divers, remotely operated vehicles, and specialized equipment.
DP2 Dynamic position 2 - redundancy allows the vessel to maintain position even with failure of one component or subsystem, required for vessels which support manned diving operations.
Dry Bulk Non-liquid cargoes of commodities shipped in an unpackaged state.
Dry-docking The removal of a vessel or drilling rig from the water for inspection and/ or repair of submerged parts.
Dynamic Position (“DP”) Computer-directed thruster systems that use satellite-based positioning and other positioning technologies to ensure the proper counteraction to wind, current, and wave forces enabling the vessel to maintain its position without the use of anchors.
Freight Rates A price at which a certain cargo is delivered from one point to another. The price depends on the form of the cargo, the mode of transport (truck, ship, train, aircraft), the weight of the cargo, and the distance to the delivery destination. Many shipping services, especially air carriers, use dimensional weight for calculating the price, which takes into account both weight and volume of the cargo.
Glossary

235
ANNUAL REPORT 2015
Handymax A dry bulk carrier of approximately 35,000 to 60,000 dwt.
Handysize A dry bulk carrier having a carrying capacity of up to approximately 35,000 dwt.
Hull The shell or body of a vessel.
International Maritime Organization (“IMO”)
A United Nations agency that issues international trade standards for shipping.
Metric Tonne A unit of measurement equal to 1,000 kilograms.
Newbuilding A newly constructed vessel.
Orderbook A reference to currently placed orders for the construction of vessels or drilling rigs (e.g., the Handymax orderbook).
Panamax A dry bulk carrier of approximately 60,000 to 80,000 dwt of maximum length, depth and draft capable of passing fully loaded through the Panama Canal.
Remotely Operated
Vehicles (“ROV”)
Robotic vehicles used to complement, support, and increase the efficiency of diving and sub-sea operations and for tasks beyond the capability of manned diving operations.
Scrapping The disposal of old or damaged vessel tonnage by way of sale as scrap metal.
Short-Term Time Charter A time charter which lasts less than approximately twelve months.
Supramax A bulk carrier with a capacity less than 60,000 dwt. Supramax vessels are relatively bigger in size with 50,000 to 60,000 dwt. It is well suited for small ports with length and draught restrictions, or ports lacking transshipment infrastructure
Tender Rig A tender rig is a purpose-built self-erecting drilling tender barge with a flat bottom, raked sterns, and raked bow hull shape. It is designed as a cost-efficient and flexible drilling system for development scenarios involving multiple well slot fixed offshore platforms whereby the rig moves from platform to platform using its own drilling equipment set which is lifted by its own crane. Lifting operations can be made onto platforms up to a height of 90 feet above sea level.
Time Charter Contract for hire of a vessel. A charter under which the vessel owner is paid charter hire rate on a per day basis for a certain period of time, the vessel owner being responsible for providing the crew and paying operating costs while the charterer is responsible for paying the voyage costs. Any delays at port or during the voyages are the responsibility of the charterer, save for certain specific exceptions such as loss of time arising from vessel breakdown and routine maintenance.
Voyage Charter Contract for hire of a vessel under which a vessel owner is paid freight on the basis of moving cargo from a loading port to a discharge port. The vessel owner is responsible for paying both operating costs and voyage costs. The charterer is typically responsible for any delay at the loading or discharging ports.
Glossary
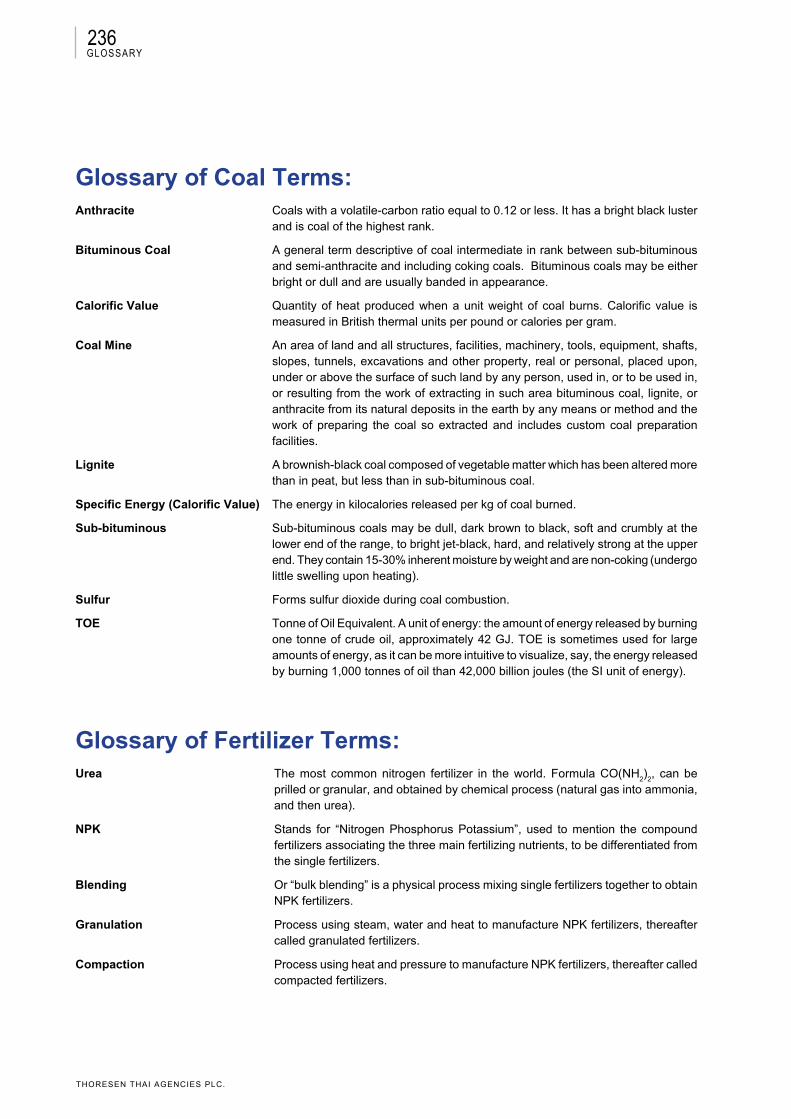
236
THORESEN THAI AGENCIES PLC.
Glossary of Coal Terms:Anthracite Coals with a volatile-carbon ratio equal to 0.12 or less. It has a bright black luster
and is coal of the highest rank.
Bituminous Coal A general term descriptive of coal intermediate in rank between sub-bituminous and semi-anthracite and including coking coals. Bituminous coals may be either bright or dull and are usually banded in appearance.
Calorific Value Quantity of heat produced when a unit weight of coal burns. Calorific value is measured in British thermal units per pound or calories per gram.
Coal Mine An area of land and all structures, facilities, machinery, tools, equipment, shafts, slopes, tunnels, excavations and other property, real or personal, placed upon, under or above the surface of such land by any person, used in, or to be used in, or resulting from the work of extracting in such area bituminous coal, lignite, or anthracite from its natural deposits in the earth by any means or method and the work of preparing the coal so extracted and includes custom coal preparation facilities.
Lignite A brownish-black coal composed of vegetable matter which has been altered more than in peat, but less than in sub-bituminous coal.
Specific Energy (Calorific Value) The energy in kilocalories released per kg of coal burned.
Sub-bituminous Sub-bituminous coals may be dull, dark brown to black, soft and crumbly at the lower end of the range, to bright jet-black, hard, and relatively strong at the upper end. They contain 15-30% inherent moisture by weight and are non-coking (undergo little swelling upon heating).
Sulfur Forms sulfur dioxide during coal combustion.
TOE Tonne of Oil Equivalent. A unit of energy: the amount of energy released by burning one tonne of crude oil, approximately 42 GJ. TOE is sometimes used for large amounts of energy, as it can be more intuitive to visualize, say, the energy released by burning 1,000 tonnes of oil than 42,000 billion joules (the SI unit of energy).
Glossary of Fertilizer Terms:Urea The most common nitrogen fertilizer in the world. Formula CO(NH
2)
2, can be
prilled or granular, and obtained by chemical process (natural gas into ammonia, and then urea).
NPK Stands for “Nitrogen Phosphorus Potassium”, used to mention the compound fertilizers associating the three main fertilizing nutrients, to be differentiated from the single fertilizers.
Blending Or “bulk blending” is a physical process mixing single fertilizers together to obtain NPK fertilizers.
Granulation Process using steam, water and heat to manufacture NPK fertilizers, thereafter called granulated fertilizers.
Compaction Process using heat and pressure to manufacture NPK fertilizers, thereafter called compacted fertilizers.
Glossary

237
ANNUAL REPORT 2015
Corporate informationAs of 31 December 2015
Name of Company : Thoresen Thai Agencies Public Company Limited
Initial : TTA
Registration No. : 0107537002737
Date of Establishment : 16 August 1983
Date of Conversion to Public Company Limited : 15 December 1994
Date of Listing Ordinary Shares in SET : 25 September 1995
Type of Business : Investment Holdings with 4 lines of business:Transport, Energy, Infrastructure, and others
Office Address : 26/26-27 Orakarn Building, 8th FloorSoi Chidlom, Ploenchit RoadBangkok 10330, ThailandTelephone: +66 (0) 2254-8437Facsimile: +66 (0) 2655-5631Email: [email protected]: http://www.thoresen.com
Investor Relations Department : Telephone: + 66 (0) 2254-8437 ext 292Facsimile: +66 (0) 2655-5631Email: [email protected]
Company Secretary Office and Corporate Affairs Department
: Telephone: + 66 (0) 2254-8437 ext 144Facsimile: +66 (0) 2655-5631Email: [email protected]
Internal Audit Department : Telephone: + 66 (0) 2254-8437 ext 515Facsimile: + 66 (0) 2655-5635
Ordinary Shares
Registered Capital : Baht 2,276,847,250
Paid up Capital : Baht 1,822,454,100
No. of Issued Shares : 1,822,454,100 ordinary shares
Par Value : Baht 1 per share
Warrants (TTA-W4)
Number of Warrants Issued : 99,369,017 units
Number of Warrants Unexercised : 98,167,544 units
Exercise Price : Baht 17.4669 per 1 ordinary share
Exercise Ratio : 1 unit of Warrant to 1.0591 ordinary shares(after the adjustment in February 2015)
Warrant Issue Date : 14 March 2014
Term of Warrants : 36 months or 3.0 years from the warrant issue date
Last Exercise Date : 28 February 2017
corporate information
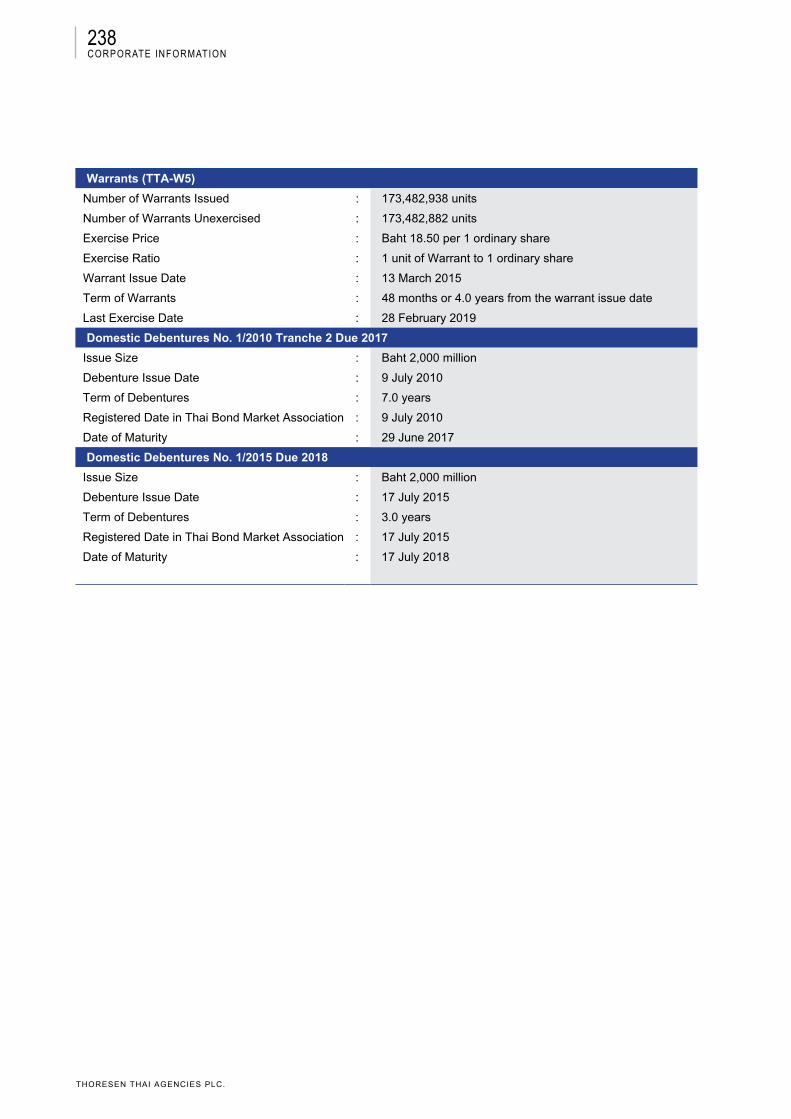
238
THORESEN THAI AGENCIES PLC.
Warrants (TTA-W5)
Number of Warrants Issued : 173,482,938 units
Number of Warrants Unexercised : 173,482,882 units
Exercise Price : Baht 18.50 per 1 ordinary share
Exercise Ratio : 1 unit of Warrant to 1 ordinary share
Warrant Issue Date : 13 March 2015
Term of Warrants : 48 months or 4.0 years from the warrant issue date
Last Exercise Date : 28 February 2019
Domestic Debentures No. 1/2010 Tranche 2 Due 2017
Issue Size : Baht 2,000 million
Debenture Issue Date : 9 July 2010
Term of Debentures : 7.0 years
Registered Date in Thai Bond Market Association : 9 July 2010
Date of Maturity : 29 June 2017
Domestic Debentures No. 1/2015 Due 2018
Issue Size : Baht 2,000 million
Debenture Issue Date : 17 July 2015
Term of Debentures : 3.0 years
Registered Date in Thai Bond Market Association : 17 July 2015
Date of Maturity : 17 July 2018
corporate information
239
ANNUAL REPORT 2015
Reference Persons
Regulator : Securities and Exchange Commission, Thailand (“SEC”)333/3 Viphavadi Rangsit Road, Chomphon, ChatuchakBangkok 10900, ThailandTelephone: +66 (0) 2695-9999Facsimile: +66 (0) 2695-9660Email: [email protected]: http://www.sec.or.th
Regulator : The Stock Exchange of Thailand (“SET”)93 Ratchadaphisek Road, DindaengBangkok 10400, ThailandTelephone: +66 (0) 2009-9000Facsimile: +66 (0) 2009-9991SET Contact Center: +66 (0) 2009-9999Email: [email protected]: http://www.set.or.th
Securities Registrar of Ordinary Shares and
Warrants
: Thailand Securities Depository Co., Ltd. (“TSD”)93, 14th Floor, Ratchadaphisek Road, DindaengBangkok 10400, Thailand Telephone: +66 (0) 2009-9000Facsimile: +66 (0) 2009-9991SET Contact center: +66 (0) 2009-9999Email: [email protected]: http://www.set.or.th/tsd
Debenture Registrar : Siam Commercial Bank Plc.9 Ratchadaphisek Road, Jatujak Jatujak, Bangkok, 10900 ThailandTelephone: +66 (0) 2544-1000Facsimile: +66 (0) 2544-2658
Auditor : Mr. Veerachai RatanajaratkulCertified Public Accountant Registration No. 4323KPMG Phoomchai Audit Ltd.48th - 51st Floors, Empire Tower195 South Sathorn RoadYannawa, Sathorn, Bangkok 10120, ThailandTelephone: +66 (0) 2677-2000Facsimile: +66 (0) 2677-2222
Legal Advisor : Baker & McKenzie Ltd.5th Floor, 22nd - 25th Floor, Abdulrahim Place990 Rama IV Road, Silom, Bangrak Bangkok 10500, ThailandTelephone: +66 (0) 2636-2000Facsimile: +66 (0) 2636-2111
Remark: Investors can study additional details of the issuer from the Company’s Annual Information Disclosure Form (Form 56-1) on the SEC’s website
at http://www.sec.or.th. or on the Company’s website at http://www.thoresen.com.
corporate information
240
THORESEN THAI AGENCIES PLC.