“Tsunami – Surfs Up!” - The Learning Cafe · Task 1: Set up Google Earth A. Create a folder...
7
Name: ____________________ Teacher: __________________ GEOGRAPHY Level One Achievement Standard 91014 Version 1 Apply spatial analysis, with direction, to solve a geographic problem Credits: 3 “Tsunami – Surfs Up!”
Transcript of “Tsunami – Surfs Up!” - The Learning Cafe · Task 1: Set up Google Earth A. Create a folder...
Name: ____________________
Teacher: __________________
GEOGRAPHY
Level One
Achievement Standard 91014 Version 1
Apply spatial analysis, with direction, to solve a geographic
problem
Credits: 3
“Tsunami – Surfs Up!”

Internal Assessment Resource Achievement Standard Geography 91014: Apply spatial analysis, with direction, to solve a geographic problem Resource reference: Geography 1.8 Resource title: Tsunami – Surfs Up! Credits: 3
Achievement Achievement with Merit Achievement with Excellence
Apply spatial analysis, with direction, to solve a geographic problem.
Effectively apply spatial analysis, with direction, to solve a geographic problem.
Comprehensively apply spatial analysis, with direction, to solve a geographic problem.
Student instructions
Introduction This assessment activity requires you to comprehensively apply spatial analysis, with direction, to solve a geographic problem.
Mount Maunganui is located on the east coast of the North Island. We know that a tsunami will occur in the future – but no one knows when.
This assessment is based on a theoretical tsunami being caused by a 9.0 earthquake near the Kermedec Trench. The Ministry of Civil Defence and Emergency Management (CDEM) is an organisation that works to make New Zealand communities resilient to hazards and disasters. It needs to know where and what the effects of a tsunami might be. It also needs a report that shows people the type and the extent of the effects of a tsunami in the Mount Maunganui area.
Imagine that you have the job of producing this report for CDEM. Your task is to:
• produce maps/images that show where the effects of the tsunami will be
• write a report about the effects of the tsunami on people, the economy, and the transport networks in Mount Maunganui.
You will work individually to produce several images/maps that will make up a layout on one side of an A3 piece of paper or in the form of an A4 booklet. You will hand in your layout and your written report.
This activity takes place over two weeks of class time.
Your final work is due on:
Task 1: Set up Google Earth A. Create a folder In your workspace, create a folder where you can save your data.
B. Set up Google Earth
• Open Google Earth.
• Create a new folder titled “Mount Maunganui Tsunami” by right clicking on My Places à Add àFolder.
C. Save your work Make sure that all of the features you create have been dragged into the folder in your workspace. To save your work in the Mount Maunganui Folder, right click the folder and choose “Save place as.” (You should do this at the end of every session).
D. Prepare a document for layout
• Open the application where you will create your layout (for example, Microsoft Word).
• Prepare a A3 document or an A4 booklet which you will paste your maps/images. Save this document in your workspace folder.
Task 2: Create, collect, and manipulate spatial data A. Locate the Bay of Plenty Region
• Open Google Earth. Zoom in so that all of New Zealand is shown.
• Under “Layers”, clear the Primary data base (untick the box)
• Turn on “Boarders and Labels”
• Place mark Mount Maunganui
• Take a screen capture to show the location of Mount Maunganui in relation to the rest of New Zealand. Add this to your layout.
B. The process of the tsunami
• Fly to Mount Maunganui and make sure that “Borders and Labels” is turned on
• The epicentre of the 9.0 magnitude earthquake that triggers the tsunami is located west of Cheeseman Island in the Pacific Ocean. In the “Search” box, enter this as 30 30 42.20S, 178 28 56.73E. Fly to this location. Create a place mark to show the location of the epicentre and the magnitude. (You should be west of Cheeseman Island.)
• Use the “Ruler” to draw a line from the epicentre to Mount Maunganui – note the distance in km.
• Label the line with a “Placemark” that the tsunami travels at 450km/hr in deep water

• Create other “Placemarks” closer to the coast noting that the tsunami slows to 10km/hr as it nears the coast (within 2km) and that the range in height of the tsunami is between 4 and 6.75m.
• Calculate the time that the tsunami will take to arrive at Mount Maunganui – and use this in your report in terms of time that the residents of Mount Maunganui have to respond/evacuate the area.
• Take a screen capture of your map/image and add this to your layout.
C. The possible effects on the land
• Go to “Tools” and “Options” and then make sure that “Units of Measurement” is set to “Metres, Kilometres”
• Zoom into the Mount Maunganui area to an “Eye Alt” of 11km (NB, make sure that you can see some of Matakana Island and all of Mauao (Mount Maunganui) in the NW corner of your image) This scale image / map is to be used for the tasks that follow.
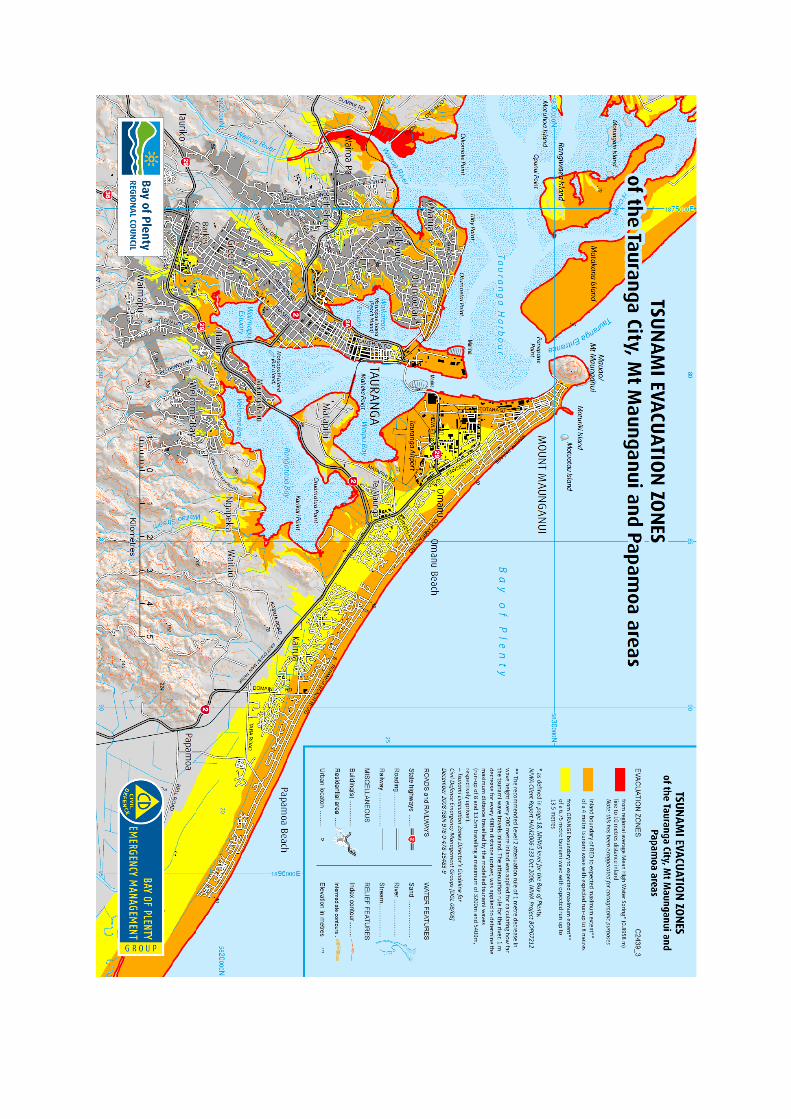
• Using the Tsunami Evacuation Zones Map / Resource for Tauranga City, Mt Maunganui and Papamoa (Colour Resource Sheet provided) - show the tsunami evacuation zones (maximum extent) for a 4 metre and a 6.75 metre wave using the “Polygon” tool. Show the following evacuation zones for;
o Matakana Island
o The Port of Tauranga
o The whole area of Mount Maunganui (The land area east of the Harbour)
• In the Mount Maunganui area there are two high areas that will not be inundated by the 6.75 metre tsunami, Mauao and Hopukiore (Mt Maunganui and Mt Drury). For these two areas create two opaque column polygons. Under “Altitude”, select “Relative to the ground” and enter 232m as the height for Mauao and 21m as the height for Hopukiore. Extend the sides to the ground.
• Note the impact of the tsunami on the landscape and the shape of the land area that makes up Mount Maunganui. Note the difficulties it might cause in evacuation and the areas of safety in either a 4m or 6.75m tsunami. Include this in your report.
• Take a screen capture of your map/image and add this to your layout.
D. The possible effects on land use and people
• Use the “Polygon” tool to locate and label the following;
o Two recreational areas
o Mount Maunganui Central Business District (CBD)
o Industrial Area – boarded by The Airport, Maunganui Road, Hull Road and Totara Street
o Residential Area – From Mount Maunganui to Girven Road
• On your image use the “Placemark” tool to locate and label an area of exotic forest and an area of horticulture.
• From “Layers”, turn on:
Ø Expand the “More” layer (click the triangle) Ø Turn on “Parks/Recreation areas” Ø Expand the “Place Categories” layer– “Banks/ATMs”, “Fire”,
“Hospitals”, “Schools” Ø Note the impact the tsunami would have on ‘other’ cultural
activities (and add this to your final report) • Take a screen capture of your map/image and add this to your layout.
E. The possible impact on the transport network
• Use a combination of the “Path” and “Polygon” tools to locate and label the major transport networks in the Mount Maunganui area (MoreàTransportation)
o The Port – east and west of the harbour
o Airport
o State Highway 2 and 29
o Railway
• Take a screen capture of your map/image and add this to your layout.
Key Facts Mount Maunganui and Papamoa would be devastated if an "extreme" tsunami hit the Western Bay, forcing 35,000 people to flee for their lives.
It would smash through Tauranga's entire low-lying coastal strip, inundating about 19,000 homes and 2000 commercial premises.
It would have a major impact on the local transport network. The Port of Tauranga is the largest port in the country in terms of total cargo volume, and the second largest in terms of container throughput. Tauranga airport is the fifth busiest airport in New Zealand in terms of aircraft movements, with 86,935 movements during 2010. This places it just behind Hamilton airport. State Highway 2 and Trans Rail are an integral links for Tauranga and the Bay of Plenty to the rest of the country.
The prospect has left Civil Defence planners praying they get enough warning to carry out an orderly mass evacuation. Calculations were based on a historical "worst case" 4m tsunami and an "extreme case" 6.75m surge.
Task 3: Produce a layout showing the effects of the tsunami
This task requires you to produce one A3-sized layout that shows how and where the tsunami could affect Mount Maunganui. Your layout will contain the maps / images that you have created in Task 2. Your layout should clearly and accurately show:
• The location of Mount Maunganui in New Zealand
• The process of the tsunami
• The possible effects on the land
• The possible effects on land use and people
• The possible impact on the transport network
• You may also want to overlay some of images/maps you produced to get an overall picture of the impact that the tsunami could have (on the natural and cultural environment) and add this to your layout.
You can add annotations to show where people, transport, and the economy are affected. Remember to use proper mapping conventions in your layout.
Task 4: Analyse your data to provide a solution to the geographic problem This task requires you to provide a report for CDEM. Your report must clearly outline the effects of this tsunami and location of these effects on people, the economy, and transport networks. Ensure that your report is valid, detailed, and based on information that is shown on your layout.
• State clearly which areas of Mount Maunganui are affected by the tsunami and how they are affected. Refer to your layout.
• Include specific details in your answer, such as suburbs, streets, and statistics. Use your work from Task 2 to help you do this.
Hand in your work by the due date. Ensure that you hand in:
• a cover sheet with your name and assessment details on it
• your layout
• your written report.