TS01J mills fox et al 7002 ppt - FIG · Determining the spatio-temporal distribution of 20th...
13
Determining the spatio-temporal distribution of 20th Century Antarctic Peninsula glacier mass change Jon Mills, Pauline Miller, Matthias Kunz School of Civil Engineering & Geosciences / Centre for Earth Systems Engineering Newcastle University, United Kingdom Matt King University of Tasmania, Australia Adrian Fox, Lucy Clarke British Antarctic Survey, United Kingdom Contents • Background to study • Hypotheses • Aims and objectives • Data and study area • Methodology • Results to date • Provisional conclusions • References and contact details
Transcript of TS01J mills fox et al 7002 ppt - FIG · Determining the spatio-temporal distribution of 20th...

Determining the spatio-temporal distribution of 20t h Century Antarctic Peninsula glacier mass change
Jon Mills , Pauline Miller, Matthias KunzSchool of Civil Engineering & Geosciences / Centre for Earth Systems Engineering
Newcastle University, United Kingdom
Matt KingUniversity of Tasmania, Australia
Adrian Fox, Lucy ClarkeBritish Antarctic Survey, United Kingdom
Contents
• Background to study
• Hypotheses
• Aims and objectives
• Data and study area
• Methodology
• Results to date
• Provisional conclusions
• References and contact details

Background: Antarctica
Background: Western Antarctic Peninsula
• Temperature increase
• Glacier retreat and acceleration
• Surface lowering?
Cook et al. (2005), Science
Pritchard & Vaughan (2007), JGR

Scientific hypotheses
• The northern, coastal AP has experienced a loss of grounded ice at lower altitudes and an increase in grounded ice at higher altitudes.
• The onset of this ice loss began in recent decades, first in the north and west of the region, then spreading and accelerating at the end of the 20th Century and in the early years of this century.
• The loss at lower altitudes can be primarily ascribed to increased summer ablation and run-off, due to increased summer melt, but accelerating glacier flow is also a factor. This summer ablation, which began after a cool period in the 1950s to 1960s, is partly mitigated by increased snowfall at higher altitudes.
• The ice-loss is sufficient to be comparable to other near-polar mountain systems and is a significant current contributor to global sea level rise.
Aims and objectives
• Aim• To unlock a multi-decadal surface elevation change record
from an existing archive of more than 30,000 aerial photographs of the AP, held at BAS and USGS.
• Objectives• Identify spatial patterns in the regional distribution of glacier
change over time for 50 benchmark glaciers• Identify temporal patterns within the wide-area spatial pattern,
by more detailed analysis of a sub-sample of nine of the 50 glaciers;
• Relate the trends and patterns identified to climate, marine temperature, and sea ice records to establish relationships with various forcings.

Methodology
Problem of orientation between archival (USGS/BAS) & modern (ASTER/photography/lidar) data due to lack of
ground control or lost calibration data
Biased measurements of change
1940s-1980s
• USGS / BAS aerial photography
2000s
• ASTER imagery• BAS aerial photography• Lidar / LVIS / EarthWatch, etc…
Data and study area
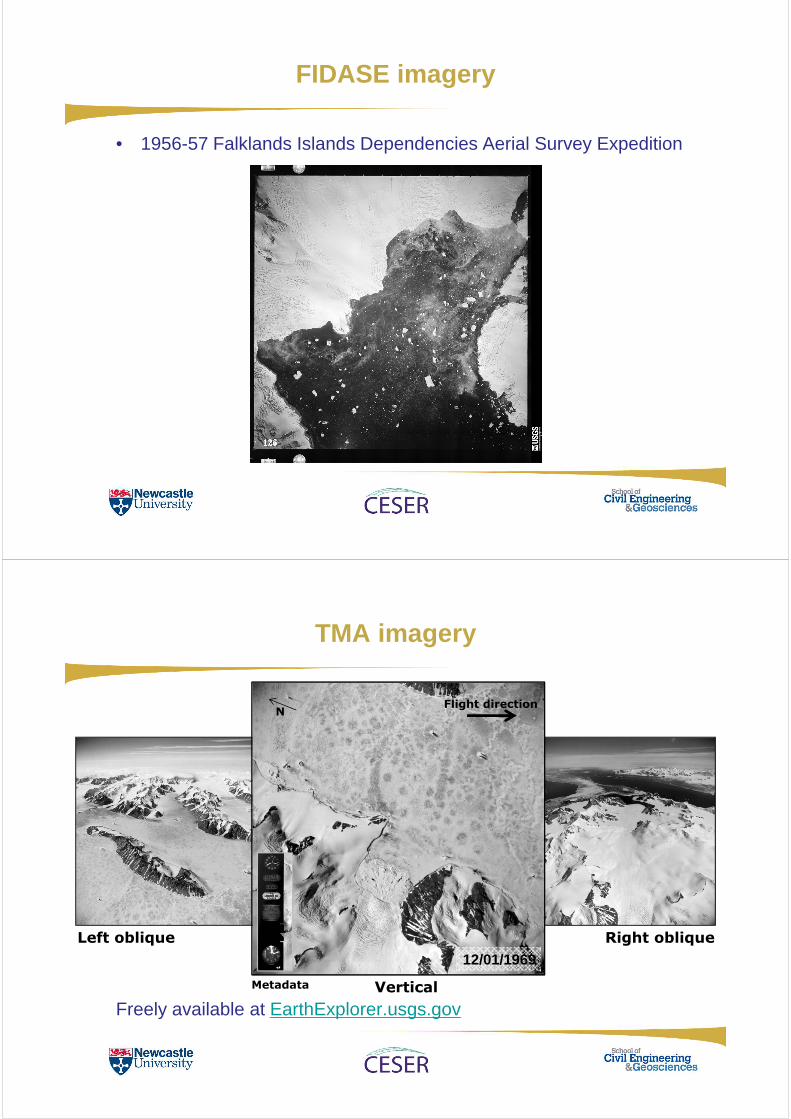
FIDASE imagery
• 1956-57 Falklands Islands Dependencies Aerial Survey Expedition
TMA imagery
Freely available at EarthExplorer.usgs.gov
Right obliqueLeft oblique
Vertical
Flight directionN
Metadata
12/01/1969

Sheldon and adjacent glaciers
Breguet Glacier
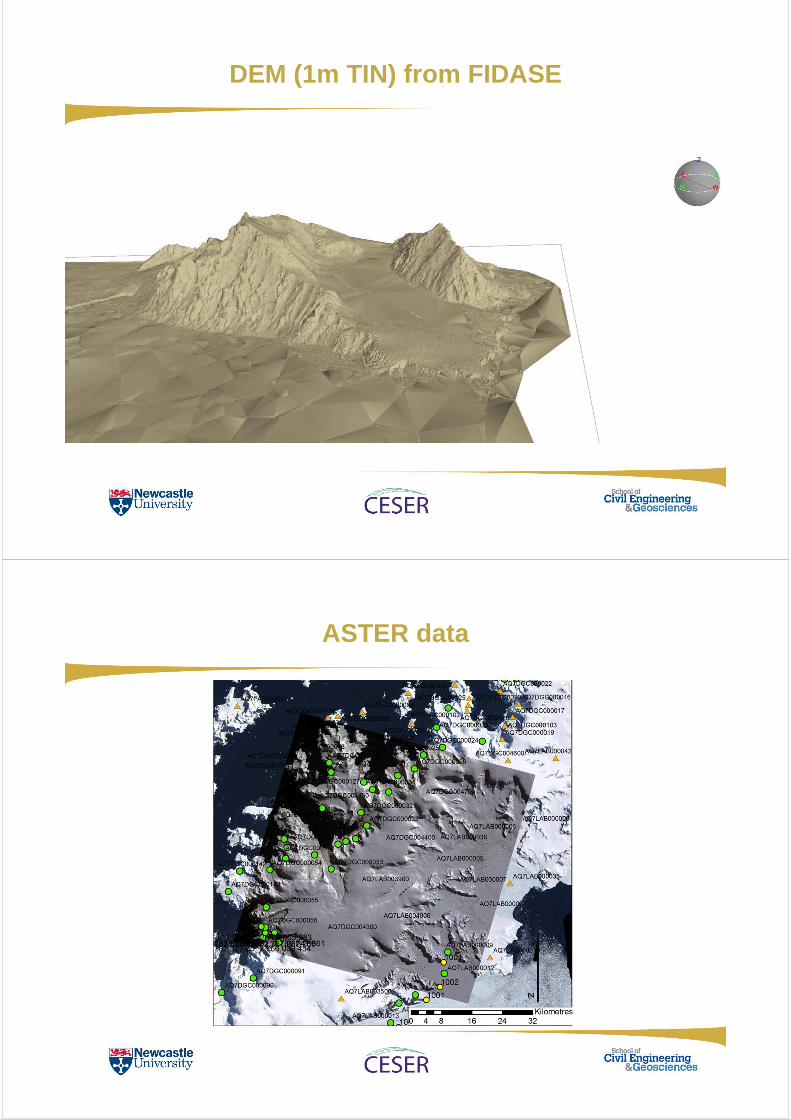
DEM (1m TIN) from FIDASE
ASTER data

LVIS data
Interior orientation• Fiducial marks re-measured using Photoshop• Generalised lens distortion curve applied
(if unknown)
Exterior orientation• > 25 tie points• Ground control extracted from ASTER DEM to
initialise USGS DEM absolute orientation• RMS 10-50 m
Workflow
USGS 1968 DEM extraction
ASTER 2005
Robust surface matching
DEM differencing and change measurement
• 7 Parameter transformation• Down-weighting of outliers• Minimisation of Euclidean distance

Accuracy improvement
Archival to modern aerial photography DEM Archival photography to modern ASTER DEM
dh Pre-Match
Post-Match
Mean (m) -16.17 -0.99
σ (m) 13.13 10.99
RMSE (m) 22.72 14.91
Min. (m) -89.41 -54.05
Max (m) 90.66 59.08
dh Pre-Match
Post-Match
Mean (m) 17.93 0.58
σ (m) 47.94 24.87
RMSE (m) 51.18 28.63
Min. (m) -220.71 -166.0
Max (m) 178.18 147.26
Nemo Glacier Leonardo Glacier
Results to date
• 12 sites with coverage of the glacier front (located between 64° S and 71° S)
• No glacier wide coverage due to widely spaced flight line pattern of historic imagery
• 38 USGS Antarctic Single Frames (min. three per site, no ground control data)
• DEMs from aerial imagery generated in BAE SOCET GXP with NGATE Module
• ASTER DEMs generated from Level 1B data in ITT ENVI with DEM Extraction Module

Leonardo Glacier
Glacier surface lowering
• Significant frontal lowering (up to 50 m)• Surface thickening at advanced glacier parts• Negative surface mass balance at glacier front• No glacier wide mass balance

Sheldon Glacier (1989 - 2005)
Increased elevation
Decreased elevation
Mean rate ofsurface elevation change:Lower part -0.57 m/yrUpper part +0.20 m/yr
Rothera ice ramp
Smith et al. (1998)-0.32 m/yr
This study-0.31 m/yr
Pattern of change
• Surface lowering below ~400 m elevation• No glacier wide mass balance
dh/dt vs elevation along central lines (combined)
• Increased lowering since 1990• Atmospheric temperature increases

Provisional conclusions
• Successful measurement of glacier surface elevation changes from historical USGS/BAS data and modern ASTER imagery
• Application of surface matching enables precise measurements
• Multi-decadal frontal surface lowering observed (up to ~50 m), with a mean lowering rate at glacier front of 0.28 ± 0.03 m/yr over an average period of 37 years (1969-2007)
• Nine glaciers demonstrated frontal retreat, two advanced
• Two glaciers show increased accumulation at higher elevation, but mean response (over areas sampled) is lowering
• Increased lowering since 1990 and higher lowering rates in the northern AP in agreement with increased atmospheric temperatures
References
Kunz, M., Mills, J. P., Miller, P. E., King, M. A., Fox, A. J. and Marsh, S., 2012. Application of surface matching for improved measurements of historic glacier volume change in the Antarctic Peninsula. International Archives of Photogrammetry, Remote Sensing and Spatial Information Sciences, 39(B8): 579–584.
Kunz, M., King, M. A., Mills, J. P., Miller, P. E., Fox, A. J., Vaughan, D. G. and Marsh, S. H., 2012. Multi-decadal glacier surface lowering in the Antarctic Peninsula. Geophys. Res. Lett., 39, L19502, doi:10.1029/2012GL052823.

Contact details
Jon Mills MRICS FCInstCES FHEA
Professor of Geomatic EngineeringHead of School
School of Civil Engineering and GeosciencesNewcastle UniversityNewcastle upon TyneNE1 7RUUnited Kingdom
Email: [email protected]: +44 191 208 5393