Trusted Global Innovator - NTT Data · realize corporate transformation. Values and Their...
82
NTT DATA CORPORATION Annual Report 2018 ANNUAL REPORT 2018 Trusted Global Innovator
Transcript of Trusted Global Innovator - NTT Data · realize corporate transformation. Values and Their...
NT
T DA
TA C
OR
PO
RA
TION
Annual R
eport 20
18
ANNUAL REPORT 2018
Trusted Global Innovator

1
Our Story of Long-Term Value Creation
Pursuing Group VisionIn these difficult-to-predict times, amid remarkable IT innovations and rapidly changing business models,
we work closely with clients to combine an abundance of client ideas with global cutting-edge technologies that enable us to demonstrate our strengths. By doing so, we realize business innovation and resolve their issues. This also leads to the
resolution of social issues as we aim to become a partner trusted by clients and society over the long term.
Mission Statement
NTT DATA uses information technology to create new paradigms and values,
which help contribute to a more affluent and harmonious society.
Group Vision
Trusted Global Innovator

NTT DATA ANNUAL REPORT 2018
1
Clients First
Foresight
Teamwork
Advancing ValuesNTT DATA’s Values express the values we uphold in our quest to become a
“Trusted Global Innovator,” which we have established as our Group Vision. We are united in sharing and inculcating these Values to
realize corporate transformation.
Values and Their Significance
Clients First Foresight Teamwork
First, and above all else, we place the needs of our clients. We work continuously to understand your business and we strive to resolve every concern to your satisfaction. We feel responsibility to ensure your success and we let this obligation set the direction of our work and guide our actions.
We never settle for the status quo. Instead, with speed and foresight, we anticipate challenges that lay ahead. We consider the future of IT as well as the future of your business, work to enhance our ability to picture the future, and with our ecosystems, adapt to the changing business environment. In this way, we help you to meet your goals and create a brighter future for society.
We put great importance on enabling our employees to achieve their best through their work with each other. We believe that when a diverse group of individuals brings their unique world views together, shares their wisdom, and works toward a common goal, the results are extraordinary and far beyond what can be achieved by any one person.
We will utilize internal and external management resources that are best for our clients and work to provide optimal IT services, which will eventually lead to ensuring our long-term and stable earnings.
By accurately forecasting long-term technology trends in the field of IT, where technology innovation is rapid, it becomes possible to promote long-term, large-scale projects and technology development.
Utilizing human resources with diverse values enables the creation of innovation and the provision of optimal solutions.
Values
Significance
Committed to Delivering Excellence
Technology Agnostic
Applied Innovation
2 3
Our Story of Long-Term Value Creation
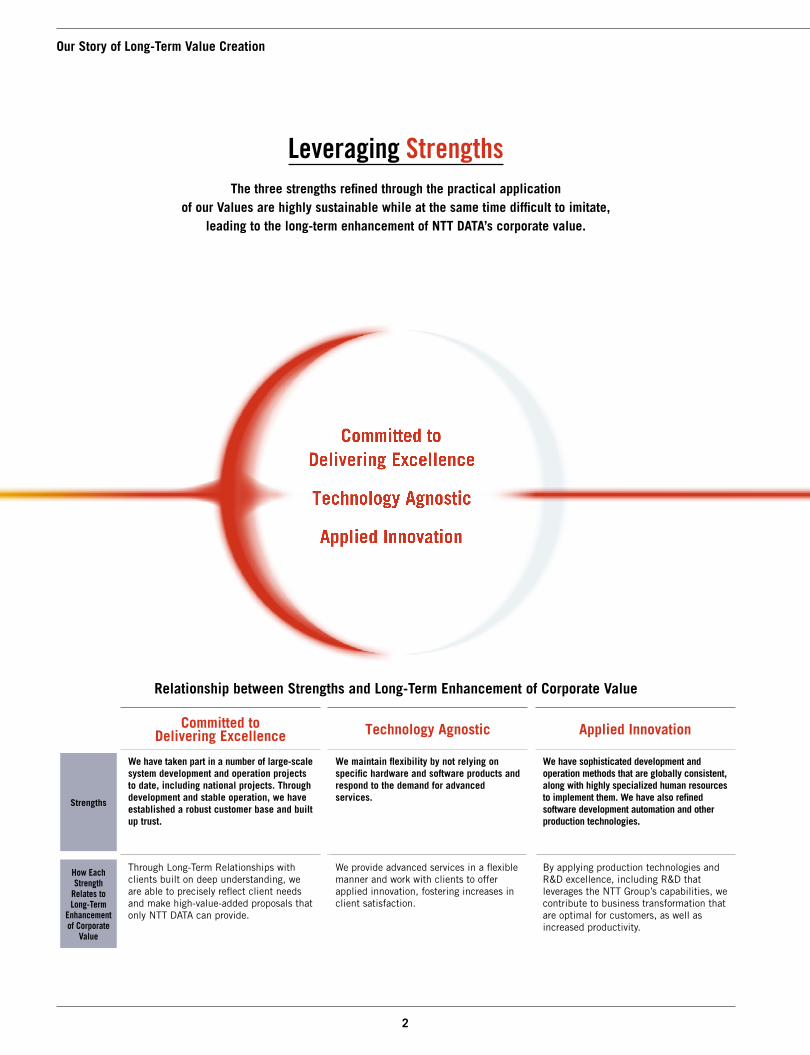
Leveraging StrengthsThe three strengths refined through the practical application
of our Values are highly sustainable while at the same time difficult to imitate, leading to the long-term enhancement of NTT DATA’s corporate value.
Relationship between Strengths and Long-Term Enhancement of Corporate Value
Committed to Delivering Excellence Technology Agnostic Applied Innovation
We have taken part in a number of large-scale system development and operation projects to date, including national projects. Through development and stable operation, we have established a robust customer base and built up trust.
We maintain flexibility by not relying on specific hardware and software products and respond to the demand for advanced services.
We have sophisticated development and operation methods that are globally consistent, along with highly specialized human resources to implement them. We have also refined software development automation and other production technologies.
Through Long-Term Relationships with clients built on deep understanding, we are able to precisely reflect client needs and make high-value-added proposals that only NTT DATA can provide.
We provide advanced services in a flexible manner and work with clients to offer applied innovation, fostering increases in client satisfaction.
By applying production technologies and R&D excellence, including R&D that leverages the NTT Group’s capabilities, we contribute to business transformation that are optimal for customers, as well as increased productivity.
Strengths
How Each Strength
Relates toLong-Term
Enhancement of Corporate
Value

3
NTT DATA ANNUAL REPORT 2018
Positioning of NTT DATA to Maximize Our Strengths
We persist on being a multi-vendor that is not reliant on specific hardware and software products to maintain our flexibility and pursue advanced and innovative technologies so that:
• In addition to NTT DATA’s advanced solutions, by engaging in partnerships with players of various product and service domains, we are able to incorporate a wide range of advanced products and technologies and provide solutions that are optimal for clients.
• Amid ongoing business transformations in a variety of industries, we respond to market and client changes and capture business opportunities in a wide range of domains, enabling the co-innovation of new business models with clients using IT.
• We are able to develop social infrastructure systems requiring the consolidation of numerous vendors and cross-industrial businesses.
• Alliances with other companies enable us to avoid needless investment, improving investment efficiency and reducing risk.
NTT DATA Positioning Image
System Integrator
System development and overall integration (utilizing the strengths of outside partners)
Global Top
Companies as Sler
Clients
SoftwarePlayers
· Microsoft
· Oracle
· SAP, etc.
Hardware
Players
· Fujitsu
· NEC
· Hitachi, etc.
Committed to Delivering Excellence
Applied Innovation
Technology Agnostic
Strengths
Programming
Players
· Produced by Sler
· System companies, etc.
Network
Players
· NTT Communications, etc.
Clients First
Players
· IBM
· Accenture
· Deloitte
· DXC
· PwC
· Fujitsu
Provision of optimal IT solutions(Using NTT DATA’s own resources and providing them in an integrated manner)
4 5
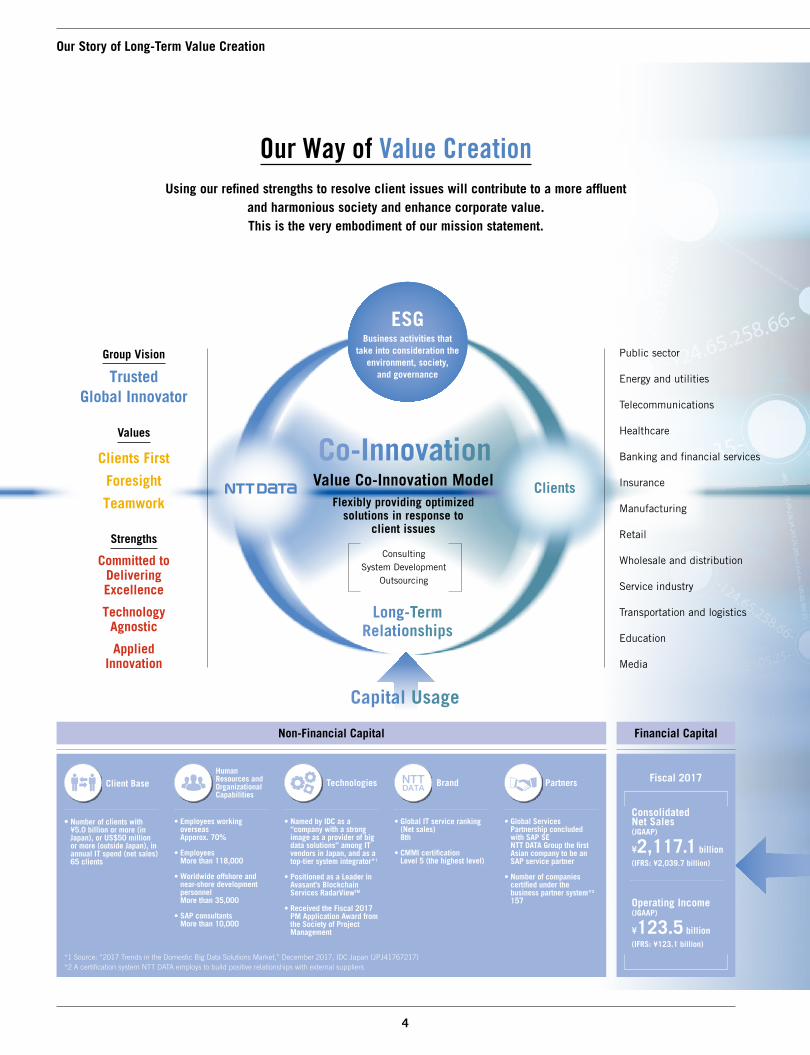
Our Way of Value CreationUsing our refined strengths to resolve client issues will contribute to a more affluent
and harmonious society and enhance corporate value. This is the very embodiment of our mission statement.
Public sector
Energy and utilities
Telecommunications
Healthcare
Banking and financial services
Insurance
Manufacturing
Retail
Wholesale and distribution
Service industry
Transportation and logistics
Education
Media
ClientsValue Co-Innovation ModelFlexibly providing optimized
solutions in response to client issues
Long-Term Relationships
Capital Usage
ConsultingSystem Development
Outsourcing
Non-Financial Capital
• Number of clients with ¥5.0 billion or more (in Japan), or US$50 million or more (outside Japan), in annual IT spend (net sales) 65 clients
• Employees working overseas Apporox. 70%
• Employees More than 118,000
• Worldwide offshore and near-shore development personnel More than 35,000
• SAP consultants More than 10,000
• Named by IDC as a “company with a strong image as a provider of big data solutions” among IT vendors in Japan, and as a top-tier system integrator*1
• Positioned as a Leader in Avasant’s Blockchain Services RadarViewTM
• Received the Fiscal 2017 PM Application Award from the Society of Project Management
• Global IT service ranking (Net sales) 8th
• CMMI certification Level 5 (the highest level)
• Global Services Partnership concluded with SAP SE NTT DATA Group the first Asian company to be an SAP service partner
• Number of companies certified under the business partner system*2 157
Client BaseHuman Resources and Organizational Capabilities
Technologies Brand Partners
Consolidated Net Sales (JGAAP)
¥2,117.1 billion(IFRS: ¥2,039.7 billion)
Fiscal 2017
Financial Capital
Operating Income (JGAAP)
¥123.5 billion(IFRS: ¥123.1 billion)
ESGBusiness activities that
take into consideration the environment, society,
and governance
Our Story of Long-Term Value Creation
Group Vision
Trusted Global Innovator
Values
Clients First
Foresight
Teamwork
Strengths
Committed to Delivering Excellence
Technology Agnostic
Applied Innovation
*1 Source: “2017 Trends in the Domestic Big Data Solutions Market,” December 2017, IDC Japan (JPJ41767217)*2 A certification system NTT DATA employs to build positive relationships with external suppliers
Co-Innovation
NTT DATA ANNUAL REPORT 2018
5
Public sector
Energy and utilities
Telecommunications
Healthcare
Banking and financial services
Insurance
Manufacturing
Retail
Wholesale and distribution
Service industry
Transportation and logistics
Education
Media
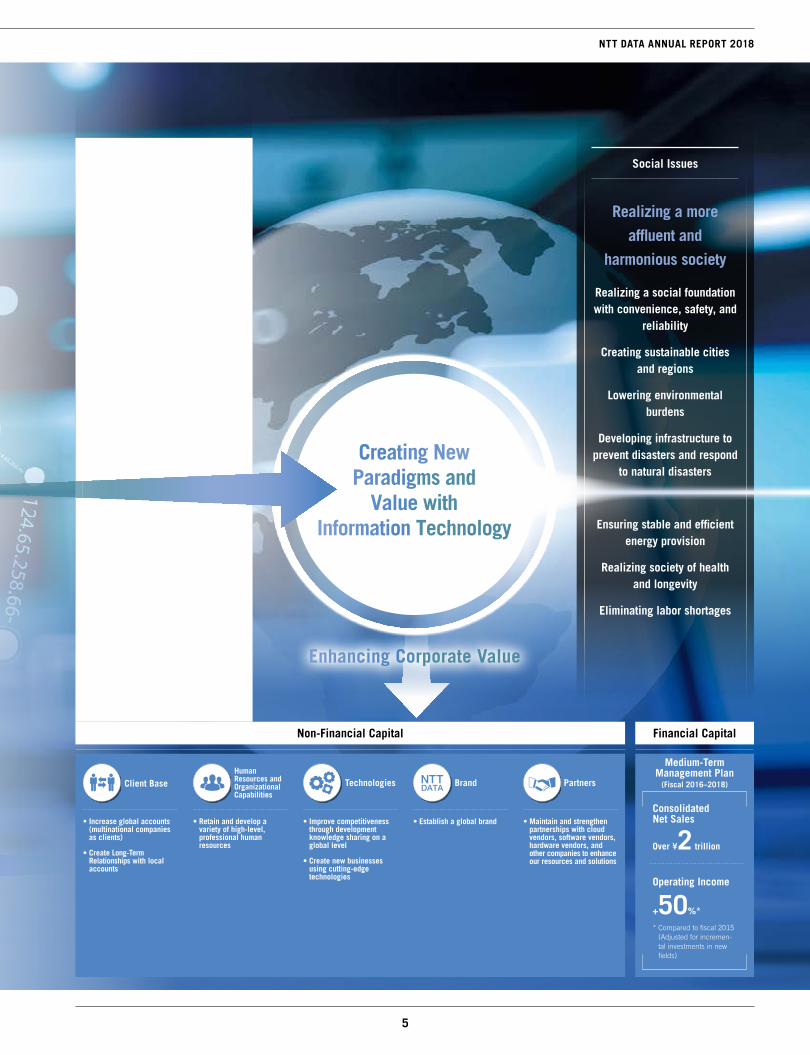
Non-Financial Capital
• Increase global accounts (multinational companies as clients)
• Create Long-Term Relationships with local accounts
• Retain and develop a variety of high-level, professional human resources
• Improve competitiveness through development knowledge sharing on a global level
• Create new businesses using cutting-edge technologies
• Establish a global brand • Maintain and strengthen partnerships with cloud vendors, software vendors, hardware vendors, and other companies to enhance our resources and solutions
Consolidated Net Sales
Over ¥2 trillion
Operating Income
+50%*
Medium-Term Management Plan
(Fiscal 2016–2018)
Financial Capital
* Compared to fiscal 2015 (Adjusted for incremen-tal investments in new fields)
Social Issues
Realizing a more
affluent and
harmonious society
Realizing a social foundation with convenience, safety, and
reliability
Creating sustainable cities and regions
Lowering environmental burdens
Developing infrastructure to prevent disasters and respond
to natural disasters
Ensuring stable and efficient energy provision
Realizing society of health and longevity
Eliminating labor shortages
Client Issues
Global development
Response to increasingly sophisticated economic
activities
Realization of smart communities
Creation of new products and services
Reliable and convenient infrastructure development
Lower electric power and energy consumption
Provision of high-quality medical services
Lower paper consumption
Ensuring cybersecurity
Client needs analysis
Support for workstyle innovations
Rational and efficient operational processes
Creating New Paradigms and
Value with Information Technology
Enhancing Corporate Value
Client BaseHuman Resources and Organizational Capabilities
Technologies Brand Partners
6
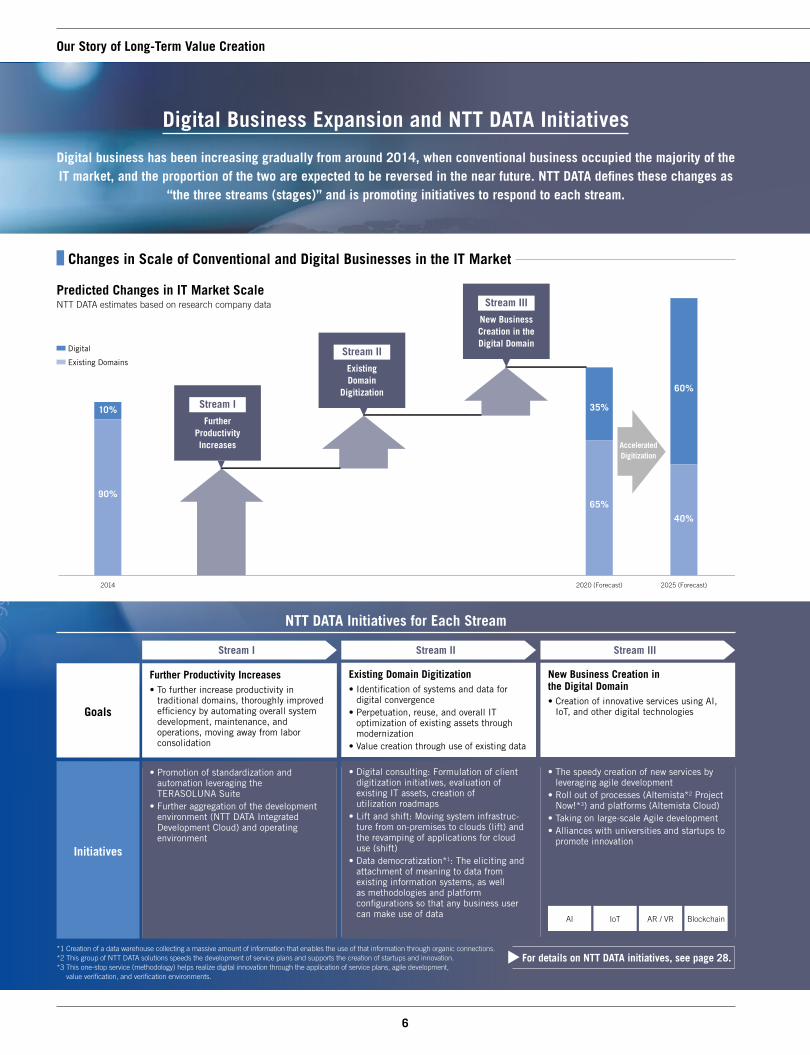
Digital Business Expansion and NTT DATA Initiatives
Digital business has been increasing gradually from around 2014, when conventional business occupied the majority of the IT market, and the proportion of the two are expected to be reversed in the near future. NTT DATA defines these changes as
“the three streams (stages)” and is promoting initiatives to respond to each stream.
2014 2020 (Forecast) 2025 (Forecast)
10%
90%65%
35%
40%
60%
Predicted Changes in IT Market ScaleNTT DATA estimates based on research company data Stream III
New Business Creation in the Digital Domain
Stream II
Existing Domain
DigitizationStream I
Further Productivity Increases
NTT DATA Initiatives for Each Stream
Initiatives
Goals
Further Productivity Increases• To further increase productivity in
traditional domains, thoroughly improved efficiency by automating overall system development, maintenance, and operations, moving away from labor consolidation
Existing Domain Digitization• Identification of systems and data for
digital convergence • Perpetuation, reuse, and overall IT
optimization of existing assets through modernization
• Value creation through use of existing data
New Business Creation in the Digital Domain• Creation of innovative services using AI,
IoT, and other digital technologies
Changes in Scale of Conventional and Digital Businesses in the IT Market
Digital
Existing Domains
*1 Creation of a data warehouse collecting a massive amount of information that enables the use of that information through organic connections.*2 This group of NTT DATA solutions speeds the development of service plans and supports the creation of startups and innovation. *3 This one-stop service (methodology) helps realize digital innovation through the application of service plans, agile development,
value verification, and verification environments.
• Promotion of standardization and automation leveraging the TERASOLUNA Suite
• Further aggregation of the development environment (NTT DATA Integrated Development Cloud) and operating environment
• Digital consulting: Formulation of client digitization initiatives, evaluation of existing IT assets, creation of utilization roadmaps
• Lift and shift: Moving system infrastruc-ture from on-premises to clouds (lift) and the revamping of applications for cloud use (shift)
• Data democratization*1: The eliciting and attachment of meaning to data from existing information systems, as well as methodologies and platform configurations so that any business user can make use of data
• The speedy creation of new services by leveraging agile development
• Roll out of processes (Altemista*2 Project Now!*3) and platforms (Altemista Cloud)
• Taking on large-scale Agile development • Alliances with universities and startups to
promote innovation
Stream I Stream II Stream III
AI IoT AR / VR Blockchain
For details on NTT DATA initiatives, see page 28.
Accelerated Digitization
Our Story of Long-Term Value Creation
7

1 Our Story of Long-Term Value Creation
8 Message from the CEO 16 Value Creation and History of Self-Transformations 18 Our Businesses 20 Consolidated Financial Highlights 24 Financial Models of Principal Businesses
26 Overview and Progress on “NTT DATA: ASCEND,” Our Medium-Term Management Plan
30 Financial and Capital Strategy
32 Business Strategies by Segment
32 Public & Social Infrastructure Segment 34 Financial Segment 36 Enterprise & Solutions Segment 38 North America Segment 40 EMEA & LATAM Segment
42 Toward the Sustainable Enhancement of Corporate Value
44 Growth Drivers 48 Profitability 50 Sustainability
50 Value Creation through Contribution to Society and the Environment
52 Human Resource Management 56 Sustainable Solutions 58 Environmental Management
60 Corporate Governance
68 Risk Management
70 Information Security
72 Financial Information
78 Company and Stock Information
Contents
The names of NTT DATA’s products and services referred to in this annual report are trademarks or registered trademarks of NTT DATA in Japan and other countries. The names of other companies, products, services, etc., are the trade names, trademarks, or registered trademarks of the companies concerned.
Cautionary Statement Regarding Forward-Looking Statements
This annual report contains forward-looking statements concerning the NTT DATA Group’s future plans, strategies, and performance. These forward-looking statements are not historical facts; rather, they represent assump-tions and beliefs based on economic, financial, and competitive data currently available. Forward-looking statements include information preceded by, followed by, or that include the words “predicts,” “expects,” “anticipates,” “could,” “may,” or similar expressions. Furthermore, they are subject to a number of risks and uncertainties that, without limitation, relate to economic conditions, fierce competition in the information service industry, client demand, tax rules, regulations, and other factors. Readers of this annual report are cautioned not to place undue reliance on these forward-looking statements. The NTT DATA Group therefore wishes to caution readers that actual results may differ materially.
7
NTT DATA ANNUAL REPORT 2018
8 9
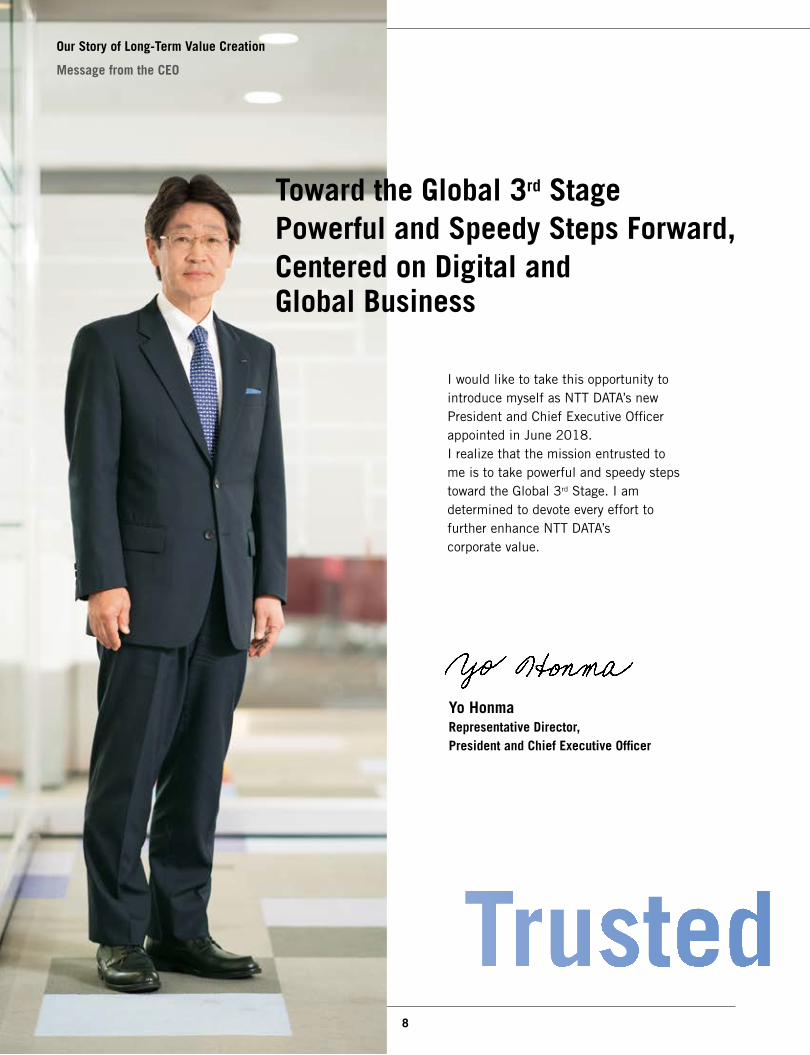
Toward the Global 3rd StagePowerful and Speedy Steps Forward,Centered on Digital and Global Business
I would like to take this opportunity to introduce myself as NTT DATA’s new President and Chief Executive Officer appointed in June 2018.I realize that the mission entrusted to me is to take powerful and speedy steps toward the Global 3rd Stage. I am determined to devote every effort to further enhance NTT DATA’s corporate value.
Yo HonmaRepresentative Director,President and Chief Executive Officer
Our Story of Long-Term Value Creation
Message from the CEO
9
NTT DATA ANNUAL REPORT 2018
Toward the Global 3rd StagePowerful and Speedy Steps Forward,Centered on Digital and Global Business
What I Live By
I Always Want to Stay Firm to My Beliefs but Be Brave Enough to Change
The principle that has guided me throughout my career is to always stay firm to my beliefs but be brave enough to change. This year marks the 30th anniversary of NTT DATA becoming a separate entity in 1988 from NIPPON TELEGRAPH AND TELEPHONE CORPORATION. As I look back at the his-tory of our Company, its founding concept of becoming a “value creator to draw vitality from information” in particular caught my eye. At present, our mission statement is to “use information technology to create new paradigms and values, which help contribute to a more affluent and harmonious society,” and we strive to share and practice our Values. In fact, we have been able to consistently exert our efforts to “shape an affluent society with information technologies” over the 30 years since our establishment. And rather than pursuing short-term profits or shying away from challenges, we have remained focused on placing “Clients First,” as this is one of our Values. The Company has stayed firm to this belief and must continue to do so going forward. Long-Term Relationships built upon this principle are a cornerstone of NTT DATA’s competitive advantage. At the same time, I believe that we need to continue to boldly change with courage and a strong will when it is required. In 2010, I was appointed Head of the Retail and Service Business Sector. It was a time of multiple problematic projects, with employees exhausted as they were unable to deliver results despite their hard work. And so we decided to analyze issues in each team and then worked with the teams to transform by “starting small” to address issues wher-ever possible. These steady efforts helped us to deliver projects on time, recovering employee satisfaction from its lowest to highest level in the process. This experience taught me how important it is to “give it your all in everything you do,” to draw on the “vitality” of employees to enhance organizational capabilities, and that “you can change if you have a strong will.” At present, many clients are working aggressively on digital transformation to change their business models with artificial intelligence (AI), the Internet of Things (IoT), and other technologies. NTT DATA should help in this regard as well as transform itself in order to come up with higher value-added proposals in new fields as an IT specialist. Going into new markets always comes with its set of challenges, however, we will unleash the vitality of our employees and transform ourselves with a strong will by building up successes based on a spirit of “giving it our all.”
10 11
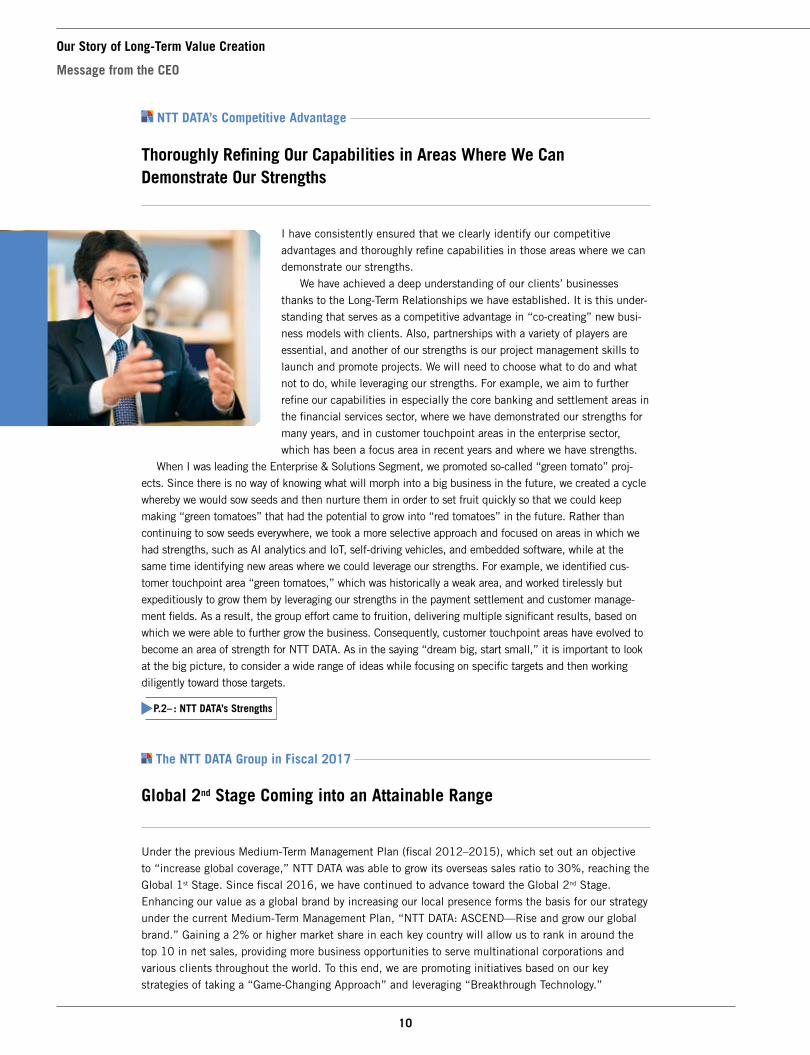
NTT DATA’s Competitive Advantage
Thoroughly Refining Our Capabilities in Areas Where We Can Demonstrate Our Strengths
I have consistently ensured that we clearly identify our competitive advantages and thoroughly refine capabilities in those areas where we can demonstrate our strengths. We have achieved a deep understanding of our clients’ businesses thanks to the Long-Term Relationships we have established. It is this under-standing that serves as a competitive advantage in “co-creating” new busi-ness models with clients. Also, partnerships with a variety of players are essential, and another of our strengths is our project management skills to launch and promote projects. We will need to choose what to do and what not to do, while leveraging our strengths. For example, we aim to further refine our capabilities in especially the core banking and settlement areas in the financial services sector, where we have demonstrated our strengths for many years, and in customer touchpoint areas in the enterprise sector, which has been a focus area in recent years and where we have strengths.
When I was leading the Enterprise & Solutions Segment, we promoted so-called “green tomato” proj-ects. Since there is no way of knowing what will morph into a big business in the future, we created a cycle whereby we would sow seeds and then nurture them in order to set fruit quickly so that we could keep making “green tomatoes” that had the potential to grow into “red tomatoes” in the future. Rather than continuing to sow seeds everywhere, we took a more selective approach and focused on areas in which we had strengths, such as AI analytics and IoT, self-driving vehicles, and embedded software, while at the same time identifying new areas where we could leverage our strengths. For example, we identified cus-tomer touchpoint area “green tomatoes,” which was historically a weak area, and worked tirelessly but expeditiously to grow them by leveraging our strengths in the payment settlement and customer manage-ment fields. As a result, the group effort came to fruition, delivering multiple significant results, based on which we were able to further grow the business. Consequently, customer touchpoint areas have evolved to become an area of strength for NTT DATA. As in the saying “dream big, start small,” it is important to look at the big picture, to consider a wide range of ideas while focusing on specific targets and then working diligently toward those targets.
P.2– : NTT DATA’s Strengths
The NTT DATA Group in Fiscal 2017
Global 2nd Stage Coming into an Attainable Range
Under the previous Medium-Term Management Plan (fiscal 2012–2015), which set out an objective to “increase global coverage,” NTT DATA was able to grow its overseas sales ratio to 30%, reaching the Global 1st Stage. Since fiscal 2016, we have continued to advance toward the Global 2nd Stage. Enhancing our value as a global brand by increasing our local presence forms the basis for our strategy under the current Medium-Term Management Plan, “NTT DATA: ASCEND—Rise and grow our global brand.” Gaining a 2% or higher market share in each key country will allow us to rank in around the top 10 in net sales, providing more business opportunities to serve multinational corporations and various clients throughout the world. To this end, we are promoting initiatives based on our key strategies of taking a “Game-Changing Approach” and leveraging “Breakthrough Technology.”
Our Story of Long-Term Value Creation
Message from the CEO
11
NTT DATA ANNUAL REPORT 2018
In fiscal 2017, the second year of the current Medium-Term Management Plan, new orders received, net sales, and operating income outperformed results of the previous fiscal year, helped along by robust business in Japan and business growth abroad. In addition, we successfully achieved our sales target, one of the objectives of the current Medium-Term Management Plan, one year early. The post-merger integration (PMI) of former Dell Services is on track and the overseas sales ratio exceeded 40%. With the former Dell Services consolidated into our results, our operations encompass 214 cities across 53 countries and regions globally with approximately 118,000 employees, nearly 70% of whom are outside Japan. We are steadily making progress in terms of increasing our local presence, with our local market share now exceeding 2% in countries such as Spain and Italy. In terms of our “Game-Changing Approach,” as we have successfully built trusted relationships with numerous clients by pursuing our Clients First approach, large accounts with ¥5.0 billion or more in annual IT spend (net sales) grew from 36 in fiscal 2011 to 65 in fiscal 2017. In this way, by leveraging “Japan Quality,” NTT DATA is building Long-Term Relationships with clients, strengthening its customer base, and establishing a stable foundation to manage business. Regarding “Breakthrough Technology,” we are promoting initiatives to comprehen-sively support clients’ digital journey, including consulting services to help digitization in “front-end systems” and the provision of technologies for digitization using existing IT assets within “back-end systems.”
P.26– : Medium-Term Management Plan
Challenges Ahead
Reinforcing Control of Unprofitable Projects and Improving the Profits of Business Outside Japan
Fiscal 2017 yielded positive results in various aspects, while having also left some chal-lenges. One of those is unprofitable projects. Large losses were incurred with one project that was unique in nature and extremely difficult from a technical perspective, as it had never been attempted anywhere by anyone before. Except for this project, we faced few unprofitable projects and losses from unprofitable projects have been controlled within 0.3%–0.5% against consolidated net sales, which is our parameter to measure unprofit-able projects. Still, we will continue to focus on managing loss-making projects as a key agenda. As overseas sales have grown, now accounting for over 40%, we will reinforce control of unprofitable projects in our business in Japan as well as abroad. Another challenge is improving the profits of business outside Japan. In North America, we have seen a trend toward insourcing projects where clients initiate digital transformation with in-house IT resources, while also noticing a move to consolidate vendors in areas like ITO and BPO to reduce order value. Against such a backdrop, orders are not growing as expected and profit margins are on the decline. As such, in addition to augmenting digital and sales capabilities, we will work on reducing costs. EMEA and Latin America are enjoying great results in both orders and net sales, but their profitabil-ity has not made progress as anticipated due to a temporary uptick in selling, recruiting, and training costs as the result of business expansion. We will continue to grow orders and sales while controlling costs to enhance profit margins.
P.48– : Challenges Ahead “Profitability”
12 13
The NTT DATA Group in Fiscal 2018
Drawing Up Concrete Measures to Achieve the Global 3rd Stage
We are targeting net sales of ¥2.1 trillion, a year-on-year increase of ¥60.3 billion, in fiscal 2018, the year in which we adopted the International Financial Reporting Standards (IFRS). Operating income is forecast to reach ¥142.0 billion, an increase of ¥18.9 billion compared to fiscal 2017, while we expect to generate ¥152.0 billion, which is 50% higher than fiscal 2015, in operating income after adjustments excluding additional investments of ¥10.0 billion in new areas, thus bringing us within reach of an objective of the current Medium-Term Management Plan. In fiscal 2018, we plan to pay an annual dividend of ¥17 per share, an increase of ¥2 per share compared to fiscal 2017. From fiscal 2019, we will begin moving toward the Global 3rd Stage, aiming roughly for the year 2025. In formulating the next Medium-Term Management Plan, to be announced in spring 2019, I will clearly define concrete measures for the Group as well as incorporate my own thoughts into it. I would like to take you through our current thoughts on the plan’s basic direction.
What We Have Infused in the Group Vision: “Trusted Global Innovator”
Setting Ourselves Apart in Global Markets through Trust
As we celebrated our 30th anniversary in May 2018, we launched our new Group Vision of “Trusted Global Innovator.” Since 2005, when we set out our Group Vision to become a “Global IT Innovator,” we have been building a foundation to drive global business. At present, we have achieved our goal of becoming a global company, operating across 53 countries and regions with approximately 118,000 employees. Although the precise picture of what the future will bring is unpredictable, one thing remains clear. And that is our competitive advantage, which I discussed earlier, of Long-Term Relationships with clients and a deep understanding of our clients’ businesses. We will work side by side with clients as a trusted partner, connecting their abundant ideas with cutting-edge technologies throughout the world to help create business inno-vations and address social issues. Once we have embarked on a project, we will never turn our back on it, working closely with clients as their partner through to the very end. This is what we aim for as a “Trusted Global Innovator.” Our goal is to differentiate our-selves by gaining “trust” to continuously win out in the coming age.
Our Story of Long-Term Value Creation
Message from the CEO
13
NTT DATA ANNUAL REPORT 2018
How to Reach the Global 3rd Stage
“Growth with Quality” Driven by Digital and Global Business
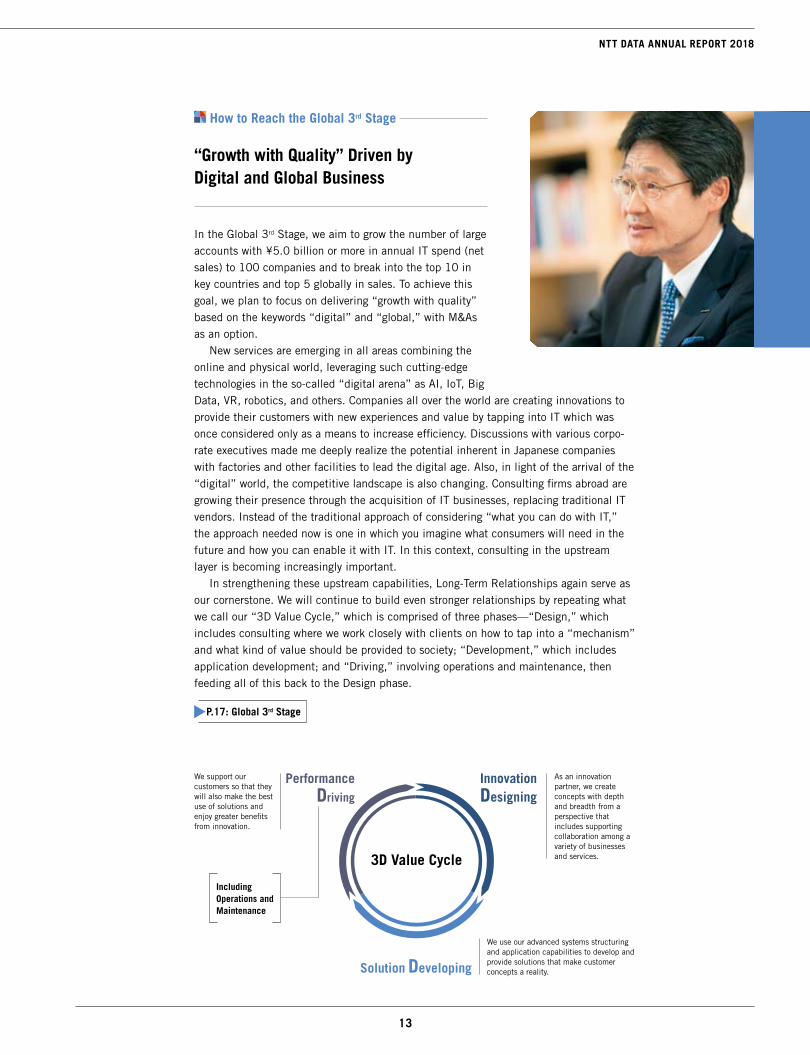
In the Global 3rd Stage, we aim to grow the number of large accounts with ¥5.0 billion or more in annual IT spend (net sales) to 100 companies and to break into the top 10 in key countries and top 5 globally in sales. To achieve this goal, we plan to focus on delivering “growth with quality” based on the keywords “digital” and “global,” with M&As as an option. New services are emerging in all areas combining the online and physical world, leveraging such cutting-edge technologies in the so-called “digital arena” as AI, IoT, Big Data, VR, robotics, and others. Companies all over the world are creating innovations to provide their customers with new experiences and value by tapping into IT which was once considered only as a means to increase efficiency. Discussions with various corpo-rate executives made me deeply realize the potential inherent in Japanese companies with factories and other facilities to lead the digital age. Also, in light of the arrival of the “digital” world, the competitive landscape is also changing. Consulting firms abroad are growing their presence through the acquisition of IT businesses, replacing traditional IT vendors. Instead of the traditional approach of considering “what you can do with IT,” the approach needed now is one in which you imagine what consumers will need in the future and how you can enable it with IT. In this context, consulting in the upstream layer is becoming increasingly important. In strengthening these upstream capabilities, Long-Term Relationships again serve as our cornerstone. We will continue to build even stronger relationships by repeating what we call our “3D Value Cycle,” which is comprised of three phases—“Design,” which includes consulting where we work closely with clients on how to tap into a “mechanism” and what kind of value should be provided to society; “Development,” which includes application development; and “Driving,” involving operations and maintenance, then feeding all of this back to the Design phase.
IncludingOperations and Maintenance
3D Value Cycle
P.17: Global 3rd Stage
Innovation Designing
Solution Developing
As an innovation partner, we create concepts with depth and breadth from a perspective that includes supporting collaboration among a variety of businesses and services.
We use our advanced systems structuring and application capabilities to develop and provide solutions that make customer concepts a reality.
Performance Driving
We support our customers so that they will also make the best use of solutions and enjoy greater benefits from innovation.
14 15
In the global business, we believe that clearly defining our strengths, enhancing our competitive advantage, and providing even higher added value are of the utmost importance, and we will promote various initiatives in these areas. These efforts include creating “Global Offering,” solution services that can be offered across the globe. We have a high degree of expectation for our AW3D Global Digital 3D Map and MarkLogic as globally competitive solutions. Furthermore, we will respond to high-level requirements even more than ever from “global accounts” who roll out business globally, as a “Global One Team” by forging teamwork across the NTT DATA Group. In addition, through proactive investments in production technologies such as high-speed, high-quality development and automation technologies, as well as infrastructure, methodologies, performance design, and security technologies, we will provide high-quality services in each country while also striving to improve profitability. Creating global synergies through these efforts will become a critical agenda in the global business.
Building a Foundation to Promote Our Strategies
Maintaining Diversity, Promoting Workstyle Reforms, and Reinforcing Global Governance
Between now and 2025, the IT industry is expected to face a severe talent shortage of around 750,000 people. Amid intensifying competition to recruit personnel, it is critical for NTT DATA to continue recruiting and training talented personnel to grow sustainably. Creativity in the digital age is often best nurtured through contact with those that have different viewpoints and come from different backgrounds. We would like to accelerate initiatives to increase human resource diversity to help realize a world where diversity is commonplace. NTT DATA has remained ahead of its peers in the IT industry with regard to workstyle reforms, including the reduction of working hours, which has been a problem in the industry. Our persistent efforts led to lowering total hours worked per employee from 2,066 hours to 1,901 hours between fiscal 2007 and fiscal 2017. This level is far below the average for Japanese companies in the IT industry as well as across industries over-all. We will continue to strengthen these initiatives going forward to provide a better work environment and make efforts to become a company where our employees feel motivated to work. We want to have NTT DATA seen as an attractive company to both our people and our business partners. We will also reinforce global governance to help create more global synergies. At the Ordinary General Meeting of Shareholders held in June 2018, John McCain was appointed as the first non-Japanese director of NTT DATA Corporation. We will drive the global business by drawing on his global insights, new perspectives, and ideas. At the same time, we are making progress in putting a governance structure in place to run business in a unified manner as NTT DATA at large. We will move forward as a Trusted Global Innovator by sharing our mission statement, Group Vision, and Values to bring all employees across NTT DATA together as one NTT DATA.
P.52– : Human Resource Management / P.60– : Corporate Governance
Our Story of Long-Term Value Creation
Message from the CEO

15
NTT DATA ANNUAL REPORT 2018
Toward Sustainable Development
Continuing to Help Realize a More Affluent, Harmonious, and Sustainable Society
In 2002, NTT DATA announced its branding message as “Shaping the Future with IT.” Sixteen years later, a dramatic societal transformation dubbed “the Fourth Industrial Revolution” is becoming a reality. “Digital” in a broader sense opens up possibilities for addressing social issues limit-lessly. As Japan is facing a variety of societal challenges including labor shortages, a declining population, an aging population, and regional problems (depopulation), public–private partnerships (PPPs) are under way to realize “Society 5.0,” a new society leveraging cutting-edge technologies. Turning to the world, it is hoped that various challenges are resolved that threaten the sustainability of global society, including food and water problems caused by growing populations and urbanization, social infrastructure issues such as transportation, education, healthcare, and disaster prevention as well as energy and environmental problems. Since our foundation, NTT DATA has consistently striven to “use information technology to create new paradigms and values, which help contribute to a more affluent and harmonious society,” and our role continues to increase even now more than ever. The paradigms we will create for the interest of a variety of stakeholders will also contribute to achieving various objectives set forth under the United Nations Sustainable Development Goals (SDGs). NTT DATA will continue to take solid steps forward as a “Trusted Global Innovator” by leading initiatives to realize a more affluent and smart society, as we manage business with due consideration to environmental, social, and governance (ESG) factors. We appreciate the continued support of our shareholders, investors, and all stakeholders.
P.56– : Sustainable Solutions
16 17
1988 1989 1990 1991 1992 1993 1994 1995 1996 1997 1998 1999 2000 2001 2002 2003 2004 2005 2006 2007 2008FY
¥1 trillion
¥2 trillion
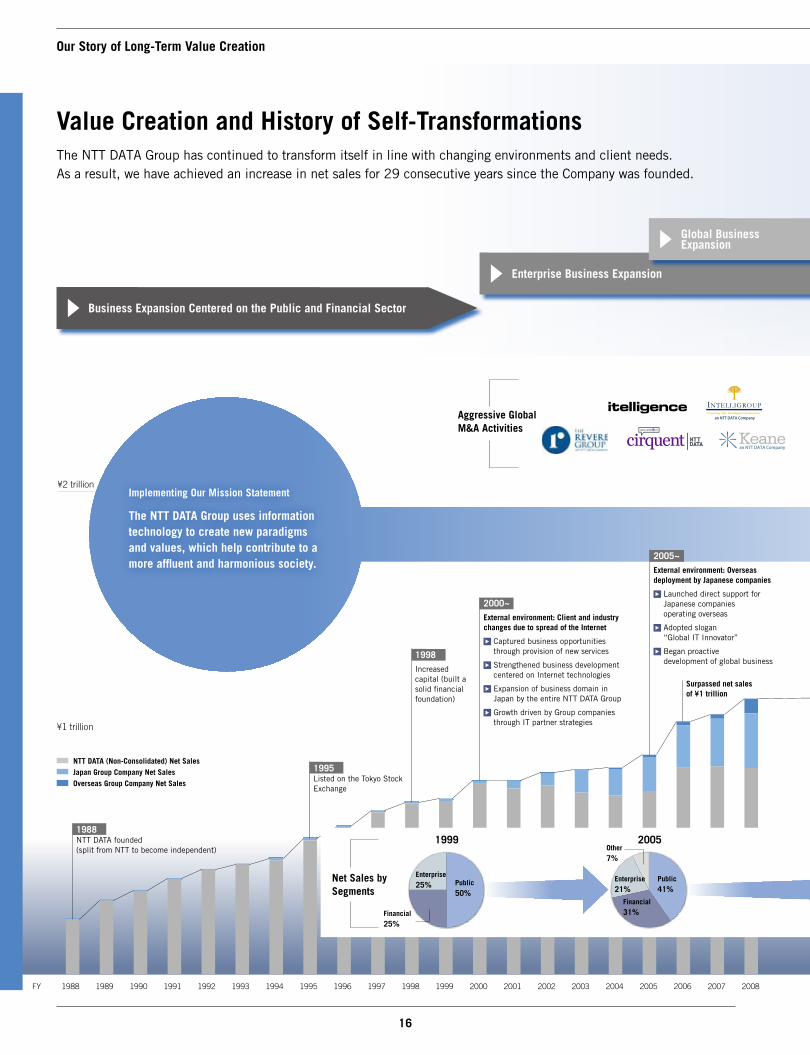
2005
Public41%
Financial31%
Enterprise 21%
Other7%
Our Story of Long-Term Value Creation
Value Creation and History of Self-TransformationsThe NTT DATA Group has continued to transform itself in line with changing environments and client needs.As a result, we have achieved an increase in net sales for 29 consecutive years since the Company was founded.
1999
2005~External environment: Overseas deployment by Japanese companies
Launched direct support for Japanese companies operating overseas
Adopted slogan “Global IT Innovator”
Began proactive development of global business
Aggressive Global M&A Activities
NTT DATA (Non-Consolidated) Net Sales Japan Group Company Net Sales Overseas Group Company Net Sales
Public50%
Financial25%
Enterprise 25%
Business Expansion Centered on the Public and Financial Sector
Implementing Our Mission Statement
The NTT DATA Group uses information technology to create new paradigms and values, which help contribute to a more affluent and harmonious society.
Net Sales by Segments
Surpassed net sales of ¥1 trillion
1998Increased capital (built a solid financial foundation)
Enterprise Business Expansion
2000~External environment: Client and industry changes due to spread of the Internet
Captured business opportunities through provision of new services
Strengthened business development centered on Internet technologies
Expansion of business domain in Japan by the entire NTT DATA Group
Growth driven by Group companies through IT partner strategies
Global Business Expansion
1995 Listed on the Tokyo Stock Exchange
1988NTT DATA founded(split from NTT to become independent)
17
NTT DATA ANNUAL REPORT 2018
2009 2010 2011 2012 2013 2014 2015 2016 2017
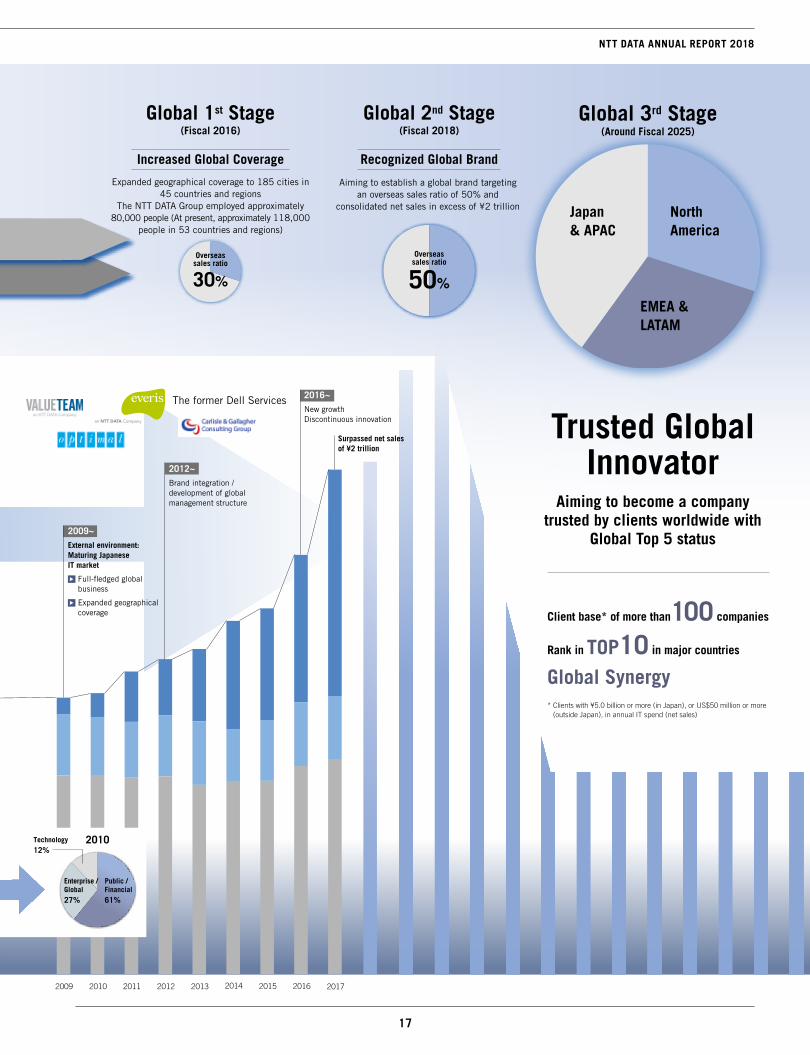
Global 1st Stage (Fiscal 2016)
Global 2nd Stage (Fiscal 2018)
North America
EMEA & LATAM
Japan & APAC
Global 3rd Stage (Around Fiscal 2025)
Increased Global Coverage Recognized Global Brand
Aiming to establish a global brand targeting an overseas sales ratio of 50% and
consolidated net sales in excess of ¥2 trillion
Expanded geographical coverage to 185 cities in 45 countries and regions
The NTT DATA Group employed approximately 80,000 people (At present, approximately 118,000
people in 53 countries and regions)
2010
2012~Brand integration / development of global management structure
2016~New growthDiscontinuous innovationAggressive Global
M&A Activities
The former Dell Services
Surpassed net sales of ¥2 trillion
2009~External environment: Maturing Japanese IT market
Full-fledged global business
Expanded geographical coverage
Trusted Global Innovator
Aiming to become a company trusted by clients worldwide with
Global Top 5 status
Overseas sales ratio
30%
Overseas sales ratio
50%
Client base* of more than100 companies
Rank in TOP10 in major countries
Global Synergy* Clients with ¥5.0 billion or more (in Japan), or US$50 million or more
(outside Japan), in annual IT spend (net sales)
Global Business Expansion
Public / Financial61%
Enterprise / Global27%
Technology12%
18 19
Our Story of Long-Term Value Creation
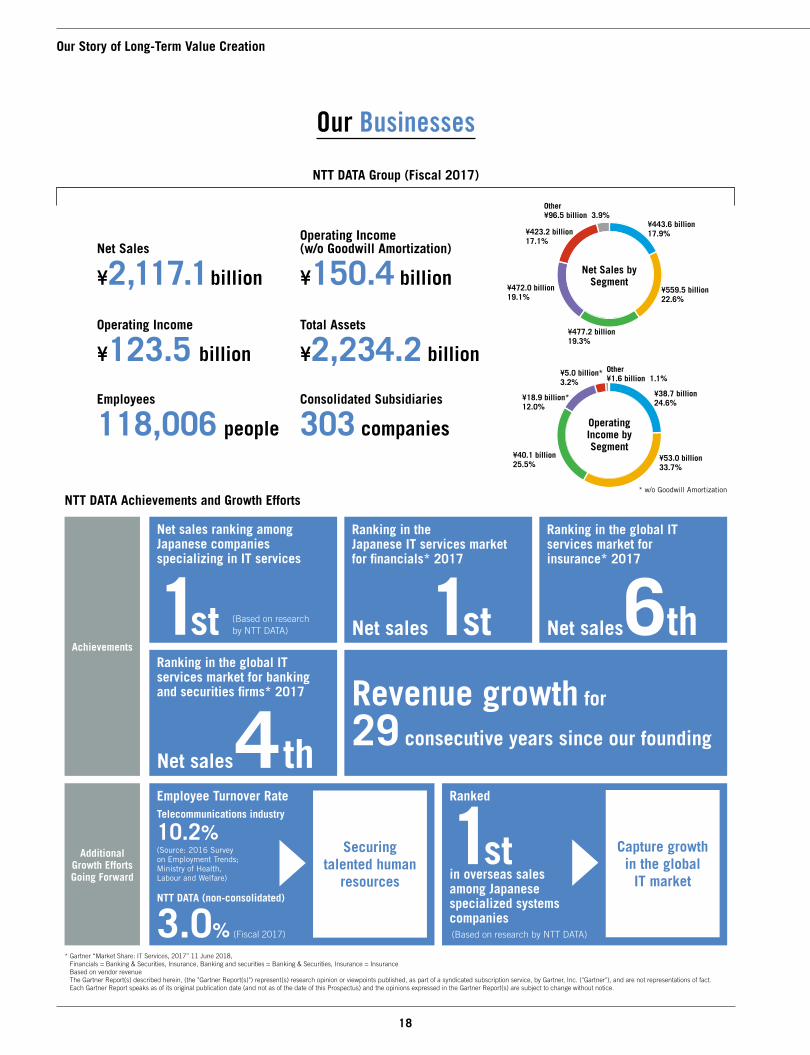
Our Businesses
Net Sales
¥2,117.1 billion
Operating Income (w/o Goodwill Amortization)
¥150.4 billion
Operating Income
¥123.5 billion
Total Assets
¥2,234.2 billion
Employees
118,006 people
Consolidated Subsidiaries
303 companies
NTT DATA Group (Fiscal 2017)
NTT DATA Achievements and Growth Efforts
Achievements
Employee Turnover RateTelecommunications industry
10.2%(Source: 2016 Survey on Employment Trends; Ministry of Health, Labour and Welfare)
NTT DATA (non-consolidated)
3.0% (Fiscal 2017)
* Gartner “Market Share: IT Services, 2017” 11 June 2018, Financials = Banking & Securities, Insurance, Banking and securities = Banking & Securities, Insurance = Insurance Based on vendor revenue The Gartner Report(s) described herein, (the "Gartner Report(s)") represent(s) research opinion or viewpoints published, as part of a syndicated subscription service, by Gartner, Inc. ("Gartner"), and are not representations of fact. Each Gartner Report speaks as of its original publication date (and not as of the date of this Prospectus) and the opinions expressed in the Gartner Report(s) are subject to change without notice.
Ranked
1st in overseas sales among Japanese specialized systems companies
Capture growth in the global
IT market
Additional Growth Efforts Going Forward
Net Sales by Segment
¥472.0 billion19.1%
¥559.5 billion22.6%
¥443.6 billion17.9%
¥477.2 billion19.3%
* w/o Goodwill Amortization
Operating Income by Segment
¥423.2 billion17.1%
¥38.7 billion24.6%
¥53.0 billion33.7%
¥40.1 billion25.5%
¥18.9 billion*12.0%
¥5.0 billion*3.2%
Net sales ranking among Japanese companies specializing in IT services
1st
Ranking in the Japanese IT services market for financials* 2017
Net sales1st
Ranking in the global IT services market for insurance* 2017
Net sales6thRanking in the global IT services market for banking and securities firms* 2017
Net sales4th
Revenue growth for
29 consecutive years since our founding
Securing talented human
resources
(Based on research by NTT DATA)
(Based on research by NTT DATA)
Other¥96.5 billion 3.9%
Other¥1.6 billion 1.1%
19
NTT DATA ANNUAL REPORT 2018
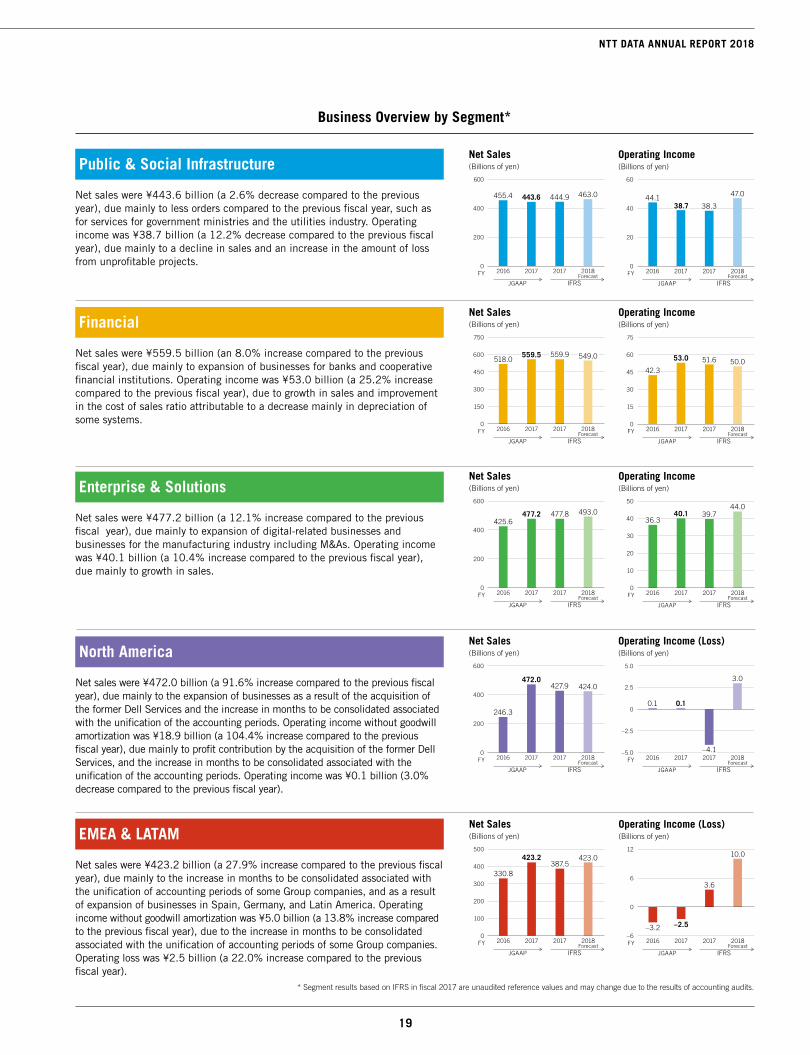
Business Overview by Segment*
Public & Social Infrastructure
EMEA & LATAM
Net sales were ¥423.2 billion (a 27.9% increase compared to the previous fiscal year), due mainly to the increase in months to be consolidated associated with the unification of accounting periods of some Group companies, and as a result of expansion of businesses in Spain, Germany, and Latin America. Operating income without goodwill amortization was ¥5.0 billion (a 13.8% increase compared to the previous fiscal year), due to the increase in months to be consolidated associated with the unification of accounting periods of some Group companies. Operating loss was ¥2.5 billion (a 22.0% increase compared to the previous fiscal year).
Net Sales(Billions of yen)
20172016
JGAAP IFRS
2017 2018
443.6455.4 444.9 463.0
0
200
400
600
FY Forecast
Net sales were ¥443.6 billion (a 2.6% decrease compared to the previous year), due mainly to less orders compared to the previous fiscal year, such as for services for government ministries and the utilities industry. Operating income was ¥38.7 billion (a 12.2% decrease compared to the previous fiscal year), due mainly to a decline in sales and an increase in the amount of loss from unprofitable projects.
Financial
Net sales were ¥559.5 billion (an 8.0% increase compared to the previous fiscal year), due mainly to expansion of businesses for banks and cooperative financial institutions. Operating income was ¥53.0 billion (a 25.2% increase compared to the previous fiscal year), due to growth in sales and improvement in the cost of sales ratio attributable to a decrease mainly in depreciation of some systems.
Enterprise & Solutions
Net sales were ¥477.2 billion (a 12.1% increase compared to the previous fiscal year), due mainly to expansion of digital-related businesses and businesses for the manufacturing industry including M&As. Operating income was ¥40.1 billion (a 10.4% increase compared to the previous fiscal year), due mainly to growth in sales.
North America
Net sales were ¥472.0 billion (a 91.6% increase compared to the previous fiscal year), due mainly to the expansion of businesses as a result of the acquisition of the former Dell Services and the increase in months to be consolidated associated with the unification of the accounting periods. Operating income without goodwill amortization was ¥18.9 billion (a 104.4% increase compared to the previous fiscal year), due mainly to profit contribution by the acquisition of the former Dell Services, and the increase in months to be consolidated associated with the unification of the accounting periods. Operating income was ¥0.1 billion (3.0% decrease compared to the previous fiscal year).
Operating Income(Billions of yen)
38.744.1
38.3
47.0
0
20
40
60
20172016
JGAAP IFRS
2017 2018FY Forecast
Net Sales(Billions of yen)
559.5518.0
559.9 549.0
150
600
450
300
750
020172016
JGAAP IFRS
2017 2018FY Forecast
Operating Income(Billions of yen)
53.0
42.3
51.6 50.0
15
45
60
30
75
020172016
JGAAP IFRS
2017 2018FY Forecast
Net Sales(Billions of yen)
477.2425.6
477.8 493.0
200
400
600
020172016
JGAAP IFRS
2017 2018FY Forecast
Operating Income(Billions of yen)
40.136.3
39.744.0
20
10
40
30
50
020172016
JGAAP IFRS
2017 2018FY Forecast
Net Sales(Billions of yen)
472.0
246.3
427.9 424.0
200
400
600
020172016
JGAAP IFRS
2017 2018FY Forecast
Operating Income (Loss)(Billions of yen)
0.10.1
–4.1
3.0
–5.0
2.5
–2.5
5.0
0
20172016
JGAAP IFRS
2017 2018FY Forecast
Net Sales(Billions of yen)
423.2
330.8387.5
423.0
100
400
300
200
500
020172016
JGAAP IFRS
2017 2018FY Forecast
Operating Income (Loss)(Billions of yen)
–2.5–3.2
3.6
10.0
–6
6
12
0
20172016
JGAAP IFRS
2017 2018FY Forecast
* Segment results based on IFRS in fiscal 2017 are unaudited reference values and may change due to the results of accounting audits.
20 21
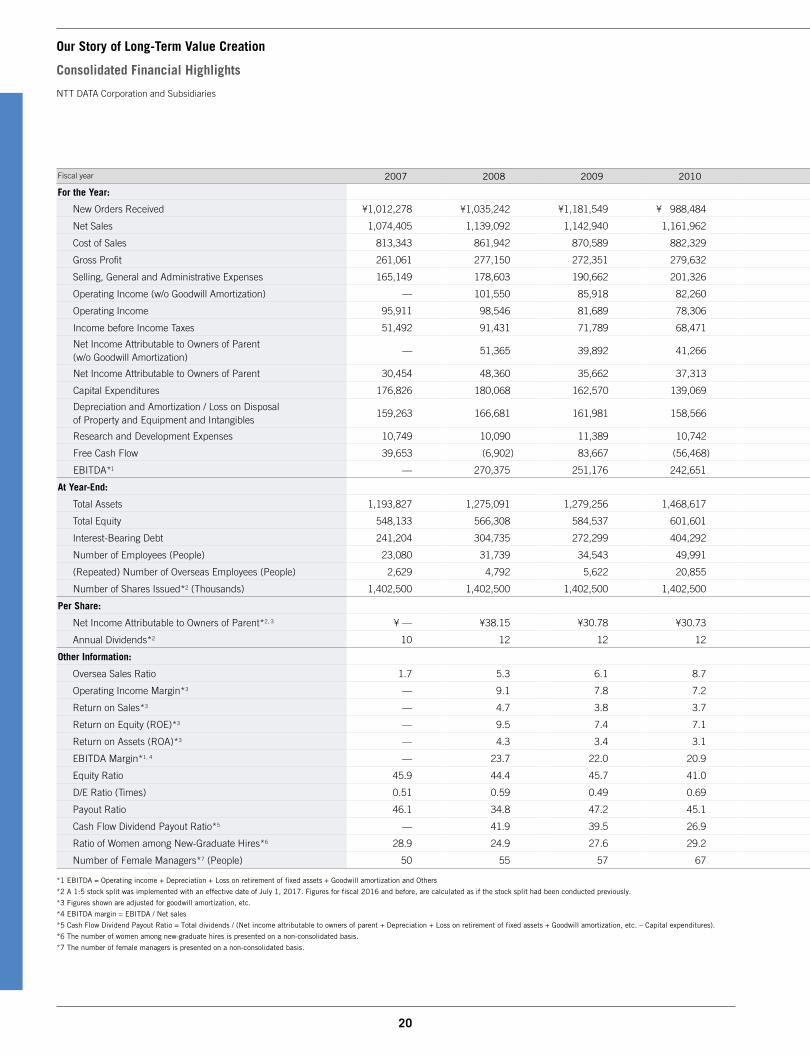
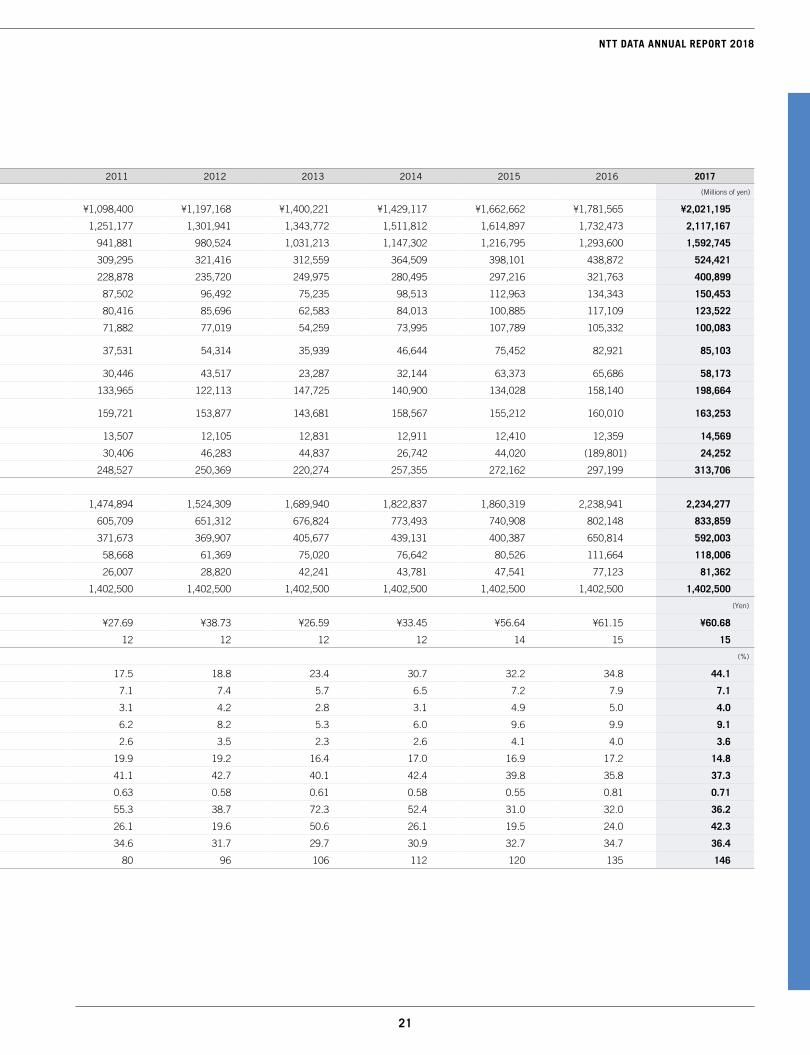
Fiscal year 2007 2008 2009 2010 2011 2012 2013 2014 2015 2016 2017
For the Year: (Millions of yen)
New Orders Received ¥1,012,278 ¥1,035,242 ¥1,181,549 ¥ 988,484 ¥1,098,400 ¥1,197,168 ¥1,400,221 ¥1,429,117 ¥1,662,662 ¥1,781,565 ¥2,021,195
Net Sales 1,074,405 1,139,092 1,142,940 1,161,962 1,251,177 1,301,941 1,343,772 1,511,812 1,614,897 1,732,473 2,117,167
Cost of Sales 813,343 861,942 870,589 882,329 941,881 980,524 1,031,213 1,147,302 1,216,795 1,293,600 1,592,745
Gross Profit 261,061 277,150 272,351 279,632 309,295 321,416 312,559 364,509 398,101 438,872 524,421
Selling, General and Administrative Expenses 165,149 178,603 190,662 201,326 228,878 235,720 249,975 280,495 297,216 321,763 400,899
Operating Income (w/o Goodwill Amortization) — 101,550 85,918 82,260 87,502 96,492 75,235 98,513 112,963 134,343 150,453
Operating Income 95,911 98,546 81,689 78,306 80,416 85,696 62,583 84,013 100,885 117,109 123,522
Income before Income Taxes 51,492 91,431 71,789 68,471 71,882 77,019 54,259 73,995 107,789 105,332 100,083
Net Income Attributable to Owners of Parent (w/o Goodwill Amortization)
— 51,365 39,892 41,266 37,531 54,314 35,939 46,644 75,452 82,921 85,103
Net Income Attributable to Owners of Parent 30,454 48,360 35,662 37,313 30,446 43,517 23,287 32,144 63,373 65,686 58,173
Capital Expenditures 176,826 180,068 162,570 139,069 133,965 122,113 147,725 140,900 134,028 158,140 198,664
Depreciation and Amortization / Loss on Disposal of Property and Equipment and Intangibles
159,263 166,681 161,981 158,566 159,721 153,877 143,681 158,567 155,212 160,010 163,253
Research and Development Expenses 10,749 10,090 11,389 10,742 13,507 12,105 12,831 12,911 12,410 12,359 14,569
Free Cash Flow 39,653 (6,902) 83,667 (56,468) 30,406 46,283 44,837 26,742 44,020 (189,801) 24,252
EBITDA*1 — 270,375 251,176 242,651 248,527 250,369 220,274 257,355 272,162 297,199 313,706
At Year-End:
Total Assets 1,193,827 1,275,091 1,279,256 1,468,617 1,474,894 1,524,309 1,689,940 1,822,837 1,860,319 2,238,941 2,234,277
Total Equity 548,133 566,308 584,537 601,601 605,709 651,312 676,824 773,493 740,908 802,148 833,859
Interest-Bearing Debt 241,204 304,735 272,299 404,292 371,673 369,907 405,677 439,131 400,387 650,814 592,003
Number of Employees (People) 23,080 31,739 34,543 49,991 58,668 61,369 75,020 76,642 80,526 111,664 118,006
(Repeated) Number of Overseas Employees (People) 2,629 4,792 5,622 20,855 26,007 28,820 42,241 43,781 47,541 77,123 81,362
Number of Shares Issued*2 (Thousands) 1,402,500 1,402,500 1,402,500 1,402,500 1,402,500 1,402,500 1,402,500 1,402,500 1,402,500 1,402,500 1,402,500
Per Share: (Yen)
Net Income Attributable to Owners of Parent*2, 3 ¥ — ¥38.15 ¥30.78 ¥30.73 ¥27.69 ¥38.73 ¥26.59 ¥33.45 ¥56.64 ¥61.15 ¥60.68
Annual Dividends*2 10 12 12 12 12 12 12 12 14 15 15
Other Information: (%)
Oversea Sales Ratio 1.7 5.3 6.1 8.7 17.5 18.8 23.4 30.7 32.2 34.8 44.1
Operating Income Margin*3 — 9.1 7.8 7.2 7.1 7.4 5.7 6.5 7.2 7.9 7.1
Return on Sales*3 — 4.7 3.8 3.7 3.1 4.2 2.8 3.1 4.9 5.0 4.0
Return on Equity (ROE)*3 — 9.5 7.4 7.1 6.2 8.2 5.3 6.0 9.6 9.9 9.1
Return on Assets (ROA)*3 — 4.3 3.4 3.1 2.6 3.5 2.3 2.6 4.1 4.0 3.6
EBITDA Margin*1, 4 — 23.7 22.0 20.9 19.9 19.2 16.4 17.0 16.9 17.2 14.8
Equity Ratio 45.9 44.4 45.7 41.0 41.1 42.7 40.1 42.4 39.8 35.8 37.3
D/E Ratio (Times) 0.51 0.59 0.49 0.69 0.63 0.58 0.61 0.58 0.55 0.81 0.71
Payout Ratio 46.1 34.8 47.2 45.1 55.3 38.7 72.3 52.4 31.0 32.0 36.2
Cash Flow Dividend Payout Ratio*5 — 41.9 39.5 26.9 26.1 19.6 50.6 26.1 19.5 24.0 42.3
Ratio of Women among New-Graduate Hires*6 28.9 24.9 27.6 29.2 34.6 31.7 29.7 30.9 32.7 34.7 36.4
Number of Female Managers*7 (People) 50 55 57 67 80 96 106 112 120 135 146
Our Story of Long-Term Value Creation
Consolidated Financial Highlights
NTT DATA Corporation and Subsidiaries
*1 EBITDA = Operating income + Depreciation + Loss on retirement of fixed assets + Goodwill amortization and Others
*2 A 1:5 stock split was implemented with an effective date of July 1, 2017. Figures for fiscal 2016 and before, are calculated as if the stock split had been conducted previously.
*3 Figures shown are adjusted for goodwill amortization, etc.
*4 EBITDA margin = EBITDA / Net sales
*5 Cash Flow Dividend Payout Ratio = Total dividends / (Net income attributable to owners of parent + Depreciation + Loss on retirement of fixed assets + Goodwill amortization, etc. – Capital expenditures).
*6 The number of women among new-graduate hires is presented on a non-consolidated basis.
*7 The number of female managers is presented on a non-consolidated basis.
21
NTT DATA ANNUAL REPORT 2018
Fiscal year 2007 2008 2009 2010 2011 2012 2013 2014 2015 2016 2017
For the Year: (Millions of yen)
New Orders Received ¥1,012,278 ¥1,035,242 ¥1,181,549 ¥ 988,484 ¥1,098,400 ¥1,197,168 ¥1,400,221 ¥1,429,117 ¥1,662,662 ¥1,781,565 ¥2,021,195
Net Sales 1,074,405 1,139,092 1,142,940 1,161,962 1,251,177 1,301,941 1,343,772 1,511,812 1,614,897 1,732,473 2,117,167
Cost of Sales 813,343 861,942 870,589 882,329 941,881 980,524 1,031,213 1,147,302 1,216,795 1,293,600 1,592,745
Gross Profit 261,061 277,150 272,351 279,632 309,295 321,416 312,559 364,509 398,101 438,872 524,421
Selling, General and Administrative Expenses 165,149 178,603 190,662 201,326 228,878 235,720 249,975 280,495 297,216 321,763 400,899
Operating Income (w/o Goodwill Amortization) — 101,550 85,918 82,260 87,502 96,492 75,235 98,513 112,963 134,343 150,453
Operating Income 95,911 98,546 81,689 78,306 80,416 85,696 62,583 84,013 100,885 117,109 123,522
Income before Income Taxes 51,492 91,431 71,789 68,471 71,882 77,019 54,259 73,995 107,789 105,332 100,083
Net Income Attributable to Owners of Parent (w/o Goodwill Amortization)
— 51,365 39,892 41,266 37,531 54,314 35,939 46,644 75,452 82,921 85,103
Net Income Attributable to Owners of Parent 30,454 48,360 35,662 37,313 30,446 43,517 23,287 32,144 63,373 65,686 58,173
Capital Expenditures 176,826 180,068 162,570 139,069 133,965 122,113 147,725 140,900 134,028 158,140 198,664
Depreciation and Amortization / Loss on Disposal of Property and Equipment and Intangibles
159,263 166,681 161,981 158,566 159,721 153,877 143,681 158,567 155,212 160,010 163,253
Research and Development Expenses 10,749 10,090 11,389 10,742 13,507 12,105 12,831 12,911 12,410 12,359 14,569
Free Cash Flow 39,653 (6,902) 83,667 (56,468) 30,406 46,283 44,837 26,742 44,020 (189,801) 24,252
EBITDA*1 — 270,375 251,176 242,651 248,527 250,369 220,274 257,355 272,162 297,199 313,706
At Year-End:
Total Assets 1,193,827 1,275,091 1,279,256 1,468,617 1,474,894 1,524,309 1,689,940 1,822,837 1,860,319 2,238,941 2,234,277
Total Equity 548,133 566,308 584,537 601,601 605,709 651,312 676,824 773,493 740,908 802,148 833,859
Interest-Bearing Debt 241,204 304,735 272,299 404,292 371,673 369,907 405,677 439,131 400,387 650,814 592,003
Number of Employees (People) 23,080 31,739 34,543 49,991 58,668 61,369 75,020 76,642 80,526 111,664 118,006
(Repeated) Number of Overseas Employees (People) 2,629 4,792 5,622 20,855 26,007 28,820 42,241 43,781 47,541 77,123 81,362
Number of Shares Issued*2 (Thousands) 1,402,500 1,402,500 1,402,500 1,402,500 1,402,500 1,402,500 1,402,500 1,402,500 1,402,500 1,402,500 1,402,500
Per Share: (Yen)
Net Income Attributable to Owners of Parent*2, 3 ¥ — ¥38.15 ¥30.78 ¥30.73 ¥27.69 ¥38.73 ¥26.59 ¥33.45 ¥56.64 ¥61.15 ¥60.68
Annual Dividends*2 10 12 12 12 12 12 12 12 14 15 15
Other Information: (%)
Oversea Sales Ratio 1.7 5.3 6.1 8.7 17.5 18.8 23.4 30.7 32.2 34.8 44.1
Operating Income Margin*3 — 9.1 7.8 7.2 7.1 7.4 5.7 6.5 7.2 7.9 7.1
Return on Sales*3 — 4.7 3.8 3.7 3.1 4.2 2.8 3.1 4.9 5.0 4.0
Return on Equity (ROE)*3 — 9.5 7.4 7.1 6.2 8.2 5.3 6.0 9.6 9.9 9.1
Return on Assets (ROA)*3 — 4.3 3.4 3.1 2.6 3.5 2.3 2.6 4.1 4.0 3.6
EBITDA Margin*1, 4 — 23.7 22.0 20.9 19.9 19.2 16.4 17.0 16.9 17.2 14.8
Equity Ratio 45.9 44.4 45.7 41.0 41.1 42.7 40.1 42.4 39.8 35.8 37.3
D/E Ratio (Times) 0.51 0.59 0.49 0.69 0.63 0.58 0.61 0.58 0.55 0.81 0.71
Payout Ratio 46.1 34.8 47.2 45.1 55.3 38.7 72.3 52.4 31.0 32.0 36.2
Cash Flow Dividend Payout Ratio*5 — 41.9 39.5 26.9 26.1 19.6 50.6 26.1 19.5 24.0 42.3
Ratio of Women among New-Graduate Hires*6 28.9 24.9 27.6 29.2 34.6 31.7 29.7 30.9 32.7 34.7 36.4
Number of Female Managers*7 (People) 50 55 57 67 80 96 106 112 120 135 146

22 23
Year-End Order Backlog Net Sales
2007FY 2008 2009 2010 2011 2012 2013 2014 2015 2016 20170
500
1,000
1,500
2,500
2,0002,117.1
2,371.5
0
60
120
180
0
4
8
12
7.17.1
150.4150.4
5.85.8
2007 2008 2009 2010 2011 2012 2013 2014 2015 2016 2017
123.5
FY
Net Income Attributable to Owners of Parent
Net Income Attributable to Owners of Parent
(w/o Goodwill Amortization)
0
50
100
150
200198.6
2007 2008 2009 2010 2011 2012 2013 2014 2015 2016 2017
163.2
FY
9.1
7.1
3.6
2.6
0
3
6
9
12
2007 2008 2009 2010 2011 2012 2013 2014 2015 2016 2017FY
EBITDA (left)
EBITDA Margin (right)*1 EBITDA = Operating income + Depreciation + Loss on
retirement of fixed assets + Goodwill amortization and Others
0
200
100
400
300
0
10
20
30
40
14.814.8
313.7
2007 2008 2009 2010 2011 2012 2013 2014 2015 2016 2017FY
Capital Expenditures
Depreciation and Amortization / Loss on Disposal of
Property and Equipment and Intangibles
Return on Equity (ROE) / Return on Assets (ROA)
ROE and ROA both declined due to lower net income attributable to owners of parent.
ROE (Adjustment for Goodwill Amortization, etc.) ROE
ROA (Adjustment for Goodwill Amortization, etc.) ROA
EBITDA*1 / EBITDA Margin
EBITDA remained on a solid upward trend in line with growth in operating income and other factors.
Capital Expenditures / Depreciation and Amortization / Loss on Disposal of Property and Equipment and Intangibles
Capital expenditures increased in line with the expansion of business in Japan and the acquisition of the former Dell Services. Depreciation and amortization / loss on disposal of property and equipment and intangibles rose due to the acquisition of the former Dell Services.
Net Income Attributable to Owners of Parent
Net income attributable to owners of parent decreased due to the impact of gain on sales of investment securities in the previous fiscal year despite an increase in operating income.
Operating Income (left)
Operating Income (w/o Goodwill Amortization) (left)
Operating Income Margin (right)
Operating Income Margin
(Adjusted for Goodwill Amortization, etc.) (right)
Operating Income / Operating Income Margin
Despite the impact of lower profits due to an unprofitable project, higher sales in the Financial and Enterprise & Solutions businesses resulted in increased operating income.
Order Backlog / Net Sales
Net sales increased due to business expansion in line with the acquisition of the former Dell Services in North America, an increase in the number of months for consolidation due to the unification of the accounting periods of some overseas Group companies, business expansion in Spain, Germany, and Latin America, and increased scale of digital-related businesses and busi-nesses for manufacturing industry, including M&As, in Japan. Order backlog remained at a high level as in the previous fiscal year.
Our Story of Long-Term Value Creation
Consolidated Financial Highlights
NTT DATA Corporation and Subsidiaries
0
30
60
9085.1
58.1
2007 2008 2009 2010 2011 2012 2013 2014 2015 2016 2017FY
(Billions of yen)
(Billions of yen)
(Billions of yen) (%)
(%)
(Billions of yen)
(Billions of yen) (%)

23
NTT DATA ANNUAL REPORT 2018
24.2
–200
–150
–100
–50
0
50
100
2007 2008 2009 2010 2011 2012 2013 2014 2015 2016 2017FY0
800
1,600
2,400
0
20
40
60
37.337.3
2,234.2
833.8
2007 2008 2009 2010 2011 2012 2013 2014 2015 2016 2017FY
EPS (Adjusted for Goodwill Amortization etc.) (left)
Operating Income Growth Rate
(Adjusted for Goodwill Amortization etc.) (right)*2 Regarding EPS, please see note (*2) on P.20.
60.68
–40
0
80
40
–30
0
60
30
9.79.7
2007 2008 2009 2010 2011 2012 2013 2014 2015 2016 2017FY
Annual Dividends per Share*3 / Cash Flow Dividend Payout Ratio
Based on performance trends and financial condi-tions, we pay stable dividends considering the overall balance between expenditures including investments on business and dividends. In terms of our share-holder returns policy, we focus on maintaining the consolidated cash flow dividend payout ratio over the medium- to long-term.
Annual Dividends per Share (left)
Cash Flow Dividend Payout Ratio (right)
Cash Flow Dividend Payout Ratio
(Weighted Average of Past 5 Years) (right)
*3 Regarding annual dividends per share, please see note (*2) on P.20.
2007 2008 2009 2010 2011 2012 2013 2014 2015 2016 2017
1,270.8
0
500
1,000
1,500
FY
Interest-Bearing Debt (left)
D/E Ratio (right)
592.0
0
200
400
600
800
0
0.3
0.6
0.9
1.2
2007 2008 2009 2010 2011 2012 2013 2014 2015 2016 2017
0.710.71
FY
Invested Capital
Recognizing that we are in a revenue growth stage based on medium- to long-term strategies, we will continue to increase business investments to achieve sustainable growth going forward.
EPS(Adjusted for Goodwill Amortization, etc.)*2 / Operating Income Growth Rate (Adjusted for Goodwill Amortization, etc.)
EPS declined due to lower net income attributable to owners of parent.
Interest-Bearing Debt / D/E Ratio
The D/E ratio improved by 0.1 on the contraction of interest-bearing debt and other factors.
Total Assets (left) Total Equity (left)
Equity Ratio (right)
Total Assets / Total Equity / Equity Ratio
Despite a decrease in liabilities due to the constriction of interest-bearing debt, higher retained earnings resulted in an increase in equity, thus total assets remained at the same level as in the previous fiscal year.
Free Cash Flow
Although cash flows from operating activities remained nearly the same as in the previous fiscal year, a reduction in payments associated with the acquisition of the former Dell Services in the previous fiscal year substantially reduced cash flows used in investing activities, causing free cash flow to increase.
(Billions of yen)
(Yen) (%)
(Billions of yen) (%)
(Yen) (%)
(Billions of yen) (Times)
(Billions of yen)
42.342.3
28.428.4
15
0
6
12
18
0
20
40
60
2007 2008 2009 2010 2011 2012 2013 2014 2015 2016 2017FY
24 25
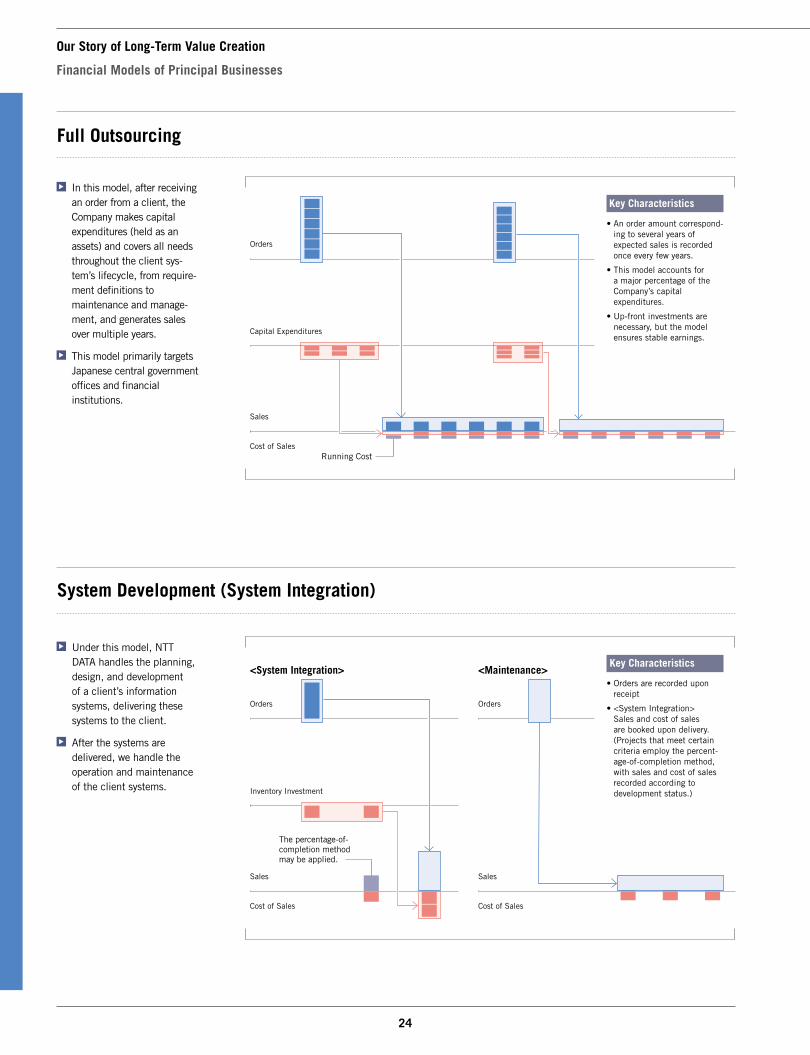
Full Outsourcing
In this model, after receiving an order from a client, the Company makes capital expenditures (held as an assets) and covers all needs throughout the client sys-tem’s lifecycle, from require-ment definitions to maintenance and manage-ment, and generates sales over multiple years.
This model primarily targets Japanese central government offices and financial institutions.
Orders
Capital Expenditures
Sales
Cost of SalesRunning Cost
Key Characteristics
• An order amount correspond-ing to several years of expected sales is recorded once every few years.
• This model accounts for a major percentage of the Company’s capital expenditures.
• Up-front investments are necessary, but the model ensures stable earnings.
<System Integration> <Maintenance>
Orders
Inventory Investment
Sales
Cost of Sales
The percentage-of-completion method may be applied.
Orders
Sales
Cost of Sales
System Development (System Integration)
Under this model, NTT DATA handles the planning, design, and development of a client’s information systems, delivering these systems to the client.
After the systems are delivered, we handle the operation and maintenance of the client systems.
Key Characteristics
• Orders are recorded upon receipt
• <System Integration> Sales and cost of sales are booked upon delivery. (Projects that meet certain criteria employ the percent-age-of-completion method, with sales and cost of sales recorded according to development status.)
Our Story of Long-Term Value Creation
Financial Models of Principal Businesses
25
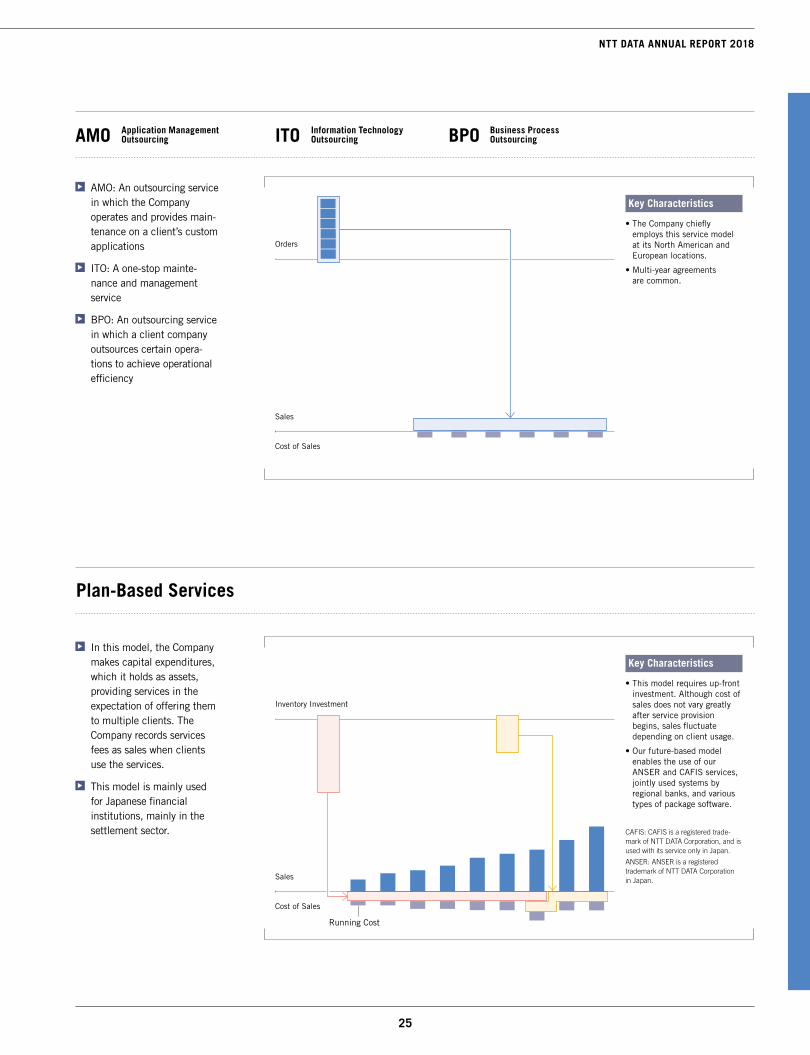
NTT DATA ANNUAL REPORT 2018
AMO ITO BPOApplication Management Outsourcing
Information Technology Outsourcing
Business Process Outsourcing
Orders
Sales
Cost of Sales
Inventory Investment
Sales
Cost of Sales
Running Cost
AMO: An outsourcing service in which the Company operates and provides main-tenance on a client’s custom applications
ITO: A one-stop mainte-nance and management service
BPO: An outsourcing service in which a client company outsources certain opera-tions to achieve operational efficiency
Key Characteristics
• The Company chiefly employs this service model at its North American and European locations.
• Multi-year agreements are common.
Plan-Based Services
In this model, the Company makes capital expenditures, which it holds as assets, providing services in the expectation of offering them to multiple clients. The Company records services fees as sales when clients use the services.
This model is mainly used for Japanese financial institutions, mainly in the settlement sector.
Key Characteristics
• This model requires up-front investment. Although cost of sales does not vary greatly after service provision begins, sales fluctuate depending on client usage.
• Our future-based model enables the use of our ANSER and CAFIS services, jointly used systems by regional banks, and various types of package software.
CAFIS: CAFIS is a registered trade-mark of NTT DATA Corporation, and is used with its service only in Japan.
ANSER: ANSER is a registered trademark of NTT DATA Corporation in Japan.

26 27
Overview and Progress on “NTT DATA: ASCEND,” Our Medium-Term Management Plan
Medium-Term Management Plan Overview
Under the current Medium-Term Management Plan (fiscal 2016–2018), we are increasing our local presence and targeting consolidated net sales of over ¥2 trillion and a 50% or higher
increase in adjusted operating income (compared to fiscal 2015). We are executing the global strategies of “Game-Changing Approach” and “Breakthrough Technology.”
Sound Financial Ground(Managing ROI and D/E ratio, stable payout of dividends)
Fiscal 2016–2018* Compared to fiscal 2015 (Adjusted for incremental investments in new fields)
Fiscal 2018 Financial Objectives
Net Sales
Over ¥2 trillion
Adjusted Operating Income
+50 %*
Breakthrough Technology
Outside JapanScale Expansion and Quality Improvement
• Inorganic growth (North America, EMEA, and others)
• Implement game-changing approaches and improve profitability by increasing our share and scope of services
• Viewing changes in the business environment and technological innovations in the global market as opportunities, we will accelerate the creation of new markets and expand our market share in each region. We will also engage in global cooperation to expand our provision of solutions and services while promoting improved global project support capabilities to move into areas where we could not operate in the past.
• Quickly and flexibly provide services and systems comprising the core of client competitiveness through production technology innovations
• Create new mechanisms and businesses with clients leveraging cutting-edge technologies by enhancing technological capabilities in the digital domain and engaging in business alliances with other companies that possess strong technological capabilities
Global Synergy
• Innovate production technology / Spark new ideas and technologies
• Global Accounts / Global Delivery / Global Offering / Global Talents
Game-Changing Approach
Achievements Up to Now and Future Prospects
JapanStable Growth
• Implement game-changing approaches to regrow our business
• Take thorough control of unprofitable projects• Secure profits required for growth investment
by sharpening competitive edges
20162015FY FY2017 2018(Forecast)
IFRS
20162015 2017 2018(Forecast)
¥1,732.4 billion
¥1,614.8 billion
JGAAP JGAAPIFRS
¥2,039.7 billion¥2,100.0 billion
¥117.1 billion
¥100.8 billion
¥123.1 billion
¥152.0 billion*
* Excludes additional investment of ¥10.0 billion in new fields
Net Sales Operating Income
Businesses in Japan and overseas are growing sustainably.We expect to achieve our targets in fiscal 2018, the final year of the current Medium-Term Management Plan.
27
NTT DATA ANNUAL REPORT 2018
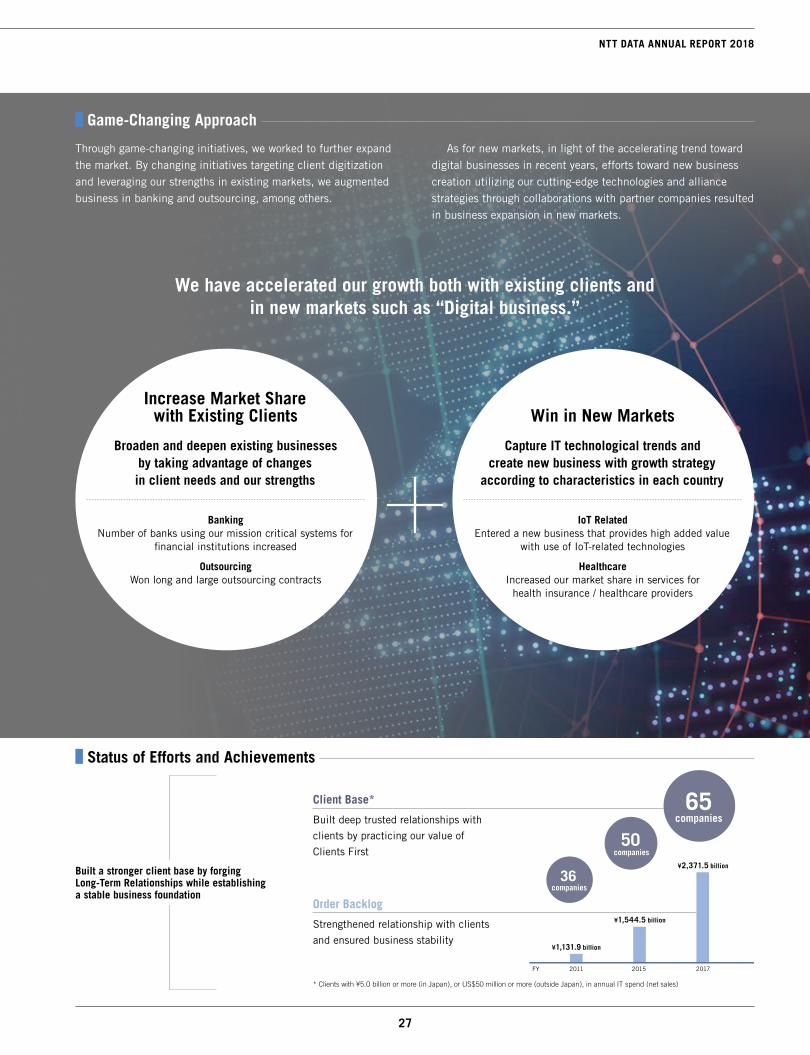
Game-Changing Approach
Through game-changing initiatives, we worked to further expand the market. By changing initiatives targeting client digitization and leveraging our strengths in existing markets, we augmented business in banking and outsourcing, among others.
As for new markets, in light of the accelerating trend toward digital businesses in recent years, efforts toward new business creation utilizing our cutting-edge technologies and alliance strategies through collaborations with partner companies resulted in business expansion in new markets.
We have accelerated our growth both with existing clients and in new markets such as “Digital business.”
Increase Market Share with Existing Clients
Broaden and deepen existing businesses by taking advantage of changes in client needs and our strengths
BankingNumber of banks using our mission critical systems for
financial institutions increased
OutsourcingWon long and large outsourcing contracts
Status of Efforts and Achievements
Win in New Markets
Capture IT technological trends and create new business with growth strategy
according to characteristics in each country
IoT RelatedEntered a new business that provides high added value
with use of IoT-related technologies
HealthcareIncreased our market share in services for
health insurance / healthcare providers
Built a stronger client base by forging Long-Term Relationships while establishing a stable business foundation
* Clients with ¥5.0 billion or more (in Japan), or US$50 million or more (outside Japan), in annual IT spend (net sales)
36companies
50companies
65companies
Client Base*
Built deep trusted relationships with
clients by practicing our value of
Clients First
Order Backlog
Strengthened relationship with clients
and ensured business stability
2015 20172011FY
¥1,131.9 billion
¥1,544.5 billion
¥2,371.5 billion
28 29
Overview and Progress on “NTT DATA: ASCEND,” Our Medium-Term Management Plan
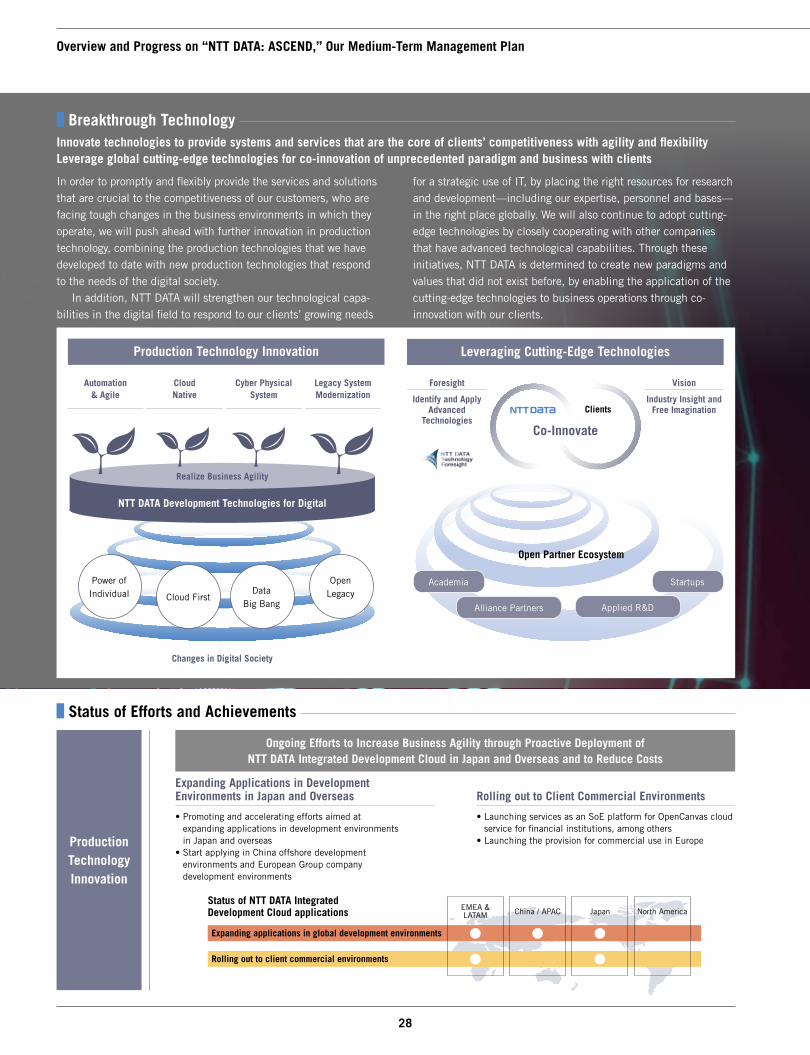
Breakthrough Technology Innovate technologies to provide systems and services that are the core of clients’ competitiveness with agility and flexibilityLeverage global cutting-edge technologies for co-innovation of unprecedented paradigm and business with clients
In order to promptly and flexibly provide the services and solutions that are crucial to the competitiveness of our customers, who are facing tough changes in the business environments in which they operate, we will push ahead with further innovation in production technology, combining the production technologies that we have developed to date with new production technologies that respond to the needs of the digital society. In addition, NTT DATA will strengthen our technological capa-bilities in the digital field to respond to our clients’ growing needs
for a strategic use of IT, by placing the right resources for research and development—including our expertise, personnel and bases—in the right place globally. We will also continue to adopt cutting-edge technologies by closely cooperating with other companies that have advanced technological capabilities. Through these initiatives, NTT DATA is determined to create new paradigms and values that did not exist before, by enabling the application of the cutting-edge technologies to business operations through co-innovation with our clients.
Production Technology Innovation Leveraging Cutting-Edge Technologies
NTT DATA Development Technologies for Digital
Changes in Digital Society
Automation & Agile
Cloud Native
Cyber Physical System
Legacy System Modernization
Power of Individual Cloud First
Data Big Bang
Open Legacy
Vision
Industry Insight and Free Imagination
Foresight
Identify and Apply Advanced
TechnologiesCo-Innovate
Clients
Open Partner Ecosystem
Academia
Realize Business Agility
Alliance Partners Applied R&D
Startups
Status of Efforts and Achievements
Production Technology Innovation
Ongoing Efforts to Increase Business Agility through Proactive Deployment of NTT DATA Integrated Development Cloud in Japan and Overseas and to Reduce Costs
Expanding Applications in Development Environments in Japan and Overseas
• Promoting and accelerating efforts aimed at expanding applications in development environments in Japan and overseas
• Start applying in China offshore development environments and European Group company development environments
Status of NTT DATA Integrated Development Cloud applications
Expanding applications in global development environments
Rolling out to client commercial environments
EMEA & LATAM
China / APAC
Japan
North America
Rolling out to Client Commercial Environments
• Launching services as an SoE platform for OpenCanvas cloud service for financial institutions, among others
• Launching the provision for commercial use in Europe
29
NTT DATA ANNUAL REPORT 2018
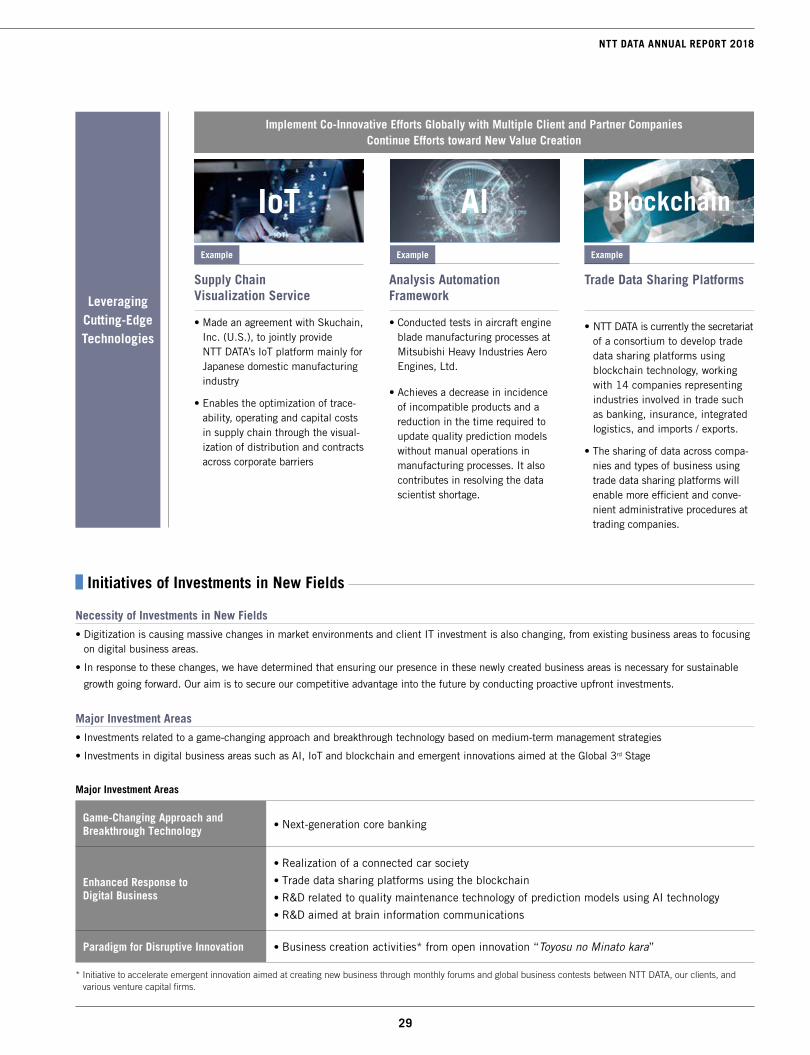
Leveraging Cutting-Edge Technologies
Implement Co-Innovative Efforts Globally with Multiple Client and Partner CompaniesContinue Efforts toward New Value Creation
Supply Chain Visualization Service
• Made an agreement with Skuchain, Inc. (U.S.), to jointly provide NTT DATA’s IoT platform mainly for Japanese domestic manufacturing industry
• Enables the optimization of trace-ability, operating and capital costs in supply chain through the visual-ization of distribution and contracts across corporate barriers
Analysis Automation Framework
• Conducted tests in aircraft engine blade manufacturing processes at Mitsubishi Heavy Industries Aero Engines, Ltd.
• Achieves a decrease in incidence of incompatible products and a reduction in the time required to update quality prediction models without manual operations in manufacturing processes. It also contributes in resolving the data scientist shortage.
Trade Data Sharing Platforms
• NTT DATA is currently the secretariat of a consortium to develop trade data sharing platforms using blockchain technology, working with 14 companies representing industries involved in trade such as banking, insurance, integrated logistics, and imports / exports.
• The sharing of data across compa-nies and types of business using trade data sharing platforms will enable more efficient and conve-nient administrative procedures at trading companies.
Initiatives of Investments in New Fields
IoT AI Blockchain
Necessity of Investments in New Fields
• Digitization is causing massive changes in market environments and client IT investment is also changing, from existing business areas to focusing on digital business areas.
• In response to these changes, we have determined that ensuring our presence in these newly created business areas is necessary for sustainable
growth going forward. Our aim is to secure our competitive advantage into the future by conducting proactive upfront investments.
Major Investment Areas
• Investments related to a game-changing approach and breakthrough technology based on medium-term management strategies
• Investments in digital business areas such as AI, IoT and blockchain and emergent innovations aimed at the Global 3rd Stage
Major Investment Areas
Game-Changing Approach and Breakthrough Technology • Next-generation core banking
Enhanced Response to Digital Business
• Realization of a connected car society
• Trade data sharing platforms using the blockchain
• R&D related to quality maintenance technology of prediction models using AI technology
• R&D aimed at brain information communications
Paradigm for Disruptive Innovation • Business creation activities* from open innovation “Toyosu no Minato kara”
* Initiative to accelerate emergent innovation aimed at creating new business through monthly forums and global business contests between NTT DATA, our clients, and various venture capital firms.
ExampleExample Example
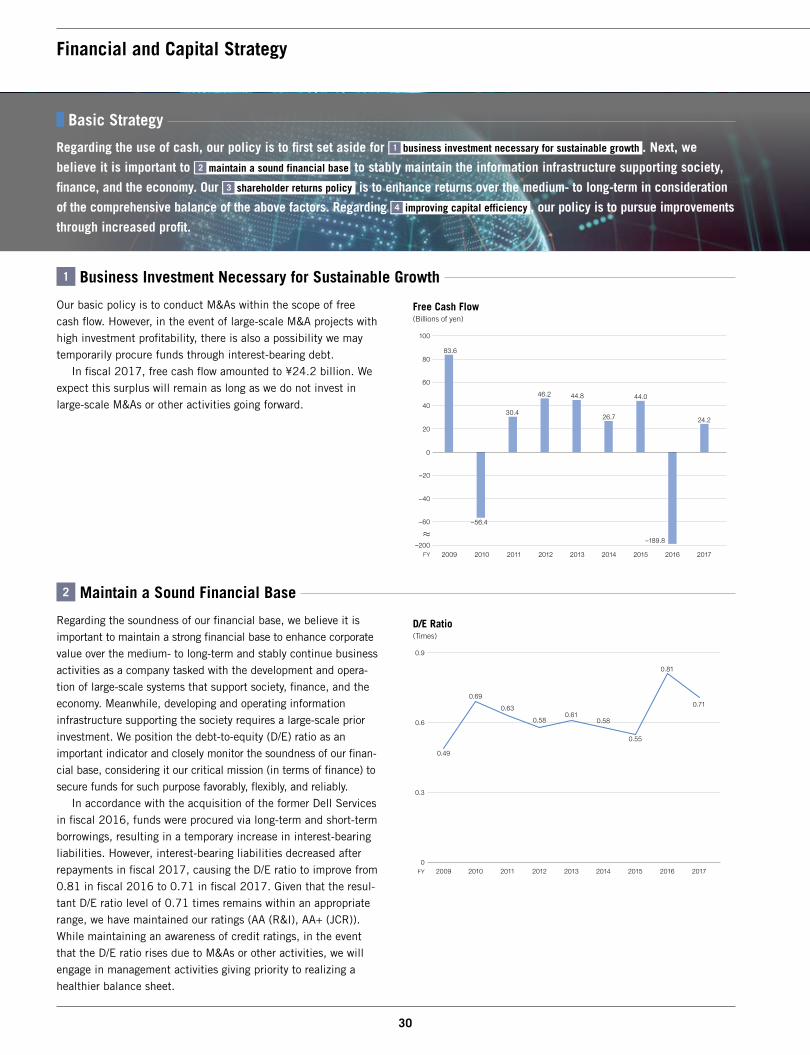
30 31
2 Maintain a Sound Financial Base
Regarding the soundness of our financial base, we believe it is important to maintain a strong financial base to enhance corporate value over the medium- to long-term and stably continue business activities as a company tasked with the development and opera-tion of large-scale systems that support society, finance, and the economy. Meanwhile, developing and operating information infrastructure supporting the society requires a large-scale prior investment. We position the debt-to-equity (D/E) ratio as an important indicator and closely monitor the soundness of our finan-cial base, considering it our critical mission (in terms of finance) to secure funds for such purpose favorably, flexibly, and reliably. In accordance with the acquisition of the former Dell Services in fiscal 2016, funds were procured via long-term and short-term borrowings, resulting in a temporary increase in interest-bearing liabilities. However, interest-bearing liabilities decreased after repayments in fiscal 2017, causing the D/E ratio to improve from 0.81 in fiscal 2016 to 0.71 in fiscal 2017. Given that the resul-tant D/E ratio level of 0.71 times remains within an appropriate range, we have maintained our ratings (AA (R&I), AA+ (JCR)). While maintaining an awareness of credit ratings, in the event that the D/E ratio rises due to M&As or other activities, we will engage in management activities giving priority to realizing a healthier balance sheet.
Financial and Capital Strategy
1 Business Investment Necessary for Sustainable Growth
Our basic policy is to conduct M&As within the scope of free cash flow. However, in the event of large-scale M&A projects with high investment profitability, there is also a possibility we may temporarily procure funds through interest-bearing debt. In fiscal 2017, free cash flow amounted to ¥24.2 billion. We expect this surplus will remain as long as we do not invest in large-scale M&As or other activities going forward.
Free Cash Flow(Billions of yen)
D/E Ratio(Times)
Basic Strategy
Regarding the use of cash, our policy is to first set aside for business investment necessary for sustainable growth1 . Next, we
believe it is important to maintain a sound financial base2 to stably maintain the information infrastructure supporting society,
finance, and the economy. Our shareholder returns policy3 is to enhance returns over the medium- to long-term in consideration
of the comprehensive balance of the above factors. Regarding improving capital efficiency4 , our policy is to pursue improvements
through increased profit.
FY 201720162015201420132012201120102009
0.81
0.55
0.580.61
0.58
0.63
0.69
0.49
0
0.3
0.6
0.9
0.71
FY
–200
–60
–40
–20
0
20
40
60
80
100
201720162015201420132012201120102009
–189.8
44.0
24.226.7
44.846.2
30.4
83.6
–56.4

31
NTT DATA ANNUAL REPORT 2018
4 Improving Capital Efficiency
In terms of return on equity (ROE), our policy is to maintain a level that exceeds shareholders’ equity costs over the medium- to long-term. In fiscal 2017, ROE was 7.1% and ROE adjusted for goodwill amortization etc., was 9.1%. We recognize that the Company is in a revenue growth stage based on medium- to long-term strategies. Thus, rather than constricting capital equivalent to the denominator of ROE, our basic policy aims to improve capital efficiency via pursing profit growth corresponding to the numerator by proactively setting aside funds for business investment and technological development. To increase profits, we will increase our presence (sales) in global markets including Japan and increase profitability through increased management efficiency in each country to secure the profits necessary for ongoing investments and shareholder returns. In terms of profitability, we will strive to control unprofit-able projects, improve overseas business profitability, increase productivity through production technology innovations and thoroughly monitor performance related to M&A projects. With regard to M&As and other business investments in par-ticular, we have always made decisions based on investment profitability for individual projects and manage planning and performance. Going forward, we will continue enhancing return on investment.
3 Shareholder Returns Policy
We implement stable dividends in light of overall consideration for business trends and financial conditions on a consolidated basis. Such consideration includes achieving a balance among business investments, technological developments aimed at sustainable growth in the future, and the maintenance and strengthening of our financial structure and dividend payments. When determining the dividend amount, we place emphasis on maintaining the medium- to long-term consolidated cash flow dividend payout ratio. In fiscal 2018, we plan to increase the dividend per share by ¥2 compared to the previous fiscal year. Going forward, in the event of changes to the balance between the scale of free cash flow and investment for inorganic growth, we will also consider changes to the shareholder return balance.
* Consolidated cash flow payout ratio = Total dividends / (Net income attributable to owners of parent + Depreciation + Loss on retirement of fixed assets + Goodwill amortization, etc. – Capital expenditures).
ROE ROE (Adjusted for Goodwill Amortization, etc.)
ROE(%)
Cash Flow Dividend Payout Ratio Cash Flow Dividend Payout Ratio (Weighted Average of Past 5 years.)
* IFRS
Cash Flow Dividend Payout Ratio(%)
FY 2017 2018*(Forecast)
20162015201420132012201120102009
42.3
19.5
24.026.1
29.1
50.6
26.9
28.8
27.0
34.135.9
39.5
0
15
30
45
60
28.426.1
19.6
24.9 24.5 28.429.4
26.7
FY 201720162015201420132012201120102009
8.58.4
4.4
3.5
6.9
5.0
6.36.2
9.99.6
6.0
5.3
8.2
6.2
7.17.4
0
2.0
4.0
6.0
8.0
10.0
12.0
7.1
9.1
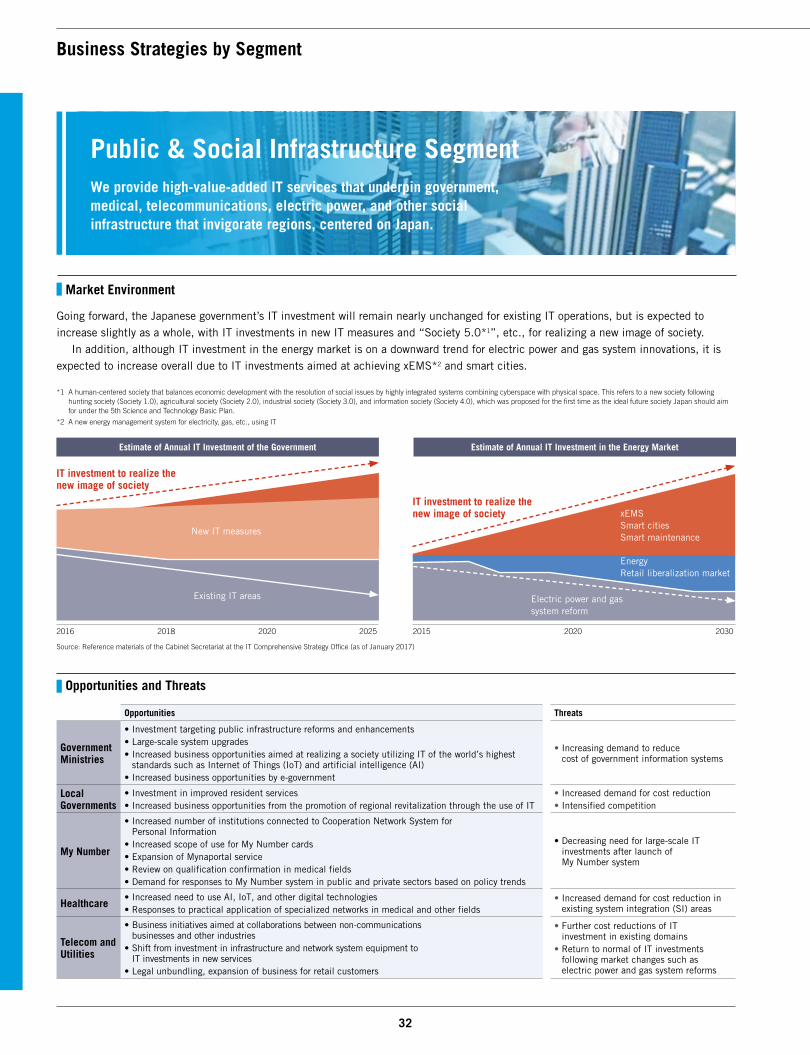
32 33
Business Strategies by Segment
Market Environment
Going forward, the Japanese government’s IT investment will remain nearly unchanged for existing IT operations, but is expected to increase slightly as a whole, with IT investments in new IT measures and “Society 5.0*1”, etc., for realizing a new image of society. In addition, although IT investment in the energy market is on a downward trend for electric power and gas system innovations, it is expected to increase overall due to IT investments aimed at achieving xEMS*2 and smart cities.
We provide high-value-added IT services that underpin government, medical, telecommunications, electric power, and other social infrastructure that invigorate regions, centered on Japan.
Public & Social Infrastructure Segment
Estimate of Annual IT Investment of the Government Estimate of Annual IT Investment in the Energy Market
Existing IT areas
New IT measures
Electric power and gassystem reform
xEMSSmart citiesSmart maintenance
EnergyRetail liberalization market
IT investment to realize the new image of society
2016 20252018 2020 2015 20302020
Opportunities and Threats
Opportunities Threats
Government Ministries
• Investment targeting public infrastructure reforms and enhancements • Large-scale system upgrades• Increased business opportunities aimed at realizing a society utilizing IT of the world’s highest
standards such as Internet of Things (IoT) and artificial intelligence (AI)• Increased business opportunities by e-government
• Increasing demand to reduce cost of government information systems
Local Governments
• Investment in improved resident services• Increased business opportunities from the promotion of regional revitalization through the use of IT
• Increased demand for cost reduction • Intensified competition
My Number
• Increased number of institutions connected to Cooperation Network System for Personal Information
• Increased scope of use for My Number cards• Expansion of Mynaportal service• Review on qualification confirmation in medical fields• Demand for responses to My Number system in public and private sectors based on policy trends
• Decreasing need for large-scale IT investments after launch of My Number system
Healthcare• Increased need to use AI, IoT, and other digital technologies• Responses to practical application of specialized networks in medical and other fields
• Increased demand for cost reduction in existing system integration (SI) areas
Telecom and Utilities
• Business initiatives aimed at collaborations between non-communications businesses and other industries
• Shift from investment in infrastructure and network system equipment to IT investments in new services
• Legal unbundling, expansion of business for retail customers
• Further cost reductions of IT investment in existing domains
• Return to normal of IT investments following market changes such as electric power and gas system reforms
Source: Reference materials of the Cabinet Secretariat at the IT Comprehensive Strategy Office (as of January 2017)
*1 A human-centered society that balances economic development with the resolution of social issues by highly integrated systems combining cyberspace with physical space. This refers to a new society following hunting society (Society 1.0), agricultural society (Society 2.0), industrial society (Society 3.0), and information society (Society 4.0), which was proposed for the first time as the ideal future society Japan should aim for under the 5th Science and Technology Basic Plan.
*2 A new energy management system for electricity, gas, etc., using IT
IT investment to realize the new image of society
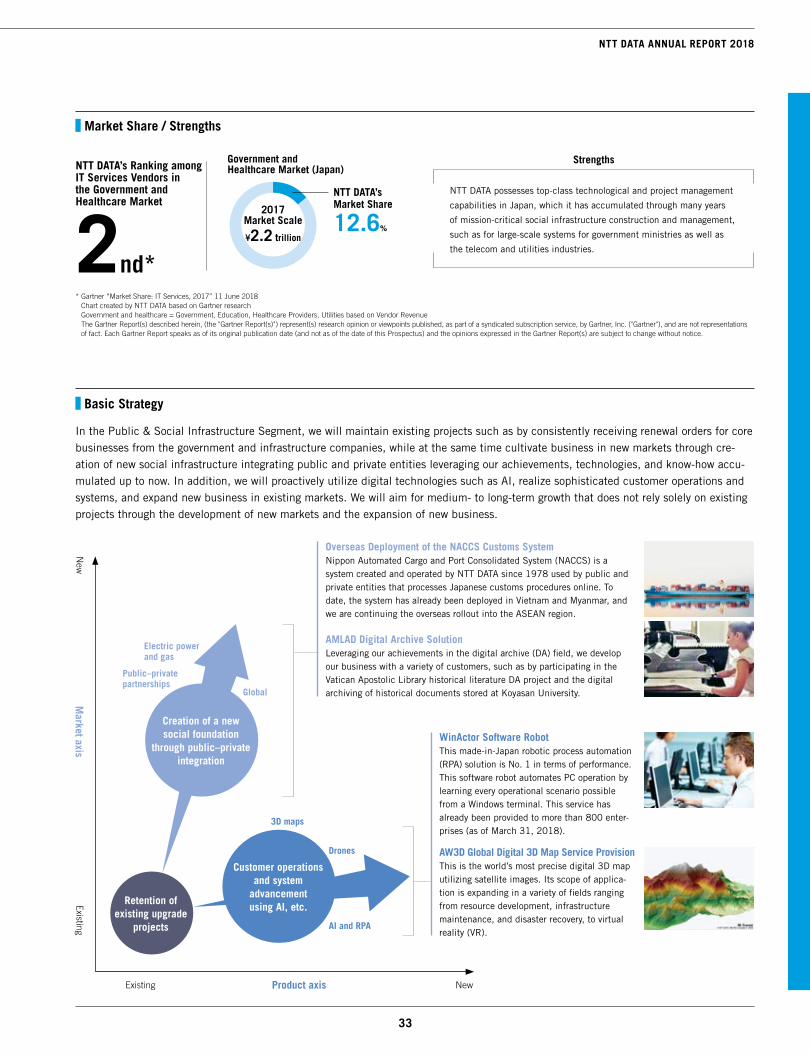
33
NTT DATA ANNUAL REPORT 2018
Overseas Deployment of the NACCS Customs SystemNippon Automated Cargo and Port Consolidated System (NACCS) is a system created and operated by NTT DATA since 1978 used by public and private entities that processes Japanese customs procedures online. To date, the system has already been deployed in Vietnam and Myanmar, and we are continuing the overseas rollout into the ASEAN region.
Market Share / Strengths
xEMSSmart citiesSmart maintenance
In the Public & Social Infrastructure Segment, we will maintain existing projects such as by consistently receiving renewal orders for core businesses from the government and infrastructure companies, while at the same time cultivate business in new markets through cre-ation of new social infrastructure integrating public and private entities leveraging our achievements, technologies, and know-how accu-mulated up to now. In addition, we will proactively utilize digital technologies such as AI, realize sophisticated customer operations and systems, and expand new business in existing markets. We will aim for medium- to long-term growth that does not rely solely on existing projects through the development of new markets and the expansion of new business.
NTT DATA possesses top-class technological and project management
capabilities in Japan, which it has accumulated through many years
of mission-critical social infrastructure construction and management,
such as for large-scale systems for government ministries as well as
the telecom and utilities industries.
Retention of existing upgrade
projects
Market axis
New
Existing
Product axisExisting New
Public–private partnerships
Electric power and gas
Global
3D maps
Drones
AI and RPA
Creation of a new social foundation
through public–private integration
Customer operations and system
advancement using AI, etc.
Basic Strategy
NTT DATA’s Ranking among IT Services Vendors in the Government and Healthcare Market
2nd** Gartner “Market Share: IT Services, 2017” 11 June 2018
Chart created by NTT DATA based on Gartner research Government and healthcare = Government, Education, Healthcare Providers, Utilities based on Vendor Revenue The Gartner Report(s) described herein, (the "Gartner Report(s)") represent(s) research opinion or viewpoints published, as part of a syndicated subscription service, by Gartner, Inc. ("Gartner"), and are not representations of fact. Each Gartner Report speaks as of its original publication date (and not as of the date of this Prospectus) and the opinions expressed in the Gartner Report(s) are subject to change without notice.
2017 Market Scale
¥2.2 trillion
Government and Healthcare Market (Japan)
NTT DATA’s Market Share
12.6%
Strengths
AMLAD Digital Archive SolutionLeveraging our achievements in the digital archive (DA) field, we develop our business with a variety of customers, such as by participating in the Vatican Apostolic Library historical literature DA project and the digital archiving of historical documents stored at Koyasan University.
WinActor Software RobotThis made-in-Japan robotic process automation (RPA) solution is No. 1 in terms of performance. This software robot automates PC operation by learning every operational scenario possible from a Windows terminal. This service has already been provided to more than 800 enter-prises (as of March 31, 2018).
AW3D Global Digital 3D Map Service ProvisionThis is the world’s most precise digital 3D map utilizing satellite images. Its scope of applica-tion is expanding in a variety of fields ranging from resource development, infrastructure maintenance, and disaster recovery, to virtual reality (VR).

34 35
Business Strategies by Segment
Market Environment
The Japan’s Financial Segment’s market environment is undergoing substantial changes, including negative interest rate policies, legal reforms, deregulation and other policy trends, the increasing need to globalize financial businesses, and the rapid deployment of digital technologies. Due to these changes, entry of new players and emergence of new financial businesses are expected.
Opportunities and Threats
Opportunities Threats
Banking
• Increased need for the provision of services utilizing FinTech and other new technologies and legislative support (Banking Act amendments, deregulation)
• Increased need for operational efficiency, automation, and other cost reduction measures
• Aggressive investment in digital domains• Aggressive promotion of globalization (major corporations)• Active IT investment in light of business integration, restructuring, and alliances
(smaller corporations)
• Curbed IT investment to strengthen manage-ment foundations
• Decreasing need for investment in the conven-tional system domain (major corporations)
Insurance • Cultivating and strengthening new customer touchpoints, and active IT investment addressing sophistication of information usage
• Curbed IT investment in consideration of reduction in existing insurance products
Securities• Active IT investment in expanding business through asset formation in the retail
segment (supporting shift from savings to investment)
• Investment motivation for addressing system changes
• Concerns over curbed IT investment due to geopolitical risks and environmental changes such as overseas political conditions
Credit
• Expanded IT investment for advanced settlement systems (infrastructure reforms, cashless transactions, etc.)
• Expanded IT investment aimed at strengthening security measures
• Active IT investment aimed at 24-hour, 365-days-a-year support
• Curbed IT investment due to decreasing use of credit cards in line with response to new settle-ment methods
Main External Environment
Provision of financial platforms supporting the needs of
society and industry
Creation of effective and efficient business models utilizing laboratories
and design studios
Development of solutions aimed at cost reductions and improved
customer engagement
Promotion of open innovation
Expectation to NTT DATA
Technology
EconomicsEmergence of new financial services Entry of companies from other industries into the financial sector Spread of sharing economy Acceleration of globalization, and other factors
Society
Politics
Exponential advances in technology Increasing number of projects using AI, robotics, blockchain, and other new technologies Falling startup costs, and other factors
Government promotion of financial innovation and business environment changes Revised Banking Act Deregulation Negative interest rate policies, and other factors
Population decrease and rapidly changing population composition Declining population and birth rate and aging population Depopulation of the countryside Increased purchasing power of digital natives, and other factors
Substantial changes in the financial market
environment
We provide high-value-added IT services that contribute to increased service and operational efficiency, centered on Japanese financial institutions.
Financial Segment
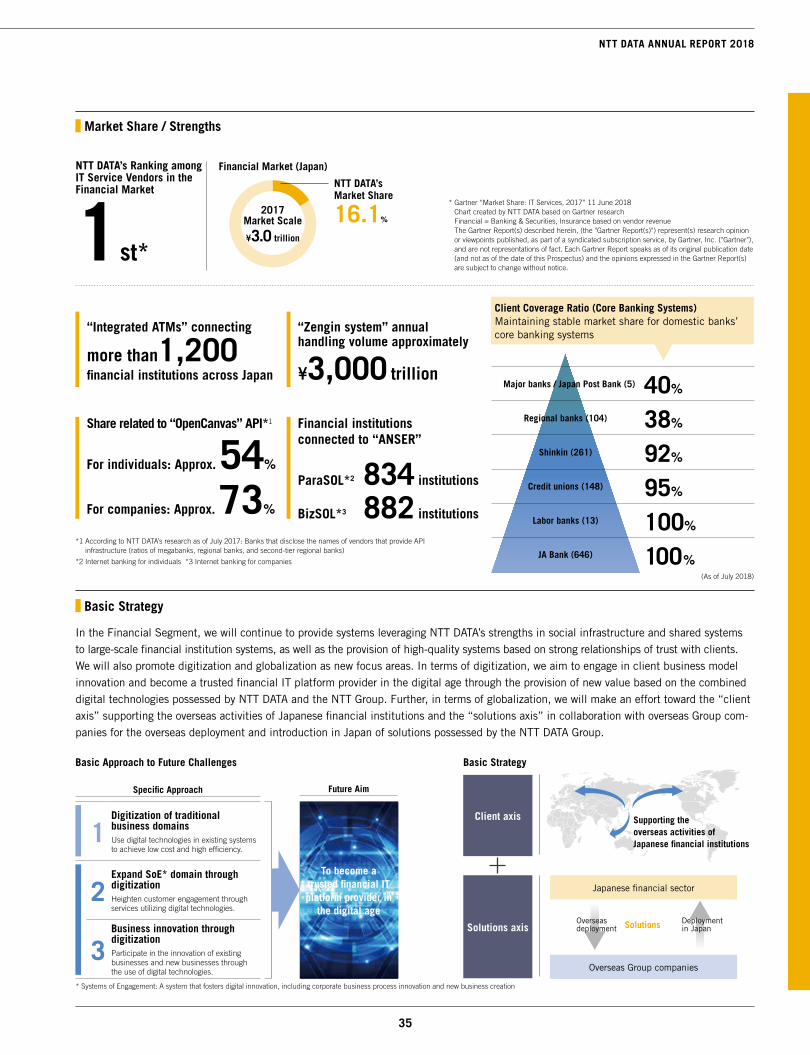
35
NTT DATA ANNUAL REPORT 2018
1Digitization of traditional business domainsUse digital technologies in existing systems to achieve low cost and high efficiency.
2Expand SoE* domain through digitizationHeighten customer engagement through services utilizing digital technologies.
3Business innovation through digitizationParticipate in the innovation of existing businesses and new businesses through the use of digital technologies.
* Gartner “Market Share: IT Services, 2017” 11 June 2018 Chart created by NTT DATA based on Gartner research Financial = Banking & Securities, Insurance based on vendor revenue The Gartner Report(s) described herein, (the "Gartner Report(s)") represent(s) research opinion or viewpoints published, as part of a syndicated subscription service, by Gartner, Inc. ("Gartner"), and are not representations of fact. Each Gartner Report speaks as of its original publication date (and not as of the date of this Prospectus) and the opinions expressed in the Gartner Report(s) are subject to change without notice.
Market Share / Strengths
In the Financial Segment, we will continue to provide systems leveraging NTT DATA’s strengths in social infrastructure and shared systems to large-scale financial institution systems, as well as the provision of high-quality systems based on strong relationships of trust with clients. We will also promote digitization and globalization as new focus areas. In terms of digitization, we aim to engage in client business model innovation and become a trusted financial IT platform provider in the digital age through the provision of new value based on the combined digital technologies possessed by NTT DATA and the NTT Group. Further, in terms of globalization, we will make an effort toward the “client axis” supporting the overseas activities of Japanese financial institutions and the “solutions axis” in collaboration with overseas Group com-panies for the overseas deployment and introduction in Japan of solutions possessed by the NTT DATA Group.
Basic Approach to Future Challenges
“Integrated ATMs” connecting
more than1,200 financial institutions across Japan
Specific Approach
Share related to “OpenCanvas” API*1
For individuals: Approx. 54%
For companies: Approx. 73%
Client Coverage Ratio (Core Banking Systems)Maintaining stable market share for domestic banks’ core banking systems
Major banks / Japan Post Bank (5) 40%
Shinkin (261)
Regional banks (104)
Credit unions (148)
Labor banks (13)
JA Bank (646)
38%
92%
95%
100%
100%
“Zengin system” annual handling volume approximately
¥3,000 trillion
Basic Strategy
To become a trusted financial IT platform provider in
the digital age
Future Aim
Basic Strategy
Client axis
Solutions axis
Supporting the overseas activities of Japanese financial institutions
Japanese financial sector
Overseas Group companies
Deployment in Japan
Overseas deployment Solutions
NTT DATA’s Ranking among IT Service Vendors in the Financial Market
1st*
Financial institutions connected to “ANSER”
ParaSOL*2 834 institutions
BizSOL*3 882 institutions
*1 According to NTT DATA’s research as of July 2017: Banks that disclose the names of vendors that provide API infrastructure (ratios of megabanks, regional banks, and second-tier regional banks)
*2 Internet banking for individuals *3 Internet banking for companies
(As of July 2018)
NTT DATA’s Market Share
16.1%2017
Market Scale
¥3.0 trillion
Financial Market (Japan)
* Systems of Engagement: A system that fosters digital innovation, including corporate business process innovation and new business creation
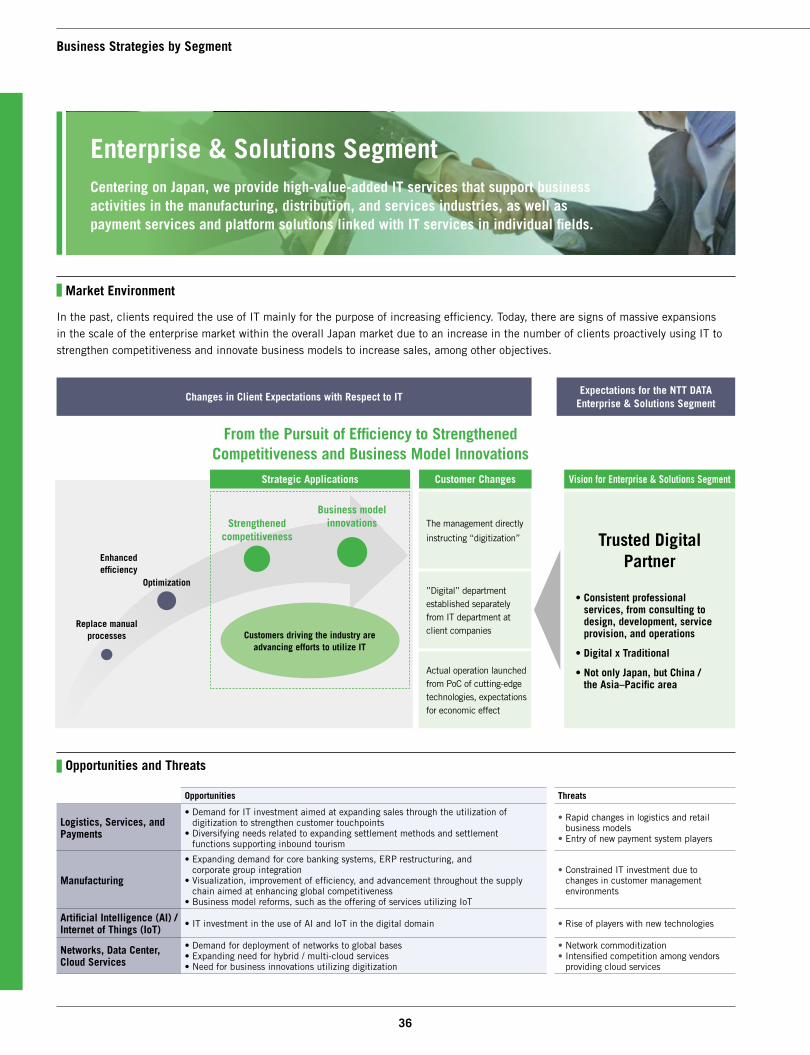
36 37
Market Environment
In the past, clients required the use of IT mainly for the purpose of increasing efficiency. Today, there are signs of massive expansions in the scale of the enterprise market within the overall Japan market due to an increase in the number of clients proactively using IT to strengthen competitiveness and innovate business models to increase sales, among other objectives.
Opportunities and Threats
Opportunities Threats
Logistics, Services, and Payments
• Demand for IT investment aimed at expanding sales through the utilization of digitization to strengthen customer touchpoints
• Diversifying needs related to expanding settlement methods and settlement functions supporting inbound tourism
• Rapid changes in logistics and retail business models
• Entry of new payment system players
Manufacturing
• Expanding demand for core banking systems, ERP restructuring, and corporate group integration
• Visualization, improvement of efficiency, and advancement throughout the supply chain aimed at enhancing global competitiveness
• Business model reforms, such as the offering of services utilizing IoT
• Constrained IT investment due to changes in customer management environments
Artificial Intelligence (AI) / Internet of Things (IoT)
• IT investment in the use of AI and IoT in the digital domain • Rise of players with new technologies
Networks, Data Center, Cloud Services
• Demand for deployment of networks to global bases• Expanding need for hybrid / multi-cloud services• Need for business innovations utilizing digitization
• Network commoditization• Intensified competition among vendors
providing cloud services
Replace manual processes
Optimization
Strengthened competitiveness
Business model innovations
Strategic Applications
Expectations for the NTT DATA Enterprise & Solutions Segment
”Digital” department established separately from IT department at client companiesCustomers driving the industry are
advancing efforts to utilize IT
The management directly
instructing “digitization”
Actual operation launched from PoC of cutting-edge technologies, expectations for economic effect
From the Pursuit of Efficiency to Strengthened Competitiveness and Business Model Innovations
Customer Changes
Changes in Client Expectations with Respect to IT
Enhanced efficiency
Vision for Enterprise & Solutions Segment
Trusted Digital Partner
• Consistent professional services, from consulting to design, development, service provision, and operations
• Digital x Traditional
• Not only Japan, but China / the Asia–Pacific area
Business Strategies by Segment
Centering on Japan, we provide high-value-added IT services that support business activities in the manufacturing, distribution, and services industries, as well as payment services and platform solutions linked with IT services in individual fields.
Enterprise & Solutions Segment

37
NTT DATA ANNUAL REPORT 2018
Strengthen and develop digital commerce and
payments
Proactively deploy AI, IoT, and other
cutting-edge technologies
Global deployment
of ERP
Infrastructure supporting digitization
Market Share / Strengths
In the Enterprise & Solutions Segment, we have defined three growth strategies and four focus areas and are promoting business enhancements and expansion.
Basic Strategy
Solution Service Strengths
Digital commerce • Successful creation of numerous e-commerce and omnichannel systems
AI and IoT
• Successful creation of analytical frameworks, analytical consulting, and infrastructure
• Employ the largest number of embedded software engineers in Japan
ERP • Around 1,000 SAP experts in Japan alone • Global SAP delivery capabilities
Payments• Japan’s largest domestic settlement infrastruc-
ture network supporting a variety of settlement methods
Networks, data centers, and cloud services
• Successful implementation of numerous integra-tion and comprehensive outsourcing projects in the infrastructure domain
Strengths of Each Solution Service
Focus Areas
• Expand business in the retail and logistics sectors with the provision of new services combining digital commerce and payments
• In addition to supporting new settlement methods, enhance value-added services realizing diverse customer experiences
• Provide comprehensive services,
from analytical consulting to analytical operation services that support resolutions for customer operational issues
• Digitalize overall business processes with technological superiority as the starting point
• Supply chain optimization, after-sales service, and smart factory deployment
• Leverage achievements with multinational corporations in the automotive industry, and deploy in the machinery, healthcare, and food and beverage industries
• Deployment from accounting and management administration sectors to global lifecycle management, and logistics systems
• Cultivate infrastructure directors and other upstream human resources
• Provide IT infrastructure service comprehensively, from consulting to integration and operational management
TargetRetail and logistics sectors
and settlement
TargetManufacturing, retail and
logistics industries
TargetManufacturing industry
TargetAll industries
• Focus efforts in industries with advanced customers and industries that are substantially impacted by digitization• Provide new value to clients by leveraging AI, IoT, and other cutting-edge technologies combined with NTT DATA’s accumulated know-how• Seamlessly support global deployment by Japanese corporations
Growth Strategies
NTT DATA’s Ranking among IT Service Vendors in the Enterprise Market
5th*
* Gartner “Market Share: IT Services, 2017” 11 June 2018 Chart created by NTT DATA based on Gartner research Enterprise = Transportation, Wholesale Trade, Communications, Media & Services, Manufacturing & Natural Resources, Retail based on vendor revenue The Gartner Report(s) described herein, (the "Gartner Report(s)") represent(s) research opinion or viewpoints published, as part of a syndicated subscription service, by Gartner, Inc. ("Gartner"), and are not representations of fact. Each Gartner Report speaks as of its original publication date (and not as of the date of this Prospectus) and the opinions expressed in the Gartner Report(s) are subject to change without notice.
2017 Market Scale
¥6.2 trillion
NTT DATA’s Market Share
4.9%
Enterprise Market (Japan)
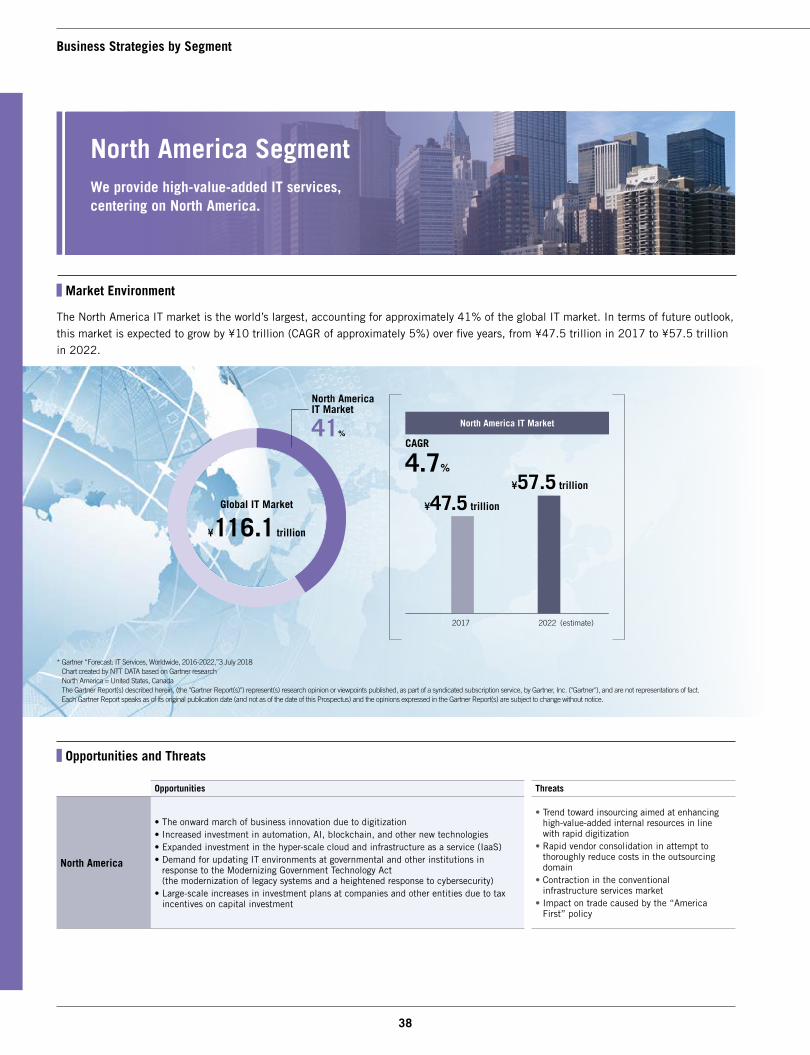
38 39
Market Environment
The North America IT market is the world’s largest, accounting for approximately 41% of the global IT market. In terms of future outlook, this market is expected to grow by ¥10 trillion (CAGR of approximately 5%) over five years, from ¥47.5 trillion in 2017 to ¥57.5 trillion in 2022.
Opportunities and Threats
Opportunities Threats
North America
• The onward march of business innovation due to digitization• Increased investment in automation, AI, blockchain, and other new technologies• Expanded investment in the hyper-scale cloud and infrastructure as a service (IaaS)• Demand for updating IT environments at governmental and other institutions in
response to the Modernizing Government Technology Act (the modernization of legacy systems and a heightened response to cybersecurity)
• Large-scale increases in investment plans at companies and other entities due to tax incentives on capital investment
• Trend toward insourcing aimed at enhancing high-value-added internal resources in line with rapid digitization
• Rapid vendor consolidation in attempt to thoroughly reduce costs in the outsourcing domain
• Contraction in the conventional infrastructure services market
• Impact on trade caused by the “America First” policy
Business Strategies by Segment
Global IT Market
¥116.1 trillion
North America IT Market
41%North America IT Market
2017 2022
CAGR
4.7%
¥47.5 trillion
¥57.5 trillion
(estimate)
* Gartner “Forecast: IT Services, Worldwide, 2016-2022,”3 July 2018 Chart created by NTT DATA based on Gartner research North America = United States, Canada The Gartner Report(s) described herein, (the "Gartner Report(s)") represent(s) research opinion or viewpoints published, as part of a syndicated subscription service, by Gartner, Inc. ("Gartner"), and are not representations of fact. Each Gartner Report speaks as of its original publication date (and not as of the date of this Prospectus) and the opinions expressed in the Gartner Report(s) are subject to change without notice.
We provide high-value-added IT services, centering on North America.
North America Segment

39
NTT DATA ANNUAL REPORT 2018
Inter-Sector Ranking / Strengths
North America Market (Gartner Ranking)
* Gartner “Market Share: IT Services 2017” 11 June 2018 Chart created by NTT DATA based on Gartner research North America = United States, Canada The Gartner Report(s) described herein, (the "Gartner Report(s)") represent(s) research opinion or viewpoints published, as part of a syndicated subscription service, by Gartner, Inc. ("Gartner"), and are not representations of fact. Each Gartner Report speaks as of its original publication date (and not as of the date of this Prospectus) and the opinions expressed in the Gartner Report(s) are subject to change without notice.
41th (As of June 2017)
Category Report Ranking
Healthcare
Everest PEAK Report 2016—Everest Group PEAK Matrix for Provider IT Services Leader
Everest PEAK Report 2017—Everest Group PEAK Matrix for Healthcare Payer IT Services Leader
Everest PEAK Report 2016—Everest Group PEAK Matrix for Healthcare Payer BPO Leader
Strength Areas
29th*(As of June 2018)
Strength Industries
Healthcare Enterprise FinanceGovernment agencies
Category Report Ranking
Cloud HfS Blueprint—IT Infrastructure Management and Enterprise Cloud Services 2017 Winner’s Circle
Workplace Services
Everest Workplace Services—Market Trends and PEAK Matrix Assessment: “End Users are no Less than Customers!”
Leader & Star Performer
ISG Provider Lens Quadrant Report—Digital Workplace Services Leader
Strength Solutions
We are accelerating the development and sales of innovative offerings in digital, cloud and security to help our clients around the globe adapt to changing market dynamics to drive their businesses forward.
Basic Strategy
Accelerate revenue growth • Protect client base
• Accelerate sales of innovative digital offerings, such as AI
• Go to market vertically
Generate Demand and Create Value
Package the portfolio • Shift investment
portfolio to digital with legacy advantage
• Leverage NTT Group’s collective strength
Industrialize delivery • Drive improvements in
process quality and cost of operations through automation
• Build scale in focused areas
Invest in people • Deepen consulting
industry and technology expertise
• Attract and develop talent
Promote Brand & Innovation Build Pipeline
Optimize SupportImprove customer and employee experiences
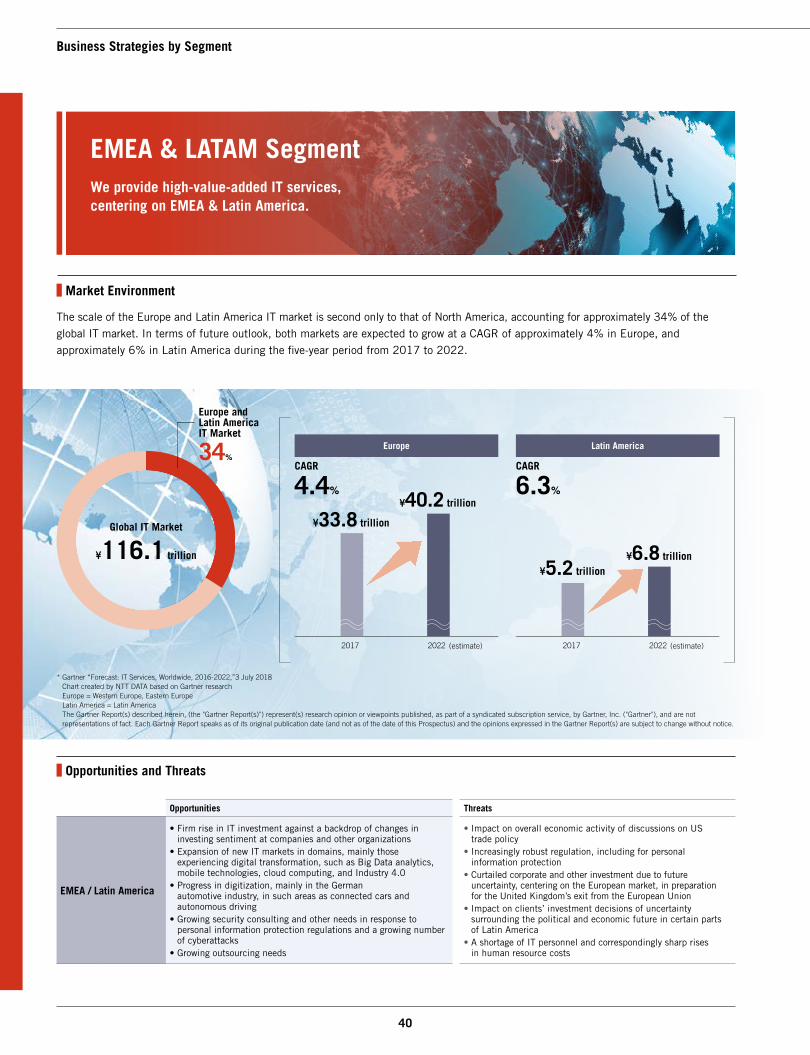
40 41
Market Environment
The scale of the Europe and Latin America IT market is second only to that of North America, accounting for approximately 34% of the global IT market. In terms of future outlook, both markets are expected to grow at a CAGR of approximately 4% in Europe, and approximately 6% in Latin America during the five-year period from 2017 to 2022.
Business Strategies by Segment
Opportunities Threats
EMEA / Latin America
• Firm rise in IT investment against a backdrop of changes in investing sentiment at companies and other organizations
• Expansion of new IT markets in domains, mainly those experiencing digital transformation, such as Big Data analytics, mobile technologies, cloud computing, and Industry 4.0
• Progress in digitization, mainly in the German automotive industry, in such areas as connected cars and autonomous driving
• Growing security consulting and other needs in response to personal information protection regulations and a growing number of cyberattacks
• Growing outsourcing needs
• Impact on overall economic activity of discussions on US trade policy
• Increasingly robust regulation, including for personal information protection
• Curtailed corporate and other investment due to future uncertainty, centering on the European market, in preparation for the United Kingdom’s exit from the European Union
• Impact on clients’ investment decisions of uncertainty surrounding the political and economic future in certain parts of Latin America
• A shortage of IT personnel and correspondingly sharp rises in human resource costs
Europe
2017 2022
CAGR
4.4%
Latin America
2017 2022
CAGR
6.3%
Global IT Market
¥116.1 trillion
Europe and Latin America IT Market
34%
¥33.8 trillion
¥40.2 trillion
¥5.2 trillion¥6.8 trillion
(estimate) (estimate)
* Gartner “Forecast: IT Services, Worldwide, 2016-2022,”3 July 2018 Chart created by NTT DATA based on Gartner research Europe = Western Europe, Eastern Europe Latin America = Latin America The Gartner Report(s) described herein, (the "Gartner Report(s)") represent(s) research opinion or viewpoints published, as part of a syndicated subscription service, by Gartner, Inc. ("Gartner"), and are not representations of fact. Each Gartner Report speaks as of its original publication date (and not as of the date of this Prospectus) and the opinions expressed in the Gartner Report(s) are subject to change without notice.
We provide high-value-added IT services, centering on EMEA & Latin America.
EMEA & LATAM Segment
Opportunities and Threats

41
NTT DATA ANNUAL REPORT 2018
Inter-Sector Ranking / Strengths / Market Share
Industries and Domains of Strength
Basic Strategy
Germany
We provide IT services globally for large companies, centered on those in the German automotive industry, and have robust client relationships. For small and medium-sized German companies, we also provide consulting on the introduction of SAP software (SAP being the ERP market leader) and have a solid client base. Our delivery capabilities take advantage of our development base in Romania, which has excellent German-speaking human resources.
Italy
We provide IT services that mainly target media, telecom, and utility companies headquartered in Italy and other parts of Europe, and have strong client relationships. In addition, in response to demands for digitization centered on customers in the banking and retail industries we have human resources skilled in digital technologies and strong delivery capabilities.
Spain
We provide broad-ranging IT services on a global scale, centering on Spanish banks and telecom companies, and have strong customer relationships. We respond to a wide range of needs for digitization with multiple design studios, strong consulting capabilities, and the application of advanced digital technologies. We have strong delivery capabilities that make use of our development bases in Europe and Latin America, leveraging core countries in the Spanish-speaking world.
• Leverage strengths in specified industries and fields
• Expand portfolio / strengthen service provision capabilities
• Synergies through NTT DATA Group and NTT Group alliances
Organic Growth
• Establish flexible delivery model through combination of near shore in Eastern Europe, etc., and offshore in India
• Achieve cost efficiency through integrated business management
Profitability Improvement
• M&As with enterprises that have capabilities NTT DATA lacks related to upstream processes and digitization
M&As
• Increase local presence in the EMEA & LATAM region
• Achieve growth strategy through expanded synergies in terms of geography, lifecycle, and offering
Europe and Latin America IT Market (Gartner Ranking)
* Gartner “Market Share: IT Services 2017” 11 June 2018 Chart created by NTT DATA based on Gartner research Europe = Western Europe, Eastern Europe Latin America = Latin America The Gartner Report(s) described herein, (the "Gartner Report(s)") represent(s) research opinion or viewpoints published, as part of a syndicated subscription service, by Gartner, Inc. ("Gartner"), and are not representations of fact. Each Gartner Report speaks as of its original publication date (and not as of the date of this Prospectus) and the opinions expressed in the Gartner Report(s) are subject to change without notice.
17th*(As of June, 2018)
(%)
NTT DATA’s Market Share Ranking in Major Countries within the Europe and Latin America Regions
(Billions of yen)
5,0000 500 1,5001,000 2,000
0.0
1.0
4.0
3.0
5.0
2.0
Turkey5th (5.0%)
Chile4th (4.8%)
Italy8th (2.6%)
Colombia10th (2.0%)
Market Share 2.0%
Market scale
6.0
NTT D
ATA’s market share
Spain5th (5.3%)
Germany11th(1.9%)

42 43
Toward the Sustainable Enhancement of Corporate Value
The NTT DATA Group targets the sustainable enhancement of corporate value from three standpoints: Growth Drivers, Profitability, and Sustainability.
Profitability P.48
Manage Unprofitable Projects, and Increase Overseas Business Margins
To enhance corporate value as a Trusted Global Innovator, NTT DATA believes it is important to not only increase sales but also to work toward improved profitability. To this end, we will sort out issues on a global basis and make efforts toward improved profitability.
Growth Drivers
Profitability Sustainability
Improve Profitability Globally
The Key Drivers of Corporate
Value
Manage Unprofitable
Projects
Improve Overseas Business
Margins
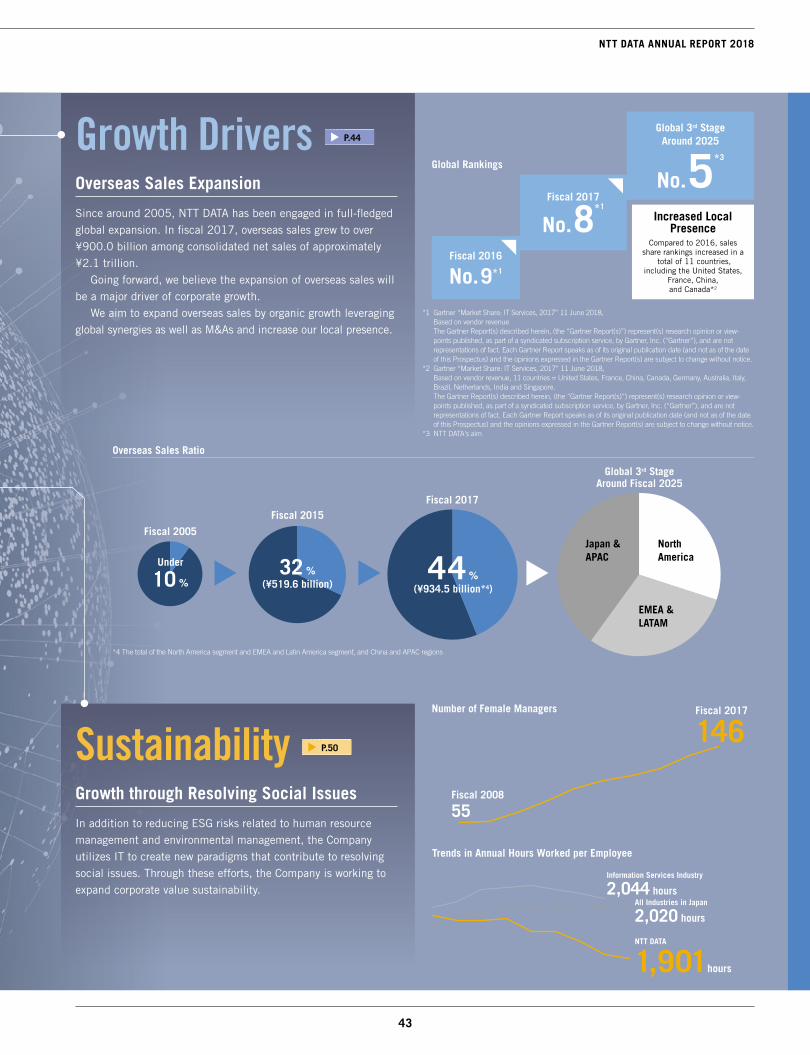
Increased Local Presence
Compared to 2016, sales share rankings increased in a
total of 11 countries, including the United States,
France, China, and Canada*2
43
NTT DATA ANNUAL REPORT 2018
Fiscal 2016
No.9*1
Growth Drivers P.44
Overseas Sales Expansion
Since around 2005, NTT DATA has been engaged in full-fledged global expansion. In fiscal 2017, overseas sales grew to over ¥900.0 billion among consolidated net sales of approximately ¥2.1 trillion. Going forward, we believe the expansion of overseas sales will be a major driver of corporate growth. We aim to expand overseas sales by organic growth leveraging global synergies as well as M&As and increase our local presence.
Sustainability P.50
Growth through Resolving Social Issues
In addition to reducing ESG risks related to human resource management and environmental management, the Company utilizes IT to create new paradigms that contribute to resolving social issues. Through these efforts, the Company is working to expand corporate value sustainability.
Fiscal 2015
32 %(¥519.6 billion)
Under
10 %
Fiscal 2005
Fiscal 2017
44 % (¥934.5 billion*4)
Global 3rd Stage Around Fiscal 2025
North America
EMEA & LATAM
Japan & APAC
Fiscal 2017
No.8*1
Global 3rd Stage Around 2025
No.5*3Global Rankings
*1 Gartner “Market Share: IT Services, 2017” 11 June 2018, Based on vendor revenue The Gartner Report(s) described herein, (the “Gartner Report(s)”) represent(s) research opinion or view-points published, as part of a syndicated subscription service, by Gartner, Inc. (“Gartner”), and are not representations of fact. Each Gartner Report speaks as of its original publication date (and not as of the date of this Prospectus) and the opinions expressed in the Gartner Report(s) are subject to change without notice.
*2 Gartner “Market Share: IT Services, 2017” 11 June 2018, Based on vendor revenue, 11 countries = United States, France, China, Canada, Germany, Australia, Italy, Brazil, Netherlands, India and Singapore. The Gartner Report(s) described herein, (the “Gartner Report(s)”) represent(s) research opinion or view-points published, as part of a syndicated subscription service, by Gartner, Inc. (“Gartner”), and are not representations of fact. Each Gartner Report speaks as of its original publication date (and not as of the date of this Prospectus) and the opinions expressed in the Gartner Report(s) are subject to change without notice.
*3 NTT DATA's aim
Overseas Sales Ratio
Information Services Industry
2,044 hoursAll Industries in Japan
2,020 hours
NTT DATA
1,901hours
Trends in Annual Hours Worked per Employee
Number of Female Managers Fiscal 2017
146
Fiscal 2008
55
*4 The total of the North America segment and EMEA and Latin America segment, and China and APAC regions
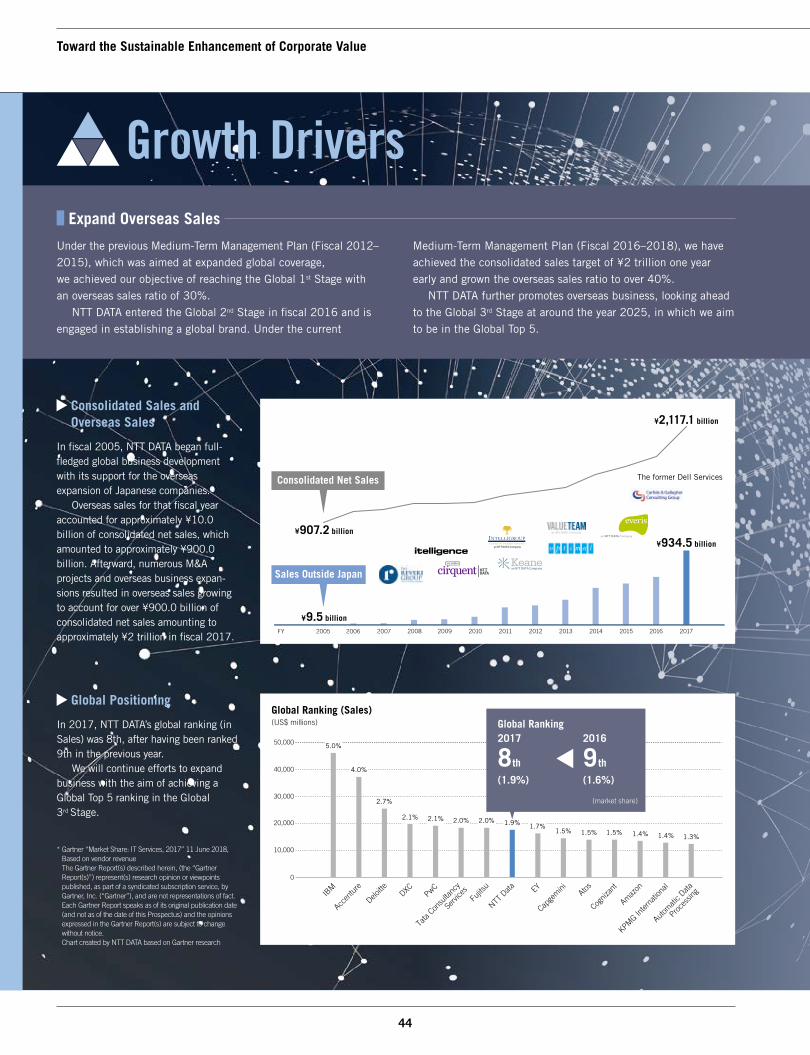
2007 20172016201520142013201220112010200920082005 2006FY
¥9.5 billion
¥907.2 billion
¥934.5 billion
¥2,117.1 billion
44 45
Growth Drivers Expand Overseas Sales
Under the previous Medium-Term Management Plan (Fiscal 2012–2015), which was aimed at expanded global coverage, we achieved our objective of reaching the Global 1st Stage with an overseas sales ratio of 30%. NTT DATA entered the Global 2nd Stage in fiscal 2016 and is engaged in establishing a global brand. Under the current
Medium-Term Management Plan (Fiscal 2016–2018), we have achieved the consolidated sales target of ¥2 trillion one year early and grown the overseas sales ratio to over 40%. NTT DATA further promotes overseas business, looking ahead to the Global 3rd Stage at around the year 2025, in which we aim to be in the Global Top 5.
Consolidated Sales and Overseas Sales
In fiscal 2005, NTT DATA began full-fledged global business development with its support for the overseas expansion of Japanese companies. Overseas sales for that fiscal year accounted for approximately ¥10.0 billion of consolidated net sales, which amounted to approximately ¥900.0 billion. Afterward, numerous M&A projects and overseas business expan-sions resulted in overseas sales growing to account for over ¥900.0 billion of consolidated net sales amounting to approximately ¥2 trillion in fiscal 2017.
Global Positioning
In 2017, NTT DATA’s global ranking (in Sales) was 8th, after having been ranked 9th in the previous year. We will continue efforts to expand business with the aim of achieving a Global Top 5 ranking in the Global 3rd Stage.
* Gartner “Market Share: IT Services, 2017” 11 June 2018, Based on vendor revenue The Gartner Report(s) described herein, (the “Gartner Report(s)”) represent(s) research opinion or viewpoints published, as part of a syndicated subscription service, by Gartner, Inc. (“Gartner”), and are not representations of fact. Each Gartner Report speaks as of its original publication date (and not as of the date of this Prospectus) and the opinions expressed in the Gartner Report(s) are subject to change without notice. Chart created by NTT DATA based on Gartner research
Global Ranking (Sales)(US$ millions)
0
10,000
20,000
30,000
40,000
50,000
Autom
atic D
ata
Proce
ssing
KPMG In
terna
tiona
l
Amaz
on
Cogniz
ant
Atos
Capge
miniEY
NTT D
ata
Fujits
u
Tata
Consu
ltanc
y
Servi
ces
PwCDXC
Deloitte
Accen
ture
IBM
Global Ranking2017
8th
(1.9%)
2016
9th
(1.6%)
5.0%
4.0%
2.7%
2.1% 2.1% 2.0% 2.0% 1.9% 1.7%1.5% 1.5% 1.5% 1.4% 1.4% 1.3%
Consolidated Net Sales
Sales Outside Japan
The former Dell Services
Toward the Sustainable Enhancement of Corporate Value
(market share)

45
NTT DATA ANNUAL REPORT 2018
Increasing Local Presence
To expand sales globally, it is important to acquire opportunities to propose IT services to a variety of customers throughout the world, including national governments and multinational corpora-tions. To this end, NTT DATA must gain a market share of 2% or higher and rank within the top 10 in terms of sales in all major nations throughout the world.
In 2017, within the 15 largest IT service markets, NTT DATA’s sales ranked within the top 10 in Japan, Spain, and Italy. In the Unites States, which is the largest IT services market in the world with a scale approximately four times larger than that of Japan, NTT DATA was ranked 24th. We will maintain our focus on expanding sales through organic growth and M&As to increase our local presence.
Countries in which NTT DATA is ranked in top 10
IT Services Market Scale by Country (Top 15 countries ranked according to 2017 end-user expenditures)(US$ millions)
* Gartner “Market Share: IT Services, 2017” 11 June 2018, Based on vendor revenue, 11 countries = United States, France, China, Canada, Germany, Australia, Italy, Brazil, Netherlands, India and Singapore. The Gartner Report(s) described herein, (the “Gartner Report(s)”) represent(s) research opinion or viewpoints published, as part of a syndicated subscription service, by Gartner, Inc. (“Gartner”), and are not representations of fact. Each Gartner Report speaks as of its original publication date (and not as of the date of this Prospectus) and the opinions expressed in the Gartner Report(s) are subject to change without notice. Chart created by NTT DATA based on Gartner research
United States
0
100,000
200,000
300,000
400,000
Trusted Global Innovator M&A Strategy
M&A represents one important means of achieving global growth going forward. We will engage in M&A activities based on the following M&A strategy.
Increased Local PresenceIncreased sales share ranking in 11 countries including the United States, France, China, and Canada compared to the previous year*
Geography
The scale of the IT services market is huge, and
although NTT DATA already develops business in
this market, its share is less than 2% in some
countries and regions. We will utilize M&A activities
to expand market share and increase presence.
Lifecycle
We will acquire consulting capabilities and out-
sourcing service delivery capabilities to enable
support from the upstream phase for client manage-
ment issues, with superior project proposal capabili-
ties for client company management and formation
capability and utilize these capabilities globally.
Offering
We will obtain skills enabling support for global
accounts and clients in all countries and regions to
enhance service provision capabilities and acquire
solutions for the automobile and financial industries.
Consulting Application development Operation and maintenance (AMO, ITO, BPO, etc.)
Lifecycle
Integrate and conduct ongoing consulting, application development, and operation and maintenance to create and provide new value as a business partner to our clients.
Design Development Driving
42.4%
11.0%7.8%
4.6% 3.5% 2.8% 2.6% 2.5% 1.8% 1.7% 1.7% 1.7% 1.6% 1.4% 1.2%
2nd 5th 8th
Utilize M&A Activities to Drive Growth Strategies by Expanding Synergies between Geography, Lifecycle, and Offering.
NTT DATA’s share 9.3%
NTT DATA’s share 5.3%
NTT DATA’s share 2.6%
Japan UnitedKingdom
Germany France China Australia Canada Spain South Korea
Italy Brazil Netherlands India Singapore
46 47
Toward the Sustainable Enhancement of Corporate Value
Robb RasmussenHead of Global Marketing Headquarters
Purpose of Establishing the Global Marketing Headquarters
Up until now, NTT DATA has been expanding its global presence through aggressive M&As. With offices around the world, we have succeeded in improving our delivery capability to customers. However, in order to create more synergies, we are now in need of a central management of the strengths and services of each region. Therefore, we have installed the Global Marketing Headquarters as an organization to manage the global brand improvement of our company cross-regionally. While our company’s brand power is established in Japan, we are faced with the challenge to build one that will lead us to receiving orders overseas. Therefore, we intend to take all kinds of measures to improve our brand power, which would lead to profit, and present our company’s “world-class capability.”
Missions of the Global Marketing Headquarters
The missions of the Global Marketing Headquarters are (1) to provide support for “growth with profitability” and (2) to improve our company’s brand power outside Japan. In order to carry out these missions, we provide support for our global customers as a global and cross-regional function and promote smooth collaboration across the regions on a global level. In our group, with more than 110,000 employees working worldwide, rich human resources, solutions, intellectual properties, methodologies, and networks exist as a large power. I believe that by cooperating globally, we can exert our company’s true power.
Marketing Strategy
What we’re trying to focus on the most is our digital strategy. We will externally communicate our company’s digital strategy by defining six focus areas of digitization that we can appeal to our customers in a way that is easy to understand. We also intend to work with our customers on projects and solution investments in order to become their partner in advancing their digital strategy together. For this purpose, we will rebuild our structure for approaching global clients to strengthen our ties with the customers.
Future Prospects
We are already collaborating across regions for the auto motive industry worldwide, and similarly intend to play the role of a hub office for our global business for the financial, telecom, and insurance industries to boost collaboration among regions. To become a Trusted Global Innovator, we will continue to contribute to the achievement of the business goals of our customers worldwide.
Interview with the Head of the Global Marketing Headquarters
About the Global Marketing HeadquartersIn July 2017, the Global Marketing Headquarters was established as a corporate organization to manage our global businesses cross-regionally, and I, Robb Rasmussen was appointed as its head. It is the first challenge in our company’s history to have a non-Japanese appointed as the head, and I recognize that it indicates high expectations of the top management team for “NTT DATA’s globalization”.
1
2
3
4
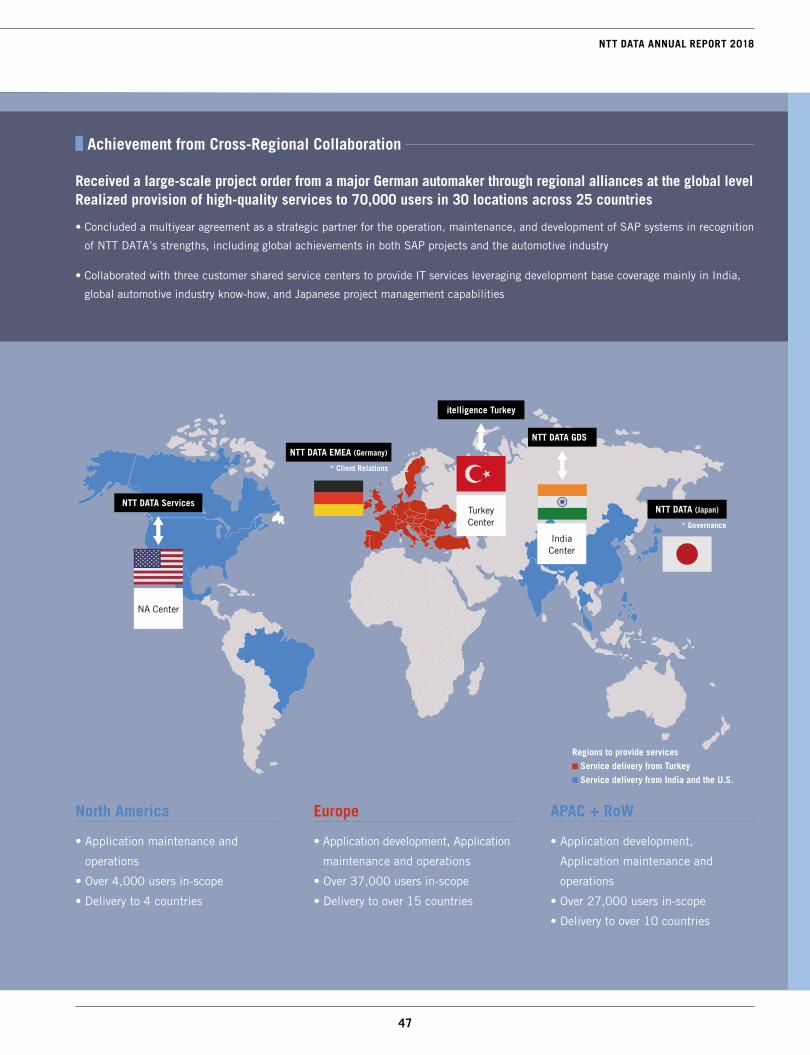
India Center
NA Center
Regions to provide services Service delivery from Turkey Service delivery from India and the U.S.
* Client Relations
* Governance
47
NTT DATA ANNUAL REPORT 2018
Achievement from Cross-Regional Collaboration
Received a large-scale project order from a major German automaker through regional alliances at the global level Realized provision of high-quality services to 70,000 users in 30 locations across 25 countries
• Concluded a multiyear agreement as a strategic partner for the operation, maintenance, and development of SAP systems in recognition
of NTT DATA’s strengths, including global achievements in both SAP projects and the automotive industry
• Collaborated with three customer shared service centers to provide IT services leveraging development base coverage mainly in India,
global automotive industry know-how, and Japanese project management capabilities
Turkey Center
North America
• Application maintenance and
operations
• Over 4,000 users in-scope
• Delivery to 4 countries
Europe
• Application development, Application
maintenance and operations
• Over 37,000 users in-scope
• Delivery to over 15 countries
APAC + RoW
• Application development,
Application maintenance and
operations
• Over 27,000 users in-scope
• Delivery to over 10 countries
NTT DATA EMEA (Germany)
NTT DATA Services
NTT DATA GDS
NTT DATA (Japan)
itelligence Turkey
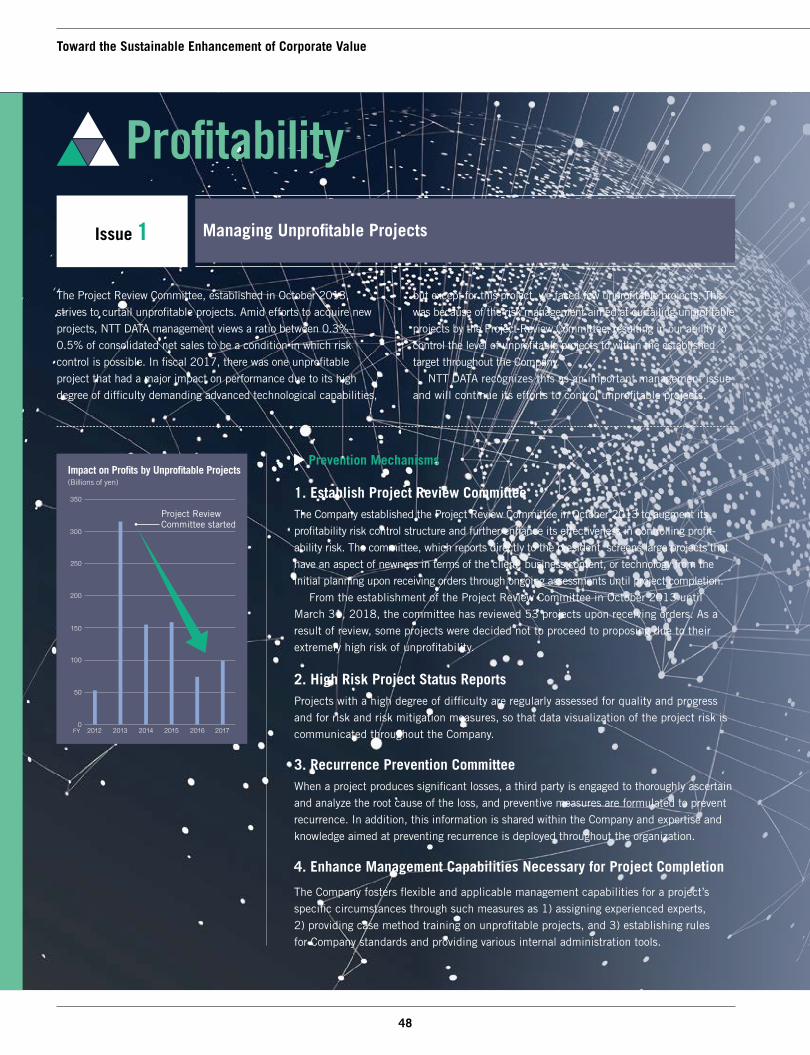
48 49
Profitability
Issue 1
The Project Review Committee, established in October 2013, strives to curtail unprofitable projects. Amid efforts to acquire new projects, NTT DATA management views a ratio between 0.3%–0.5% of consolidated net sales to be a condition in which risk control is possible. In fiscal 2017, there was one unprofitable project that had a major impact on performance due to its high degree of difficulty demanding advanced technological capabilities,
but except for this project, we faced few unprofitable projects. This was because of the risk management aimed at curtailing unprofitable projects by the Project Review Committee, resulting in our ability to control the level of unprofitable projects to within the established target throughout the Company. NTT DATA recognizes this as an important management issue and will continue its efforts to control unprofitable projects.
Managing Unprofitable Projects
Impact on Profits by Unprofitable Projects(Billions of yen)
Prevention Mechanisms
1. Establish Project Review CommitteeThe Company established the Project Review Committee in October 2013 to augment its profitability risk control structure and further enhance its effectiveness in controlling profit-ability risk. The committee, which reports directly to the president, screens large projects that have an aspect of newness in terms of the client, business content, or technology from the initial planning upon receiving orders through ongoing assessments until project completion. From the establishment of the Project Review Committee in October 2013 until March 31, 2018, the committee has reviewed 53 projects upon receiving orders. As a result of review, some projects were decided not to proceed to proposing due to their extremely high risk of unprofitability.
2. High Risk Project Status ReportsProjects with a high degree of difficulty are regularly assessed for quality and progress and for risk and risk mitigation measures, so that data visualization of the project risk is communicated throughout the Company.
3. Recurrence Prevention CommitteeWhen a project produces significant losses, a third party is engaged to thoroughly ascertain and analyze the root cause of the loss, and preventive measures are formulated to prevent recurrence. In addition, this information is shared within the Company and expertise and knowledge aimed at preventing recurrence is deployed throughout the organization.
4. Enhance Management Capabilities Necessary for Project Completion
The Company fosters flexible and applicable management capabilities for a project’s specific circumstances through such measures as 1) assigning experienced experts, 2) providing case method training on unprofitable projects, and 3) establishing rules for Company standards and providing various internal administration tools.
0
50
150
250
100
200
300
350
2016 20172015201420132012FY
Project Review Committee started
Toward the Sustainable Enhancement of Corporate Value

49
NTT DATA ANNUAL REPORT 2018
We have integrated our next-generation development methodology and tools across the globe, and strengthened our production technology innovations that can provide high-quality services in each market.
Specifically, when developing in collaboration with multiple overseas Group companies, it contributes to enhanced development efficiency and quality improvements
• As the EBITA margin on overseas*2 business remains around 4.7%, boosting profitability is an important focus.
• To bolster profitability over the medium- to long-term, we are promoting both globally concerted and region-specific initiatives.
Issue 2 Improving the Profitability of Overseas Business
Overseas Business EBITA*1 Margin(%)
*2. Overseas: In fiscal 2017, the total of the North America segment and EMEA and Latin America segment, and China and APAC regions
Establishing Global Development Standards
Integrate next-generation development standards globally and assemble a knowledge database
Expand gradually by incorporating SAP, Oracle, Salesforce, and other development methodologies
Expand and roll out to overseasLaunch utilization in EMEA and APAC regions
Methodology and Tools
Initiatives by Region
• North America: Promote cost reductions via increased productivity at offshore facilities in India and acquisition of upstream projects with high profitability through strengthened consulting and other efforts
• EMEA & LATAM: Promote reductions in administrative and common expenses by integrating staff departments of the three core companies
*1. EBITA = Operating income + Amortization of goodwill and intangible assets subject to purchase price allocation (PPA) arising from acquisitions, etc.
0
1.5
3.0
4.5
6.0
20162015FY 2017

50 5151
Achieving the Sustainable Development Goals
Selected at the United Nations (UN) Sustainable Development Summit in September 2015, the Sustainable Development Goals (SDGs) outline 17 objectives and 169 targets to achieve by 2030 on a global scale. These goals, agreed upon by govern-ments around the world, position companies of all industries as important partners and require their positive action in order to realize these goals. As a member of the NTT Group, the NTT DATA Group endorses the SDGs and will utilize ICT in collaboration with its customer and other stakeholders in order to help realize a sustainable society.
Third-Party Evaluation (As of September 2018)
The ESG efforts of the NTT DATA Group has received positive reviews from research agencies in Japan and overseas, and has been selected as a constituent of numbers of indexes.
SustainabilityValue Creation through Contribution to Society and the Environment
Dow Jones Sustainability World Index / Asia Pacific IndexNTT DATA was selected as a constituent of the Dow Jones Sustainability Index (DJSI) World and Asia Pacific indexes. The DJSI is managed coop-eratively by S&P Dow Jones Indices and RobecoSAM and evaluates business sustainability from the three perspectives of economy, environ-ment, and society.
FTSE4Good IndexNTT DATA was selected as a constituent of the FTSE4Good Index, a socially responsible investment (SRI) index designed to promote investment in companies that meet global ESG standards.
FTSE Blossom JapanNTT DATA has been selected as a constituent of the FTSE Blossom Japan Index, which recognizes Japanese companies deemed exceptional by international ESG standards set by FTSE Russell.
Oekom PrimeNTT DATA has been rated Prime by Germany-based oekom research AG, designating the Company as one of the top leaders for CSR in the Internet and software industry.
Morningstar Socially Responsible Investment IndexNTT DATA was selected as a constituent of the Morningstar Socially Responsible Investment Index (MS-SRI), the first SRI in Japan. Morningstar selects listed companies in Japan that excel in social responsibility and indexes their stock prices.
RobecoSAM Sustainability AwardNTT DATA received the RobecoSAM Sustainability Award as a Bronze Class Company by RobecoSam, a Swiss SRI evaluation company and research agency. The award is given by evaluating sustainability and was awarded to NTT DATA for its exceptional CSR efforts.
Toward the Sustainable Enhancement of Corporate Value
In recent years, business has become evaluated more and more in terms of its relationships with society, which hinge on environmental, social, and governance (ESG) activities. Based on our mission statement, “NTT DATA uses information technology to create new paradigms and values, which help contribute to a more affluent and harmonious society,” we will engage in business activities that are mindful of issues related to society and the environment. In doing so, we will work toward increasing sustainable corporate value.
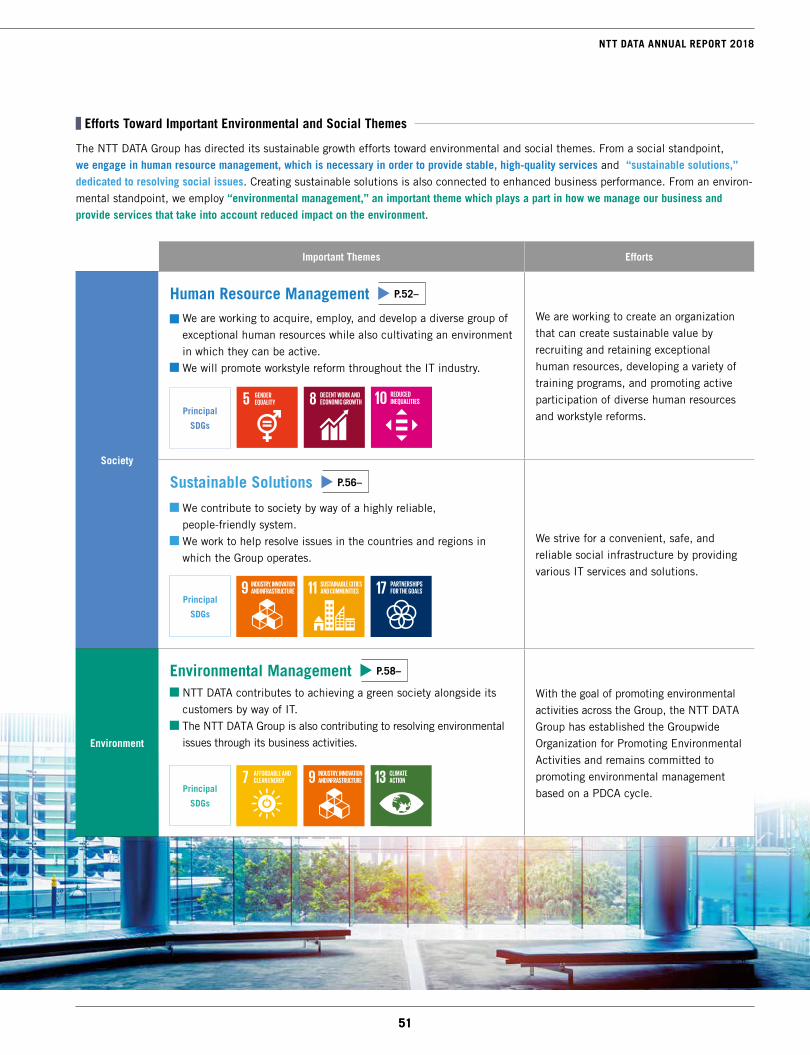
51
NTT DATA ANNUAL REPORT 2018
51
Important Themes Efforts
Society
Human Resource Management P.52–
We are working to acquire, employ, and develop a diverse group of exceptional human resources while also cultivating an environment in which they can be active. We will promote workstyle reform throughout the IT industry.
We are working to create an organization that can create sustainable value by recruiting and retaining exceptional human resources, developing a variety of training programs, and promoting active participation of diverse human resources and workstyle reforms.
Sustainable Solutions P.56–
We contribute to society by way of a highly reliable, people-friendly system. We work to help resolve issues in the countries and regions in which the Group operates.
We strive for a convenient, safe, and reliable social infrastructure by providing various IT services and solutions.
Environment
Environmental Management P.58–
NTT DATA contributes to achieving a green society alongside its customers by way of IT. The NTT DATA Group is also contributing to resolving environmental issues through its business activities.
With the goal of promoting environmental activities across the Group, the NTT DATA Group has established the Groupwide Organization for Promoting Environmental Activities and remains committed to promoting environmental management based on a PDCA cycle.
Principal
SDGs
Principal
SDGs
Principal
SDGs
Efforts Toward Important Environmental and Social Themes
The NTT DATA Group has directed its sustainable growth efforts toward environmental and social themes. From a social standpoint, we engage in human resource management, which is necessary in order to provide stable, high-quality services and “sustainable solutions,” dedicated to resolving social issues. Creating sustainable solutions is also connected to enhanced business performance. From an environ-mental standpoint, we employ “environmental management,” an important theme which plays a part in how we manage our business and provide services that take into account reduced impact on the environment.
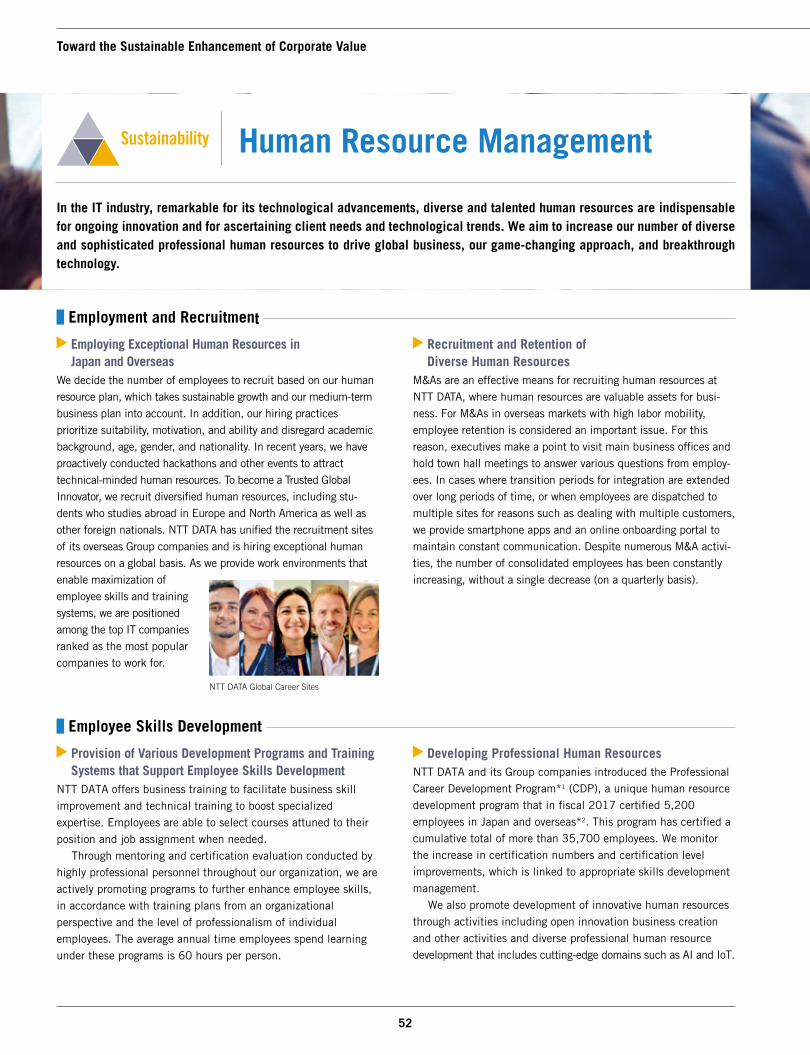
52 53
Employment and Recruitment
Employing Exceptional Human Resources in Japan and Overseas
We decide the number of employees to recruit based on our human resource plan, which takes sustainable growth and our medium-term business plan into account. In addition, our hiring practices prioritize suitability, motivation, and ability and disregard academic background, age, gender, and nationality. In recent years, we have proactively conducted hackathons and other events to attract technical-minded human resources. To become a Trusted Global Innovator, we recruit diversified human resources, including stu-dents who studies abroad in Europe and North America as well as other foreign nationals. NTT DATA has unified the recruitment sites of its overseas Group companies and is hiring exceptional human resources on a global basis. As we provide work environments that enable maximization of employee skills and training systems, we are positioned among the top IT companies ranked as the most popular companies to work for.
Recruitment and Retention of Diverse Human Resources
M&As are an effective means for recruiting human resources at NTT DATA, where human resources are valuable assets for busi-ness. For M&As in overseas markets with high labor mobility, employee retention is considered an important issue. For this reason, executives make a point to visit main business offices and hold town hall meetings to answer various questions from employ-ees. In cases where transition periods for integration are extended over long periods of time, or when employees are dispatched to multiple sites for reasons such as dealing with multiple customers, we provide smartphone apps and an online onboarding portal to maintain constant communication. Despite numerous M&A activi-ties, the number of consolidated employees has been constantly increasing, without a single decrease (on a quarterly basis).
Employee Skills Development
Provision of Various Development Programs and Training Systems that Support Employee Skills Development
NTT DATA offers business training to facilitate business skill improvement and technical training to boost specialized expertise. Employees are able to select courses attuned to their position and job assignment when needed. Through mentoring and certification evaluation conducted by highly professional personnel throughout our organization, we are actively promoting programs to further enhance employee skills, in accordance with training plans from an organizational perspective and the level of professionalism of individual employees. The average annual time employees spend learning under these programs is 60 hours per person.
Developing Professional Human ResourcesNTT DATA and its Group companies introduced the Professional Career Development Program*1 (CDP), a unique human resource development program that in fiscal 2017 certified 5,200 employees in Japan and overseas*2. This program has certified a cumulative total of more than 35,700 employees. We monitor the increase in certification numbers and certification level improvements, which is linked to appropriate skills development management. We also promote development of innovative human resources through activities including open innovation business creation and other activities and diverse professional human resource development that includes cutting-edge domains such as AI and IoT.
In the IT industry, remarkable for its technological advancements, diverse and talented human resources are indispensable for ongoing innovation and for ascertaining client needs and technological trends. We aim to increase our number of diverse and sophisticated professional human resources to drive global business, our game-changing approach, and breakthrough technology.
Human Resource ManagementSustainability
Toward the Sustainable Enhancement of Corporate Value
NTT DATA Global Career Sites
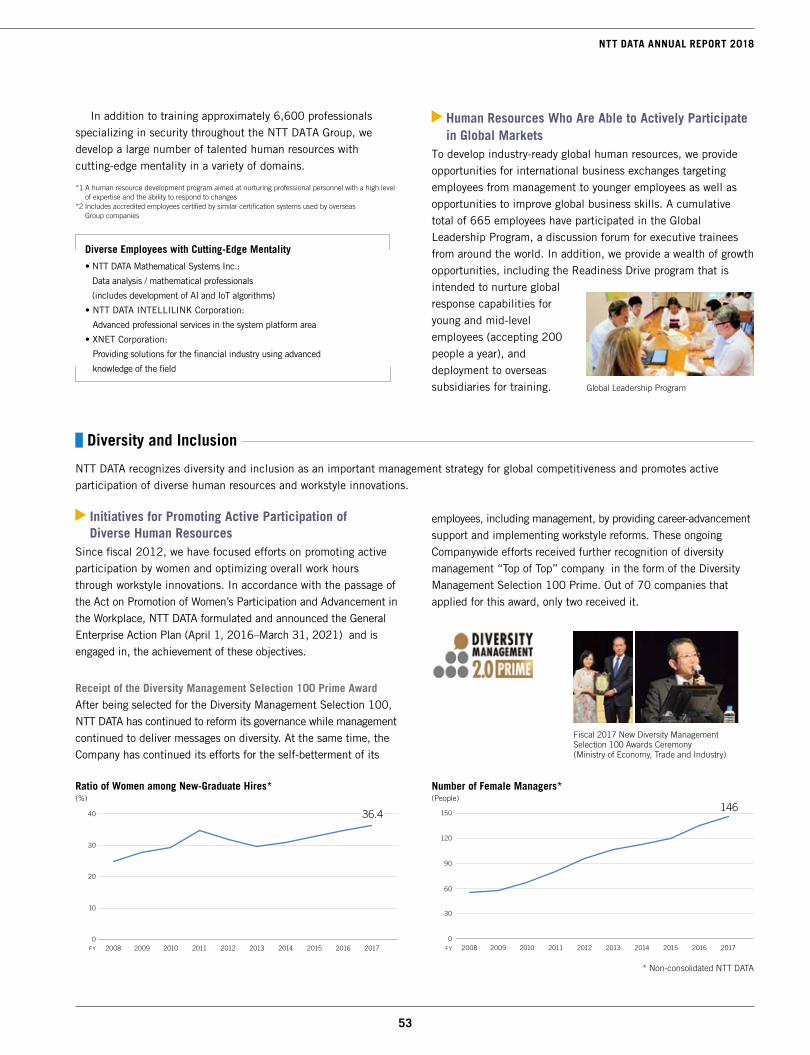
53
NTT DATA ANNUAL REPORT 2018
Diversity and Inclusion
NTT DATA recognizes diversity and inclusion as an important management strategy for global competitiveness and promotes active participation of diverse human resources and workstyle innovations.
Initiatives for Promoting Active Participation of Diverse Human Resources
Since fiscal 2012, we have focused efforts on promoting active participation by women and optimizing overall work hours through workstyle innovations. In accordance with the passage of the Act on Promotion of Women’s Participation and Advancement in the Workplace, NTT DATA formulated and announced the General Enterprise Action Plan (April 1, 2016–March 31, 2021) and is engaged in, the achievement of these objectives.
Receipt of the Diversity Management Selection 100 Prime AwardAfter being selected for the Diversity Management Selection 100, NTT DATA has continued to reform its governance while management continued to deliver messages on diversity. At the same time, the Company has continued its efforts for the self-betterment of its
employees, including management, by providing career-advancement support and implementing workstyle reforms. These ongoing Companywide efforts received further recognition of diversity management “Top of Top” company in the form of the Diversity Management Selection 100 Prime. Out of 70 companies that applied for this award, only two received it.
In addition to training approximately 6,600 professionals specializing in security throughout the NTT DATA Group, we develop a large number of talented human resources with cutting-edge mentality in a variety of domains.
*1 A human resource development program aimed at nurturing professional personnel with a high level of expertise and the ability to respond to changes
*2 Includes accredited employees certified by similar certification systems used by overseas Group companies
Human Resources Who Are Able to Actively Participate in Global Markets
To develop industry-ready global human resources, we provide opportunities for international business exchanges targeting employees from management to younger employees as well as opportunities to improve global business skills. A cumulative total of 665 employees have participated in the Global Leadership Program, a discussion forum for executive trainees from around the world. In addition, we provide a wealth of growth opportunities, including the Readiness Drive program that is intended to nurture global response capabilities for young and mid-level employees (accepting 200 people a year), and deployment to overseas subsidiaries for training. Global Leadership Program
Diverse Employees with Cutting-Edge Mentality
• NTT DATA Mathematical Systems Inc.:
Data analysis / mathematical professionals
(includes development of AI and IoT algorithms)
• NTT DATA INTELLILINK Corporation:
Advanced professional services in the system platform area
• XNET Corporation:
Providing solutions for the financial industry using advanced
knowledge of the field
Fiscal 2017 New Diversity Management Selection 100 Awards Ceremony(Ministry of Economy, Trade and Industry)
* Non-consolidated NTT DATA
FY
0
10
20
30
40
20172016201520142013201220112010200920080
60
120
30
90
150
2017201620152014201320122011201020092008FY
14636.4
Ratio of Women among New-Graduate Hires*(%)
Number of Female Managers*(People)

54 55
Promoting Success of WomenSince fiscal 2015, we have continuously promoted the success of women by a variety of methods, such as strengthening measures for female supervisors and section chiefs, creating training plans for female employees, providing career advancement support training for women and their supervisors to attend together, sending employees for training outside the Company, and providing diversity training for management. We also provide career advancement support for employees who are facing various life events. For example, for those employees who are returning from childcare or nursing leave, we have three-way consultation sessions between the returning employees, their supervisors, and the director of human resources of the employee’s organization.
Women’s InitiativeIn May 2017, the Global Summit of Women, a gathering of women leaders in world economic and political circles, was held in Japan. At this summit, the Managing Director and CFO from NTT DATA Germany delivered a speech and several women leaders from NTT DATA, including women from overseas Group companies, were also in attendance. At NTT DATA Global Conference, a gathering of leaders from various countries, we regularly hold sessions on the theme of women’s success and promote women’s success throughout the NTT DATA Group.
Initiatives Related to LGBT and Gender MinoritiesOur Global Compliance Policy stipulates that we “respect human rights and will not discriminate based on gender, nationality, belief, or religion.” NTT DATA continually implements human rights awareness and other activities while also promoting initiatives including the development of system administration and training for staff in personnel, general affairs, and recruiting. In recognition of these efforts, we received a Gold ranking in the PRIDE Index 2017 from private institution “work with Pride” (wwP), Japan’s only rating index for this area.
Enhancing Childcare and Nursing Care SystemsTo help employees balance childbearing and child-rearing, nursing care, and work responsibilities with a greater sense of relief, the NTT DATA Group is enhancing its leave systems while working to increase the employee’s understanding of such systems and improving the workplace environment, making these systems easier to be used. Our childcare support system includes Egg Garden, an in-house daycare facility. Through these and other proactive efforts the Company earned a Ministry of Health, Labour and Welfare Kurumin Next-Generation Certification Mark in 2008. Since then, the Company has earned the mark continuously, most recently in December 2017. In addition, we joined to remote nursing care support services provided by the NPO Umi wo Koeru Care no Te since 2011, to directly support employees engaged in nursing care.
Efforts toward Workstyle Innovations
Approach to Workstyle Innovations
The reduction of long working hours has been an agenda item in the IT industry for many years. NTT DATA is engaged in workstyle innovations based on the idea that, in order to maintain sustainable growth, diverse human resources should be promoted to demonstrate more flexible, richer inventiveness and dynamism within a limited time frame, thus we must provide working environments that create new value and innovation.
Initiatives to Reduce Total Hours Worked and the ResultsWe have established a set of key performance indicators (KPIs), including thorough management of hours worked using methods
Toward the Sustainable Enhancement of Corporate Value
FY
0
40
80
120
160
200
0
20
40
60
80
100
20162015201420132012201120102009 2017
98.3 98.098.197.692.595.593.8
97.8
146
80
4544
64
106113
74
Number of Employees who Return to Work after Childcare Leave / Rate of Return(People) (%)
97.0
161
1,901
Quantitative Diversity Targets (As of March 31, 2018)
Target 1 Continue to aim for a female employment rate of over 30% by the end of fiscal 2020
Maintaining roughly 30% for the past 10 yearsTarget 2 Overall hours worked
Aim for average annual hours worked per employee of 1,890 hours by the end of fiscal 2018
The initiative, which has been promoted since 2013, already reduced the average hours worked per employee to 1,901 hours in fiscal 2017
Target 3 Aim for 200 or more female managers by the end of fiscal 2020 Added 11 female managers compared to the previous fiscal year, for a total of 146 female managers (Applicable number of incumbent managers, but excludes employees in scope of Target 4)
Target 4 Aim for 10 or more female senior managers (Directors, organizational heads, etc.) by the end of fiscal 2020
Currently, there are nine female senior managers
Trends in Annual Hours Worked per Employee(Hours)
Number of Employees who Return to Work after Childcare Leave (left)
Rate of Return (right)
FY 201720162015201420132012201120102009
2,0202,044
0
1,900
2,000
2,100
NTT DATA Information Services Industry All Industries in JapanSource: Proprietary data / Japan Information Technology Services Industry Association basic statistical
survey report / Ministry of Health, Labour and Welfare Monthly Labour Statistical Survey

55
NTT DATA ANNUAL REPORT 2018
such as recording computing log in and log off time, and whether targets for average working hours and target rates of set paid holidays used have been reached. These KPIs have been incorporated as part of our organizational evaluations and promoted across the entire Company. As a result of these efforts, we were able to reduce the amount of annual hours worked per person from 2,066 hours in fiscal 2007 to 1,901 hours in fiscal 2017, which is lower than the average for Japanese companies.
Encouraging the Use of Paid Vacation TimeTo promote a work-life balance among employees, NTT DATA encourages employees to take advantage of its Refreshment leave*1 and Anniversary leave*2 systems. As a company participating in the Ministry of Land, Infrastructure, Transport and Tourism’s Positive Off initiative, NTT DATA conducts initiatives encouraging all employees, including management, to plan and take vacations during summer breaks and year-end holidays, and use the Refreshment leave system. *1 Refreshment leave: When a work milestone is achieved, employees can take more than five
consecutive days of vacation by combining leave days with national holidays.
*2 Anniversary leave: Employees decide their own anniversary date and plan to take vacations.
Initiatives to Improve ProductivityWe are moving toward switching to thin-client terminals for work use in order to facilitate work on the same environment from the office, on business trips, or at home. In routine financial, accounting, personnel, purchasing work, and their related duties, we automated some of their processes such as producing slips and entering data into systems via robotic process automation (RPA). This Process not only boosts operational efficiency but also lowers mistakes in transcription and other human errors, leading to improved work quality.
We are also contributing to a more flexible workstyle for our development personnel by utilizing an “NTT DATA Integrated Development Cloud,” which integrates our system development environment into the cloud. The benefits of this system include shortened delivery times and other efficiency improvement as well as allowing remote development work. As a result of these efforts to improve productivity, labor productivity per person in fiscal 2017 has improved by 14% from fiscal 2013.
Promoting Flexible WorkstylesTelework has been introduced as a specific way to realize workstyle innovation, and is utilized by approximately 70% of employees. In 2016, in recognition of our introduction and utilization of telework, NTT DATA was selected as one of the top 100 Telework Pioneers by the Ministry of Internal Affairs and Communications. In fiscal 2017, NTT DATA participated in “Jisa Biz” (“jisa” means “time difference” in Japanese), which, in conjunction with Telework Day aims to mitigate traffic congestion during the morning rush hour. For its efforts, the Company was awarded the Jisa Biz Promotion Award in the workstyle division by the Tokyo metropolitan government. In addition, the Company also received the Chairman’s Award from the Japan Telework Association for promoting telework. In fiscal 2018, 33,000 employees took part in the Telework campaign over a five-day period, making use of Companywide measures to eliminate traffic congestion through a combination of telework, commuting during off-peak, and paid leave.
Maintaining and Enhancing Employee Health
Occupational physicians and nurses in the Health Promotion Office are working in cooperation with each workplace to promote physical and mental health care for employees. In order to dis-cover cases of poor mental or physical health early and to keep employees aware of their own health, we have implemented several initiatives, including health education for young employees and up, an accumulated fatigue check for those who log over 45 hours of overtime work, consultations with occupational doctors
and nurses, Companywide health inquiries via the web, and stress checks. In addition, starting from fiscal 2017 we have provided specialized health guidance for employees over 40 by an in-house nurse. We are working to improve participation in this effort. These efforts were evaluated and NTT DATA was certified as a Health & Productivity Management Outstanding Organizations (White 500) in February 2018.
NTT DATA All Industries
Source: Proprietary data / Ministry of Health, Labour and Welfare
Paid Vacation Utilization Rate(%)
FY 2017201620152014
49.4
0
80
60
40
20
100 89
Labor Productivity per Employee*(Thousands of yen / hours)
FY 2016 2017201520142013
36.2
0
39.0
36.0
42.0
36.6
38.538.5
40.1
* Labor productivity per employee = Sales / (Total working hours per person x Number of employees) (Non-consolidated NTT DATA)
41.4
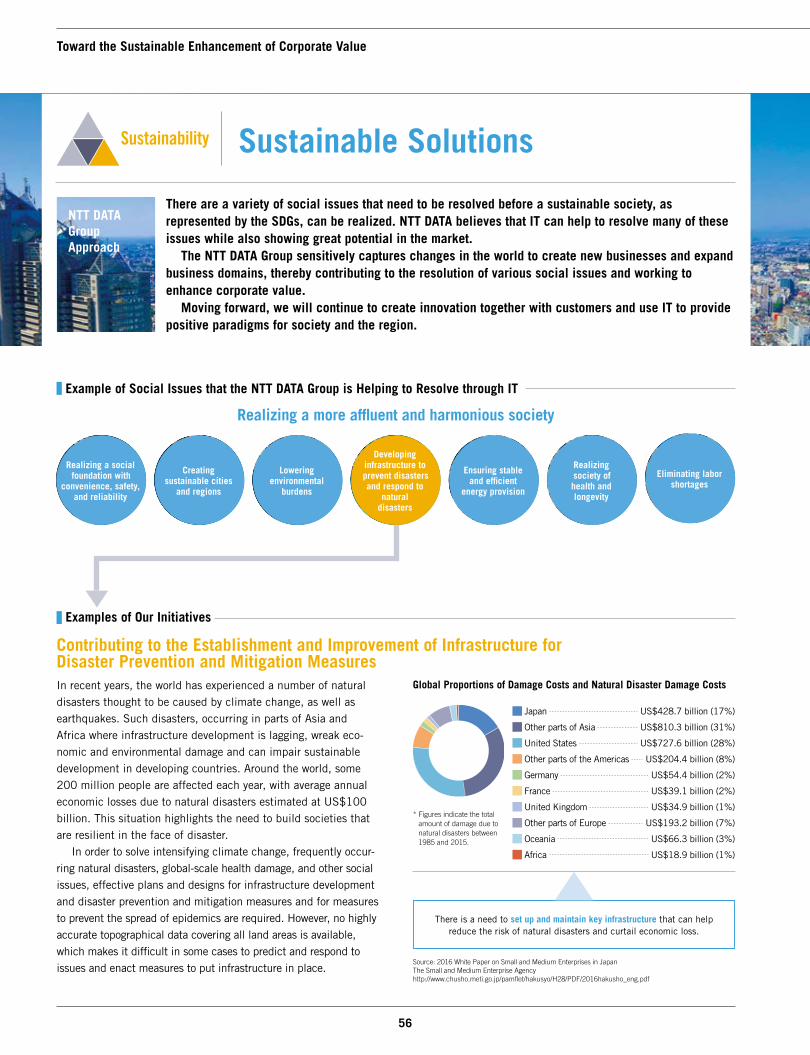
56 57
There are a variety of social issues that need to be resolved before a sustainable society, as represented by the SDGs, can be realized. NTT DATA believes that IT can help to resolve many of these issues while also showing great potential in the market. The NTT DATA Group sensitively captures changes in the world to create new businesses and expand business domains, thereby contributing to the resolution of various social issues and working to enhance corporate value. Moving forward, we will continue to create innovation together with customers and use IT to provide positive paradigms for society and the region.
Sustainable Solutions
Example of Social Issues that the NTT DATA Group is Helping to Resolve through IT
Examples of Our Initiatives
Contributing to the Establishment and Improvement of Infrastructure for Disaster Prevention and Mitigation Measures In recent years, the world has experienced a number of natural disasters thought to be caused by climate change, as well as earthquakes. Such disasters, occurring in parts of Asia and Africa where infrastructure development is lagging, wreak eco-nomic and environmental damage and can impair sustainable development in developing countries. Around the world, some 200 million people are affected each year, with average annual economic losses due to natural disasters estimated at US$100 billion. This situation highlights the need to build societies that are resilient in the face of disaster. In order to solve intensifying climate change, frequently occur-ring natural disasters, global-scale health damage, and other social issues, effective plans and designs for infrastructure development and disaster prevention and mitigation measures and for measures to prevent the spread of epidemics are required. However, no highly accurate topographical data covering all land areas is available, which makes it difficult in some cases to predict and respond to issues and enact measures to put infrastructure in place.
Global Proportions of Damage Costs and Natural Disaster Damage Costs
Sustainability
Realizing a social foundation with
convenience, safety, and reliability
Creating sustainable cities
and regions
Lowering environmental
burdens
Ensuring stable and efficient
energy provision
Realizing society of health and longevity
NTT DATA Group Approach
Toward the Sustainable Enhancement of Corporate Value
Eliminating labor shortages
Realizing a more affluent and harmonious society
Developing infrastructure to prevent disasters and respond to
natural disasters
Japan US$428.7 billion (17%)
Other parts of Asia US$810.3 billion (31%)
United States US$727.6 billion (28%)
Other parts of the Americas US$204.4 billion (8%)
Germany US$54.4 billion (2%)
France US$39.1 billion (2%)
United Kingdom US$34.9 billion (1%)
Other parts of Europe US$193.2 billion (7%)
Oceania US$66.3 billion (3%)
Africa US$18.9 billion (1%)
* Figures indicate the total amount of damage due to natural disasters between 1985 and 2015.
There is a need to set up and maintain key infrastructure that can help reduce the risk of natural disasters and curtail economic loss.
Source: 2016 White Paper on Small and Medium Enterprises in Japan The Small and Medium Enterprise Agencyhttp://www.chusho.meti.go.jp/pamflet/hakusyo/H28/PDF/2016hakusho_eng.pdf

57
NTT DATA ANNUAL REPORT 2018
The World’s Most Accurate Global High-Resolution 3D Map, AW3D
NTT DATA has jointly developed and launched AW3D with the Remote Sensing Technology Center of Japan (RESTEC). AW3D creates digital 3D maps displaying a global topography at a reso-lution and accuracy of five meters. Using approximately 3 million satellite images taken by “DAICHI (ALOS),” the land-area observation technology satellite of the Japan Aerospace Exploration Agency (JAXA), we finished mapping topographical data for the entire world at the end of March 2016. This map allows consistently high-resolution analy-sis of terrain throughout the world, including mountainous
regions where local surveys are difficult. In addition, NTT DATA has partnered with DigitalGlobe (see below), a U.S. company operating some of the world’s highest-performance satellites, to map at a resolution as high as 0.5 meters in urban areas. At this level of detail, it is possible to represent fine undulations at the building level. AW3D is utilized by over 100 countries for its high position accuracy, made possible by taking advantage of the latest 3D map processing technology, and for providing AI and Big Data technology with short delivery times and low cost.
Utilization of AW3D to Create a Tsunami Hazard Map in Macau Made through Flooding Simulation
We have provided AW3D for use in more than 800 projects to resolve issues in a variety of fields, including mapping, disaster prevention measures, and in the area of hygiene to stop the spread of epidemics. As one example, when creating a hazard map of Macau, AW3D
elevation data enabled the accurate simulation of tsunami move-ments. The hazard map thus demonstrates what areas of reclaimed land would hypothetically be flooded by a tsunami in a worst-case scenario. This has enabled effective disaster countermeasures and infrastructure development in Macau.
Winner of the Grand Prize at JISA Awards 2018
AW3D was declared the winner of the grand prize at JISA Awards 2018, held by the Japan Information Technology Services Industry Association (JISA) in June 2018. The JISA Awards honors creators of highly original and internationally applicable systems.
Going forward, we will continue to provide real-time data in a timely manner; aim to further resolve social issues in a wide range of fields such as urban planning, communication services, transportation, disaster prevention, and aviation; expand the use of geospatial information; and promote market creation around the world.
Example of Achievements
Category Area of Activity (Country) Contribution
Disaster preventionDisaster mitigation
VietnamIdentification of locations in danger of landslide disasters along trunk roads
NepalCreation of hazard map for long-term recovery planning following large earthquake
IndonesiaDisaster mitigation by forecasting products of volcanic eruption
InfrastructureCountries around the world
In the electricity field, more efficient research into wind power generation locations
Resources TanzaniaIn the water resources field, planning the use of underground water
Hygiene Nigeria, NigerIn the hygiene field, measures to address epidemics
Urban planningCountries around the world
In the urban planning field, selecting locations for wireless base stations
Tsunami Hazard Map Using Flood Simulation (Macau)
Legend: Brown indicates land
Source: Reclamation evolution of Macau [Jiang et al., 2011]
Legend: Red indicates flooding of 6.0–8.0m
Source: Dr. Linlin Li of Earth Observatory of Singapore
Landfill
Area where flooding from tsunami is forecast to be particularly deep
[Redevelopment Progress] [Tsunami Hazard Map]
58 59
Environmentally Oriented Management Policy and Long-Term Goals
The NTT DATA Group established its Environmental Policies in July 1999. Since then, we have focused not only on reducing the environmental impact of our own activities, through such mea-sures as the announcement of our Environmental Messages beginning in fiscal 2010 and the revision of our Environmental
Policies in fiscal 2011, but also on providing environmentally responsible systems and services in our capacity as an informa-tion services provider, and participating in activities aimed at reducing the environmental impact of society as a whole.
Environmental Policies of the NTT DATA Group
We believe that, given the increasingly serious nature of global environmental problems, we must address these as management issues and work toward contributions that resolve the environ-mental problems facing the world and society. The NTT DATA Group, which applies IT to create new para-digms and values, contributes to environmental protection by
providing systems and solutions that can replace or alleviate the need for actual movement of people and goods. At the same time, recognizing the major impact of business activities on the environment, we are promoting an ongoing and planned approach to environmental protection so as to realize a more affluent and harmonious society.
Environmental Messages
Earth SolutionsUsing IT to Solve Environmental Problems
The NTT DATA Group is applying IT to create new paradigms of resolving the environmental problems facing the world and society.
The NTT DATA Group uses IT to contribute to the greening of its clients and to society as a whole while making a Groupwide effort to reduce the environmental impact of its business activities. To further entrench environmental concerns into business management and maintain efforts to promote environmental activities, we must establish a foundation for promoting actions and create a framework for Groupwide environmental management. To promote environmental efforts, the NTT DATA Group established the Groupwide Organization for Promoting Environmental Activities and engages in environmental management centered on use of the PDCA cycle.
Environmental ManagementSustainability
NTT DATA Group Approach
Toward the Sustainable Enhancement of Corporate Value
1. Environmental Considerations in Conducting BusinessThe NTT DATA Group is working to lessen the environmental impact of its business activities, setting quantitative goals and targets to the extent possible, and reviewing these periodically as part of an ongoing betterment program. 1 We are promoting environmentally responsible system
development. 2 We are actively carrying out green purchasing. 3 We are working to prevent pollution and limit resource use,
by implementing policies for saving resources and energy, promoting reuse and recycling, and reducing waste.
2. Meeting Legal ObligationsIn carrying out business activities, we observe all applicable environment-related laws and other agreements and obligations.
3. Raising AwarenessThrough environmental education and environmental and social contribution activities for our employees and partners, we are enhancing and boosting recognition of environmental awareness activities.
4. Promoting CommunicationsWe work proactively to promote environmental communications with stakeholders both within and outside the NTT DATA Group.

59
NTT DATA ANNUAL REPORT 2018
Responding to Increasingly Sophisticated Needs and Reducing Environmental Impact at Mitaka Data Center EAST Eguipped with State-of-the-Art EquipmentAmid the trend of increasing energy consumption per server rack due to the expansion of cloud services and highly integrated systems, higher energy efficiency from an environmental man-agement perspective is in demand at data centers. Mikata Data Center EAST, which commenced operations in April 2018 and boasts state-of-the-art equipment, features this sort of high energy efficiency as one of its main characteristics. For this data center, we have adopted wall-mounted air condi-tioning, which allows for high cooling efficiency, and hot aisle capping, which encloses the exhaust heat passages of servers and other equipment, physically separating that heat from cold air that cools the servers and improving air conditioning effi-
ciency even further. Moreover, this is NTT DATA’s first use of an outside-air cooling system using natural energy (outside air during spring, autumn, and winter), which reduces the operating hours of air conditioning facility. The use of this system is aimed at achieving Japan’s top power usage effectiveness (PUE) of 1.3 or less (annual average, design value) and contributing to the conservation of electric power. In addition, the atrium, dubbed the “Multi-Concourse” makes active use of natural lighting to minimize power use. Furthermore, we were able to achieve zero energy use in the Multi-Concourse during the winter by using exhaust heat from the servers for heating and also using solar power for lighting at night time and heating.
[Action Plans]
Contributing to the Greening of Our Clients and Society through IT• Promote the visualization of environmental impact assessments of the systems and solutions provided by the NTT DATA Group• Help to reduce society’s environmental impact by promoting the creation and expansion of environmental solutions
Contributing to the Global Environment by Promoting the Greening of the NTT DATA Group• Steadily reduce CO2 emissions by the Group by raising the efficiency and improving operations of its data centers and by such
workstyle innovations as hot-desking• Implement steady cuts to paper usage and waste volumes
Engaging Each Employee in Thinking about the Environment and Making His or Her Own Active Contribution• Promote environmental social contribution activities across a range of fields both as an organization and individuals• Promote proactive environmental communication within and outside the Group
Initiative Example
Multi-Concourse Solar panels
Image of the outside-air cooling system
About Mitaka Data Center EAST
Mitaka Data Center EAST is the largest data center in Japan, a dedicated facility four stories high with approximately 38,000 m2
of floor space (upon completion of the second phase of building) accommodating up to 5,600 server racks. Established in the city of Mitaka in Tokyo Prefecture, Mitaka Data Center EAST has an extremely low risk of damage from floods, earthquakes, and other natural disasters. In addition, Mitaka Data Center EAST was constructed with robust infrastructure, including a quake-absorbing structure and emergency power generators that, compared to conventional data centers, provide stronger data recovery and business continuity planning (BCP) response capabilities in case of disasters.
* Mitaka Data Center EAST is the common name of NTT DATA Mitaka Building EAST.
Mitaka Data Center EAST exterior
Cold patioCooling efficiency improved by precooling
Hot patioReduce energy load by using exhaust heat to raise efficiency
Efficient rising exhaust air
Exhaust
Outside air Outside-air cooling system
Wall-mounted air conditioning
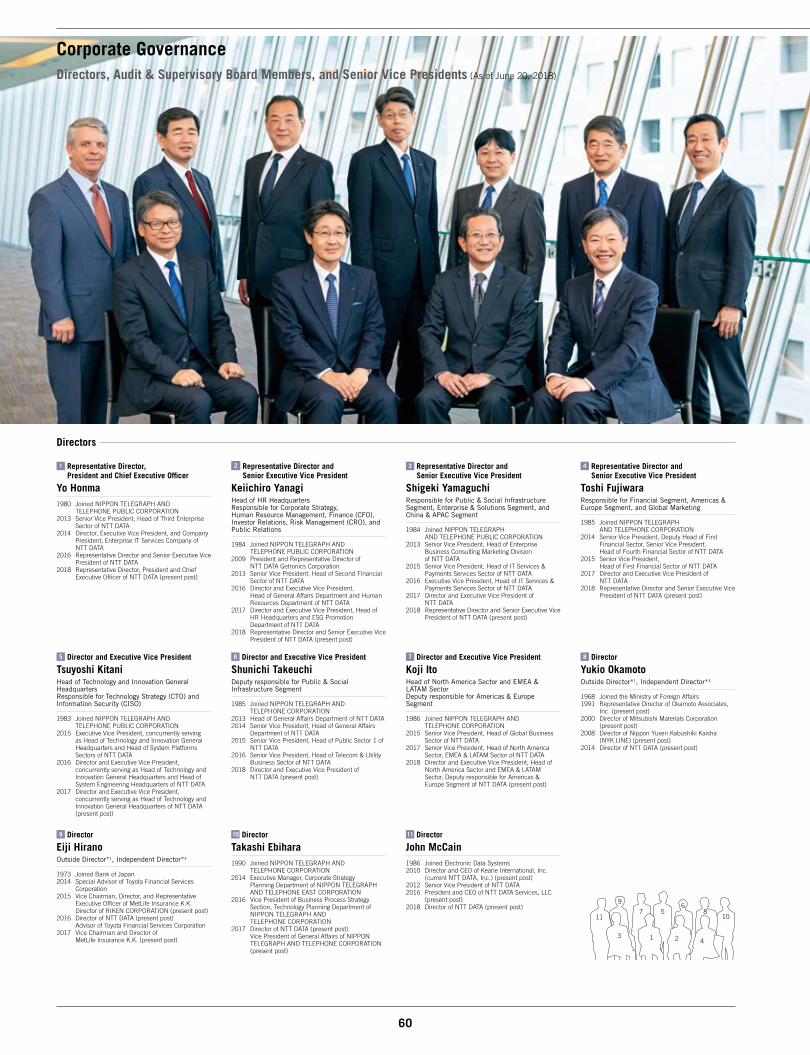
60 61
Corporate GovernanceDirectors, Audit & Supervisory Board Members, and Senior Vice Presidents (As of June 20, 2018)
10
3 1 2 4
11
9
7 56
8
1 Representative Director, President and Chief Executive Officer
Yo Honma 1980 Joined NIPPON TELEGRAPH AND
TELEPHONE PUBLIC CORPORATION2013 Senior Vice President, Head of Third Enterprise
Sector of NTT DATA2014 Director, Executive Vice President, and Company
President, Enterprise IT Services Company of NTT DATA
2016 Representative Director and Senior Executive Vice President of NTT DATA
2018 Representative Director, President and Chief Executive Officer of NTT DATA (present post)
2 Representative Director and Senior Executive Vice President
Keiichiro YanagiHead of HR Headquarters Responsible for Corporate Strategy, Human Resource Management, Finance (CFO), Investor Relations, Risk Management (CRO), and Public Relations 1984 Joined NIPPON TELEGRAPH AND
TELEPHONE PUBLIC CORPORATION2009 President and Representative Director of
NTT DATA Getronics Corporation2013 Senior Vice President, Head of Second Financial
Sector of NTT DATA2016 Director and Executive Vice President,
Head of General Affairs Department and Human Resources Department of NTT DATA
2017 Director and Executive Vice President, Head of HR Headquarters and ESG Promotion Department of NTT DATA
2018 Representative Director and Senior Executive Vice President of NTT DATA (present post)
3 Representative Director and Senior Executive Vice President
Shigeki YamaguchiResponsible for Public & Social Infrastructure Segment, Enterprise & Solutions Segment, and China & APAC Segment 1984 Joined NIPPON TELEGRAPH
AND TELEPHONE PUBLIC CORPORATION2013 Senior Vice President, Head of Enterprise
Business Consulting Marketing Division of NTT DATA
2015 Senior Vice President, Head of IT Services & Payments Services Sector of NTT DATA
2016 Executive Vice President, Head of IT Services & Payments Services Sector of NTT DATA
2017 Director and Executive Vice President of NTT DATA
2018 Representative Director and Senior Executive Vice President of NTT DATA (present post)
5 Director and Executive Vice President
Tsuyoshi KitaniHead of Technology and Innovation General Headquarters Responsible for Technology Strategy (CTO) and Information Security (CISO) 1983 Joined NIPPON TELEGRAPH AND
TELEPHONE PUBLIC CORPORATION2015 Executive Vice President, concurrently serving
as Head of Technology and Innovation General Headquarters and Head of System Platforms Sectors of NTT DATA
2016 Director and Executive Vice President, concurrently serving as Head of Technology and Innovation General Headquarters and Head of System Engineering Headquarters of NTT DATA
2017 Director and Executive Vice President, concurrently serving as Head of Technology and Innovation General Headquarters of NTT DATA (present post)
6 Director and Executive Vice President
Shunichi TakeuchiDeputy responsible for Public & Social Infrastructure Segment 1985 Joined NIPPON TELEGRAPH AND
TELEPHONE CORPORATION2013 Head of General Affairs Department of NTT DATA2014 Senior Vice President, Head of General Affairs
Department of NTT DATA2015 Senior Vice President, Head of Public Sector 1 of
NTT DATA2016 Senior Vice President, Head of Telecom & Utility
Business Sector of NTT DATA2018 Director and Executive Vice President of
NTT DATA (present post)
8 Director
Yukio OkamotoOutside Director*1, Independent Director*3
1968 Joined the Ministry of Foreign Affairs1991 Representative Director of Okamoto Associates,
Inc. (present post)2000 Director of Mitsubishi Materials Corporation
(present post)2008 Director of Nippon Yusen Kabushiki Kaisha
(NYK LINE) (present post)2014 Director of NTT DATA (present post)
10 Director
Takashi Ebihara 1990 Joined NIPPON TELEGRAPH AND
TELEPHONE CORPORATION2014 Executive Manager, Corporate Strategy
Planning Department of NIPPON TELEGRAPH AND TELEPHONE EAST CORPORATION
2016 Vice President of Business Process Strategy Section, Technology Planning Department of NIPPON TELEGRAPH AND TELEPHONE CORPORATION
2017 Director of NTT DATA (present post) Vice President of General Affairs of NIPPON TELEGRAPH AND TELEPHONE CORPORATION (present post)
11 Director
John McCain 1986 Joined Electronic Data Systems2010 Director and CEO of Keane International, Inc.
(current NTT DATA, Inc.) (present post)2012 Senior Vice President of NTT DATA 2016 President and CEO of NTT DATA Services, LLC
(present post)2018 Director of NTT DATA (present post)
4 Representative Director and Senior Executive Vice President
Toshi FujiwaraResponsible for Financial Segment, Americas & Europe Segment, and Global Marketing 1985 Joined NIPPON TELEGRAPH
AND TELEPHONE CORPORATION2014 Senior Vice President, Deputy Head of First
Financial Sector, Senior Vice President, Head of Fourth Financial Sector of NTT DATA
2015 Senior Vice President, Head of First Financial Sector of NTT DATA
2017 Director and Executive Vice President of NTT DATA
2018 Representative Director and Senior Executive Vice President of NTT DATA (present post)
7 Director and Executive Vice President
Koji ItoHead of North America Sector and EMEA & LATAM Sector Deputy responsible for Americas & Europe Segment 1986 Joined NIPPON TELEGRAPH AND
TELEPHONE CORPORATION2015 Senior Vice President, Head of Global Business
Sector of NTT DATA2017 Senior Vice President, Head of North America
Sector, EMEA & LATAM Sector of NTT DATA2018 Director and Executive Vice President, Head of
North America Sector and EMEA & LATAM Sector, Deputy responsible for Americas & Europe Segment of NTT DATA (present post)
9 Director
Eiji HiranoOutside Director*1, Independent Director*3
1973 Joined Bank of Japan2014 Special Advisor of Toyota Financial Services
Corporation2015 Vice Chairman, Director, and Representative
Executive Officer of MetLife Insurance K.K. Director of RIKEN CORPORATION (present post)
2016 Director of NTT DATA (present post) Advisor of Toyota Financial Services Corporation
2017 Vice Chairman and Director of MetLife Insurance K.K. (present post)
Directors
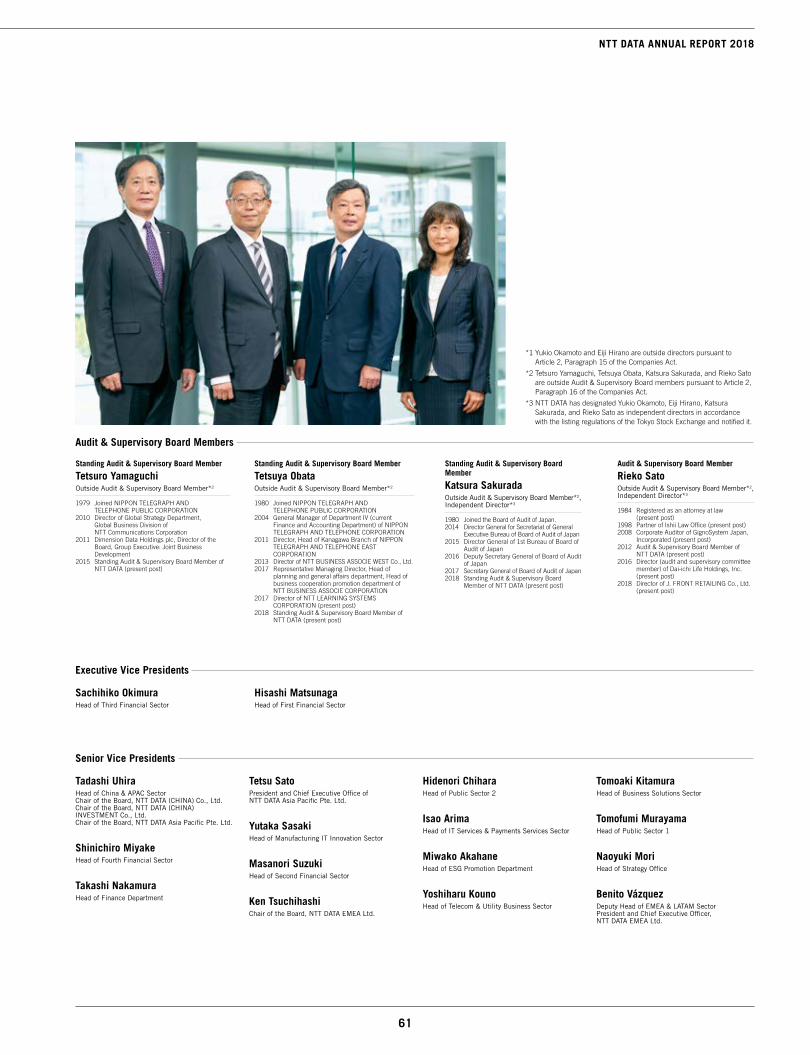
61
NTT DATA ANNUAL REPORT 2018
*1 Yukio Okamoto and Eiji Hirano are outside directors pursuant to Article 2, Paragraph 15 of the Companies Act.
*2 Tetsuro Yamaguchi, Tetsuya Obata, Katsura Sakurada, and Rieko Sato are outside Audit & Supervisory Board members pursuant to Article 2, Paragraph 16 of the Companies Act.
*3 NTT DATA has designated Yukio Okamoto, Eiji Hirano, Katsura Sakurada, and Rieko Sato as independent directors in accordance with the listing regulations of the Tokyo Stock Exchange and notified it.
Audit & Supervisory Board Member
Rieko SatoOutside Audit & Supervisory Board Member*2, Independent Director*3
1984 Registered as an attorney at law
(present post)1998 Partner of Ishii Law Office (present post)2008 Corporate Auditor of GignoSystem Japan,
Incorporated (present post)2012 Audit & Supervisory Board Member of
NTT DATA (present post)2016 Director (audit and supervisory committee
member) of Dai-ichi Life Holdings, Inc. (present post)
2018 Director of J. FRONT RETAILING Co., Ltd. (present post)
Standing Audit & Supervisory Board Member
Katsura SakuradaOutside Audit & Supervisory Board Member*2, Independent Director*3
1980 Joined the Board of Audit of Japan.2014 Director General for Secretariat of General
Executive Bureau of Board of Audit of Japan2015 Director General of 1st Bureau of Board of
Audit of Japan2016 Deputy Secretary General of Board of Audit
of Japan2017 Secretary General of Board of Audit of Japan2018 Standing Audit & Supervisory Board
Member of NTT DATA (present post)
Standing Audit & Supervisory Board Member
Tetsuro YamaguchiOutside Audit & Supervisory Board Member*2
1979 Joined NIPPON TELEGRAPH AND
TELEPHONE PUBLIC CORPORATION2010 Director of Global Strategy Department,
Global Business Division of NTT Communications Corporation
2011 Dimension Data Holdings plc, Director of the Board, Group Executive: Joint Business Development
2015 Standing Audit & Supervisory Board Member of NTT DATA (present post)
Standing Audit & Supervisory Board Member
Tetsuya ObataOutside Audit & Supervisory Board Member*2
1980 Joined NIPPON TELEGRAPH AND
TELEPHONE PUBLIC CORPORATION2004 General Manager of Department IV (current
Finance and Accounting Department) of NIPPON TELEGRAPH AND TELEPHONE CORPORATION
2011 Director, Head of Kanagawa Branch of NIPPON TELEGRAPH AND TELEPHONE EAST CORPORATION
2013 Director of NTT BUSINESS ASSOCIE WEST Co., Ltd.2017 Representative Managing Director, Head of
planning and general affairs department, Head of business cooperation promotion department of NTT BUSINESS ASSOCIE CORPORATION
2017 Director of NTT LEARNING SYSTEMS CORPORATION (present post)
2018 Standing Audit & Supervisory Board Member of NTT DATA (present post)
Audit & Supervisory Board Members
Sachihiko OkimuraHead of Third Financial Sector
Hisashi MatsunagaHead of First Financial Sector
Executive Vice Presidents
Tadashi UhiraHead of China & APAC Sector Chair of the Board, NTT DATA (CHINA) Co., Ltd. Chair of the Board, NTT DATA (CHINA) INVESTMENT Co., Ltd. Chair of the Board, NTT DATA Asia Pacific Pte. Ltd.
Shinichiro MiyakeHead of Fourth Financial Sector
Takashi NakamuraHead of Finance Department
Tetsu SatoPresident and Chief Executive Office of NTT DATA Asia Pacific Pte. Ltd.
Yutaka SasakiHead of Manufacturing IT Innovation Sector
Masanori SuzukiHead of Second Financial Sector
Ken TsuchihashiChair of the Board, NTT DATA EMEA Ltd.
Hidenori ChiharaHead of Public Sector 2
Isao ArimaHead of IT Services & Payments Services Sector
Miwako AkahaneHead of ESG Promotion Department
Yoshiharu KounoHead of Telecom & Utility Business Sector
Tomoaki KitamuraHead of Business Solutions Sector
Tomofumi MurayamaHead of Public Sector 1
Naoyuki MoriHead of Strategy Office
Benito VázquezDeputy Head of EMEA & LATAM Sector President and Chief Executive Officer, NTT DATA EMEA Ltd.
Senior Vice Presidents

62 63
Corporate Governance
Basic Policy
The NTT DATA Group aims to establish a business structure that produces stable profits through continuous growth by carrying out the mission to create new systems and values with informa-tion technology for a more affluent and harmonious society, and also by forecasting future trends to swiftly and accurately respond to the changing market environment, client needs, and cutting-edge technology trends. Under this management philosophy, the NTT DATA Group has set the Medium-Term Management Plan (fiscal 2016 to 2018), pursued business growth in regions around the world, established key principles, “NTT DATA: ASCEND Rise and grow our global brand” to enhance our brand value as a global brand by increas-ing our local presence and using global synergy effects, and carried out the global strategies of “Game-Changing Approach” and “Breakthrough Technology.” The NTT DATA Group will play an active role in overcoming the various issues that face society through the appropriate provi-sion of various information services by the Group’s officers and employees based on common sense, as well as in compliance with laws and contracts at home and abroad and in respecting international standards including those of human rights. Under these concepts, NTT DATA is working on the following basic policies in accordance with the purpose of each principle of the Corporate Governance Code to ensure that corporate gover-nance will effectively function: (1) to ensure transparency and soundness in business management, (2) to achieve appropriate and swift decision-making and business execution, and (3) to implement compliance thoroughly. The purpose of working on such basic policies is to meet the various expectations of stake-holders, including shareholders, investors, clients, business partners, and employees, and to maximize enterprise value.
(1) Ensuring Transparency and Soundness in Business Management
NTT DATA strives to disclose information in a just, fair, and timely manner in accordance with the Disclosure Policy, based on Disclosure Guidelines. Such disclosure is important in that it enables the market to appraise NTT DATA appropriately. For this reason, NTT DATA holds a meeting for explanation of financial results when financial results are announced quarterly, and often holds other meetings for domestic and international investors and analysts, in order to ensure transparency in business man-agement. To reinforce the function of supervising and auditing the fairness in business execution, NTT DATA appoints outside directors and outside audits to ensure soundness in its business management, its Board of Directors supervises and the Audit & Supervisory Board audits business execution. NTT DATA also priorities maximizing profits its shareholders when transacting
business with NIPPON TELEGRAPH AND TELEPHONE CORPORATION (hereinafter referred to as “NTT”), the parent company of NTT DATA, and the companies in the NTT Group.
(2) Achievement of Appropriate and Swift Decision-Making and Business Execution
Decision-making at NTT DATA is carried out under the supervi-sion of the Board of Directors in accordance with the Authority Rules, which stipulate the responsibility and authority of the President and Chief Executive Officer, the Senior Executive Vice Presidents, the Officers in charge of each segment, and the Heads of each section or group. For smooth and swift decision-making and supervision in its business operations, NTT DATA has established the Corporate Management Committee,” which is made up of the President and Chief Executive Officer, the Senior Executive Vice Presidents, Officers in charge of each segment, and other Heads of important sections or groups, and has prior discussions at the Committee for effective deliberations about the items to be resolved at the Board of Directors’ Meeting. In addition, NTT DATA pursues appropriate and swift decision-making and business execution by placing Senior Vice Presidents in charge of business execution, assigning most of the authority relating to business execution to such Senior Vice Presidents from directors, with each section or group executing business operations independently and responsibly in accordance with the Organizational Regulations.
(3) Thorough Implementation of Compliance
NTT DATA is determined to operate its business in accordance with high ethical standards as well as compliance by setting up the Global Compliance Policy, targeted at all officers and employ-ees of the NTT DATA Group, in order to clarify its basic policy and specific behavior guidelines relating to corporate ethics. To make such business operation effective, NTT DATA considers it necessary to implement a continuous educational campaign to promote the awareness of such ethics and compliance. Therefore, it has been holding training sessions on compliance targeted at employees and conducting employees’ attitude sur-veys. Aiming for more openness in its corporate culture, NTT DATA has placed reception desks for “the Whistle Line,” which is cross-sectional within the Group, as an internal and external point to receive any declaration, whether anonymous or named. NTT DATA ensures that any declarer to the reception desk through “the Whistle Line” is not unfavorably treated because of his or her declaration.
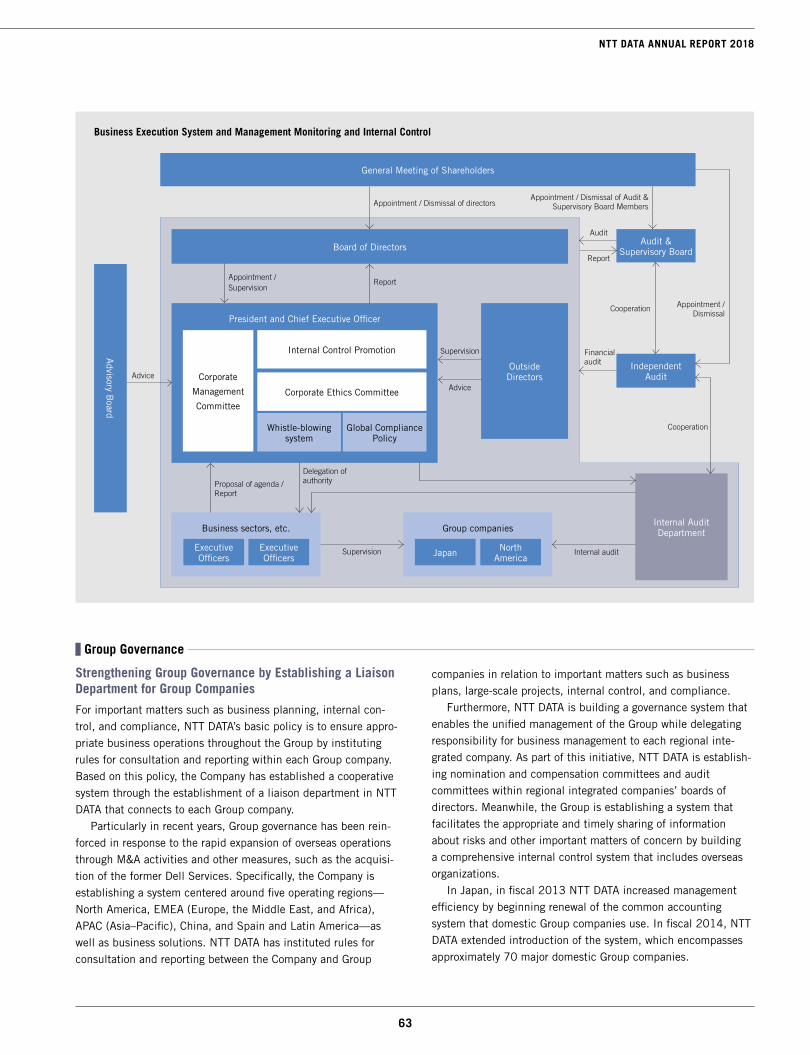
63
NTT DATA ANNUAL REPORT 2018
Group Governance
Strengthening Group Governance by Establishing a Liaison Department for Group Companies
For important matters such as business planning, internal con-trol, and compliance, NTT DATA’s basic policy is to ensure appro-priate business operations throughout the Group by instituting rules for consultation and reporting within each Group company. Based on this policy, the Company has established a cooperative system through the establishment of a liaison department in NTT DATA that connects to each Group company. Particularly in recent years, Group governance has been rein-forced in response to the rapid expansion of overseas operations through M&A activities and other measures, such as the acquisi-tion of the former Dell Services. Specifically, the Company is establishing a system centered around five operating regions—North America, EMEA (Europe, the Middle East, and Africa), APAC (Asia–Pacific), China, and Spain and Latin America—as well as business solutions. NTT DATA has instituted rules for consultation and reporting between the Company and Group
companies in relation to important matters such as business plans, large-scale projects, internal control, and compliance. Furthermore, NTT DATA is building a governance system that enables the unified management of the Group while delegating responsibility for business management to each regional inte-grated company. As part of this initiative, NTT DATA is establish-ing nomination and compensation committees and audit committees within regional integrated companies’ boards of directors. Meanwhile, the Group is establishing a system that facilitates the appropriate and timely sharing of information about risks and other important matters of concern by building a comprehensive internal control system that includes overseas organizations. In Japan, in fiscal 2013 NTT DATA increased management efficiency by beginning renewal of the common accounting system that domestic Group companies use. In fiscal 2014, NTT DATA extended introduction of the system, which encompasses approximately 70 major domestic Group companies.
Business Execution System and Management Monitoring and Internal Control
Advisory B
oard
General Meeting of Shareholders
Board of Directors
President and Chief Executive Officer
Outside Directors
Internal Audit Department
Independent Audit
Audit & Supervisory Board
Corporate
Management
Committee
Internal Control Promotion
Corporate Ethics Committee
Whistle-blowing system
Global Compliance Policy
Business sectors, etc.
Executive Officers
Executive Officers
Group companies
Japan North America
Appointment / Dismissal of directorsAppointment / Dismissal of Audit &
Supervisory Board Members
Appointment /Supervision
Report
Audit
Report
Cooperation Appointment /Dismissal
Financial audit
Advice
Supervision
Proposal of agenda /Report
Delegation of authority
Internal auditSupervision
Advice
Cooperation

64 65
As a result, most domestic Group companies use a common accounting system. This enables centralized management of accounting information and the securing of internal control. Furthermore, the use of this system significantly reduces maintenance and operational burdens. Moreover, aiming to increase the efficiency of Group manage-ment, NTT DATA introduced an in-house Group Management Infrastructure system that visualizes Group companies’ manage-ment information (in the financial and personnel fields) to domes-tic Group companies. Through this new system, NTT DATA aims to optimize management resource allocation to reflect project charac-teristics, expedite business management, enhance the revision of information used for decision-making, and realize Group synergies.
Ensuring Robust Group Governance Based on Group Management Policies and Group Management Rules
To optimize the Group as a whole, the NTT DATA Group estab-lished Group Management Policies to define the basic approach to Group management. Furthermore, with respect to consultation and reporting between NTT DATA and Group companies, Group Management Rules have been established for domestic Group companies and a Group Authority Matrix has been established for overseas Group companies. The rules and matrix are used in combination with Group Management Policies to realize robust management of Group governance.
Norbert Rotter
Business Solutions
Fritz Hoderlein
everis
Bob Pryor
NTT DATA Services
Benito Vázquez
NTT DATA EMEA
Tetsu Sato
NTT DATA APAC
Tadashi Uhira
NTT DATA China
JapanEmployees
Approx. 36,000
Strengthen collaboration among Group companies, and enhance Group governance
APACEmployees
Approx. 7,000
IndiaEmployees
Approx. 22,000
North AmericaEmployees
Approx. 16,000
EMEA & Latin AmericaEmployees
Approx. 36,000
53 countries and regions 214 cities Approx.118,000 professionals
North America EMEA & Latin America China & APAC
Initiatives to Inculcate Our Group Vision “Values Week”
The NTT DATA Group strives to share the values that express the principles we cherish to realize our Group Vision. Specifically, these efforts include Values Week, held annually in May to commemorate our founding, and other events that facilitate discussions pertaining to our values. In fiscal 2017, roughly 15,000 employees from over 100 cities in approximately 30 countries and regions participated in these activities.
Corporate Governance
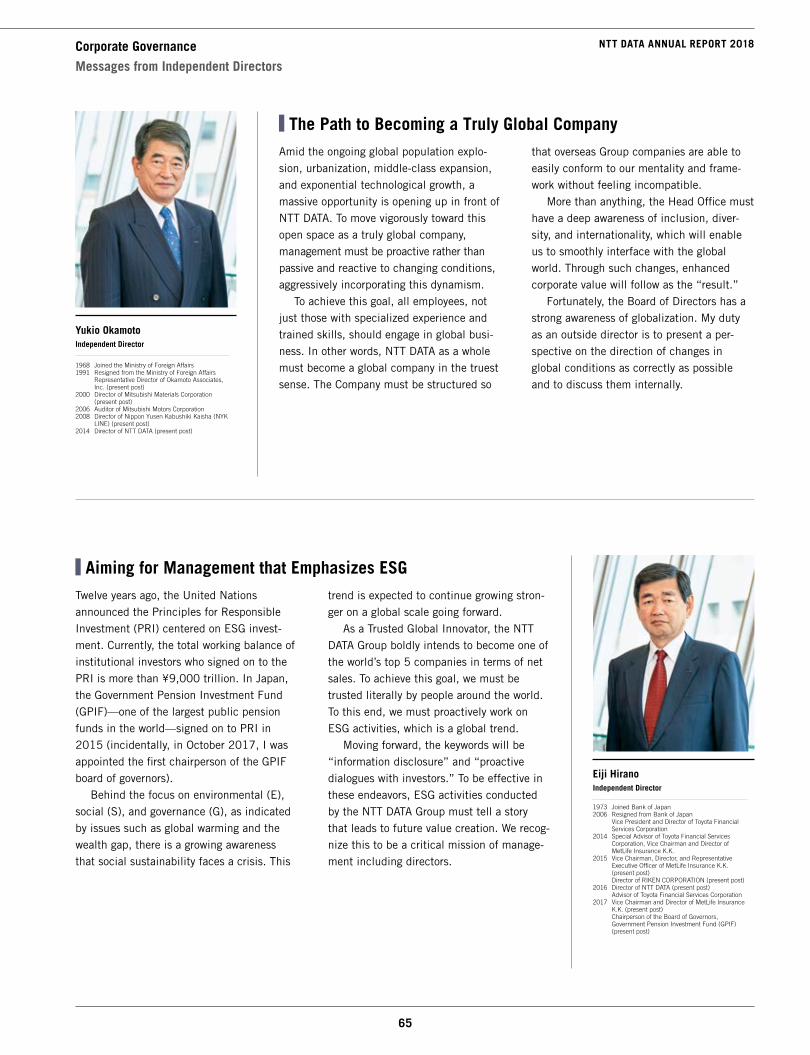
65
NTT DATA ANNUAL REPORT 2018
Yukio OkamotoIndependent Director 1968 Joined the Ministry of Foreign Affairs1991 Resigned from the Ministry of Foreign Affairs
Representative Director of Okamoto Associates, Inc. (present post)
2000 Director of Mitsubishi Materials Corporation (present post)
2006 Auditor of Mitsubishi Motors Corporation2008 Director of Nippon Yusen Kabushiki Kaisha (NYK
LINE) (present post)2014 Director of NTT DATA (present post)
Corporate Governance
Messages from Independent Directors
The Path to Becoming a Truly Global CompanyAmid the ongoing global population explo-sion, urbanization, middle-class expansion, and exponential technological growth, a massive opportunity is opening up in front of NTT DATA. To move vigorously toward this open space as a truly global company, management must be proactive rather than passive and reactive to changing conditions, aggressively incorporating this dynamism. To achieve this goal, all employees, not just those with specialized experience and trained skills, should engage in global busi-ness. In other words, NTT DATA as a whole must become a global company in the truest sense. The Company must be structured so
that overseas Group companies are able to easily conform to our mentality and frame-work without feeling incompatible. More than anything, the Head Office must have a deep awareness of inclusion, diver-sity, and internationality, which will enable us to smoothly interface with the global world. Through such changes, enhanced corporate value will follow as the “result.” Fortunately, the Board of Directors has a strong awareness of globalization. My duty as an outside director is to present a per-spective on the direction of changes in global conditions as correctly as possible and to discuss them internally.
Eiji HiranoIndependent Director 1973 Joined Bank of Japan2006 Resigned from Bank of Japan
Vice President and Director of Toyota Financial Services Corporation
2014 Special Advisor of Toyota Financial Services Corporation, Vice Chairman and Director of MetLife Insurance K.K.
2015 Vice Chairman, Director, and Representative Executive Officer of MetLife Insurance K.K. (present post) Director of RIKEN CORPORATION (present post)
2016 Director of NTT DATA (present post) Advisor of Toyota Financial Services Corporation2017 Vice Chairman and Director of MetLife Insurance
K.K. (present post) Chairperson of the Board of Governors, Government Pension Investment Fund (GPIF) (present post)
Aiming for Management that Emphasizes ESGTwelve years ago, the United Nations announced the Principles for Responsible Investment (PRI) centered on ESG invest-ment. Currently, the total working balance of institutional investors who signed on to the PRI is more than ¥9,000 trillion. In Japan, the Government Pension Investment Fund (GPIF)—one of the largest public pension funds in the world—signed on to PRI in 2015 (incidentally, in October 2017, I was appointed the first chairperson of the GPIF board of governors). Behind the focus on environmental (E), social (S), and governance (G), as indicated by issues such as global warming and the wealth gap, there is a growing awareness that social sustainability faces a crisis. This
trend is expected to continue growing stron-ger on a global scale going forward. As a Trusted Global Innovator, the NTT DATA Group boldly intends to become one of the world’s top 5 companies in terms of net sales. To achieve this goal, we must be trusted literally by people around the world. To this end, we must proactively work on ESG activities, which is a global trend. Moving forward, the keywords will be “information disclosure” and “proactive dialogues with investors.” To be effective in these endeavors, ESG activities conducted by the NTT DATA Group must tell a story that leads to future value creation. We recog-nize this to be a critical mission of manage-ment including directors.
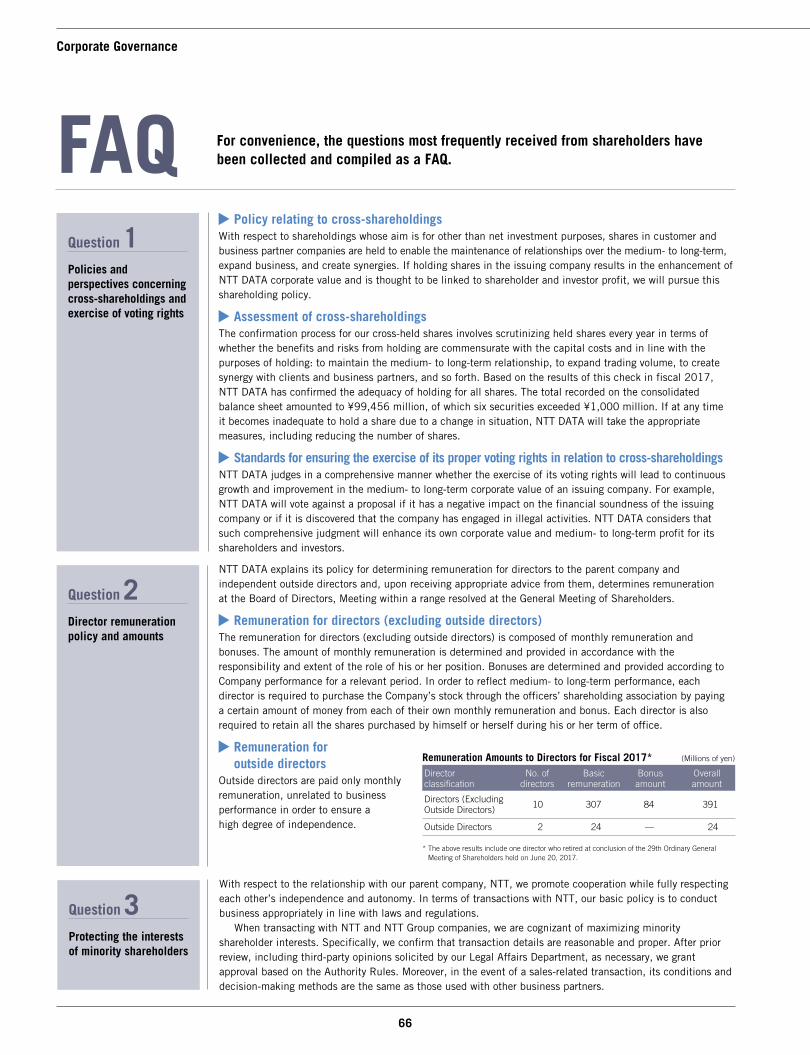
66 67
For convenience, the questions most frequently received from shareholders have been collected and compiled as a FAQ. FAQ
Question 1Policies and perspectives concerning cross-shareholdings and exercise of voting rights
Policy relating to cross-shareholdingsWith respect to shareholdings whose aim is for other than net investment purposes, shares in customer and business partner companies are held to enable the maintenance of relationships over the medium- to long-term, expand business, and create synergies. If holding shares in the issuing company results in the enhancement of NTT DATA corporate value and is thought to be linked to shareholder and investor profit, we will pursue this shareholding policy.
Assessment of cross-shareholdingsThe confirmation process for our cross-held shares involves scrutinizing held shares every year in terms of whether the benefits and risks from holding are commensurate with the capital costs and in line with the purposes of holding: to maintain the medium- to long-term relationship, to expand trading volume, to create synergy with clients and business partners, and so forth. Based on the results of this check in fiscal 2017, NTT DATA has confirmed the adequacy of holding for all shares. The total recorded on the consolidated balance sheet amounted to ¥99,456 million, of which six securities exceeded ¥1,000 million. If at any time it becomes inadequate to hold a share due to a change in situation, NTT DATA will take the appropriate measures, including reducing the number of shares.
Standards for ensuring the exercise of its proper voting rights in relation to cross-shareholdings NTT DATA judges in a comprehensive manner whether the exercise of its voting rights will lead to continuous growth and improvement in the medium- to long-term corporate value of an issuing company. For example, NTT DATA will vote against a proposal if it has a negative impact on the financial soundness of the issuing company or if it is discovered that the company has engaged in illegal activities. NTT DATA considers that such comprehensive judgment will enhance its own corporate value and medium- to long-term profit for its shareholders and investors.
Question 2Director remuneration policy and amounts
NTT DATA explains its policy for determining remuneration for directors to the parent company and independent outside directors and, upon receiving appropriate advice from them, determines remuneration at the Board of Directors, Meeting within a range resolved at the General Meeting of Shareholders.
Remuneration for directors (excluding outside directors)The remuneration for directors (excluding outside directors) is composed of monthly remuneration and bonuses. The amount of monthly remuneration is determined and provided in accordance with the responsibility and extent of the role of his or her position. Bonuses are determined and provided according to Company performance for a relevant period. In order to reflect medium- to long-term performance, each director is required to purchase the Company’s stock through the officers’ shareholding association by paying a certain amount of money from each of their own monthly remuneration and bonus. Each director is also required to retain all the shares purchased by himself or herself during his or her term of office.
Remuneration for outside directors
Outside directors are paid only monthly remuneration, unrelated to business performance in order to ensure a high degree of independence.
Remuneration Amounts to Directors for Fiscal 2017*Director classification
No. of directors
Basic remuneration
Bonus amount
Overall amount
Directors (Excluding Outside Directors) 10 307 84 391
Outside Directors 2 24 — 24
* The above results include one director who retired at conclusion of the 29th Ordinary General Meeting of Shareholders held on June 20, 2017.
With respect to the relationship with our parent company, NTT, we promote cooperation while fully respecting each other’s independence and autonomy. In terms of transactions with NTT, our basic policy is to conduct business appropriately in line with laws and regulations. When transacting with NTT and NTT Group companies, we are cognizant of maximizing minority shareholder interests. Specifically, we confirm that transaction details are reasonable and proper. After prior review, including third-party opinions solicited by our Legal Affairs Department, as necessary, we grant approval based on the Authority Rules. Moreover, in the event of a sales-related transaction, its conditions and decision-making methods are the same as those used with other business partners.
Question 3 Protecting the interests of minority shareholders
Corporate Governance
(Millions of yen)
67
NTT DATA ANNUAL REPORT 2018
Question 4Evaluation of the effectiveness of the Board of Directors
• We have increased the number of outside directors from one in fiscal 2016 to two in fiscal 2017 in order to improve monitoring of management.
• All corporate audits are from outside the Company. They attend important meetings, including meetings of the Board of Directors, and function as a check by providing opinions in terms of laws, regulations, and the articles of incorporation from a perspective independent of business executed by the Company.
• In order to maintain effectiveness of the Board of Directors, the Company promotes the appointment of female directors in line with its human resource policy of selecting candidates on the basis of superior character, insight, and management ability regardless of age or gender. At the present time, we have appointed one foreign director and one female Audit & Supervisory Board Member, and since fiscal 2018 we have newly selected one female senior vice president and appointed her as the secretary general of the Board of Directors. We ensure diversity in our Board of Directors from an international and gender point of view by having these directors attend Board meetings and participate in discussions.
The Board of Directors determines important matters concerning Company and Group management, and oversees directors’ performance by receiving quarterly reports on the performance of their duties. Additionally, the Board of Directors started to conduct self-assessment / analysis for its effectiveness in fiscal 2016 for the purpose of improving the function of the Board of Directors and maximizing corporate value. The second of these self-assessments / analyses were carried out in fiscal 2017, in a similar manner to the one carried out in the previous fiscal year. An overview of this evaluation is as described below.
Method of evaluation Time of implementation: October 2017 Evaluation method: A questionnaire is completed by all directors and audits on the Board of Directors Managing responses: Responses are managed through an external institution in order to ensure anonymity.
Results of evaluationAnalysis, discussion, and evaluation took place from December 2017 to February 2018, based on aggregated results reported by an external institution. The evaluation results were reported to the Board of Directors, who then held discussion to verify the details of the results, and put forth policies for further improvement. The general assessment in terms of the organization and operation of the Board of Directors was positive, and recognizes the effectiveness of the Board in its entirety. In regard to efforts to increase the weight of discussion on managerial strategy implemented in response to issues that arose in fiscal 2016, the Board of Directors reviewed the agenda criteria and set the opportunities for such discussions. It was thus evaluated that definite steps toward improvement have been taken.
Responses based on the evaluation results, etc.We have confirmed that improvement has been made overall since fiscal 2016. However, we have identified further issues to improve as described below. In addition to those issues, we continue to work toward develop-ing management policies for improvement, including finding better ways to manage the Board of Directors. • Further enhance and deepen discussions involving management strategy and plans from the formulation stage onward.• In terms of risk management, make revisions so even when cases do not fall under the agenda criteria of the Board
of the Directors, they will be considered as matters to be reported based on importance and risk.• Further enhance content of reports to investors based on their request to receive more detailed information from the
Board of Directors. Moving forward, we will continue to evaluate the effectiveness of the Board of Directors and promote efforts to raise its functionality.
Question 5 Initiatives to strengthen governance
For details on our efforts, please see the Corporate Governance section.
https://www.nttdata.com/global/en/investors/corporate-governance
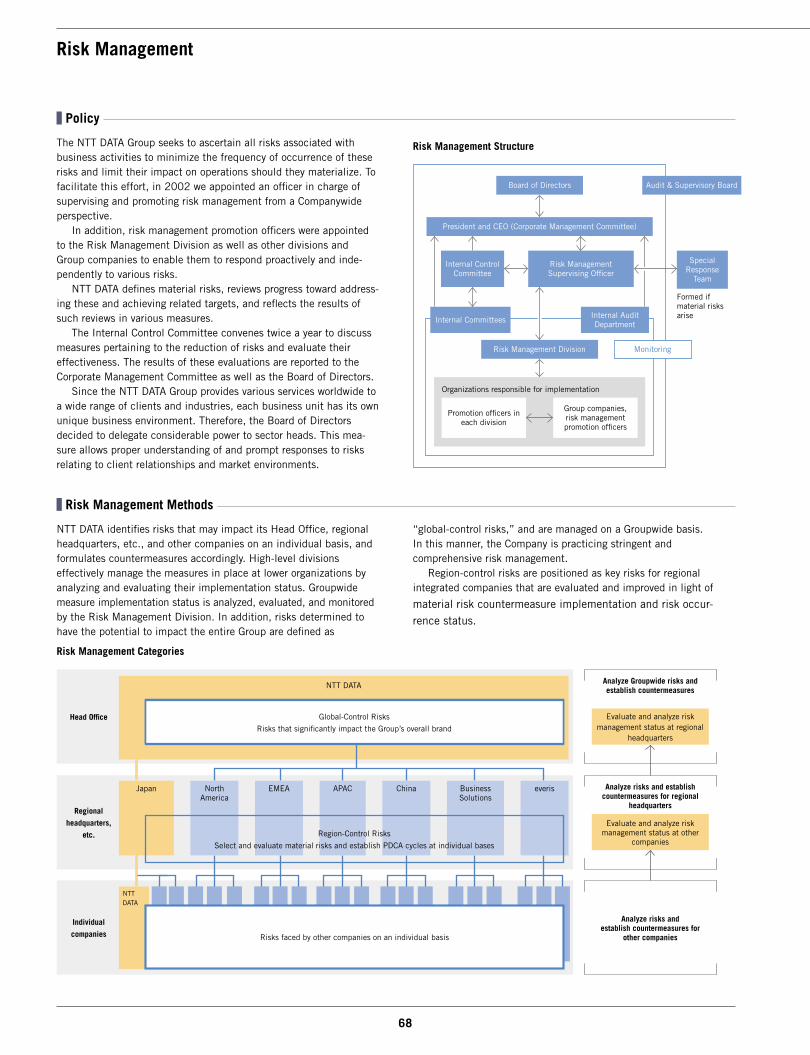
68 69
Policy
The NTT DATA Group seeks to ascertain all risks associated with business activities to minimize the frequency of occurrence of these risks and limit their impact on operations should they materialize. To facilitate this effort, in 2002 we appointed an officer in charge of supervising and promoting risk management from a Companywide perspective. In addition, risk management promotion officers were appointed to the Risk Management Division as well as other divisions and Group companies to enable them to respond proactively and inde-pendently to various risks. NTT DATA defines material risks, reviews progress toward address-ing these and achieving related targets, and reflects the results of such reviews in various measures. The Internal Control Committee convenes twice a year to discuss measures pertaining to the reduction of risks and evaluate their effectiveness. The results of these evaluations are reported to the Corporate Management Committee as well as the Board of Directors. Since the NTT DATA Group provides various services worldwide to a wide range of clients and industries, each business unit has its own unique business environment. Therefore, the Board of Directors decided to delegate considerable power to sector heads. This mea-sure allows proper understanding of and prompt responses to risks relating to client relationships and market environments.
Risk Management Categories
Risk Management Methods
NTT DATA identifies risks that may impact its Head Office, regional headquarters, etc., and other companies on an individual basis, and formulates countermeasures accordingly. High-level divisions effectively manage the measures in place at lower organizations by analyzing and evaluating their implementation status. Groupwide measure implementation status is analyzed, evaluated, and monitored by the Risk Management Division. In addition, risks determined to have the potential to impact the entire Group are defined as
“global-control risks,” and are managed on a Groupwide basis. In this manner, the Company is practicing stringent and comprehensive risk management. Region-control risks are positioned as key risks for regional integrated companies that are evaluated and improved in light of
material risk countermeasure implementation and risk occur-rence status.
Risk Management
Risk Management Structure
Board of Directors
President and CEO (Corporate Management Committee)
Internal Committees Internal Audit Department
Audit & Supervisory Board
Organizations responsible for implementation
Promotion officers in each division
Group companies, risk management promotion officers
Special Response
Team
Internal Control Committee
Risk Management Supervising Officer
Risk Management Division Monitoring
Formed if material risks arise
Head Office
NTT DATA
Regional
headquarters,
etc.
Individual
companies
NTT DATA
Japan North America
EMEA APAC China Business Solutions
everis
Risks faced by other companies on an individual basis
Analyze Groupwide risks and establish countermeasures
Evaluate and analyze risk management status at regional
headquarters
Analyze risks and establish countermeasures for regional
headquarters
Evaluate and analyze risk management status at other
companies
Analyze risks and establish countermeasures for
other companies
Global-Control Risks
Risks that significantly impact the Group’s overall brand
Region-Control Risks
Select and evaluate material risks and establish PDCA cycles at individual bases
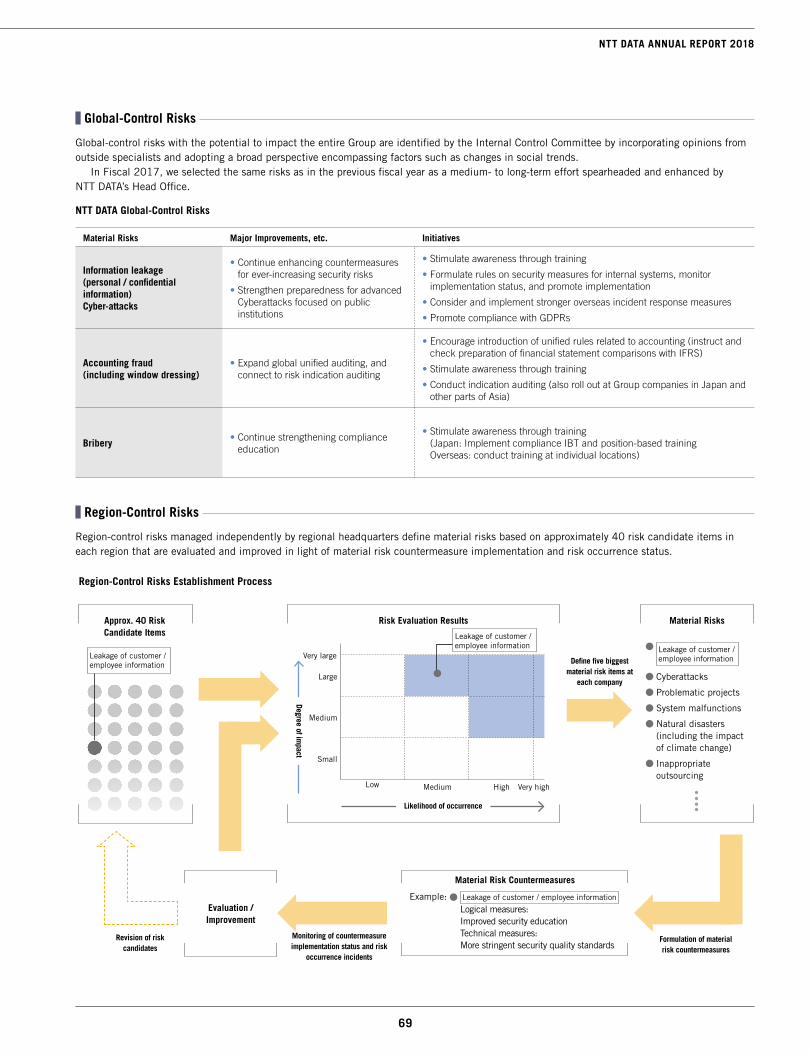
69
NTT DATA ANNUAL REPORT 2018
Global-Control Risks
Global-control risks with the potential to impact the entire Group are identified by the Internal Control Committee by incorporating opinions from outside specialists and adopting a broad perspective encompassing factors such as changes in social trends. In Fiscal 2017, we selected the same risks as in the previous fiscal year as a medium- to long-term effort spearheaded and enhanced by NTT DATA’s Head Office.
NTT DATA Global-Control Risks
Material Risks Major Improvements, etc. Initiatives
Information leakage (personal / confidential information) Cyber-attacks
• Continue enhancing countermeasures for ever-increasing security risks
• Strengthen preparedness for advanced Cyberattacks focused on public institutions
• Stimulate awareness through training
• Formulate rules on security measures for internal systems, monitor implementation status, and promote implementation
• Consider and implement stronger overseas incident response measures
• Promote compliance with GDPRs
Accounting fraud (including window dressing)
• Expand global unified auditing, and connect to risk indication auditing
• Encourage introduction of unified rules related to accounting (instruct and check preparation of financial statement comparisons with IFRS)
• Stimulate awareness through training
• Conduct indication auditing (also roll out at Group companies in Japan and other parts of Asia)
Bribery• Continue strengthening compliance
education
• Stimulate awareness through training (Japan: Implement compliance IBT and position-based training Overseas: conduct training at individual locations)
Risk Evaluation Results
Large
Low Medium High Very high
Very large
Small
Likelihood of occurrence
Material Risks
Cyberattacks
Problematic projects
System malfunctions
Natural disasters (including the impact of climate change)
Inappropriate outsourcing
Leakage of customer / employee information
Approx. 40 Risk Candidate Items
Region-Control Risks Establishment Process
Material Risk Countermeasures
Evaluation / Improvement
Define five biggest material risk items at
each company
Monitoring of countermeasure implementation status and risk
occurrence incidents
Revision of risk candidates
Leakage of customer / employee information
Leakage of customer / employee information
Formulation of material risk countermeasures
Region-Control Risks
Region-control risks managed independently by regional headquarters define material risks based on approximately 40 risk candidate items in each region that are evaluated and improved in light of material risk countermeasure implementation and risk occurrence status.
Medium
Degree of impact
Example: Logical measures: Improved security education Technical measures: More stringent security quality standards
Leakage of customer / employee information

70 71
Information Security Management System
The Information Security Committee ascertains the Companywide status of information security activities and areas requiring improve-ment and formulates necessary initiatives. In addition, NTTDATA-CERT was established as a specialized organization for preventing information security incidents*1 and responding to any incidents that might occur. NTT DATA also joined the Nippon CSIRT Association as well as Forum of Incident Response and Security Teams (FIRST)*2, which is a global computer security incident response team (CSIRT)*3 community. Through our participation in these organiza-tions, we are collecting a wide range of information on security trends, which we then utilize to improve security. The information security governance structure comprises three levels of information security steering organizations located at the Head Office, regional headquarters, and other companies on an individual basis to ensure thorough global information security gover-nance. The information security steering organizations at each level cooperate closely to maintain and develop information security poli-cies, monitor information security measures, respond to emergencies, and engage in preventive measure activities to prevent incidents.
*1 The term information security incidents refers to the actualization events that pose security threats to information management and system operation, such as computer malware infection, unauthorized access, and information leakage.
*2 FIRST is a global community consisting of approximately 380 CSIRTs from government agencies, educational institutions, companies, and other organizations.
*3 A CSIRT is an incident response team comprised of security specialists. These teams collect and analyze information on security incidents, security-related technologies, and vulnerabilities, and conduct activities including implementing effective countermeasures and training.
Global Information Security Governance Points• Created a structure to promote the establishment of three levels
of information security steering organizations: Head Office, regional headquarters, and other companies
• Close cooperation among information security steering organizations
• Head Office conducts quarterly monitoring of control status at regional headquarters
Basic Approach Regarding Information Security
The Information Security Policy was established in 1998 as guidance for appropriately handling information assets and protecting informa-tion security, and the Personal Information Protection Policy was formulated in 2001. These policies are revised and improved in response to information technology progress and societal changes. The NTT DATA Group Security Policy (GSP) was also formulated in an effort to ensure the secure distribution of information throughout the entire Group. The objective of the GSP, ensuring both the safety of information and active use and sharing of information, is essential as a partner that supports customers’ efforts to create new businesses. To realize these objectives, we are promoting initiatives including logical measures covering the formulation of rules and provision of training and other educational activities related to information security, and technical measures such as introduction of a solution to prevent information leakage as well as the introduction of thin-client PCs.
Information Security
The number of cyberthreats to information systems has increased dramatically in recent years, due to fraudulent access via the Internet and targeted attacks, which involve the insertion of malware. To remain a trusted partner for its clients, based on its medium-term man-agement plan the NTT DATA Group has defined risks related to information security as a material risk affecting corporate management. Accordingly, we are focusing on information security measures. Specifically, we consider “various impacts of information security accidents posed by information outflows and leaks” to be risks. As a provider of information systems, we work to ensure information security and focus on personal information protection.
Structure of Information Security Governance
Regional headquarters, etc. Information Security Steering Organization
Other companies Information Security Steering Organization
Head Office
Information Security Steering Organization (Information Security Office)
Reports(serious incident)
Organizations Providing Regional Oversight
Reports(excluding serious incident)Request
Request Reports
RequestInformation sharing
Safe Groupwide Application of Knowledge
Creating new value
Guaranteeing information security
NTT DATA Group Security Policy (GSP)
Mission Statement
Technical measures
Logical measures
Interlinked
Ensuring safety of information
Actively utilizing and sharing information
Balance
NTT DATA regularly issues information security reports that summarize our concept on information security and initiatives.
We also explain medium- to long-term risks and initiatives focused on the future in this report.
For details on these initiatives, please see NTT DATA Information Security Report 2016:
https://www.nttdata.com/global/en/-/media/nttdataglobal/files/sustainability/sus001_home/sus001_information_security_report_2016.pdf

71
NTT DATA ANNUAL REPORT 2018
Initiatives Aimed at Strengthening NTT DATA Information Security
• Promulgation of Information Security Training and Educational Activities
Every year, information security and personal information protection training IBT is conducted for all employees. We also conduct initia-tives aimed at enhancing employee understanding, such as requiring that all questions are answered 100% correctly as a condition for completing the training. In addition, we conduct trainings each year to confirm that all employees are able to correctly identify and respond to targeted and distributed email attacks.
• Development of In-House IT Platforms for Reducing Risks
NTT DATA has in-house IT platforms in response to the following risks:
Thin-client“BIZXAAS Office” DaaS
Provide cloud PC environment for employees.Prevents information leaks from PC side, realizes energy-efficient offices.
Mobile platform“MERMaides”
Ensures safe business domains within mobile devices, offering strong protection of information by encrypting operational applications and data stored on devices.
“NOSiDE”quarantine system
This quarantine system inspects devices that access the Internet and prevents information leaks on the Internet due to cyberattacks and malware targeting vulnerabilities.
Information distributioninfrastructure“ETRANPOT”
System for the secure forwarding of large files among NTT DATA, NTT DATA Group companies, and related clients.
Security risks
Information leakage
Fake emails
Targeted e-mail attacks
Ransomware
Suspicious emails
Initiatives Aimed at Strengthening NTT DATA Group Information Security
To prepare against possible security risks, the NTT DATA Group formulates and promulgates necessary rules at the global level, promoting security training and awareness activities as well as the development of IT platforms.
• Policy Development and PromulgationWe formulated the GSP and promote the inculcation of this policy at Group companies worldwide. In particular, we developed and promul-gate Security Measure Standards Related to Internet-connected Environments with the intention of preventing information leaks from cyberattacks and malware infections via the Internet.
• Promulgation of Information Security Education and Awareness Activities at the Global Level
We issue a multilingual information security handbook in six lan-guages: Japanese, English, Chinese, Vietnamese, Portuguese, and Spanish (information security IBT is issued in three languages: Japanese, English, and Chinese).
• IT Platform DevelopmentWe conduct initiatives in an attempt to raise the level of security throughout the entire Group, including the joint development and operation of IT platforms for safely connecting to the Internet.
Initiatives Aimed at Strengthening Client Information Security
• Ensuring the Security of Commercial SystemsNTT DATA thoroughly engages in enhancing its ability to respond to cyberattacks on information systems, including unauthorized access and internal intrusions by means of malware (so-called targeted attacks), via the Internet and preventing internal fraud. Specifically, we promote 1 building appropriate security measures starting from the development stage, 2 conducting periodic vulnerability checks
(security diagnosis) for systems in operation, 3 strengthening our framework for promptly responding to detected critical vulnerabili-ties, and 4 ensuring sound operational management of important information. In addition, we strive to provide systems that can be used safely and securely by promptly sharing information on the latest security technology trends and vulnerability information.
Information Security and Personal Information Protection Training IBT
Goal
100% of employees completed training
Results
100% of employees completed training
Development of In-House IT Platforms for Reducing Risks

72 73
(Millions of yen)
Fiscal year 2016 2017
Assets Current assets Cash and deposits ¥ 212,459 ¥ 186,616 Notes and accounts receivable–trade 458,085 504,632 Lease receivables and investment assets 28,085 26,524 Securities 4,302 2,297 Inventories 31,211 41,165 Deferred tax assets 32,061 30,211 Deposits paid 55,808 12,000 Other 79,635 85,194 Allowance for doubtful accounts (3,740) (3,217) Total current assets 897,910 885,425Non-current assets Property, plant and equipment Data communication facilities 311,013 302,638 Accumulated depreciation (221,253) (212,979) Data communication facilities, net 89,760 89,659 Buildings and structures 317,875 325,518 Accumulated depreciation (202,879) (209,102) Buildings and structures, net 114,995 116,416 Machinery, equipment and vehicles 91,106 96,845 Accumulated depreciation (60,072) (60,610) Machinery, equipment and vehicles, net 31,034 36,234 Tools, furniture and fixtures 56,783 61,456 Accumulated depreciation (40,116) (41,228) Tools, furniture and fixtures, net 16,666 20,227 Land 63,835 66,131 Construction in progress 35,609 46,417 Other 10,231 11,388 Accumulated depreciation (5,273) (6,125) Other, net 4,957 5,263 Total property, plant and equipment 356,860 380,350 Intangible assets Software 240,304 238,636 Software in progress 61,168 78,050 Goodwill 315,261 311,658 Other 160,549 113,735 Total intangible assets 777,283 742,080 Investments and other assets Investment securities 86,834 112,803 Net defined benefit asset 5,603 6,932 Deferred tax assets 60,802 50,119 Other 54,419 57,299 Allowance for doubtful accounts (772) (734) Total investments and other assets 206,887 226,420 Total non-current assets 1,341,031 1,348,851 Total assets ¥2,238,941 ¥2,234,277
Financial InformationConsolidated Balance Sheets
NTT DATA Corporation and Subsidiaries
As of end of Fiscal 2016 (March 31, 2017) and end of Fiscal 2017 (March 31, 2018)

73
NTT DATA ANNUAL REPORT 2018
(Millions of yen)
Fiscal year 2016 2017
Liabilities Current liabilities Accounts payable–trade ¥ 138,453 ¥ 145,371 Short-term loans payable 213,160 46,846 Current portion of long-term loans payable 53,461 567 Current portion of bonds 49,996 50,000 Income taxes payable 35,916 26,212 Advances received 180,827 209,746 Provision for loss on order received 3,452 5,759 Other 158,351 181,468 Total current liabilities 833,619 665,971 Non-current liabilities Bonds payable 160,075 110,081 Long-term loans payable 168,618 358,779 Deferred tax liabilities 30,367 7,141 Net defined benefit liability 186,788 197,923 Provision for directors’ retirement benefits 876 909 Other 24,880 24,606 Total non-current liabilities 571,605 699,442 Total liabilities 1,405,225 1,365,414
Net assets Shareholders’ equity Capital stock 142,520 142,520 Capital surplus 141,048 140,977 Retained earnings 501,369 537,368 Treasury shares (0) (1) Total shareholders’ equity 784,937 820,864 Accumulated other comprehensive income Valuation difference on available-for-sale securities 39,881 57,754 Deferred gains or losses on hedges (155) 71 Foreign currency translation adjustment 23,889 (1,163) Remeasurements of defined benefit plans (30,083) (27,560) Other (16,320) (16,107) Total accumulated other comprehensive income 17,211 12,994 Non-controlling interests 31,567 35,003 Total net assets 833,715 868,863Total liabilities and net assets ¥2,238,941 ¥2,234,277
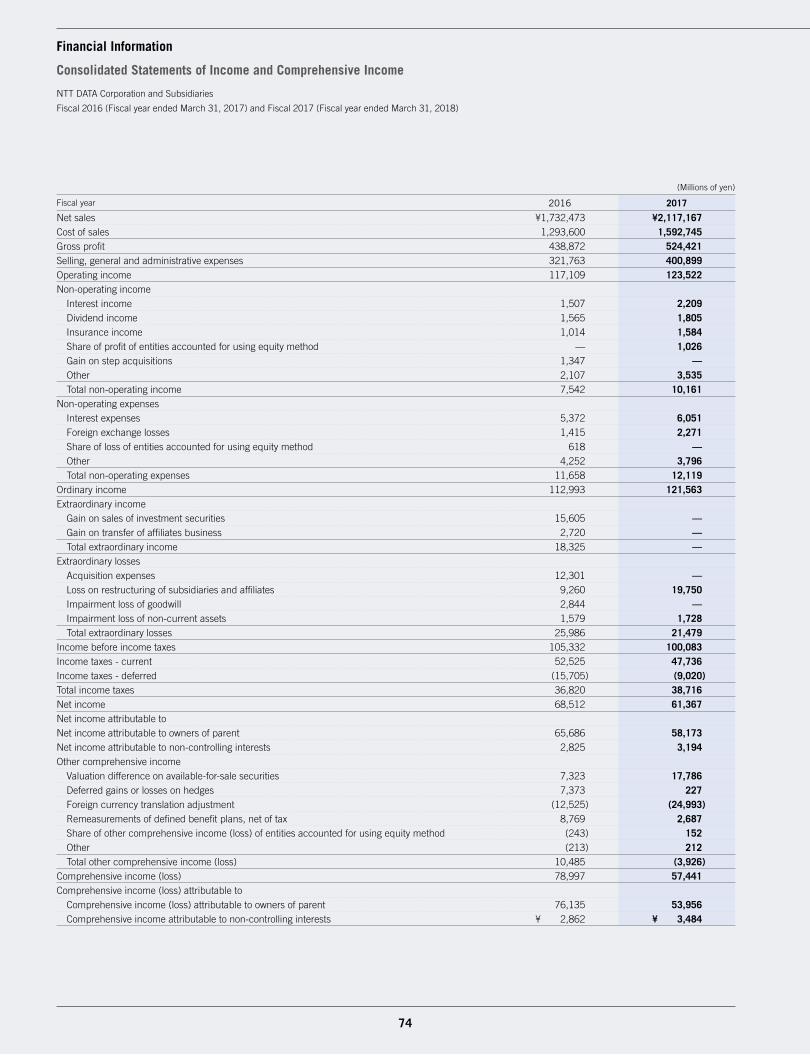
74 75
(Millions of yen)
Fiscal year 2016 2017
Net sales ¥1,732,473 ¥2,117,167Cost of sales 1,293,600 1,592,745Gross profit 438,872 524,421Selling, general and administrative expenses 321,763 400,899Operating income 117,109 123,522Non-operating income Interest income 1,507 2,209 Dividend income 1,565 1,805 Insurance income 1,014 1,584 Share of profit of entities accounted for using equity method — 1,026 Gain on step acquisitions 1,347 — Other 2,107 3,535 Total non-operating income 7,542 10,161Non-operating expenses Interest expenses 5,372 6,051 Foreign exchange losses 1,415 2,271 Share of loss of entities accounted for using equity method 618 — Other 4,252 3,796 Total non-operating expenses 11,658 12,119Ordinary income 112,993 121,563Extraordinary income Gain on sales of investment securities 15,605 — Gain on transfer of affiliates business 2,720 — Total extraordinary income 18,325 —Extraordinary losses Acquisition expenses 12,301 — Loss on restructuring of subsidiaries and affiliates 9,260 19,750 Impairment loss of goodwill 2,844 — Impairment loss of non-current assets 1,579 1,728 Total extraordinary losses 25,986 21,479Income before income taxes 105,332 100,083Income taxes - current 52,525 47,736Income taxes - deferred (15,705) (9,020)Total income taxes 36,820 38,716Net income 68,512 61,367Net income attributable toNet income attributable to owners of parent 65,686 58,173Net income attributable to non-controlling interests 2,825 3,194Other comprehensive income Valuation difference on available-for-sale securities 7,323 17,786 Deferred gains or losses on hedges 7,373 227 Foreign currency translation adjustment (12,525) (24,993) Remeasurements of defined benefit plans, net of tax 8,769 2,687 Share of other comprehensive income (loss) of entities accounted for using equity method (243) 152 Other (213) 212 Total other comprehensive income (loss) 10,485 (3,926)Comprehensive income (loss) 78,997 57,441Comprehensive income (loss) attributable to Comprehensive income (loss) attributable to owners of parent 76,135 53,956 Comprehensive income attributable to non-controlling interests ¥ 2,862 ¥ 3,484
Financial Information
Consolidated Statements of Income and Comprehensive Income
NTT DATA Corporation and Subsidiaries
Fiscal 2016 (Fiscal year ended March 31, 2017) and Fiscal 2017 (Fiscal year ended March 31, 2018)
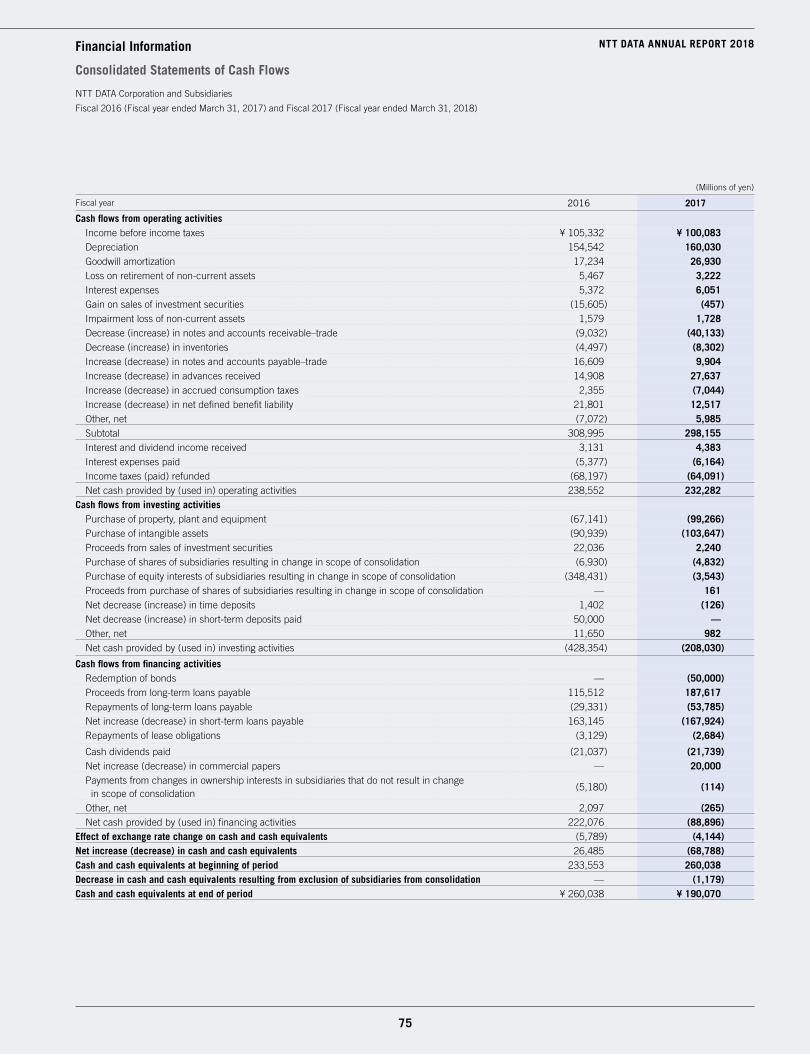
75
NTT DATA ANNUAL REPORT 2018
(Millions of yen)
Fiscal year 2016 2017
Cash flows from operating activities Income before income taxes ¥ 105,332 ¥ 100,083 Depreciation 154,542 160,030 Goodwill amortization 17,234 26,930 Loss on retirement of non-current assets 5,467 3,222 Interest expenses 5,372 6,051 Gain on sales of investment securities (15,605) (457) Impairment loss of non-current assets 1,579 1,728 Decrease (increase) in notes and accounts receivable–trade (9,032) (40,133) Decrease (increase) in inventories (4,497) (8,302) Increase (decrease) in notes and accounts payable–trade 16,609 9,904 Increase (decrease) in advances received 14,908 27,637 Increase (decrease) in accrued consumption taxes 2,355 (7,044) Increase (decrease) in net defined benefit liability 21,801 12,517 Other, net (7,072) 5,985 Subtotal 308,995 298,155 Interest and dividend income received 3,131 4,383 Interest expenses paid (5,377) (6,164) Income taxes (paid) refunded (68,197) (64,091) Net cash provided by (used in) operating activities 238,552 232,282Cash flows from investing activities Purchase of property, plant and equipment (67,141) (99,266) Purchase of intangible assets (90,939) (103,647) Proceeds from sales of investment securities 22,036 2,240 Purchase of shares of subsidiaries resulting in change in scope of consolidation (6,930) (4,832) Purchase of equity interests of subsidiaries resulting in change in scope of consolidation (348,431) (3,543) Proceeds from purchase of shares of subsidiaries resulting in change in scope of consolidation — 161 Net decrease (increase) in time deposits 1,402 (126) Net decrease (increase) in short-term deposits paid 50,000 — Other, net 11,650 982 Net cash provided by (used in) investing activities (428,354) (208,030)
Cash flows from financing activities Redemption of bonds — (50,000) Proceeds from long-term loans payable 115,512 187,617 Repayments of long-term loans payable (29,331) (53,785) Net increase (decrease) in short-term loans payable 163,145 (167,924) Repayments of lease obligations (3,129) (2,684)
Cash dividends paid (21,037) (21,739) Net increase (decrease) in commercial papers — 20,000 Payments from changes in ownership interests in subsidiaries that do not result in change
in scope of consolidation(5,180) (114)
Other, net 2,097 (265) Net cash provided by (used in) financing activities 222,076 (88,896)Effect of exchange rate change on cash and cash equivalents (5,789) (4,144)Net increase (decrease) in cash and cash equivalents 26,485 (68,788)Cash and cash equivalents at beginning of period 233,553 260,038Decrease in cash and cash equivalents resulting from exclusion of subsidiaries from consolidation — (1,179)Cash and cash equivalents at end of period ¥ 260,038 ¥ 190,070
Financial Information
Consolidated Statements of Cash Flows
NTT DATA Corporation and Subsidiaries
Fiscal 2016 (Fiscal year ended March 31, 2017) and Fiscal 2017 (Fiscal year ended March 31, 2018)
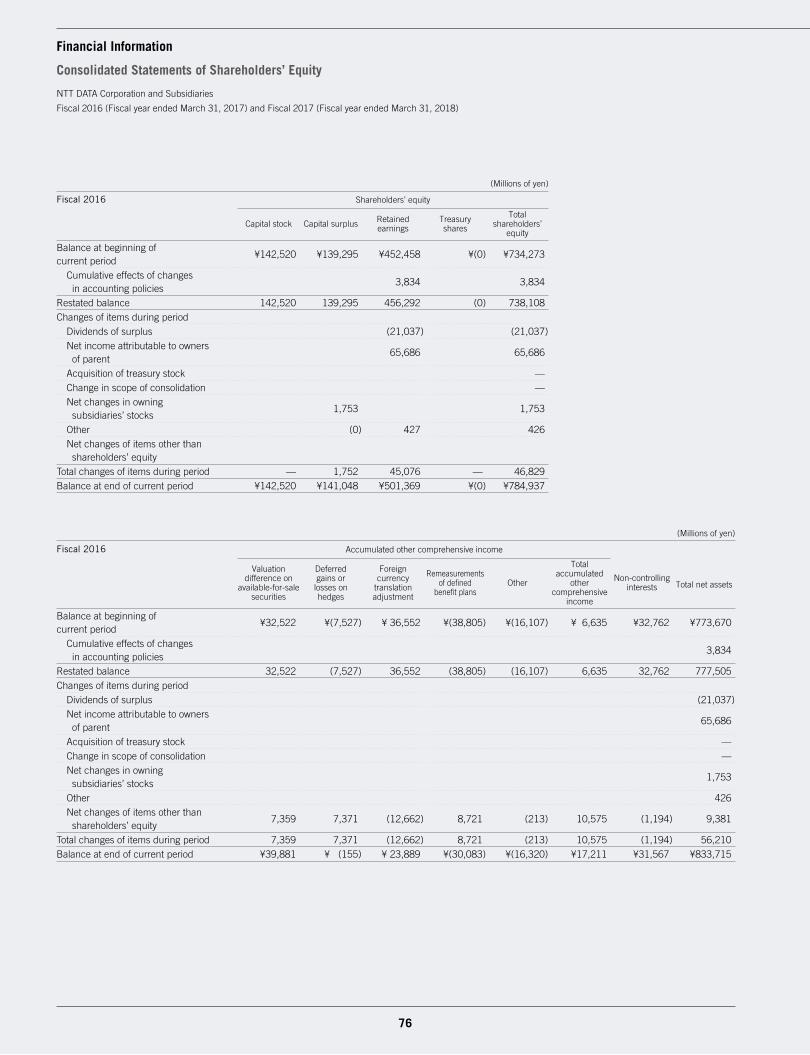
76 77
(Millions of yen)
Fiscal 2016 Shareholders’ equity
Capital stock Capital surplus Retained earnings
Treasury shares
Total shareholders’
equity
Balance at beginning of current period
¥142,520 ¥139,295 ¥452,458 ¥(0) ¥734,273
Cumulative effects of changes in accounting policies
3,834 3,834
Restated balance 142,520 139,295 456,292 (0) 738,108Changes of items during period Dividends of surplus (21,037) (21,037) Net income attributable to owners
of parent65,686 65,686
Acquisition of treasury stock — Change in scope of consolidation — Net changes in owning
subsidiaries’ stocks1,753 1,753
Other (0) 427 426 Net changes of items other than
shareholders’ equityTotal changes of items during period — 1,752 45,076 — 46,829Balance at end of current period ¥142,520 ¥141,048 ¥501,369 ¥(0) ¥784,937
(Millions of yen)
Fiscal 2016 Accumulated other comprehensive income
Non-controlling interests Total net assets
Valuation difference on
available-for-sale securities
Deferred gains or losses on hedges
Foreign currency
translation adjustment
Remeasurements of defined
benefit plansOther
Total accumulated
other comprehensive
income
Balance at beginning of current period
¥32,522 ¥(7,527) ¥ 36,552 ¥(38,805) ¥(16,107) ¥ 6,635 ¥32,762 ¥773,670
Cumulative effects of changes in accounting policies
3,834
Restated balance 32,522 (7,527) 36,552 (38,805) (16,107) 6,635 32,762 777,505 Changes of items during period Dividends of surplus (21,037) Net income attributable to owners
of parent65,686
Acquisition of treasury stock — Change in scope of consolidation — Net changes in owning
subsidiaries’ stocks1,753
Other 426 Net changes of items other than
shareholders’ equity7,359 7,371 (12,662) 8,721 (213) 10,575 (1,194) 9,381
Total changes of items during period 7,359 7,371 (12,662) 8,721 (213) 10,575 (1,194) 56,210 Balance at end of current period ¥39,881 ¥ (155) ¥ 23,889 ¥(30,083) ¥(16,320) ¥17,211 ¥31,567 ¥833,715
Financial Information
Consolidated Statements of Shareholders’ Equity
NTT DATA Corporation and Subsidiaries
Fiscal 2016 (Fiscal year ended March 31, 2017) and Fiscal 2017 (Fiscal year ended March 31, 2018)
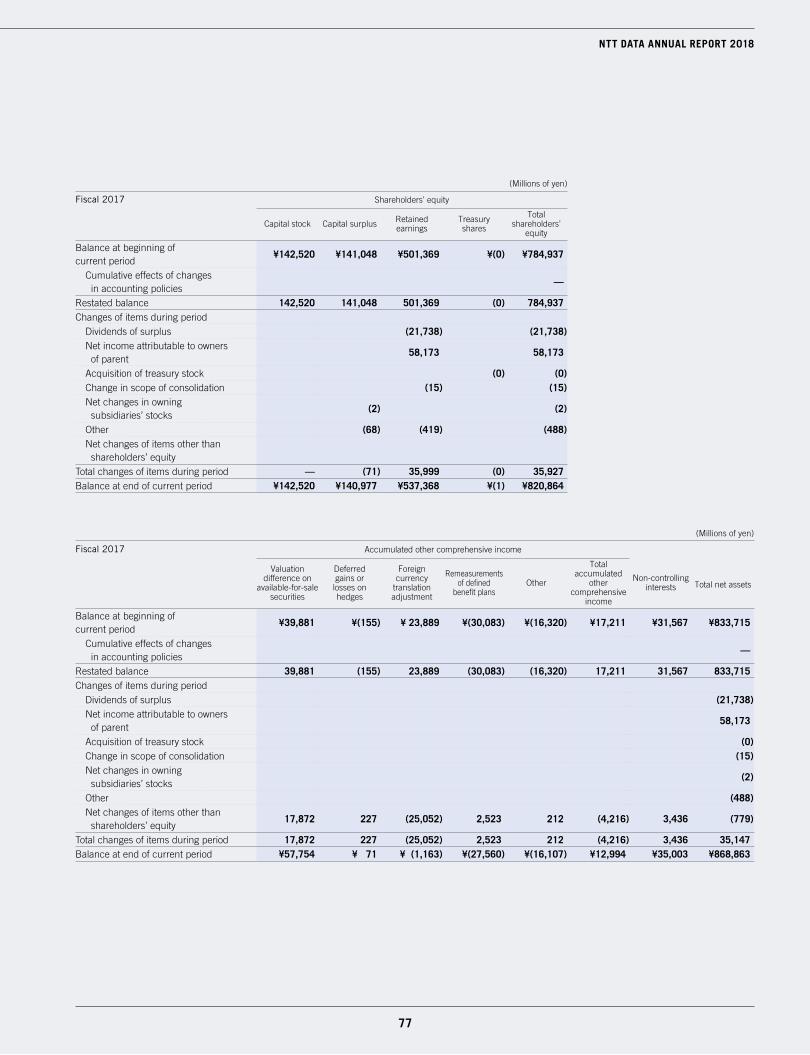
77
NTT DATA ANNUAL REPORT 2018
(Millions of yen)
Fiscal 2017 Shareholders’ equity
Capital stock Capital surplus Retained earnings
Treasury shares
Total shareholders’
equity
Balance at beginning of current period
¥142,520 ¥141,048 ¥501,369 ¥(0) ¥784,937
Cumulative effects of changes in accounting policies
—
Restated balance 142,520 141,048 501,369 (0) 784,937Changes of items during period Dividends of surplus (21,738) (21,738) Net income attributable to owners
of parent58,173 58,173
Acquisition of treasury stock (0) (0) Change in scope of consolidation (15) (15) Net changes in owning
subsidiaries’ stocks(2) (2)
Other (68) (419) (488) Net changes of items other than
shareholders’ equityTotal changes of items during period — (71) 35,999 (0) 35,927Balance at end of current period ¥142,520 ¥140,977 ¥537,368 ¥(1) ¥820,864
(Millions of yen)
Fiscal 2017 Accumulated other comprehensive income
Non-controlling interests Total net assets
Valuation difference on
available-for-sale securities
Deferred gains or losses on hedges
Foreign currency
translation adjustment
Remeasurements of defined
benefit plansOther
Total accumulated
other comprehensive
income
Balance at beginning of current period
¥39,881 ¥(155) ¥ 23,889 ¥(30,083) ¥(16,320) ¥17,211 ¥31,567 ¥833,715
Cumulative effects of changes in accounting policies
—
Restated balance 39,881 (155) 23,889 (30,083) (16,320) 17,211 31,567 833,715Changes of items during period Dividends of surplus (21,738) Net income attributable to owners
of parent58,173
Acquisition of treasury stock (0) Change in scope of consolidation (15) Net changes in owning
subsidiaries’ stocks(2)
Other (488) Net changes of items other than
shareholders’ equity17,872 227 (25,052) 2,523 212 (4,216) 3,436 (779)
Total changes of items during period 17,872 227 (25,052) 2,523 212 (4,216) 3,436 35,147Balance at end of current period ¥57,754 ¥ 71 ¥ (1,163) ¥(27,560) ¥(16,107) ¥12,994 ¥35,003 ¥868,863

78 79
President and CEO
Organizational Structure (As of July 1, 2018)
Clients
Business Units and Group Companies
Manufacturing IT Innovation S
ector
First Financial Sector
Intellectual Property
Office
System
Engineering H
eadquarters
Public S
ector 2
Business S
olutions Sector
Second Financial S
ector
Research and D
evelopment
Headquarters
China &
AP
AC
Sector
EM
EA
& LATA
M S
ector
IT Services &
Paym
ents Services
Sector
Corporate Management Committee
Technology and Innovation G
eneral Headquarters
Audit & Supervisory Board Member
Audit & Supervisory Board
Office for Audit & Supervisory Board
Members
FY 2013 2014 2015 2016 2017
Consolidated 75,020 76,642 80,526 111,664 118,006
Non-Consolidated 11,000 11,110 11,213 11,227 11,263
Note: Employees seconded from NTT DATA to other companies are not included, but employees seconded to NTT DATA are included in the number of employees.
Information Technology M
anagement
Office
Quality A
ssurance Departm
ent
Third Financial Sector
Fourth Financial Sector
Purchasing D
epartment
North A
merica S
ector
Global M
arketing Headquarters
Board of Directors
Investor Relations O
ffice
ES
G P
romotion D
epartment
Strategy O
ffice
HR
Headquarters
Public R
elations Departm
ent
Finance Departm
ent
Environm
ental Managem
ent Prom
otion Office
Number of Employees at Fiscal Year-End(People)
Company Name
NTT DATA Corporation
Head Office
Toyosu Center Bldg., 3-3, Toyosu 3-chome, Koto-ku,
Tokyo 135-6033, Japan
Telephone: +81-3-5546-8202
Date of Establishment
May 23, 1988
Common Stock
¥142,520 million
Fiscal Year
April 1 to March 31 of the following year
Independent Auditors
KPMG AZSA LLC
Company and Stock Information(As of March 31, 2018)
0
30,000
60,000
90,000
120,000
Public S
ector 1
Social Infrastructure S
olution Sector
Telecom &
Utility B
usiness Sector
Internal Audit D
epartment
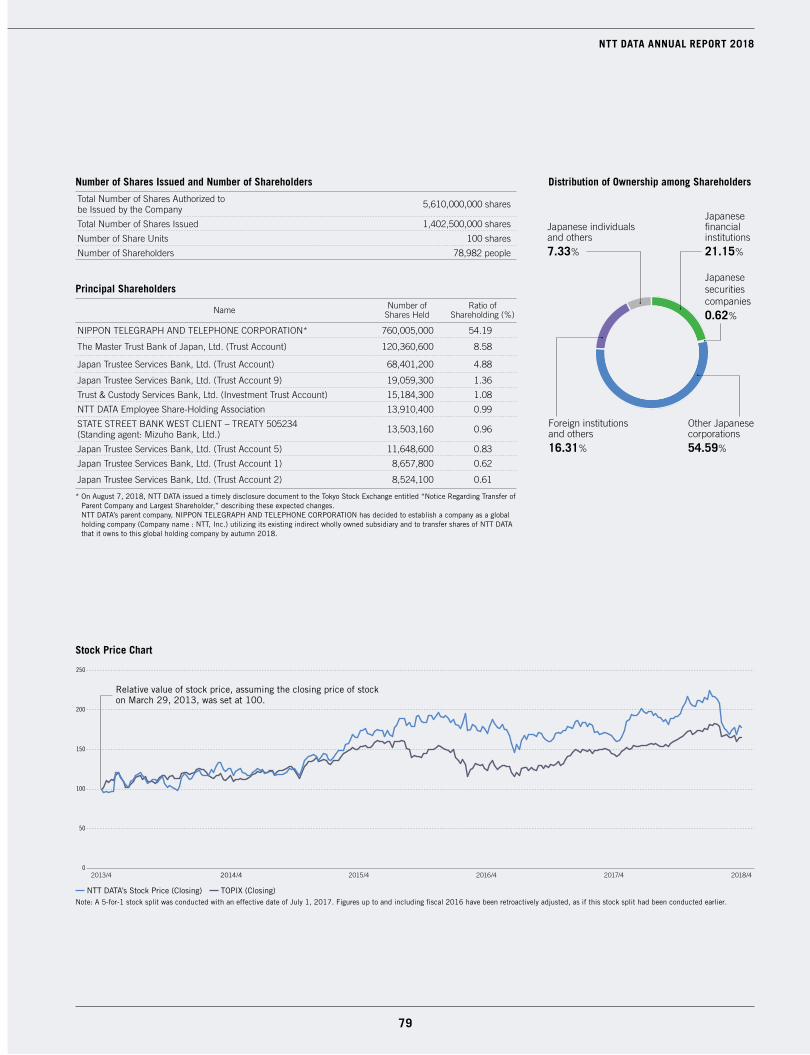
79
NTT DATA ANNUAL REPORT 2018
Distribution of Ownership among Shareholders
Japanese financial institutions
21.15%
Japanese securities companies
0.62%
Other Japanese corporations
54.59%
Foreign institutions and others
16.31%
Japanese individuals and others
7.33%
Number of Shares Issued and Number of Shareholders
Total Number of Shares Authorized to be Issued by the Company 5,610,000,000 shares
Total Number of Shares Issued 1,402,500,000 shares
Number of Share Units 100 shares
Number of Shareholders 78,982 people
Principal Shareholders
Name Number of Shares Held
Ratio of Shareholding (%)
NIPPON TELEGRAPH AND TELEPHONE CORPORATION* 760,005,000 54.19
The Master Trust Bank of Japan, Ltd. (Trust Account) 120,360,600 8.58
Japan Trustee Services Bank, Ltd. (Trust Account) 68,401,200 4.88
Japan Trustee Services Bank, Ltd. (Trust Account 9) 19,059,300 1.36
Trust & Custody Services Bank, Ltd. (Investment Trust Account) 15,184,300 1.08
NTT DATA Employee Share-Holding Association 13,910,400 0.99
STATE STREET BANK WEST CLIENT – TREATY 505234 (Standing agent: Mizuho Bank, Ltd.) 13,503,160 0.96
Japan Trustee Services Bank, Ltd. (Trust Account 5) 11,648,600 0.83
Japan Trustee Services Bank, Ltd. (Trust Account 1) 8,657,800 0.62
Japan Trustee Services Bank, Ltd. (Trust Account 2) 8,524,100 0.61
* On August 7, 2018, NTT DATA issued a timely disclosure document to the Tokyo Stock Exchange entitled “Notice Regarding Transfer of Parent Company and Largest Shareholder,” describing these expected changes. NTT DATA’s parent company, NIPPON TELEGRAPH AND TELEPHONE CORPORATION has decided to establish a company as a global holding company (Company name : NTT, Inc.) utilizing its existing indirect wholly owned subsidiary and to transfer shares of NTT DATA that it owns to this global holding company by autumn 2018.
Stock Price Chart
NTT DATA’s Stock Price (Closing) TOPIX (Closing)Note: A 5-for-1 stock split was conducted with an effective date of July 1, 2017. Figures up to and including fiscal 2016 have been retroactively adjusted, as if this stock split had been conducted earlier.
Relative value of stock price, assuming the closing price of stock on March 29, 2013, was set at 100.
2018/42017/42016/42015/42014/42013/40
50
100
150
200
250
Information regarding sustainability, R&D, and corporate governance, along with detailed financial data of the NTT DATA Group, is available at the following websites:
Sustainability https://www.nttdata.com/global/en/sustainability
NTT DATA Technology Foresight https://www.nttdata.com/global/en/foresight
Investor Relations https://www.nttdata.com/global/en/investors
Corporate Governance https://www.nttdata.com/global/en/investors/corporate-governance/
Annual Report and some other financial information https://www.nttdata.com/global/en/investors/financials?year=2018&tab=Annual-Report
NT
T DA
TA C
OR
PO
RA
TION
Annual R
eport 20
18
NTT DATA CorporationToyosu Center Bldg., 3-3, Toyosu 3-chome,Koto-ku, Tokyo 135-6033, JapanTelephone: +81-3-5546-8202URL: http://www.nttdata.com/
色指定 / 特色 : Pantone 626C CMYK : C100 M60 Y100 K20 公和印刷株式会社
1C
1C
4C
4C
オンプロダクト-スタンドードタイプ 英語版 オンプロダクト-ミニラベル 英語版(印刷スペースが無い場合)
アイソレーションゾーン
Non-VOC インキロゴ使用ガイド
プロセス4C
ロゴの使用カラー
ミドリ - 01C50 Y100
バックに色が入る場合
ミドリ - 02C100 M25 Y100 K25
単色
スミ - 01K50
スミ - 02K100
Non -VOC インキとは?
ロゴの最小サイズ
印刷上、及び判読上の問題を避けるために、
ロゴのサイズがW10mmより小さくならないようにして下さい。
アイソレーション
ロゴが独立して見えるように、ロゴの周囲に約
1つ分以上のスペースを設けて下さい。
10mm
Non-VOCインキは、構成成分中の高沸点石油系溶剤を1%未満に抑えたインキで、植物油
インキよりもさらに進んだ環境にやさしいインキです。