TRUST BOARD IN PUBLIC th Date: 26 January 2017 REPORT ...
21
TRUST BOARD IN PUBLIC Date: 26 th January 2017 Agenda Item: 6.2 REPORT TITLE: SaSH Inclusion Report EXECUTIVE SPONSOR: Mark Preston Director or Organisational Development & People REPORT AUTHOR (s): Mark Preston REPORT DISCUSSED PREVIOUSLY: (name of sub-committee/group & date) Finance and Workforce Committee Action Required: Approval (√) Discussion () Assurance (√) Purpose of Report: The Workforce Diversity Report provides an overview of the Trust and local community demographics Summary of key issues The Diversity Report is based on data for 2015, as well as comparisons over the period 2011-2015 The report highlights key equality and diversity demographics (ie protected characteristics), in relation to SaSH staff As part of our responsibilities under the Public Sector Equality Duties this information has been published on the Trust website Recommendation: The Board are asked to note the contents of this report Relationship to Trust Strategic Objectives & Assurance Framework: SO1: Safe – Deliver safe high quality and improving services which pursue perfection and be in the top 20% against our peers SO2: Effective – As a teaching hospital deliver effective, improving and sustainable clinical services within the local health economy SO3: Caring – Working in partnership with staff, families and carers SO4: Responsive – Become the secondary care provider of choice our catchment population SO5: Well led - Become an employer of choice and deliver financial and clinical sustainability around a patient focused clinical model
Transcript of TRUST BOARD IN PUBLIC th Date: 26 January 2017 REPORT ...

TRUST BOARD IN PUBLIC
Date: 26th January 2017 Agenda Item: 6.2
REPORT TITLE: SaSH Inclusion Report
EXECUTIVE SPONSOR: Mark Preston Director or Organisational Development & People
REPORT AUTHOR (s): Mark Preston
REPORT DISCUSSED PREVIOUSLY: (name of sub-committee/group & date)
Finance and Workforce Committee
Action Required:
Approval (√) Discussion () Assurance (√)
Purpose of Report:
The Workforce Diversity Report provides an overview of the Trust and local community demographics
Summary of key issues
The Diversity Report is based on data for 2015, as well as comparisons over the period 2011-2015
The report highlights key equality and diversity demographics (ie protected characteristics), in relation to SaSH staff
As part of our responsibilities under the Public Sector Equality Duties this information has been published on the Trust website
Recommendation:
The Board are asked to note the contents of this report
Relationship to Trust Strategic Objectives & Assurance Framework:
SO1: Safe – Deliver safe high quality and improving services which pursue perfection
and be in the top 20% against our peers
SO2: Effective – As a teaching hospital deliver effective, improving and sustainable
clinical services within the local health economy
SO3: Caring – Working in partnership with staff, families and carers
SO4: Responsive – Become the secondary care provider of choice our catchment
population
SO5: Well led - Become an employer of choice and deliver financial and clinical
sustainability around a patient focused clinical model
Corporate Impact Assessment:
Legal and regulatory impact Publishing equality data is a requirement of the Public Sector Equality Duty
Financial impact There is no direct financial implications
Patient Experience/Engagement
Comparing Trust and local community demographics should allow the Trust to understand how representative we are of the population we provide services for
Risk & Performance Management There is no direct Risk / Performance management issues
NHS Constitution/Equality & Diversity/Communication
Reviewing equality data and designing and delivering suitable responses to this meets the over-arching requirements of the NHS Constitution
Attachment:
(1) SaSH Inclusion Reporting (2) Workforce Diversity Report 2015

SaSH Inclusion Reporting
1.0 Introduction As part of the introduction of the Equality Act (2010), public sector organisations were given specific responsibilities know as Public Sector Equality Duties (PSED), along with the general duties of the Act. The general equality duties comprise three key components, namely:
Eliminate unlawful discrimination, harassment and victimisation and other conduct prohibited by the Act
Advance equality of opportunity between people who share a protected characteristic and those who do not
Foster good relations between people who share a protected characteristic and those who do not
Along with this, under the PSED, public sector employers are required to:
Publish equality data on their website on an annual basis, where they employ more than 150 members of staff
Set out at least one equality objective, (which must be specific and measureable), and new objective(s) must be issued at least every four years
Taking these requirements into account, SaSH developed and published its first equality report (ie 2015 Workforce Diversity Report), in September 2016. 2.0 Protected Characteristics The Equality Act (2010), defined a set of protected characteristics of which it is unlawful to discriminate against. The protected characteristic are as follows: Age Disability Gender Reassignment Pregnancy & Maternity Marriage & Civil Partnership Race Religion or Belief Sex Sexual Orientation 3.0 SaSH Inclusion Report The data for the Workforce Diversity report comprises information taken for 2015, as well as comparisons over the period 2011-2015. This data has been taken from the Electronic Staff Record (ESR). The report highlights key equality and diversity demographics (ie protected characteristics), in relation to SaSH staff.
Along with comparisons between staff groups, the report also highlights the demographics of the communities we predominantly provide services for. The overall aim of this is for the Trust to understand how representative our staff population is of the local communities, and where access to services may be a barrier due to this. We will be producing and publishing a further report in June 2017 to cover the period from the previous report to 31st March 2017. 3.0 Inclusion at SaSH The Trust has recently started to develop a formal Inclusion Strategy, and we are working with BRAP, a national qualities charity, to create operational work-streams to deliver the strategy. We are keen to ensure the strategy is a ‘living’ document. We are reviewing the strategy in line with other national frameworks (eg Equality Delivery System 2, Workforce Race Equality Scheme), so relevant stakeholders are engaged in this work with the Trust. SaSH has also been supporting national equality initiatives at a local level (eg in support of ‘International Day of Persons with a Disability’ (3rd December), a stand was set up outside of the Three Arches Restaurant as an awareness raising campaign. This was run in conjunction with partner organisations and Unison). We are also setting up a Black & Minority Ethnic Network Group (BAME Network), and the first newsletter for this group is due to be issued in the immediate future. 4.0 Next Steps As a public sector organisation, SaSH is committed to delivering national requirements (eg our public sector equality duties, etc), however we want to ensure that we are delivering an Inclusion Strategy that is relevant, supports and enables staff and allows for the delivery of first class patient care. Mark Preston Director of Organisational Development & People January 2017
Workforce Diversity Report 2015
Surrey and Sussex Healthcare NHS Trust (SASH) sits at the heart of our community and plays a huge part in people’s daily
lives, be those staff, patients or members of the public. Our role is to ensure that all of ‘our people’ have equal access to fair and
inclusive services and opportunities.
The Trust has a legal obligation (under the Public Sector Equality Duty, as set out in the Equality Act 2010) to deliver this but over
and above our legal obligations, we as a Trust want to ensure that these basic principles are embedded in everything we do.
Our responsibilities under the Public Sector Equality Duty are as follows:
• Eliminate unlawful discrimination, harassment and victimisation and other conduct prohibited by the Equality Act.
• Advance equality of opportunity between people who share a protected characteristic and those who do not.
• Foster good relations between people who share a protected characteristic and those who do not.
In order to meet these three responsibilities we are required to review and publish our workforce data on an annual basis. Doing
this allows us to identify areas where we need to reduce inequalities and notice workforce trends which enable us to make effective
decisions for the future.
This report provides the high level data for the protected characteristics that we record on the Electronic Staff Record (ESR).
The data in this report is accurate as of 31st December 2015. We have included historical data going back to 2011 as a means of
identifying workforce trends over the last five years.

Workforce data in comparison to the population of our local boroughs
40 - average age of population in Reigate and Banstead
37 - average age of population in Crawley
41 - average age of someone working at SASH
49% Male, 51% Female - Crawley, Reigate and Banstead
23.6% Male, 76.4% Female - SASH
Characteristic Reigate & Banstead Crawley SASH
Ethnicity 91.5% White, 8.5% BAME* 72% White, 28% BAME 72.9% White, 26.3% BAME
Religion (highest three % score)
61.9% Christian, 25.8% Atheist, 1.9% Muslim
54.2% Christian, 25.5% Atheist, 7.2% Muslim
38.1% Christian, 6.9% Atheist, 2.84% Hindu**
*BAME (Black, Asian and Minority Ethnic) **of those staff who declared they had a faith
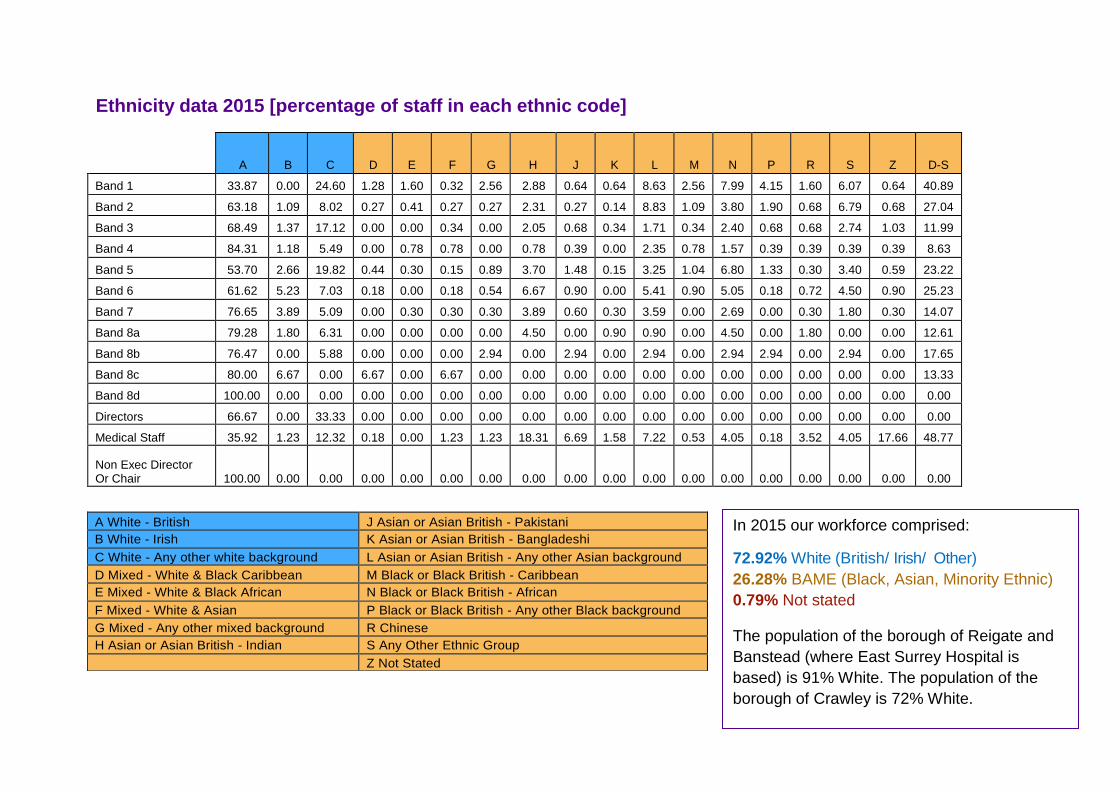
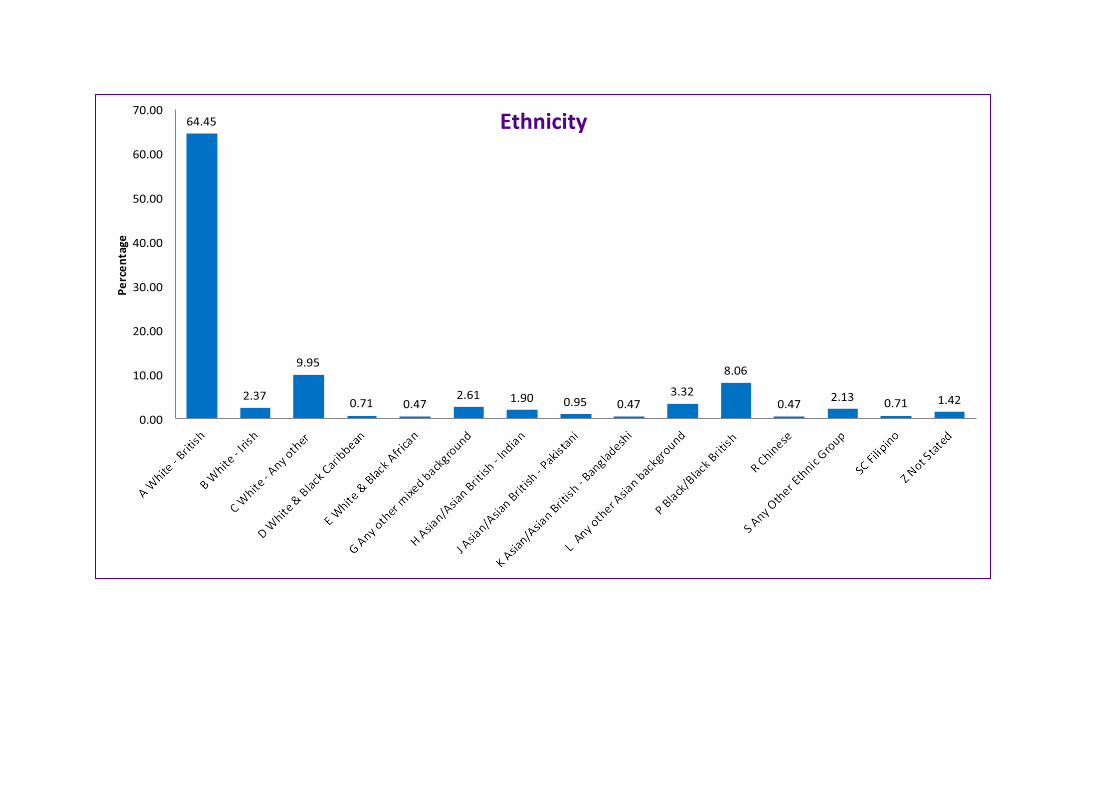
Ethnicity data 2015 [percentage of staff in each ethnic code]
A
B
C
D
E
F
G
H
J
K
L
M
N
P
R
S
Z
D-S
Band 1 33.87 0.00 24.60 1.28 1.60 0.32 2.56 2.88 0.64 0.64 8.63 2.56 7.99 4.15 1.60 6.07 0.64 40.89
Band 2 63.18 1.09 8.02 0.27 0.41 0.27 0.27 2.31 0.27 0.14 8.83 1.09 3.80 1.90 0.68 6.79 0.68 27.04
Band 3 68.49 1.37 17.12 0.00 0.00 0.34 0.00 2.05 0.68 0.34 1.71 0.34 2.40 0.68 0.68 2.74 1.03 11.99
Band 4 84.31 1.18 5.49 0.00 0.78 0.78 0.00 0.78 0.39 0.00 2.35 0.78 1.57 0.39 0.39 0.39 0.39 8.63
Band 5 53.70 2.66 19.82 0.44 0.30 0.15 0.89 3.70 1.48 0.15 3.25 1.04 6.80 1.33 0.30 3.40 0.59 23.22
Band 6 61.62 5.23 7.03 0.18 0.00 0.18 0.54 6.67 0.90 0.00 5.41 0.90 5.05 0.18 0.72 4.50 0.90 25.23
Band 7 76.65 3.89 5.09 0.00 0.30 0.30 0.30 3.89 0.60 0.30 3.59 0.00 2.69 0.00 0.30 1.80 0.30 14.07
Band 8a 79.28 1.80 6.31 0.00 0.00 0.00 0.00 4.50 0.00 0.90 0.90 0.00 4.50 0.00 1.80 0.00 0.00 12.61
Band 8b 76.47 0.00 5.88 0.00 0.00 0.00 2.94 0.00 2.94 0.00 2.94 0.00 2.94 2.94 0.00 2.94 0.00 17.65
Band 8c 80.00 6.67 0.00 6.67 0.00 6.67 0.00 0.00 0.00 0.00 0.00 0.00 0.00 0.00 0.00 0.00 0.00 13.33
Band 8d 100.00 0.00 0.00 0.00 0.00 0.00 0.00 0.00 0.00 0.00 0.00 0.00 0.00 0.00 0.00 0.00 0.00 0.00
Directors 66.67 0.00 33.33 0.00 0.00 0.00 0.00 0.00 0.00 0.00 0.00 0.00 0.00 0.00 0.00 0.00 0.00 0.00
Medical Staff 35.92 1.23 12.32 0.18 0.00 1.23 1.23 18.31 6.69 1.58 7.22 0.53 4.05 0.18 3.52 4.05 17.66 48.77
Non Exec Director Or Chair
100.00
0.00
0.00
0.00
0.00
0.00
0.00
0.00
0.00
0.00
0.00
0.00
0.00
0.00
0.00
0.00
0.00
0.00
A White - British J Asian or Asian British - Pakistani
B White - Irish K Asian or Asian British - Bangladeshi
C White - Any other white background L Asian or Asian British - Any other Asian background
D Mixed - White & Black Caribbean M Black or Black British - Caribbean
E Mixed - White & Black African N Black or Black British - African
F Mixed - White & Asian P Black or Black British - Any other Black background
G Mixed - Any other mixed background R Chinese
H Asian or Asian British - Indian S Any Other Ethnic Group
Z Not Stated
In 2015 our workforce comprised:
72.92% White (British/ Irish/ Other)
26.28% BAME (Black, Asian, Minority Ethnic)
0.79% Not stated
The population of the borough of Reigate and
Banstead (where East Surrey Hospital is
based) is 91% White. The population of the
borough of Crawley is 72% White.
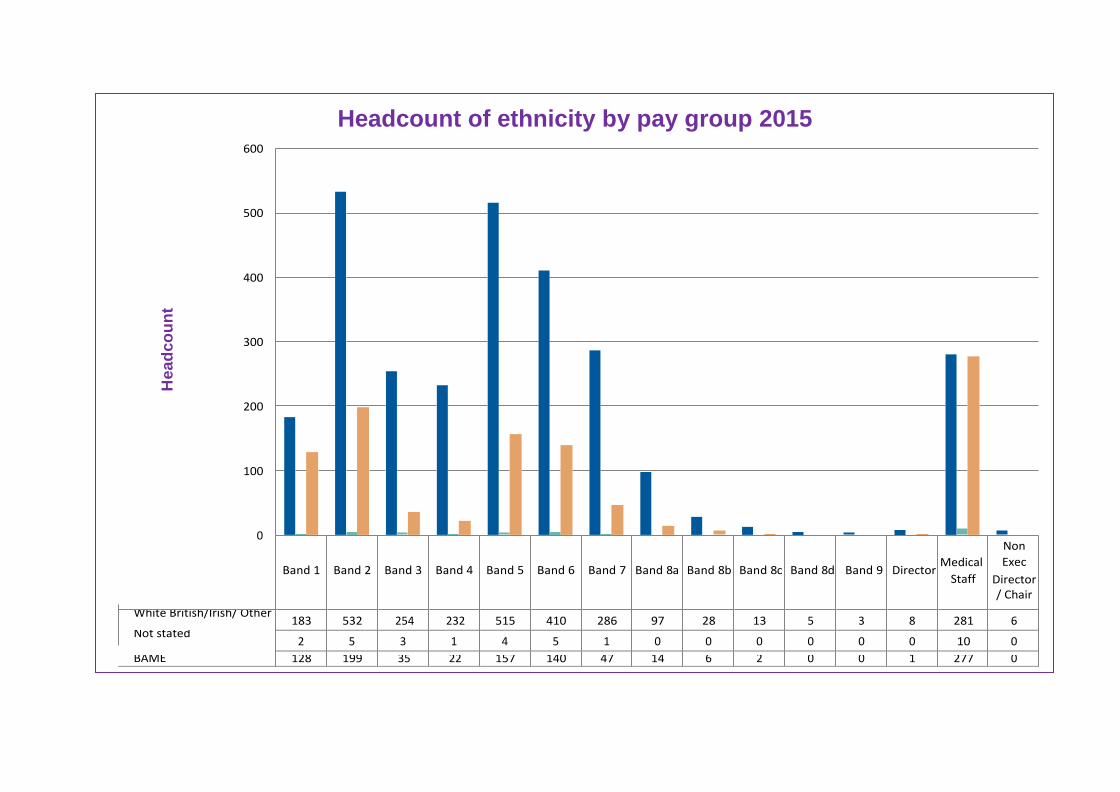
Headcount of ethnicity by pay group 2015 600
500
400
300
200
100
0
Band 1 Band 2 Band 3 Band 4 Band 5 Band 6 Band 7 Band 8a Band 8b Band 8c Band 8d Band 9 Director Medical
Non
Exec
He
ad
co
un
t
Staff Director / Chair
White British/Irish/ Other 183 532 254 232 515 410 286 97 28 13 5 3 8 281 6
Not stated 2 5 3 1 4 5 1 0 0 0 0 0 0 10 0
BAME 128 199 35 22 157 140 47 14 6 2 0 0 1 277 0

Percentage of workforce in each ethnic group 2011-2015 65.00
60.00
55.00
50.00
45.00
40.00
35.00
30.00
25.00
20.00
15.00
10.00
5.00
0.00
A B C D E F G H J K L M N P R S Z D-S
Dec-11 62.22 3.65 8.75 0.41 0.38 0.62 0.65 5.68 1.38 0.18 5.06 0.77 4.30 0.71 0.91 3.18 1.15 24.23
Dec-12 61.32 2.90 8.98 0.32 0.40 0.57 0.60 6.05 1.52 0.23 5.65 0.92 4.76 0.83 0.77 3.33 0.83 25.97
Dec-13 61.12 2.69 9.61 0.22 0.30 0.30 0.64 5.62 1.55 0.30 5.26 0.83 5.02 0.86 1.00 3.63 1.03 25.55
Dec-14 60.27 2.52 10.24 0.24 0.29 0.40 0.67 5.74 1.55 0.32 5.71 0.67 4.91 0.88 0.99 3.73 0.86 26.11
Dec-15 58.74 2.17 12.01 0.31 0.33 0.43 0.72 5.57 1.61 0.41 5.37 0.87 4.50 1.10 1.07 3.99 0.79 26.28
Pe
rce
nta
ge

Disability data for 2011-2015
3500
3000
2500
2000
1500
1000
0
No Yes Not declared Undefined
Dec-11 322 48 3 3013
Dec-12 644 42 3 2796
Dec-13 1515 62 727 1298
Dec-14 1763 61 1578 348
Dec-15 2063 66 1663 120
In our 2015 staff survey results, 283 people (14% of responses) declared they had a disability which is significantly higher
than the 66 people (1.68% of the total workforce) who are recorded as declaring they have a disability on ESR.
Hea
dco
un
t
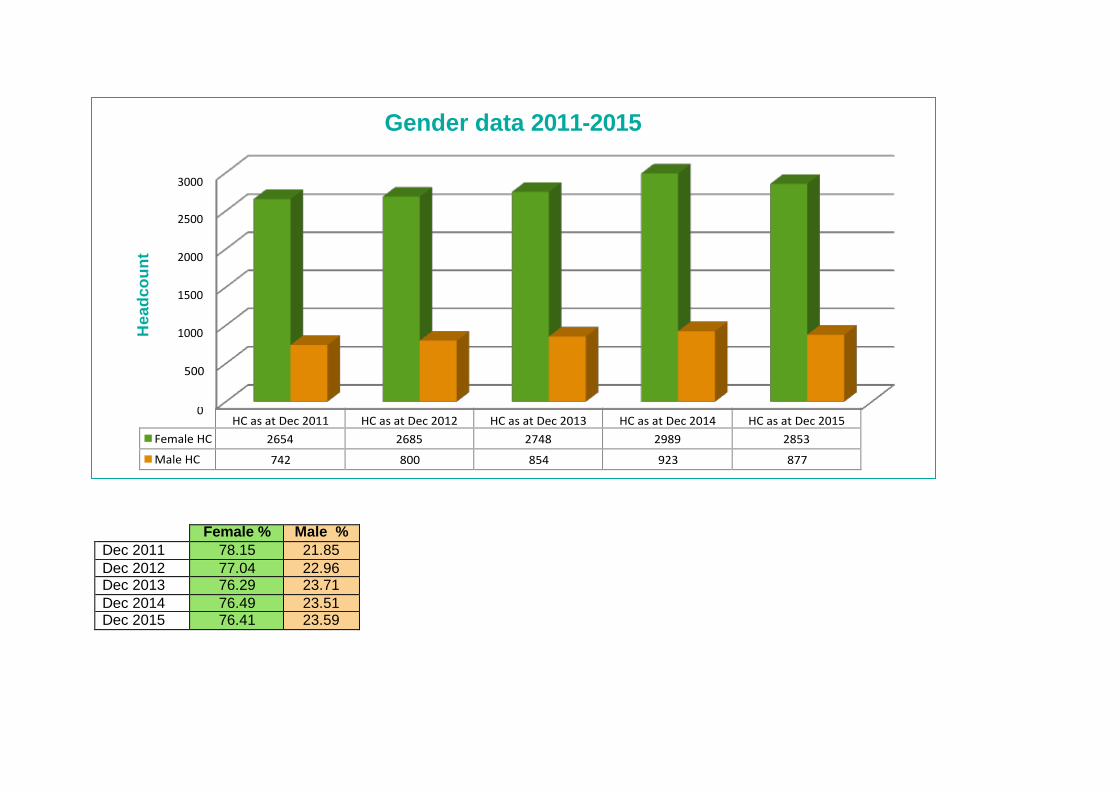
Gender data 2011-2015
3000
2500
2000
1500
1000
0 HC as at Dec 2011 HC as at Dec 2012 HC as at Dec 2013 HC as at Dec 2014 HC as at Dec 2015
Female HC 2654 2685 2748 2989 2853
Male HC 742 800 854 923 877
Female % Male %
Dec 2011 78.15 21.85
Dec 2012 77.04 22.96 Dec 2013 76.29 23.71
Dec 2014 76.49 23.51 Dec 2015 76.41 23.59
He
ad
co
un
t

Gender and Pay Band 100
Per
cen
tag
e
Band 1 Band 2 Band 3 Band 4 Band 5 Band 6 Band 7 Band 8a Band 8b Band 8c Band 8d Band 9 Directors Medical Non
Exec
Female % 54.3 80.2 83.9 85.5 85.9 87.7 85.3 79.3 64.7 80 20 66.7 44.4 49.8 16.7
Male % 45.7 19.8 16.1 14.5 14.1 12.3 14.7 20.7 35.3 20 80 33.3 55.6 50.2 83.3

Age data 2011-2015
30.00
25.00
20.00
15.00
10.00
5.00
0.00 16-20 21-30 31-40 41-50 51-60 61-70 71-80 81+
Dec 11 1.09 18.11 25.85 27.53 22.06 5.30 0.06 0.00
Dec 12 1.32 18.75 25.24 27.80 21.42 5.43 0.03 0.00
Dec 13 1.32 18.75 25.24 27.80 21.42 5.43 0.03 0.00
Dec 14 1.50 20.88 24.64 26.19 21.05 5.52 0.21 0.00
Dec 15 1.76 22.01 23.57 26.20 20.32 5.85 0.26 0.03
Pe
rce
nta
ge

Religion data 2011-2015
60.00
50.00
40.00
30.00
20.00
10.00
0.00
Atheism % Buddhism
%
Christianity
%
Hinduism
%
I do not
wish to
disclose %
Islam % Jainism% Judaism% Other% Sikhism% Undefined
%
Dec 2011 1.91 0.29 26.47 0.88 13.22 1.00 0.03 0.03 3.12 0.12 52.92
Dec 2012 2.82 0.40 27.80 1.70 13.48 1.84 0.03 0.03 3.51 0.26 48.13
Dec 2013 5.89 0.67 39.67 2.58 19.27 2.30 0.03 0.03 3.03 0.14 26.40
Dec 2014 6.51 0.80 38.82 2.87 34.18 2.57 0.03 0.08 3.11 0.21 10.80
Dec 2015 6.90 0.92 38.16 2.84 37.76 2.68 0.10 0.08 2.86 0.10 7.59
Pe
rcen
tag
e
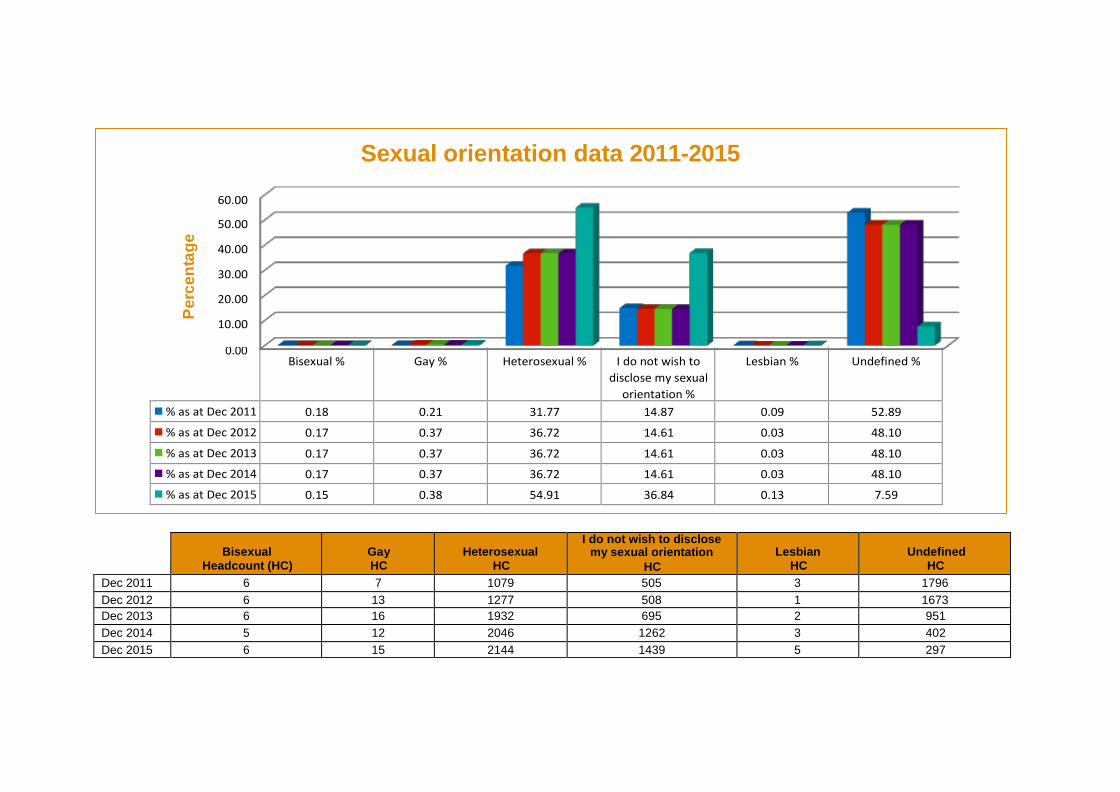
Sexual orientation data 2011-2015
0.00 Bisexual % Gay % Heterosexual % I do not wish to
disclose my sexual
orientation %
Lesbian % Undefined %
% as at Dec 2011 0.18 0.21 31.77 14.87 0.09 52.89
% as at Dec 2012 0.17 0.37 36.72 14.61 0.03 48.10
% as at Dec 2013 0.17 0.37 36.72 14.61 0.03 48.10
% as at Dec 2014 0.17 0.37 36.72 14.61 0.03 48.10
% as at Dec 2015 0.15 0.38 54.91 36.84 0.13 7.59
Bisexual
Headcount (HC) Gay HC
Heterosexual HC
I do not wish to disclose my sexual orientation
HC
Lesbian HC
Undefined HC
Dec 2011 6 7 1079 505 3 1796
Dec 2012 6 13 1277 508 1 1673
Dec 2013 6 16 1932 695 2 951
Dec 2014 5 12 2046 1262 3 402
Dec 2015 6 15 2144 1439 5 297
Pe
rcen
tag
e

Recruitment Data by Ethnicity
Ethnicity
Applications
% Shortlisted % Appointed %
WHITE - British 5,171 37.40% 1945 42.20%
341 45.90% WHITE - Irish 155 1.10% 75 1.60% 18 2.40%
WHITE - Any other white background 2,017 14.60% 606 13.10%
87 11.70% ASIAN or ASIAN BRITISH - Indian 1,449 10.50% 422 9.20% 33 4.40%
ASIAN or ASIAN BRITISH - Pakistani 779 5.60% 184 4.00% 11 1.50%
ASIAN or ASIAN BRITISH - Bangladeshi 140 1.00% 32 0.70% 3 0.40%
ASIAN or ASIAN BRITISH - Any other Asian background 910 6.60% 292 6.30% 46 6.20%
MIXED - White & Black Caribbean 60 0.40% 19 0.40% 3 0.40%
MIXED - White & Black African 91 0.70% 26 0.60% 2 0.30%
MIXED - White & Asian 67 0.50% 21 0.50% 1 0.10%
MIXED - any other mixed background 171 1.20% 52 1.10% 4 0.50%
BLACK or BLACK BRITISH - Caribbean 228 1.70% 61 1.30% 15 2.00%
BLACK or BLACK BRITISH - African 1,315 9.50% 403 8.70% 32 4.30%
BLACK or BLACK BRITISH - Any other black background 133 1.00% 48 1.00% 6 0.80%
OTHER ETHNIC GROUP - Chinese 134 1.00% 36 0.80% 5 0.70%
OTHER ETHNIC GROUP - Any other ethnic group 564 4.10% 171 3.70% 14 1.90%
Undisclosed 434 3.10% 218 4.70% 122 16.40%
This data is also included in the SaSH Workforce Race Equality Standard report.

Pe
rce
nta
ge
Workforce Data for Formal Management Under Staff Policy
Gender
6%
12%
16%
Age group
1%
8% 4%
12%
9%
9%
13%
10%
16-20
21-25
26-30
31-35
36-40
41-45
46-50
51-55
56-60
61-65
66 & Over
90.00
80.00
70.00
60.00
50.00
40.00
30.00
20.00
10.00
0.00
Female Male
Ethnicity
Pe
rce
nta
ge

Summary of our data
Ethnicity Over the last five years we have seen a gradual reduction (3.48%) in the number of White-British staff and an increase in our White-Other (non-
British/ Irish) staff of 3.26%. Since 2011 the population of our Black, Asian and Minority Ethnic (BAME) workforce has increased by 2.05%.
Disability Over the last five years a significant proportion of the workforce has moved from “undefined” to actively choosing to declare or not declare
whether or not they have a disability. For example, the number of staff declaring they do not have a disability increased from 322 people in
2011 to 2063 people in 2015. This is a result of annual data cleanse exercises carried out by our workforce information department. The
number of staff declaring they have a disability has only increased by 18 people over the last five years to a total of 66 people (0.017% of the
whole workforce). 283 staff reported they had a disability in our 2015 Staff Survey.
Gender Our workforce gender profile has generally remained consistent since 2011. Our gender diversity is in line with the national NHS workforce
population. The number of males in the organisation tends to increase in the higher pay bands.
Age Over the last five years the percentage of the workforce in age groups 31-40, 41-50 and 51-60 has shown a gradual decline. The biggest
percentage difference can be seen in the age group 21-30 which has increased by 3.9% since 2011. 2015 was the first year (based on data
collated for this report) that we employed a member of staff over 81 years of age. The average age of a SASH Employee is 41 years.
Religion As a result of our data cleansing exercises the percentage of staff moving from ‘undefined’ to choosing to declare or not declare if they have a
religion has decreased from 52% to 7.59%. The largest religion within the Trust is Christianity (38.16%) with 37.76% of staff choosing not to
disclose if they have a religion or not.
Sexual Orientation Over half of the workforce (54.91%) identify as heterosexual with 0.66% of the workforce identifying as lesbian, gay or bisexual. Over a third of
the organisation (36.84%), have chosen not to disclose their sexual orientation.
Our work on diversity and inclusion
Throughout 2016 we will be embarking on a number of activities to support our work on diversity and inclusion at SASH.
Equality Objectives We will refresh and publish our new Corporate Equality Objectives for 2017-2021. This work will commenced with a board development
seminar and will conclude in Spring 2017 following input from multi-professional representatives across our workforce.
Equality Training We are very pleased to announce that we are working with BRAP a leading equalities and human rights charity, on a number of diversity
training initiatives across the latter part of 2016 and early 2017. This includes unconscious bias, managing diverse teams and recruitment and
selection. BRAP have worked at all levels in the NHS including supporting the department of health on a number strategic projects.
Equality Networks We will begin a scoping exercise into how we can develop diversity networks for staff with projected characteristics, focusing initially on a
network for our Black, Asian and Minority Ethnic (BAME) workforce.
Learning from others The Trust has become a member of the Employers Network for Equality and Inclusion, a multi-sector national support network who facilitate the
sharing of best practice and new developments in diversity and inclusion.
National NHS programmes SASH is engaged in national diversity programmes including the workforce race equality standard (WRES) which is
published separately to this report on an annual basis.