TRUST AND PARTICIPATION IN AN EMERGING...
40
TRUST AND PARTICIPATION IN AN EMERGING MARKET: LEADING AND LAGGING EFFECTS OF SOCIAL TIES ON CORRUPTION Christopher B. Yenkey Univ. of Chicago Booth School of Business Draft: Please do not cite without permission of the author Abstract This paper analyzes the effects of social ties between investors and a corrupt stock broker as they relate to the broker’s selection of victims for a fraud and investors’ subsequent reactions to experiencing the fraud. In contrast with earlier work linking interpersonal relationships with malfeasance, I first ask whether shared group membership between investors and their broker is positively or negatively related to being selected as a victim. Second, I ask whether shared group membership mediates victims’ reactions to the fraud, looking to see how post-fraud levels of investing differ between investors who share group-level ties with the corrupt broker and those who belong to rival groups. The empirical setting is the tribally diverse and contentious population of investors in Kenya’s emerging stock market, where investors and their stockbrokers can be members of the same or rival tribal groups. Analysis of investor-level data from a major stockbroker scandal in 2008 suggests that corrupt brokers disproportionately target clients from their own tribal group for theft of cash and shares but avoid stealing from the accounts of investors belonging to rival tribes. Investors sharing the tribal tie to the corrupt broker continue to increase the value of their investments post-scandal, while members of rival tribes reduce the value of their investments. Investors belonging to the broker’s tribe reduce future investments primarily in response to increased personal financial losses or when a great number of fellow tribe members also experience the fraud. In contrast, the negative reactions of investors belonging to the rival tribe do not intensify with either rising personal financial losses or with an increase in the number of proximate other victims. Taken together, results suggest that group-level ties increase the likelihood of experiencing the fraud but also increase the severity of fraud necessary to trigger a reduction in trust in the market. Keywords: fraud, social networks, group identity, emerging market This research was supported by a grant from the National Science Foundation (Grant No. 0802469), the University of Chicago Booth School Of Business, the Center for the Study of Economy and Society at Cornell University, and Cornell University’s Graduate School. Direct correspondence with the author at [email protected].
Transcript of TRUST AND PARTICIPATION IN AN EMERGING...

TRUST AND PARTICIPATION IN AN EMERGING MARKET: LEADING AND LAGGING EFFECTS OF SOCIAL TIES ON CORRUPTION
Christopher B. Yenkey Univ. of Chicago Booth School of Business
Draft: Please do not cite without permission of the author
Abstract
This paper analyzes the effects of social ties between investors and a corrupt stock broker as they relate to the broker’s selection of victims for a fraud and investors’ subsequent reactions to experiencing the fraud. In contrast with earlier work linking interpersonal relationships with malfeasance, I first ask whether shared group membership between investors and their broker is positively or negatively related to being selected as a victim. Second, I ask whether shared group membership mediates victims’ reactions to the fraud, looking to see how post-fraud levels of investing differ between investors who share group-level ties with the corrupt broker and those who belong to rival groups. The empirical setting is the tribally diverse and contentious population of investors in Kenya’s emerging stock market, where investors and their stockbrokers can be members of the same or rival tribal groups. Analysis of investor-level data from a major stockbroker scandal in 2008 suggests that corrupt brokers disproportionately target clients from their own tribal group for theft of cash and shares but avoid stealing from the accounts of investors belonging to rival tribes. Investors sharing the tribal tie to the corrupt broker continue to increase the value of their investments post-scandal, while members of rival tribes reduce the value of their investments. Investors belonging to the broker’s tribe reduce future investments primarily in response to increased personal financial losses or when a great number of fellow tribe members also experience the fraud. In contrast, the negative reactions of investors belonging to the rival tribe do not intensify with either rising personal financial losses or with an increase in the number of proximate other victims. Taken together, results suggest that group-level ties increase the likelihood of experiencing the fraud but also increase the severity of fraud necessary to trigger a reduction in trust in the market. Keywords: fraud, social networks, group identity, emerging market
This research was supported by a grant from the National Science Foundation (Grant No. 0802469), the University of Chicago Booth School Of Business, the Center for the Study of Economy and Society at Cornell University, and Cornell University’s Graduate School. Direct correspondence with the author at [email protected].

1
Introduction
The goal of this paper is to deepen our understanding of the role of social ties in the
causes and consequences of malfeasance. I address two primary questions. First, I revisit the
question posed by Baker and Faulkner (2004) about the protective versus harmful effects of
social ties on experiencing fraud from the perspective of group membership. Instead of
contrasting the potentially protective effects of interpersonal ties between principals and agents
against the potentially harmful effects of ties as they might lead to increased opportunity for
being recruited into a fraud, I study how a corrupt agent selects victims from his existing client
base of the membership of each in the same or rival social groups. In doing so, I analyze the
likelihood of becoming a target of fraud not as it relates to interpersonal connections between
principals and agents, but instead as it relates to the larger context of ties to sympathetic or
antagonistic groups. The primary question asked here is whether corrupt agents select victims
from their own social group or from a rival group?
Second, I analyze the reactions of actors that experience the fraud as a function of these
group-level ties between the victim and the perpetrator. This line of analysis is interested in
better understanding whether the expected negative effects of fraud are mediated by social ties
between victims and perpetrators. The primary question asked here is whether actors who are
victimized by a member of their own social group react more strongly to the event than do
victims belonging to a rival group?
In both lines of inquiry, I focus on the role of social ties at the group rather than the
individual level. Starting with data on dyadic pairings between investors and their stockbroker, I
observe the membership of each in close-knit ethnic groups. With data on almost 400,000
geographically disparate investors who become clients of a limited number of stockbrokers, I

2
assume that there are few if any pre-existing interpersonal relationships. Put simply, the formal
tie in this study is the investor-broker relationship without any assumption that they know each
other personally. These ties, however, are embedded in a larger social structure in which each
actor embodies a meaningful social identity resulting from membership in close-knit ethnic
groups. The empirical context is Kenya’s tribally diverse and contentious population, where the
stockbroker is a member of the economically dominant Kikuyu tribe. Investors can be members
of three different tribal groups: members of the same economically dominant tribal group, one of
two rival tribes who compete at the local and national level for economic resources, and a third
group of investors belonging to one of nine non-rival tribes not in strong competition for
resources..
The empirical analysis focuses on the 2008 corruption case of Nyaga Stockbrokers, a
case of intermediate fraud (Clinard 1984) where an initially legitimate business later defrauded a
subset of its clients, resulting in the broker’s expulsion from Kenya’s Nairobi Securities
Exchange (NSE). In early 2008, Nyaga served as the market intermediary for approximately 25
per cent of Kenya’s 400,000 investors. While Nyaga legitimately served as the intermediary for
most of its clients, it actively stole from about 18,000 investors either by stealing cash or shares
from their electronic account. With access to the NSE’s investor database, I am able to see which
investors were affected and measure their tribal group membership. I then estimate the likelihood
of each account being targeted as well as the reactions of all investors as a function of a dyadic
measure of the investor’s membership in the same, rival, or non-rival tribal groups compared to
her stockbroker.
Results suggest that the 18,000 victims are disproportionately members of the
stockbroker’s same tribe. In contrast, clients who are members of the rival tribe are significantly

3
less likely to be targeted for the fraud, while members of tribes who are non-rivals to the broker
are insignificantly affected. Investor reactions to experiencing the fraud differ along the lines of
group membership as well, but in a somewhat opposite direction. Although all investors exposed
to the fraud curtail future investments somewhat, members of the rival group are more sensitive
to experiencing fraud, reducing future investments simply as a function of having been a client of
a corrupt broker, while inv. Investors who share the tribal group tie to the corrupt broker seem to
react more negatively only when the financial value of their personal losses is greater or when
they are in closer proximity to a greater number of other defrauded investors in their tribe. Put
another way, investors who are cheated by a member of their own group seem to have a higher
threshold for tolerating the fraud, but once this threshold is met they reduce future investments
disproportionately. Rival group investors, however, are quick to reduce their future investments,
but this negative reaction does not seem to grow as their personal losses increase or as more
members of their group experience the fraud. I interpret these results as suggesting that social
ties at the level of group membership make one more vulnerable to fraud but also increase the
threshold for negative reactions to the fraud, with negative reactions more easily triggered in
rivals but that the disproportionately negative reactions of in-group members predicted by
theories of social network closure resulting from more severe exposure to the fraud.
The next section describes the empirical setting of the study in order to familiarize the
reader with the empirical facts of the case used in this study, including the social setting in which
the rival social identities operate. The following section provides a theoretical discussion of the
competing predictions offered by earlier work in sociology, criminology, and social psychology,
contrasting the large body of work on the protective role of networks with that of more recent
work that looks at the effects of social ties on the negative outcomes of fraud and over

4
commitment. A section describing the novel dataset and empirical framework is followed by
presentation of results. Concluding sections discuss interpretations of the results and briefly
outline the next steps in the analysis.
Empirical context
The recent history of the Nairobi Securities Exchange (NSE) has seen both high levels of
investor recruitment as well as several notable scandals. By 2005, fifty years after its founding,
the NSE had mobilized only 140,000 total investors from a national population of about
2,500,000 households with the financial resources to do so. Following a package of state-adopted
market liberalization reforms adopted in 2005, a wave of investor recruitment occurred between
May 2006 and December 2008. In this short period, the number of total investors soared ten
times to approximately 1.4 million. Yenkey (2012) argues that communication within tribal
groups was a primary pathway through which information and influence traveled in Kenya,
showing that potential investors often entered the market as a result of learning about the benefits
of shareholding from co-ethnics rather than geographically proximate prior adopters.
Three notable scandals occurred during this dynamic growth period on the NSE. In May
2006, publicly traded Uchumi Supermarkets filed for bankruptcy and delisted, leaving 7,213
uncompensated investors at a time when there were approximately 175,000 investors in the
market. In March 2007, the stockbrokerage firm Francis Thuo and Partners was expelled from
the market for the practice of stealing funds from clients’ accounts and trading in their shares,
forcing all of their 4,000 clients, an unknown number of which suffered financial losses from
theft and fraudulent trading, to transfer their accounts to another intermediary.

5
The third and largest of the scandals was the collapse of Nyaga Stockbrokers in April
2008. As the largest brokerage in Kenya at the time, Nyaga was the intermediary for about 25
per cent of the 397,413 investors in the market. Among Nyaga clients, 18,006 were direct
victims as a result of Nyaga agents stealing cash or shares from their electronic accounts.
Nyaga’s fraud began as agents using clients’ shares for trades in the secondary market, keeping
the resulting profits and then returning those shares to the client’s account. However, unexpected
losses began to mount from those trades, resulting in rogue agents making both cash withdrawals
from client accounts and permanently selling shares and keeping the proceeds, both as a means
of covering losses. The extent of theft reached such a level that the brokerage was suspended
from operations on March 5, 2008, and placed under statutory management by the NSE and the
state regulatory agency, the Capital Markets Authority (CMA). Since that time, evidence has
surfaced that officials at the NSE and the Capital Markets Authority had been aware of the fraud
for some time before they shut it down. Even those Nyaga clients that were not direct victims
were non-trivially exposed to the fraud, as they were notified by the NSE that their stockbroker
had been expelled from the market as a result of fraudulent practices and their accounts had to be
transferred to another broker before any further transactions could take place. Due to the highly
infrequent use of online accounts, the majority of investors accomplished this by traveling to the
NSE in Nairobi, often on multiple occasions, to fill out to necessary paperwork. For almost two
months, the NSE’s offices in downtown Nairobi were the site of a queue of Nyaga clients and
victims that at times stretched for blocks. No investor associated with Nyaga, even those who
were not directly stolen from, escaped the experimental prime of being associated with a corrupt
and collapsed broker.1
1 Corruption is a common event in Kenya. The 2007 Transparency International Corruption Perception Index estimated that 87% of Kenyans paid bribes to access basic services in some form (e.g. payments to police, local or

6
The analysis presented here focuses on the effects of the Nyaga scandal rather than the
other two for several reasons. First, more complete data is available for this scandal than for the
previous two. Following the first brokerage collapse (Francis Thuo and Partners), the Kenyan
state established the Investor Compensation Fund to reimburse investors who lost money due to
corrupt practices in the market. Because Nyaga victims were eligible for reimbursement, each
was provided with a statement of all past activity (cash withdrawals or share trades) on the
account. If an investor found an unordered trade or an unrequested withdrawal of funds in her
account, she could submit a claim for reimbursement. The NSE management team shared their
list of the 18,006 verified claims from the Nyaga collapse, thus allowing me to measure the
intensity of each investor’s exposure to the fraud. Second, the Nyaga scandal directly preceded
the largest IPO in Kenyan history- the listing of state-owned telecom Safaricom. In contrast, the
Thuo scandal was followed by the listing of a small, relatively unknown private advertising
conglomerate that drew less popular demand. Given the extraordinary public appeal of the
Safaricom IPO and the widespread exposure of the Nyaga scandal, I argue that this specific event
makes for a more suitable natural experiment of the effects of fraud by providing a more
measurable single instance of fraud tied with a locally meaningful opportunity for investors to
respond. The Safaricom IPO subscription period began just six weeks after the collapse of the
Nyaga brokerage, enough time for investors to transfer to another broker but not sufficient time
for them to be compensated by the Investor Compensation Fund.
Tribal group membership is the primary mode of social identity I consider in this study
precisely because it is so salient in Kenyan society. Tribal membership has long been known to
play a key role in the formation of social identity in East Africa, an in Kenya in particular
(Brewer 1969). In addition to the author’s work on investor recruitment mentioned above, national government, utility providers), ranking it 150th internationally.
7
anthropologists have shown that tribal membership, particularly in Kenya, is a key institution
through which economic activity is organized. Ensminger (1996) shows this with the
development of market institutions among the Orma in northeastern Kenya, while van Ufford
and Zaal (2004) explain the development of a national beef market in Kenya in the 1990s as a
product of inter-tribe distrust. Here, butchers and traders from disparate parts of Kenya, each
representing the tribe of their home region, travel to the Tanzanian border to buy directly from
herdsmen there, preferring to form a closed supply chain within the tribe over long distances
rather than entrust purchases to out-group middle men.
An in-depth historical account of ethnic tensions in Kenya is beyond the scope of this
paper. In order to illustrate the salience of the three groups I operationalize, a brief description of
ethnic conflict at the time of the Nyaga stockbroker scandal should suffice. The Kenyan
presidential election in December 2007 saw the sitting president, a member of the economically
dominant Kikuyu tribe, challenged by a coalition ticket comprised of members of the Luo and
Kalenjin tribes, both traditional rivals to the Kikuyu for political and economic power dating
back to the colonial era. Both campaigns made extensive use of tribal tensions to mobilize
support, and both groups are widely understood to have engaged in vote rigging (Gutierrez-
Romero, forthcoming). Two weeks after the election, the Kikuyu candidate was announced as
the winner in an awkward and suspicious series of events. Members of the ethnic opposition
began violent raids on Kikuyu communities in an organized pattern that suggested preparations
had been made ahead of time. A number of similarly organized Kikuyu groups retaliated,
producing several weeks of ethnic clashes that left approximately 1,300 dead and more than
400,000 internally displaced. Both major presidential candidates publicly accused the other of
ethnic genocide, and five years later the case is still being heard by the International Criminal

8
Court, with major political figures on both sides under indictment for crimes against humanity. It
was in this environment in March 2008, just weeks after Kofi Annan brokered a peace deal
between the two sides, that Kenyan investors belonging to these three groups (the Kikuyu, their
Luo and Kalenjin rivals, and the remaining non-rival tribes) received the news that their Kikuyu
stockbroker had been expelled from the market because of fraud and that they should check their
accounts for lost funds and begin the search for a new intermediary.
There is on additional aspect of the empirical setting that deserves our attention, given the
research questions being asked: what is the role of tribal ties in creating client ties between
investors and stockbrokers? Data is being collected on the tribal affiliation of all 27
intermediaries licensed by the NSE in order to include this important initial question in the full
analysis. At the current time, however, I only know that the Nyaga Stockbrokerage is a fully
Kikuyu-run organization, and I know the tribal affiliation of their clients relative to all other
investors in the market. At the time of the Nyaga scandal, approximately 60 per cent of all Nyaga
clients were Kikuyu, while only six per cent of clients were members of rival tribes, and 34 per
cent of clients were non-rivals to the Kikuyu. Among non-Nyaga clients in the market,
approximately 42 per cent are Kikuyu, 10 per cent are rivals, and 40 per cent are members of
non-rival tribes. These descriptive statistics strongly suggest that Kikuyu investors make up a
disproportionate number of Nyaga clients. These summary data will not surprise sociologists that
have long demonstrated the role of shared ethnicity and related forms of homophily on the
creation of social and economic ties.

9
Social ties as a cause of and reaction to fraud
Seminal work in the social sciences demonstrates that similarity breeds tie formation and
those ties subsequently foster more trustworthy behavior and minimize the risk of malfeasance.
The expected outcomes of two alternative but not uncommon scenarios have received less
attention: the risk of malfeasance in networks formed between antagonistic groups, and how
victims’ reactions to malfeasance might differ according to membership in the same versus rival
groups as the perpetrator. In this section, I revisit the question of the expected protective versus
harmful role played by shared social ties on the likelihood of malfeasance and then extend that
discussion by theorizing how victims’ reactions to fraud might vary according to their
membership in shared versus rival group as the perpetrator.
Brokers choosing victims
Baker and Faulkner (2004) were the first to empirically test the competing predictions of
the role of social ties in malfeasance. Sociologists have long argued that social ties play a
protective role against malfeasance in numerous ways. Social ties provide a higher degree of
information about more risky transactions (DiMaggio and Louch 1998), create closure within
social groups which facilitates monitoring and enforcement of productive group norms (Coleman
1990; Burt 1992), and creates an environment in which the cost of cheating a member of one’s
group escalates considerably with the possibility of other group members discovering the fraud
(Granovetter 1992). In contrast, criminologists tend to focus on the harmful nature of social ties,
which can be used to facilitate recruitment of victims into a fraud through the use of shared
social ties including group membership. Here, shared social ties create a false sense of trust,
reducing the likelihood that an actor will conduct due diligence before entering the exchange.

10
Baker and Faulkner (2004) were the first to empirically test these contradictory
outcomes of social ties, using a strategic case in which interpersonal ties between investors and
an oil exploration firm could have been use to either recruit new victims or insure repayment of
investment when the firm faced financial difficulty. They found that interpersonal ties between
investors and the firm’s principals served a protective role, helping investors who knew
principals personally avoid losing their full investment. Secondary ties, those investors whose
contacts had personal relations with company principals, were not similarly protected.
Although illuminating, this single empirical case cannot capture the full range of possible
outcomes where social ties are part of a large scale fraud. Social ties operationalize in myriad
ways across empirical settings, but most existing work studies social ties as direct, interpersonal
ties. In contrast, the case studied here considers the possible outcomes when ties are formed
between economic actors belonging to the same versus rival social groups. Operationalizing
social ties in a way that allows group membership to matter and adds the additional dimension of
known antagonism between groups shifts the focus of the analysis more to the social context in
which ties are formed and away from the degree of inter-personal connections between the
actors.
Geertz (1968), Coleman (1990), and Biggart (2001) each studied the high trust
environments in which rotating savings and credit organizations (rosca’s) operate in developing
countries, finding that dense interpersonal ties in these local savings groups facilitate trust by
make malfeasance “unthinkable” in small, close knit communities. We know little, however,
about the prevalence of malfeasance in groups comprised of members of rival social groups.
Exchange relations between members of rival groups are, of course, less likely to form, but this
does not mean that such situations are not still fairly common. Examples might include shop

11
keepers whose businesses serve customers from antagonistic social groups, real estate agents
who broker purchases for members of their own as well as rival groups, or grant writers seeking
funding from an expectedly reticent source. In these settings, do we expect that social ties at the
level of the group will protect exchange partners from malfeasance or make them more
vulnerable? If more dense social ties within the group increase monitoring and enforcement, then
the fraud is more likely to be discovered, the agent would be more likely to suffer both social and
economic sanctions as a result of increased communication within the victim’s group, and
therefore the agent should be less likely to cheat his own group. But as predicted by
criminologists, potential victims are more likely to trust and less likely to perform due diligence
on agents from their same social group, thus creating a better opportunity for a corrupt agent to
successfully steal from them. Alternatively, the corrupt shop keeper might be less likely to cheat
a member of an antagonistic group because of the expectation that such rivals increase due
diligence and monitoring, suggesting that the agent will be less likely to cheat his rivals because
their increased scrutiny makes it more likely that the fraud will be discovered.
Studying stockbrokers who serve investors belonging to both the same and rival social
groups provides a productive setting for revisiting the contrasting theoretical arguments made by
sociologists and criminologists presented by Baker and Faulkner, looking for the harmful versus
protective effects of social ties at the level of contentious groups. Either outcome once again
seems plausible. Corrupt stockbrokers might be more likely to steal from in-group members
because they expect them to be less likely to be monitoring against malfeasance and hence the
crime goes unnoticed, or they may avoid cheating in-group members because they expect greater
monitoring and enforcement among group members which would increase the likelihood of
discovery and loss of future business. These basic propositions can be similarly applied to

12
members of rival groups, as they could be more likely to detect the fraud due to heightened due
diligence and/or more likely to react more strongly as a result of the underlying tensions between
the groups. Ex ante, either outcome seems plausible:
Research Question 1 (RQ1): Are corrupt agents more or less likely to target members of their social group or a rival group when conducting a fraud?
Reactions to the fraud: future participation
Prior research in sociology has tended to focus on the social arrangements that facilitate
trustworthy behavior, with much less attention paid to instances where trust has been violated.
Studies of local savings groups in Africa and Asia document the close knit social structure that
leads to high trust (Geertz 1968; Biggart 2001), but there are no follow up studies on what
happens when a group member does in fact violate that trust. Greif (1993) convincingly argues
that kinship-based ties increased trust between principals and agents making long distance trade
possible in the Mediterranean almost 1,000 years ago, but we have no data on what happened in
those presumably rare events when a member of such a group did abscond with a shipment of
goods. Surely not even the strongest advocate of the sociological argument that social ties protect
actors from malfeasance would argue that such an outcome is absolute? Baker and Faulkner
(2004) show us a lower risk for losing an investment if there is a direct social tie between the
investor and the corrupt agent, but unless this risk is reduced to zero, it should be productive to
consider how investors might respond to a fraud as a function of their shared versus rival ties to
the corrupt agent. I consider the possible reactions of in-group versus rival group victims of
fraud.

13
Reactions of in-group victims
A relatively new line of work among sociologists investigates the negative effects of
social ties on economic outcomes. The generalized finding is that actors form biased assessments
of prior exchange partners, which can either create higher performance by way of a self-fulfilling
prophecy by extending better terms of trade to our social contacts which then improves
performance (Kollock 1994), or we reduce the objectivity of our post-exchange assessments and
bias performance calculations upward as a result of affective attachment to our contacts (Lawler
1992). Sorenson and Waguespack (2006) demonstrate that actors overestimate the quality and
trustworthiness of prior exchange partners in a study of historical ties between Hollywood film
producers and distributors that result in the latter investing inordinate levels of resources to
promoting and releasing the formers’ films, resulting in lower economic gains for the distributor.
Biased assessments of prior connections quite easily extend beyond dyadic past exchange
relations and into the realm of ethnic group membership, particularly in a setting like Kenya
where tribal group membership is a fundamental pathway through which resources flow in a
patronage system. In a reanalysis of Kanter’s (1968, 1972) work on pathways of group
commitment, Hall (1988) finds that ethnic group membership is the strongest underlying factor
aiding group-level survival across a population of utopian societies. Lawler (1992) similarly
finds that greater emotional attachment occurs between individuals and group-level identities
that strengthen their generalized sense of control. Sgourev and Zuckerman (2011) find that
secondary emotional attachment to connections within a business peer network reduce the
likelihood of exiting the group, even in the presence of a decreased assessment of the group’s
contribution to an individual’s economic interests.

14
Experimental evidence from social psychologists presents a contrasting prediction.
Yamagishi et al. (2009) find evidence that expectations of fair behavior are higher among in-
group members than for out-group members, a concept directly relevant here. If expectations are
higher for fair behavior within the social group, then it should follow that more negative
reactions ensue when those expectations are not met. In such cases, we would expect Kikuyu
investors who are exposed to fraud by their in-group stockbroker to react more negatively. This
prediction is in line with the bulk of social network theory discussed above, including the
expectation that more dense social ties create increased monitoring and enforcement of group
norms (Coleman 1990; Burt 2000).
These arguments present competing predictions of how victims of fraud would react if
the perpetrator hails from the same social group. Would attachment to one’s primary social
group, especially in Kenya where tribal groups seek to control scarce resources, create a more or
less negative reaction to fraud when the perpetrator is a member of the same group? Evidence
from earlier work might predict either that the affective attachment embodied in such ties might
provide a protective bugger against such a departure from the expected trustworthy behavior, at
least in the short term or when the exposure to fraud is relatively small. Alternatively, a fraud
committed by an in-group member could trigger a disproportionately negative reaction by virtue
of its incongruence with the expectation of fair and trustworthy behavior.
Reactions of rival group members
Existing work from sociological studies of social ties and trust does not provide much
traction on the question of malfeasance by alters from antagonistic groups. Earlier work has
found structural differences in corrupt networks compared to networks of legitimate business

15
contacts, with corrupt networks more designed for concealing the identity of agents (Baker and
Faulkner 1993; Diesner, Frantz & Carley 2006; Aven 2012), as issue addressed in more detail
below. Logically, we might predict that the reduced likelihood of ties initially forming between
members of rival groups would either limit the expectations of rival group members of fair
treatment by the agent; alternatively, those members of the rival group that do form a tie to a
stockbroker from the rival group might represent the small subset of investors who are
disproportionately most likely to trust that the transaction will be handled according to the shared
interests of each party (Hardon 2006).
Social psychologists have addressed the question of how members of rival groups react
to stimuli more directly. Some earlier work suggests that reactions to fraud perpetrated by a rival
group member would be less negative as a result of the initially lower expectations of
trustworthy behavior that members of rival ethnic groups have for one another. Steele et al.
(2002) and Prudie, Steele & Davies (2004) find that trust between ethnic minority and majority
groups is less likely to develop in situations where minority groups have been historically
subjected to prejudice and discrimination at the hand of the majority group. Thus, actors in
general are less likely to trust members of other groups (Tajfel & Turner 1986), which leads to
less positive expectations for interactions with members of rival groups (Tropp 2003), and
therefore a lowered degree of felt victimization when a tie with a rival results in a fraud. In such
a setting, a defrauded rival group member, especially one whose rival group is in the minority,
might be expected to exhibit what sociologists have called “theory driven learning,” where
experiences that confirm theoretical priors are more heavily weighted in decisions about future
actions while experiences that run counter to one’s priors are discounted (Strang and Jung 2005).

16
Carr and Steele (2010), however provide reason to think that members of rival, minority
groups might react disproportionately negatively if the perceived stereotype assigned to their
group is confirmed. In experimental settings, these researchers find that subjects are more risk
averse in financial decisions when a negative stereotype about them is stimulated. In the Kenyan
case, members of the rival group are the negatively stereotyped group, having been relegated to a
less favored economic position in Kenyan society many years or decades prior and might be
expected to react disproportionately negatively to experiencing fraud, especially when it
confirms their stereotype as the minority, disadvantaged group.
There are conflicting expectations, then, when trying to predict the reaction of a
defrauded member from a rival group. The disadvantaged rival might discount the experience on
account of lower initial expectations of fair treatment, or the fraud might intensity her reaction to
being in the disadvantaged minority. In the Kenyan context studied here, if you already believe
that you are in the minority group and the market is rigged, then experiencing that could either
confirm what you already knew before entering the market and therefore not dissuade future
investments or serve as a final, direct indicator of expectations of unfair treatment and reduce
future investments.
Taking into account the contrasting predictions of how investors’ from the corrupt
broker’s same versus rival tribes might react to experiencing the fraud, I am content to simply
ask the question:
Research question 2 (RQ2): How do reactions to a fraud differ according to shared social group membership between victim and perpetrator?

17
Finally, it should be noted that both same and rival group investors can experience the
fraud in a range of ways that would be. First, the tension between victims and perpetrators might
differ according to whether the investors was just a client of the Nyaga brokerage, and therefore
received the stimulus that the broker was corrupt but did not steal directly from them. Second,
the investor may have been directly stolen from, and the sum stolen might differ in gross value or
percentage of an investor’s portfolio. Third, and especially relevant to the group-level dynamics
of interest here, investors may be located in closer proximity to greater numbers of other Nyaga
clients and victims. In settings where there is a greater concentration of others experiencing the
fraud, each investor’s private information about the fraud would increasingly constitute public,
shared information or felt experience. This might be especially true when the numbers of other
clients or victims are members of one’s own tribal group. This third approach, which accounts
for the prevalence of the fraud among members of the tribal group, accounts for the social
identity of affected investors in the context of their ties to a corrupt broker. If ex ante we expect
fraud to have a negative effect and that shared versus rival group ties to the perpetrator are
important, then it is necessary to consider not just the effects of dyadic differences in group
membership but also the location of each investor within the larger structure of victims
surrounding her.
Data and methods
Access to the NSE’s clearing and settlement database allows me to construct a unique
dataset of investor-level attributes, behaviors, and exposure to the Nyaga Stockbroker fraud.
NSE databases provide geographic location for most investors as well as the family name of each
account holder, with family name being highly related to tribal membership in Kenya.

18
Approximately 90 per cent of all NSE account contain a verified town of residence. Because an
important component of the analysis is geographic proximity to other investors exposed to the
fraud and a range of control variables are included based on location of residence, only investors
whose account contained a verified town of residence are included in the analysis. NSE account
data for 71,347 out of approximately 100,000 Nyaga clients contained a verifiable town of
residence.2 Investors lacking a verifiable town of residence don’t show patterns of bias in terms
of portfolio size, diversity, or tenure in the market.
Dependent variables
The outcome variable for research question 1 is a dichotomous measure indicating
whether or not an investor who was a Nyaga client also directly experienced theft of cash or
shares as reported by the Investor Compensation Fund. Investors’ reactions to the fraud, the
focus of the second research question, are measured as the natural log of the value of investment
made in the telecom privatization IPO six weeks after Nyaga’s expulsion from the market. For
this second analysis, I estimate the size of investment for all 397,413 investors in the market at
the time, with independent variables distinguishing Nyaga clients and/or victims from non-
affected investors.
2 Town of residence is self-reported by investors and hand entered by NSE clerks when the account is opened; as a result, the raw data contained numerous misspellings. To correct this without bias, I employed Basis Technologies’ Rosette Name Indexer algorithm (http://www.basistech.com/name-indexer/), which compared the provided town names against a list of verified names of legal administrative units gleaned from GIS databases referenced against the 2000 Kenyan Population Census. The algorithm assigned each provided name into a “true” town name, given a 99% confidence interval. Approximately 98% of all self-reported names were thus matched to a verified town.

19
Independent variables
Investors’ tribal membership was coded by eight independent coders, each indigenous
Kenyans representing Kenya’s six largest tribal groups. Coders were provided with a list of the
20,000 most commonly occurring family names from the NSE’s investor registration database,
which captures 94% of all investors, and a list of Kenya’s 12 largest tribal groups and two
common non-tribal groups (South Asian and English). Each coder would code each name
according to the group that coder felt more than 75% confident the name could represent. Names
could receive multiple tribal codes, which was more common for non-rival tribes which shared
common history and very rare for members of rival tribes. Each name was then assigned a score
according to the percentage of all coders who identified it in each tribal group. Inter-rater
reliability is exceedingly high. Using these scores from each of the 12 tribal groups, I created
scores for each investor according to their percentage membership in the Kikuyu tribe (that of
the stockbroker as well), one of two rival tribes (Luo or Kalenjin), or a non-rival group (all other
tribes). Investors count toward each group proportional to the score they have in each category;
although categories are non-exclusive and non-discrete, 95% of all coded investors have a
combined score of less than 1.5.
Exposure to the fraud is operationalized in multiple ways: at the individual and group
level, and in terms of simply being a Nyaga client versus having been a direct victim of theft. At
the level of the individual investor, I create a categorical variable indicating whether that investor
was a client of the corrupt Nyaga broker. An investor is coded as a Nyaga client if at least 50 per
cent of her investment in her most recent IPO subscription or her most recent share trades were
executed by the Nyaga brokerage. Access to the Investor Compensation Fund data shows the
value of each victim’s verified loss, with 18,006 of the 397,413 Nyaga investors experiencing

20
actual financial losses as a result of direct theft of cash or shares from their accounts. I also
measure the frequency of other Nyaga clients and victims in the investor’s home district, both as
a total count of other clients and as the total financial value of their losses. An additional district-
level measure of fraud exposure by members of the investor’s tribal group is calculating as the
number of other Nyaga clients and their actual financial losses among members of the same
tribal group within the district.
Controls
The analysis controls for a wide range of alternative predictors of the size of investment
in the telecom IPO following the Nyaga scandal, including portfolio composition, past
performance, exposure to other financial frauds, and level of exposure to the listing company and
its advertising campaigns. I control for each of these by including a range of control variables.
Portfolio value is the logged value of all shares held by the investor, calculated with share prices
at the end of trading the day prior to the start of the IPO subscription period modeled here.
Portfolio diversity is measured as the number of different equities held by the investor at the time
of the IPO. Portfolio performance is measured as the logged value of profits earned on the
previous IPO. Additionally, investors who entered the market prior to the rise in popular
participation in 2006 (discussed above) might also be more likely to participate in the telecom
IPO; a dichotomous variable indicating the investor’s entry into the market pre-2006 is included.
All models include a dummy variable indicating each investor’s location in one of
Kenya’s 68 administrative districts, roughly equivalent to counties in the U.S., which captures a
range of location-invariant attributes including the presence of offices or agents working on

21
behalf of each market intermediary. Controls for rates of stock market participation in the
investor’s district were estimated but not found to alter results and are not presented here.
I control for effects of generalized trust studied in the finance literature (Zignales 2008)
and specific experience with the listing firm by including district-level measures of instances of
fraud in financial organizations as well as use of cell phones (relevant because the Safaricom
telecommunications firm being listed in the period of interest had 87% market share in the
Kenyan cell phone market at the time). Rates of perceived and experienced fraud are calculated
by averaging district-level responses to the 2009 FinAccess survey, conducted by Financial
Sector Deepening-Kenya. Respondents were asked of about their experiences with fraud across a
wide range of organizations, including formal banks and insurance programs as well as informal
savings programs such as rotating savings and credit associations.
Finally, I control for the effects of advertising campaigns conducted leading up to the
IPO by including data on media expenditures by the telecom collected by a Nairobi-based market
research firm. Media buys are estimated based according to the duration and time of day of radio
advertisements promoting the telecom in the month preceding the start of the IPO subscription
period.
Methods
Selection of a Nyaga client for theft of cash or shares by a corrupt Nyaga agent, the focus
of research question 1, is modeled using binomial logistic regression predicting the 18,006
verified victims of financial losses from the population of 71,347 Nyaga clients. Reactions to the
fraud are modeled using OLS models predicting the logged value of each investor’s subscription
to the telecom IPO that followed the fraud. This model estimates the effects of varying exposure

22
to the Nyaga fraud across the full population of 397,413 investors in the market at the time,
subject to the controls described above.
Results
Descriptive results of the population of victims
Before presenting results of models addressing the two stated research questions, it is worth
noting some interesting descriptive patterns in the data. The first is the fact that victims were
drawn from the full range of portfolio values across all Nyaga clients (results not shown here).
Although there is a slight trend toward targeting investors with higher than average portfolio
values, victims were selected from all deciles of the distribution of portfolio values. Victims
were chosen between the 10th smallest and 213th largest investors in the market at the time.
Second, victims are evenly distributed across geographic areas in direct proportion to the number
of Nyaga clients in each district. Figure 1 shows a district-level scatterplot of the percentage of
Nyaga clients living in each district (horizontal axis) plotted against the percentage of Nyaga
victims living in the same district. The trend line demonstrates that victims are evenly distributed
geographically across the at-risk population. Although I do not have data to conclusively
demonstrate that this was an explicit strategy on the behalf of Nyaga agents to separate the
victims, this descriptive result is consistent with earlier work that demonstrates the intentionally
sparse structure of corrupt networks, a feature that aids detection avoidance (Baker and Faulkner
1993; Diesner, Frantz & Carley 2006).
**Figure 1 about here**
Finally, the size of theft within each account is large. Figure 2 presents data showing the
post-scandal portfolio value of the 18,006 Nyaga victims (black line, left axis), the financial

23
value of cash and shares stolen in the fraud (red bars, left axis), and the percentage of pre-scandal
portfolio value that was stolen (green bars, right axis). These data show that corrupt agents stole
a rather consistent and high percentage of the portfolio value of each victim’s account. On
average, victims lost approximately 30 per cent of portfolio value to theft, but the modal level of
theft exceeds 50 per cent. Taken together, Figures 1 and 2 suggest that corrupt agents may have
been more concerned with concealing knowledge of the fraud across investors rather than
limiting the potential within any given victim to notice it.
**Figure 2 about here**
Brokers choosing victims
Table 1 contains summary statistics and correlations for all variables in the analysis of
which Nyaga clients were targeted for theft of cash or shares from their accounts. Table 2
presents logistic regression estimates of an investor experiencing theft of cash or shares given
that she is a Nyaga client. Coefficients in Model 1 suggest that Kikuyu investors, those sharing
the tribal group membership with the corrupt Nyaga agents, are almost 13 per cent more likely to
be targeted for the fraud from among the population of at-risk clients, while members of rival
tribal groups are 15 per cent less likely to be targeted. Model 2 controls for the proportion of
Nyaga clients in each district who are Kikuyu or Kikuyu rivals but produces estimates consistent
with model 1, suggesting that agents’ targeting of Kikuyu investors is not a function of the
increased opportunity created by the available population of Kikuyu or rival tribe members.
**Tables 1 and 2 about here**
Models 3-5 estimate the effects of tribal group membership separately for three
illustrative geographic districts: the tribally diverse capital district of Nairobi as well as two
districts where either Kikuyu or rival populations are highly concentrated (Thika and Kisumu,

24
respectively). The diverse capital district of Nairobi exhibits the same nationally aggregated
trend seen in models 1 and 2, with victims are more likely to be from the same Kikuyu tribe as
the corrupt agent. However, model 4 suggests that in a district dominated by the Kikuyu,
investors from rival tribes are 55 per cent more likely to be targeted for theft. In the district
dominated by rival tribe members, however, Kikuyu investors are 265 per cent more likely to be
targeted for theft relative to the rival tribe members who make up the dominant tribal group in
the district.
These results seem to be consistent with an agentic process by which the perpetrator is
attempting to socially isolate victims. On the aggregate, the corrupt agent will target members of
his own tribal group, but his selection of victims differs across these social groups according to
the concentration of members of that group in the district. Assuming that members of
antagonistic tribal groups would be less likely to communicate with each other (Yenkey 2012),
this could be an effective way to isolate victims of the fraud in a way that limits their opportunity
for collective recognition and/or action.
Investor reactions to fraud
Table 3 contains summary statistics and correlations for all variables in the analysis of
size of future investment according to exposure to the fraud, the subject of research question 2.
Tables 4 and 5 present OLS regression coefficients predicting the logged value of investments in
the telecom IPO following the Nyaga scandal. Model 1 in Table 4 contains the full set of control
variables as well the baseline effect of both being an Nyaga client and levels of experienced
losses from theft. Estimates do not differ significantly when each indicator of exposure to the
fraud are modeled separately. Not surprisingly, being an Nyaga client is predictive of smaller

25
future investments, but the baseline effect of an investor’s personal losses from theft are
positively related to size of future investment. One interpretation consistent with a performance
strain arguments (cite) is that experienced losses, such as this from theft, increase risky behaviors
in the form of additional investments in order to compensate for the loss.
**Tables 3 and 4 about here**
Model 2 adds the baseline effects of each investor’s tribal group membership, showing
that net of controls and exposure to the two forms of Nyaga scandal, Kikuyu investors are
expected to make larger investments in the telecom IPO than are rival tribe investors. Rival tribe
members, however, are predicted to make larger investments than are non-rival tribe investors.
Models 3-5 interact tribal group membership with the dichotomous measure of having
been a Nyaga client. The interaction term is negative for all three tribal groups, but interestingly
the negative effect of the interaction only produces an overall expected reduction in the size of
future investing for the non-Kikuyu groups. The positive effect of being a Kikuyu investor
exceeds the negative effect of the Nyaga client interaction term, predicting that Kikuyu clients of
the corrupt Kikuyu broker still make larger investments in the subsequent IPO on average, albeit
lower than if they were not an Nyaga client. In contrast, the negative effect of the interaction
term for both rival and non-rival tribal groups creates a net negative prediction for size of future
investing. Taken together, these results suggest that the aggregate effect of being a Nyaga client
is negative, but that this negative effect does not hold for members of the corrupt agent’s Kikuyu
tribe.
Models 6 – 8, however, suggest that the leniency of Kikuyu investors has its limits. Here,
the interaction effect of the financial value of the losses from theft is negative and significant for
Kikuyu investors (model 6) but not significant for investors from the rival tribe (model 7).

26
However, the magnitude of the negative interaction for Kikuyu investors is lower than the
baseline positive effect of these losses, suggesting that the increases in future investments
stimulated by actual loss are merely slowed for Kikuyu investors. I interpret this result as
suggesting that an increase in actual financial losses for clients sharing the social tie with their
broker restrict future investments for these in-group investors. For rival group investors,
however, mere exposure to the scandal via a client tie to the corrupt broker is sufficient for
trigging an overall reduction in future investing. Future models will need to investigate non-
linearity in the negative interaction term for financial losses of in-group investors in order to
ascertain the level at which predicted future investments might become negative.
**Table 5 about here**
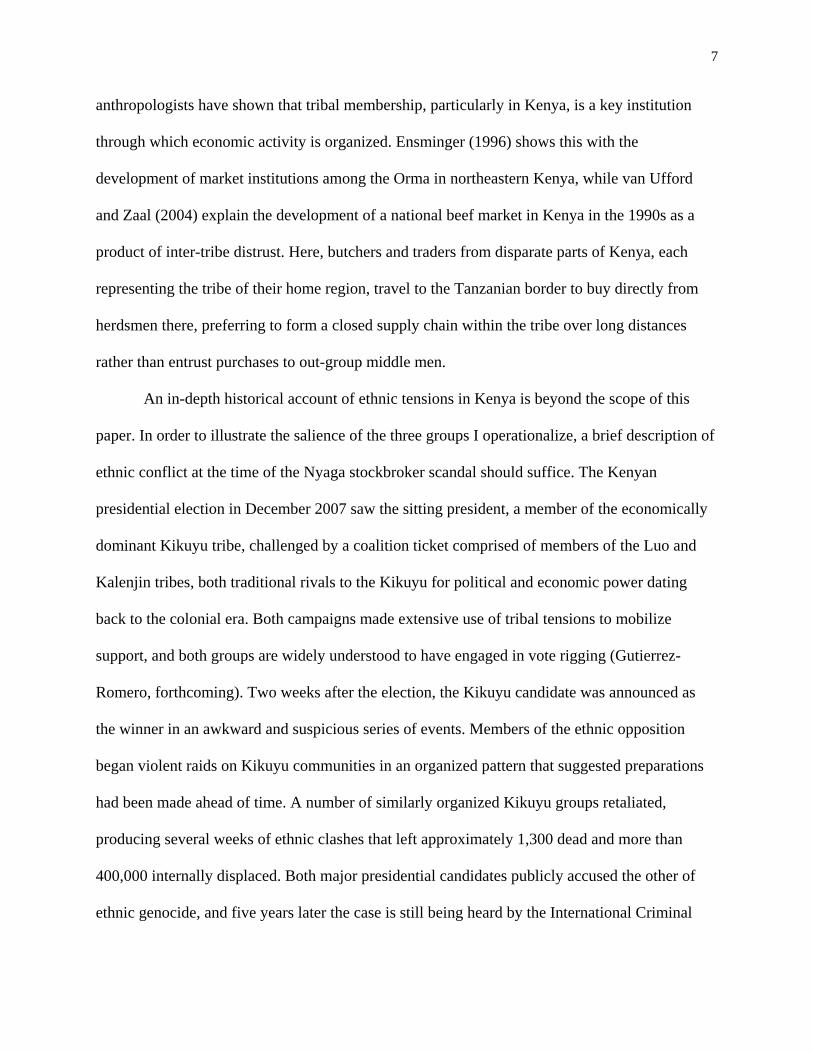
Table 5 presents a similar set of estimates, but rather than estimating the effects each
investor’s own exposure to the fraud these models estimate the effect of the district’s other
investors’ exposure to the Nyaga fraud. Models 9 – 12 show a baseline negative effect on future
investing when there are more Nyaga clients in the district; on the aggregate, being
geographically proximate to more investors who had to transfer their accounts due to the Nyaga
scandal seems to reduce the size of future investments for those investors in the market.
However, this effect seems to differ across investors in the three tribal groups. Kikuyu investors
are unaffected by increased numbers of Nyaga clients in their district (model 10), leaving them
with lower expected levels of future investing when in the presence of higher numbers of other
Nyaga clients. In contrast, the negative effect of proximity to other Nyaga clients is attenuated
for investors from rival and non-rival tribes (models 11 and 12), whose baseline negative effect
of proximity to other Nyaga clients is reduced as the number of other similarly f . It is important
to remember that these models estimate future investing for all investors in the market, not just

27
for Nyaga clients themselves. Accordingly, the relevant result here is that Kikuyu investors are
not particularly affected by higher rates of fraud-exposed investors in their district, but non-
Kikuyu investors seem to be positively affected by higher rates of fraud occurrence in their
district. One possible interpretation of this is that these out-group members take the presence of
greater numbers of defrauded others as indication that exposure to the fraud is not unique, which
might have the effect of reversing the negative effects of stereotype threat or reducing the
negative felt experience of being a member of a disadvantaged minority who is cheated by a
member of the majority group.
This pattern is reversed, though, when we look at the effects of proximity to Nyaga
clients who are also members of the investor’s same tribe. Models 13-16 show a baseline
positive effect of the number of Nyaga clients in an investor’s district who are also a member of
his tribal group. However, the interaction is insignificant for rival tribe investors while it is
negative and significant for Kikuyu investors and their non-rivals. Results from models focusing
on the reactions of Kikuyu investors (models 10 and 14) seem to suggest that these in-group
investors require negative experiences to be concentrated within the tribal group before
additionally reducing their willingness to invest in the market. In contract, models focusing on
investors from rival groups (models 11 and 15) suggest that the initial negative reaction to
exposure to the fraud will trigger any negative reaction while increased experience with the fraud
within the rival tribal group serves to ameliorate its negative effects.
Discussion
Taken together, the preliminary results presented here suggest that the corrupt
stockbroker studied here disproportionately targets members of his own tribal group for theft.

28
Model results suggest that although this is true on the aggregate, the perpetrator may also be
targeting victims according to their expected level of social interaction with proximate peers: in
districts with populations heavily oriented toward the Kikuyu tribe or its rivals, victims are
heavily drawn from the population of investors that represents the minority group in the area.
Subsequent to experiencing the fraud either personally or among other investors in one’s district,
investors from the same tribe as the corrupt broker continue to increase the value of future
investments while members of rival and non-rival tribes are expected to reduce future
investments. This pattern of less negative reactions to the fraud by investors who belong to the
corrupt broker’s tribe reduces, however, when the actual financial losses from direct theft of cash
and shares increase. Taken together, these results suggest that thresholds for negative reaction to
experiencing the fraud differ according to the mix of contentious group-level context in which
investor-broker ties are embedded, with same-group investors requiring a more direct, substantial
fraud to be perpetrated before reacting more negatively.
An alternative way to discuss these results would be to see them as a diagnostic tool for
thinking about how each member of the dyad sees the relationship are replaceable. Thinking
about the results as representative of the fungibility of ties according to the group-level contexts
in which they are embedded provides an opportunity to consider how corrupt agents may value
same-group ties differently from investors and how investors from the same or rival groups as
the perpetrator might differ in their reactions.
For example, the increased likelihood that a corrupt broker will choose a victim from his
own tribal group while those in-group investors continue to increase investments after being
exposed to the fraud suggest that the degree of tribe-level social identity and commitment is
higher for investors than it is for the corrupt broker. This finding is consistent with earlier work

29
from criminology that argues that social ties increase vulnerability to malfeasance. In a similar
way, the faster exit of rival group investors from the market suggests that they place a low value,
or have low expectations, of the outcomes of such ties.
Future directions
Three important questions remain to be addressed in order to provide a more complete analysis
of the role of social ties in the causes and consequences of the fraud studied here. Having already
mentioned the need to account for investor selection of a broker in the earlier section, I briefly
outline two additional issues that future work will need to address.
Earlier work has argued that affinity fraud is successful because those with ties to the
perpetrator, either at the interpersonal or group level, are more likely to assume that the agent is
trustworthy and therefore less likely to conduct due diligence. In the case considered here, there
is the potential for due diligence to play a role. Even though Nyaga stockbrokers operated a large
scale legitimate stockbrokerage business, the 18,000 or so clients that were stolen from would
have experienced those losses in the months leading up to Nyaga’s expulsion from the market in
March 2008. NSE investors are able to transfer their accounts to any intermediary at any point,
creating the potential that investors who did pay close attention to activity on their accounts
would have been at an increased likelihood to observe the fraud and take the corrective step of
transferring to another broker. The theoretical expectation is that investors from rival tribes
whom are known to have been direct victims would be more likely to transfer out of Nyaga prior
to the collapse. Future iterations of the analysis will want to account for this possibility.
Given that I am measuring investor reaction to fraud committed by an intermediary by
looking at future market participation, there exists the possibility that the affected investor’s

30
selection of another stockbroker in the time between the fraud and the next round of investing
would affect her level of trust in the market and therefore willingness to continue to invest. A
range of intermediaries with seats on the NSE exist, including brokers of all tribal affiliations as
well as more tribally neutral commercial banks that can execute share trades and IPO
subscriptions. Therefore, there is the possibility that investors who experienced the Nyaga fraud
could have selected a broker with a different set of characteristics, and in doing so indicate that
the lost trust was embodied in the attributes of the corrupt broker rather than in the market itself.
That is, selecting a qualitatively different intermediary could have the effect of re-establishing
trust in the stock market and therefore mitigate the impact of fraud on market performance.
Future iterations of the analysis will need to control for the intermediary that the defrauded
investors select after the Nyaga collapse and before the telecom IPO subscription.

31
References
Baker, W. E., & Faulkner, R. R. (1993). The social organization of conspiracy: Illegal networks
in the heavy electrical equipment industry. American Sociological Review, 837-860. Baker, W. E., & Faulkner, R. R. (2004). Social networks and loss of capital. Social Networks,
26(2), 91-111. Biggart, N. W. (2001). Banking on each other: the situational logic of rotating savings and credit
associations. Advances in Qualitative Organization Research, 3(1), 129-152. Boyle, J. M., Heinzelmann, F., & Titus, R. (1995). The Anatomy of Fraud: Report of a
Nationwide Survey. National Institute of Justice journal. Brass, D. J., Butterfield, K. D., & Skaggs, B. C. (1998). Relationships and unethical behavior: A
social network perspective. Academy of Management Review, 14-31. Brewer, M. B. (1968). Determinants of social distance among East African tribal groups. Journal
of Personality and Social Psychology, 10(3), 279-289. Brewer, M. B. (1981). Ethnocentrism and Its Role in Interpersonal Trust Scientific Inquiry and
the Social Sciences. New York: Jossey-Bass.
Burt, R. S., & Knez, M. (1995). Kinds of Third-Party Effects on Trust. Rationality and Society, 7(3), 255-292.
Carr, P. B., & Steele, C. M. (2010). Stereotype threat affects financial decision making. Psychol
Sci, 21(10), 1411-1416. Clinard, M. R. (1984). The Phantom Capitalists: The Organization and Control of Long-Firm
Fraud by Michael Levi. The British Journal of Sociology, 35(1), 141. Coleman, J. S. (1988). Social capital in the creation of human capital. American Journal of
Sociology, 95-120. Coleman, J. S. (1990). Relations of Trust Foundations of Social Theory. Cambridge, MA:
Belknap Press of Harvard University Press. DiMaggio, P., & Louch, H. (1998). Socially Embedded Consumer Transactions: For What Kinds
of Purchases Do People Most Often use Networks? American Sociological Review, 63(5), 619-637.
Dincer, O. C. (2011). Ethnic Diversity and Trust. Contemporary Economic Policy, 29(2), 284-
293. Elischer, S. (2008). Ethnic Coalitions of Convenience and Commitment: Political Parties and
Party Systems in Kenya. GIGA German Institute of Global and Area Studies(68).

32
Foddy, M., Platow, M. J., & Yamagishi, T. (2009). Group-Based Trust in Strangers: The Role of
Stereotypes and Expectations. Psychological Science, 20(4), 419-422. Geertz, C. (1962). The Rotating Credit Association: A "Middle Rung" in Development.
Economic Development and Cultural Change, 10(3), 241-263. Georgarakos, D., & Pasini, G. (2011). Trust, Sociability, and Stock Market Participation. Review
of Finance, 15(4), 693-725. Granovetter, M. (1985). Economic action and social structure: the problem of embeddedness.
American Journal of Sociology, 481-510. Granovetter, M. (1992). Problems of explanation in economic sociology. In N. Nohria & R.
Eccles (Eds.), {Networks and Organizations: Structure, Form, and Action} (pp. 25-56): Harvard University School Press.
Guiso, L., Sapienza, P., & Zingales, L. (2008). Trusting the Stock Market. The Journal of
Finance, 63(6), 2557-2600. Gutierrez-Romero, R. The Role of Ethnic Identity and Economic Issues in the 2007 Kenyan
Elections. Hall, J. R. (1988). Social Organization and Pathways of Commitment: Types of Communal
Groups, Rational Choice Theory, and the Kanter Thesis. American Sociological Review, 53(5), 679-692.
Kossinets, G., & Watts, Duncan J. (2009). Origins of Homophily in an Evolving Social
Network1. American Journal of Sociology, 115(2), 405-450. Kramer, R. M. (1999). Trust and distrust in organizations: Emerging perspectives, enduring
questions. Annual review of psychology, 50(1), 569-598. Lawler, E. J. (1992). Affective Attachments to Nested Groups: A Choice-Process Theory.
American Sociological Review, 57(3), 327-339. McEvily, B., Perrone, V., & Zaheer, A. (2003). Trust as an organizing principle. Organization
Science, 91-103. Peng, Y. (2004). Kinship Networks and Entrepreneurs in China’s Transitional Economy.
American Journal of Sociology, 109(5), 1045-1074. Portes, A., & Sensenbrenner, J. (1993). Embeddedness and Immigration: Notes on the Social
Determinants of Economic Action. American Journal of Sociology, 98(6), 1320.

33
Rao, H., Davis, G. F., & Ward, A. (2000). Embeddedness, Social Identity and Mobility: Why Firms Leave the NASDAQ and Join the New York Stock Exchange. Administrative Science Quarterly, 45(2), 268-292.
Risen, J. L., Gilovich, T., & Dunning, D. (2007). One-shot illusory correlations and stereotype
formation. Pers Soc Psychol Bull, 33(11), 1492-1502. Seligman, A. B. (1998). Trust and Sociability. American Journal of Economics and Sociology,
57(4), 391-404. Sgourev, S. V., & Zuckerman, E. W. (2011). Breaking up is hard to do: Irrational inconsistency
in commitment to an industry peer network. Rationality and Society, 23(1), 3-34. Sorenson, O., & Waguespack, D. M. (2006). Social structure and exchange: Self-confirming
dynamics in Hollywood. Administrative Science Quarterly, 51(4), 560-589. Tropp, L. R., Stout, A. M., Boatswain, C., Wright, S. C., & Pettigrew, T. F. (2006). Trust and
Acceptance in Response to References to Group Membership: Minority and Majority Perspectives on Cross-Group Interactions1. Journal of Applied Social Psychology, 36(3), 769-794.
Tyler, T. R. (2001). Why Do People Rely on Others? In K. S. Cook (Ed.), Trust in Society. New
York: Russell Sage Foundation. van Ufford, P. Q., & Zaal, F. (2011). The Transfer of Trust: Ethnicities as Economic Institutions
in the Livestock Trade in West and East Africa. Africa, 74(02), 121-145. Zak, P. J., & Knack, S. (2001). Trust and Growth. The Economic Journal, 111, 295-321.

Figure 1: Scatterplot of Percentage of Nyaga Clients and Victims, by district
Note: Five largest districts not shown.
Figure 2: Pre- and Post-Scandal Portfolio Values and % Lost by the 18,006 Nyaga Victims
Note: All 18,006 accounts with ICF verified claims shown.
y = 0.9553x + 0.0657
0
0.5
1
1.5
2
0 0.5 1 1.5 2
% o
f al
l Nya
ga v
icti
ms
in t
he
dis
tric
t
% of all Nyaga clients in the district
0%
10%
20%
30%
40%
50%
60%
70%
80%
90%
100%
0
100,000
200,000
300,000
400,000
500,000
600,000
700,000
800,000
900,000
1,000,000
% of p
ort value lost
Por
t. v
alu
e an
d v
erif
ied
loss
(K
sh)
Post-scandalportfoliovalue (leftaxis)
Verifiedclaim (leftaxis)
% ofportfoliovalue stolen(right axis)

Table 1Descriptive Statistics and Correlation Matrix, verified losses from theft among Nyaga clients (N=71,347):
Variable Mean Std. Dev. Min Max 1 2 3 4 5 6 7 81 Nyaga victim 0.25 0.43 0 12 Kikuyu 0.60 0.41 0 1 0.053 Kikuyu rival 0.06 0.20 0 1 -0.04 -0.334 Kikuyu non-rival 0.36 0.34 0 1 -0.02 -0.34 -0.125 Portoflio value (ln) 9.92 1.75 3.22 20.43 0.14 -0.02 -0.02 -0.016 Portfolio diversity 2.40 2.34 1 50 0.15 0.01 -0.02 0.01 0.667 More experienced investor 0.24 0.43 0 1 0.08 0.00 -0.02 0.00 0.53 0.478 Nyaga clients who are Kikuyu (District %) 60.34 13.46 0 79.82 0.07 0.33 -0.17 -0.17 -0.02 0.00 0.009 Nyaga clients who are Kikuyu rivals (District %) 35.90 7.74 2.08 100 -0.04 -0.25 0.01 0.22 0.02 0.01 0.00 -0.77

Table 2
Logistic Regression Estimates of Having a Verified Loss from Nyaga Theft (N=71,347):
1 2 3 4 5
District dummies yes yesNairobi
onlyKikuyu district
Rival district
Portoflio value (ln) 0.106*** (0.007)
0.106*** (0.007)
0.115*** (0.010)
0.093*** (0.020)
0.447* (0.211)
Portfolio diversity 0.091*** (0.006)
0.091*** (0.006)
0.061*** (0.008)
0.108*** (0.018)
0.006 (0.115)
Investor was in market prior to KEGN IPO -0.075** (0.025)
-0.075** (0.025)
-0.061 (0.039)
-0.179** (0.065)
-0.594 (0.924)
Kikuyu 0.127*** (0.026)
0.127*** (0.026)
0.288*** (0.036)
-0.050 (0.073)
2.649** (0.994)
Kikuyu rival -0.150** (0.052)
-0.150** (0.052)
-0.093 (0.065)
0.545** (0.201)
1.178 (0.904)
Kikuyu non-rival -0.026 (0.029)
-0.026 (0.029)
-0.008 (0.041)
0.005 (0.081)
-1.013 (1.196)
Nyaga clients who are Kikuyu (District %)
0.003
(0.008) Nyaga clients who are Kikuyu rivals (District %)
-0.058* (0.025)
Constant -2.520*** (0.071)
-0.430 (1.352)
-2.634*** (0.098)
-2.033*** (0.191)
-7.511*** (2.008)
Log likelihood -39066 -39066 -18269 -5711 -44Chi-squared 2096 2096 733 184 29Deg. of Freedom 65 65 6 6 6No. obs 71327 71327 34261 9710 183
Coefficients presented as odds ratios; robust standard errors in parentheses.A22* p<0.05 ** p<0.01 *** p<0.001

Table 3Descriptive Statistics and Correlation Matrix, future investments following the Nyaga scandal (N=397,413)
Variable Mean Std. Dev. Min Max 1 2 3 4 5 6 7 8 9 10 11 12 13 141 Investment size (ln) 3.69 3.85 0 18.352 Kikuyu 0.45 0.44 0 1 0.083 Kikuyu rival 0.09 0.26 0 1 -0.03 -0.304 Kikuyu non-rival 0.40 0.38 0 1 -0.02 -0.22 -0.145 Same tribe Nyaga clients (District, ln) 7.36 3.58 0 10.76 0.08 0.53 0.01 0.406 Financial losses of other Nyaga clients in same tribe (District) 14.58 6.62 0 19.47 0.09 0.52 0.04 0.42 0.987 Nyaga clients (District, ln) 9.51 1.85 0 10.77 -0.03 0.08 -0.09 -0.04 0.37 0.238 Nyaga client 0.18 0.38 0 1 0.01 0.16 -0.06 -0.04 0.10 0.11 0.019 Verified theft (ln) 0.33 1.66 0 16.59 0.04 0.08 -0.04 -0.03 0.05 0.05 0.00 0.42
10 Profit on previous investment (ln) 15.85 0.01 15.60 18.04 0.04 -0.02 -0.01 -0.01 -0.03 -0.03 0.01 -0.01 0.0011 Portfolio value (ln) 10.07 1.85 2.82 23.02 0.27 -0.06 -0.04 -0.03 -0.06 -0.07 0.01 -0.04 0.05 0.0812 Investor was in market prior to KEGN IPO 0.22 0.41 0 1 0.21 0.02 -0.02 0.00 0.03 0.04 -0.01 0.03 0.06 0.02 0.5013 Prior experience with financial fraud (District) 4.17 1.76 0 28.53 -0.04 -0.12 0.13 -0.02 -0.06 -0.08 -0.02 -0.08 -0.04 0.00 0.01 0.0014 IPO advertising exposure (ln) 4.93 0.56 2.59 5.33 -0.06 -0.07 0.01 0.01 0.24 0.11 0.79 -0.05 -0.03 0.01 0.02 -0.03 0.0315 Cell phone use (District %) 69.59 14.60 7.93 79.83 -0.05 -0.04 0.00 -0.02 0.26 0.14 0.84 -0.07 -0.04 0.01 0.02 -0.04 0.15 0.81

Table 4OLS Regression Estimates of IPO Investment Following Investor's Exposure to Nyaga Scandal
1 2 3 4 5 6 7 8District dummies yes yes yes yes yes yes yes yesProfit on previous investment (ln) 6.905***
(0.630)7.332*** (0.628)
7.362*** (0.628)
7.334*** (0.628)
7.339*** (0.628)
7.339*** (0.628)
7.332*** (0.628)
7.336*** (0.628)
Portfolio value (ln) 0.463*** (0.004)
0.480*** (0.004)
0.481*** (0.004)
0.480*** (0.004)
0.480*** (0.004)
0.481*** (0.004)
0.480*** (0.004)
0.480*** (0.004)
Investor was in market prior to KEGN IPO 0.918*** (0.018)
0.870*** (0.018)
0.868*** (0.018)
0.870*** (0.018)
0.870*** (0.018)
0.870*** (0.018)
0.870*** (0.018)
0.870*** (0.018)
Nyaga client -0.151*** (0.018)
-0.217*** (0.018)
-0.020 (0.028)
-0.195*** (0.019)
-0.168*** (0.024)
-0.219*** (0.018)
-0.217*** (0.018)
-0.216*** (0.018)
Verified theft (ln) 0.061*** (0.004)
0.059*** (0.004)
0.060*** (0.004)
0.058*** (0.004)
0.059*** (0.004)
0.089*** (0.007)
0.060*** (0.004)
0.072*** (0.005)
Prior experience with financial fraud (District)
-0.381*** (0.063)
-0.397*** (0.063)
-0.399*** (0.063)
-0.396*** (0.063)
-0.397*** (0.063)
-0.396*** (0.063)
-0.397*** (0.063)
-0.397*** (0.063)
IPO advertising exposure (ln) 9.369* (3.898)
9.571* (3.884)
9.644* (3.883)
9.541* (3.884)
9.596* (3.884)
9.582* (3.883)
9.569* (3.884)
9.580* (3.884)
Cell phone use (District %) -0.182* (0.076)
-0.193* (0.076)
-0.194* (0.076)
-0.192* (0.076)
-0.193* (0.076)
-0.193* (0.076)
-0.193* (0.076)
-0.193* (0.076)
Kikuyu 0.806*** (0.016)
0.862*** (0.017)
0.804*** (0.016)
0.804*** (0.016)
0.820*** (0.016)
0.806*** (0.016)
0.806*** (0.016)
Kikuyu rival 0.231*** (0.026)
0.230*** (0.026)
0.266*** (0.027)
0.230*** (0.026)
0.232*** (0.026)
0.234*** (0.026)
0.231*** (0.026)
Kikuyu non-rival 0.104*** (0.017)
0.097*** (0.017)
0.103*** (0.017)
0.122*** (0.018)
0.103*** (0.017)
0.104*** (0.017)
0.114*** (0.017)
Kikuyu * Nyaga client -0.348*** (0.038)
Kikuyu rival * Nyaga client -0.317*** (0.074)
Kikuyu non-rival * Nyaga client -0.130** (0.045)
Kikuyu * Verified theft (ln) -0.048*** (0.009)
Kikuyu rival * Verified theft (ln) -0.024 (0.021)
Kikuyu non-rival * Verified theft (ln) -0.039*** (0.011)
Constant -144.816*** (17.600)
-152.325*** (17.538)
-153.057*** (17.536)
-152.237*** (17.538)
-152.530*** (17.538)
-152.473*** (17.538)
-152.320*** (17.538)
-152.425*** (17.538)
Log likelihood -997189 -995859 -995817 -995850 -995855 -995845 -995858 -995852Deg. of Freedom 72 75 76 76 76 76 76 76No. obs 367017 367017 367017 367017 367017 367017 367017 367017
Standard errors in parentheses* p<0.05 ** p<0.01 *** p<0.001
Table 5OLS Regression Estimates of IPO Investment Following Investor's Peers' Exposure to Nyaga Scandal
9 10 11 12 13 14 15 16District dummies yes yes yes yes yes yes yes yesPortfolio value (ln) 0.480***
(0.004)0.480*** (0.004)
0.481*** (0.004)
0.481*** (0.004)
0.480*** (0.004)
0.479*** (0.004)
0.480*** (0.004)
0.480*** (0.004)
Investor was in market prior to KEGN IPO 0.870*** (0.018)
0.870*** (0.018)
0.870*** (0.018)
0.869*** (0.018)
0.810*** (0.018)
0.811*** (0.018)
0.810*** (0.018)
0.810*** (0.018)
Nyaga client -0.217*** (0.018)
-0.218*** (0.018)
-0.217*** (0.018)
-0.217*** (0.018)
-0.272*** (0.018)
-0.271*** (0.018)
-0.272*** (0.018)
-0.272*** (0.018)
Verified losses (ln) 0.059*** (0.004)
0.059*** (0.004)
0.059*** (0.004)
0.059*** (0.004)
0.061*** (0.004)
0.061*** (0.004)
0.061*** (0.004)
0.061*** (0.004)
Prior experience with financial fraud (District)
-0.040 (0.076)
-0.040 (0.076)
-0.042 (0.076)
-0.032 (0.076)
-0.489*** (0.062)
-0.499*** (0.062)
-0.489*** (0.062)
-0.483*** (0.062)
IPO advertising exposure (ln) 0.819 (2.723)
0.768 (2.723)
0.934 (2.723)
0.340 (2.723)
11.126** (3.865)
11.600** (3.864)
11.141** (3.865)
11.071** (3.865)
Cell phone use (District %) 0.045 (0.053)
0.046 (0.053)
0.043 (0.053)
0.055 (0.053)
-0.245** (0.075)
-0.252*** (0.075)
-0.245** (0.076)
-0.242** (0.076)
Kikuyu 0.806*** (0.016)
0.635*** (0.096)
0.809*** (0.016)
0.805*** (0.016)
-0.445*** (0.026)
0.648*** (0.086)
-0.446*** (0.026)
-0.438*** (0.026)
Kikuyu rival 0.231*** (0.026)
0.230*** (0.026)
-0.227* (0.113)
0.219*** (0.026)
-0.791*** (0.031)
-0.787*** (0.031)
-0.816*** (0.100)
-0.785*** (0.031)
Kikuyu non-rival 0.104*** (0.017)
0.103*** (0.017)
0.102*** (0.017)
-0.587*** (0.086)
-1.119*** (0.026)
-1.114*** (0.026)
-1.119*** (0.026)
-0.910*** (0.082)
Nyaga clients (District, ln) -0.443*** (0.114)
-0.443*** (0.114)
-0.447*** (0.114)
-0.475*** (0.114)
Kikuyu * Nyaga clients (District, ln) 0.017 (0.010)
Kikuyu rival * Nyaga clients (District, ln) 0.048*** (0.012)
Kikuyu non-rival * Nyaga clients (District, ln)
0.071*** (0.009)
Same tribe Nyaga clients (District, ln) 0.209*** (0.004)
0.213*** (0.004)
0.209*** (0.004)
0.209*** (0.004)
Kikuyu * Same tribe Nyaga clients (District, ln)
-0.117*** (0.009)
Kikuyu rival * Same tribe Nyaga clients (District, ln)
0.003 (0.012)
Kikuyu non-rival * Same tribe Nyaga clients (District, ln)
-0.023** (0.009)
Constant -121.47*** (14.257)
-121.39*** (14.257)
-121.94*** (14.257)
-119.91*** (14.257)
-168.92*** (17.456)
-170.46*** (17.452)
-168.97*** (17.457)
-168.78*** (17.455)
Log likelihood -995859 -995857 -995850 -995826 -994080 -993992 -994080 -994077Deg. of Freedom 75 76 76 76 76 77 77 77No. obs 367017 367017 367017 367017 367017 367017 367017 367017
Standard errors in parentheses* p<0.05 ** p<0.01 *** p<0.001