TRUST: A LISP Program for the Analysis of Transit Route...
11
TRANSPORTATION RESEARCH RECORD 1283 125 TRUST: A LISP Program for the Analysis of Transit Route Configurations M. HADI BAAJ AND HANIS. MAHMASSANI TRUST is a program to analyze and evaluate a given set of bus transit routes and associated frequencies, in terms of several descriptors, including measures of user costs, service quality, and operator resources . The procedure assigns a known demand matrix to the transit network according to a path choice logic that explic- itly considers transfers. As such, it calculates the percentages of the total demand trips that are able to reach their destination with no transfer, via one transfer, via two transfers, or simply cannot be satisified (with two or fewer transfers). Also computed are several node-level and route-level descriptors for use in the route network planning and design process. After the assignment is executed, the program determines the service frequency nec- essary on each route to maintain the passenger load factor below a specified maximum. The procedure can be used iteratively until the calculated frequencies are consistent with the input frequen- cies. TRUST is written in the LISP language because the latter's "list" data structure representation is particularly well suited to support the path search and enumeration activities inherent in the assignment logic and path choice rules appropriate in a transit network. The application of the program to the transit network of the Austin, Tex., urban area (with some simplifying assump- tions) is presented, illustrating the program's capabilities and computational performance. The purpose of this paper is to describe TRUST (Transit Routes Analyst), a LISP program developed to analyze a set of bus transit routes and associated service frequencies. It can be used either separately in a design-support function, or in the context of a formal solution procedure for the transit network design problem (TNDP). Such problems have been studied by several authors in the past (1-8). In the TNDP, one seeks to determine a configuration, consisting of a set of transit routes and associated frequencies, that achieves some desired objective, subject to the constraints of the problem. Mathematical formulations of the TNDP have been con- cerned primarily with the minimization of an overall cost mea- sure, generally a combination of user costs and operator costs. The former is often captured by the total travel time incurred by users in the network, while a proxy for operator costs is the total number of buses required for a particular configu- ration. Feasibility constraints may include, but are not limited to: (1) minimum operating frequencies on all or selected routes (policy headways, where applicable); (2) a maximum load factor on any bus route; and (3) a maximum allowable bus fleet size. Most existing formulations can be viewed as variants of the following mathematical program: Department of Civil Engineering, University of Texas at Austin, Austin, Tex. 78712. (1) subject to frequency feasibility fk :::: f min for all k E SR (2) load factor constraint: LFk = (Qk)max < LF fkCAP - max for all k E SR (3) fleet size constraint: 2.: Nk = [ 2.: fkrk ] W all kESR all kE SR where for all k E SR (4) diJ demand between nodes i and j, tiJ total travel time between i and j; t; 1 = t;nvtt,iJ + fwt,ij + f11,ij• t;nvllij = in-vehicle travel time between nodes i and j, twr ,iJ = waiting time incurred while traveling between nodes i and j, ttt.iJ = transfer time (penalty per transfer) incurred on trip between nodes i and j, Nk = number of buses operating on route k (Nk !Jk); fk = frequency of buses operating on route k, f,,,;n = minimum frequency of buses operating on any route, Tk = round trip time of route k, W = fleet size available for operation on the route network, load factor of route k, maximum flow occurring on any link of route k, CAP = seating capacity of buses operating on the net- work's routes, SR = set of transit routes, and cu c 2 = weights reflecting the relative importance of the two cost components. Note that by varying c 1 and c 2 , one can generate different nondominated configurations that achieve a different tradeoff between user costs on one hand and operator costs (number
Transcript of TRUST: A LISP Program for the Analysis of Transit Route...

TRANSPORTATION RESEARCH RECORD 1283 125
TRUST: A LISP Program for the Analysis of Transit Route Configurations
M. HADI BAAJ AND HANIS. MAHMASSANI
TRUST is a program to analyze and evaluate a given set of bus transit routes and associated frequencies, in terms of several descriptors, including measures of user costs, service quality, and operator resources . The procedure assigns a known demand matrix to the transit network according to a path choice logic that explicitly considers transfers. As such, it calculates the percentages of the total demand trips that are able to reach their destination with no transfer, via one transfer, via two transfers, or simply cannot be satisified (with two or fewer transfers) . Also computed are several node-level and route-level descriptors for use in the route network planning and design process. After the assignment is executed, the program determines the service frequency necessary on each route to maintain the passenger load factor below a specified maximum. The procedure can be used iteratively until the calculated frequencies are consistent with the input frequencies. TRUST is written in the LISP language because the latter's "list" data structure representation is particularly well suited to support the path search and enumeration activities inherent in the assignment logic and path choice rules appropriate in a transit network. The application of the program to the transit network of the Austin, Tex., urban area (with some simplifying assumptions) is presented, illustrating the program's capabilities and computational performance.
The purpose of this paper is to describe TRUST (Transit Routes Analyst), a LISP program developed to analyze a set of bus transit routes and associated service frequencies. It can be used either separately in a design-support function, or in the context of a formal solution procedure for the transit network design problem (TNDP). Such problems have been studied by several authors in the past (1-8). In the TNDP, one seeks to determine a configuration, consisting of a set of transit routes and associated frequencies, that achieves some desired objective, subject to the constraints of the problem. Mathematical formulations of the TNDP have been concerned primarily with the minimization of an overall cost measure, generally a combination of user costs and operator costs. The former is often captured by the total travel time incurred by users in the network, while a proxy for operator costs is the total number of buses required for a particular configuration. Feasibility constraints may include, but are not limited to: (1) minimum operating frequencies on all or selected routes (policy headways, where applicable); (2) a maximum load factor on any bus route; and (3) a maximum allowable bus fleet size.
Most existing formulations can be viewed as variants of the following mathematical program:
Department of Civil Engineering, University of Texas at Austin, Austin, Tex. 78712.
(1)
subject to
frequency feasibility fk :::: f min for all k E SR (2)
load factor constraint: LFk = (Qk)max < LF fkCAP - max
for all k E SR (3)
fleet size constraint: 2.: Nk = [ 2.: fkrk ] ~ W all kESR all k E SR
where
for all k E SR (4)
diJ demand between nodes i and j, tiJ total travel time between i and j; t;1 = t;nvtt,iJ +
fwt,ij + f11,ij•
t;nvllij = in-vehicle travel time between nodes i and j,
twr,iJ = waiting time incurred while traveling between nodes i and j,
ttt.iJ = transfer time (penalty per transfer) incurred on trip between nodes i and j,
Nk = number of buses operating on route k (Nk !Jk);
fk = frequency of buses operating on route k, f,,,;n = minimum frequency of buses operating on any
route, Tk = round trip time of route k, W = fleet size available for operation on the route
network, load factor of route k , maximum flow occurring on any link of route k,
CAP = seating capacity of buses operating on the network's routes,
SR = set of transit routes, and cu c2 = weights reflecting the relative importance of the
two cost components.
Note that by varying c1 and c2 , one can generate different nondominated configurations that achieve a different tradeoff between user costs on one hand and operator costs (number

126
of buses) on the other. In practice, other important tradeoffs need to be addressed in what is inherently a multiobjective problem. For example, should all demand be served, implying that some resources are allocated to low-density routes, or should service be more concentrated to provide high service levels on more productive routes, even if that means leaving some demand unmet? Similarly, a tradeoff needs to be made between directness of service (no transfers) and covera·ge. Such considerations have not typically been included in mathematical programming formulations, perhaps explaining the generally low degree of acceptance of such formulations in practice.
A central component in the solution of the network design problem is a procedure to evaluate the objective function components (in math programming formulations) and other measures of effectiveness or service quality that are of concern to the operator. This requires the assignment of the passenger trip demand matrix to the set of routes that define any particular network configuration. As indicated by Spiess and Florian (9), the transit assignment problem has been studied by several authors in the past, either as a separate problem (10,11) or as a subproblem of more complex models, such as transit network design (1,4,7) or multimodal network equilibrium (12).
Most transit assignment algorithms are variants of procedures used for private car traffic on road networks (such as shortest path, or stochastic multipath assignment), which are modified to reflect the waiting time phenomenon inherent to transit networks. However, path choice in a transit network, especially in large urban areas with overlapping routes, may not be well described by the assumptions of auto driver assignment. This was recognized by the transit route choice behavior model presented by Han and Wilson (13), which allowed for a lexicographic strategy in the choice among competing routes, with transfer avoidance and/or minimization acting as the primary choice criterion. This feature of their model is adopted in TRUST.
The transit route choice model at the core of TRUST considers two main criteria: the number of transfers necessary to reach the trip's destination, and the trip times incurred on different alternative choices. The tripmaker is assumed to always attempt to reach his/her destination by following the path that involves the fewest possible number of transfers. In case of a tie (i.e., when there is more than one path with the same least number of transfers), a decision is made after considering the competing paths' trip times. When there is one or more alternatives whose trip time is within a threshold of the minimum trip time, a "frequency share" rule is applied, as explained below.
The next section presents an overview of TR UST explaining what it does, how the input data is represented, the rationale for using LISP for this purpose, and the unique features and advantages that LISP offers relative to more conventional languages for this particular problem. Subsequent sections describe in detail the transit network representation and input data, the traveler's route choice model (which is at the core of the assignment procedures), and the procedures for computing the different network descriptors and performance measures, as well as other output information. An example case demonstrates the results of computer runs of TRUST on the Austin, Tex., transit network (with some simplifying
TRANSPORTATION RESEARCH RECORD 1283
assumptions on the demand side). The final section presents some concluding remarks and future directions for research and improvement.
OVERVIEW OF TRUST
TRUST is intended as an analytic tool that can support the design of transit routes: the transit planner generates a given set of routes (either manually or via a computerized route generation package) and assigns frequencies to these routes (based on either policy headways, past experience, or a formal frequency allocation procedure). TRUST then computes a variety of network descriptors and figures of merit, including the components of the objective function given earlier. In addition to the usual cost items, the program is notable for generating measures of service quality from the user's point of view, particularly with regard to transfers. The following five types of information are calculated:
1. The total travel time experienced by users in the network, and the respective percentages of in-vehicle travel time, waiting time, and transfer time (the latter reflecting a prespecified time penalty considered to be equivalent to · a transfer);
2. The total number of demand trips, as well as the percentages of demand that are unsatisfied, or satisfied with 0, 1, or 2 transfers;
3. The number of trips originating at each node that could not be assigned, as well as the number of passenger trips that transfer at each node;
4. The link flows on each route's links and the route's maximum load factor; and
5. The frequency and number of buses required on each route to maintain its load factor under LFmax and the resulting number of buses required for the whole network.
If, for a given analysis run of a particular configuration, the output frequencies (i.e., the frequencies required to maintain all routes' load factors under a prespecified LFmaJ are considered quite different from the input frequencies (say they differ by more than 5 percent), then the planner may reiterate the process by using the output frequencies of the previous run as the new input frequencies. For the example case of Austin's transit network presented below, the difference between input frequencies and output frequencies after two iterations was more than 10 percent for 9 out of 36 routes, between 5 percent and 10 percent for 3 other routes, and under 5 percent for the remaining 24 routes. After three iterations, this difference was still more than 10 percent for only 2 out of the 36 routes, between 5 percent and 10 percent in the case of 5 other routes, and under 5 percent in the case of the remaining 29 routes. The network descriptors recomputed in each new iteration differed from those of previous runs by small percentages, usually under 5 percent.
TRUST's input data may be grouped under four categories:
1. Network-the number of bus transit nodes, the names of routes operating in the network as well as the list of nodes defining each route, and a connectivity list specifying for each node its accessible neighboring nodes as well as the in-vehicle

Baaj and Mahmassani
travel time (i.e. over the road network) to each of the neighboring nodes;
2. Frequencies-the frequencies of bus service on each route; 3. Demand-a symmetric demand matrix representing the
number of passenger trips between each pair of nodes (the symmetry requirement is not essential, but has been used so far for convenience); and
4. Design parameters-the transfer time (penalty) per transfer expressed in equivalent minutes of in-vehicle travel time, the bus seating capacity (assumed the same on all buses), and the maximum load factor allowed by the planner on any transit route.
TRUST is written in LISP (List Processing), a fifth generation computer language (14) . The principal motivation for using LISP (or, more generally, a fifth generation language) lies in the nature of the computational activity taking place in TRUST, which consists of searching and screening paths in a graph. It has been common wisdom in transportation network applications to avoid any form of path enumeration. Thus, most existing assignment procedures are limited to shortest path constructs. However, other programming paradigms and advances in computing hardware and software can greatly facilitate some degree of path search and enumeration, which is justified by the added realism that it could allow into the resulting procedure. The present program is an attempt to explore these possibilities in the transit network analysis area.
LISP offers advantages over "conventional" languages such as FORTRAN, C, or Pascal both in terms of representation and search. The transit network data representation lends itself conveniently to the 'list' data structure representation of LISP, which in turn supports the kind of path search strategies of interest in this application. This can be illustrated by the following:
• The network connectivity can be conveniently represented in a descriptive language such as LISP: to each network node, one associates a set (or, in LISP, a list) of neighboring nodes as well as the trip time (cost) associated with the nodes. Thus, the list (2 ((1 11.4)(3 2.9)(6 8.0))) indicates that one can travel from node 2 to node 1 in 11.4 minutes, to node 3 in 2.9 minutes, and to node 6 in 8 minutes .
• A route can be represented as a list of nodes, thus route r25 is defined by the list of nodes (18 11 10 9 8 12 14).
•The search techniques that are specific to the transit network design problem can be readily programmed in LISP. In such techniques, a feasible path connecting two network nodes can be easily represented as a list. Thus, the list ((rl 9 16)(r8 16 21)) implies that one can travel from node 9 to node 21 by boarding route rl from node 9 to node 16 and route r8 from node 16 to node 21 (i.e., node 16 is a transfer node).
Taylor (15) describes simple programs written in Prolog, another fifth generation language, to solve different route selection problems. His examples underscore the brevity of code as well as the relative ease of programming with fifth generation languages. At the basis of these programs are some general "predicates" (Prolog meta-statements) that test for set membership or append a new element to a set. Such metastatements define the necessary condition for the required
127
solution, thus isolating the programmer from worring about the elemental computing and house-keeping chores, as would be the case with conventional programming languages such as FORTRAN, Pascal, and C.
On the negative side, LISP, like most higher-level languages, may experience relatively slow computational performance when it comes to mathematical computations (as opposed to symbolic manipulations) . However, tests with the program to date have shown reasonable execution times . Furthermore, when TRUST is eventually incorporated into a design procedure, it is envisioned that activities that are most efficiently and effectively handled by conventional languages (such as bookkeeping) would be programmed as such, while items such as the experts' design rules or path search strategies would be conveniently expressed in a symbolic language like LISP. Such use of multiple languages communicating in the execution of a particular program is an increasingly appealing approach to combine the advantages of artificial intelligence tools and standard scientific computing for the development of effective design procedures for engineering problems.
TRANSIT NETWORK DAT A REPRESENTATION AND INPUT DATA
Nodes are defined to represent the demand points for transit trips in the network under study. A list of these nodes, called *NODE-LIST* (whose members are natural integers starting with 0 and ending with a number equal to 1 less than the number of nodes), is maintained internally. For each node (call it parent node), we specify the set of adjacent or neighboring nodes and the in-vehicle travel time in minutes between each neighboring node (call it child node) and the parent node. In list form, (2 ((1 11.4) (3 2.9)(6 8.0))) is the sublist associated with node 2. It indicates that one can travel between node 2 and nodes 1, 3, and 6 in 11.4, 2.9, and 8.0 minutes, respectively. The overall list (of all sublists) for all nodes is referred to as *CONNECTIVITY-LIST*:
Passenger trip demand is represented in the usual way as an origin-destination trip matrix, called *DEMANDMATRIX*, containing the number of trips from each node to all others. In the present version, the matrix is assumed to be symmetric for convenience and with no loss of generality. A transit route is represented as a sequence of nodes, which are input by the user for each route, thereby forming the *ROUTE-LIST*. For example, a route called r25 would be represented as (r25 (18 11 10 9 8 12 14)) .
In addition to the name, four ·properties are associated with each route: "list-of-nodes" (defined earlier), frequency, "roundtrip-time", and "list-of-link-flows." The first two properties and their values are obtained from the input data. The frequency of service is assigned by the user for each route (an interactive capability in the program queries the user for this information) . However, as explained below, the program has the capability to also set frequencies, in which case the entered values serve as initial values. The third and fourth properties are determined internally by the program.
The third property is assigned (via a call to the procedure "round-trip-times-of-routes") using the information contained in the above-mentioned *CONNECTIVITY-LIST* . The fourth property corresponds to one of the main objectives

128
of the program and is determined as a result of the assignment procedure. Link flow values are initialized to zero (via a call to the procedure "create"). Thus for route r25, the "cre;ite" procedure assembles the list ((1-18-11 0.0) (1-11-10 0.0) (1-10-9 0.0) (1-9-8 0.0) (1-8-12 0.0)(1-12-14 0.0)). This list indicates that initially, before the assignment procedures are called, the flow on link 1-18-11 (which represents the link connecting nodes 18 and 11 of route r25) is 0.0. Now consider another route, r44, with the "list-of-link-flows" ((1-1-2 0.0)(1-2-6 0.0) (1-6-12 0.0)(1-12-14 0.0)) . Both routes r25 and r44 utilize the same physical link joining nodes 12 and 14, but for the purpose of assignment and flow specification, (1-12-14) associated with route r25 is different from (1-12-14) associated with r44, as should be the case.
In addition to the above network and system descriptors, the user specifies values for the following parameters: *TRANSFER-PENALTY* (in equivalent minutes of network in-vehicle travel time), *BUS-SEATING-CAPACITY*, and *MAX-LOAD-FACTOR*.
THE ASSIGNMENT MODEL AND COMPUTATION OF TRANSIT NETWORK DESCRIPTORS
The assignment model is the core of the analysis program because it determines the passenger flows on each link , which are used to calculate the various costs and performance descriptors. The assignment process consists of a direct application of the underlying transit path choice logic. As noted earlier, we have adapted the lexicographic decision structure of Han and Wilson (13) because of its behavior realism and plausibility. The main feature that we have adopted from their model is the consideration of the number of transfers as the most important criterion, and one which exercises preemptive priority over other considerations. Thus the procedure first starts by identifying all transit paths between i and j that do not involve any tranfers. Only if none are found will paths involving one (and only one tranfer) be considered . If more than one zero-transfer path is available, then additional criteria come into play. It is in the details of this aspect that our procedure differs from Han and Wilson. When more than one path exists with the same number of (or no) transfers, the user's effective choice set is assumed to contain only those paths with respective travel times within a particular range. Trips are then assigned to these paths using an allocation formula reflecting the relative frequencies of service on the alternative paths. The details of this procedure are described below.
The assignment process considers each node pair separately. For a given node pair (i, j), the set of routes passing through node i, and those passing through node j (denoted by SRl and SR2, respectively), are assembled by calling the "routes-passing-by" procedure for both nodes. If either SRl or SR2 is empty, then at least one of these two nodes is not served by any transit route, and the demand d1; cannot be assigned. In this case, the list ((i j) d1) is appended to the list *UNSATISFIED-DEMAND-LIST*, which was initially empty. If both SRl and SR2 are not empty, then a call is made to procedure "assign-0-transfer?" that checks whether the demand can be assigned directly (without transfers). This is possible only if the intersection of SRl and SR2, which is
TRANSPORTATION RESEARCH RECORD 1283
the subset of all routes that have both nodes i and j on their "list-of-nodes," is not empty. When this is the case, the intersection set is p;issecl to the procedure "decide-0," whose function is to distribute the demand d1; among the acceptable routes.
The procedure "decide-0" finds the route with the minimum in-vehicle travel time, then invokes a filtering process . Any route with in-vehicle travel time exceeding the minimum value by a specified threshold (say 50 percent, as selected in our implementation) is rejected . The demand d1; is allocated to the routes surviving the filtering process using a simple "frequency-share" rule: a route carries a proportion of the flow equal to the ratio of its frequency to the sum of the frequencies of all acceptable routes . Thus, if there are three acceptable routes (after filtering) Rl, R2 , and R3 whose frequencies are f1> f2 , and f 3 (in buses per hour), respectively, then Rl carries {[f/(f1 + f2 + f3)] x d1;} on all links between nodes i and j of this route. Such flow incurs an average waiting time (in minutes) of {60.0/[2([1 + f 2 + f 3)]}. Note that the corresponding flows on R2 and R3 also incur the same average waiting time. This rule is based on the assumption that uniformly arriving tripmakers board the first bus to arrive at their stop; the waiting time calculation further ignores stochasticity in bus headways.
If the "assign-0-transfer?" procedure is unable to assign the demand between i and j directly (with no transfers), a call to procedure " assign-1-transfer?" is made. The latter checks whether the trip can be completed with one transfer. This check is carried out by examining, for every possible combination of a route number of SRl (i.e., that passes through node i, say Rl) and another of SR2 (say R2), the intersection set of the "list-of-nodes" of both Rl and R2. If the intersection set is not empty, then its contents are possible transfer nodes between Rl and R2. For example, if the intersection set is (tfl tf2), TRUST forms two possible paths for the assignment of demand between nodes i and j: ((Rl i tfl)(R2 tfl j)) and ((Rl i tf2)(R2 tf2 j)) . The first signifies that a possible path from i to j consists of boarding route Rl 's bus at i , and slaying on it until node tfl (transfer node 1), where the passenger should transfer to route R2 and travel on it until the destination j is attained. For each possible path involving one transfer, an estimate of the total travel time is calculated. Thus, for the first path above , the total travel time is computed as
I;; = finvtt,i 1fllRI + f1nv11,1jl ilR2 + [60/(2[1)]
+ [60/(2[ 2) ] + *TRANSFER-PENALTY* (5)
where the third and fourth components are the average waiting times at nodes i and tfl respectively. After all such paths between i and j are found, and the associated trip times calculated, a filtering process similar to the zero-transfer case is applied. All paths between i and j whose total travel time exceeds the minimum value offered by any path between that pair of nodes by more than a specified threshold (say 10 percent as selected here) are rejected.
Procedure "decide-1" subsequently distributes d1; among the paths that have passed the filtering process . "Decide-1" utilizes the above-described "frequency-share" rule , except that it is now applied to classes of paths rather than to indi-

Baaj and Mahmassani
vidual paths. Such modification is necessary in both "decide-1" and "decide-2." Paths that share the same starting route (say Rm) at the boarding node i, form one class of paths (say Cm). Demand is first allocated among alternative classes; within each class, demand is shared equally among the constituting paths. The fraction of the demand that the whole class carries is equal to the ratio off,,, (the frequency of the starting route Rm defining the class of paths Cm) to the summation of the frequencies of all the starting routes that define all the existing classes of paths.
To illustrate this process, Figure 1 shows five acceptable paths between nodes i and j that have survived the filtering process applied by "decide-I." Procedure "classify-paths" indicates that there are two classes of paths, Cl and C4, corresponding to routes Rl and R4, respectively, which can be boarded at node i. The class Cl contains three possible paths: ((Rl i tf3)(R3 tf3 j)), ((Rl i tfl)(R2 tfl j)), and ((Rl i tf2)(R2 tf2 j)). The latter two indicate that the traveller can transfer to route R2 either at tfl or tf2 since the link joining tfl and tf2 is common to both routes Rl and R2. The flow allocated to Cl is {[j/(f1 + /4 )] x d1), and a third of this flow is assigned to each of Cl's three paths. The average waiting time incurred by all riders at node i reflects the frequencies of Rl and R4, and is given by {60/[2 (f1 + /4 )]} . An additional waiting time is incurred at the transfer node; it is equal to [60/(2/3)] for Cl's first path and [60/(2/2)] for its second and third paths. Similarly, C4 in Figure 1 contains two different paths: ((R4 i tf4)(R5 tf4 j)) and ((R4 i tf5)(R6 tf5 j)). The flow allocated to C4 is {[N(f1 + / 4)] x dii}, with half of it assigned to each of C4's two paths.
If it is determined that d1j cannot be assigned with at most one transfer procedure "assign-2-transfer?" is called to search
129
for paths involving two transfers. If no such path is found, the demand between i and j will remain unsatisfied. In other words, it is assumed that a passenger will simply not consider boarding the transit buses to accomplish a trip that requires three or more transfers. Hence, TRUST avoids searching for paths that reach destination j with three or more transfers, thereby avoiding an otherwise considerable amount of meaningless search and keeping the execution time within tolerable limits.
The "assign-2-transfer?" procedure searches for all paths with exactly two transfers between given nodes i and j. The search consists of finding a route that passes through neither i nor j, but which shares a node with a route passing through i (i.e., with a member of SRl) and another through node j (i.e., with a member of SR2). The set SR3 of routes that pass through neither node i nor node j is obtained as the complement (in SR, the set of all routes) of the union of the previously generated SRl and SR2, (SRl U SR2). For a trip to require exactly two transfers between origin i and destination j, the first route, Rl, has to pass by node i (hence, Rl E
SRl); the second route, R3, has to pass by some node other than node i or node j (hence, R3 E SR3); and the third route, R2, has to pass by node j (hence, R2 E SR2). Thus, three "do" loops are executed: the outer one on SR3 , the inner one on SRl, and the innermost one on SR2. A route from each of the above three sets is selected and the following test is performed: if the "list-of-nodes" of the route from SR3 (say R3) intersects both the "list-of-nodes" of the route from SRl (say Rl), and the "list-of-nodes" of the route from SR2 (say R2), then a possible two-transfer path is defined. For example, if the intersection set of the "list-of-nodes" of R3 and Rl is (tfl tf2) and that of the "list-of-nodes" of R3 and
R6
FIGURE 1 Five acceptable paths between nodes i and j involving one transfer.

130
R2 is (tf3), then TRUST defines two possible paths: ((Rl i tfl)(R3 tfl tf3)(R2 tf3 j)) and ((Rl i tf2)(R3 tf2 tf3) (R2 tf3 i)).
After all possible combinations of triplets (R3 E SR3, Rl E SRl, R2 E SR2) are checked and listed, the allocation procedure "decide-2" is called. Its logic is similar to that of the previously described "decide-1," in that it filters out paths with travel time exceeding the minimum possible total travel time by more than the prespecified threshold (10 percent here). The average total travel time of the above path is calculated as
l;j = tinvu,; tf1IR1 + l;nvu,tfl tf3IR3 + l;.,v11,1j3 jlR2
+ [60/(2/1)] + [60/(2/2)] + [60/(2/3)]
+ [2 (*TRANSFER-PENALTY*)] (6)
Following the filtering process, the remaining paths are grouped into different path classes, such that members of the same class share the same first route as the trip origin i. The demand dij is then assigned to the alternative paths in a manner similar to the previously described one-transfer case. Note that while "decide-2" could be rather time consuming computationally, it is usually executed a smaller number of times than "decide-0" or "decide-1," especially if the transit network allows the completion of most trips directly or via one transfer.
In summary, "allocate-demand" checks each node pair (one element of the demand matrix) to determine whether its trip can be assigned with zero, one, or two transfers. It appends the list ((i j) d;i) to one of four possible demand lists: *UNSATISFIED-DEMAND-LIST*, *D EMAND-0-TRANSFER * *DEMAND-1-TRANSFER*, and *DEMAND-2-TRANS~ FERS*. It also computes the contributions of this assignment to the networkwide measures of user costs: *NETWORKINVEHICLE-TRA VEL-TIME*, *NETWORK-WAITINGTIME*, and *NETWORK-TRANSFER-TIME*. Once all elements of the demand matrix are assigned, the *NETWORK-TOTAL-TRA VEL-TlME* is calculated as the sum of the final values of the above three components . The program also considers each of the four demand lists above to compute the percentages of the total number of passenger trips that are unsatisfied, or satisfied via zero, one, or two transfers. The flow diagram of the assignment process is shown in Figure 2. The program output includes each of the four demand lists, so that one can identify how the demand associated with a selected pair of nodes was assigned, as well as the final "list-of-link-flows" associated with each transit route. This information provides the principal measures of service quality and user costs that are of interest in the evaluation of a particular transit route network configuration. The other type of measures consists of the resources required by the operator, primarily the number of buses necessary to serve that particular configuration. The next section discusses this aspect, as well as the use of the program in an iterative approach to calculate service frequencies consistent with a prespecified load factor constraint.
COMPUTATION OF ROUTE FREQUENCIES AND NUMBER OF BUSES
Once all elements of the demand matrix have been assigned, the final "list-of-link-flows" of each route k is used to locate
TRANSPORTATION RESEA RCH RECORD 1283
the route's link carrying the highest volume, (Qk)max· The program then computes the number of buses required on route k to achieve the m;ixim11m ;illowed load factor:
(N ) _ (Q, ),,,,,,,. x Tk k required - 60.0 x *MAX-LOAD-FACTOR*
x *BUS-SEA TING-CAP A CITY*
for allk E SR (7)
The bus frequency required to maintain the route's load factor under LF max is computed as:
for all k E SR, (8)
where all terms are as previously defined. The above tasks are accomplished by a call to procedure
"min-buses." The minimum fleet size necessary for the whole network, (W)required• is also included in the program's output and is computed as:
(W)required = L (Nk)required a ll k E SR
for all k E SR. (9)
Note that the fleet size produced is a minimum value required to maintain set frequencies on the system's routes . It does not make allowances for reliability issues, which need to be taken into account separately by the operator, based on local experience and/or operating policies.
The calculation of route frequencies so as to achieve a preset peak load factor is a commonly used rule in the transit industry, especially in connection with congested networks . Of course, in order for it to be meaningful, the demand assignment must be performed over the peak period. Generally, one would expect to exercise TRUST for different time-ofday periods and separately for average weekdays and weekends. I'or less congested periods, the peak load facto1 method may come up with frequencies that are lower than what can be reasonably expected by riders. Minimum policy headways would then be used instead. From a route design standpoint, the number of required buses will be generally governed by the peak period. Because the focus of TRUST is on route design, its frequency-setting logic is limited to diagnosing a particular set of routes and frequencies against a maximum load factor constraint, so as to determine the minimum number of buses needed to achieve this constraint. It does not presently possess the capability to allocate frequencies given a fleet size constraint. For a comprehensive discussion of frequency allocation issues, the reader is referred to the review and model presented by Furth and Wilson (16).
As explained, the service frequencies computed are those that are consistent with the preset load factor. However, these frequencies are calculated after demand assignment on the basis of an initial set of frequencies. These two sets of frequency values may not be identical. The direction of the discrepancy indicates situations of higher or lower service than necessary. The program provides the capability to set frequencies in an iterative process where the last set of frequency values serves as the basis for the next assignment. While there is no guarantee of convergence, experience to date has indicated a converging pattern, as shown in the next case example.

Baaj and Mahmassani 131
Round trip times of routes
min - buses
Pick the next demand matrix element (nodel, node2, total-demand)
l4---I update *unsatisfied-demand-list*
Decide-0
Update *demand-0-transfer* Update *network-invehicle-travel-time* Update *network-waiting time*
Yes Decide-I
Update *demand-I-transfer* Update *network-invehicle-travel-time• Update *network-waiting time* Update *network-transfer-time*
Decide-2
Update *demand-2-transfer"' Update *network-invehicle-travel-time• Update *network-waiting time* Update *network-transfer-time*
update *unsatisfied-demand-list*
FIGURE 2 Flow diagram of TRUST.
APPLICATION TO AUSTIN NETWORK
The transit network of the Austin, Tex. , urban area (metropolitan population approximately 500,000) was selected to illustrate TRUST and test its computational performance on a network of realistic size. Some simplifications were made in the process , due in part to data limitations, though they do not detract from the illustrative purpose of the application.
The transit network consists of 36 routes with fixed schedules, operated by the Capital Metropolitan Transit Authority (Capital Metro, for short). We defined 140 nodes to describe the service area and associated network connectivity (the nodes defined include all intersection points of two or more routes). A trip demand matrix was not available in the desired format. In order to demonstrate the performance of TRUST, a symmetrical demand matrix was randomly generated. Each ele-

132
ment of the matrix is a natural integer independently selected according to a discrete and linearly decreasing probability mass function between 0 and 4, inclusive. Thus .. the number of trips between two nodes (a given demand matrix element) equals either 0, 1, 2, 3, or 4, with corresponding probabilities of 5/15, 4/15, 3/15, 2/15, and 1/15. For all runs, the penalty for a transfer was selected as 5 minutes of equivalent in-vehicle travel time, the bus seating capacity was taken as 40 passengers, and the maximum load factor was chosen to be 1.25 (i.e., up to 10 standing passengers are allowed at any time).
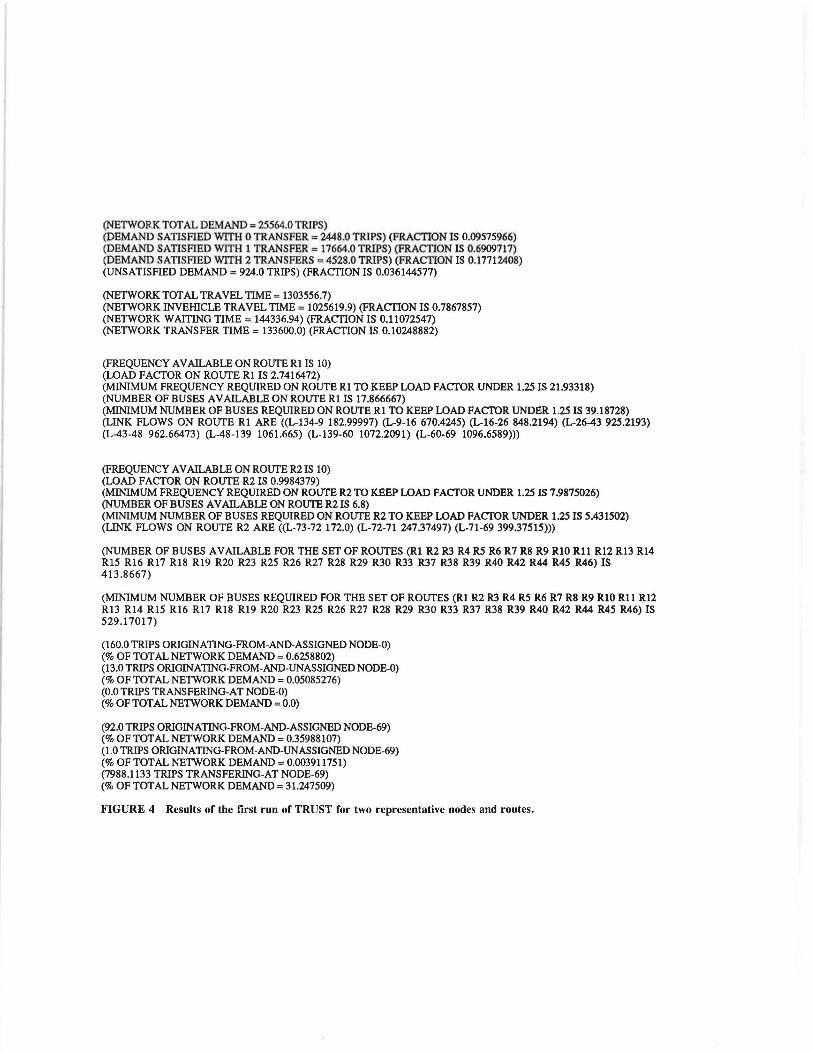
Figure 3 shows the contents of file "data .text," which lists the names of the network's routes and the node composition of each route. Figure 4 shows the different output quantities generated after one run (iteration) of the program. These include the total network aggregate values; thus, under the above assumptions, and for the fictitious demand matrix generated, only 9.6 percent can be served with no transfer, 69.1 percent require one transfer, 17. 7 percent two transfers, and the rest cannot be served with less than three transfers . Also included in Figure 4 are results for two representative routes (Rl and R2) and nodes (0 and 69). Table 1 summarizes selected results of three successive iterations. For the first run, all input bus frequencies were arbitrarily set at 10 buses per hour; in subsequent runs, the input frequencies were selected as the output (required) frequencies of the corresponding previous run, as explained previously. It can be noted that, after two iterations, the difference between input"frequences and out-
rl (134 9 16 26 43 48 139 60 69) r2 (73 72 71 69) r3 (14 19 31 47 139 59 69) r4 (82 81 137 80 75 74 69) r5 (14 15 20 31 43 49 60 69) r6 (67 68 69) r7 (4 11 10 17 16 21 25 61 69) r8 (14 15 16 21 25 22 23 24 32 39 40 53 67 72 75 79 90) r9 (27 28 30 45 44 57 69) rlO (124 125 103 87 69) rll (51 50 41 42 131 136 64 132 63 62 61 69) r12 (128 122 123 129 101 97 96 95 94 85 69) r13 (115 116 112 104 105 93 133 69) r14 (109 108 91 106 92 93 133 69) r15 (25 41 SO 62 66 69) r16 (117 129 102 107 86 87 69) rl 7 (77 137 76 75 79 78 69) r18 (55 54 53 65 66 69) rl9 (27 28 29 30 46 58 59 69) r20 (35 34 38 40 52 64 132 63 62 69) r23 (13 14) r25 (18 11 10 9 8 12 14) r26 (89 82 90 88 69) r27 (115 114 113 111 109 91 90 88 133 69) r28 (99 100 101 102 103 104 105 109) r29 (98 84 85 86 87 69) r30 (99 130 83 84 85 86 87 133 69) r33 (118 119 120 121 122 123 124 125 116 115 111 108 110) r37 (37 36 35 34 33 32 42 131 51 63 66 69) r38 (127 121 117 100 97 96 94 85 69) r39 (138 18 24 23 22 25) r40 (2 3 135 8 9) r42 (0 3 5 8 9 16) r44 (1 2 6 12 14) r4S (126 125 116 115) r46 (7 14) EDF
FIGURE 3 Contents of the data file "Data. Text" for Austin transit network application.
TRANSPORTATION RESEARCH RECORD 1283
put frequencies was more than 10 percent for 9 out of the 36 routes, between 5 percent and 10 percent for 3 other routes, and under 5 percent for the remaining 24 routes. After three runs, the difference between input frequencies and output frequencies was more than 10 percent for only 2 of 36 routes, between 5 percent and 10 percent for 5 other routes, and under 5 percent for the remaining 29 routes, revealing a generally converging pattern.
From the computational standpoint, all runs were executed on an Apple MAC-II workstation equipped with a specialpurpose TI Explorer microchip that runs the LISP language compiler. Each run took about 14 minutes of real execution time, which is quite satisfactory given the extent of path search and enumeration required to implement the assignment logic and calculate the desired performance measures. This response time is certainly within tolerable limits for such applications.
CONCLUSIONS
TRUST is a program for the analysis and evaluation of alternative transit route network configuration consisting of a set of routes and as ociated frequencies . It main function is to assign known demands between origin-destination pairs to the transit network, and compute a variety of performance measure reflecting the qualily of . ervice and co t exp r.iencecl by lhe users a well as the resource required by the op cat r. The program differs from cxisiing as ignment approaches in several respects , including: (1) the path choice mechanism that i. the basi · of the as ignment procedure; (2) the use of LISP, a so-call d fifth generation language associated with artificial intelligence (AI) applications, which greatly facilitates the implementation of the path search and enumeration inherent in the type of a signment procedure ad pted ; and (3) the broad r range of performance measur and descriptor that are computed and displayed . particularly on the demand ide. TRUST may be utilized in at least two different ways :
1. As a computerized tool for the analysis of a given set of transit routes, which might be examined by the transit planner in the process of short-range transit route design (modifications and service changes aimed at improving an existing transit network) or long-range transit system planning (whereby a whole new transit network is designed from scratch); and
2. As a tool for effective sensitivity analysis , whereby transit network descriptors are evaluated when variations in route configuration, route frequency, bus seating capacity, transfer penalty , and maximum allowable route load factors are considered jointly or separately. [In this regard, it can be noted that procedures "decide-0," "decide-1," and "decide-2" can easily be changed so as to model different travellers' route choice behavior mechanisms; furthermore, the various thresholds used, such as the 50 percent over the minimum in-vehicle travel time (as assumed by "decide-0") and 10 percent over the minimum total travel time (assumed in both "decide-1" and "decide-2") can be easily modified to better reflect local conditions.]
In addition to the substantive motivation in terms of providing effective procedures for transit planning and design problems, an additional motivation, from a methodological standpoint, has been to explore the possibilities of LISP and
(NETWORK. TOT AL DEMAND = 25564.0 TRIPS) (DEMAND SATISFIED WITH 0 TRANSFER= 2448.0 TRIPS) (FRACTION JS 0.09575966) (DEMAND SATISFIED WITH l TRANSFER = 17664.0 TRIPS) (FRACTION IS 0.6909717) (DEMAND SATISFIED WITH 2 TRANSFERS = 4528.0 TRlPS) (FRACTION IS 0.17712408) (UNSATISFIED DEMAND= 924.0 TRIPS) (FRACTION IS 0.036144577)
(NETWORK TOTAL TRAVEL TIME= 1303556.7) (NETWORK INVEHICLE TRAVEL TIME= 1025619.9) (FRACTION IS 0.7867857) (NETWORK WAITING TIME= 144336.94) (FRACTION IS 0.11072547) (NETWORK TRANSFER TIME = 133600.0) (FRACTION IS O.I0248882)
(FREQUENCY AVAILABLE ON ROUTE Rl IS 10) (LOAD FACTOR ON ROUTE Rl IS 2.7416472) (MINIMUM FREQUENCY REQUIRED ON ROUTE Rl TO KEEP LOAD FACTOR UNDER 1.25 IS 21.93318) (NUMBER OF BUSES AVAILABLE ON ROUTE Rl IS 17.866667) (MINIMUM NUMBER OF BUSES REQUIRED ON ROUTE Rl TO KEEP LOAD FACTOR UNDER 1.25 IS 39.18728) (LINK FLOWS ON ROUTE Rl ARE ((L-134-9 182.99997) (L-9-16 670.4245) (L-16-26 848.2194) (L-26-43 925.2193) (L-43-48 962.66473) (L-48-139 I061.665) (L-139-60 1072.2091) (L-60-69 I096.6589)))
(FREQUENCY AVAILABLE ON ROUTE R2 IS 10) (LOAD FACTOR ON ROUTE R2 IS 0.9984379) (MINIMUM FREQUENCY REQUIRED ON ROUTE R2 TO KEEP LOAD FACTOR UNDER 1.25 IS 7.9875026) (NUMBER OF BUSES AVAILABLE ON ROUTE R2 IS 6.8) (MINIMUM NUMBER OF BUSES REQUIRED ON ROUTE R2 TO KEEP LOAD FACI'OR UNDER 1.25 IS 5.431502) (LINK FLOWS ON ROUTE R2 ARE ((L-73-72 172.0) (L-72-71 247.37497) (L-71-69 399.37515)))
(NUMBER OF BUSES AVAILABLE FOR THE SET OF ROUTES (Rl R2 R3 R4 RS R6 R7 R8 R9 RIO Rll R12 R13 R14 R15 R16 R17 R18 R19 R20 R23 R25 R26 R27 R28 R29 R30 R33 R37 R38 R39 R40 R42 R44 R45 R46) IS 413.8667)
(MINIMUM NUMBER OF BUSES REQUIRED FOR THE SET OF ROUTES (Rl R2 R3 R4 RS R6 R7 R8 R9 RIO Rll R12 R13 R14 R15 R16 R17 RIB R19 R20 R23 R25 R26 R27 R28 R29 R30 R33 R37 R38 R39 R40 R42 R44 R45 R46) IS 529.17017)
(160.0 TRIPS ORIGIN A TING-FROM-AND-ASSIGNED NODE-0) (% OF TOT AL NETWORK DEMAND= 0.6258802) (13.0 TRIPS ORIGINATING-FROM-AND-UNASSIGNED NODE-0) (%OF TOT AL NETWORK DEMAND = 0.05085276) (0.0 TRIPS TRANSFERING-AT NODE-0) (%OF TOT AL NETWORK DEMAND= 0.0)
(92.0 TRIPS ORIGINATING-FROM-AND-ASSIGNED NODE-69) (%OF TOT AL NETWORK DEMAND= 0.35988107) (1.0 TRIPS ORIGINATING-FROM-AND-UNASSIGNED NODE-69) (%OF TOTAL NETWORK DEMAND= 0.003911751) (7988.1133 TRIPS TRANSFERING-AT NODE-69) (% OF TOT AL NETWORK DEMAND= 31.247509)
FIGURE 4 Results of the first run of TRUST for two representative nodes and routes.
134 TRANSPORTATION RESEARCH RECORD 1283
TABLE 1 PARTIAL RESULTS OF THREE ITERATfONS OF TRUST
First Run Second Run Third Run roll!e name input freq. output freo. ~ input frea. output freq. ~ input freq. outnut freq.~
rl 10 21.93 119.3 21.93 22.1 0.78 22.1 21.9 - 0.91 12 10 7.99 - 20.1 7.99 7.96 - 0.38 7.96 7.93 -0.38 r3 10 16.74 67.4 16.74 17.13 2.33 17.13 17.96 0.18 r4 10 13.54 35.4 13.54 13.93 2.88 13.93 13.96 0.22 r5 10 16.23 62.3 16.23 15.96 - 1.66 15.96 16.09 0.81 r6 10 5.21 -47.9 5.21 5.03 - 3.45 5.03 5.02 0.20 r7 10 20.03 100.3 20.03 19.91 -0.60 19.91 20.23 1.61 r8 10 14.85 48.5 14.85 15.27 2.83 15.27 15.36 0.59 r9 10 10.76 7.6 10.76 10.57 - 1.77 10.57 10.57
rlO 10 8.97 - 10.3 8.97 8.78 - 2.12 8.78 8.78 rll 10 8.06 - 19.4 8.06 5.70 - 29.28 5.70 4.25 -25.44 r12 10 23.54 135.4 23.54 24.38 3.57 24.38 24.66 1.15 rl3 10 15.79 57.9 15.79 16.04 1.58 16.04 16.05 0.06 r14 10 12.88 28.8 12.88 12.66 - 1.71 12.66 12.63 - 0.24 rl5 10 10.30 3.0 10.30 9.69 - 5.92 9.69 9.62 - 0.72 rl6 10 8.07 - 19.3 8.07 7.13 - 11.65 7.13 6.84 -4.07 rl7 10 13.52 35.2 13.52 13.39 - 0.96 13.39 13.36 - 0.22 rl8 10 10.6 6.0 10.6 10.48 - 1.13 10.48 10.49 0.10 r19 10 20.62 106.2 20.62 20.77 0.72 20.77 20.77 120 10 13.15 31.5 13.15 13.83 5.17 13.83 15.07 8.97 123 10 3.72 - 62.8 3.72 3.72 3.72 3.72 125 10 3.11 - 68.9 3.11 2.03 - 34.73 2.03 1.69 - 16.75 r26 10 6.05 - 39.5 6.05 5.36 - 11.40 5.35 5.25 - 2.05 127 10 14.77 47.7 14.77 14.88 0.74 14.88 14.89 0.07 r28 10 3.67 - 63.3 3.67 3.25 - 11.44 3.25 3.18 - 2.15 129 10 5.74 - 42.6 5.74 5.12 - 10.80 5.12 4.7,j! - 6.64 r30 10 14.01 40.l 14.01 14.38 2.64 14.38 14.57 1.32 r33 10 9.27 - 7.3 9.27 9.31 0.43 9.31 9.32 0.11 r37 10 21.09 110.9 21.09 22.92 8.68 22.92 23.14 0.96 r38 10 15.70 57.0 15.70 16.08 2.42 16.08 16.14 0.37 r39 10 6.13 - 38.7 6.13 6.01 - 1.96 6.01 6.10 1.50 r40 10 5.66 - 43.4 5.66 4.73 - 16.43 4.73 4.29 - 9.30 r42 10 9.25 - 7.5 9.25 10.28 ll.14 10.28 10.89 5.93 r44 10 9.10 - 9.0 9.10 10.98 20.66 10.98 11.59 5.56 r45 10 3.24 - 67.6 3.24 3.24 3.24 3.24 r46 ]Q 3.50 - 65 Q 3.SQ 3.SQ J,SQ 3 .. :rn
Total demand : 25564.0 trips Demand-0-Transfer (%) 9.58 9.58 9.58 Demand-I-Transfer(%) 69.10 69.10 69.10 Demand-2-Transfers (%) 17.71 17.71 17.71 Unsatisfied-Demand(%] 3.61 3.61 3.61
Network total travel time l.304 x 106 l.282x 106 1.283 x 10⁶ Network invehicle travel time(%) 78.68 79.85 79.73 Network waiting time(%) 11.07 9.72 9.86 Network transfer time(%) 10.25 10.43 10.41
Number of buses available 414 529 532 Number of buses required 529 532 534
other fifth generation languages for transportation network • integration of AI software development tools and con-analysis and design problems. Such tools offer both oppor- ventional languages in program execution . tunities and challenges, as described earlier. Our experience to date with the TRUST program has confirmed that the TRUST is the core analysis part of the overall methodology, choice of LISP for this application has been an appropriate though it can be used independently, as shown in the present one, as it has allowed considerable flexibility in terms of the paper. Two principal additional components are contem-path choice rules and assignment logic that have been explored. plated in the overall design framework. The first is a heuristic
Clearly, the program is still in its developmental stages. As route generation tool that produces "good" layouts, which explained earlier, it is intended as part of an AI-based decision would then be evaluated by TRUST. The second component support system for transit network planning and design, which identifies and suggests modifications to an existing configu-differs from existing approaches in several respects, including: ration, given the descriptors computed by TRUST.
• use of heuristics and expert knowledge to guide search for design configuration; REFERENCES
• consideration of multiple criteria in the design process, as illustrated in the use of demand and transfer information 1. W. Lampkin and P. D . Saalmans. The Design of Routes, Service in the present paper; and Frequencies and Schedules for a Municipal Bus Undertaking: A

Baaj and Mahmassani
Case Study. Operations R esearch Quarterly, Vol. 18, 1967, pp . 375- 397.
2. J. C. Rea. Designing Urban Transit Systems: An Approach to the Route-Technology Selection Problem. Report 204881. University or Washington , cattle, Wash. , 1971.
3. L. A. ilman, Z. Barzlly, and U. Passy. Planning the Route System for Urban Buses. Comp. Oper. Res. Vol. 1, 1974, pp . 201-211.
4. C. E . Mandi. Evaluation and Optimization of Urban Public Trnnsporta tion Networh. Presented at the 3rd European Congress on Operation Research , Amsterdam, Netherlands, 1979.
5. G. Newell . ome I . ues Related to the Optimal Design or Bus Routes. Transportation Scie!lce , Vol. 13, 1979, pp. 20- 35 .
6. D. Dubois, G. Bell, and M. Uibre. A Set of Methods in Transportation Ne1work ynthe! i. and Ana lysis. Jouriwl of the Oper<Uions Research Society , Vol. 30 1979 pp. 797-808.
7. D. H;i selstrom . Public Tra11spor1<11io11 Pla1111i11g- A Marhematica/ Programming A pproach . Ph.D. the i . Univer. i1 y or Gothenburg, Sweden , 1981.
8. A. Ceder and N. H. M. Wilson . Bus Network Design . Trans· portarion Research B, Vol. 20B , No. 4, 1986, pp. 331-344.
9. H. pies and M. Florian . Optimal S1rntcgie : A New As ignment Model for Transit Networks. Trt111spor1atio11 Research B , Vol. 23B , No. 2, 1989, pp . 83-102.
135
10. R. B. Dial. Transit Pathfinder Algorithm. In Highway R esearch Record 205, TRB, National Research Council, Washington, D.C., 1967, pp . 67- 85.
11. M. H. Rapp , P. Manenbcrger S. Piguet , and A. Robcrt-Grandpierre. lnteractiv Graphic Sy tern for Transit Route Optimization. In Transportation Research Record 619, T RB aLional Research Council , Washington, D .C. , 1976.
12. M. Florian and H. Spiess. On Two Mode Choice/Assignment Models. Transportation Science, Vol. 17, 1983, pp. 32-47 .
13. A. F. Han and N. H . M. Wilson. The Allocation of Buses in Heavily U1ilized Networks with Overlapping Routes. Transportation Research B, Vol. 168 , No. 3, 1982, pp . 221-232.
14. P.H. Winston and B. K. P. Horn. LISP, 2nd ed . AddisonWesley, Reading, Mass., 1984.
15 . M. A. P. Taylor. Knowledge-Based Systems for Transport Network Analysis: A Fifth Generation Perspeclive on Tra nsport Network Problems. Department of Civil Engineering, Monash University , Victoria, Australia, 1989.
16. P. C. Furth and N. H . M. Wilson . Setting Frequencies on Bus Routes : Theory and Practice . In Transportation Research Record 818, TRB, National Research Council, Washington, D.C. , 1981.
Publication of this paper sponsored by Committee on Transportation Supply Analysis.


![May the LISP be with You - Nerd2NerdWhy Lisp? More on Macros [ What Lisp?, How Lisp? ]Problems/Features [ When Lisp? ] May the LISP be with You Andrew (kqb) Easton nerd2nerd: nerdend](https://static.fdocuments.us/doc/165x107/5ed9946d1b54311e7967d3e5/may-the-lisp-be-with-you-nerd2nerd-why-lisp-more-on-macros-what-lisp-how.jpg)

