Trung Dung Nguyen, David Rouzineau, Michel Meyer, Xuan Mi ...
20
HAL Id: hal-01911995 https://hal.archives-ouvertes.fr/hal-01911995 Submitted on 5 Nov 2018 HAL is a multi-disciplinary open access archive for the deposit and dissemination of sci- entific research documents, whether they are pub- lished or not. The documents may come from teaching and research institutions in France or abroad, or from public or private research centers. L’archive ouverte pluridisciplinaire HAL, est destinée au dépôt et à la diffusion de documents scientifiques de niveau recherche, publiés ou non, émanant des établissements d’enseignement et de recherche français ou étrangers, des laboratoires publics ou privés. Design and simulation of divided wall column: Experimental validation and sensitivity analysis Trung Dung Nguyen, David Rouzineau, Michel Meyer, Xuan Mi Meyer To cite this version: Trung Dung Nguyen, David Rouzineau, Michel Meyer, Xuan Mi Meyer. Design and simulation of divided wall column: Experimental validation and sensitivity analysis. Chemical Engineering and Processing: Process Intensification, Elsevier, 2016, 104, pp.94-111. 10.1016/j.cep.2016.02.012. hal- 01911995
Transcript of Trung Dung Nguyen, David Rouzineau, Michel Meyer, Xuan Mi ...
HAL Id: hal-01911995https://hal.archives-ouvertes.fr/hal-01911995
Submitted on 5 Nov 2018
HAL is a multi-disciplinary open accessarchive for the deposit and dissemination of sci-entific research documents, whether they are pub-lished or not. The documents may come fromteaching and research institutions in France orabroad, or from public or private research centers.
L’archive ouverte pluridisciplinaire HAL, estdestinée au dépôt et à la diffusion de documentsscientifiques de niveau recherche, publiés ou non,émanant des établissements d’enseignement et derecherche français ou étrangers, des laboratoirespublics ou privés.
Design and simulation of divided wall column:Experimental validation and sensitivity analysis
Trung Dung Nguyen, David Rouzineau, Michel Meyer, Xuan Mi Meyer
To cite this version:Trung Dung Nguyen, David Rouzineau, Michel Meyer, Xuan Mi Meyer. Design and simulation ofdivided wall column: Experimental validation and sensitivity analysis. Chemical Engineering andProcessing: Process Intensification, Elsevier, 2016, 104, pp.94-111. �10.1016/j.cep.2016.02.012�. �hal-01911995�
Open Archive Toulouse Archive Ouverte (OATAO)
OATAO is an open access repository that collects the work of some Toulouseresearchers and makes it freely available over the web where possible.
This is an author’s version published in: http://oatao.univ-toulouse.fr/ 20535
To cite this version:
Nguyen, Trung Dung and Rouzineau, David and Meyer, Michel and Meyer, Xuân-Mi Design and simulation of divided wall column: Experimental validation and sensitivity analysis. (2016) Chemical Engineering and Processing: Process Intensification, 104. 94-111. ISSN 0255-2701
Any correspondance concerning this service should be sent to the repository administrator:
Official URL: https://doi.org/10.1016/j.cep.2016.02.012
Design and simulation of divided wall column: Experimental validationand sensitivity analysis
Trung Dung Nguyena,b, David Rouzineaua,*, Michel Meyera, Xuan Meyera
aUNIVERSITE DE TOULOUSE, ENSIACET—INP de Toulouse, Laboratoire de Génie Chimique, UMR CNRS 5503, 4 allée Emile Monso, BP 44362, 31432 Toulouse
Cedex 4, FrancebHanoi University of Science and Technology, 1 Dai Co Viet Street, Hanoi, Vietnam
Keywords:
Process intensification
Divided wall column
Process design
Simulation
Pilot plant
Sensitivity analysis
A B S T R A C T
This article deals with design and simulation of divided wall column. Design parameters are provided to
the rigorous simulation in the ProSimPlus1 software. The results show that the procedure can determine
parameters quickly in the case studies and can give a good initialization for rigorous simulation. Secondly,
a pilot plant has been design, built and operated in our laboratory. The pilot plant will provide necessary
experimental evidence to validate the previous procedure. Ternary mixture and four-component mixture
of alcohols have been used in our pilot plant in steady state conditions. The results show that the
composition of products, composition and temperature profile along the column are in very good
agreement with simulation results. Finally, in order to determine the optimal parameters of divided wall
columns, the effects of the structural parameters of the divided wall column such as the height of the
wall, the vertical position of the wall and number of stages of each section are analyzed. Ternary diagram
is used as an indicator both in showing what the most economical configuration is and in showing the
distillation boundary.
1. Introduction
The divided wall column (DWC) has many known advantages,
and many design methodologies for DWC’s have been published
over the last years. Almost all papers that have been published
were restricted to ternary mixtures with three products, sharp
separations, saturated liquid feed, constant flowrate and constant
relative volatility. The design of divided wall columns or fully
thermally coupled distillations is more complex than traditional
distillation because it has more degrees of freedom. A number of
papers have been published on the subject which focus on the
calculation of the minimum vapor requirement and determined
the number of stages in the various column sections. Triantafyllou
and Smith [4] published a design oriented shortcut method for
three products in a divided wall column based on the Fenske–
Underwood–Gilliland–Kirkbridge model (FUGK). In this paper,
they presented a method to decompose a divided wall column into
a three-traditional-column model. By using the decomposition
method, they assume that heat transfer across the column wall can
be neglected, hence making the divided wall column equivalent to
a fully thermally coupled distillation. The prefractionator is
considered like a traditional column if a partial condenser and a
partial reboiler are used. The main column can be represented as
two traditional columns if we assume a total reboiler for the upper
part of the main column and a total condenser for the lower part of
the main column. The interconnecting streams are considered as
the feed flowrates with superheated vapor and sub-cooled liquid
conditions, respectively. The FUGK method can be applied to
determine operational and structural parameters for each column.
The minimum number of equilibrium stages can be determined by
the Fenske equation, the minimum reflux ratio can be determined
by using the Underwood equation, the number of stages can be
determined by the Gilliland method when choosing operating
reflux ratio, and feed location can be determined by the Kirkbride
method. The reflux ratio of the prefractionator is adjusted until its
number of stages equals the number of the side section. The
recoveries in the prefractionator column are optimized for the
minimum vapor flowrate or the minimum number of stages.
Amminudin et al. [1,2] proposed a semi-rigorous design method
based on equilibrium stage composition concept. Certain assump-
tions are as follows: constant molar overflow, constant relative
volatility, and estimation of component distribution at minimum
reflux. Their design procedure starts from defining the products
composition, and works backward to determine the design
parameters required to achieve them. Therefore, firstly, by using* Corresponding author.
E-mail address: [email protected] (D. Rouzineau).
the method of Van Dongen and Doherty [18], a feasible product
distribution is estimated for the composition of the top, middle and
bottom products, the minimum reflux ratio and the minimum boil-
up ratio. Any distillation operation lies between the two limits of
total reflux and minimum reflux ratios. At total reflux ratio, the
number of stages is minimized and energy consumption is
maximized. At the minimum reflux ratio, the number of stages
is maximized and energy consumption is minimized. Therefore, a
product distribution must be chosen between the two conditions.
Secondly, using the equilibrium stage concept the number of
stages, flow rates, feed stage and side stream location for the fully
thermally coupled distillation are estimated.
An approximate design procedure for fully thermally coupled
distillation column is proposed by Kim [11]. The Fenske equation is
applied to the main column to determine minimum number of
stages. However, the author believed that the design of the
prefractionator cannot follow the Fenske equation because the end
compositions are unknown. Therefore, a stage-to-stage computa-
tion is proposed. Then, the number of stages in the system is taken
as twice the minimum number of stages. The minimum vapor
flowrate was determined by the Underwood equation. The liquid
flowrate of the main column is determined by checking the
compositions of the products. Clearly, they take twice the
minimum number of stages as the number of theoretical trays
is considered to be equal to two times the minimum number of
stages. It is not always true.
Halvorsen and Skogestad [7,10] proposed the Vmin diagram
method to determine the minimum energy consumption. To use
the method, they assume constant molar flowrates, constant
relative volatilities, and an infinite number of stages. Firstly, the
Vmin diagram is drawn based on the Underwood equation. The
minimum energy requirement for separation of a feed mixture of n
components into n pure products is given by:
VPetlyukmin ¼ max
X
j
i¼1
aiziF
ai " uj; j 2 1; n " 1f g
Here: uj are the n " 1 common Underwood roots found from:
1 " q ¼X
n
i¼1
aiziai " u
Underwood roots obey a1 > u1 > a2 > u2 > . . . > un"1 > an
where: q is liquid fraction in the feed (F) and z is the feed
composition
Secondly, they choose the actual flowrate around 10% and the
minimum number of stages was calculated based on the
Underwood equation.
Calzon-McConville et al. [5] presented an energy efficient
design procedure for optimization of the thermally coupled
distillation sequences with initial designs based on the design of
conventional distillation sequences. In the first step, it is assumed
that each column performs with specified recoveries of compo-
nents of 98% (light and heavy key components) and by using the
shortcut method (FUG model), the number of stages of conven-
tional distillation schemes are obtained. In the second step, the
stage arrangements in the integrated configurations are obtained;
finally, an optimization procedure is used to minimize energy
consumption. The energy-efficient design procedure for thermally
coupled distillation sequences is applied not only for the
separation of ternary and quaternary mixtures but also for the
separation of five or more component mixtures.
Sotudeh and Shahraki [14,15] proposed a shortcut method for
the design of a divided wall column based only on the Underwood
equation because authors believe that using the Fenske equation
for calculating the minimum number of stages is not adequate for
designing divided wall columns. The theoretical number of stages
can be calculated by using the basic Underwood equation. In this
method, the number of stages in the prefractionator is set to be the
same as in the side section. Clearly, we cannot know that the
number of stages of prefractionator is correct or not. Moreover, the
paper does not carry out simulations to confirm the method.
Ramirez-Corona et al. [13] presented an optimization procedure
for the Petlyuk distillation system. The procedure used the FUG
model to determine the structural design of the divided wall
column as well as the mass and energy balances, the thermody-
namic relationships, and cost equations. The objective function
was set as the minimization of the total annual cost. In the
procedure, they estimated the composition of the interconnection
streams between the prefractionator and the main column by
solving the feed line and the operating line equations.
yi ¼q
q " 1
" #
xi "xi;Dq " 1
yi ¼R
R þ 1
" #
xi þxi;DR þ 1
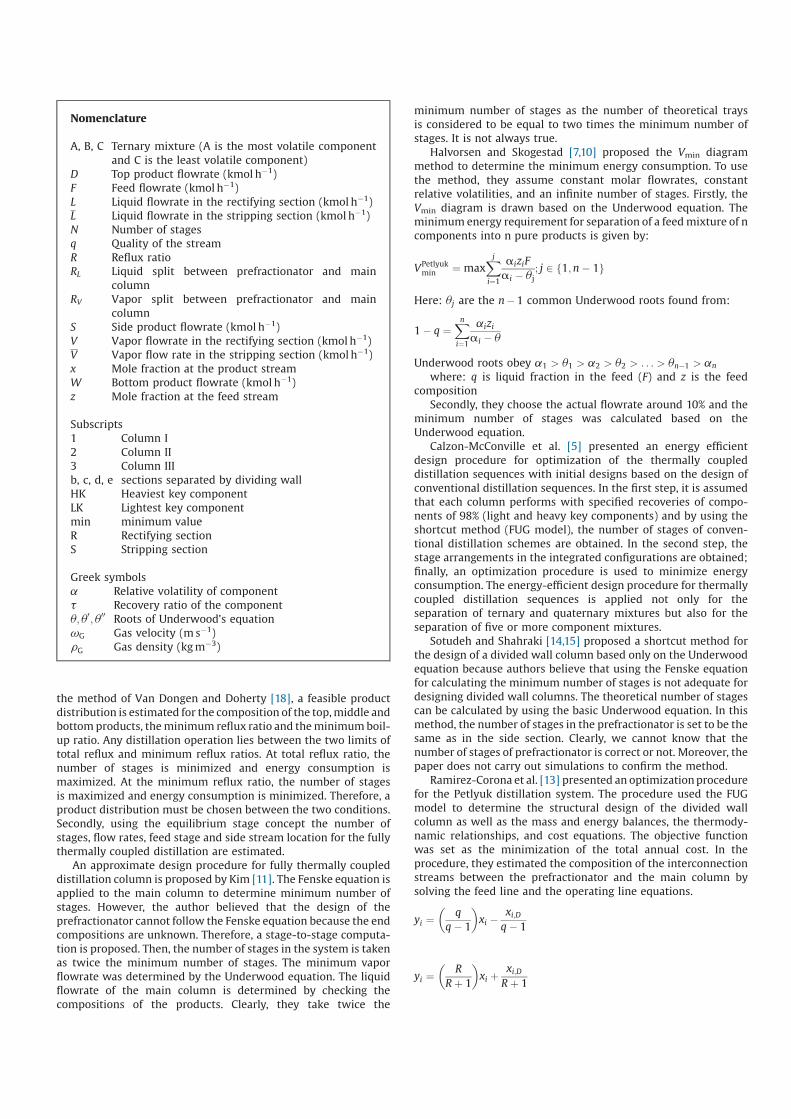
Nomenclature
A, B, C Ternary mixture (A is the most volatile component
and C is the least volatile component)
D Top product flowrate (kmol h"1)
F Feed flowrate (kmol h"1)
L Liquid flowrate in the rectifying section (kmol h"1)
L Liquid flowrate in the stripping section (kmol h"1)
N Number of stages
q Quality of the stream
R Reflux ratio
RL Liquid split between prefractionator and main
column
RV Vapor split between prefractionator and main
column
S Side product flowrate (kmol h"1)
V Vapor flowrate in the rectifying section (kmol h"1)
V Vapor flow rate in the stripping section (kmol h"1)
x Mole fraction at the product stream
W Bottom product flowrate (kmol h"1)
z Mole fraction at the feed stream
Subscripts
1 Column I
2 Column II
3 Column III
b, c, d, e sections separated by dividing wall
HK Heaviest key component
LK Lightest key component
min minimum value
R Rectifying section
S Stripping section
Greek symbols
a Relative volatility of component
t Recovery ratio of the component
u; u0; u
00Roots of Underwood’s equation
vG Gas velocity (m s"1)
rG Gas density (kg m"3)
Combining these equations, one obtains:
xi ¼zi R þ 1ð Þ þ xi;D q " 1ð Þ
R þ q
yi ¼Rzi þ qxi;D
R þ q
Chu et al. [6] presented a new shortcut method based on the
efficient net flow model to determine the composition of the key
components. They then applied the shortcut method of Fenske,
Underwood, Gilliland and Kirkbride to determine the number of
stages of each section. Liquid split RL and vapor split RV are
dependent variables due to the constant molar flow assumption.
The values of RL and RV are chosen to obtain the same number of
trays in the prefractionator and in the side section. Table 1 shows
the summary of several shortcut methods for design of divided
wall columns. Based on the above analysis, we can conclude that a
lot of papers focused on the design and simulation for divided wall
column. However, these methods still have drawbacks. The
method of Triantafyllou and Smith [4] applied the FUGK model
that can quickly and easily determine operational and structural
parameters of divided wall columns. However the application of
the Fenske equation for the estimation of the minimum number of
stages of a divided wall column is not correct since the composition
of the liquid stream returning from the main column is not equal to
the composition of the vapor entering the main column at the
connection points. Kim [11] applied a stage-to-stage computation
method instead of the Fenske equation for the prefractionator.
However the actual number of stages in the system takes twice the
minimum number of stages. Sotudeh and Shahraki [14] used only
the Underwood equation to determine the number of stages in the
main column and they set the number of stages of the
prefractionator to be the same number of stages as in the side
section. Ramirez-Corona et al. [13] also applied the FUGK method
and estimated the composition of interconnecting streams.
Moreover, all the previous methods are restricted to ternary
mixtures with a feed quality (q) equal to 1.
2. Design and simulation procedure for divided wall column
2.1. Model design
This paragraph aims to present, by application of standard
shortcut method (FUGK model) and using the component net flow
model, a procedure for designing divided wall columns. The
approach allows rapid determination of the minimum vapor flow
rate, minimum reflux ratio, and number of stages for each section
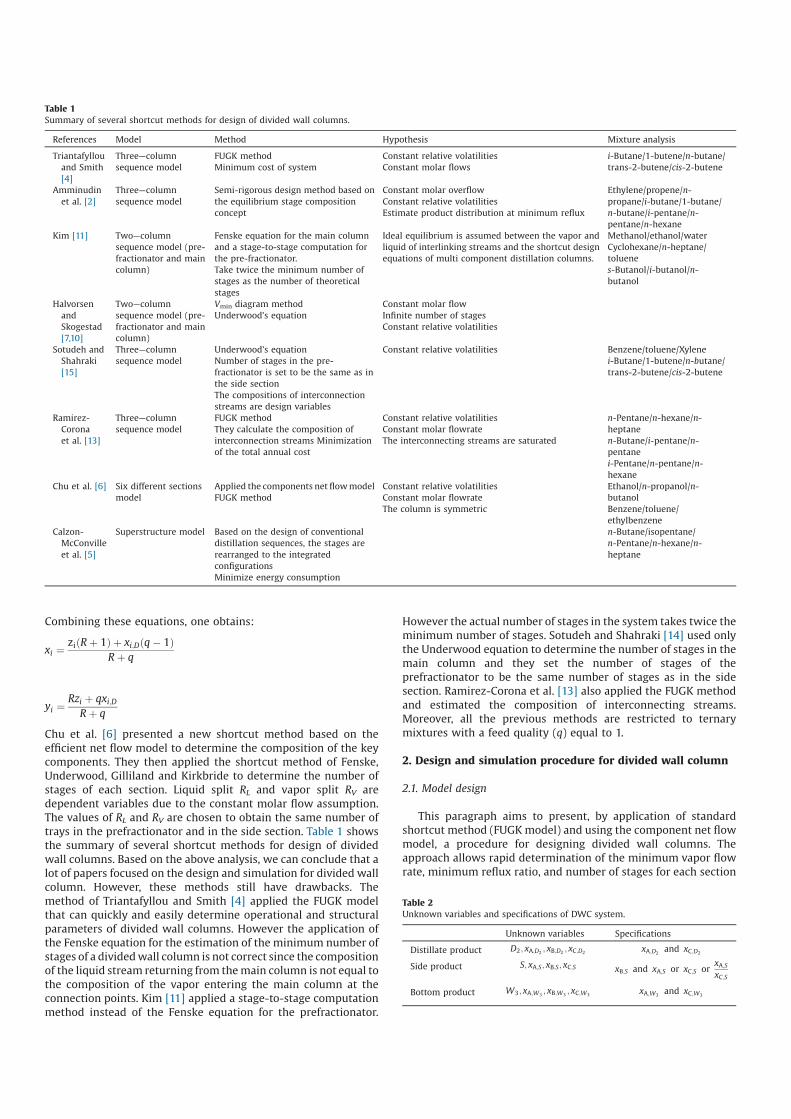
Table 1
Summary of several shortcut methods for design of divided wall columns.
References Model Method Hypothesis Mixture analysis
Triantafyllou
and Smith
[4]
Three—column
sequence model
FUGK method
Minimum cost of system
Constant relative volatilities
Constant molar flows
i-Butane/1-butene/n-butane/
trans-2-butene/cis-2-butene
Amminudin
et al. [2]
Three—column
sequence model
Semi-rigorous design method based on
the equilibrium stage composition
concept
Constant molar overflow
Constant relative volatilities
Estimate product distribution at minimum reflux
Ethylene/propene/n-
propane/i-butane/1-butane/
n-butane/i-pentane/n-
pentane/n-hexane
Kim [11] Two—column
sequence model (pre-
fractionator and main
column)
Fenske equation for the main column
and a stage-to-stage computation for
the pre-fractionator.
Take twice the minimum number of
stages as the number of theoretical
stages
Ideal equilibrium is assumed between the vapor and
liquid of interlinking streams and the shortcut design
equations of multi component distillation columns.
Methanol/ethanol/water
Cyclohexane/n-heptane/
toluene
s-Butanol/i-butanol/n-
butanol
Halvorsen
and
Skogestad
[7,10]
Two—column
sequence model (pre-
fractionator and main
column)
Vmin diagram method
Underwood’s equation
Constant molar flow
Infinite number of stages
Constant relative volatilities
Sotudeh and
Shahraki
[15]
Three—column
sequence model
Underwood’s equation
Number of stages in the pre-
fractionator is set to be the same as in
the side section
The compositions of interconnection
streams are design variables
Constant relative volatilities Benzene/toluene/Xylene
i-Butane/1-butene/n-butane/
trans-2-butene/cis-2-butene
Ramirez-
Corona
et al. [13]
Three—column
sequence model
FUGK method
They calculate the composition of
interconnection streams Minimization
of the total annual cost
Constant relative volatilities
Constant molar flowrate
The interconnecting streams are saturated
n-Pentane/n-hexane/n-
heptane
n-Butane/i-pentane/n-
pentane
i-Pentane/n-pentane/n-
hexane
Chu et al. [6] Six different sections
model
Applied the components net flow model
FUGK method
Constant relative volatilities
Constant molar flowrate
The column is symmetric
Ethanol/n-propanol/n-
butanol
Benzene/toluene/
ethylbenzene
Calzon-
McConville
et al. [5]
Superstructure model Based on the design of conventional
distillation sequences, the stages are
rearranged to the integrated
configurations
Minimize energy consumption
n-Butane/isopentane/
n-Pentane/n-hexane/n-
heptane
Table 2
Unknown variables and specifications of DWC system.
Unknown variables Specifications
Distillate product D2; xA;D2; xB;D2
; xC;D2xA;D2
and xC;D2
Side product S; xA;S; xB;S; xC;S xB;S and xA;S or xC;S orxA;SxC;S
Bottom product W3; xA;W3; xB;W3
; xC;W3xA;W3
and xC;W3
by choosing an operating reflux ratio, liquid and vapor split values,
and the possible position and configuration of the dividing wall.
Moreover, the compositions of interconnecting streams between
the prefractionator and the main column are also estimated and set
as the initial conditions for simulation in ProSimPlus1 software.
Assumptions and model design
To use the standard shortcut method, the component net flow
model, and simplified model of a divided wall column, we assume
that:
(1) The relative volatility of components is constant;
(2) The vapor and liquid flows in each section of the divided wall
column are constant;
(3) The pressure of the system is constant;
(4) The heat transfer across the dividing wall is neglected;
(5) The heat losses from the column walls are negligible;
(6) Vapor–liquid equilibrium is achieved on each stage;
(7) The heavy non-key component is assumed to go completely to
the bottom of column II (Fig. 2) and the light non-key
component is assumed to go completely to the top of column III
(Fig. 2);
Kister [9] defined that key components are the two components
in the feed mixture whose separation is specified. They are called
light key component (more volatile) and heavy key component
(less volatile). Other components are called non-key components.
Any components lighter than the light key are called light non-key
components, while those heavier than the heavy key are called
heavy non-keys components. The components that lie between the
light key and the heavy key are called distributed non-key
components. The procedure can be applied not only for ternary
mixtures but also for four component mixtures. To simplify, we
consider separation of a ternary mixture A, B, and C, in which A is
the lightest component and C is the heaviest component. The feed
flowrate is F (kmol/h), feed composition zA,zB, and zC, and
recoveries or purities of component in divided wall column are
known. The relative volatilities of each component are constant
(assumption 1).
The feed composition is listed in decreasing order of the relative
volatility of the component:
aA > aB > aC ¼ 1
The minimum number of stages at total reflux may be
estimated by using the Fenske equation. It is applied with the
assumption that all stages reach equilibrium (assumption 6) and
requires a constant relative volatility a throughout the column
(assumption 1). To determine the minimum reflux ratio, the
equations developed by Underwood are based on the assumption
(2): constant molar flowrate. Then, the knowledge of minimum
stages and minimum reflux ratio in a column can be related to the
actual number of stages and the actual reflux required by the
Gilliland correlation. Finally, the feed stage can be estimated by
using the Kirkbride equation.
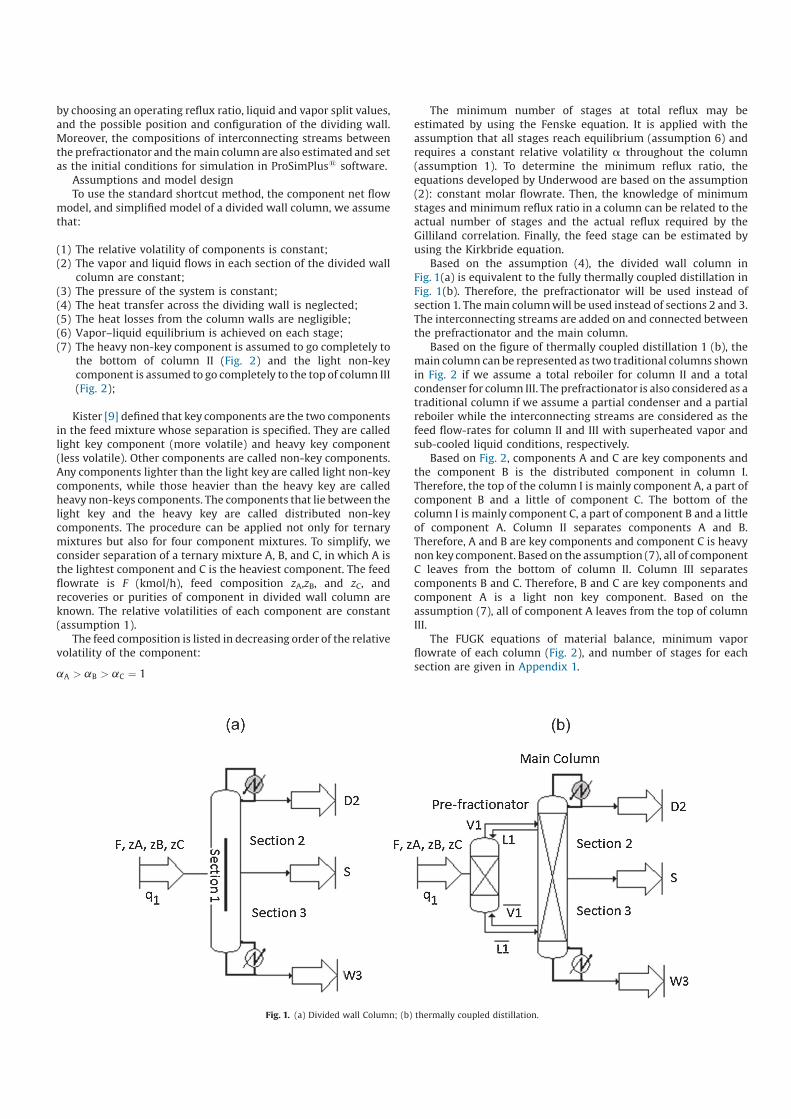
Based on the assumption (4), the divided wall column in
Fig. 1(a) is equivalent to the fully thermally coupled distillation in
Fig. 1(b). Therefore, the prefractionator will be used instead of
section 1. The main column will be used instead of sections 2 and 3.
The interconnecting streams are added on and connected between
the prefractionator and the main column.
Based on the figure of thermally coupled distillation 1 (b), the
main column can be represented as two traditional columns shown
in Fig. 2 if we assume a total reboiler for column II and a total
condenser for column III. The prefractionator is also considered as a
traditional column if we assume a partial condenser and a partial
reboiler while the interconnecting streams are considered as the
feed flow-rates for column II and III with superheated vapor and
sub-cooled liquid conditions, respectively.
Based on Fig. 2, components A and C are key components and
the component B is the distributed component in column I.
Therefore, the top of the column I is mainly component A, a part of
component B and a little of component C. The bottom of the
column I is mainly component C, a part of component B and a little
of component A. Column II separates components A and B.
Therefore, A and B are key components and component C is heavy
non key component. Based on the assumption (7), all of component
C leaves from the bottom of column II. Column III separates
components B and C. Therefore, B and C are key components and
component A is a light non key component. Based on the
assumption (7), all of component A leaves from the top of column
III.
The FUGK equations of material balance, minimum vapor
flowrate of each column (Fig. 2), and number of stages for each
section are given in Appendix 1.
Fig. 1. (a) Divided wall Column; (b) thermally coupled distillation.
This shortcut procedure is implemented in ProSimPlus software
to obtain all parameters of divided wall column.
2.2. Simulation with ProSimPlus software
There is no standard model for the simulation of a divided wall
column in commercial software. As shown in Fig. 3, there are four
possible models for the simulation: pump around sequence, two—
column sequence with prefractionator, two—column sequence
with postfractionator, and four—column sequences. For the pump
around sequence, Becker et al. [3] reported that the model can lead
to convergence problems because in two points of the column
entire vapor and liquid are drawn off, and none remains to “flow” to
the next tray. The four-column sequence model reflects the actual
best situation, but it is most difficult to initialize, because initial
values of more interconnecting streams are required. It is also the
slowest model to converge. It is considered for use with dynamic
simulations [8].
The structural and operational parameters are determined by
shortcut method, they are used as initial parameters for the
simulation. Besides the above necessary information, it is noted
that the composition, temperature, and flowrates of interconnect-
ing streams (2 and 3) or (4 and 5) must be set in the model. If there
is no specification, the simulation cannot be run. Not only because
the stream 1 is the feed stream but also because streams 4 and 5 are
the feed streams for the prefractionator. Therefore, they must be
specified for the initial run of the simulation.
Fig. 2. Simplified model design of divided wall column.
Fig. 3. Models for simulation: (a) pump around sequence (b) two—column sequence with prefractionator (c) two—column sequence with postfractionator (d) four—column
sequences.
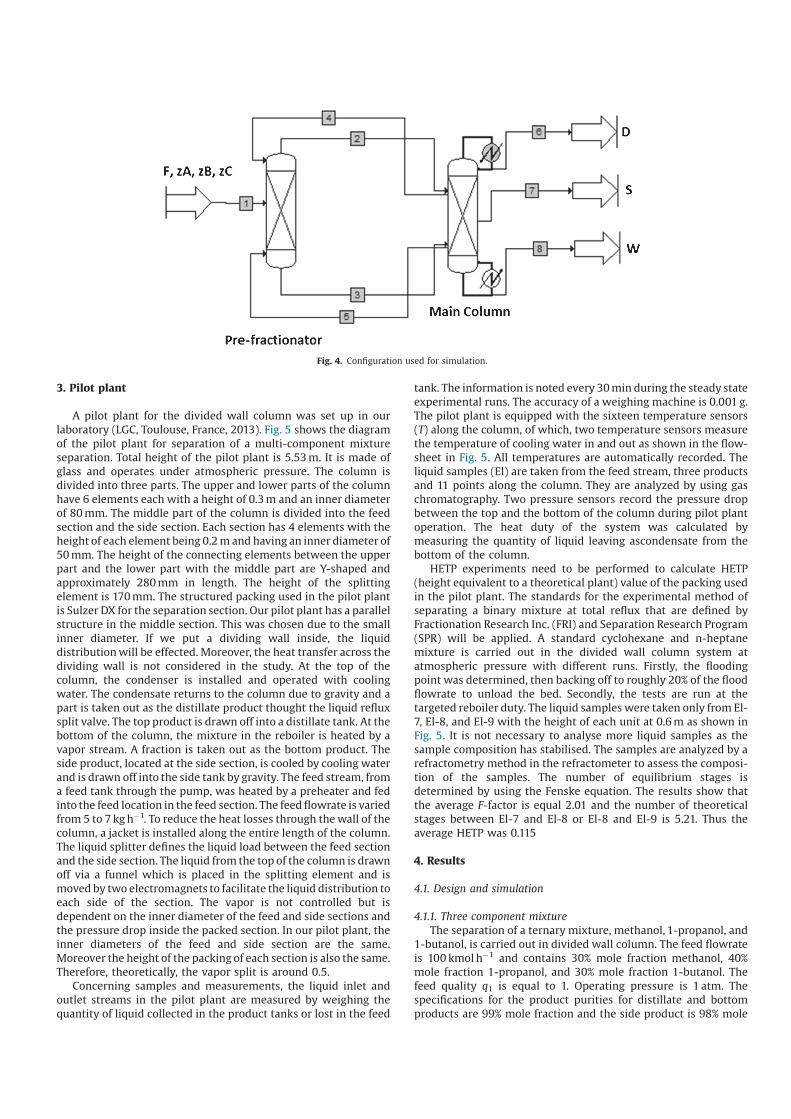
Based on these reasons, the two—column sequence with prefractionator is used to simulate the system in ProSimPlus. As shown in Fig. 4, the first column is considered as the
prefractionator and the second column as the main column. The interconnecting streams 2, 3, 4, and 5 connect the two columns. The top, side and bottom product are the
streams 6, 7, and 8, respectively and the feed flow rate is stream 1
3. Pilot plant
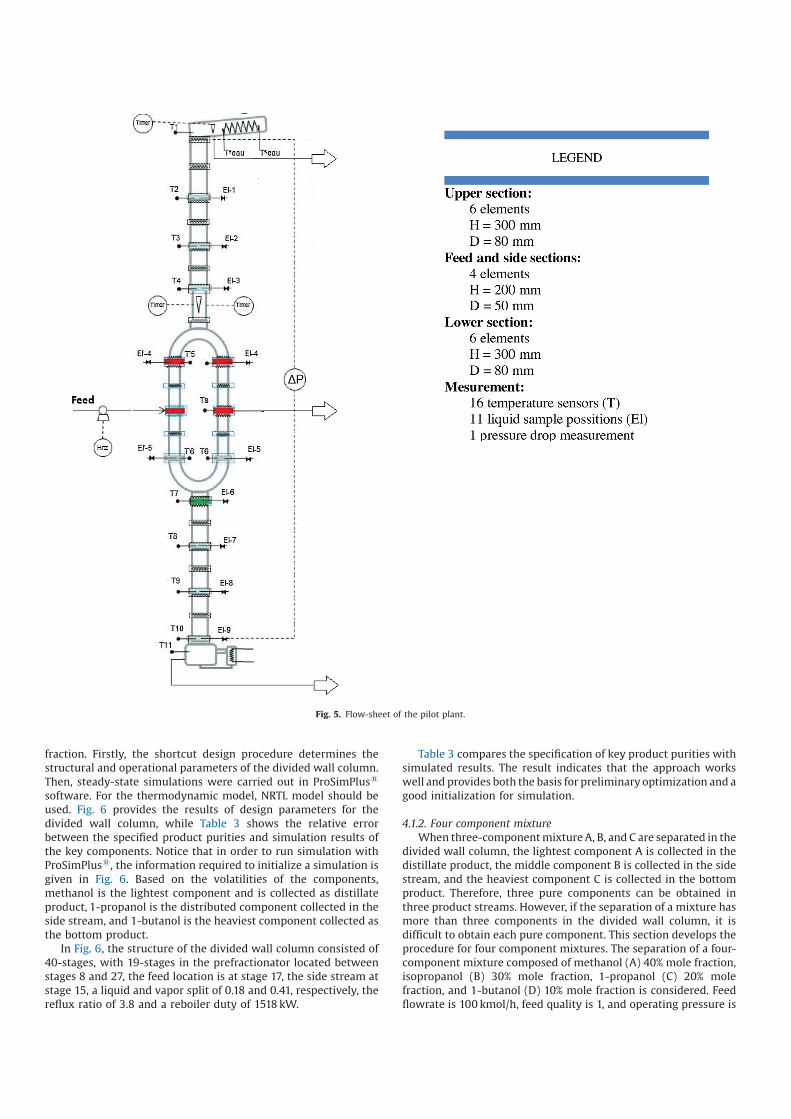
A pilot plant for the divided wall column was set up in our
laboratory (LGC, Toulouse, France, 2013). Fig. 5 shows the diagram
of the pilot plant for separation of a multi-component mixture
separation. Total height of the pilot plant is 5.53 m. It is made of
glass and operates under atmospheric pressure. The column is
divided into three parts. The upper and lower parts of the column
have 6 elements each with a height of 0.3 m and an inner diameter
of 80 mm. The middle part of the column is divided into the feed
section and the side section. Each section has 4 elements with the
height of each element being 0.2 m and having an inner diameter of
50 mm. The height of the connecting elements between the upper
part and the lower part with the middle part are Y-shaped and
approximately 280 mm in length. The height of the splitting
element is 170 mm. The structured packing used in the pilot plant
is Sulzer DX for the separation section. Our pilot plant has a parallel
structure in the middle section. This was chosen due to the small
inner diameter. If we put a dividing wall inside, the liquid
distribution will be effected. Moreover, the heat transfer across the
dividing wall is not considered in the study. At the top of the
column, the condenser is installed and operated with cooling
water. The condensate returns to the column due to gravity and a
part is taken out as the distillate product thought the liquid reflux
split valve. The top product is drawn off into a distillate tank. At the
bottom of the column, the mixture in the reboiler is heated by a
vapor stream. A fraction is taken out as the bottom product. The
side product, located at the side section, is cooled by cooling water
and is drawn off into the side tank by gravity. The feed stream, from
a feed tank through the pump, was heated by a preheater and fed
into the feed location in the feed section. The feed flowrate is varied
from 5 to 7 kg h"1. To reduce the heat losses through the wall of the
column, a jacket is installed along the entire length of the column.
The liquid splitter defines the liquid load between the feed section
and the side section. The liquid from the top of the column is drawn
off via a funnel which is placed in the splitting element and is
moved by two electromagnets to facilitate the liquid distribution to
each side of the section. The vapor is not controlled but is
dependent on the inner diameter of the feed and side sections and
the pressure drop inside the packed section. In our pilot plant, the
inner diameters of the feed and side section are the same.
Moreover the height of the packing of each section is also the same.
Therefore, theoretically, the vapor split is around 0.5.
Concerning samples and measurements, the liquid inlet and
outlet streams in the pilot plant are measured by weighing the
quantity of liquid collected in the product tanks or lost in the feed
tank. The information is noted every 30 min during the steady state
experimental runs. The accuracy of a weighing machine is 0.001 g.
The pilot plant is equipped with the sixteen temperature sensors
(T) along the column, of which, two temperature sensors measure
the temperature of cooling water in and out as shown in the flow-
sheet in Fig. 5. All temperatures are automatically recorded. The
liquid samples (El) are taken from the feed stream, three products
and 11 points along the column. They are analyzed by using gas
chromatography. Two pressure sensors record the pressure drop
between the top and the bottom of the column during pilot plant
operation. The heat duty of the system was calculated by
measuring the quantity of liquid leaving ascondensate from the
bottom of the column.
HETP experiments need to be performed to calculate HETP
(height equivalent to a theoretical plant) value of the packing used
in the pilot plant. The standards for the experimental method of
separating a binary mixture at total reflux that are defined by
Fractionation Research Inc. (FRI) and Separation Research Program
(SPR) will be applied. A standard cyclohexane and n-heptane
mixture is carried out in the divided wall column system at
atmospheric pressure with different runs. Firstly, the flooding
point was determined, then backing off to roughly 20% of the flood
flowrate to unload the bed. Secondly, the tests are run at the
targeted reboiler duty. The liquid samples were taken only from El-
7, El-8, and El-9 with the height of each unit at 0.6 m as shown in
Fig. 5. It is not necessary to analyse more liquid samples as the
sample composition has stabilised. The samples are analyzed by a
refractometry method in the refractometer to assess the composi-
tion of the samples. The number of equilibrium stages is
determined by using the Fenske equation. The results show that
the average F-factor is equal 2.01 and the number of theoretical
stages between El-7 and El-8 or El-8 and El-9 is 5.21. Thus the
average HETP was 0.115
4. Results
4.1. Design and simulation
4.1.1. Three component mixture
The separation of a ternary mixture, methanol, 1-propanol, and
1-butanol, is carried out in divided wall column. The feed flowrate
is 100 kmol h"1 and contains 30% mole fraction methanol, 40%
mole fraction 1-propanol, and 30% mole fraction 1-butanol. The
feed quality q1 is equal to 1. Operating pressure is 1 atm. The
specifications for the product purities for distillate and bottom
products are 99% mole fraction and the side product is 98% mole
Fig. 4. Configuration used for simulation.
fraction. Firstly, the shortcut design procedure determines the
structural and operational parameters of the divided wall column.
Then, steady-state simulations were carried out in ProSimPlus1
software. For the thermodynamic model, NRTL model should be
used. Fig. 6 provides the results of design parameters for the
divided wall column, while Table 3 shows the relative error
between the specified product purities and simulation results of
the key components. Notice that in order to run simulation with
ProSimPlus1, the information required to initialize a simulation is
given in Fig. 6. Based on the volatilities of the components,
methanol is the lightest component and is collected as distillate
product, 1-propanol is the distributed component collected in the
side stream, and 1-butanol is the heaviest component collected as
the bottom product.
In Fig. 6, the structure of the divided wall column consisted of
40-stages, with 19-stages in the prefractionator located between
stages 8 and 27, the feed location is at stage 17, the side stream at
stage 15, a liquid and vapor split of 0.18 and 0.41, respectively, the
reflux ratio of 3.8 and a reboiler duty of 1518 kW.
Table 3 compares the specification of key product purities with
simulated results. The result indicates that the approach works
well and provides both the basis for preliminary optimization and a
good initialization for simulation.
4.1.2. Four component mixture
When three-component mixture A, B, and C are separated in the
divided wall column, the lightest component A is collected in the
distillate product, the middle component B is collected in the side
stream, and the heaviest component C is collected in the bottom
product. Therefore, three pure components can be obtained in
three product streams. However, if the separation of a mixture has
more than three components in the divided wall column, it is
difficult to obtain each pure component. This section develops the
procedure for four component mixtures. The separation of a four-
component mixture composed of methanol (A) 40% mole fraction,
isopropanol (B) 30% mole fraction, 1-propanol (C) 20% mole
fraction, and 1-butanol (D) 10% mole fraction is considered. Feed
flowrate is 100 kmol/h, feed quality is 1, and operating pressure is
Fig. 5. Flow-sheet of the pilot plant.
1 atm. The desired side product is isopropanol. Therefore, the
distillate product contains methanol and a little isopropanol, and
the bottom product contains a little isopropanol, 1-propanol, and
1-butanol.
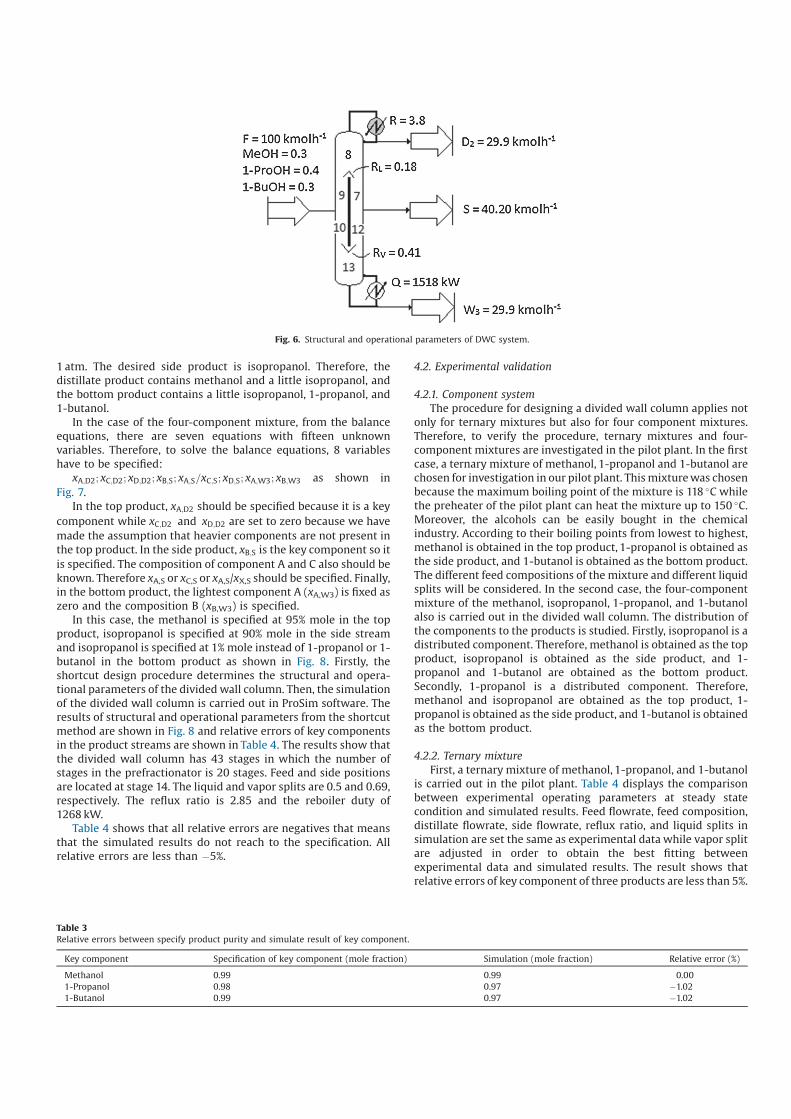
In the case of the four-component mixture, from the balance
equations, there are seven equations with fifteen unknown
variables. Therefore, to solve the balance equations, 8 variables
have to be specified:
xA;D2; xC;D2; xD;D2; xB;S; xA;S=xC;S; xD;S; xA;W3; xB;W3 as shown in
Fig. 7.
In the top product, xA;D2 should be specified because it is a key
component while xC;D2 and xD;D2 are set to zero because we have
made the assumption that heavier components are not present in
the top product. In the side product, xB;S is the key component so it
is specified. The composition of component A and C also should be
known. Therefore xA,S or xC,S or xA,S/xX,S should be specified. Finally,
in the bottom product, the lightest component A (xA,W3) is fixed as
zero and the composition B (xB,W3) is specified.
In this case, the methanol is specified at 95% mole in the top
product, isopropanol is specified at 90% mole in the side stream
and isopropanol is specified at 1% mole instead of 1-propanol or 1-
butanol in the bottom product as shown in Fig. 8. Firstly, the
shortcut design procedure determines the structural and opera-
tional parameters of the divided wall column. Then, the simulation
of the divided wall column is carried out in ProSim software. The
results of structural and operational parameters from the shortcut
method are shown in Fig. 8 and relative errors of key components
in the product streams are shown in Table 4. The results show that
the divided wall column has 43 stages in which the number of
stages in the prefractionator is 20 stages. Feed and side positions
are located at stage 14. The liquid and vapor splits are 0.5 and 0.69,
respectively. The reflux ratio is 2.85 and the reboiler duty of
1268 kW.
Table 4 shows that all relative errors are negatives that means
that the simulated results do not reach to the specification. All
relative errors are less than "5%.
4.2. Experimental validation
4.2.1. Component system
The procedure for designing a divided wall column applies not
only for ternary mixtures but also for four component mixtures.
Therefore, to verify the procedure, ternary mixtures and four-
component mixtures are investigated in the pilot plant. In the first
case, a ternary mixture of methanol, 1-propanol and 1-butanol are
chosen for investigation in our pilot plant. This mixture was chosen
because the maximum boiling point of the mixture is 118 *C while
the preheater of the pilot plant can heat the mixture up to 150 *C.
Moreover, the alcohols can be easily bought in the chemical
industry. According to their boiling points from lowest to highest,
methanol is obtained in the top product, 1-propanol is obtained as
the side product, and 1-butanol is obtained as the bottom product.
The different feed compositions of the mixture and different liquid
splits will be considered. In the second case, the four-component
mixture of the methanol, isopropanol, 1-propanol, and 1-butanol
also is carried out in the divided wall column. The distribution of
the components to the products is studied. Firstly, isopropanol is a
distributed component. Therefore, methanol is obtained as the top
product, isopropanol is obtained as the side product, and 1-
propanol and 1-butanol are obtained as the bottom product.
Secondly, 1-propanol is a distributed component. Therefore,
methanol and isopropanol are obtained as the top product, 1-
propanol is obtained as the side product, and 1-butanol is obtained
as the bottom product.
4.2.2. Ternary mixture
First, a ternary mixture of methanol, 1-propanol, and 1-butanol
is carried out in the pilot plant. Table 4 displays the comparison
between experimental operating parameters at steady state
condition and simulated results. Feed flowrate, feed composition,
distillate flowrate, side flowrate, reflux ratio, and liquid splits in
simulation are set the same as experimental data while vapor split
are adjusted in order to obtain the best fitting between
experimental data and simulated results. The result shows that
relative errors of key component of three products are less than 5%.
Table 3
Relative errors between specify product purity and simulate result of key component.
Key component Specification of key component (mole fraction) Simulation (mole fraction) Relative error (%)
Methanol 0.99 0.99 0.00
1-Propanol 0.98 0.97 "1.02
1-Butanol 0.99 0.97 "1.02
Fig. 6. Structural and operational parameters of DWC system.
In the simulation, we assume that the heat losses from the column
walls are negligible. Thus, heat duty of condenser in experiment is
used to compare with heat duty of reboiler in simulation instead of
heat duty of reboiler as shown in Table 5. The relative error is equal
to 6.31%.
Fig. 9 shows the composition and temperature profiles along
the column. This figure indicates that the product purities show
very good agreement between experiment and simulation not only
for products but also for composition in whole column. The results
can indicate two regions: Methanol and 1-propanol are separated
in the upper part where mole fraction of 1-butanol is almost zero
from a packing height of 2.6–4.4 m. The 1-propanol and 1-butanol
are separated in the lower part where methanol is almost zero
Fig. 7. Specified variables for four-component mixture in divided wall column.
Fig. 8. Design parameters for the divided wall column.
Table 4
Relative errors between specified product purity and simulation of key components.
Key component Specification of products Simulation Relative error (%)
Methanol 0.95 0.918 " 3.36
Isopropanol 0.90 0.860 " 4.44
Isopropanol 0.01 0.0096 " 4.00
Table 5
Operation parameters and results for experimental steady-state runs.
Parameters Experiment Simulation Relative error (%)
Feed Stream (kg/h) 6.12 6.12 –
Methanol (wt. %) 0.32 0.32 –
1-Propanol (wt. %) 0.36 0.36 –
1-Butanol (wt. %) 0.32 0.32 –
Distillate stream (kg/h) 1.95 1.95 –
Methanol (wt. %) 0.98 0.97 "1.02
1-Propanol (wt. %) 0.02 0.03 –
1-Butanol (wt. %) 0.00 0.00 –
Side stream (kg/h) 2.12 2.12 –
Methanol (wt. %) 0.00 0.03 –
1-Propanol (wt. %) 0.99 0.97 "2.02
1-Butanol (wt. %) 0.01 0.00 –
Bottom stream (kg/h) 1.93 2.05 –
Methanol (wt. %) 0.00 0.00 –
1-Propanol (wt. %) 0.06 0.05 –
1-Butanol (wt. %) 0.94 0.95 +1.06
Liquid split (") 0.4 0.4 –
Vapor split (") – 0.65 –
Reflux ratio (") 4 4 –
Heat duty (kW) 2.85 3.03 +6.31
Pressure drop (mbar) 3.1 – –
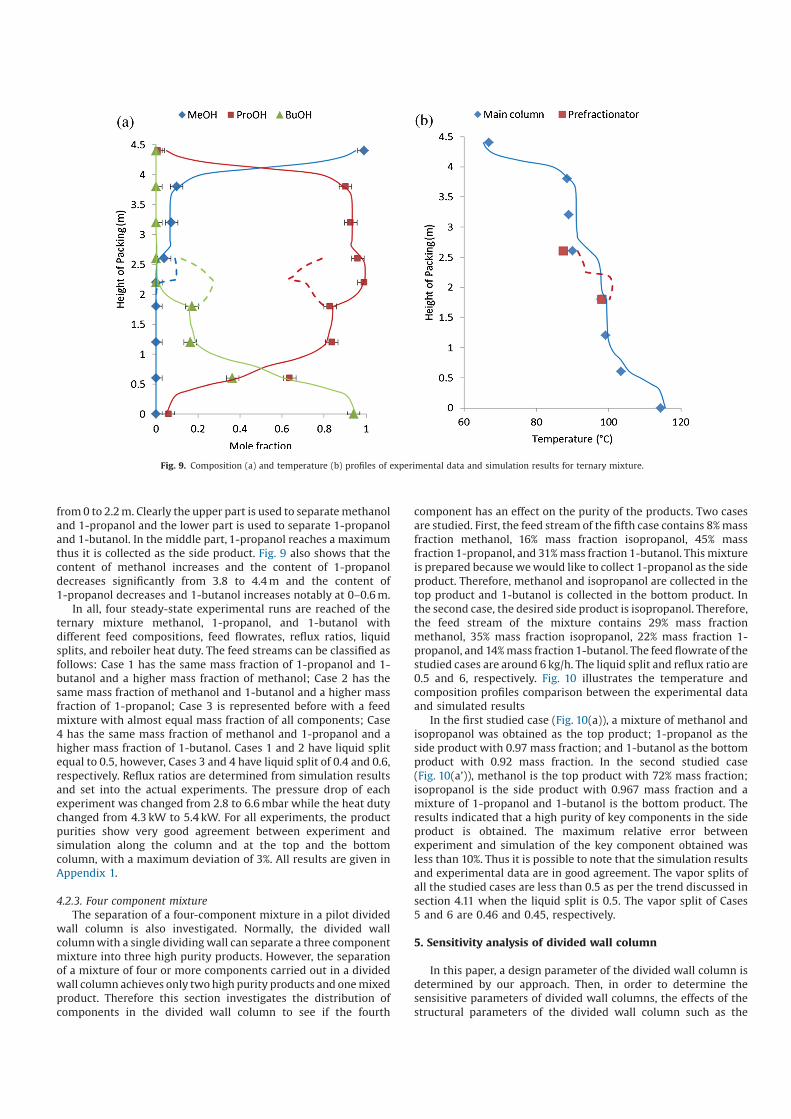
from 0 to 2.2 m. Clearly the upper part is used to separate methanol
and 1-propanol and the lower part is used to separate 1-propanol
and 1-butanol. In the middle part, 1-propanol reaches a maximum
thus it is collected as the side product. Fig. 9 also shows that the
content of methanol increases and the content of 1-propanol
decreases significantly from 3.8 to 4.4 m and the content of
1-propanol decreases and 1-butanol increases notably at 0–0.6 m.
In all, four steady-state experimental runs are reached of the
ternary mixture methanol, 1-propanol, and 1-butanol with
different feed compositions, feed flowrates, reflux ratios, liquid
splits, and reboiler heat duty. The feed streams can be classified as
follows: Case 1 has the same mass fraction of 1-propanol and 1-
butanol and a higher mass fraction of methanol; Case 2 has the
same mass fraction of methanol and 1-butanol and a higher mass
fraction of 1-propanol; Case 3 is represented before with a feed
mixture with almost equal mass fraction of all components; Case
4 has the same mass fraction of methanol and 1-propanol and a
higher mass fraction of 1-butanol. Cases 1 and 2 have liquid split
equal to 0.5, however, Cases 3 and 4 have liquid split of 0.4 and 0.6,
respectively. Reflux ratios are determined from simulation results
and set into the actual experiments. The pressure drop of each
experiment was changed from 2.8 to 6.6 mbar while the heat duty
changed from 4.3 kW to 5.4 kW. For all experiments, the product
purities show very good agreement between experiment and
simulation along the column and at the top and the bottom
column, with a maximum deviation of 3%. All results are given in
Appendix 1.
4.2.3. Four component mixture
The separation of a four-component mixture in a pilot divided
wall column is also investigated. Normally, the divided wall
column with a single dividing wall can separate a three component
mixture into three high purity products. However, the separation
of a mixture of four or more components carried out in a divided
wall column achieves only two high purity products and one mixed
product. Therefore this section investigates the distribution of
components in the divided wall column to see if the fourth
component has an effect on the purity of the products. Two cases
are studied. First, the feed stream of the fifth case contains 8% mass
fraction methanol, 16% mass fraction isopropanol, 45% mass
fraction 1-propanol, and 31% mass fraction 1-butanol. This mixture
is prepared because we would like to collect 1-propanol as the side
product. Therefore, methanol and isopropanol are collected in the
top product and 1-butanol is collected in the bottom product. In
the second case, the desired side product is isopropanol. Therefore,
the feed stream of the mixture contains 29% mass fraction
methanol, 35% mass fraction isopropanol, 22% mass fraction 1-
propanol, and 14% mass fraction 1-butanol. The feed flowrate of the
studied cases are around 6 kg/h. The liquid split and reflux ratio are
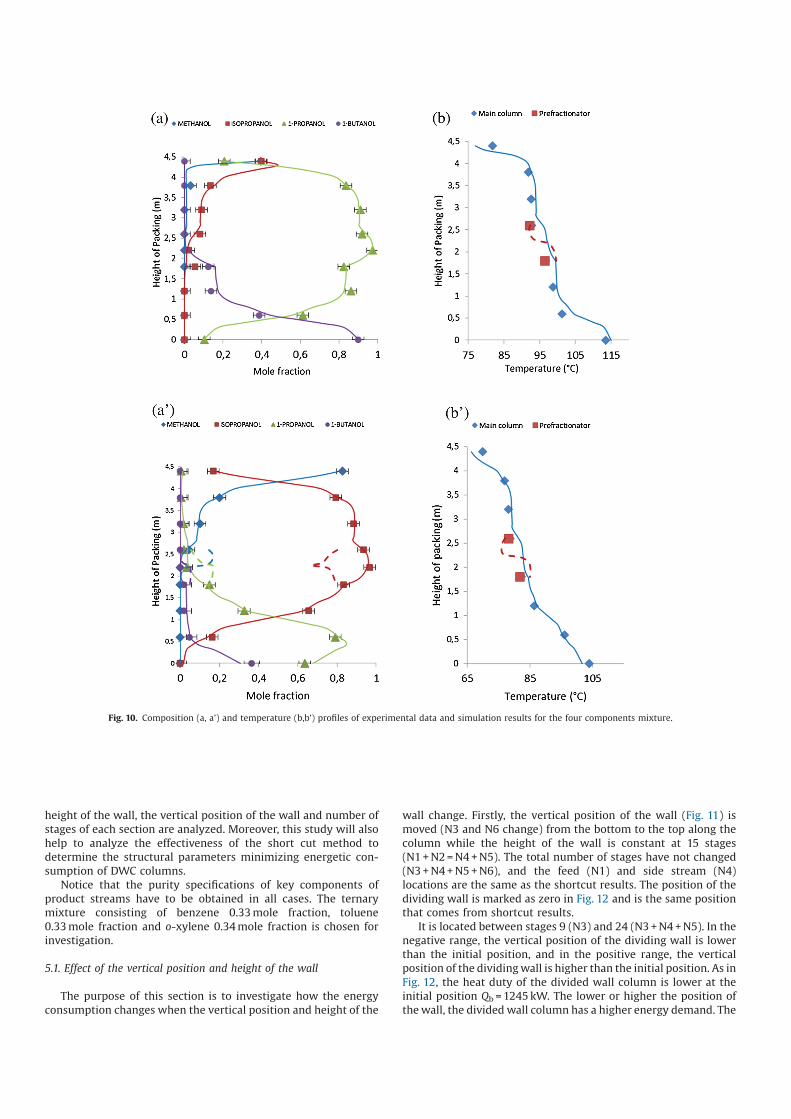
0.5 and 6, respectively. Fig. 10 illustrates the temperature and
composition profiles comparison between the experimental data
and simulated results
In the first studied case (Fig. 10(a)), a mixture of methanol and
isopropanol was obtained as the top product; 1-propanol as the
side product with 0.97 mass fraction; and 1-butanol as the bottom
product with 0.92 mass fraction. In the second studied case
(Fig. 10(a’)), methanol is the top product with 72% mass fraction;
isopropanol is the side product with 0.967 mass fraction and a
mixture of 1-propanol and 1-butanol is the bottom product. The
results indicated that a high purity of key components in the side
product is obtained. The maximum relative error between
experiment and simulation of the key component obtained was
less than 10%. Thus it is possible to note that the simulation results
and experimental data are in good agreement. The vapor splits of
all the studied cases are less than 0.5 as per the trend discussed in
section 4.11 when the liquid split is 0.5. The vapor split of Cases
5 and 6 are 0.46 and 0.45, respectively.
5. Sensitivity analysis of divided wall column
In this paper, a design parameter of the divided wall column is
determined by our approach. Then, in order to determine the
sensisitive parameters of divided wall columns, the effects of the
structural parameters of the divided wall column such as the
Fig. 9. Composition (a) and temperature (b) profiles of experimental data and simulation results for ternary mixture.
height of the wall, the vertical position of the wall and number of
stages of each section are analyzed. Moreover, this study will also
help to analyze the effectiveness of the short cut method to
determine the structural parameters minimizing energetic con-
sumption of DWC columns.
Notice that the purity specifications of key components of
product streams have to be obtained in all cases. The ternary
mixture consisting of benzene 0.33 mole fraction, toluene
0.33 mole fraction and o-xylene 0.34 mole fraction is chosen for
investigation.
5.1. Effect of the vertical position and height of the wall
The purpose of this section is to investigate how the energy
consumption changes when the vertical position and height of the
wall change. Firstly, the vertical position of the wall (Fig. 11) is
moved (N3 and N6 change) from the bottom to the top along the
column while the height of the wall is constant at 15 stages
(N1 + N2 = N4 + N5). The total number of stages have not changed
(N3 + N4 + N5 + N6), and the feed (N1) and side stream (N4)
locations are the same as the shortcut results. The position of the
dividing wall is marked as zero in Fig. 12 and is the same position
that comes from shortcut results.
It is located between stages 9 (N3) and 24 (N3 + N4 + N5). In the
negative range, the vertical position of the dividing wall is lower
than the initial position, and in the positive range, the vertical
position of the dividing wall is higher than the initial position. As in
Fig. 12, the heat duty of the divided wall column is lower at the
initial position Qb = 1245 kW. The lower or higher the position of
the wall, the divided wall column has a higher energy demand. The
Fig. 10. Composition (a, a’) and temperature (b,b’) profiles of experimental data and simulation results for the four components mixture.
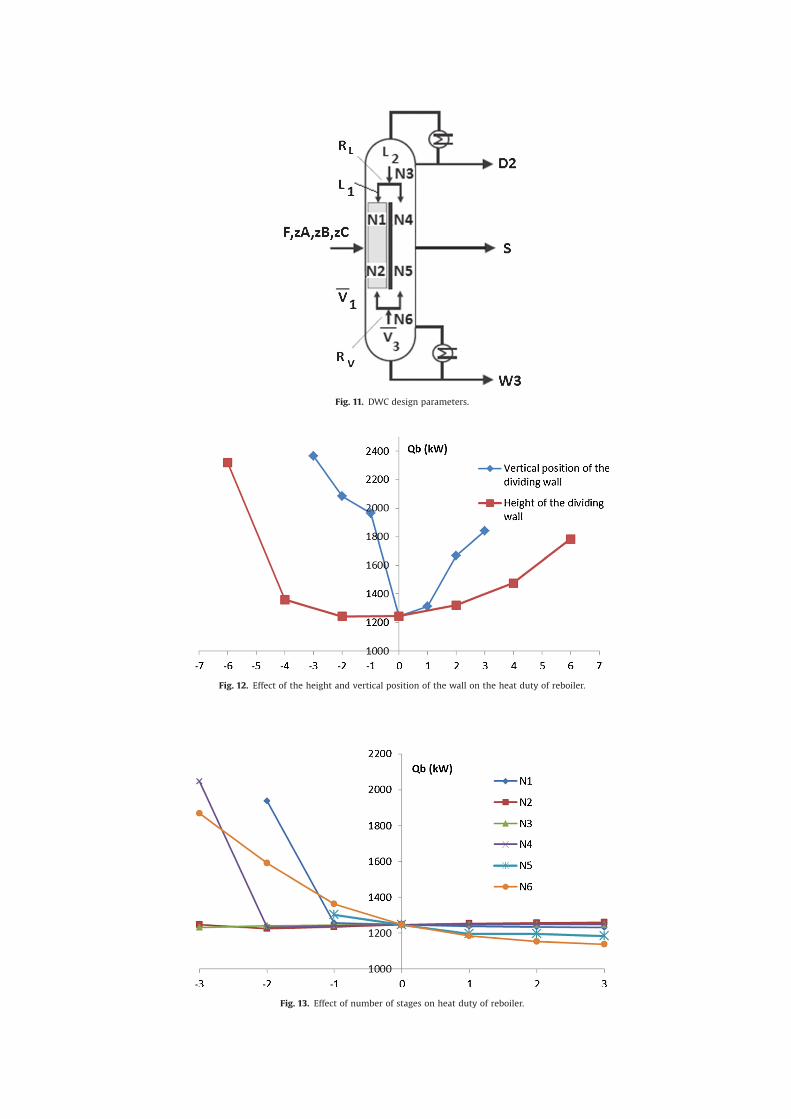
Fig. 11. DWC design parameters.
Fig. 12. Effect of the height and vertical position of the wall on the heat duty of reboiler.
Fig. 13. Effect of number of stages on heat duty of reboiler.
reboiler heat duty is 2400 kW when the vertical position of the
dividing wall is 3 stages lower. It is located between stages 12 and
27. The heat duty of the reboiler is 1850 kW when the vertical
position of the dividing wall is 3 stages higher. It is located between
stages 6 and 21. The result shows that the vertical position of the
dividing wall from the shortcut results requires less energy when
the structure changes.
Secondly, the reboiler heat duty is also analyzed with a change
of the height of the dividing wall (N1 + N2 = N4 + N5 change). The
height of the wall is 15 stages, as per the shortcut result, marked
zero in Fig. 12. In the negative range, the number of stages of the
dividing wall is decreased while in the positive range, the number
of stages of the dividing wall is increased. The feed (N1) and side
product (N4) position remains the same as the initial parameters.
Fig. 12 shows that the energy consumption of the divided wall
column is lower if the number of stage decreases from 15 to
13 stages. The reboiler heat duty is around 1245 kW. The reboiler
heat duty increased to 2300 kW when the height of the dividing
wall decreases to 9 stages. The reboiler heat duty also increased to
1800 kW when the height of the dividing wall increases to
21 stages. Clearly, our procedure for design of divided wall columns
gives good structural parameters; the results are very closed to the
minimum energy demand of the column.
5.2. Effect of the number of stages
In this section, the change of the reboiler heat duty is studied
when the number of stages of one section has changed while those
of other sections are fixed the same as initial parameters. Fig. 13
shows that the heat duty of the reboiler changes with the number
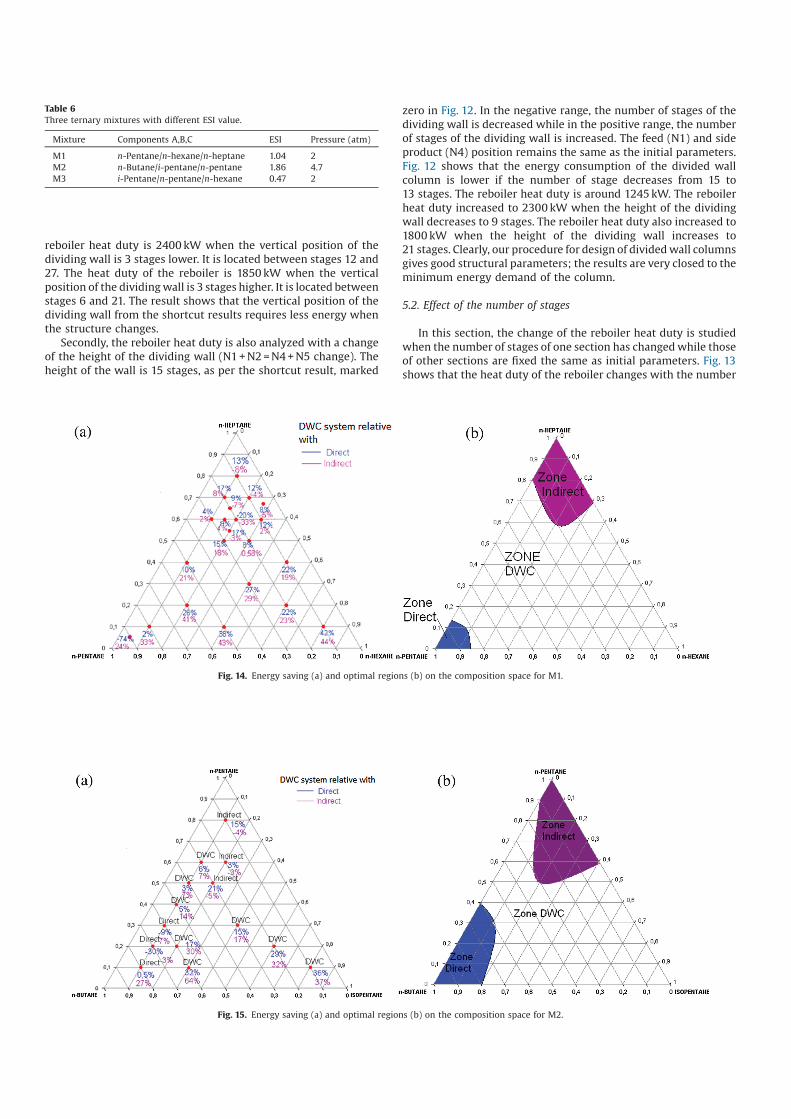
Table 6
Three ternary mixtures with different ESI value.
Mixture Components A,B,C ESI Pressure (atm)
M1 n-Pentane/n-hexane/n-heptane 1.04 2
M2 n-Butane/i-pentane/n-pentane 1.86 4.7
M3 i-Pentane/n-pentane/n-hexane 0.47 2
Fig. 14. Energy saving (a) and optimal regions (b) on the composition space for M1.
Fig. 15. Energy saving (a) and optimal regions (b) on the composition space for M2.
of stages of each section. The initial parameters from the shortcut
results are marked zero as shown in Fig. 13 including N1—8 stages,
N2—9 stages, N3—9 stages, N4—8 stages, N5—7 stages, and N6—
7 stages. In the negative range, the number of stages decreases and
in the positive range, the number of stages increases.
Fig. 13 shows that the heat duty of the reboiler increases when
the number of stages of each section decreases. Theoretically,
when the numbers of stages decreases, in order to retain the
specified product purity, the reflux ratio has to increase. Therefore
the reboiler heat duty will increase. In Fig. 13, the numbers of
stages in the section 1, 4, and 6 has a significant effect on the heat
duty of the reboiler while the number of stages in sections 2 and
3 are not significantly affected. The number of stages in sections
1 and 5 cannot decrease more as the purity specification cannot be
reached, regardless of the energy supplied to the column. The
number of stages in each section increases, the energy duty of
reboiler slightly decreases as shown in Fig. 13. Clearly, it is
important to notice that when the number of stages increases, the
capital cost of the process will also increase. So, our procedure for
design of divided wall columns gives good initial value of number
of stage regarding to the minimum energy demand of the column.
5.3. Energy consumption comparison between traditional sequences
and DWC system
The idea is to build a ternary diagram and find the boundary
where the configuration of distillation is the most economical. In
order to do this, the energy used for the traditional distillation
column and divided wall column for three ternary mixtures M1,
M2 and M3 are considered. Table 6 displays the different values of
the ease of separation index (ESI) of the mixture. ESI is defined by
Tedder and Rudd [17]: the value ESI equal (or less than, or more
than) to 1 that means the split A/B is as difficult as (or more than, or
less than) the split B/C.
ESI ¼KAKC
K2B
where KA; KB; KC are volatilities of component A, B, and C.
The feed flowrate is 100 kmol h"1. The operating pressure for
each mixture is chosen to ensure the use of cooling water in the
condensers. The lightest component is recovered at the top of the
column at 99%, the heaviest component is recovered at the bottom
of the column at 99% and the intermediate component is recovered
in the middle of the column at 95%. A wide range of feed
composition is studied.
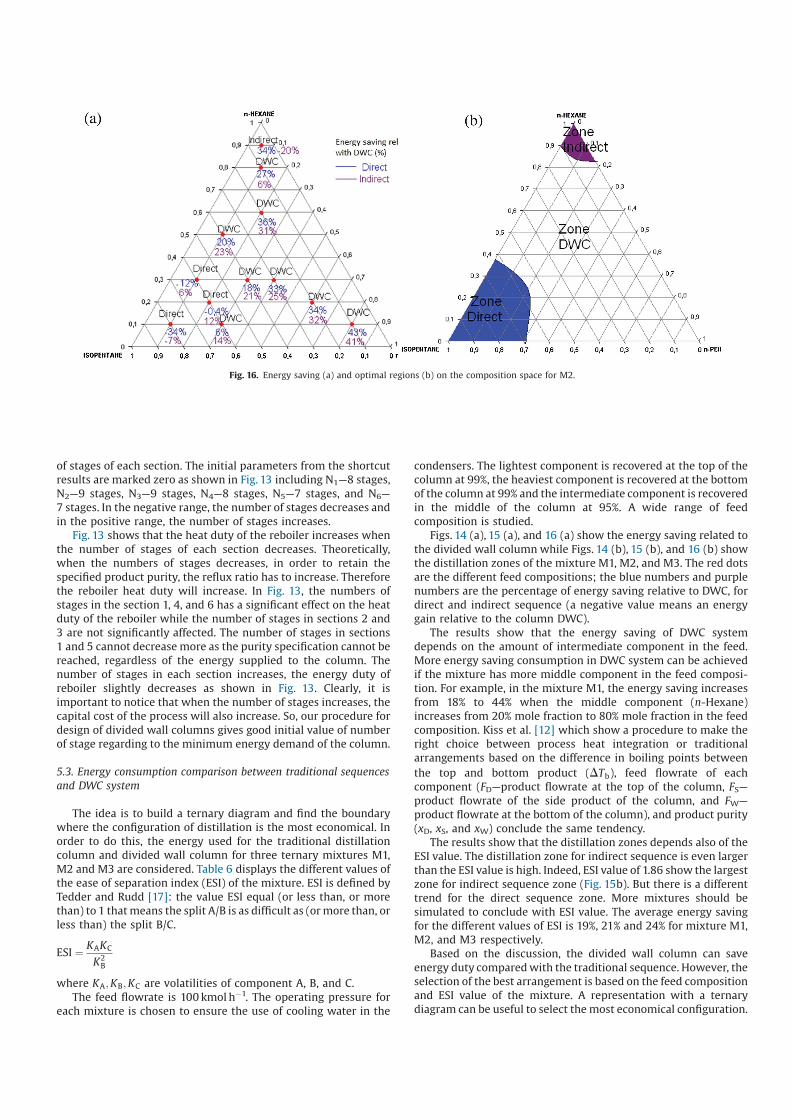
Figs. 14 (a), 15 (a), and 16 (a) show the energy saving related to
the divided wall column while Figs. 14 (b), 15 (b), and 16 (b) show
the distillation zones of the mixture M1, M2, and M3. The red dots
are the different feed compositions; the blue numbers and purple
numbers are the percentage of energy saving relative to DWC, for
direct and indirect sequence (a negative value means an energy
gain relative to the column DWC).
The results show that the energy saving of DWC system
depends on the amount of intermediate component in the feed.
More energy saving consumption in DWC system can be achieved
if the mixture has more middle component in the feed composi-
tion. For example, in the mixture M1, the energy saving increases
from 18% to 44% when the middle component (n-Hexane)
increases from 20% mole fraction to 80% mole fraction in the feed
composition. Kiss et al. [12] which show a procedure to make the
right choice between process heat integration or traditional
arrangements based on the difference in boiling points between
the top and bottom product (DTb), feed flowrate of each
component (FD—product flowrate at the top of the column, FS—
product flowrate of the side product of the column, and FW—
product flowrate at the bottom of the column), and product purity
(xD, xS, and xW) conclude the same tendency.
The results show that the distillation zones depends also of the
ESI value. The distillation zone for indirect sequence is even larger
than the ESI value is high. Indeed, ESI value of 1.86 show the largest
zone for indirect sequence zone (Fig. 15b). But there is a different
trend for the direct sequence zone. More mixtures should be
simulated to conclude with ESI value. The average energy saving
for the different values of ESI is 19%, 21% and 24% for mixture M1,
M2, and M3 respectively.
Based on the discussion, the divided wall column can save
energy duty compared with the traditional sequence. However, the
selection of the best arrangement is based on the feed composition
and ESI value of the mixture. A representation with a ternary
diagram can be useful to select the most economical configuration.
Fig. 16. Energy saving (a) and optimal regions (b) on the composition space for M2.
6. Conclusion
The paper has given a procedure for design of DWC system in
which both structural and operational parameters of DWC system
are rapidly determined. Based on the simulated results, it can be
concluded that our procedure can give a good initialization for
rigorous simulation. The implementation, startup and operation of
a pilot plant to carry out alcohol mixture are achieved in the paper.
It indicated that the simulated results are in good agreement with
the experimental data at steady state condition and then, the
proposed procedure appears to be well adapted to quickly design
divided wall columns.
The energy consumption of the traditional arrangements and
DWC system are compared. The separations of three different
ternary mixtures with different values of ESI are studied. The
energy consumption of the DWC system is more favorable than the
traditional arrangements if the mixture has more middle compo-
nent. Clearly, the DWC system is not always the best compared
with the conventional arrangements. The selection depends on the
feed composition and the ESI value of the mixture.
Acknowledgement
The authors gratefully acknowledge ProSim1 Company for their
support and discussions.
Appendix 1.
FUGK equation for shortcut method of DWC column system
Material balance of divided wall column for ternary mixture
Based on Fig. 2, material balance equations for each component
For the component A
FzA ¼ D2xA;D2þ SxA;S þ W3xA;W3
For the component B
FzB ¼ D2xB;D2þ SxB;S þ W3xB;W3
For the component C
FzC ¼ D2xC;D2þ SxC;S þ W3xC;W3
and
xA;D2þ xB;D2
þ xC;D2¼ 1
xA;S þ xB;S þ xC;S ¼ 1
xA;W3þ xB;W3
þ xC;W3¼ 1
We know the feed flowrate (F) and feed composition zA; zB; zCð Þ.
From the above equations, there are twelve unknown variables
while there are six equations. Therefore, in order to solve the
equations, six of unknown variables must be specified. Unknown
variables and specification are listed in Table 2.
We assumed that the component C goes completely to the
bottom of the column II and the component A goes completely to
the top of the column III. Therefore, we have xC;D2¼ 0 and
xA;W3¼ 0.
Minimum vapor flowrate of DWC system
Minimum vapor flowrate of column I
In the column I, the recovery ratio of component i in the top
product defined as:
ti;T ¼xi;D1
D1
Fzi
Recovery ratio of components A and C should be chosen between:
1 > tA;T > 1 "xA;SS
zAF
0 < tC;T <xC;SS
zBF
The recovery ratio of component B is calculated by Stichlmair’s
equation [16]. It is called the preferred split bp:
tB;T ¼ bp ¼ "aAzAF=aA " u1ð Þ " aAzAF=aA " u2ð Þ
aBzBF=aB " u1ð Þ " aBzBF=aB " u2ð Þ
where
u1; u2—are two roots of Underwood’s equation at the minimum
reflux condition. They must be following ranges:
aA > u1 > aB > u2 > aC
1 " q1ð Þ ¼X
C
i¼A
aiziai " u
where
q1—Feed quality is the fraction of the feed that is liquid for the
column I.
The minimum vapor flow in the prefractionator is determined
by Underwood’s equation:
V1;min ¼X
C
i¼A
aixi;D1D1
ai " u
and we choose:
V1;min ¼ max V1;min u1ð Þ; V1;min u2ð Þ$ %
Minimum vapor flowrate of column II
The interconnecting streams, a saturated vapor stream V1ð Þ is
left from the column I and a saturated liquid stream L1ð Þ is returned
into the column I, can be modified by equivalent feed stream with a
superheated vapor condition. Therefore, the quality of the feed for
the column II:
q2 ¼L2 " L2D1
¼ "V1;min " D1
D1
At the minimum reflux condition, the Underwood’s equation
can be written as follows:
1 " q2ð Þ ¼X
C
i¼A
aixi;D1
ai " u0
where
u0
1; u0
2 are two roots of Underwood’s equation at the minimum
reflux condition. They must be following ranges: aA > u0
1 > aB >
u0
2 > aC
The minimum vapor flow in the column II can be estimated by:
V2;min ¼X
C
i¼A
aixi;D2D2
ai " u0
Therefore, we can choose
V2;min ¼ max V2;min u01ð Þ; V2;min u02ð Þ$ %
Minimum vapor flowrate of column III
The stream is fed to the column III that is connected from
interconnecting streams are a saturated liquid stream L1 Þ&
and a
saturated vapor stream V1Þ&
, can be modified by equivalent feed
stream with a sub-cooled liquid condition. The quality of the feed
for the column III can be calculated by:
q3 ¼L3 " L3W1
¼V1;min " D1 þ q1F
W1
At the minimum reflux condition, the Underwood’s equation
can be written as follows:
1 " q3ð Þ ¼X
C
i¼A
aixi;W1
ai " u}
where
u}
1; u}
2are two roots of Underwood’s equation at the minimum
reflux condition. They must be following ranges: aA > u}
1 > aB >
u}
2 > aC
The minimum vapor flow in the column III can be determined
by:
V3;min ¼ "X
C
i¼A
aixi;W3W3
ai " u}
Therefore, we choose
V3;min ¼ max V 3;min u}1ð Þ; V3;min u}2ð Þg$
Minimum vapor flow rate of DWC system
The minimum vapor flowrate of DWC system should be chosen
by Halvorsen and Skogestad [7,10]
Vmin;DWCs ¼ max V2;min; V3;min þ 1 " q1ð ÞF$ %
Number of stages for each section of DWC system
The minimum reflux ratio of the DWC system can be calculated
as follows:
Rmin ¼Vmin;DWCs
D2" 1
The operating reflux ratio of the DWC system can be chosen as:
R ¼1; 2
1; 5
" #
Rmin
The liquid and vapor splits between prefractionator and main
column can be defined as:
RL ¼L1L2
RV ¼V1
V3
Starting from the structure as shown in Fig. 2, an evaluation of NET
for each section and reflux ratio for each column are computed
based on traditional shortcut method of Fenske, Underwood, and
Gilliland and Kirkbride equations by Kister [9]. The minimum
number of stages can be determined by Fenske equation for
column i:
Ni;min ¼ln Sð Þ
ln aavð Þ
where S is given by equation
S ¼xLKxHK
" #
Di
xHKxLK
" #
W i
; i ¼1
3
Then, we calculate number of stages by using Gilliland
equation:
Y ¼ 0; 75: 1 " X0;5668' (
where X and Y are given by equation
X ¼R " Rmin
R þ 1
Y ¼N " Nmin
N þ 1
Feed location in each column can be calculated by Kirkbridge
equation
NR
NS
" #
i
¼zHKzLK
" #
i
xLK;W i
xHK;Di
" #2W i
Di
( )0:206
Appendix 2.
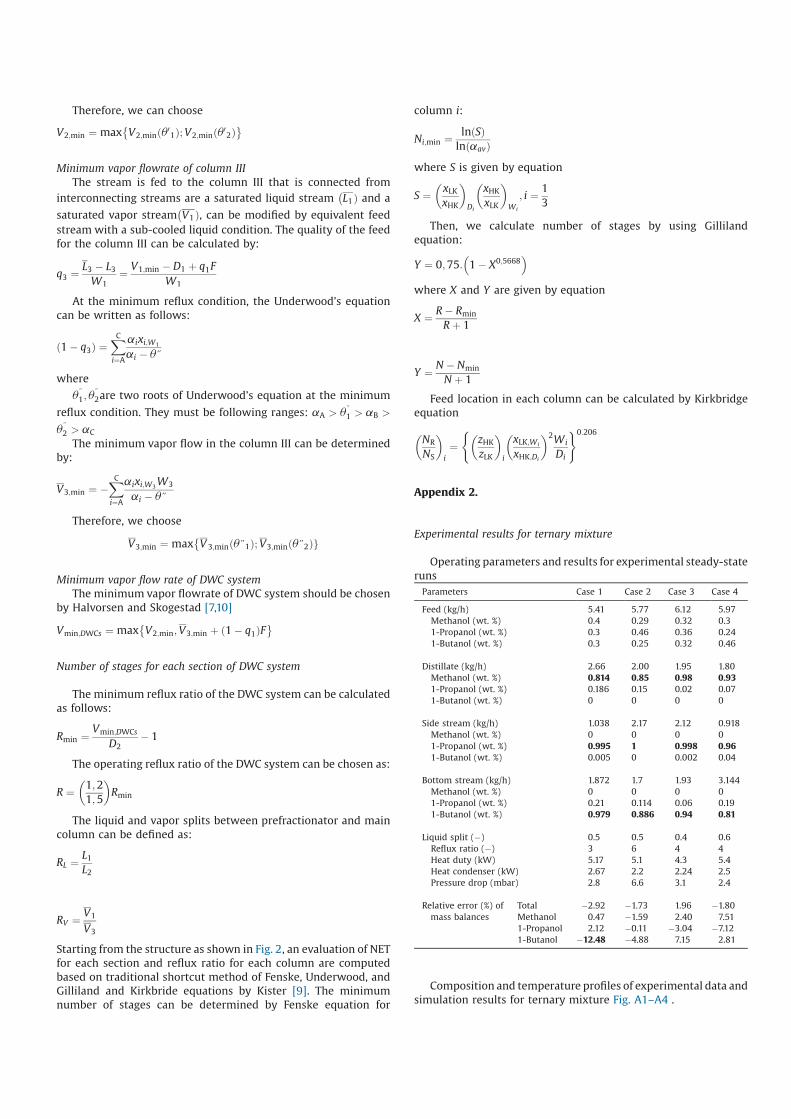
Experimental results for ternary mixture
Operating parameters and results for experimental steady-state
runs
Parameters Case 1 Case 2 Case 3 Case 4
Feed (kg/h) 5.41 5.77 6.12 5.97
Methanol (wt. %) 0.4 0.29 0.32 0.3
1-Propanol (wt. %) 0.3 0.46 0.36 0.24
1-Butanol (wt. %) 0.3 0.25 0.32 0.46
Distillate (kg/h) 2.66 2.00 1.95 1.80
Methanol (wt. %) 0.814 0.85 0.98 0.93
1-Propanol (wt. %) 0.186 0.15 0.02 0.07
1-Butanol (wt. %) 0 0 0 0
Side stream (kg/h) 1.038 2.17 2.12 0.918
Methanol (wt. %) 0 0 0 0
1-Propanol (wt. %) 0.995 1 0.998 0.96
1-Butanol (wt. %) 0.005 0 0.002 0.04
Bottom stream (kg/h) 1.872 1.7 1.93 3.144
Methanol (wt. %) 0 0 0 0
1-Propanol (wt. %) 0.21 0.114 0.06 0.19
1-Butanol (wt. %) 0.979 0.886 0.94 0.81
Liquid split (") 0.5 0.5 0.4 0.6
Reflux ratio (") 3 6 4 4
Heat duty (kW) 5.17 5.1 4.3 5.4
Heat condenser (kW) 2.67 2.2 2.24 2.5
Pressure drop (mbar) 2.8 6.6 3.1 2.4
Relative error (%) of
mass balances
Total "2.92 "1.73 1.96 "1.80
Methanol 0.47 "1.59 2.40 7.51
1-Propanol 2.12 "0.11 "3.04 "7.12
1-Butanol "12.48 "4.88 7.15 2.81
Composition and temperature profiles of experimental data and
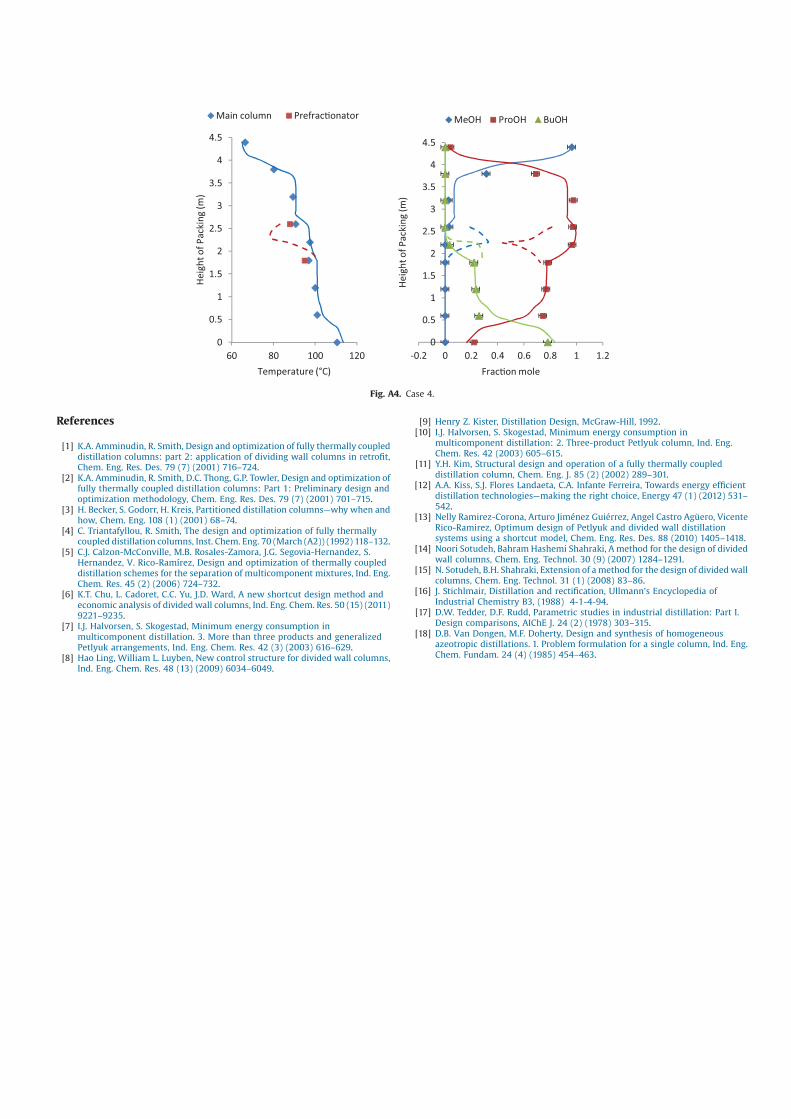
simulation results for ternary mixture Fig. A1–A4 .
0
0.5
1
1.5
2
2.5
3
3.5
4
4.5
60 80 100 120
He
igh
t o
f P
ack
ing
(m
)
Temperature (°C)
Main column PrefracConator
0
0.5
1
1.5
2
2.5
3
3.5
4
4.5
-0.2 0 0.2 0.4 0.6 0.8 1 1.2
He
igh
t o
f P
ack
ing
(m
)
FracCon mole
MeOH ProOH BuOH
Fig. A2. Case 2.
0
0.5
1
1.5
2
2.5
3
3.5
4
4.5
65 85 105 125
He
igh
t o
f P
ack
ing
(m
)
Temperature (°C)
Main column PrefracConator
0
0.5
1
1.5
2
2.5
3
3.5
4
4.5
-0.2 0 0.2 0.4 0.6 0.8 1 1.2
Pa
ckin
g h
eig
h (
m)
FracCon mole
Methanol 1-propanol 1-butanol
Fig. A1. Case 1.
0
0.5
1
1.5
2
2.5
3
3.5
4
4.5
60 80 100 120
He
igh
t o
f P
ack
ing
(m
)
Temperature (°C)
Main column PrefracConator
0
0.5
1
1.5
2
2.5
3
3.5
4
4.5
-0.2 0 0.2 0.4 0.6 0.8 1 1.2
He
igh
t o
f P
ack
ing
(m
)
FracCon mole
MeOH ProOH BuOH
Fig. A3. Case 3.
References
[1] K.A. Amminudin, R. Smith, Design and optimization of fully thermally coupleddistillation columns: part 2: application of dividing wall columns in retrofit,Chem. Eng. Res. Des. 79 (7) (2001) 716–724.
[2] K.A. Amminudin, R. Smith, D.C. Thong, G.P. Towler, Design and optimization offully thermally coupled distillation columns: Part 1: Preliminary design andoptimization methodology, Chem. Eng. Res. Des. 79 (7) (2001) 701–715.
[3] H. Becker, S. Godorr, H. Kreis, Partitioned distillation columns—why when andhow, Chem. Eng. 108 (1) (2001) 68–74.
[4] C. Triantafyllou, R. Smith, The design and optimization of fully thermallycoupled distillation columns, Inst. Chem. Eng. 70 (March (A2)) (1992) 118–132.
[5] C.J. Calzon-McConville, M.B. Rosales-Zamora, J.G. Segovia-Hernandez, S.Hernandez, V. Rico-Ramírez, Design and optimization of thermally coupleddistillation schemes for the separation of multicomponent mixtures, Ind. Eng.Chem. Res. 45 (2) (2006) 724–732.
[6] K.T. Chu, L. Cadoret, C.C. Yu, J.D. Ward, A new shortcut design method andeconomic analysis of divided wall columns, Ind. Eng. Chem. Res. 50 (15) (2011)9221–9235.
[7] I.J. Halvorsen, S. Skogestad, Minimum energy consumption inmulticomponent distillation. 3. More than three products and generalizedPetlyuk arrangements, Ind. Eng. Chem. Res. 42 (3) (2003) 616–629.
[8] Hao Ling, William L. Luyben, New control structure for divided wall columns,Ind. Eng. Chem. Res. 48 (13) (2009) 6034–6049.
[9] Henry Z. Kister, Distillation Design, McGraw-Hill, 1992.[10] I.J. Halvorsen, S. Skogestad, Minimum energy consumption in
multicomponent distillation: 2. Three-product Petlyuk column, Ind. Eng.Chem. Res. 42 (2003) 605–615.
[11] Y.H. Kim, Structural design and operation of a fully thermally coupleddistillation column, Chem. Eng. J. 85 (2) (2002) 289–301.
[12] A.A. Kiss, S.J. Flores Landaeta, C.A. Infante Ferreira, Towards energy efficientdistillation technologies—making the right choice, Energy 47 (1) (2012) 531–542.
[13] Nelly Ramirez-Corona, Arturo Jiménez Guiérrez, Angel Castro Agüero, VicenteRico-Ramirez, Optimum design of Petlyuk and divided wall distillationsystems using a shortcut model, Chem. Eng. Res. Des. 88 (2010) 1405–1418.
[14] Noori Sotudeh, Bahram Hashemi Shahraki, A method for the design of dividedwall columns, Chem. Eng. Technol. 30 (9) (2007) 1284–1291.
[15] N. Sotudeh, B.H. Shahraki, Extension of a method for the design of divided wallcolumns, Chem. Eng. Technol. 31 (1) (2008) 83–86.
[16] J. Stichlmair, Distillation and rectification, Ullmann’s Encyclopedia ofIndustrial Chemistry B3, (1988) 4-1-4-94.
[17] D.W. Tedder, D.F. Rudd, Parametric studies in industrial distillation: Part I.Design comparisons, AIChE J. 24 (2) (1978) 303–315.
[18] D.B. Van Dongen, M.F. Doherty, Design and synthesis of homogeneousazeotropic distillations. 1. Problem formulation for a single column, Ind. Eng.Chem. Fundam. 24 (4) (1985) 454–463.
0
0.5
1
1.5
2
2.5
3
3.5
4
4.5
60 80 100 120
He
igh
t o
f P
ack
ing
(m
)
Temperature (°C)
Main column PrefracConator
0
0.5
1
1.5
2
2.5
3
3.5
4
4.5
-0.2 0 0.2 0.4 0.6 0.8 1 1.2
He
igh
t o
f P
ack
ing
(m
)
FracCon mole
MeOH ProOH BuOH
Fig. A4. Case 4.


![Detection of Fault in Rolling Element Bearing using ... · conditions. Prof. Dr. Zahari Taha, Nguyen Trung Dung[3] did signal analysis of single point defect by finite element analysis.](https://static.fdocuments.us/doc/165x107/602ebe11c426bf28564b0d77/detection-of-fault-in-rolling-element-bearing-using-conditions-prof-dr-zahari.jpg)