TRUE STORY OF A SUCCESSFUL FAÇADE
40
1 - TRUE STORY OF A SUCCESSFUL FAÇADE: Solarban® Glass Powering KOI Tower TRUE STORY OF A SUCCESSFUL FAÇADE: Solarban ® Glass Powering KOI Tower A Proven Case of Savings, Comfort and Aesthetics
Transcript of TRUE STORY OF A SUCCESSFUL FAÇADE

1 - TRUE STORY OF A SUCCESSFUL FAÇADE: Solarban® Glass Powering KOI Tower
TRUE STORY OF A SUCCESSFUL FAÇADE:
Solarban® Glass Powering KOI Tower
A Proven Case of Savings, Comfort and Aesthetics

Table of Contents
Executive Summary ......................................................................................................................................................................... 1
Infographic ...................................................................................................................................................................................... 4
1. Evolution: A True Case of Savings ................................................................................................................................................ 5
2. KOI Tower: A Flagship Vertical City ....................................................................................................................................................... 6
1.1 Local Climate of the Case Study .................................................................................................................................... 7
1.2 Key Factors for a High-Performance Building ............................................................................................................... 8
1.3 Technical Characteristics of Glass Systems ............................................................................................................ 10
1.4 Methodology ........................................................................................................................................................ 11
1.5 Comparison of Glass Systems ............................................................................................................................... 12
3.Finance & Profitability ................................................................................................................................................................... 13
3.1 Initial Investment Costs ........................................................................................................................................ 14
3.2 Operating Costs ................................................................................................................................................... 15
4. Occupant Comfort Level ................................................................................................................................................................. 18
4.1 Thermal Comfort: Heat Gain Control ................................................................................................................... 22
4.2 Luminous Comfort: Glare Control ........................................................................................................................ 22
5. How Much Energy Does a Vertical Architectural Glass City Consume? ....................................................................................... 28
5.1 Consumption Percentage by Type of Use .............................................................................................................. 29
5.2 Reduction of CO2 Emissions to the Environment .................................................................................................. 29
6. Conclusions .................................................................................................................................................................................. 31
Annex 1: Climate Zones in Mexico ................................................................................................................................................. 34
Annex 2: Thermal Comfort Analysis ................................................................................................................................................ 36

3 - TRUE STORY OF A SUCCESSFUL FAÇADE: Solarban® Glass Powering KOI Tower
Economic Profitability
Energy Efficiency
User comfort
Executive Summary
TRUE STORY OF A SUCCESSFUL FAÇADE: Solarban® Glass Powering KOI Tower
A Proven Case of Savings, Comfort and Aesthetics
With a track record of over 100 years of experience in innovation and continuous improvement processes, we at Vitro Architectural Glass challenge ourselves to break paradigms and demystify the belief that selecting a high-performance glass makes initial investment costs rise and extends the return-on-investment process.
In 2020 we selected Three Consultoría Medioambiental, a firm dedicated to energy efficiency and sustainability consulting, to analyze the economic and energy impact of the case study for KOI Tower, located in the Metropolitan Area of Monterrey, Nuevo León. We also had the support of Internacional de Inversiones (IDEI) to provide us with information and costs of the tower, along with its energy consumption.
What makes this case study different? We present information of the actual energy consumption of the project, its annual operating costs and the initial investment costs in order to obtain the tangible savings of the project, as well as a calculation of the return on investment (ROI).
In addition, we analyze in depth the comfort level of its inhabitants from a thermal and lighting point of view.
To achieve the above, we compare the current condition of the tower to the variations that would have occurred if another type of glass had been selected for its façade.
The objective of the study is to make clear the impact of good decision making on the glazing system: measurable, real and immediate savings for the investor, in addition to constant long-term benefits for the users.
About KOI Tower The façade of KOI Tower is composed mainly of our Solarban® R100 Optiblue® glass double glazing, so its thermal and optical characteristics are fundamental to the achievement of the building's efficiency and high-performance objectives.
In the analysis process, we considered three aspects:
With the KOI Tower success story, we intend to show that a higher initial investment is not necessary to have a high-performance sustainable building.

4 - TRUE STORY OF A SUCCESSFUL FAÇADE: Solarban® Glass Powering KOI Tower
Immediate Return on Investment (ROI)
Thermal Comfort
Solarban® R100
Savings of $362,000 from the first minute
Optiblue® glass provides thermal comfort for building users 90% of the time the space is occupied throughout the year.
28% reduction in HVAC equipment
Lighting Comfort
capacity compared to a 12mm monolithic 13% decrease of glare clear glass system, due to the high areas compared to performance of the installed glass. 12mm clear glass.
Impact on Annual Operating Costs
Savings of more than
Emission Reduction
$595,000 per year
in HVAC operating costs. More than 1,833 tCO2e/year
were reduced.
Considering 40 years as the average lifespan
Over the lifespan of the building, a total of
of the building, only in operational savings, 73,355 tCO2e will be reduced, which would be this glass avoids an expense of more than equivalent to removing 36,979 vehicles from $24 million! circulation.
The study also includes a comparison with other types of glass systems known in the market to provide a detailed analysis of the benefits provided by the different options.
Monolithic Clear 12 $10,723,669 $2,028,656 74% 38% 6,022 Double Clear + Clear 25 $10,750,828 $1,757,606 78% 37% 5,258
Double Solargray® + Clear 25 $9,932,227 $1,627,780 81% 31% 4,831
Double Solarban® 60 + Clear 25 $10,262,700 $1,517,119 86% 33% 4,512
Double Solarban® R100 Optiblue® + Clear
25 $10,357,839 $1,409,568 90% 25% 4,188
We hope that after reading our study you will feel confident when using high-performance glass for the façade of your next project, knowing it will give you savings from the moment you specify the glass and throughout the life cycle of the building.
Glass Type
Product
Thickness
(mm)
Initial Investment
Cost: Glass & HVAC System (USD)
Emissions (Tons of
CO2e/year)
Don't miss out on the benefits – unleash the potential of your project with Solarban® glass!
Annual
Operating Cost (USD)
Percentage of
Hours in Thermal Comfort
Percentage of
Area with Glare

5 - TRUE STORY OF A SUCCESSFUL FAÇADE: Solarban® Glass Powering KOI Tower
Immediate Return on Investment (ROI):
Savings of $360,000 in initial investment cost
(Compared to 12 mm clear glass)
Savings in annual operating costs of $589,880 à $25.5 Million
over the life of the building*.
Increased thermal comfort by 15.7% and reduced glare by 13.7%
Mitigation of 73,355 tCO2e over the lifespan of the building*
(Equivalent to removing 36,979 vehicles from circulation)
28% reduction in tons of cooling for HVAC equipment
Solarban® R100
Optiblue® Glass +
Clear Glass
VLT: 30%
SHGC: 0.20
U-Value: 0.29
The selection of the right architectural glass provides significant improvements for both people and the environment, in addition to reducing initial investment and annual operating costs.
The success case of KOI Tower demonstrated the following tangible benefits of selecting the Solarban® R100 Optiblue® glass system versus the baseline 12mm monolithic clear glass.
TRUE STORY OF A SUCCESSFUL FAÇADE:
Solarban® Glass Powering KOI Tower
A Proven Case of Savings, Comfort and Aesthetics
Economic Profitability
Benefits of Solarban® R100 Optiblue® + Clear Glass
Energy Efficiency
User Comfort

6 - TRUE STORY OF A SUCCESSFUL FAÇADE: Solarban® Glass Powering KOI Tower
Immediate Return on Investment (ROI):

7 - TRUE STORY OF A SUCCESSFUL FAÇADE: Solarban® Glass Powering KOI Tower
1. Evolution: A True Case of Savings
What’s the first thing that comes to mind when you think of a sustainable, energy-saving building? Other than its benefits and aesthetics, you probably think sustainable buildings will be considerably more complex and require very expensive technologies.
Real information on energy consumption (electricity costs), mechanical equipment costs (HVAC) and glazing types, as well as the comfort level of its occupants were used to obtain quantitative conclusions and monetize the benefits obtained thanks to a good selection of glass by the developer and architect.
Therefore, KOI Tower was selected for this Study. In addition to serving as an emblematic
We hope that after reading our study, you will feel confident in using high-performance glass for the façade of your next project, knowing it will provide savings from the moment of selection and throughout the life of the building.
This case study is an evolution of the publication “Low-E Architectural Glass and Solar Control: Energy, Economic and Environmental Benefits”, which was published by Vitro in 2019.
Unlike the previous report that used energy modeling in different cities in Mexico to calculate savings in initial investment and operating costs in a simulated building, this report focuses on studying and presenting the real and tangible benefits in economic profitability, energy efficiency and user comfort in a real building operating for more than three years.
building in the metropolitan area of Monterrey, it is one of the tallest buildings in Latin America. Its architectural facades are coated with our Solarban® R100 Optiblue® low-emissivity, high- performance glass.
At Vitro Architectural Glass, we challenge ourselves to break paradigms and demystify the belief that when selecting a high-performance glass, the initial investment costs rise, and it takes a long time to recover the return on investment.

8 - TRUE STORY OF A SUCCESSFUL FAÇADE: Solarban® Glass Powering KOI Tower
Image 1. Thermal and optical properties of the glass in the project.
2. KOI Tower: An Emblematic Vertical City
KOI Tower is the second-tallest building in Mexico.
RESIDENTIAL 36,000 m2 of sellable space on 37 floors
COMMERCIAL 55,400 m2 of leasable space on 27 floors
After a thorough selection process, the decision was made to specify and install a high-performance double-glazing system featuring Solarban® R100 Optiblue® glass by Vitro Architectural Glass.
For this analysis, the technical properties as shown in Image 1 were considered. These in turn allow the benefits of the Solarban® R100 Optiblue® glass system to be realized, in terms of reduced energy consumption, savings in initial investment and operating costs, thermal comfort and natural lighting. In addition, this double-glazing system (also known as insulated glass) solves the structural challenge posed by the impact of wind speed in tall buildings such as KOI.
At 279.5 meters tall, the skyscraper is considered mixed-use as it is comprised of offices and apartments.
It has been in operation since 2017 and has been recognized as an exemplary building by receiving the LEED® C&S1 v2009 Silver Level certification in 2018.
1 LEED: Leadership in Energy and Environmental Design Core and Envelope Certification. | LEED® and its related logo are trademarks owned by the U.S. Green Building Council® and are used with permission.
KOI Tower
SOLARBAN® R100 OPTIBLUE® + CLEAR Glass
VLT: 30%
SHGC: 0.20
U Value: 0.29
In the design of the building, 100% of the total façade is covered with architectural glass, so the choice of glass was of utmost importance and contribution to the building.

9 - TRUE STORY OF A SUCCESSFUL FAÇADE: Solarban® Glass Powering KOI Tower
2.1 Local Climate of the Case Study
According to the ASHRAE 90.12 standard, the Monterrey Metropolitan Area (ZMM) belongs to a 2B climate zone.
The predominant climate in the ZMM, of which San Pedro Garza Garcia is part, is "dry, hot and extreme", with irregular rainfall in late summer. The average temperature is above 71ºF with oscillations between 44.6ºF and 57.2ºF, and there is also midsummer heat.
These conditions usually require the implementation of cooling and heating systems (HVAC) to achieve thermal comfort.
The use of these systems translates directly into energy consumption; therefore, the search for strategies to reduce such consumption is crucial to achieve the best performance of buildings.
*For more information on Mexico's climates, please refer to Annex
1 of this document.
Image 2. Monterrey Climate Zone (Monterrey Metropolitan Area)
2 ASHRAE (American Society of Heating, Refrigerating and Air-Conditioning Engineers) 90.1: International Energy Efficiency Standard on Energy
Requirements for Buildings Except Low-Rise Residential Buildings, which is used as a reference for LEED certification.
Monterrey 2B Climate Zone Dry, hot and extreme weather
113°F Maximum Temp.
71.6°F 28.4°F Mean Temp. Min. Temp.

10 - TRUE STORY OF A SUCCESSFUL FAÇADE: Solarban® Glass Powering KOI Tower
2.2 Key Factors for a High-Performance Building
The selection of appropriate materials for a project should consider the following factors:
A building envelope is made of the elements that separate the interior environment from the exterior: walls, roofs, floors, windows, skylights, etc. A good design of the envelope and the proper selection of materials can impact the heat gain in a project, affecting comfort and energy consumption.
In the case of KOI Tower, glass is the predominant element of the envelope and plays an essential
role in determining the heat gains of the building. Therefore, its performance was evaluated according to the three factors mentioned above, as they determine the energy performance of the building and the quality of life of the people who live in it.
Regarding economic profitability, we found two important elements:
Economic Profitability
Initial Investment Costs Operating Costs
Directly related to the reduction in the need for equipment for the cooling and heating system (HVAC) as a result of having an envelope with high thermal efficiency materials.
Related to economic savings, due to a decrease in energy consumption, reflected in a lower monthly electricity bill.
Efficiency
Comfort

11 - TRUE STORY OF A SUCCESSFUL FAÇADE: Solarban® Glass Powering KOI Tower
Energy efficiency is directly related to economic profitability and environmental impact. With the correct selection of materials for the building envelope, it is possible to reduce electrical energy consumption from the source and
Therefore, reduce greenhouse gas (GHG) emissions to the environment, thanks to a lower consumption of heating and cooling systems needed to provide thermal comfort inside the building.
The glazed system influences user comfort in three main factors3:
Acoustic Comfort The overall level of satisfaction of an occupant in a given environment caused by sound or noise produced inside or coming from the outside.
Luminous and Radiant Light Comfort How natural light is perceived by sight, where lighting conditions such as levels, uniformity, color and radiation diffusion play an important role in achieving the comfort necessary to perform the activity intended for the interior space.
Thermal Comfort and Thermal Radiation When the occupants of a given interior space do not feel cold or hot: factors such as temperature, air and humidity are ideal for carrying out the activity intended for the space.
3 Although double glazing such as that used in KOI Tower improves acoustic comfort, for the purposes of this study this factor is not analyzed. Should
you require specific information on this subject for any project, please contact Vitro Architectural Glass.

12 - TRUE STORY OF A SUCCESSFUL FAÇADE: Solarban® Glass Powering KOI Tower
2.3 Technical Characteristics of Glass Systems The aspects to consider during the selection of glass for the project, which directly affect the comfort of the spaces and energy consumption, include the following:
VLT4 (Visible Light
Transmission):
Refers to the amount of light that a glazing system allows to enter the interior space in proportion to what the human eye can perceive. The range is from 0 to 1, where the higher the value, the more visible light enters the interior space.
Double Glazing5 Solarban® R100 Optiblue® + Clear Glass 6mm
Exterior Interior
Low-E Glass Surface #2
Image 3. Thermal and optical properties of glass
SHGC6
(Solar Heat Gain Coefficient):
U-Value
(Overall Heat Transfer Coefficient):
Determines the ability of a glazing system to reject the amount of solar radiation entering the interior space. It has a range from 0 to 1, where the lower the value, the less heat will pass into the interior.
A characteristic that determines the amount of energy that a material can transmit from an exterior space to the interior and vice versa. The lower the U-value, the better the insulation provided by this material. In this study, the winter air values are considered.
4 VLT: Visible Light Transmission
5 25 mm (1 inch) double glazing (UD) with 13 mm (1/2 inch) intermediate air space and two 6 mm (1/4 inch) monolithic glass. 6 SHGC: Solar Heat Gain Coefficient
SHGC 20%
VLT 30%

13 - TRUE STORY OF A SUCCESSFUL FAÇADE: Solarban® Glass Powering KOI Tower
2.4 Methodology
In December 2020, Vitro Architectural Glass commissioned Three Consultoría Medioambiental, based in Monterrey, to study the economic, social and environmental impact of the Solarban® R100 Optiblue® glass selected for the KOI Tower case study, compared to four other glass systems.
Aluminum was considered in all five scenarios for window and door frames, as it is the framing material most commonly used in Mexico.
For the purposes of this study, two specialized software were used:
These were used to calibrate an energy simulation that allowed calculating the different energy consumptions that would have been generated in the building in case of using different glass in the façade.
Thermal comfort was analyzed using the Comfort Zone Analytical Method described in ASHRAE 558 Standard. This methodology considers the six components of thermal comfort and the effect of direct solar radiation on occupants to simulate how people would respond if they were asked whether they were hot or cold.
Level 60
Level 51
Level 47
The analysis was carried out taking into consideration the two types of use of the building: commercial and residential, as well as the different floors of the building in each of the levels as presented in Image 4.
To determine the annual energy savings of the case study, the company Internacional de Inversiones (IDEI), developer of KOI Tower, kindly and voluntarily shared the required information, including actual records from one year of energy consumption (electricity bills).
Level 17
Ground Floor
Commercial
Residential
Level 25
Image 4. Architectural elevation case study Torre KOI
7 IESVE - Integrated Environmental Solutions Virtual Environment.
8 ANSI/ASHRAE Standard 55-2017 - Standard for Thermal Environmental Conditions
for Human Occupancy, which is used as a reference for LEED certification.
The Trace 700 software to evaluate energy consumption.
The IESVE7 program to evaluate thermal comfort, natural lighting and solar radiation.

12 - TRUE STORY OF A SUCCESSFUL FAÇADE: Solarban® Glass Powering KOI Tower
VLT: 30% VLT: 30%
2.5 Comparison of Glass Systems
Table 1 shows the five glass systems that are part of this analysis along with their physical, thermal and optical characteristics, in order to compare the performance of each of these in the same architectural and climatic conditions.
Table 1. Glass systems to be analyzed with their physical, optical and thermal properties.
Monolithic Clear 12 83% 5.60 0.72
Double Clear + Clear 25 78% 2.69 0.70
Double Solargray® + Clear 25 40% 2.69 0.46
Double Solarban® 60 Clear + Clear 25 70% 1.65 0.39
Double Solarban® R100 Optiblue® + Clear 25 30% 1.65 0.20
Glass Type
Product
U Value
(W/m2*K)
SHGC
Thickness
(mm)
VLT %

13 - TRUE STORY OF A SUCCESSFUL FAÇADE: Solarban® Glass Powering KOI Tower
3. Finance & Profitability
In this section we will analyze from a financial point of view why Solarban® R100 Optiblue® glass was the best decision for KOI Tower.
To obtain the profitability of each of the options considered, the initial return on investment of the case study was analyzed by comparing the initial investment costs:
Cost of Glass
Window Frames
HVAC
The selection of the Solarban® R100 Optiblue® glass system resulted in a reduction in the need for the cooling and heating capacity required to achieve comfort; resulting in considerable and immediate savings for the developer by reducing the investment in mechanical equipment capacity, duct sizes, electrical installations that supply power to the systems; labor during installation; and subsequently, in the energy bills of tenants and users.
We will break the paradigm that by selecting low-emissivity (low-e) and solar control glass, which has a much higher performance than traditional clear glass, our project will automatically become more expensive or even unfeasible.
The evidence collected with this study demonstrates that it is possible to have a high-performing glazing system and recover your investment immediately, in addition to enjoying the constant savings and qualitative benefits (comfort) that this type of glass provides.

14 - TRUE STORY OF A SUCCESSFUL FAÇADE: Solarban® Glass Powering KOI Tower
3.1 Initial Investment Costs
Five glass systems were compared, including the one installed in KOI Tower, versus a baseline of 12mm monolithic clear glass. The latter is the most basic system that could be used for this type of building considering structural issues, architectural design and wind loads.
The costs involved in each type of glazing were considered, which is composed of the sum of the cost of the type of glass (including window frames) and the cost of the air conditioning (which depends on the tons of cooling required).
Table 2. Initial investment cost per glass and HVAC system.
Monolithic Clear 12 $8,653,312 $2,071,643 $10,728,147 $0.00
Double Clear + Clear 25 $8,112,569 $2,642,225 $10,758,702 -$30,250
Double Solargray® + Clear 25 $7,144,910 $2,790,943 $9,939,502 $788,795
Double Solarban® 60 Clear + Clear 25 $6,781,543 $3,484,961 $10,270,256 $458,106
Double Solarban® R100 Optiblue® + Clear 25 $6,242,192 $4,119,960 $10,365,797 $362,915
9 The estimated cost of $2,997 per ton of cooling installed was provided by the contractor who installed the HVAC system at KOI
Tower. The equipment used is water-cooled VRF with closed- loop
cooling towers. The tons of cooling required for each glass system
are referenced in Graph 4. The façade area considered in the
energy modeling was 29,262 m2.
10 The estimated cost of each glass system considers the glass and
framing.
11 The capital cost estimates for both the glass and HVAC systems were
calculated using current 2020/2021 costs.
Glass Type
Product
Thickness
(mm)
Total Cost in
Tons of Cooling (USD)
Total Cost Facade:
Glass + Framing (USD)10
Total Initial
Investment Cost: Glass & HVAC
System (USD)11
Initial
Investment Cost Savings
(USD)

15 - TRUE STORY OF A SUCCESSFUL FAÇADE: Solarban® Glass Powering KOI Tower
$249
$0.78
$0.45
$0.36
$199
$149
$99
$49
Clear 12 mm Clear + Clear Solargray® + Clear
Solarban® 60 Clear + Clear
Solarban® R100 Optiblue® + Clear
Initial Investment Cost Savings (Millions USD)
Total Facade Cost: Glass + Window Frames (Millions USD)
Total Cost in Tons of Cooling (Millions USD)
Graph 1. Initial Investment Costs per Glass System and corresponding HVAC System
Table 2 and Graph 1 summarize the reduction in initial investment costs due to the implementation of efficient glass systems. If KOI Tower had installed a 12mm12 monolithic clear system, the investor would have lost more than
$347, 050 (2020 current costs) since the initial investment compared to selecting the high thermal performance Solarban® R100 Optiblue® glass system.
In addition, a translucent envelope allows natural daylight to enter, helping to reduce the
hours of operation of the electric lighting systems, generating an additional economic benefit during the operation of the building.
In addition to the large initial investment savings, we must remember that, during the operation stage, air conditioning equipment of lower capacity will consume less energy and will be needed for fewer hours per year to provide thermal comfort to users. This allows for economic savings in operating costs and reduction of greenhouse gas (GHG) emissions throughout the life of the building.
12 Due to wind loads, glass specifications should be a minimum of 12mm Clear monolithic glass.
Mill
ions
USD
$2
$2.6
$3.4
$4
$2.7
$8.5
$8
-$0.30
$7
$6.7
$6

16 - TRUE STORY OF A SUCCESSFUL FAÇADE: Solarban® Glass Powering KOI Tower
3.2 Operating Costs Table 3. Annual operating costs per glass system.
Monolithic Clear 12 $2,007,848 $0.00 $0.00
Double Clear + Clear 25 $1,739,544 $268,221 $10,738,227
Double Solargray® + Clear 25 $1,611,052 $396,677 $15,876,395
Double Solarban® 60 Clear + Clear 25 $1,501,008 $506,511 $20,258,965
Double Solarban® R100 Optiblue® + Clear 25 $1,394,774 $612,913 $24,525,433
Table 3 shows how the annual operating costs are directly related to the thermal properties (U- value and SHGC) of the glass system, where the low solar heat gain value (SHGC) of Solarban® R100 Optiblue® glass results in large savings. Similarly, we can see that without Solarban® R100 Optiblue® glass, the building operator could have lost over
traditional glass system (12mm monolithic clear) had been installed, in terms of operating costs.
As shown in Table 4, the return on investment (ROI) of Solarban® R100 Optiblue® glass is immediate, in addition to all the operational savings that are generated as a direct gain for the operator. This results in savings of more than
$620,000 $24.8 Million per year that would have been required if a over the lifespan of the building (40 years).
$2.1
$1.9
$1.7
$1.4
$2
$29.1
$24.3
$19.4
$1.
$0.9
$0.7
$14.5
$9.7
$0.4 $0.2
$4.8
Clear 12 mm Clear + Clear Solargray® + Clear Solarban® 60
Clear + Clear
Solarban® R100 Optiblue® + Clear
Estimated annual operating cost (Millions UDS)
Savings in operating costs over the lifespan of the project (Millions USD)
Graph 2. Annual operating costs per glass system.
Glass Type
Product
Thickness
(mm)
Estimated Annual
Operating Cost (USD)
Mill
ions
USD
Mill
ions
USD
Estimated Annual
Operating Cost Savings (USD)
Project Lifecycle Operating Cost Savings (USD)

17 - TRUE STORY OF A SUCCESSFUL FAÇADE: Solarban® Glass Powering KOI Tower
Table 4. Initial Return on Investment (ROI).
Monolithic Clear 12 $10,612,156 $0.00 N.A.
Double Clear + Clear 25 $10,642,077 $0.00 $268,838
Double Solargray® + Clear 25 $9,831,756 $780,525 $397,041
Double Solarban® 60 Clear + Clear 25 $10,158,926 $453,303 $506,976
Double Solarban® R100 Optiblue® + Clear 25 $10,254,671 $359,105 $613,475
As shown in Table 4 and Graph 2, the Solarban® R100 Optiblue® glass system provides an immediate ROI by obtaining economic savings since the initial investment (3.4%) and subsequently in annual operating costs (30.5%) compared to 12mm clear glass.
In addition, Solarban® R100 Optiblue® glass significantly reduces environmental impacts throughout the life of the project, as will be shown later in the section "Reduction of CO2 emissions to the environment".
13 The re-estimation of the initial costs for both the glass and HVAC systems were calculated with current 2020/2021 costs.
Glass Type
Product
Thickness
(mm)
Total Initial Investment Cost of Glass & HVAC
System (USD)13
Initial Cost Savings: Glass &
HVAC System (USD)
Annual Operating
Cost Savings (USD)

18 - TRUE STORY OF A SUCCESSFUL FAÇADE: Solarban® Glass Powering KOI Tower
4. Occupant Comfort Level
In this section, we will understand why the more often our glass is specified for the climate where our project is located, and according to the needs of the building, the lower our energy consumption will be.
There is a direct relationship between the following three elements: thermal loads,
desired level of interior comfort for users and the necessary capacity of the air conditioning systems.
In addition, we will analyze the glare control that Solarban® R100 Optiblue® glass can offer, which has a direct impact on the level of lighting comfort for the building's users.
Image 5. Visual representation of the thermal loads of a space.
Thermal Loads
What are they? Thermal loads are the energy (heat) gains or losses of a space and are mainly generated by the building envelope, as shown in Image 5. However, other aspects of the building, such as artificial lighting, household appliances and electronic devices, as well as the number of people and the activities they perform within the space also generate heat.
Direct Radiation
People
Natural Convection
Conduction Diffuse Radiation
Thermal Mass Devices

19 - TRUE STORY OF A SUCCESSFUL FAÇADE: Solarban® Glass Powering KOI Tower
What does the HVAC system have to do with the building's energy consumption?
As mentioned in the previous section, thermal loads determine the size of the heating, ventilation and air conditioning (HVAC) systems. The more heat the building absorbs, the more tons of cooling will be required to maintain a comfortable indoor temperature. As a result, the capacity of this HVAC equipment will define the energy consumption of this system during the operation of the building, which can be at least the next 40 years of life of the building.
What role does glass play in reducing thermal loads?
Image 6 shows the thermal loads of a typical level. In this case we take the 60th floor in KOI Tower, where the glazing system plays a transcendental role.
12mm clear monolithic Solarban® R100 Optiblue®
2% Partitions
Glass (Radiation and conduction)
Partitions
People
Walls
Lighting
Miscellaneous
Glass (Radiation and conduction)
Partitions
People
Walls
Lighting
Miscellaneous
Image 6. Thermal load distribution on Level 60 (KOI Tower) with 12mm monolithic Clear glass vs. Solarban® R100 Optiblue®.
Our baseline, the 12mm monolithic clear glass system, shows that 76% of the total floor thermal load enters through the glass façade. On the other hand, in the case of Solarban® R100 Optiblue® glass, only 49% of the heat gain enters through the glass.
In other words, a 27-percentage point reduction in solar gain is achieved by selecting low-e glass.
1% Walls
76% Glass (Radiation and conduction)
6% Lighting 7% People 8% Miscellaneous

20 - TRUE STORY OF A SUCCESSFUL FAÇADE: Solarban® Glass Powering KOI Tower
5.60
252,533
174,040 142,984
2.69 2.69
89,846
1.65
0.70 0.46 0.39 0.20
0.72
1.65
As we can see, selecting a high thermal efficiency glass system has important consequences on the heat gain of the building. Table 5 shows a comparison of the five glazing systems, showing the amount of heat that enters the building through conduction and radiation.
Table 5. Results of thermal loads based on the thermal properties of the glass system at a typical level (Level 60).
Monolithic Clear 12 5.60 0.72 74,486 226,554 301,040 0%
Double Clear + Clear 25 2.69 0.70 41,090 211,443 252,533 16%
Double Solargray® + Clear 25 2.69 0.46 41,090 132,951 174,040 42%
Double Solarban® 60 Clear + Clear 25 1.65 0.39 29,117 113,867 142,984 53%
Double Solarban® R100 Optiblue® + Clear 25 1.65 0.20 29,117 60,729 89,846 70%
We can conclude that our Solarban® R100 Optiblue® glass helps to reduce up to 70% of the heat input through the windows, equivalent to approximately 28% of the required capacity of the air conditioning system - see Graph 3. This results in annual energy (monetary) savings equivalent to 31% compared to clear 12 mm glass (see Table 3).
350,000
300,000
250,000
200,000
150,000
100,000
50,000
301,040 6
5
4
3
2
1
0 Clear 12 mm Clear + Clear Solargray® + Clear Solarban® 60
Clear + Clear
0 Solarban® R100
Optiblue® + Clear
Thermal loads per glass (Btu/h)
U-Value (W/m2*K)
SHGC
Graph 3. Thermal loads per glass based on its thermal properties
14 This percentage only includes the thermal loads of the glass (conduction and radiation), because the thermal loads per ceiling, wall and internal (lighting, miscellaneous and people) are the same in the five scenarios analyzed. It should be remembered that the tons of cooling are calculated with all internal and external loads.
Thermal Properties Thermal Loads Glass Type Product Thickness
(mm) U-Value (W/m2*K)
SHGC Conduction Radiation (Btu/h) (Btu/h)
Totals (Btu/h)
Btu/
h
U-Va
lue
(W/m
2*K)
/ S
HGC
Percentage Decrease in
Thermal Loads14

21 - TRUE STORY OF A SUCCESSFUL FAÇADE: Solarban® Glass Powering KOI Tower
South and West Facade North and East Facade
Image 7. Solar incidence (heat) on facades of Torre KOI
3,500
3,0 00
2,500
2,000
1,500
1,000
500
30.0%
25.0%
20.0%
15.0%
10.0 %
5.0%
0 Clear 12 mm Clear + Clear Solargray® + Clear Solarban® 60 Clear
+ Clear
Solarban® R100 Optiblue® + Clear
0.0%
Cooling Required (Tons)
Percentage Reduction in Cooling Required (Tons)
Graph 4. Cooling required (Tons) per glass system to provide comfort to building users, based on ASHRAE 55.
Graph 4 shows the tons of cooling required for the building are directly related to the thermal characteristics of the glass. The lower the U-Value and SHGC, the higher the savings. By installing Solarban® R100 Optiblue® glass
managed to reduce
804.2 tons of cooling
which represents savings of more than
$2.3 Million15 in air-conditioning system, achieving an enormous savings on the initial investment cost of the project.
15 An estimated cost of $2,967 per ton of cooling installed was considered. This cost was provided by the contractor who installed the HVAC system for KOI Tower.
Tons
22 - TRUE STORY OF A SUCCESSFUL FAÇADE: Solarban® Glass Powering KOI Tower
4.1 Thermal Comfort: Heat Gain Control
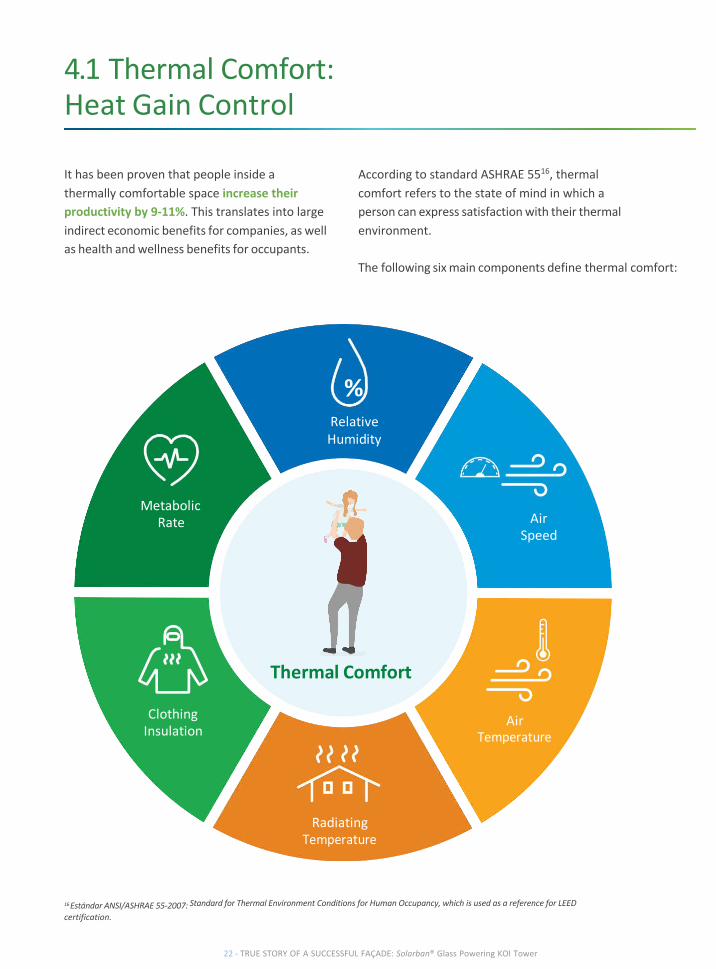
It has been proven that people inside a thermally comfortable space increase their productivity by 9-11%. This translates into large indirect economic benefits for companies, as well as health and wellness benefits for occupants.
According to standard ASHRAE 5516, thermal comfort refers to the state of mind in which a person can express satisfaction with their thermal environment.
The following six main components define thermal comfort:
16 Estándar ANSI/ASHRAE 55-2007: Standard for Thermal Environment Conditions for Human Occupancy, which is used as a reference for LEED certification.
% Relative Humidity
Metabolic Rate Air
Speed
Thermal Comfort
Clothing Insulation
Air
Radiating

23 - TRUE STORY OF A SUCCESSFUL FAÇADE: Solarban® Glass Powering KOI Tower
In this case study, we compared the five different glass systems to evaluate the percentage of hours the spaces are at a comfortable temperature for their users without the need to use air conditioning equipment.
Table 6. Thermal Comfort
Monolithic Clear 12 5.60 0.72 74% 338,571
Double Clear + Clear 25 2.69 0.70 78% 254,721
Double Solargray® + Clear 25 2.66 0.46 81% 176,228
Double Solarban® 60 Clear + Clear 25 1.65 0.39 86% 145,172
Double Solarban® R100 Optiblue® + Clear 25 1.65 0.20 90% 92,034
As can be seen in Table 6, Solarban® R100 Optiblue® glass provides 15.7% more hours of thermal comfort for building occupants compared to our baseline 12mm clear monolithic glass. This demonstrates that the higher the SHGC and U-Value values, the lower the percentage of hours occupants are in thermal comfort without the support of air conditioning systems.
12mm Clear Glass Solarban® R100 Optiblue® Glass
Temperature 68.07 70.73 73.38 76.02 78.67 81.33 83.98 86.63 89.29 91.94 94.58 97.23 °F
Image 8. Interior temperatures of a space based on the glass system
In Image 8 we can observe the behavior of temperatures in a similar space with two different glass systems: 12mm clear monolithic and Solarban® R100 Optiblue® glass. On the right, we can observe a temperature decrease of 39.2°F, which translates into lower energy consumption to condition the spaces, and therefore in a reduction of the costs of operation of the building.
The thermal comfort of a space is directly related to the U-value and SHGC characteristics of the glass. This is especially relevant in warm climatic zones, as is the case in the Monterrey Metropolitan Area, where the case study is located.
Glass Type Product
Thickness (mm)
U Value (W/m2*K) SHGC
Percentage of Thermal Loads Hours in Per Envelope
Thermal Comfort (BTU/h)

24 - TRUE STORY OF A SUCCESSFUL FAÇADE: Solarban® Glass Powering KOI Tower
Solar Gain (Btu/h)
15000 14000 13000 12000 11000 10000 9000 8000 7000 6000 5000 4000 3000 2000 1000 0
Solarban® R100 Optiblue® Glass
Image 9. Solar gain per glass system (level 60).
Image 9 shows the northeast façade of Level 60 of the building, with solar incidence (heat gain17) at 9:30 a.m. on March 2118. The colors indicate the heat gains of spaces: the redder it gets, the greater the heat gain.
In these results, it is important to note that a low SHGC value, such as that of Solarban® 60 glass and Solarban® R100 Optiblue® glass helps to control solar gains into the building. The use of low-e glass such as Solarban® glass increases the thermal comfort of building users, while lowering the initial investment cost by reducing the capacity of HVAC equipment and saving on operating costs by reducing monthly electricity costs.
17 Solar gain is the solar radiation (heat) absorbed by glass and transferred to spaces. This value is affected by external conditions and the properties of
the installed glass and can be expressed in Btu per hour.
18 It is the spring equinox, and the sun is over the Equator, this whole day was used as a reference point for the study.
Clear 12 mm

25 - TRUE STORY OF A SUCCESSFUL FAÇADE: Solarban® Glass Powering KOI Tower
4.2 Lighting Comfort: Glare Control
Naturally lit spaces offer direct benefits to the health and well-being of occupants, improving the functioning of the organism, increasing their productivity19 and allowing the connection of the inhabitants with the outside, reinforcing their circadian rhythms.
Natural Light
According to the National Institute of General Medical Sciences (NIGMS20), the circadian rhythm is composed of physical, mental, and behavioral changes that follow a 24-hour cycle. These natural processes respond primarily to light and dark and influence the quality of sleep and physiochemical processes in the body that are necessary for health.
Did You Know? Solar radiation has two important properties:
People who have access to natural light can sleep on average 46 minutes longer each night, improving their health and increasing their well-being.
It is important for our health to obtain natural lighting in interior spaces. However, we must keep in mind other factors during glass selection such as thermal performance and glare in spaces to ensure lighting comfort.
19 Occupant Productivity and Indoor Environment Quality: A case study of the Global Sustainability Assessment System (GSAS).
20 NIGMS: National Institute of General Medical Science
Thermal energy (heat): The amount of energy obtained from solar radiation and the most common unit of measurement is Btu/h.
Light: It is the amount of illumination obtained from the sun, its unit of measurement is Lux.

26 - TRUE STORY OF A SUCCESSFUL FAÇADE: Solarban® Glass Powering KOI Tower
Glare can cause an undesirable effect on building users. This term refers to the brightness that occurs when light strikes a surface directly, and it can be distracting to the eye due to excessive light. The optical property of glass that is related to this phenomenon is the percentage of Visible Light Transmission (VLT), where a lower value will reduce the possibility of glare in spaces.
To compare the glare control performance of the glasses, a level 17 analysis was performed. This analysis shows the percentage of regularly occupied areas (space where one or more persons spend at least one hour a day) with glare.
According to the LEED BD+C v4 guide, it is considered that from lighting levels equal to or
greater than 1,000 Lux, there is a high probability of glare, so it is recommended to reduce the hours of the year where this level is exceeded.

27 - TRUE STORY OF A SUCCESSFUL FAÇADE: Solarban® Glass Powering KOI Tower
Table 7. Percentage of area with glare as a function of VLT.
Monolithic Clear 12 83% 38%
Double Clear + Clear 25 78% 37%
Double Solargray® + Clear 25 40% 31%
Double Solarban® 60 Clear + Clear 25 70% 33%
Double Solarban® R100 Optiblue® + Clear 25 30% 25%
Table 7 shows how glass systems with low VLT values have a lower percentage of glare area, which is equivalent to spaces with greater lighting comfort for users.
Solarban® R100 Optiblue® glass is the glass that provides the best performance in glare control. ® As can be seen in Image 10, Solarban® R100 Optiblue® glass is the best option for reducing glare inside the building, which, in some cases, can avoid the use of interior blinds, resulting in savings in materials, a more homogeneous façade from the outside and better use of the views to the outside.
Solarban® R100 Optiblue® + Clear VLT= 30%
3120
3120 2980 2980 2800 2800 2640 2640 2480 2480 2320 2320 2160 2160 2000 2000 1840 1840 1680 1680 1520 1520 1380 1380 1200 1200 1040 1040
880 880 720 720 560 560 400 400 240 240
Solarban® 60 + Clear VLT= 70% Solargray® + Clear VLT= 40%
3120 3120
2980 2980 2800 2800 2640 2640 2480 2480 2320 2320 2160 2160 2000 2000 1840 1840 1680 1680 1520 1520 1380 1380 1200 1200 1040 1040
880 880 720 720 560 560 400 400 240 240
Clear + Clear VLT= 78% Clear VLT= 83%
Image 10. Perspective view with lighting levels of different glass systems.
Glass Type Product Thickness
(mm) VLT Area with
Glare (%)

28 - TRUE STORY OF A SUCCESSFUL FAÇADE: Solarban® Glass Powering KOI Tower
5. How Much Energy Does a Vertical Architectural Glass City Consume?
Consumption Characteristics
The total energy consumption of a building is composed of the electricity and/or fuel consumption of each of the building's own systems, where the most common general consumptions are:
Annual Energy Consumption Distribution
Clear 12 mm
Solarban® R100 Optiblue®
For the KOI Tower success story, the energy consumption with Solarban® R100 Optiblue® glass versus clear 12mm glass can be observed in Image 11:
Heating
Cooling
Ventilation
Electrical equipment
Lighting
Process equipment
Auxiliary pumps
Table 8. Annual energy consumption distribution Image 11. Distribution of Annual Energy Consumption of KOI Tower
Clear 12 mm Solarban® R100 Optiblue® + Clear Type of Use Energy Consumption Consumption Energy Consumption Consumption
Per Year (kWh) Percentage Per Year (kWh) Percentage
Heating 1,702,091 14% 388,632 5%
}HVAC
Cooling 3,388,507 28% 1,539,853 18%
Ventilation 1,249,737 10% 814,958 10%
Auxiliary pumps 630,713 5% 515,301 6%
Process equipment 3,258,848 27% 3,258,848 38%
Lighting 1,302,458 11% 1,302,458 15%
Various electrical devices 658,373 5% 658,373 8%
As shown in Table 8, the largest percentage of energy consumption, equivalent to 39%22 for Solarban® R100 Optiblue® glass and 57% for clear 12 mm glass, corresponds to the air conditioning system (HVAC). Therefore, the correct selection of the glass system is of utmost importance to obtain an efficient envelope and reduce the building's operating costs.
21 Process equipment in KOI Tower: elevators, hot water service, hydraulic pumps and equipment necessary to perform the functions of those who inhabit these spaces, such as computers, appliances, among others.
22 HVAC consumption consists of the consumption of heating, cooling, ventilation and auxiliary pumps.
Air-conditioning System (HVAC)
Process
Lighting
10% 18% 6%
5%
8% 38%
15%
28%
10% 14%
5% 5%
11% 27%
Total 12,190,727 100% 8,478,423 100%

29 - TRUE STORY OF A SUCCESSFUL FAÇADE: Solarban® Glass Powering KOI Tower
5.1 Consumption Percentages by Type of Use
Using actual electrical energy consumption of the building, estimates were made to calculate the annual energy consumption of the building for each type of glass system using Trace 700 software. In this study, the annual energy consumption is composed of the sum of the three types of uses of the building:
5.2 Reduction of CO2 Emissions
Residential Area
Commercial Area
Common Area
The growing environmental crisis has caused the reduction of emissions to be considered in the decision-making process to carry out developments that reduce or eliminate negative impacts on the environment.
The selection of glass in the façade of a building has the potential to make a great environmental contribution, as was the case in this success story of using Solarban® R100 Optiblue® glass in KOI Tower.
Let us not forget that buildings are immovable assets with a long lifespan, which is why they have the “Lock-in Effect”23. This means that the decisions we make in the design of our buildings will have long-term repercussions for as long as they are used. In other words, if we consider the selection of an efficient glass system from the beginning, we will be generating a positive effect on the environment throughout its lifespan.
23 Definition of "Lock-In" and Passivhaus construction, in the Green Building Advisor, by Matthew Omalia
33%
21%
46%

30 - TRUE STORY OF A SUCCESSFUL FAÇADE: Solarban® Glass Powering KOI Tower
In this regard, Solarban® R100 Optiblue® glass provides energy savings of 3,712,302 kWh
($613,000) per year.
Taking as a reference the Emission Factor of the National Electric System of 2021, which considers that to produce one MWh (1,000 kWh), 0.494 tons of CO2 equivalent (tCO2e) are emitted, the following was achieved:
Equivalent to 4,102 trees needed to absorb these emissions.
The reduction of
1,833 tCO2e emissions per year
CO2 If this reduction in emissions is considered over the lifespan of the project (40 years), it is estimated that 73,355 tCO2e would be reduced.
This would be equivalent to removing 36,979 vehicles from circulation.

31 - TRUE STORY OF A SUCCESSFUL FAÇADE: Solarban® Glass Powering KOI Tower
6. Conclusions
The World Green Building Council (World GBC)24 joined the efforts of the United Nations in supporting the Sustainable Development Goals. Nine of the 17 Sustainable Development Goals25 are directly impacted by buildings and should therefore be promoted by all organizations that are part of the building team.
The present study demonstrates quantitatively and realistically the positive impacts that can be obtained by having a proper selection of glass:
Economic Benefits
• Initial Investment Cost: Assuming a 12mm clear glass was chosen for the building instead of Solarban® R100 Optiblue® glass, the initial investment cost of the project would have increased by more than 7 million pesos due to the need for a higher investment cost in HVAC equipment to achieve indoor comfort.
• Operating Costs: Assuming a 12mm clear glass was chosen instead of Solarban® R100 Optiblue® glass, the annual operating cost would have increased by over $612,600 per year, due to the need for higher capacity air conditioning equipment and longer use. Considering an average lifespan of the building of 40 years, this glass would be avoiding an expense of more than $24.5 million.
In economic terms, we can conclude that the selection of the Solarban® R100 Optiblue® glass system was an excellent decision, providing total savings of around $24.9 million over the lifespan of the project compared to 12mm clear glass.
24 World Green Building Council. 25 1. Health and well-being, 2. Affordable and clean energy, 3. Decent work and economic growth, 4. Industry, innovation and infrastructure, 5. Sustainable cities and communities, 6. Responsible production and consumption, 7. Climate action, 8. Life of terrestrial ecosystems and 9. Partnerships to
achieve the goals.

32 - TRUE STORY OF A SUCCESSFUL FAÇADE: Solarban® Glass Powering KOI Tower
User comfort • Thermal comfort: Solarban® R100 Optiblue® glass provides 15.7% more hours of thermal comfort to occupants compared to 12mm clear glass, increasing the perception of satisfaction while reducing the hours required to use mechanical cooling systems.
• Glare control: Solarban® R100 Optiblue® glass also reduced glare areas by 13.65% compared to 12mm clear glass, providing users with better natural lighting comfort by avoiding unwanted glare.
Emission Mitigation Finally, the selection of Solarban® R100 Optiblue® glass reduced the number of emissions to the environment from electric power generation by more than 1,833 tCO2e per year.
Over the life of the building, this translates into a reduction of 73,355 tCO2e, equivalent to removing 36,979 vehicles from circulation.
In this case study, we prove that Solarban® R100 Optiblue® glass is the option that generates the greatest economic, social (user comfort) and environmental benefits.
Table 9. Comparison of Solarban® R100 Optiblue® vs Monolithic Clear 12mm
Monolithic Clear 12 $216.35 $ 40.94 74.2% 38% 6,022
Double Solarban® R100 Optiblue® + Clear 25 $10,245,971 $1,394,036 89.9% 25% 4,188
Benefits $359,041 $613,117 15.7% 14% 1,834
$10.6
$10.5
$10.4
$10.3
$10.2
$10.1
$10
$9.9
Clear 12mm
Solarban® R100 Optiblue® + Clear
$2.10
$1.95
$1.70
$1.46 $1.22
$0.97
$0.73
$0.49
$0.24
$0
Initial Investment Cost (Millions USD) Initial Investment Savings (Millions USD)
Annual Operating Cost (Millions USD)
Glass Type
Product
Thickness
(mm)
Initial Investment
Cost: Glass & HVAC System
(USD)
Air Emissions (Tons of
CO2e/year)
$360,000
Initi
al In
vest
men
t Cos
t (M
illio
ns U
SD )
Ope
ratio
nal C
ost
(Mill
ions
USD
)
Annual
Operating Cost (USD)
Percentage of
Hours in Thermal Comfort
Percentage of Area
with Glare

33 - TRUE STORY OF A SUCCESSFUL FAÇADE: Solarban® Glass Powering KOI Tower
12 mm Clear Glass
12mm Clear Glass
12mm Clear Glass
Percentage of Hours with Thermal Comfort
Solarban® R100 Optiblue®
Glass
Percentage of Area with Glare
Solarban® R100 Optiblue®
Glass
Annual CO2 Emissions
Solarban® R100
Optiblue®
Glass
6,022 Tons of CO2
74%
38%
90%
25%
4,188 Tons
of CO2

34 - TRUE STORY OF A SUCCESSFUL FAÇADE: Solarban® Glass Powering KOI Tower
Annex 1: Climate Zones in Mexico The ASHRAE 90.1-2016 standard recognizes at least five climate zones in Mexico: from climate zone 0 to 4. In general terms, it is considered that the lower the thermal zone number, the higher the energy consumption derived from air conditioning and ventilation.
Thermal zones are defined according to degree days and rainfall. Degree days are a measure of how much (expressed in degrees) and for how long (expressed in days) the outdoor air temperature will be above (cooling degree days) or below (heating degree days) a specific reference temperature. In other words, degree days express the need to air condition the environment in a location by either cooling or heating. In locations with high cooling degree days, cooling equipment will have higher energy consumption.
In addition, the ASHRAE climate classification also includes a subcategory of humidity level denoted by the letters A (humid), B (dry) and C (marine). Typically, locations with higher relative humidity will have higher cooling consumption due to the latent heat load associated with high humidity.
ASHRAE 90.1-2016 outlines certain energy measures according to the thermal zone of each location. Annex Table 1.1 shows the requirements for glazing system properties by thermal zone: as the thermal zone becomes more temperate, the U-value requirement decreases and the SHGC value increases. The ratio of visible transmittance to overall solar gain remains the same in all thermal zones.
Annex Table 1.1. Property requirements for glazing systems by thermal zone
Thermal zone
U-Value
(Btu/hft2°F)
SHGC
VLT
/SHGC
0 (A,B)
0.50
0.22
1.10
1 (A, B)
0.57
0.25
2 (A, B)
0.54
3 (A, B, C)
0.45
4 (A, B, C)
0.38
0.36
For the purposes of this study, we will focus on the properties of the glazing system for the Monterrey Metropolitan Area, where KOI Tower is located, which is considered climate zone 2B, according to ASHRAE 90.1-2016

35 - TRUE STORY OF A SUCCESSFUL FAÇADE: Solarban® Glass Powering KOI Tower
Annex Table 1.2 Thermal properties of the glazing systems analyzed
Monolithic Clear 12 5.60 0.72
Double Clear + Clear 25 2.69 0.70
Double Solargray® + Clear 25 2.69 0.46
Double Solarban® 60 Clear + Clear 25 1.65 0.39
Double Solarban® R100 Optiblue® + Clear 25 1.65 0.20
As we can see in Table Annex 1.2, the thermal properties requirement for the glazing system in Monterrey (2B) indicates that a low U-Value and SHGC is required, since it is a warm climate zone. Based on this requirement, we can highlight that the Solarban® R100 Optiblue® glass system meets and improves the requirements established by ASHRAE 90.1-2016.
Annex Image 1.1 Map of Mexican Climate Zones
México Cimate Zone
1A 1B
2B 3A 3B
Monterrey (2B)
San Luis Potosí (3B)
Tampico (1A)
México City (3A)
Morelos (3C)
Veracruz (1A)
Mérida (0A)
Tijuana (3B)
Mazatlán (1A)
Puerto Vallarta (1A)
Guadalajara (3A)
Guanajuato (2A)
Estado de México (3A)
Acapulco (0A)
Glass Type Product Thickness
(mm) U-Value
(W/m2*K) SHGC
2A

36 - TRUE STORY OF A SUCCESSFUL FAÇADE: Solarban® Glass Powering KOI Tower
Annex 2: Thermal Comfort Analysis
To analyze the thermal comfort in the spaces, and its variations with different glasses, the Comfort Zone analytical method described in Standard ASHRAE 55-2010 was used. This methodology considers direct solar radiation on the occupants and the six determining components of thermal comfort:
Metabolic Rate
(Heat generated by the
human body while performing an activity)
Relative Humidity
Air Speed
Clothing Insulation
Radiating Temperature
Air Temperature
With these parameters, the model establishes the functions that relate to them to predict under what conditions the building occupants would feel comfortable and when they would not. This is categorized through a simulated voting system, called PMV, or Predicted Mean Vote, in which a rating greater than -0.5 and less than 0.5 is considered to be in comfort.
With this methodology, and using the IESVE 2021 software, the simulation was carried out. According to this methodology, results were obtained per space and per hour, and a percentage of hours per year that the spaces are comfortable was obtained.

HISTORIA REAL DE UNA FACHADA EXITOSA: Vidrios Solarban® potenciando KOI Tower- 37

38 - HISTORIA REAL DE UNA FACHADA EXITOSA: Vidrios Solarban® potenciando KOI Tower
/VitroPeopleandCulture /Vitro_Glazings /company/Vitro-Architectural-Glass /c/VitroGlass @Vitro_Glazings
[email protected] │ www.vitroglazings.com │ www.projects.vitroglazings.com
SOLA
RBAN
® R10
0 O
PTIB
LUE® G
lass