Softshake 2013: 10 reasons why java developers are jealous of Scala developers

True SouthUnleashing Democracy in the Black Belt 50 Years After Freedom Summer
By Ben Jealous June 2014
WWW.AMERICANPROGRESS.ORG
ASSO
CIATED PRESS

True SouthUnleashing Democracy in the Black Belt 50 Years After Freedom Summer
By Ben Jealous June 2014

1 Introduction and summary
3 Polarization in the Black Belt: A brief history
6 Why this time is different: The opportunity for a less polarized and more inclusive Black Belt
6 Changing demographics
8 Frustration with the extreme right wing
12 What the extreme right wing understands: Voters of color and young people hold the keys to the future
12 Attacks on the right to vote
13 Attacks on immigrants’ rights
14 The lessons of Freedom Summer and how we can apply them today
14 Lesson 1: Voter registration can overcome voter suppression
19 Lesson 2: Coalition building is the key to transformative political power
21 Lesson 3: A successful movement is a marathon, not a sprint
23 Conclusion
24 Methodology
Contents

Contents 25 About the author
26 Acknowledgments
27 Appendix A
41 Appendix B
44 Endnotes

1 Center for American Progress | True South
Introduction and summary
This report contains corrections. See page 24.
The 1964 Mississippi Freedom Summer was a pivotal moment for democracy in America. Yet 50 years later, despite many gains at the local level, the dream of Freedom Summer remains largely unrealized in the stretch of heavily black southern states known as the Black Belt. There are a number of significant and troubling signs:
• Large numbers of black voters and voters of color remain unregistered.
• New waves of voter suppression laws are being passed, and they have taken a form not seen since the rise of Jim Crow laws.
• The general wisdom in many Black Belt states remains that when it comes to winning statewide office, candidates who support the views and concerns of people of color simply do not have a chance.
Nevertheless, the Black Belt region is in a state of change. Waves of black remi-gration and Latino and Asian immigration are infusing Black Belt states with a more diverse, more tolerant, and more progressive population. At the same time, extreme right-wing attacks on women’s rights, as well as a rising generation of increasingly tolerant young white voters, have begun to increase the possi-bilities for successful multiracial voter coalitions and candidates of color at the statewide level.
This report examines the conditions in the Black Belt today and identifies lessons from Freedom Summer that can help today’s political organizers build a more inclusive Black Belt.

2 Center for American Progress | True South
The first and most important lesson is that massive voter registration can over-come massive voter suppression. Our analysis shows that registering just 30 percent of eligible unregistered black voters or other voters of color could shift the political calculus in a number of Black Belt states, helping blacks elect candidates who share their concerns or alternatively, forcing all candidates to pay attention to the community’s concerns. Registering 60 percent or 90 percent would change the political calculus in an even greater number of states.
However, if organizers seek to maintain this progress in the long term, they must also embrace two other lessons from Freedom Summer. The second lesson is that coalition building is the key to transformative political power. The third is that successful movement is a marathon, not a sprint.
Taken together, these three lessons can provide the tactical framework for advanc-ing inclusion and unleashing democracy in the Black Belt.

3 Center for American Progress | True South
Polarization in the Black Belt: A brief history
The so-called “Negro Question” has always played a defining role in the politics of the Black Belt. For the first half of the 20th century, the Democratic Party enjoyed broad success in the region. So-called “Dixiecrats” dominated elections for decades by offering a mix of populism and hardline support for segregation and Jim Crow laws. After the civil rights advances of the 1960s, many white former Dixiecrats fled for the Republican Party, and the following decades saw a further exodus of white voters to the GOP.1
Except for a few short periods of time, voting patterns in the Black Belt states have been racially polarized since the end of Reconstruction, with whites and non-whites deeply divided in their political preferences.2 That reality—combined with the fact that whites make up a great percentage of the region’s total population—has made it difficult for black voters and voters of color in the Black Belt to elect candidates who support their views and concerns.
As a consequence, the policy agenda typically favored by blacks and voters of colors in the Black Belt has largely been held in check. Below are a few examples of the policies that dominate the region, notwithstanding consistent opposition from communities of color. Out of 13 Black Belt states:
• Nine states have passed laws requiring voters to bring photo identification to the polling booth in order to cast a traditional ballot. These states are Alabama, Arkansas, Florida, Georgia, Louisiana, Mississippi, Tennessee, Texas, and Virginia.3 Many of the Black Belt states have also passed or introduced laws to abolish or limit early voting and to restrict registration—all of which have the effect of suppressing voters of color and low-income voters generally.

4 Center for American Progress | True South
• Nine states have governors who elected not to expand Medicaid in the wake of the Affordable Care Act, effectively denying health care to millions of their citi-zens, overwhelmingly the poor and people of color. These states are Alabama, Florida, Georgia, Louisiana, Mississippi, North Carolina, South Carolina, Tennessee, and Texas.4
• Eleven states have passed “right-to-work” laws, which discourage organizing by unions. These states are Alabama, Arkansas, Florida, Georgia, Louisiana, Mississippi, North Carolina, South Carolina, Tennessee, Texas, and Virginia.5
• Ten states received a grade of “D” or lower on the Center of American Progress’ “State of Women in America” report, indicating poor performance on economic opportunities, leadership opportunities, and women’s health. These states are Alabama, Arkansas, Georgia, Louisiana, Mississippi, North Carolina, South Carolina, Tennessee, Texas, and Virginia.6
• Three states have introduced laws prohibiting undocumented immigrants from receiving public benefits—Alabama, Georgia, and South Carolina7—while two states have introduced proof-of-citizenship laws that discourage voting by people of color—Alabama and Tennessee.8
• Six states rank in the top 15 in the country for carbon dioxide emissions,9 which disproportionately affect the health of low-income communities and commu-nities of color.10 These states are Alabama, Florida, Georgia, Louisiana, North Carolina, and Texas.
Moreover, very few blacks or people of color have ever held statewide office in the Black Belt. In the past century, Black Belt voters have elected only one black gover-nor, two black lieutenant governors, and no black senators.11 Only four Hispanics and two Asians have held any of those elected positions in the Black Belt in more than a century.

5 Center for American Progress | True South
The “Black Belt” is an informal name for the states and counties that stretch across
the former Confederate states, east to west from Delaware to East Texas, and north to
south from the southern tip of Tennessee to the northern counties of Florida.
The Black Belt earned its nickname for two reasons: the dark, rich soil that made
the region ideal for farming and the legacy of plantation slavery that the fertile soil
enabled. Since the days of the transatlantic slave trade, the region has been home to
a varying but always sizable percentage of the country’s black population.
For the purpose of this report, we will define the Black Belt as the following 13 states,
each of which has a black population of at least 10 percent: Alabama, Arkansas,
Delaware, Florida, Georgia, Maryland, Louisiana, Mississippi, North Carolina, South
Carolina, Tennessee, Texas, and Virginia.
This definition correlates roughly with the U.S. Census Bureau’s definition of the U.S.
South, although our definition does not include the states of West Virginia, Kentucky,
and Oklahoma or the District of Columbia.12
What is the Black Belt?
FIGURE 1
The Black BeltCounties by percentage of black population
Source: Bureau of the Census, "Race, Hispanic or Latino, Age, and Housing Occupancy: 2010," available at http://fact�nder2.census.gov/faces/tableservices/jsf/pages/productview.xhtml?pid=DEC_10_PL_QTPL&prodType=table (last accessed June 2014).
5–9.9%less than 5%
25% or more10–24.9%

6 Center for American Progress | True South
Why this time is different: The opportunity for a less polarized and more inclusive Black Belt
Although the Black Belt has experienced a long history of polarization, a number of factors are coming together that could change this dynamic. Let’s examine these conditions next.13
Changing demographics
The demographics of the United States are changing rapidly. In the 16 years between 1996 and 2012, the share of the voting population that was non-Hispanic white decreased from 82.5 percent to 73.7 percent.14 By 2043, America will be a majority-minority country, and no single racial or ethnic group will make up a clear majority of the American people.15
This demographic shift is especially pronounced in the U.S. South. From 2000 to 2010, the non-Hispanic white population in the South grew at a rate of 4 percent, while the so-called “minority” population in the region experienced a 34 percent growth, the greatest out of any region in the country.16 In 2000, the South was 34.2 percent minority, or people of color, and that number jumped to 40 percent by 2010. These trends could have a major effect on the region’s poli-tics because voters of color tend to be more progressive17 and vote overwhelm-ingly for progressive candidates.18
Let’s examine these trends more deeply.

7 Center for American Progress | True South
The Great Remigration: The reversal of a historic trend
Between 1910 and 1970, an estimated 5 million blacks fled the southern United States for northern cities in what became known as the Great Migration.19 The migration was driven partly by economic factors but also by racial segregation and systemic terrorism.
In recent years, however, blacks have been moving back to the South at a remarkable rate. From 2000 to 2010, the Black alone-or-in-combination popula-tion grew by 18 percent in the South*. In fact, in 2010, the share of blacks who lived below the Mason-Dixon Line was at 57 percent—the highest it has been since 1960.20 Blacks now make up an estimated 20 percent of the population of southern United States.21
Notably, 40 percent of blacks who moved to the South since 2000 were between the ages of 21 and 40 years old, so there is reason to believe the black population will only grow as these young transplants settle down and start families.22
Other communities of color have grown as well
As the black population in the Black Belt has grown, so have the Hispanic, Asian, and Native American populations.
The Hispanic population in the South increased by 57 percent in the first decade of the new millennium, from 11,586,696 to 18,227,508*.23 Nine Black Belt states saw their Hispanic population more than double from 2000 to 2011: Alabama, Arkansas, Delaware, Georgia, Maryland, Mississippi, North Carolina, South Carolina, and Tennessee.24 Meanwhile, from 2000 to 2010, the Asian alone-or-in-combination population grew the fastest in the U.S. south, growing by 69 percent, from 2,267,094 to 3,835,242 people.25 The American Indian and Alaska Native population grew significantly in the U.S. South as well—by 36 percent—although the total population of American Indian and Alaska Natives in southern states remains relatively small at 1,712,102 people.26

8 Center for American Progress | True South
Frustration with the extreme right wing
The second factor preparing the ground for a more inclusive Black Belt is the growing frustration among certain key white constituencies with the region’s extreme right-wing leaders and their policies.
In many Black Belt states, right-wing extremists have hijacked the conservative movement. There are two main reasons for this trend. First, many conservative candidates for statewide office have essentially written off the support of vot-ers of color and progressive voters and instead have taken increasingly staunch conservative stands to win over the remaining white vote. Second, decades of gerrymandering have corrupted the electoral process in a way that favors hardline candidates in general.27
These right-wing extremists have promoted policies that are increasingly out of touch with the actual needs and desires of their constituents, further pushing away voters of color, but also alienating white women and young voters. Let’s examine the impact on each of these latter groups below.
Young voters
Recent polling shows that the Millennial generation is the least racist and most tolerant in the history of our country.28 Young people today, when compared to their counterparts in the late 1980s, are twice as likely to completely disagree with the statement “I don’t have much in common with people of other races.”29 Moreover, 9 out of 10 people 18 to 29 year olds say they approve of interra-cial dating and marriage, compared with just 7 out of 10 of those in the Baby Boomer generation.30
Young voters are also more progressive than previous generations. Millennials are more likely to believe that government should reduce the income gap, improve public schools, and make college more affordable.31 They are also significantly more concerned about protecting the environment.32 Notably, even those Millennials who identify themselves as Republican or conservative are less anti-government than their counterparts in previous generations.33
9 Center for American Progress | True South
Because of their tolerant attitudes and progressive views, young white voters in the Black Belt may be less likely to respond to the “culture war” issues and racial appeals that white politicians have used for decades to drive a wedge between white voters and voters of color. These past tactics include the politicizing of the Confederate battle flag, which helped to determine the 2002 Georgia gubernato-rial race34 and has played a role in South Carolina’s politics for years.35
As one example, young whites voted for President Barack Obama at a rate of 54 percent in 2008 and 44 percent in 2012, higher rates than their elders.36 There is evidence that this could be a sustained trend. David Madland and Ruy Teixeira at the Center for American Progress have argued that the decreasing salience of “culture war” issues for Millennial voters could the “acrimonious disputes about family and religious values, feminism, gay rights, and race” that have “frequently crippled progressives’ ability to make their case to the average American.”37
White women
The Black Belt in recent years has been home to some of the most aggressive attacks on women’s rights and women’s health. This has alienated women of all colors, although it could have the biggest impact on the voting outcomes of white women in the region, who have voted for extreme right-wing candidates in recent years despite these attacks.
The Black Belt is already home to states that have the most restrictive laws when it comes to women’s health. As mentioned above, the majority of Black Belt states received a grade of “D” or lower on the Center of American Progress’ “State of Women in America” report.38 Yet the attacks keep coming: In 2014 alone, Black Belt lawmakers have taken the following actions:
• In South Carolina, a state senate committee voted to expand the state’s “Stand Your Ground” law to include fetuses, which many women’s health advocates viewed as an attempt to challenge Roe v. Wade and the right to a safe and legal abortion.39
• In Alabama, the state house of representatives voted to ban abortions when a fetal heartbeat is detected, which occurs at about six weeks.40

10 Center for American Progress | True South
• In Texas, Republican Gov. Ricky Perry signed a law making it more difficult for physicians to perform abortions, which has caused abortion clinics to close and reduced opportunities for women to get medical care.41
These attacks have started to affect voting patterns. In 2012, for example, Virginia Gov. Bob McDonnell (R) and his Attorney General Ken Cucinelli (R) supported a bill that would have required some women to undergo an invasive procedure called a “transvaginal ultrasound” before getting an abortion.42 Many women saw this as governmental overreach into their personal medical decisions. In the following year’s gubernatorial race, Cucinelli received significantly less support from white women than McDonnell had received four years earlier—54 percent compared to McDonnell’s 63 percent in 2009.43 Analysts cited this drop as one of the primary reasons that Cucinelli ultimately lost the 2013 gubernatorial race.44
There have been two occasions that could be termed “dress rehearsals” for a more
progressive and inclusive Black Belt. The first occurred in the years following the Civil
War—the Reconstruction era—and the second took place in the mid-1970s. The
extreme right wing stymied both of these movements with racially divisive, suppres-
sive, and often violent tactics.
Reconstruction
The years immediately following the Civil War offered a glimpse of what a more
inclusive Black Belt could look like. Reconstruction historian Eric Foner has estimated
that 2,000 black men held public office in the South between the years 1865 and
1876, including two U.S. senators and one governor.45
The curtain closed on this period in 1877 when President Rutherford B. Hayes
withdrew federal troops from the U.S. South. The troops had been deployed in part
to protect the rights of the newly freed slaves, and their removal allowed the white
power structure to regain control. Free from federal oversight, southern whites
began to suppress the black vote in two ways: with poll taxes and literacy tests used
to disenfranchise black voters and with outright violence to keep them away from
the polls. As a result, from 1901 to 1972, there was not a single black member of
Congress or governor from the former Confederate states.46
Dress rehearsals for a more inclusive Black Belt

11 Center for American Progress | True South
The “New South” of the late 1970s and 1980s
In the years following Freedom Summer, the Black Belt experienced a temporary
coalition of white and black working-class voters. As the black voter registration
rate shot up, white attitudes toward race softened, and, as Bob Moser writes in his
book Blue Dixie, by the early 1970s, “every single Southern state but Alabama …
had elected a moderate-to-progressive governor calling for racial reconciliation and
‘lift-all-boats’ economic reforms.”47 These governors included Terry Sanford in North
Carolina and Jimmy Carter in Georgia. Although these “New South” governors were
always white, they did offer a vision of a progressive and inclusive future.
The political moment did not last long, however. In the late 1960s, presidential can-
didate Richard Nixon started campaigning in the South with his so-called “Southern
Strategy.” Instead of making outright racial appeals to white voters as 1964 GOP
presidential candidate Sen. Barry Goldwater (AZ) did with his mantra that “forced in-
tegration is just as wrong as forced segregation,” Nixon used coded language to drive
a wedge between working-class whites and blacks. His promises to oppose busing
and focus on “law and order” convinced many working-class whites to vote for him,
despite Nixon’s economic policies were against their best interests.48
Other politicians continued to use Nixon’s “Southern Strategy” for decades. In
1980, GOP presidential candidate California Gov. Ronald Reagan drew criticism for
making a campaign stop at Mississippi’s Neshoba County Fair, just miles from a
site where civil rights activists had been murdered in 1964. He used this campaign
appearance to call for “state’s rights,” a move that many saw as a coded appeal to
the old racial order.49
Mississippi Gov. Kirk Fordice (R) continued this trend of racially divisive politics in the
early 1990s by advocating for the end of affirmative action, closing black colleges,
and pushing so-called “tough on crime” criminal justice reforms.50 By the mid-1990s,
the promise of the “New South” was lost—or, more accurately, stolen.

12 Center for American Progress | True South
What the extreme right wing understands: Voters of color and young people hold the keys to the future
If the Black Belt is at a precipitous and historical moment, then one thing is for sure: The extreme right wing of the conservative movement understands this fully. There is also evidence that they are actively trying to hold back the rising multira-cial and multiethnic majority.
In the past few years, right-wing extremists in the Black Belt have continuously attacked the most basic civil rights of people of color. The attacks have hit a tone not heard since the fall of Jim Crow, and they have taken a form not seen since Jim Crow’s rise. Despite their stated intent—to safeguard against voter fraud and make the country safer—these attacks have had the effect of disenfranchising and otherwise pushing away from the polls voters of color, women, young voters, and low-income voters of every color.51
Attacks on the right to vote
The right to vote is the right upon which all other rights depend. Yet in many Black Belt states, extreme right-wing leaders have found inventive ways to suppress the vote of people who disagree with them and their policies.
Perhaps the most well-known form of voter suppression has been the introduc-tion of voter ID laws. According to the nonpartisan National Conference of State Legislators, 9 out of 13 Black Belt states now have laws requiring voters to bring photo identification to the polling booth in order to cast a regular ballot. Six of these laws are considered strict, meaning that if a voter does not have identifica-tion, he or she needs to take additional steps after Election Day in order for their vote to be counted.52 Proponents of voter ID laws claim that they are meant to

13 Center for American Progress | True South
prevent voter fraud, but actual cases of voter fraud have been proven to be nearly nonexistent.53 Rather, these laws are about making it more difficult for people of color and low-income voters to vote.54
Voter suppression takes other forms as well. Florida, Virginia, and North Carolina have all passed restrictions on third-party voter registration in recent years.55 A number of Black Belt states have also limited same-day registration and slashed early voting.56 All of these changes have been proven to disenfranchise low-income voters and voters of color.
Attacks on immigrants’ rights
At the same time, many Black Belt states have introduced legislation that curtails the rights of undocumented immigrants and generally makes it more difficult for people of color to vote.
In June 2011, Alabama Gov. Robert Bentley (R) signed H.B. 56, an anti-immigra-tion bill that many saw as more severe than the law it was modeled after, Arizona’s S.B. 1070. Alabama’s law prohibits undocumented immigrants from receiving public benefits and allows police to inquire about any person’s citizenship status during a legal stop, detention, or arrest if they have, according to the statute, “rea-sonable suspicion” that the person is an undocumented immigrant. H.B. 56 also has a slew of other discriminatory effects on Hispanics and, in a practical sense, anyone with dark skin.57
Since then, Georgia and South Carolina have also passed copycat laws modeled after Alabama’s statute.58 Immediately after these copycat laws were passed, farm-ers began reporting that foreign field workers had moved away, and many itinerant immigrants were avoiding the region.59
In a similar move, South Carolina and Tennessee introduced proof-of-citizenship laws in 2012 that require citizens to provide documentary proof of citizenship before voting. These laws have been proven to have a chilling effect on voters of color, deterring hundreds of thousands of Hispanics from voting in these states.60

14 Center for American Progress | True South
The lessons of Freedom Summer and how we can apply them today
In so many ways, this moment in history resembles the moment that Freedom Summer activists faced in 1964. The demographic and political winds are shift-ing in ways that favor progressive voters and voters of color. In response, the right wing is pushing back by attacking these voters’ basic civil rights.
What can citizens in the Black Belt do to protect and enhance the political rights of blacks and other people of color? How can activists build upon this moment to achieve the dream of the Freedom Summer movement—a region and nation where voters of color are not shut out of politics but instead have the chance to regularly be part of a governing coalition?
History is a wonderful teacher, and there are a number of lessons from the 1964 Mississippi Freedom Summer campaign that can inform today’s situation. The following three sections will spotlight three lessons coming out of the Freedom Summer movement and lay out a strategy for applying these lessons to create political power for voters of color in the Black Belt.
Lesson 1: Voter registration can overcome voter suppression
The first and most enduring lesson from the 1964 Freedom Summer is that voter registration works, even in the face of voter suppression and violence.
The Freedom Summer activists in Mississippi faced an uphill battle from the beginning: In 1962, only 6.7 percent of eligible black voters in the state were registered to vote, the lowest of any state in the country*.61 The reason for this was two-fold: decades of poll taxes and literacy tests and systematic acts of violence against blacks who attempted to register or vote.

15 Center for American Progress | True South
The violence continued over the course of that summer. Freedom Summer activ-ists were harassed and often attacked by members of the Ku Klux Klan and White Citizens’ Councils, who resented the young activists’ attempts to upend the power structure. The triple murder of civil rights activists James Earl Chaney, Andrew Goodman, and Michael Schwerner in 1964 was the most infamous act of violence during the 10-week campaign, but the total number of acts of violence is much greater. Historian Doug McAdam estimates that at least 80 Freedom Summer workers were beaten, and 37 churches and 30 black homes or businesses were bombed or burned.62
Yet despite these challenges, the activists persevered and set in motion a contin-ued upswing in voter registration that continues to this day. Between 1966 and 1970, more than 1.7 million blacks in the South registered to vote, raising the rate of registered black voters in the region to nearly 60 percent in 1970.63 By 1972, the 11 former Confederate states had elected 665 blacks to state and local office.64
What would a massive wave of voter registration for people of color look like in the Black Belt today? We have established that voting patterns in the Black Belt states have long been racially polarized, and that this has made it difficult for black vot-ers and voters of color to elect candidates who support their views and concerns. However, as the Freedom Summer activists understood, politics is a numbers game. Therefore, increasing political participation by black voters and voters of color in general could remedy this problem in one of two ways: by helping blacks elect can-didates who share their concerns; or else by forcing candidates who would normally write off the black vote to pay attention to the community’s concerns.
In an attempt to find out how a massive wave of voter registration for people of color would affect elections in the Black Belt today, we conducted a statistical analysis that came up with the findings below.
As of 2012, there were an estimated 3,723,000 unregistered blacks living in Black Belt states, as well as an estimated 3,257,000 unregistered Hispanics and an esti-mated 759,000 unregistered Asians.65
We looked at the hypothetical effect of a massive wave of voter registration in each of these communities. For each community, we asked what would happen if activists were able to register a certain amount of the community’s unregistered voters—specifically, 30 percent, 60 percent, or 90 percent—thereby creating a certain number of new voters. (see the Methodology section below for further explanation of our methods)

16 Center for American Progress | True South
We found that in many Black Belt states, a large registration drive targeting black voters could have a significant impact on the political calculus, and a large regis-tration drive targeting black, Hispanic, and Asian voters in tandem could have an even larger impact. This is true for both presidential and midterm elections.
For instance, registering just 30 percent of unregistered black voters would yield enough new voters to upset the balance of power in North Carolina and Virginia in a presidential or midterm election year. This means that the number of new voters would be greater than the net average margin of victory over the past three gubernatorial elections. This could allow voters of color to elect a candidate of their choice, and at the minimum, affect the political decisions of all the candi-dates in the race.
Meanwhile, registering 60 percent of unregistered black, Hispanic, and Asian voters would upset the balance of power in Florida, Georgia, Maryland, North Carolina, South Carolina, Tennessee, Texas, and Virginia in presidential or midterm election year*. In a presidential election year, Alabama would be added to that list.
Case Study: Georgia
As a case study, let’s look at Georgia—a state where gubernatorial candidates sup-ported by voters of colors have not had success in recent years.
In 2002, a Republican State Sen. Sonny Perdue challenged incumbent Democratic Gov. Roy Barnes and won by a margin of 104,615 votes. Purdue was able to unseat Barnes in part by exploiting the issue of the Confederate states’ emblem on the state flag: Barnes had supported a measure to shrink the size of the flag, and Purdue attacked him for this decision.66 Although exit polling was not avail-able, it is fair to assume that voting patterns were highly polarized by race: a poll conducted in 2002 showed that 95 percent of black voters in Georgia favored a Democratic candidate, while 61 percent of white voters favored a Republican.67
In 2006, Gov. Perdue defended his victory over Democratic gubernatorial candi-date Mark Taylor, this time winning by a margin of 418,675 votes. This race was once again polarized; whites supported Purdue at a rate of 68 percent, while blacks supported Taylor at a rate of 81 percent.68 In 2010, a term-limited Perdue endorsed Republican Rep. Nathan Deal, who ultimately beat his Democratic challenger, for-mer Gov. Barnes, by a margin of 258,821 votes; exit polling was not available.
17 Center for American Progress | True South
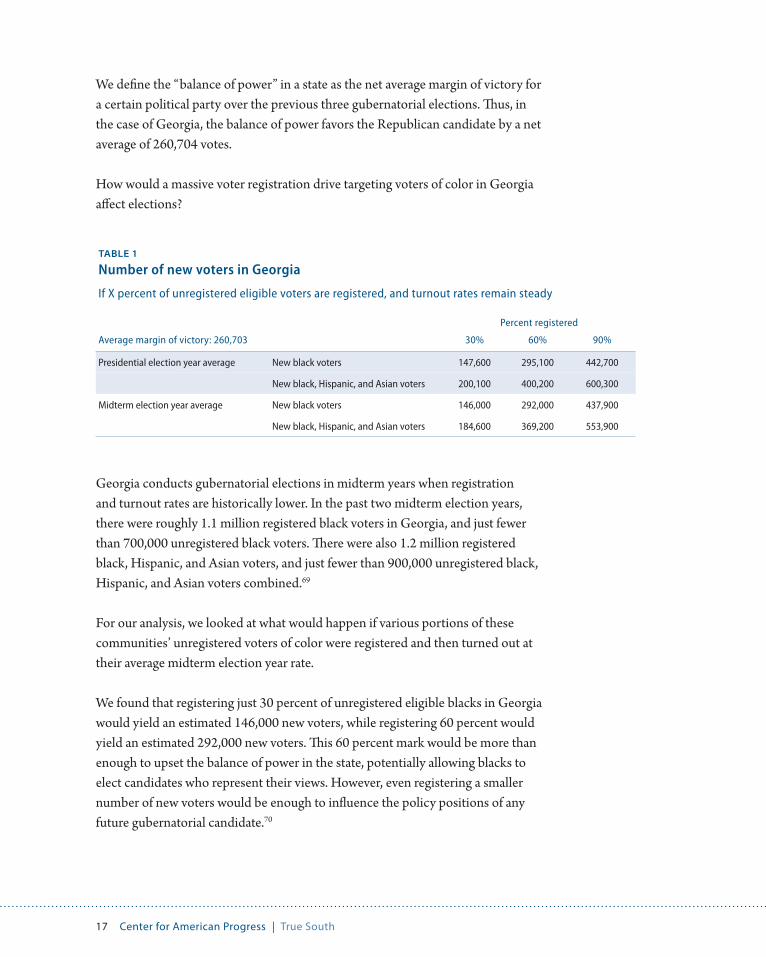
We define the “balance of power” in a state as the net average margin of victory for a certain political party over the previous three gubernatorial elections. Thus, in the case of Georgia, the balance of power favors the Republican candidate by a net average of 260,704 votes.
How would a massive voter registration drive targeting voters of color in Georgia affect elections?
TABLE 1
Number of new voters in Georgia
If X percent of unregistered eligible voters are registered, and turnout rates remain steady
Percent registered
Average margin of victory: 260,703 30% 60% 90%
Presidential election year average New black voters 147,600 295,100 442,700
New black, Hispanic, and Asian voters 200,100 400,200 600,300
Midterm election year average New black voters 146,000 292,000 437,900
New black, Hispanic, and Asian voters 184,600 369,200 553,900
Georgia conducts gubernatorial elections in midterm years when registration and turnout rates are historically lower. In the past two midterm election years, there were roughly 1.1 million registered black voters in Georgia, and just fewer than 700,000 unregistered black voters. There were also 1.2 million registered black, Hispanic, and Asian voters, and just fewer than 900,000 unregistered black, Hispanic, and Asian voters combined.69
For our analysis, we looked at what would happen if various portions of these communities’ unregistered voters of color were registered and then turned out at their average midterm election year rate.
We found that registering just 30 percent of unregistered eligible blacks in Georgia would yield an estimated 146,000 new voters, while registering 60 percent would yield an estimated 292,000 new voters. This 60 percent mark would be more than enough to upset the balance of power in the state, potentially allowing blacks to elect candidates who represent their views. However, even registering a smaller number of new voters would be enough to influence the policy positions of any future gubernatorial candidate.70

18 Center for American Progress | True South
Finally, the results are only intensified if we consider the impact of register-ing certain portions of the unregistered black, Hispanic, and Asian population. Registering just 30 percent of unregistered blacks, Hispanics, and Asians in Georgia would yield an estimated 185,000 new voters, nearly enough to upset the state’s balance of power. Meanwhile, registering 60 percent of this cohort would upset the balance of power by yielding an estimated 369,000 new voters*.71
What would a modern day Freedom Summer look like? For a textbook case of voter
registration overcoming voter suppression, consider Florida in 2012.
In the years following the 2008 presidential election, the extreme right wing in
Florida passed a number of laws that had the effect of stifling voters of color. Repub-
lican Gov. Rick Scott signed an executive order that disenfranchised half a million
black formerly incarcerated individuals with the stroke of a pen. Florida state legisla-
tors pushed through bills that eliminated early voting on the Sunday before Election
Day—a thinly veiled attack on the black church tradition of “Souls to the Polls”—and
that imposed strict new rules on community-based voter registration drives.72
All of a sudden, registering voters in Florida became much more difficult. The new
rules introduced a host of record-keeping and reporting requirements and slashed
the deadline for submitting filled-in applications from 10 days to just 48 hours.
Any violation of these new rules could result in a fine. Within weeks, the League of
Women Voters and Rock the Vote halted Florida voter registration operations.73
Undeterred, the Florida NAACP kept going. At one registration drive in Miami, the
NAACP registered 23,000 people.74 After another successful drive, the president of
the Okaloosa County branch of the NAACP was threatened with prosecution for sub-
mitting forms one hour past the deadline.75 Undaunted, he kept leading registration
drives throughout election season.
By Election Day 2012, the NAACP had registered more than 115,000 people, many in
heavily black communities. When the votes were counted, President Obama’s official
margin of victory in Florida was just more than 73,000 votes.76
Voter registration as the antidote to voter suppression: The story of Florida in 2012

19 Center for American Progress | True South
Lesson 2: Coalition building is the key to transformative political power
The second lesson from Freedom Summer of 1964 is that coalition building will be key to increasing the political power of the black community in the Black Belt.
The logo for the Student Nonviolent Coordinating Committee, or SNCC—one of the lead organizers of Freedom Summer—was a pair of joined hands, one black and one white. The activists understood that any lasting change would come from a sustained coalition of whites and people of color fighting a unified battle for a more inclusive future. In fact, 90 percent of the more than 1,000 out-of-state vol-unteers who traveled to Mississippi for Freedom Summer were white.77
In theory, these cross-racial coalitions should form naturally today. As of 2012, the South’s poverty rate was at 16.5 percent, the highest of the four U.S. Census-designated regions,78 and this poverty cuts across racial lines. A 2006 poll showed that white southerners hold populist views similar to their black neighbors, with the majority of white southerners agreeing that government should spend more on health, education, and improving people’s standards of living.
However, white conservative leaders have systematically undermined these coali-tions by playing up racially divisive wedge issues. This has been the case from the days of the Dixiecrats through Richard Nixon and up to present-day politi-cians such as South Carolina Gov. Nikki Haley (R), who has refused to remove a Confederate battle flag from the state capitol grounds.79
For the most part, this strategy of divide and conquer has worked: In recent years, working-class whites in the Black Belt have consistently voted differently than voters of color, even if this has meant voting against their economic self-interest. On the state level, whites in the Black Belt continuously vote for governors who favor small government and conservative economic policies. On the national level, white voters in the Black Belt overwhelmingly supported the GOP presidential ticket of former Gov. Mitt Romney (R-MA) and Rep. Paul Ryan (R-WI) in 2012 despite Romney’s promise to cut funding for government services and Ryan’s record of supporting draconian federal budget cuts.80

20 Center for American Progress | True South
Still, the changing dynamics described in the previous sections provide an opportunity to overcome this polarization. From Maryland to North Carolina to Georgia, we have seen multiracial coalitions come forward to advocate for pro-gressive change, including the “Moral Mondays” movement in numerous states. Below are a series of case studies that show what cross-race coalitions can look like in the Black Belt today.
Georgia and criminal justice reform
In the past few years, Georgia has passed three different pieces of criminal justice reform legislation that will help shrink the state’s bloated criminal justice system.
As of 2009, 1 out of every 13 Georgians was under criminal justice supervision of some form—the highest rate in the nation.81
In 2012, the legislature passed H.B. 1176, a bipartisan bill to implement what has been termed a “smart on crime” criminal justice policies. The bill reduced sentences for nonviolent drug offenses and increased the felony threshold for minor crimes. A companion bill quintupled funding for accountability courts, which provide an alternative to incarceration for drug offenders.82 Since then, Georgia Gov. Nathan Deal has signed two more criminal justice reform bills—H.B. 242, which rewrote the state’s juvenile justice code, and H.B. 349, which expanded the reforms of H.B. 1176. The reforms were projected to save the state $264 million over five years.83
Criminal justice reform has been a priority for civil rights activists in Georgia for years. Yet the movement for justice reform in the state only started to gain momentum in 2011 when the Georgia legislature created the “Special Council on Criminal Justice Reform,” which is tasked with studying the system and making recommendations.84 The special council brought together different leaders from all different backgrounds—whites and people of color, religious leaders, progres-sives, fiscal conservatives, business leaders, youth activists, and more—to explore the issue. The reform legislation was ultimately successful because it had support from each community.

21 Center for American Progress | True South
Mississippi and universal pre-K
As of 2013, Mississippi was 1 of only 10 states in the country not to offer state-funded pre-K. Where pre-K was offered, it was a patchwork. As of 2012, only one-third of Mississippi school districts budgeted for pre-K.85
Then the nonprofit group Mississippi First entered the picture. It authored a report that made a case for pre-K and held press conferences, rallies, and events to promote the cause.86 As a result of the group’s efforts, the legislature passed the Early Learning Collaborative Act of 2013, which provided funding for collab-orative councils that would be charged with providing pre-K across the state. In December 2013, a total of 11 different collaboratives across Mississippi were given state funding to start pre-K programs.
Mississippi First succeeded in large measure because it brought together a wide group of people from different backgrounds—whites and people of color. The group also made the case for pre-K into an economic argument that hit home with people of all different backgrounds. For instance, Mississippi First argued that lack of early education leads to higher rates of teenage pregnancy, which costs Mississippi $155 million each year. Meanwhile, the group argued that $155 million each year could pay for high-quality pre-K education for 97 percent of Mississippi’s four-year-olds.87
Lesson 3: A successful movement is a marathon, not a sprint
The organizers of Freedom Summer did not just have a one-year plan. The sum-mer of 1964 was always meant to be the beginning of a multi-faceted, multi-year campaign. Any modern movement to build a more inclusive Black Belt needs to be seen as a generational battle.
One great advantage of adopting a generational mindset is the ability to build young leaders. Freedom Summer spawned a great number of leaders who would go on to become elected officials, people such as former Georgia State Sen. Julian Bond (D) and Rep. John Lewis (D), as well as organizers who would be involved in the movement for decades, including Hollis Watkins and Heather Booth, both of whom have gone on to lead civil rights advocacy campaigns over the ensuing five decades.88

22 Center for American Progress | True South
This mindset is also necessary for building political power with or without a star candidate. The 2012 presidential election was the first time in recorded his-tory that blacks turned out to a vote at a higher rate than non-Hispanic whites.89 Many pundits attributed this to the fact that Obama was on the ticket. While this was certainly a factor, it is also true that the rate of black voter turnout has been increasing steadily over the past 20 years.90 The historic 2012 black voter turnout rate was not a one-time phenomenon; it was the end result of a sustained period of voter registration and mobilization.
Finally, this mindset is important for maintaining turnout levels during midterm elections. As demonstrated in this report, the turnout rate for midterm election years is historically lower than that for presidential election years.91 This cyclical drop-off has a huge impact on races from governor and congressman all the way down the ticket. This is especially relevant for the demographics discussed in this paper. A Voter Participation Center report on the voting habits of the “Rising American Electorate”—people of color, unmarried women, and youth voters ages 18 to 29 years old—estimates that as many as 21 million members of this group who turned out to vote in 2012 may not vote in the 2014 election.92

23 Center for American Progress | True South
Conclusion
Political activists have been limited for too long by a vision of the Black Belt as a shut door—the “Solid South” of yesteryear, artificially constrained by the long-lingering legacy of intentionally cultivated racial division. This vision is out of date. The demographic and other trends discussed in this report show that there is an opportunity to bring true political equality to the Black Belt.
For an example of what this can look like in practice, consider Maryland.
It is easy to forget that Maryland enslaved half its population at the time of the Civil War and that it is the state from which Harriet Tubman and Frederick Douglass escaped. Yet Maryland sits below the Mason-Dixon Line, and it prac-ticed legalized segregation up until 1954.93
In the past few years, however, Maryland has seen the most successful run of civil rights legislation of any state in recent history. In just two years, Gov. Martin O’Malley (D) signed bills to abolish the death penalty, legalize same-sex marriage, decriminalize small amounts of marijuana, and extend early voting and same-day registration.94
Maryland’s run of progressive policy has been partly a result of broad-based coalition building and partly a result of changing demographics; from 2000 to 2010 the popu-lation share for non-Hispanic whites dropped 7 percentage points to 54.7 percent.95 It is certainly the end result of decades of organizing. Maryland shows what can happen when people come together across old lines of separation and division to promote progressive values and policies. Maryland is not seceding from the South, instead it is demonstrating what the South’s future can and should be.

24 Center for American Progress | True South
Methodology
In order to simulate an actual election, we used two sets of numbers for registra-tion and turnout rates—an average for the past two presidential election years in 2008 and 2012, as well as an average for the past two midterm election years in 2006 and 2010—when no presidential candidate was on the ticket.
Using these data, we asked how many new voters would be created if turnout rates were held steady. We then compared that number of new voters to the balance of power in each state—which is defined as the net margin of victory over the past three gubernatorial elections.
There are a few caveats. First, these numbers are benchmarks; although it would be very difficult to register 90 percent of unregistered voters in any commu-nity in any state, we present the scenario to illustrate that communities of color have the capacity to enact political change. Second, this analysis assumes that no new white voters are registered; but it also assumes that whites in the Black Belt do not change their voting patterns in the coming years. Third, the numbers included here are based on data from the 2006–2012 Current Population Survey’s November Supplements and are therefore estimates; however, these are the only data where state-level estimates of voting registration behavior were available. We have rounded all final numbers to the nearest hundred. Finally, in certain states, the number of Hispanic or Asian voters was too small to calculate turnout rates. In these cases, we used the nation-wide turnout rate for that community and marked the final estimate of “new voters” with an asterisk.
* Correction, June 16, 2014: This report incorrectly stated the population of people defining themselves as “black” or “mixed-raced black” in the South between 2000 and 2010. This population actually grew by 18 percent over that time period. This report incorrectly stated the growth of the Hispanic population in the South in the first decade of the new millennium. The correct number is 18,227,508. This report incorrectly stated the year in which 6.7 percent of eligible black voters in the state were registered to vote, the lowest of any state in the country. The correct year is 1962. An earlier version of this report contained an incomplete list of the Black Belt states. This list has been updated to include Virginia. This report incorrectly stated the numbers of “new voters” created by register-ing 30 percent or 60 percent of unregistered blacks, Hispanics, and Asians and Georgia. The correct numbers are 185,000 and 369,000, respectively.

25 Center for American Progress | True South
About the author
Ben Jealous is a Senior Fellow at American Progress. He is the former president and CEO of the NAACP and currently works as a partner at Kapor Capital, an Oakland-based firm that leverages the technology sector to create progressive social change. At American Progress, he will focus on tracking political trends that affect civil and human rights and will contribute to developing policy solutions that ensure equity and opportunity for all Americans.
Jealous was elected to lead the NAACP in 2008. During his tenure, he focused the organization on voting rights and criminal justice reform and oversaw the launch of several national programs on education, health, and environmental justice. Jealous was the youngest person ever appointed to lead the organization and expanded the NAACP’s capacity to organize around issues pertaining to the economy and voter registration and mobilization.
Jealous’ career began in 1991, when he served as a community organizer in Harlem with the NAACP Legal Defense Fund. Among his many achievements and accolades, Jealous was named one of Time‘s “40 Under 40″ rising stars of American politics in 2010 and was recently designated as a young global leader by the World Economic Forum.
A graduate of Columbia University and Oxford University and a Rhodes scholar, Jealous also served as the president of the Rosenberg Foundation and was the founding director of Amnesty International’s U.S. Human Rights Program.

26 Center for American Progress | True South
Acknowledgments
The author would like to acknowledge the financial support of the Hunt Alternatives Fund, Ford Foundation, Black Civic Engagement Fund, and PowerPAC Foundation. The author would also like to thank Ben Wrobel for his help with research and edit-ing, as well as the staff at CAP who helped edit this report.
The Center for American Progress thanks the above-mentioned funders for their support of our report. The views and opinions expressed in this report are those of Center for American Progress, the Southern Elections Foundation, and the authors and do not necessarily reflect the position of the funders. The Center for American Progress produces independent research and policy ideas driven by solutions that we believe will create a more equitable and just world.

27 Center for American Progress | True South
Appendix A
State-by-state analysis of voting trends in Black Belt states

28 Center for American Progress | True South
Alabama
8,000
Voter profiles
Black
Turnout rate for registered voters: 90.6%
200,000
100,000
030% 60% 90% 30% 60% 90%
Presidentialelection year
average
Hispanic Asian
* For populations with small sample sizes, nationwide turnout rates are used as a baseline. Note: Figures are rounded. See Methodology section for more information.
Turnout rate for registered voters: 67.5%
Turnout rate for registered voters*: 82.8%
Turnout rate for registered voters*: 51.6%
Turnout rate for registered voters: N/A
Turnout rate for registered voters: N/A
881,400 eligible voters 20,890 eligible voters 16,600 eligible voters
845,800 eligible voters 40,500 eligible voters 10,900 eligible voters
553,300
17,300 7,600
12,800270,600
252,900
610,800
400,300592,900
N/AN/A
N/AN/A
N/AN/A23,200
Presidential election yearaverage
Average margin of
victory of past three gubernatorial
elections:
145,460R
13,600
Midtermelection year
average
Number of new black voters if X percent registered
Midterm election yearaverage
Number of new black, Hispanic, and Asian voters if X percent registered
Note: Number of new voters if X percent of unregistered eligible voters are registered, and turnout rates remain at previous levels = Margin of victory favors Republicans; = Margin of victory favors Democrats
Source: National Bureau of Economic Research, “NBER CPS Supplements,” available at http://www.nber.org/data/current-population-survey-data.html (last accessed May 2014).
DR
Unregistered
Actual voters ( )
Registered ( )
# #
#

29 Center for American Progress | True South
Arkansas
11,200
Voter profiles
Black
Turnout rate for registered voters: 81.7%
120,000
80,000
40,000
030% 60% 90% 30% 60% 90%
Presidentialelection year
average
Hispanic Asian
Note: Figures are rounded. See Methodology section for more information.
Turnout rate for registered voters: 59.5%
Turnout rate for registered voters: 65.0%
Turnout rate for registered voters: 67.0%
Turnout rate for registered voters: N/A
Turnout rate for registered voters: N/A
304,100 eligible voters 46,400 eligible voters 15,700 eligible voters
303,200 eligible voters 49,500 eligible voters 16,000 eligible voters
143,800
34,900 9,900
34,600128,000
133,800
176,100
100,800169,400
8,60011,800
14,600
Presidential election yearaverage
9,800
Midtermelection year
average
Number of new black voters if X percent registered
N/AN/A
N/AN/A
Average margin of
victory of past three gubernatorial
elections:
100,425R
Midterm election yearaverage
Number of new black, Hispanic, and Asian voters if X percent registered
Note: Number of new voters if X percent of unregistered eligible voters are registered, and turnout rates remain at previous levels = Margin of victory favors Republicans; = Margin of victory favors Democrats
Source: National Bureau of Economic Research, “NBER CPS Supplements,” available at http://www.nber.org/data/current-population-survey-data.html (last accessed May 2014).
DR
Unregistered
Actual voters ( )
Registered ( )
# #
#

30 Center for American Progress | True South
Delaware
3,000
Voter profiles
Black
Turnout rate for registered voters: 93.9%
100,000
50,000
030% 60% 90% 30% 60% 90%
Presidentialelection year
average
Hispanic Asian
Note: Figures are rounded. See Methodology section for more information.
Turnout rate for registered voters: 73.0%
Turnout rate for registered voters: 81.6%
Turnout rate for registered voters: 58.4%
Turnout rate for registered voters: 67.7%
Turnout rate for registered voters: 74.0%
124,300 eligible voters 21,800 eligible voters 10,800 eligible voters
118,300 eligible voters 20,500 eligible voters 10,600 eligible voters
80,300
12,200 3,800
11,50038,800
44,200
85,500
54,20074,100
8,50010,300
8,300
4,9006,800
5,2007,800
Presidential election yearaverage
Average margin of
victory of past three gubernatorial
elections:
106,979
4,900
Midtermelection year
average
D
Number of new black voters if X percent registered
Midterm election yearaverage
Number of new black, Hispanic, and Asian voters if X percent registered
Note: Number of new voters if X percent of unregistered eligible voters are registered, and turnout rates remain at previous levels = Margin of victory favors Republicans; = Margin of victory favors Democrats
Source: National Bureau of Economic Research, “NBER CPS Supplements,” available at http://www.nber.org/data/current-population-survey-data.html (last accessed May 2014).
DR
Unregistered
Actual voters ( )
Registered ( )
# #
#

31 Center for American Progress | True South
Florida
115,700
Voter profiles
Black
Turnout rate for registered voters: 90.1%
1,200,000
800,000
400,000
030% 60% 90% 30% 60% 90%
Presidentialelection year
average
Hispanic Asian
Note: Figures are rounded. See Methodology section for more information.
Turnout rate for registered voters: 67.4%
Turnout rate for registered voters: 87.6%
Turnout rate for registered voters: 62.7%
Turnout rate for registered voters: 88.8%
Turnout rate for registered voters: 52.3%
1,699,100 eligible voters 2,119,100 eligible voters 261,300 eligible voters
1,660,100 eligible voters 1,867,400 eligible voters 225,900 eligible voters
990,800
787,000 124,600
618,200597,800
663,200
1,101,300
672,700996,900
1,313,3001,500,900
1,080,40053,100
101,300
129,800145,600
Presidential election yearaverage
Average margin of
victory of past three gubernatorial
elections:
352,841R
688,300
Midtermelection year
average
Number of new black voters if X percent registered
Midterm election yearaverage
Number of new black, Hispanic, and Asian voters if X percent registered
Note: Number of new voters if X percent of unregistered eligible voters are registered, and turnout rates remain at previous levels = Margin of victory favors Republicans; = Margin of victory favors Democrats
Source: National Bureau of Economic Research, “NBER CPS Supplements,” available at http://www.nber.org/data/current-population-survey-data.html (last accessed May 2014).
DR
Unregistered
Actual voters ( )
Registered ( )
# #
#

32 Center for American Progress | True South
Georgia
107,400
Voter profiles
Black
Turnout rate for registered voters: 91.3%
Presidentialelection year
average
Hispanic Asian
Note: Figures are rounded. See Methodology section for more information.
Turnout rate for registered voters: 70.3%
Turnout rate for registered voters: 83.1%
Turnout rate for registered voters: 62.2%
Turnout rate for registered voters: 92.5%
Turnout rate for registered voters: 64.7%
1,970,100 eligible voters 236,100 eligible voters 184,500 eligible voters
1,852,600 eligible voters 185,200 eligible voters 126,700 eligible voters
1,305,800
117,900 85,700
91,100539,000
692,100
1,431,100
818,9001,160,500
120,700145,000
67,300
24,50041,000
72,10077,100
41,700
Midtermelection year
average
Number of new black voters if X percent registered
600,000
400,000
200,000
030% 60% 90% 30% 60% 90%
Presidential election yearaverage
Average margin of
victory of past three gubernatorial
elections:
260,703R
Midterm election yearaverage
Number of new black, Hispanic, and Asian voters if X percent registered
Note: Number of new voters if X percent of unregistered eligible voters are registered, and turnout rates remain at previous levels = Margin of victory favors Republicans; = Margin of victory favors Democrats
Source: National Bureau of Economic Research, “NBER CPS Supplements,” available at http://www.nber.org/data/current-population-survey-data.html (last accessed May 2014).
DR
Unregistered
Actual voters ( )
Registered ( )
# #
#

33 Center for American Progress | True South
Louisiana
11,600
Voter profiles
Black
Turnout rate for registered voters: 89.4%
300,000
200,000
100,000
030% 60% 90% 30% 60% 90%
Presidentialelection year
average
Hispanic Asian
Note: Figures are rounded. See Methodology section for more information.
Turnout rate for registered voters: 59.3%
Turnout rate for registered voters: 82.8%
Turnout rate for registered voters: 65.5%
Turnout rate for registered voters: N/A
Turnout rate for registered voters: N/A
955,000 eligible voters 64,100 eligible voters 17,600 eligible voters
928,600 eligible voters 62,600 eligible voters 18,000 eligible voters
650,600
24,80011,200
16,200227,500
261,100
727,500
399,500667,500
39,80047,900
37,800
Presidential election yearaverage
23,600
Midtermelection year
average
Number of new black voters if X percent registered
N/AN/A
N/AN/A
Average margin of
victory of past three gubernatorial
elections:
302,916R
Midterm election yearaverage
Number of new black, Hispanic, and Asian voters if X percent registered
Note: Number of new voters if X percent of unregistered eligible voters are registered, and turnout rates remain at previous levels = Margin of victory favors Republicans; = Margin of victory favors Democrats
Source: National Bureau of Economic Research, “NBER CPS Supplements,” available at http://www.nber.org/data/current-population-survey-data.html (last accessed May 2014).
DR
Unregistered
Actual voters ( )
Registered ( )
# #
#

34 Center for American Progress | True South
Maryland
56,600
Voter profiles
Black
Turnout rate for registered voters: 93.8%
300,000
200,000
100,000
030% 60% 90% 30% 60% 90%
Presidentialelection year
average
Hispanic Asian
Note: Figures are rounded. See Methodology section for more information.
Turnout rate for registered voters: 75.7%
Turnout rate for registered voters: 93.9%
Turnout rate for registered voters: 73.4%
Turnout rate for registered voters: 82.8%
Turnout rate for registered voters: 64.2%
1,083,400 eligible voters 160,600 eligible voters 142,200 eligible voters
1,072,300 eligible voters 155,800 eligible voters 121,600 eligible voters
769,000
69,000 67,500
56,500263,400
364,700
820,000
536,400707,600
97,300104,100
86,80033,80054,100
70,80085,600
Presidential election yearaverage
Average margin of
victory of past three gubernatorial
elections:
106,429
63,200
Midtermelection year
average
D
Number of new black voters if X percent registered
Midterm election yearaverage
Number of new black, Hispanic, and Asian voters if X percent registered
Note: Number of new voters if X percent of unregistered eligible voters are registered, and turnout rates remain at previous levels = Margin of victory favors Republicans; = Margin of victory favors Democrats
Source: National Bureau of Economic Research, “NBER CPS Supplements,” available at http://www.nber.org/data/current-population-survey-data.html (last accessed May 2014).
DR
Unregistered
Actual voters ( )
Registered ( )
# #
#

35 Center for American Progress | True South
Mississippi
9,400
Voter profiles
Black
Turnout rate for registered voters: 90.0%
120,000
80,000
40,000
030% 60% 90% 30% 60% 90%
Presidentialelection year
average
Hispanic Asian
* For populations with small sample sizes, nationwide turnout rates are used as a baseline. Note: Figures are rounded. See Methodology section for more information.
Turnout rate for registered voters: 67.8%
Turnout rate for registered voters*: 63.5%
Turnout rate for registered voters: N/A
Turnout rate for registered voters: N/A
Turnout rate for registered voters: N/A
731,200 eligible voters 15,900 eligible voters 12,000 eligible voters
719,500 eligible voters 11,600 eligible voters 13,900 eligible voters
568,400
9,100 7,900
8,50099,800
193,300
631,400
356,700526,200
6,0007,400
Presidential election yearaverage
Average margin of
victory of past three gubernatorial
elections:
124,808R
Midtermelection year
average
Number of new black voters if X percent registered
N/AN/A
N/AN/A
N/AN/A
Midterm election yearaverage
Number of new black, Hispanic, and Asian voters if X percent registered
Note: Number of new voters if X percent of unregistered eligible voters are registered, and turnout rates remain at previous levels = Margin of victory favors Republicans; = Margin of victory favors Democrats
Source: National Bureau of Economic Research, “NBER CPS Supplements,” available at http://www.nber.org/data/current-population-survey-data.html (last accessed May 2014).
DR
Unregistered
Actual voters ( )
Registered ( )
# #
#

36 Center for American Progress | True South
North Carolina
29,300
Voter profiles
Black
Turnout rate for registered voters: 94.6%
300,000
200,000
100,000
030% 60% 90% 30% 60% 90%
Presidentialelection year
average
Midtermelection year
average
Hispanic Asian
* For populations with small sample sizes, nationwide turnout rates are used as a baseline. Note: Figures are rounded. See Methodology section for more information.
Turnout rate for registered voters: 59.6%
Turnout rate for registered voters: 87.7%
Turnout rate for registered voters: 51.4%
Turnout rate for registered voters*: 82.0%
Turnout rate for registered voters: 44.6%
1,401,700 eligible voters 143,800 eligible voters 72,800 eligible voters
1,331,600 eligible voters 124,200 eligible voters 71,000 eligible voters
1,046,500
55,600 21,800
44,700296,000
511,200
1,105,700
491,300820,400
86,10099,100
68,600
22,90049,200
38,20043,500
Presidential election yearaverage
Average margin of
victory of past three gubernatorial
elections:
24,288R
44,200
Midtermelection year
average
Number of new black voters if X percent registered
Midterm election yearaverage
Number of new black, Hispanic, and Asian voters if X percent registered
Note: Number of new voters if X percent of unregistered eligible voters are registered, and turnout rates remain at previous levels = Margin of victory favors Republicans; = Margin of victory favors Democrats
Source: National Bureau of Economic Research, “NBER CPS Supplements,” available at http://www.nber.org/data/current-population-survey-data.html (last accessed May 2014).
DR
Unregistered
Actual voters ( )
Registered ( )
# #
#

37 Center for American Progress | True South
South Carolina
9,000
Voter profiles
Black
Turnout rate for registered voters: 93.0%
200,000
100,000
030% 60% 90% 30% 60% 90%
Presidentialelection year
average
Hispanic Asian
* For populations with small sample sizes, nationwide turnout rates are used as a baseline. Note: Figures are rounded. See Methodology section for more information.
Turnout rate for registered voters: 75.1%
Turnout rate for registered voters: 80.6%
Turnout rate for registered voters: 49.7%
Turnout rate for registered voters: N/A
Turnout rate for registered voters*: 61.9%
879,200 eligible voters 37,300 eligible voters 21,800 eligible voters
856,200 eligible voters 40,100 eligible voters 18,800 eligible voters
623,100
28,000 9,300
16,200208,600
259,600
670,600
448,500596,600
16,90021,100
12,1005,8009,500
12,800N/A
Presidential election yearaverage
Average margin of
victory of past three gubernatorial
elections:
79,021R
5,400
Midtermelection year
average
Number of new black voters if X percent registered
Midterm election yearaverage
Number of new black, Hispanic, and Asian voters if X percent registered
Note: Number of new voters if X percent of unregistered eligible voters are registered, and turnout rates remain at previous levels = Margin of victory favors Republicans; = Margin of victory favors Democrats
Source: National Bureau of Economic Research, “NBER CPS Supplements,” available at http://www.nber.org/data/current-population-survey-data.html (last accessed May 2014).
DR
Unregistered
Actual voters ( )
Registered ( )
# #
#

38 Center for American Progress | True South
Tennessee
34,000
Voter profiles
Black
Turnout rate for registered voters: 90.6%
250,000
125,000
030% 60% 90% 30% 60% 90%
Presidentialelection year
average
Hispanic Asian
Note: Figures are rounded. See Methodology section for more information.
Turnout rate for registered voters: 64.9%
Turnout rate for registered voters: 85.1%
Turnout rate for registered voters: 51.5%
Turnout rate for registered voters: 85.3%
Turnout rate for registered voters: 34.8%
682,200 eligible voters 103,700 eligible voters 52,500 eligible voters
670,200 eligible voters 55,200 eligible voters 34,100 eligible voters
408,400
30,500 20,800
31,700230,300
278,600
451,900
253,000391,600
58,90072,000
24,7004,700
13,300
14,90018,500
Presidential election yearaverage
Average margin of
victory of past three gubernatorial
elections:
80,628R
12,600
Midtermelection year
average
Number of new black voters if X percent registered
Midterm election yearaverage
Number of new black, Hispanic, and Asian voters if X percent registered
Note: Number of new voters if X percent of unregistered eligible voters are registered, and turnout rates remain at previous levels = Margin of victory favors Republicans; = Margin of victory favors Democrats
Source: National Bureau of Economic Research, “NBER CPS Supplements,” available at http://www.nber.org/data/current-population-survey-data.html (last accessed May 2014).
DR
Unregistered
Actual voters ( )
Registered ( )
# #
#

39 Center for American Progress | True South
Texas
208,500
Voter profiles
Black
Turnout rate for registered voters: 87.5%
2,000,000
1,000,000
030% 60% 90% 30% 60% 90%
Presidentialelection year
average
Hispanic Asian
Note: Figures are rounded. See Methodology section for more information.
Turnout rate for registered voters: 59.0%
Turnout rate for registered voters: 70.4%
Turnout rate for registered voters: 43.5%
Turnout rate for registered voters: 74.9%
Turnout rate for registered voters: 49.4%
1,930,400 eligible voters 4,679,700 eligible voters 455,100 eligible voters
1,855,700 eligible voters 4,047,400 eligible voters 453,400 eligible voters
1,249,400
1,800,100 251,700
2,133,600501,200
677,500
1,429,200
696,4001,178,200
1,793,9002546100
2,247,30097,200
201,700
182,700246600
Presidential election yearaverage
Average margin of
victory of past three gubernatorial
elections:
616,807R
978,300
Midtermelection year
average
Number of new black voters if X percent registered
Midterm election yearaverage
Number of new black, Hispanic, and Asian voters if X percent registered
Note: Number of new voters if X percent of unregistered eligible voters are registered, and turnout rates remain at previous levels = Margin of victory favors Republicans; = Margin of victory favors Democrats
Source: National Bureau of Economic Research, “NBER CPS Supplements,” available at http://www.nber.org/data/current-population-survey-data.html (last accessed May 2014).
DR
Unregistered
Actual voters ( )
Registered ( )
# #
#

40 Center for American Progress | True South
Virginia
74,100
Voter profiles
Black
Turnout rate for registered voters: 93.5%
400,000
200,000
030% 60% 90% 30% 60% 90%
Presidentialelection year
average
Hispanic Asian
* For populations with small sample sizes, nationwide turnout rates are used as a baseline. Note: Figures are rounded. See Methodology section for more information.
Turnout rate for registered voters: 67.8%
Turnout rate for registered voters*: 87.3%
Turnout rate for registered voters: 59.7%
Turnout rate for registered voters: 87.3%
Turnout rate for registered voters: 46.0%
1,019,300 eligible voters 143,100 eligible voters 227,000 eligible voters
1,000,600 eligible voters 178,200 eligible voters 216,700 eligible voters
694,500
108,900 101,000
49,000276,200
469,900
743,100
359,800530,700
88,80094,100
69,300
49,700115,700
133,500152,900
Presidential election yearaverage
Average margin of
victory of past three gubernatorial
elections:
58,168R
40,400
Midtermelection year
average
Number of new black voters if X percent registered
Midterm election yearaverage
Number of new black, Hispanic, and Asian voters if X percent registered
Note: Number of new voters if X percent of unregistered eligible voters are registered, and turnout rates remain at previous levels = Margin of victory favors Republicans; = Margin of victory favors Democrats
Source: National Bureau of Economic Research, “NBER CPS Supplements,” available at http://www.nber.org/data/current-population-survey-data.html (last accessed May 2014).
DR
Unregistered
Actual voters ( )
Registered ( )
# #
#

41 Center for American Progress | True South
Appendix B
Alabama Percent registered
Average margin of victory: 145,460 30% 60% 90%
Presidential election year average New black voters 73,600 147,100 220,700
New black, Hispanic, and Asian voters* 76,700 153,500 230,200
Midterm election year average New black voters 51,200 102,500 153,700
New black, Hispanic, and Asian voters 53,900 107,900 161,800
Arkansas Percent registered
Average margin of victory: 100,425 30% 60% 90%
Presidential election year average New black voters 31,400 62,800 94,100
New black, Hispanic, and Asian voters 38,100 76,300 114,400
Midterm election year average New black voters 23,900 47,800 71,600
New black, Hispanic, and Asian voters 30,900 61,700 92,600
Delaware Percent registered
Average margin of victory: 106,979 30% 60% 90%
Presidential election year average New black voters 10,900 21,800 32,800
New black, Hispanic, and Asian voters 14,400 28,700 43,100
Midterm election year average New black voters 9,700 19,300 29,000
New black, Hispanic, and Asian voters 12,600 25,300 37,900
Florida Percent registered
Average margin of victory: 352,841 30% 60% 90%
Presidential election year average New black voters 161,600 323,200 484,700
New black, Hispanic, and Asian voters 354,800 709,700 1,064,500
Midterm election year average New black voters 134,200 268,300 402,500
New black, Hispanic, and Asian voters 301,700 603,500 905,200
* For populations with small sample sizes, nationwide turnout rates are used as a baseline.

42 Center for American Progress | True South
Georgia Percent registered
Average margin of victory: 260,703 30% 60% 90%
Presidential election year average New black voters 147,600 295,100 442,700
New black, Hispanic, and Asian voters 200,100 400,200 600,300
Midterm election year average New black voters 146,000 292,000 437,900
New black, Hispanic, and Asian voters 184,600 369,200 553,900
Louisiana Percent registered
Average margin of victory: 302,916 30% 60% 90%
Presidential election year average New black voters 61,000 122,000 183,000
New black, Hispanic, and Asian voters 65,000 130,000 195,000
Midterm election year average New black voters 46,400 92,800 139,200
New black, Hispanic, and Asian voters 51,300 102,600 153,900
Maryland Percent registered
Average margin of victory: 106,429 30% 60% 90%
Presidential election year average New black voters 74,100 148,200 222,300
New black, Hispanic, and Asian voters 104,100 208,200 312,300
Midterm election year average New black voters 82,800 165,600 248,400
New black, Hispanic, and Asian voters 111,000 221,900 332,900
Mississippi Percent registered
Average margin of victory: 124,808 30% 60% 90%
Presidential election year average New black voters 26,900 53,900 80,800
New black, Hispanic, and Asian voters* 28,600 57,100 85,700
Midterm election year average New black voters 39,300 78,700 118,000
New black, Hispanic, and Asian voters 39,300 78,700 118,000
North Carolina Percent registered
Average margin of victory: 24,288 30% 60% 90%
Presidential election year average New black voters 84,000 168,100 252,100
New black, Hispanic, and Asian voters* 103,000 206,000 309,000
Midterm election year average New black voters 91,400 182,700 274,100
New black, Hispanic, and Asian voters 102,800 205,700 308,500
* For populations with small sample sizes, nationwide turnout rates are used as a baseline.

43 Center for American Progress | True South
South Carolina Percent registered
Average margin of victory: 79,021 30% 60% 90%
Presidential election year average New black voters 58,200 116,400 174,600
New black, Hispanic, and Asian voters 62,100 124,300 186,400
Midterm election year average New black voters 58,500 116,900 175,400
New black, Hispanic, and Asian voters* 64,400 128,800 193,100
Tennessee Percent registered
Average margin of victory: 80,628 30% 60% 90%
Presidential election year average New black voters 62,600 125,200 187,800
New black, Hispanic, and Asian voters* 78,600 157,100 235,700
Midterm election year average New black voters 54,300 108,500 162,800
New black, Hispanic, and Asian voters 61,100 122,300 183,400
Texas Percent registered
Average margin of victory: 616,807 30% 60% 90%
Presidential election year average New black voters 131,600 263,100 394,700
New black, Hispanic, and Asian voters 629,100 1,258,200 1,887,300
Midterm election year average New black voters 119,900 239,800 359,700
New black, Hispanic, and Asian voters 392,300 784,700 1,177,000
Virginia Percent registered
Average margin of victory: 58,168 30% 60% 90%
Presidential election year average New black voters 77,500 154,900 232,400
New black, Hispanic, and Asian voters* 109,700 219,400 329,100
Midterm election year average New black voters 95,600 191,100 286,700
New black, Hispanic, and Asian voters 129,000 258,000 387,000
* For populations with small sample sizes, nationwide turnout rates are used as a baseline.

44 Center for American Progress | True South
Endnotes
1 Kari Fredrickson, The Dixiecrat Revolt and the End of the Solid South: 1932-1968 (Chapel Hill, NC: The University of North Carolina Press, 2001).
2 Alan I. Abramowitz, “Why Section 5 Is Still Needed: Ra-cial Polarization And The Voting Rights Act In The 21st Century,” The University of Virginia Center for Politics, March 7, 2013, available at http://www.centerforpoli-tics.org/crystalball/articles/why-section-5-is-still-need-ed-racial-polarization-and-the-voting-rights-act-in-the-21st-century/.
3 Wendy Underhill, “Voter Identification Requirements,” National Conference of State Legislatures, April 30, 2014, available at http://www.ncsl.org/research/elections-and-campaigns/voter-id.aspx
4 The Kaiser Family Foundation, “Status of State Action on the Medicaid Expansion Decision, 2014,” available at http://kff.org/health-reform/state-indicator/state-activ-ity-around-expanding-medicaid-under-the-affordable-care-act/ (last accessed June 2014).
5 National Right to Work, “Right to Work States,” available at http://www.nrtw.org/rtws.htm (last accessed May 2014).
6 Anna Chu and Charles Posner, “The State of Women in America” (Washington: Center for American Progress, 2013), available at http://www.americanprogress.org/wp-content/uploads/2013/09/StateOfWomen-4.pdf.
7 American Civil Liberties Union, “We Vow to Fight,” available at https://www.aclu.org/whats-stake-sb-1070-supreme-court-0 (last accessed May 2014).
8 Brennan Center for Justice, “Overview: Voting Law Changes in 2012” (2011), available at http://www.bren-nancenter.org/sites/default/files/legacy/Democracy/VRE/Voting%20Law%20Changes%20in%202012%20Fact%20Sheet%20Four%20Pages%20Separate.pdf.
9 Dave Mistich, “Five Facts About West Virginia’s Coal, Energy, and Carbon Emissions, “ West Virginia Public Broadcasting, June 2, 2014, available at http://wvpublic.org/post/where-does-west-virginia-stand-nationally-coal-energy-and-carbon-emissions.
10 NAACP, “Coal Blooded,” available at http://www.naacp.org/pages/coal-blooded1 (last accessed May 2014).
11 BlackPast.org, “Major African American Office Holders Since 1641,” available at http://www.blackpast.org/aah/major-african-american-office-holders (last accessed May 2014).
12 Census of the Bureau, Census Regions and Divisions of the United States (U.S. Department of Commerce, 2014), available at http://www.census.gov/geo/maps-data/maps/pdfs/reference/us_regdiv.pdf.
13 This section refers to U.S. Census data on the U.S. South whenever state-by-state information is not available. Data on the U.S. South correspond closely with data on the Black Belt.
14 Bureau of the Census, Census Regions and Divisions of the United States.
15 Ruy Teixeira and John Halpin, “Building an All-In Na-tion: A View from the American Public” (Washington: Center for American Progress, 2013), available at http://www.americanprogress.org/issues/race/re-port/2013/10/22/77665/building-an-all-in-nation/.
16 Karen R. Humes, Nicholas A. Jones, and Roberto R. Ramirez, “Overview of Race and Hispanic Origin: 2010” (Washington: Bureau of the Census, 2011), available at http://www.census.gov/prod/cen2010/briefs/c2010br-02.pdf.
17 John Halpin and Karl Agne, “State of American Political Ideology, 2009” (Washington: Center for American Progress, 2009), available at http://www.american-progress.org/wp-content/uploads/issues/2009/03/pdf/political_ideology.pdf.
18 Nate Cohn, “Southern Whites’ Loyalty to G.O.P. Nearing That of Blacks to Democrats,” The New York Times, April 23, 2014, available at http://www.nytimes.com/2014/04/24/upshot/southern-whites-loyalty-to-gop-nearing-that-of-blacks-to-democrats.html?hpw&rref=&_r=0.
19 In Motion, “The Second Great Migration,” available at http://www.inmotionaame.org/print.cfm;jsessionid=f830147771400524903344?migration=9&bhcp=1 (last accessed May 2014).
20 Sabrina Tavernise and Robert Gebeloff, “Many U.S. Blacks Moving to South, Reversing Trend,” The New York Times, March 24, 2011, available at http://www.nytimes.com/2011/03/25/us/25south.html?pagewanted=all&_r=3&.
21 Sonya Rastogi and others, “The Black Population: 2010” (Washington: Bureau of the Census, 2011), available at http://www.census.gov/prod/cen2010/briefs/c2010br-06.pdf.
22 Tavernise and Gebeloff, “Many U.S. Blacks Moving to South, Reversing Trend.”
23 Sharon R. Ennis, Merarys Ríos-Vargas, and Nora G. Albert, “The Hispanic Population: 2010” (Washington: Bureau of the Census, 2011), available at http://www.census.gov/prod/cen2010/briefs/c2010br-04.pdf.
24 Pew Research Center, “Statistical Portrait of Hispanics in The United States, 2011” (2011), available at http://www.pewhispanic.org/files/2013/02/Statistical-Por-trait-of-Hispanics-in-the-United-States-2011_FINAL.pdf.
25 Elizabeth M. Hoeffel, “The Asian Population: 2010” (Washington: Bureau of the Census, 2012), available at http://www.census.gov/prod/cen2010/briefs/c2010br-11.pdf.
26 Tina Norris, Paula L. Vines, and Elizabeth M. Hoeffel, “The American Indian and Alaska Native Population: 2010” (Washington: Bureau of the Census, 2012), avail-able at http://www.census.gov/prod/cen2010/briefs/c2010br-10.pdf.
27 Bob Moser, “The End of the Solid South,” The American Prospect, June 4, 2013, available at http://prospect.org/article/end-solid-south.
28 David Madland and Ruy Teixeira, “New Progressive America: The Millennial Generation” (Washington: Center for American Progress, 2009), available at http://www.americanprogress.org/issues/progressive-movement/report/2009/05/13/6133/new-progressive-america-the-millennial-generation/.
29 Pew Research Center, “A Portrait of “Generation Next” (2007), available at http://www.people-press.org/2007/01/09/a-portrait-of-generation-next/.

45 Center for American Progress | True South
30 Pew Research Center, “Millennials: Confident. Con-nected. Open to Change” (2010), available at http://www.pewsocialtrends.org/files/2010/10/millennials-confident-connected-open-to-change.pdf.
31 Madland and Teixeira, “New Progressive America.”
32 Sierra Club, “2014 Sierra Club National Survey on Coal, Climate & Carbon Pollution,” available at http://www.sierraclub.org/pressroom/climatepoll/ (last accessed May 2014).
33 Madland and Teixeira, “New Progressive America.”
34 Danny Hayes and Seth C. McKee, “Booting Barnes: Ex-plaining the Historic Upset in the 2002 Georgia Guber-natorial Election,” Politics&Policy 32 (4) (2004), available at http://home.gwu.edu/~dwh/booting_barnes.pdf.
35 The Associated Press, “South Carolina: Confederate Flag Issue Rises Again,” The New York Times, July 26, 2011, available at http://www.nytimes.com/2011/07/27/us/27brfs-CONFEDERATEF_BRF.html?_r=0.
36 Pew Research Center, “Young Voters Supported Obama Less, But May Have Mattered More,” November 26, 2012, available at http://www.people-press.org/2012/11/26/young-voters-supported-obama-less-but-may-have-mattered-more/.
37 Madland and Teixeira, “New Progressive America.”
38 Chu and Posner, “The State of Women in America.”
39 Tara Culp-Ressler, “South Carolina Is Trying To Expand Its ‘Stand Your Ground’ Law To Include Fetuses,” ThinkProgress, April 11, 2014, available at http://thinkprogress.org/health/2014/04/11/3425665/south-carolina-stand-your-ground/.
40 Kala Kachmar, “Four Alabama House bills target abor-tions,” Montgomery Advertiser, February 19, 2014, avail-able at http://www.montgomeryadvertiser.com/story/news/politics/legislature/2014/02/19/four-alabama-house-bills-target-abortions/5600209/.
41 Lindsay Beyerstein, “Texas anti-abortion law forces women to make tough choices,” Al Jazeera, January 5, 2014, available at http://america.aljazeera.com/articles/2014/1/5/in-texas-abortionclinicsclose.html.
42 Laura Vozzella, “Gov. Bob McDonnell blamed for transvaginal ultrasound bill,” The Washington Post, May 30, 2012, available at http://www.washingtonpost.com/blogs/virginia-politics/post/gov-bob-mcdonnell-blamed-for-transvaginal-ultrasound-bill/2012/05/30/gJQAuoYY1U_blog.html.
43 The New York Times, “Exit Polls,” available at http://www.nytimes.com/projects/elections/2013/general/virginia/exit-polls.html (last accessed May 2014).
44 Dahlia Lithwick, “Bye-Bye, Cooch,” Slate, November 5, 2013, available at http://www.slate.com/blogs/xx_fac-tor/2013/11/05/ken_cuccinelli_loses_in_virginia_wom-en_say_no_thanks_we_re_cool.html.
45 Eric Foner, “Rooted in Reconstruction: The First Wave of Black Congressmen,” The Nation, October 15, 2008, available at http://www.thenation.com/article/rooted-reconstruction-first-wave-black-congressmen#.
46 Ibid.
47 Bob Moser, Blue Dixie: Awakening the South’s Democratic Majority (New York: Holt Paperbacks, 2008).
48 Ibid.
49 David Greenberg, “Dog-Whistling Dixie,” Slate, No-vember 20, 2007, available at http://www.slate.com/articles/news_and_politics/history_lesson/2007/11/dogwhistling_dixie.html.
50 The Associated Press, “Kirk Fordice; Miss. Governor Stirred Controversy,” The Washington Post, September 8, 2004, available at http://www.washingtonpost.com/wp-dyn/articles/A3966-2004Sep7.html.
51 Brennan Center for Justice, “Myth of Voter Fraud,” avail-able at http://www.brennancenter.org/issues/voter-fraud (last accessed May 2014).
52 National Conference of State Legislatures, “Voter Identification Requirements,” April 30, 2014, available at http://www.ncsl.org/research/elections-and-cam-paigns/voter-id.aspx.
53 Brennan Center for Justice, “Myth of Voter Fraud.”
54 Ibid.
55 Brennan Center for Justice, “Voting Laws Roundup 2013,” December 19, 2013, available at http://www.brennancenter.org/analysis/election-2013-voting-laws-roundup.
56 Brennan Center for Justice, “Voting Laws Roundup 2012,” October 11, 2012, available at http://www.brennancenter.org/analysis/election-2012-voting-laws-roundup.
57 Beason-Hammon Alabama Taxpayer and Citizen Protection Act, Alabama State Legislature, 2011, avail-able at http://alisondb.legislature.state.al.us/acas/searchableinstruments/2011rs/bills/hb56.htm.
58 American Civil Liberties Union, “We Vow to Fight.”
59 Kate Brumback, “2 Years After Immigration Laws, Ga., Ala., Stable,” Huffington Post, July 6, 2013, available at http://www.huffingtonpost.com/2013/07/06/georgia-immigration-law_n_3554714.html.
60 Brennan Center for Justice, “Overview: Voting Law Changes in 2012.”
61 Congress of Racial Equality, “Three CORE Members murdered in Mississippi,” available at http://www.core-online.org/History/freedom_summer.htm (last accessed May 2014).
62 Doug McAdam, Freedom Summer (New York: Oxford University Press, 1988).
63 Moser, Blue Dixie.
64 Ibid.
65 National Bureau of Economic Research, “NBER CPS Supplements,” available at http://www.nber.org/data/current-population-survey-data.html (last accessed May 2014); For the purposes of this report, the Native American and Alaska Native population was not in-cluded because the total number of Native Americans and Alaska Natives in the Black Belt is too small.
66 Hayes and McKee, “Booting Barnes.”
67 Ibid.
68 CNN, “U.S. House Of Representatives / National / Exit Poll,” available at http://www.cnn.com/ELECTION/2006/pages/results/states/US/H/00/epolls.0.html (last ac-cessed May 2014).

46 Center for American Progress | True South
69 National Bureau of Economic Research, “NBER CPS Supplements.”
70 Ibid.
71 Ibid.
72 Adora Obi-Nweze, “Fighting to protect the vote in Florida,” The Tampa Tribune, September 14, 2012, avail-able at http://tbo.com/list/news-opinion-commentary/fighting-to-protect-the-vote-in-florida-499446.
73 Michael Cooper and Jo Craven McGinty, “Florida’s New Election Law Blunts Voter Drives,” The New York Times, March 27, 2012, available at http://www.nytimes.com/2012/03/28/us/restrictions-on-voter-registration-in-florida-have-groups-opting-out.html?_r=0.
74 Adora Obi-Nweze, “Fighting to protect the vote in Florida,” The Tampa Tribune, September 14, 2012, avail-able at http://tbo.com/list/news-opinion-commentary/fighting-to-protect-the-vote-in-florida-499446.
75 Ibid.
76 NBCNews, “Florida election results,” available at http://elections.msnbc.msn.com/ns/politics/2012/florida/#.UJ6Xc4ZR2So (last accessed May 2014).
77 McAdam, Freedom Summer.
78 Drew Desilver, “Who’s poor in America? 50 years into the ‘War on Poverty,’ a data portrait,” Pew Research Center, January 13, 2014, available at http://www.pewresearch.org/fact-tank/2014/01/13/whos-poor-in-america-50-years-into-the-war-on-poverty-a-data-por-trait/.
79 The Associated Press, “South Carolina: Confederate Flag Issue Rises Again.”
80 Nate Cohn, “Southern Whites’ Loyalty to G.O.P. Nearing That of Blacks to Democrats,” The New York Times, April 23, 2014, available at http://www.nytimes.com/2014/04/24/upshot/southern-whites-loyalty-to-gop-nearing-that-of-blacks-to-democrats.html?hpw&rref=&_r=0.
81 Pew Research Center, “One in 31: The Long Reach Of American Corrections” (2009), available at “http://www.pewstates.org/uploadedFiles/PCS_Assets/2009/PSPP_1in31_report_FINAL_WEB_3-26-09.pdf.
82 Georgia Public Policy Foundation, “Agenda 2014: Crimi-nal Justice,” January 20, 2014, available at http://www.georgiapolicy.org/agenda-2014-criminal-justice/#ff_s=oCrIN.
83 Aaron Gould Sheinin and Bill Rankin, “Governor to sign sweeping justice reform bill,” The Atlanta Journal-Constitution, May 2, 2012, available at http://www.ajc.com/news/news/state-regional-govt-politics/governor-to-sign-sweeping-justice-reform-bill/nQTTQ/.
84 Georgia Public Policy Foundation, “Agenda 2014.”
85 Mississippi First, “PreKindegarten,” available at http://www.mississippifirst.org/education-policy/pre-kinder-garten/ (last accessed May 2014).
86 Lawayne Childrey, “Early Childhood Advocates Rally at the Capitol in Support of Pre-K Funding,” Mississippi Public Broadcasting, February 26, 2013, available at http://mpbonline.org/News/article/early_childhood_advocates_rally_at_the_capitol_in_support_of_pre_k_funding#sthash.bRQBVN9F.dpuf.
87 Mississippi First, “PreKindegarten.”
88 Southern Echo, “About,” available at http://souther-necho.org/s/?page_id=55 (last accessed June 2014); Huffington Post, “Heather Booth,” available at http://www.huffingtonpost.com/heather-booth/ (last ac-cessed June 2014).
89 Bureau of the Census, The Diversifying Electorate—Vot-ing Rates by Race and Hispanic Origin in 2012 (U.S. Department of Commerce, 2013), available at http://www.census.gov/prod/2013pubs/p20-568.pdf.
90 Ibid.
91 Fair Vote, “Voter Turnout,” available at http://www.fairvote.org/research-and-analysis/voter-turnout/ (last accessed Mary 2014).
92 The Voter Participation Center, “Anticipating 2014 Voter Drop-Off,” October 30, 2013, available at http://www.voterparticipation.org/research/anticipating-2014-vot-er-drop-off/.
93 Jennifer B. Ayscue and others, “Settle for Segregation or Strive for Diversity? A Defining Moment for Maryland’s Public Schools” (Los Angeles: The Civil Rights Project, 2013), available at http://civilrightsproject.ucla.edu/research/k-12-education/integration-and-diversity/settle-for-segregation-or-strive-for-diversity-a-defining-moment-for-maryland2019s-public-schools.
94 John Wagner and Aaron C. Davis, “O’Malley signs death penalty repeal, medical marijuana bill and other measures,” The Washington Post, May 2, 2013, available at http://www.washingtonpost.com/local/md-politics/omalley-to-sign-death-penalty-repeal-and-scores-of-other-bills-thursday-morning/2013/05/02/b0f98bb4-b319-11e2-9a98-4be1688d7d84_story.html.
95 Mark Goldstein, “Maryland’s Changing Demographics Findings from the 2010 Census” (Annapolis, MD: Mary-land Department of Planning, 2011), available at http://planning.maryland.gov/msdc/Affiliate_meeting/2011/SDC_Affiliates_Meeting_Nov10_2011.pdf.

The Center for American Progress is a nonpartisan research and educational institute
dedicated to promoting a strong, just, and free America that ensures opportunity
for all. We believe that Americans are bound together by a common commitment to
these values and we aspire to ensure that our national policies reflect these values.
We work to find progressive and pragmatic solutions to significant domestic and
international problems and develop policy proposals that foster a government that
is “of the people, by the people, and for the people.”
1333 H STREET, NW, 10TH FLOOR, WASHINGTON, DC 20005 • TEL: 202-682-1611 • FAX: 202-682-1867 • WWW.AMERICANPROGRESS.ORG