Truck Tractor Crash...
29
Truck Tractor Crash Analysis Tribal Lands in Arizona 2009-2013 ITCA Tribal Epidemiology Center (TEC) August 6, 2015 Source: azcentral.com
Transcript of Truck Tractor Crash...

Truck Tractor Crash Analysis
Tribal Lands in Arizona 2009-2013
ITCA Tribal Epidemiology Center (TEC)
August 6, 2015
Source: azcentral.com

Topics Background
Objectives
Method
Findings
Strengths and limitations
Recommendations
Source: azcentral.com

Definition: Truck Tractor
Non-cargo carrying power unit in combination with a semi-trailer.
Truck tractors and semi-trailer combinations, referred to as tractor/trailers.
Source: U.S. Department of Transportation, Federal Motor Carrier Safety Administration

Why Care about Truck Traffic Safety?
Arizona is in the middle of a large, expanding trade triangle connecting Southern California, Texas and northern Mexico.
Annually, commercial trucks make about 8 million trips into and out of Arizona with most on east-west interstate routes.
North-south trade with Mexico and Canada is a major initiative nationally and for Arizona. By 2050, freight shipments are expected to triple in Arizona.
Source: Santa Cruz Commerce Center

2010 Statewide Crash Analysis
Utilized 1997-2006 reported crash data in the Arizona Location Identification Surveillance System
Completed an analysis of n=27,382 crashes on tribal lands in Arizona
Injury and fatal crash rates were about 5 times higher on tribal lands than statewide for: Lane departure crashes involving truck tractors trailers (TTT)
Speed-related crashes involving TTT

2009-2013 Analysis of TTT Crashes on Tribal Lands in Arizona

Objectives Compare the number and
percent of injuries and fatalities in TTT crashes on and off Tribal lands
Identify high crash locations
Identify differences between TTT crashes occurring on and off Tribal lands
Source: overdrive.com
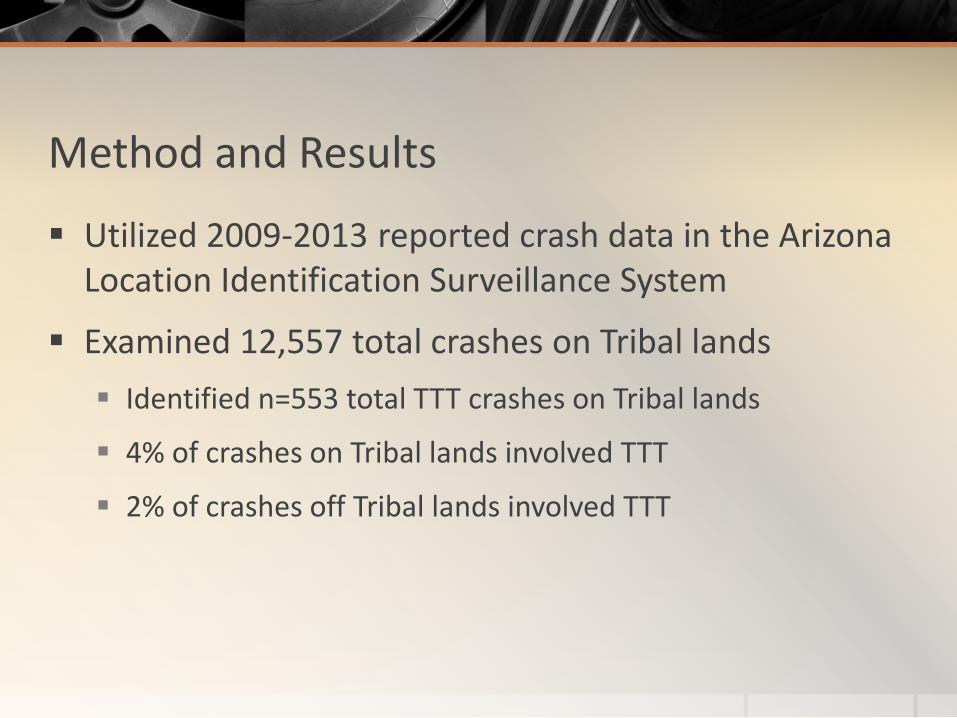
Method and Results
Utilized 2009-2013 reported crash data in the Arizona Location Identification Surveillance System
Examined 12,557 total crashes on Tribal lands Identified n=553 total TTT crashes on Tribal lands
4% of crashes on Tribal lands involved TTT
2% of crashes off Tribal lands involved TTT

Results: Location 94% of truck tractor
crashes on Tribal lands occurred on interstates, US highways, and state routes
40% of truck tractor crashes occurred on I-10
12% of truck tractor crashes occurred on I-40 Developed by Jonathan Davis, ITCA ArcGIS Fellow

Results: Year
18% 19%
22%
20% 21%
16%
22% 21% 21%
20%
0%
5%
10%
15%
20%
25%
2009 2010 2011 2012 2013
Perc
ent
On Tribal Lands Off Tribal Lands

Results: Month
6%
7%
10% 10% 10%
11%
7%
10%
9%
7%
6%
8%
7%
8% 8% 8% 8%
9%
8% 8% 8%
9%
8%
9%
0%
2%
4%
6%
8%
10%
12%
Jan Feb Mar Apr May Jun Jul Aug Sep Oct Nov Dec
Perc
ent
On Tribal Lands Off Tribal Lands

Results: Day of Week
11% 12%
14%
16% 16%
20%
10%
8%
15%
17% 17% 17% 17%
10%
0%
5%
10%
15%
20%
25%
Monday Tuesday Wednesday Thursday Friday Saturday Sunday
Perc
ent
OnTribal Land Off Tribal Land

Results: Injury Status
78%
5% 9%
3% 1% 3%
82%
6% 6% 2% 0.8%
3%
0%
10%
20%
30%
40%
50%
60%
70%
80%
90%
No Injury Possible Injury Non-IncapacitatingInjury
Incapacitating Injury Fatal Unknown
On Tribal Land Off Tribal Land

Results: Injuries and Fatalities by Vehicle Type
6%
94%
39%
61%
13%
87%
28%
72%
0%
10%
20%
30%
40%
50%
60%
70%
80%
90%
100%
Injury, TTT Injury, Non-TTT Fatality, TTT Fatality, Non-TTT
On Tribal Land Off Tribal Land

Results: Vehicles per Crash
32%
68%
21%
79%
0%
10%
20%
30%
40%
50%
60%
70%
80%
90%
Single Vehicle Multiple Vehicles
Perc
ent
On Tribal Lands Off Tribal Lands

Results: Time of Day
0
10
20
30
40
50
60
70
80
90
100
0 1 2 3 4 5 6 7 8 9 10 11 12 13 14 15 16 17 18 19 20 21 22 23
Perc
ent
OnTribal Land, Single Vehicle OnTribal Land, Multiple Vehicle
Off Tribal Land, Single Vehicle Off Tribal Land, Multiple Vehicle

Results: Collision Manner
32%
22%
32% 33%
18%
21%
13%
9%
5%
2% 3%
1% 2%
3% 2% 2%
0.2% 1.0%
0.2% 0.4% 0.0% 0.2% 0%
5%
10%
15%
20%
25%
30%
35%
On Tribal Land Off Tribal Land
Perc
ent
Single Vehicle Sideswipe, Same Direction Right Turn Other
Angle Head On Left Turn Sideswipe, Opposite Direction
Rear to Side Unknown Rear to Rear

Results: Most Harmful Event MOST HARMFUL
EVENT On Tribal Lands Off Tribal Lands
TTT Non-TTT TTT Non-TTT Number Rank Number Rank Number Rank Number Rank
Motor Vehicle in Transport
110 1 97 1 2704 1 2577 1
Overturn/Rollover 17 2 4 3 176 2 48 4 Other, Non-Fixed
Object 8 3 5 2 123 3 108 2
Fire/Explosion 8 3 -- -- 109 4 -- -- Animal, Livestock 8 3 -- -- -- -- -- --
Struck by Falling/Shifting Cargo
-- -- 4 3 -- -- 39 5
Other, Non-Collision 6 4 3 4 -- -- -- -- Cargo Loss/Shift -- -- 2 5 -- -- -- --
Tree/Bush, Standing -- -- 2 5 -- -- -- -- Parked Motor
Vehicle -- -- -- -- -- -- 71 3
Animal, Wild Game -- -- -- -- 92 5 -- --
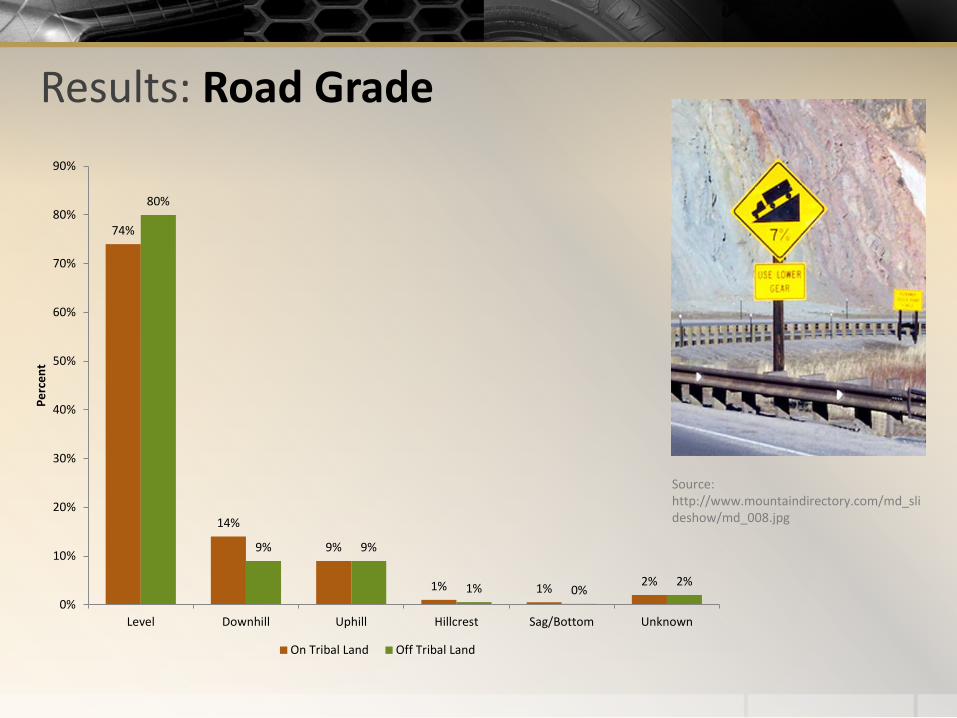
Results: Road Grade
74%
14%
9%
1% 1% 2%
80%
9% 9%
1% 0% 2%
0%
10%
20%
30%
40%
50%
60%
70%
80%
90%
Level Downhill Uphill Hillcrest Sag/Bottom Unknown
Perc
ent
On Tribal Land Off Tribal Land
Source: http://www.mountaindirectory.com/md_slideshow/md_008.jpg

Results: Road Alignment
84%
9% 5%
2% 0%
83%
6% 5% 3% 3%
0%
10%
20%
30%
40%
50%
60%
70%
80%
90%
Straight Curve, Left Curve, Right Unknown Not Reported
Perc
ent
On Tribal Land Off Tribal Land
Source: http://i.azcentral.com/commphotos/view/686936.jpg

Results: Action at Time of Crash ACTION AT TIME OF
CRASH On Tribal Lands Off Tribal Lands
TTT Non-TTT TTT Non-TTT Number Rank Number Rank Number Rank Number Rank
Going Straight Ahead 378 1 222 1 6731 1 4913 1 Negotiating a Curve 33 2 6 10 222 10 -- -- Making a Left Turn 29 3 24 4 802 4 502 5
Slowing in Trafficway 26 4 26 3 620 5 515 4 Changing Lanes 24 5 19 5 946 2 671 3
Avoiding Vehicle/Object 20 6 13 7 226 9 174 9 Unknown 18 7 11 8 313 7 307 7
Stopped in Trafficway 17 8 44 2 595 6 1185 2 Making Right Turn 15 9 6 10 924 3 408 6
Overtaking/Passing 12 10 16 6 -- -- 279 8 Other -- -- 8 9 -- -- --
Backing -- -- -- -- 303 8 -- -- Properly Parked -- -- -- -- -- -- 144 10

Results: Low light conditions
Source: www.mybinc.com/blog/category/motor-vehicle-record-check
Source: www.corporatedriving.com/semi-truck-driving-safety/
65%
2% 1% 4%
27%
1%
69%
3% 2%
10%
16%
0.3% 0%
10%
20%
30%
40%
50%
60%
70%
80%
Daylight Dawn Dusk Dark, Lighted Dark, NotLighted
Dark, UnknownLighting
Perc
ent
On Tribal Land Off Tribal Land2

Results: Safety Device Use
87% 87% 85%
88%
0%
10%
20%
30%
40%
50%
60%
70%
80%
90%
100%
Safety Device Used, TTT Safety Device Used, Non-TTT
Perc
ent
On Tribal Land Off Tribal Land

Results: Driving While Fatigued
4%
2% 2%
1%
0.0%
1.0%
2.0%
3.0%
4.0%
5.0%
6.0%
7.0%
8.0%
9.0%
10.0%
Fatigue, TTT Fatigue, Non-TTT
Perc
ent
On Tribal Land Off Tribal Land

Results: Violation VIOLATION On Tribal Lands Off Tribal Lands
TTT Non-TTT TTT Non-TTT Number Rank Number Rank Number Rank Number Rank
Speed Too Fast For Conditions
94 1 50 1 1261 1 9400 1
Inattention/ Distraction 50 2 25 2 1222 2 771 3 Unknown 29 3 23 3 940 3 774 2
Other 31 4 19 4 685 5 385 5 Failed to Keep in Proper
Lane 22 5 16 5 403 6 280 7
Unsafe Lane Change 18 6 14 6 757 4 483 4 Failed to Yield Right of Way -- -- 12 7 210 8 327 6
Improper Turn 11 7 6 10 361 7 134 9 Drove in Opposing Traffic
Lane -- -- 10 8 -- -- -- --
Followed Too Closely 8 8 9 9 140 9 -- -- Other Unsafe Passing 4 9 -- -- -- -- 129 10
Disregarded Traffic Signal -- -- 6 10 68 10 141 6
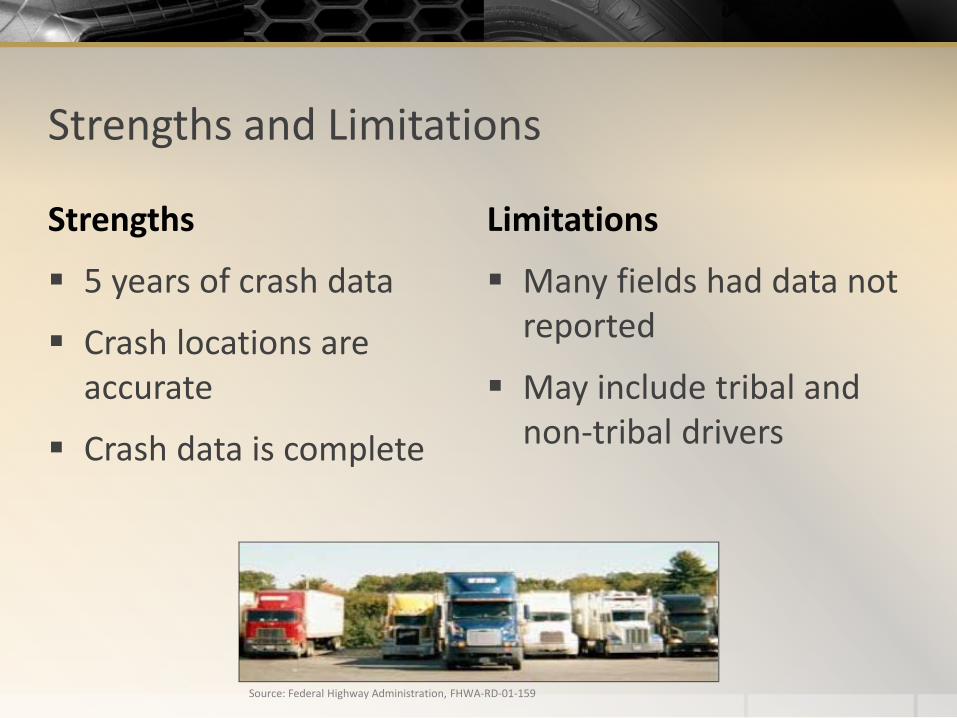
Strengths and Limitations
Strengths
5 years of crash data
Crash locations are accurate
Crash data is complete
Limitations
Many fields had data not reported
May include tribal and non-tribal drivers
Source: Federal Highway Administration, FHWA-RD-01-159

Recommendations Policy: Strengthen tribal traffic codes pertaining to
commercial traffic on tribal lands
Participate in the heavy vehicle task force for the Arizona Strategic Highway Safety Plan implementation
Enforcement: Train tribal police to become certified commercial vehicle inspectors
Education: Conduct “Share the Road” training for tribal members to heighten awareness of driving near commercial vehicles
Engineering: Utilize strategies on state routes through tribal communities

Traffic Calming in Tribal Communities State routes through tribal communities may be “main streets”. Speed feedback signs
caution drivers to lower speed
Community gateway signs notify drivers they are entering a tribal community
Photo by: J. Schallan Source: wikipedia user - Terfili
Source: www.sportbikeworld.com

Project Contacts Jamie Ritchey, PhD, MPH TEC Director
Erica Weis, MPH, Epidemiologist II
Esther Corbett, BS, Project Manager
ITCA Tribal Epidemiology Center
602-258-4822
Funded by the Office of Minority Health, DHHS
Crash map developed by Jonathan Davis, ITCA ArcGIS Fellow