TRS Board of Trustees Meeting Documents/board_meeting_book_apr2… · All or part of the April 7-8...
179
TRS Board of Trustees Meeting April 7 – 8, 2016
Transcript of TRS Board of Trustees Meeting Documents/board_meeting_book_apr2… · All or part of the April 7-8...
TRS Board of Trustees Meeting
April 7 – 8, 2016

TEACHER RETIREMENT SYSTEM OF TEXAS MEETING BOARD OF TRUSTEES
AGENDA
April 7, 2016 – 9:00 a.m.
April 8, 2016 – 8:00 a.m. (If needed)
TRS East Building, 5th Floor, Boardroom. All or part of the April 7-8 2016 meeting of the TRS Board of Trustees may be held by telephone conference call as authorized under Section 551.130 of Texas Government Code. The Board intends to have a quorum physically present at the following location: 1000 Red River Austin, Texas 78701 in the TRS East Building, 5th Floor, Boardroom. NOTE: The Board may take up any item posted on the agenda during its meeting on Thursday, April 7, or the following day beginning at the time and place specified on this agenda. However, the Board expects to conclude its April 2016 meeting on Thursday, April 7, 2016. The open portions of the April 2016 Board meeting are being broadcast over the Internet. Access to the Internet broadcast of the Board meeting is provided on TRS' website at www.trs.state.tx.us. 1. Call roll of Board members.
2. Consider the following administrative matters – David Kelly:
A. Welcome new trustees, if applicable.
B. Excuse Board member absences from the February 24-26, 2016 Board meeting.
C. Consider approval of the February 24-26, 2016 proposed meeting minutes.
D. Consider the election of the Board Vice-Chair.
E. Consider consenting to the Board Chair's appointment of committee members, and receive the Board Chair's public announcement of committee chairs.
F. Consider setting, rescheduling, or canceling future Board meetings.
G. Recognize the service of outgoing trustees, as applicable.
3. Provide an opportunity for public comment – David Kelly.
4. Review and discuss the Executive Director's report on the following matters – Brian Guthrie:

2
A. Administrative operational matters, including updates on financial, audit, legal, staff services, board administration, special projects, long-term space planning, strategic planning matters, and procurements associated with the Financial System Replacement Project.
B. Board operational matters, including a review of draft agendas for upcoming meetings.
C. Event notices or reminders; holiday and other schedules of interest; board member, employee or other individual recognitions; and expressions of thanks, congratulations, or condolences.
5. Discuss the following investment matters:
A. Fourth Quarter 2016 Performance Review – Steve Voss and Mike Comstock, Aon Hewitt.
B. Quarterly Strategic Partner Update – Mike Pia.
C. Seventh-Year Anniversary of the Bull Market – Britt Harris.
NOTE: The Board meeting likely will recess after the last item above to conduct committee meetings and resume Thursday afternoon to take up items listed below.
6. Review the report of the Audit Committee on its April 7, 2016 meeting and consider amendments to the Audit Plan for Fiscal Year 2016 – Committee Chair.
7. Review the report of the Investment Management Committee on its April 7, 2016 meeting – Joe Colonnetta.
8. Review the report of the Risk Management Committee on its April 7, 2016 meeting – Committee Chair.
9. Review the report of the Policy Committee on its April 7, 2016 meeting and consider the following – Committee Chair:
A. Consider adoption of proposed amendments to TRS Rule § 31.1, relating to Definitions (concerning Substitute Service) in Title 34, Part 3 of the Texas Administrative Code.
B. Consider adoption of amendments to the Authority to Approve and Sign Vouchers resolution.
10. Review the report of the Benefits Committee on its April 7, 2016 meeting and consider the appointment of the Active Auxiliary position on the Retiree Advisory Committee – Committee Chair.

3
11. Consider a one-year extension of the contract with Gabriel, Roeder, Smith & Company for health benefits consulting services – Katrina Daniel.
12. Receive and discuss a presentation from the TEAM Program Independent Program Assessment (IPA) Vendor – Michael Johnson, Bridgepoint Consulting.
13. Receive and discuss an update on the TEAM Program, including a demonstration of benefit estimation and an update on the Website Redesign Project – David Cook, Adam Fambrough, Sunitha Downing, Rachael Hill, Howard Goldman, and Jay Masci (Provaliant).
14. Review and discuss Deputy Director’s report, including matters related to administrative, financial, and staff services operations – Ken Welch.
15. Review and discuss the Chief Financial Officer’s report, including matters related to a mid-year budget analysis, a cash flow report and a review of the annual budget and Legislative Appropriations Request development process – Don Green.
16. Receive and discuss the report of the Chief Benefit Officer and consider related action, including – Barbie Pearson:
A. Approve proposed minutes of the January 2016 Medical Board meeting.
B. Approve the list of members qualified for retirement for December 2015
through February 2016. 17. Review the report of the General Counsel on pending and contemplated litigation,
including updates on litigation involving benefit-program contributions, retirement benefits, securities, health-benefit programs, and open records – Carolina de Onís.
18. Consider personnel matters, including the appointment, employment, evaluation, compensation, performance, duties, discipline, or dismissal of the Executive Director, Chief Investment Officer, or Chief Audit Executive – David Kelly.
19. Consult with the Board's attorney(s) in Executive Session on any item listed above on this meeting agenda as authorized by Section 551.071 of the Texas Open Meetings Act (Chapter 551 of the Texas Government Code) – David Kelly.


Minutes of the Board of Trustees February 24-26, 2016
The Board of Trustees of the Teacher Retirement System of Texas met on February 24, 2016 in the Collin, Dallas, and Ellis Rooms located on the First Floor of the Region 10 Educational Service Center at 400 East Spring Valley Road in Richardson, Texas. The following board members were present: David Kelly, Chair Nanette Sissney, Vice-Chair Karen Charleston Joe Colonnetta David Corpus Anita Palmer Dolores Ramirez Others present:
Brian Guthrie, TRS Heather Traeger, TRS Ken Welch, TRS Yimei Zhao, TRS Carolina de Onís, TRS Melody Austin, TRS Amy Barrett, TRS Will Burgess, TRS Janet Bray, TRS Vic Horton, TRS Chris Cutler, TRS Edward Esquivel, TRS Katrina Daniel, TRS Senator Don Huffines Don Green, TRS Jay Masci, Provaliant Howard Goldman, TRS John Hryhorchuk, The Governor’s Office Rebecca Merrill, TRS Dr. Gordon Taylor, Region 10 Education Service Center Barbie Pearson, TRS Steve Huff, Reinhart Boerner Van Deuren Ray Spivey, TRS Keith Johnson, Reinhart Boerner Van Deuren Ronnie Bounds, TRS Linda Engelking, Texas Retired Teachers Association Clarke Howard, TRS Ted Melina Raab, Texas American Federation of Teachers Dan Junell, TRS Bill Barnes, Texas Retired Teachers Association Lynn Lau, TRS Bill Hickman, Gabriel Roeder Smith and Company Merita Zoga, TRS Amy Cohen, Gabriel Roeder Smith and Company Rhonda Price, TRS Eric St. Pierre, Gabriel Roeder Smith and Company Dan Herron, TRS Jamie Pierce, TRS Cindy Yarbrough, TRS Amber Conrad, TRS
Tobi Bray, Richardson Retired School Personnel J. R. Fletcher, West Grayson District Mary Nan Storz, West Grayson Retired School Personnel Association Tim Lee, Texas Retired Teachers Association
Garry Sitz, TRS Mary De Peri, Plano Retired School Personal Association Toma Miller, TRS David Tolliver, Express Scripts Art Mata, TRS Ernie Sanders, HPE Dinah Arce, TRS Adam Fambrough, TRS
Prashant Jaiswal, HPE Carol Riley, Blue Cross and Blue Shield of Texas
David Cook, TRS John Bass, United Healthcare Jan Engler, TRS Joni Lozano, Caremark Tonna Duke, Texas Retired Teachers Association
Mr. Kelly called the meeting to order at 9:10 a.m.

TRS Board Meeting: February 24-26, 2016 Page 2 of 16
1. Call roll of Board members.
Ms. Lau called the roll. A quorum was present. Mr. Barth and Mr. Moss were absent. Ms. Sissney arrived at 10:18 a.m.
2. Consider the following Board administrative matters – David Kelly:
A. Welcome new trustees, if applicable.
The board did not take up agenda items 2A.
B. Consider approving the November 19-20, 2015 proposed Board meeting minutes.
On a motion by Ms. Palmer, seconded by Mr. Corpus, the board unanimously adopted the proposed minutes of the November 19-20, 2015 board meeting.
C. Consider approving the December 7, 2015 proposed Board meeting minutes.
On a motion by Ms. Ramirez, seconded by Mr. Corpus, the board unanimously adopted the proposed minutes of the December 7, 2015 board meeting.
D. Consider the election of the Board Vice-Chair.
E. Consider consenting to the Board Chair's appointment of committee members and receive the Board Chair's public announcement of committee chairs.
F. Consider setting, rescheduling, or canceling future Board meetings.
G. Recognize outgoing trustees.
The board did not take up agenda items 2D-G. 3. Provide an opportunity for public comment – David Kelly. Mr. Kelly introduced Dr. Gordon Taylor, Executive Director for the Region 10 Education Service Center. Dr. Taylor welcomed the board to the center.
4. Receive an overview of the Board meeting agenda and theme – Brian Guthrie. Mr. Guthrie stated that the theme of this board meeting was partnering for the future, which would highlight internal and external partnerships and interdepartmental projects for achieving TRS' goals and mission. He provided an overview of the meeting agenda.

TRS Board Meeting: February 24-26, 2016 Page 3 of 16
5. Receive the report of the Chief Benefit Officer and consider the following matters – Barbie Pearson:
A. Consider approving the minutes of the July, September, and November 2015
Medical Board meetings. Ms. Pearson presented the minutes of the July 14, September 15, and November 10, 2015 Medical Board meeting minutes. On a motion by Mr. Corpus, seconded by Ms. Palmer, the board approved the minutes of the Medical Board meetings as presented, thereby ratifying the actions of the Medical Board reflected in those minutes.
B. Consider concurring in the Medical Board’s certification regarding a
disability retiree under Section 824.307 of the Government Code, discontinuing annuity payments for the retiree, and restoring the retiree to membership.
Ms. Pearson presented information regarding a determination made by the Medical Board that a disability retiree was no longer disabled. On a motion by Ms. Palmer, seconded by Ms. Ramirez, the board unanimously voted to accept the Medical Board’s findings, thereby discontinuing the disability retiree’s annuity payments and restoring the retiree to active status.
C. Consider approving the list of members qualified for retirement for September through November 2015.
Ms. Pearson presented the list of members and beneficiaries receiving initial benefit payments during the period of September through November of 2015. On a motion by Ms. Ramirez, seconded by Mr. Corpus, the board unanimously approved the list of members and beneficiaries who qualified for retirement, disability, DROP, PLSO, survivor, or death benefits initiated during the reporting period.
6. Discuss and consider selecting a TRS-Care Standard Health Plan Administrator (HPA), including considering a finding that deliberating or conferring on the selection of the HPA in open meeting would have a detrimental effect on the position of the retirement system in negotiations with a third person.
Ms. Daniel described the role of the TRS-Care Standard Health Plan Administrator (HPA) and the procurement to select an HPA vendor. She reported that three organizations — Aetna, Blue Cross, and United Healthcare — had responded to the bid. All three were identified as finalists. She discussed the methodology used to evaluate the finalists' proposals.
Mr. Kelly called for a motion to find that deliberating or conferring in an open meeting about TRS-Care procurement issues would have a detrimental effect on TRS’ position in negotiations with a third party. On a motion by Mr. Corpus, seconded by Ms. Ramirez, the board voted unanimously to enter into closed session on agenda item 6.
Mr. Kelly announced that the board would go into executive session on agenda item 6 under § 825.115(e) of the Government Code to deliberate procurement matters and under § 551.071 of

TRS Board Meeting: February 24-26, 2016 Page 4 of 16
the Government Code to consult with legal counsel as needed. He asked all members of the public and staff not needed for the executive session to leave the meeting room and take their belongings with them.
Whereupon, the open session of the board meeting recessed at 9:35 a.m. to go into executive session.
The board meeting reconvened in open session at 10:29 a.m.
On a motion by Mr. Corpus, seconded by Ms. Ramirez, the board unanimously voted to adopt the following resolution selecting Aetna as the TRS-Care Standard HPA and United Healthcare as the alternate:
Whereas, Chapter 1575, Texas Insurance Code, governs the Texas Public School Retired Employees Group Insurance Program (the “TRS-Care program”) and authorizes the
Teacher Retirement System of Texas (“TRS”), as trustee, to implement the group coverage
program described in the statute;
Whereas, TRS issued a Request for Proposals (“RFP”) to interested entities for health plan
administrative, network, and network management services for the TRS-Care program;
Whereas, TRS received responsive proposals from a number of entities to provide health
plan administrative, network, and network management services for the TRS-Care
program;
Whereas, TRS staff and the TRS health benefits consultant, Gabriel, Roeder, Smith &
Company (“GRS”), have evaluated these proposals, have provided relevant information and presented an evaluation to the TRS Board of Trustees (the “Board”) concerning the
selection of a health plan administrator, and have discussed this selection with the Board;
Whereas, The Board has considered the information and evaluation provided by TRS staff and GRS; now therefore, be it
Resolved, That Board hereby selects Aetna to be the health plan administrator for the TRS-Care program, subject to the successful negotiation and execution of a final
agreement for the provision of health plan administrative, network, and network management services to the TRS-Care program, for a two-year initial term to commence
on September 1, 2016, with four optional one-year renewal terms; further
Resolved, That the Board authorizes the Executive Director to expend funds and to take all actions deemed by him to be necessary or advisable to implement this resolution,
including the negotiation and execution of all documents needed to finalize an acceptable contract with Aetna on the same or better financial terms presented to the Board and on
such other terms and conditions deemed by the Executive Director to be in the best interest
of the TRS-Care program, and from time to time to amend or modify the contract as deemed by the Executive Director to be in the best interest of the TRS-Care program, it
being understood that the Board’s selection of Aetna pursuant to this resolution shall not be construed as a binding agreement or obligation to contract, and there shall be no
binding agreement among the parties until a full and final written contract is successfully negotiated and executed by both parties; further

TRS Board Meeting: February 24-26, 2016 Page 5 of 16
Resolved, That if for any reason, the Executive Director concludes in his sole judgment
that TRS is not reasonably likely to successfully negotiate a contract with Aetna, then the Board hereby selects United Healthcare to be the health plan administrator for the TRS-
Care program, subject to the successful negotiation and execution of a final agreement for the provision of health plan administrative, network, and network management services to
the TRS-Care program, for a two-year initial term to commence on September 1, 2016,
with four optional one-year renewal terms; further
Resolved, That once the Executive Director concludes in his sole judgment that TRS is
not reasonably likely to successfully negotiate a contract with Aetna, then the Board authorizes the Executive Director to expend funds and to take all actions deemed by him
to be necessary or advisable to implement this resolution, including the negotiation and execution of all documents needed to finalize an acceptable contract with United
Healthcare on the same or better financial terms presented to the Board and on such other
terms and conditions deemed by the Executive Director to be in the best interest of the TRS-Care program, and from time to time to amend or modify the contract as deemed by
the Executive Director to be in the best interest of the TRS-Care program, it being understood that the Board’s selection of United Healthcare pursuant to this resolution shall
not be construed as a binding agreement or obligation to contract, and there shall be no
binding agreement among the parties until a full and final written contract is successfully negotiated and executed by both parties.
7. Consider establishing a single, uniformly applied employer-health-benefit-surcharge rate under TRS-Care – Katrina Daniel and Yimei Zhao.
Ms. Daniel explained staff's recommendation under the TRS-Care plan concerning the surcharge collected from employers of certain TRS retirees. She stated that the current surcharge rate depended on whether the coverage was for an individual or family and whether the participant was Medicare eligible or not. She explained that the Legislature had amended the law to simplify TRS' determination of the surcharge rate. Under the amended law, she said, TRS could apply a single surcharge rate based on the average cost to provide benefits to all TRS-Care participants and the average contribution made by all retirees to the plan. Ms. Daniel presented staff's recommendation that the board adopt a single surcharge rate of $535 per retiree per month. She noted that the new surcharge rate, if adopted, would become effective September 1, 2016 and would be administered through the new TRUST system. Ms. Daniel confirmed for Ms. Ramirez that the rate would apply to retirees who have dependents enrolled in the plan.
On a motion by Ms. Palmer, seconded by Ms. Ramirez, the board adopted the following resolution establishing a single, uniformly applied employer-health-benefit surcharge rate under TRS-Care as recommended by staff:
Whereas, Chapter 1575, Insurance Code, authorizes the Teacher Retirement System of Texas (“TRS”), as trustee, to implement and administer the uniform group health benefits
program under the Texas Public School Retired Employees Group Benefits Act (“TRS-Care”), as described in the statute;
Whereas, Section 1575.204(b), Insurance Code, and Section 825.4092(c), Government
Code, require for each payroll period, for each retiree who is enrolled in TRS-Care, that
the employer who reports the employment of the retiree shall pay an employer-health-benefit surcharge established by TRS;

TRS Board Meeting: February 24-26, 2016 Page 6 of 16
Whereas, In determining the amount of the employer-health-benefit surcharge, TRS is to
consider the amount a retiree is required to pay in premiums for the TRS-Care coverage selected by the retiree and the cost of participation in TRS-Care of all enrolled retirees and
their enrolled dependents;
Whereas, The TRS Board of Trustees (“Board”) has adopted (i) monthly premium rates
for the TRS-Care 1 standard plan, the TRS-Care 2 standard plan, and the TRS-Care 3 standard plan, effective September 1, 2015, and (ii) monthly premium rates for the TRS-
Care 2 Medicare Advantage plan and the TRS-Care 3 Medicare Advantage plan, effective January 1, 2016;
Whereas, To improve clarity, to reduce the cost of administration, and to enhance the
ease of administration, Gabriel, Roeder, Smith & Company, the TRS health benefits
consultant, and TRS staff have calculated and recommend that the Board adopt a single, monthly, uniformly applied employer-health-benefit-surcharge rate under TRS-Care in the
amount of $535.00 per employed retiree for the upcoming plan years; now, therefore, be it
Resolved, That the Board hereby approves and adopts a single, uniformly applied employer-health-benefit-surcharge under TRS-Care in the amount of $535.00 per
employed retiree, such amount to be paid monthly to TRS beginning September 1, 2016 and hereafter in accordance with applicable law, including related Board rules,
until further action by the Board or until superseded by applicable law; and
Resolved, That the Executive Director is authorized to take all actions deemed necessary,
in accordance with applicable law, to implement this resolution.
8. Consider designating the Chair and Vice-Chair of the Retiree Advisory Committee – Katrina Daniel.
Ms. Daniel presented staff's recommendation that the board designate Grace Mueller as Chair of the Retiree Advisory Committee (RAC) and Bill Barnes as Vice-chair. On a motion by Ms. Palmer, seconded by Ms. Sissney, the board unanimously voted to designate Ms. Mueller to be the RAC Chair and Mr. Barnes to be the RAC Vice-Chair. 9. Review and discuss the Executive Director's report on the following matters – Brian
Guthrie:
A. Review Strategic Plan and Executive Director goals.
B. Discuss TRS history, operations, and workforce overview.
C. Preview draft agendas for upcoming Board meetings.
D. Receive the Board training calendar.
E. Discuss and receive information on the TEAM Program history, retirement plan benefits, investment activity and operations, health-benefit programs and operations, and administrative operations, including financial, audit, legal, and staff services and special projects.

TRS Board Meeting: February 24-26, 2016 Page 7 of 16
Mr. Guthrie provided an overview of the Strategic Plan and performance goals.
Mr. Guthrie introduced the Honorable Senator Don Huffines, District 16 in Dallas County. Senator Huffines welcomed the board, staff, and other attendees to District 16.
Mr. Guthrie highlighted a few performance goals, including renovations to TRS' headquarters, remote work program, and increasing TRS’ national profile. He also provided an overview of performance goals in investment management, benefit services, and health care.
Mr. Guthrie reviewed TRS' core values and mission and vision statements. He also reviewed the system's history and highlighted significant events related to new programs, investments, and benefit changes. He then provided an overview of TRS programs and an update on the pension fund status, including the trust fund valuation, unfunded liability, and actuarial assumptions. He also provided an update on the benefit-related activities, sources of revenue, membership growth, operations of health care programs, 403(b) program, workforce profile, and succession planning.
Mr. Guthrie provided a list of upcoming training opportunities for trustees and summarized major agenda items for upcoming board meetings.
Ms. Sissney introduced two of her colleagues from Region 10, Ms. T. R. Fletcher from Whitesboro and Ms. Mary Nan Storz.
After a brief recess at 11:35 a.m., the board reconvened at 11:50 a.m.
Mr. Guthrie concluded his presentation by discussing the TEAM history and vision. 10. Receive a brief history and status update on the TEAM Program – Jay Masci,
Provaliant; David Cook and Adam Fambrough. Mr. Masci provided an overview of the TEAM program in terms of preparation, architectural vision, and major accomplishments to date. Mr. Fambrough provided an update on the Line of Business (LOB) accomplishments. Mr. Masci reported on the progress of the TEAM program. He noted that the Financial System Replacement (FSR) project had resumed and was currently in the procurement phase. Mr. Masci and Mr. Cook also addressed Ms. Sissney’s concerns regarding the status of the data cleansing and reconfiguration projects and whether certain program enhancements would be needed. Mr. Cook reviewed the TEAM budget, including breakouts by project. He also discussed current and upcoming milestones. Mr. Fambrough discussed Phase 1A certification and related training plans for TRS staff and reporting entities. Mr. Welch reported that Ms. Pearson had been designated the Reporting Entity Outreach sponsor, replacing Mr. Fambrough, who had recently become the manager of Benefits Processing.

TRS Board Meeting: February 24-26, 2016 Page 8 of 16
11. Look ahead at Key TEAM Program Risks for 2016 – Michael Johnson, Bridgepoint Consulting.
Mr. Johnson provided an overview of the key TEAM program risks for 2016.
12. Receive an overview of the Benefits Division and of the Information Technology
Division, including demonstrations of the TRUST program and remote counseling – Barbie Pearson and Chris Cutler.
Mr. Cutler provided an overview of the Information Technology (IT) Division, including the division technology and human resources, organizational structure, functions, goals, challenges, and updated technology and processes. He also highlighted the positive impacts of TEAM on the IT Division in terms of infrastructure enhancements, foundational technologies, and new processes and standards. Ms. Pearson provided an overview of the Benefits Division, including organizational structure, roles, human resources, accomplishments, workload, work performance, and technology advancement. Mr. Cutler provided a presentation on the collaboration efforts between the Benefits Division and the IT Division through the TEAM program. With Catherine Wallen at TRS' headquarters in Austin and Will Burgess at the meeting location in Richardson, staff conducted a mock remote-counseling visit using the TRUST application. After the demonstration, Ms. Pearson responded to trustees’ questions, including counseling protocol, timeline of implementation, technological requirements, accessibility and contingencies, staff training, program costs, and service availability. Next Mr. Fambrough conducted a demonstration of the reporting entity portal using the TRUST application.
13. Receive an overview of the Health Insurance Benefits and Human Resources
Departments and discuss the collaboration among Benefits, Health Insurance Benefits, and Human Resources on a training and quality assurance initiatives – Barbie Pearson, Katrina Daniel, and Janet Bray.
Ms. Bray provided an overview of the Human Resources Department, including the department mission, organizational structure, accomplishments, and objectives. Ms. Daniel provided an overview of the Health Insurance Benefits (HIB) Department, including the department organizational structure, accomplishments, and objectives. Mr. Guthrie highlighted the department collaboration of HIB and Benefits Departments for cross-training staff and transferring staff to Human Resources. Ms. Pearson and Ms. Daniel further discussed the training and quality assurance initiatives in their respective departments. Ms. Bray discussed recruiting efforts to fill vacancies in the HIB and Benefits areas and the partnership between the two departments to establish training programs.
TRS Board Meeting: February 24-26, 2016 Page 9 of 16
14. Receive an overview of the following departments or divisions: A. Internal Audit – Amy Barrett.
Ms. Barrett provided an overview of the Internal Audit Department, including the department mission, functions, organizational structure, audit cycle, mandates, and goals.
B. Financial Services, including an update on financial matters – Don Green. Mr. Green provided an overview of the Financial Division, including the division mission, resources, functions, and organizational structure. Mr. Green also provided a financial update through January 2016 and summarized the approved FY 2016 budget.
C. Project Management Office (PMO) – David Cook.
Mr. Cook provided an overview of the Project Management Office, including the team mission, organizational structure, resources, and functions. 15. Receive a presentation on and discuss collaboration among departments for
automation best ideas, including the following: A. Presentation overview and automation as a result of TEAM implementation –
Amy Barrett, Jan Engler, and Toma Miller. Ms. Engler and Ms. Miller described three key areas of improvement through technology innovation: customer relationship management, data and reporting, and integrated processing controls. Ms. Engler and Ms. Miller used three fictional scenarios to demonstrate the difference the technology improvement would make to enhance service, quality, and efficiency.
B. Development and identification of ideas and executive priorities – Barbie
Pearson, Don Green, Janet Bray, Amy Barrett, and Chris Cutler. Ms. Pearson presented management initiatives to enhance customer service. Mr. Green presented management initiatives in records management, space maximization, and efficiency assessment. Ms. Barrett, Mr. Cutler, and Ms. Bray presented the short-term and long-term projects in automating internal processes.
C. Sustaining a “culture of innovation” – David Cook and Chris Cutler.
Mr. Cook and Mr. Cutler described plans in sustaining a culture of innovation.

TRS Board Meeting: February 24-26, 2016 Page 10 of 16
Whereupon, the board meeting recessed at 6:23 p.m. The Board of Trustees of the Teacher Retirement System of Texas met on February 25, 2016 in the Collin, Dallas, and Ellis Rooms located on the First Floor of the Region 10 Educational Service Center at 400 East Spring Valley Road in Richardson, Texas. The following board members were present: David Kelly, Chair Nanette Sissney, Vice-Chair Karen Charleston Joe Colonnetta David Corpus Anita Palmer Dolores Ramirez Others present:
Brian Guthrie, TRS Heather Traeger, TRS Ken Welch, TRS Yimei Zhao, TRS Carolina de Onís, TRS Melody Austin, TRS Amy Barrett, TRS Heather Traeger, TRS Janet Bray, TRS Vic Horton, TRS Chris Cutler, TRS David Cook, TRS Katrina Daniel, TRS Toma Miller, TRS Don Green, TRS Edward Esquivel, TRS Howard Goldman, TRS Adam Fambrough, TRS Rebecca Merrill, TRS Steve Voss, Aon Hewitt Barbie Pearson, TRS Mike Cromstock, Aon Hewitt Ray Spivey, TRS Steve Huff, Reinhart Boerner Van Deuren Ronnie Bounds, TRS Keith Johnson, Reinhart Boerner Van Deuren Clarke Howard, TRS David Tolliver, Express Scripts Dan Junell, TRS John Hryhorchuk, The Governor’s Office Lynn Lau, TRS Bill Hickman, Gabriel Roeder Smith and Company Merita Zoga, TRS Amy Cohen, Gabriel Roeder Smith and Company Rhonda Price, TRS Eric St. Pierre, Gabriel Roeder Smith and Company Dan Herron, TRS Jamie Pierce, TRS Amber Conrad, TRS Dinah Arce, TRS
Ted Melina Raab, Texas American Federation of Teachers Pat Enlow, , Carrollton-Farmers Branch Retired School Personal Association Della H. Swamis, Carrollton-Farmers Branch Retired School Personal Association Lee Nitcholas, Carrollton-Farmers Branch Retired School Personal Association
Art Mata, TRS Mary De Peri, Plano Retired School Personal Association Sylvia Urich
Mr. Kelly called the meeting to order at 8:10 a.m. 1. Call roll of Board members.
Ms. Lau called the roll. A quorum was present. Mr. Barth and Mr. Moss were absent.
16. Provide opportunity for public comment – David Kelly.
Ms. Sylvia Urich urged the board to continue to seek benefits for retirees, considering that some retired public school employees like herself do not have social security benefits.

TRS Board Meeting: February 24-26, 2016 Page 11 of 16
Mr. Kelly recognized Ms. Charleston, Ms. Palmer, and Ms. Sissney for receiving a certificate of completion for the National Council on Teacher Retirement 15th Annual Trustee Workshop. 17. Receive an overview of the February 25, 2016 agenda – Brian Guthrie.
Mr. Guthrie provided a preview of agenda items being discussed this day.
18. Receive an overview of the Communications Department and discuss the collaboration between Communications and IT on the TEAM Web Site Redesign Project – Howard Goldman and Chris Cutler.
Mr. Goldman provided an overview of the Communications Department, describing its organizational structure, 2015 accomplishments, and 2016 objectives. He highlighted the website redesign project and provided an update on its status. Mr. Cutler discussed website analytics and behind-the-scenes technology involved with the website redesign project.
19. Discuss health care cost containment and data analytics initiatives – Katrina Daniel. Ms. Daniel provided an overview of the Health Insurance Benefits (HIB) Department, describing its organizational structure, 2015 accomplishments, and 2016 objectives. She also discussed healthcare cost drivers and cost containment strategies. Finally, Ms. Daniel spoke about certain collaborative efforts undertaken by HIB with the Procurement, Internal Audit, Benefits, and Information Technology departments.
20. Receive an overview of the Governmental Relations Department and an update on
legislative interim charges – Ray Spivey and Merita Zoga. Mr. Spivey provided an overview of the Governmental Relations Department, describing its organizational structure and functions, the legislative process and its key participants, 2015 accomplishments, and the sunset process. Ms. Zoga provided an overview of the joint interim committee that was formed to study the financial soundness of TRS-Care and TRS-ActiveCare and its interim charges.
21. Receive an update on employer audits and discuss the collaboration between Audit
and Benefits in the employer audit process – Amy Barrett, Art Mata, Dinah Arce and Melody Austin.
Ms. Arce, Mr. Mata, and Ms. Austin described in detail the process involved in conducting reporting entity audits and associated collaborative efforts undertaken by Internal Audit, Benefits, and Legal Services.
22. Receive an overview of the Division of Strategic Initiatives, including an update on
the TRS Strategic Planning process and the integration of enterprise risk management with strategic planning – Rebecca Merrill and Jay LeBlanc.
Ms. Merrill provided an overview of the Division of Strategic Initiatives (DSI), describing its history, organizational structure, mission, functions, 2015 accomplishments, and 2016 objectives.

TRS Board Meeting: February 24-26, 2016 Page 12 of 16
Mr. LeBlanc provided an overview of Enterprise Risk Management (ERM), a DSI key function. He described the functions and objectives of ERM and its benefits to the agency. After a recess at 11:27 a.m., the board reconvened at 12:15 p.m. 23. Discuss the role of enterprise risk management and facilities management in creating
a safe, productive work environment – Jay LeBlanc and Don Green. Mr. LeBlanc discussed the role of ERM and the Facilities Management Department in creating a safe, productive work environment. Mr. Green provided an overview of security staff and budget. Mr. LeBlanc showed a video of an actual incident that indicated potential security risks. He also described changes staff made since the incident to enhance the security of TRS facilities. Mr. LeBlanc also discussed the internal Safety Committee and safety training provided for staff. Finally, there was discussion about the new state law that allows one to openly carry a handgun.
24. Receive a presentation on actuarial matters, including a review of actuarial
terminology, methodology, and assumptions – Joe Newton, Gabriel, Roeder, Smith and Co.
Mr. Newton explained actuarial valuation and experience study processes and the importance of having a funding policy. He described the goals and components of a funding policy, current industry guidance on funding policies, types of funding policies commonly used by pension funds, steps to developing a funding policy, related terminology, and risk management framework. 25. Receive an overview of the Legal Department and receive presentations on the
following matters – Carolina de Onís: A. Open Government Update – Dan Junell and Ronnie Bounds.
B. An overview of and question and answer session on ethics and compliance
matters – Carolina de Onís; Heather Traeger; and Steve Huff, Reinhart Boerner Van Deuren, s.c.
Ms. de Onís provided an overview of the Legal Services Department, describing its core values, organizational structure, 2015 accomplishments, and 2016 objectives. Ms. de Onís introduced Mr. Michael Gunst with the U.S. Securities and Exchange Commission (SEC). Mr. Gunst stated that any views he expressed at this meeting were his personal views and not the views of the SEC or SEC staff. He then discussed the role of the SEC, fiduciary duties of trustees and staff, fraud, cybersecurity, and transparency. Ms. de Onís introduced panelists Mr. Bruce Karpati with Kohlberg Kravis Roberts, Mr. John Walsh with the Sutherland Law Firm, and Ms. Laurie Richards with J.P. Morgan. Ms. Traeger conducted a panel discussion regarding the importance of compliance, fiduciary duties and conduct, and the avoidance of conflicts of interest. Mr. Huff and Mr. Johnson provided their remarks on the related topics. The panelists concluded the discussion, providing their opinions on precautionary measures to take to ensure compliance.

TRS Board Meeting: February 24-26, 2016 Page 13 of 16
Mr. Junell and Mr. Bounds provided a presentation on open government issues, particularly regarding new legislation related to the Open Meetings Act (OMA) and OMA general principles and guidelines. They also briefly discussed the annual total volume of open record requests and payments received over the past eight years.
26. Receive an update on implementation of various Governmental Accounting
Standards Board (GASB) requirements – Don Green and Jamie Pierce. Ms. Pierce provided an overview of GASB Statements 67 and 68. She highlighted their impact on calculating and reporting pension liabilities. Mr. Green introduced and explained GASB Statement 72 that addresses issues relating to fair value measurements of investments for all state and local governmental entities.
27. Receive a presentation on and discuss contracting and procurement practices,
including the report on Historically Underutilized Businesses (HUB) for fiscal year 2015 and consider related HUB goals for fiscal year 2016 – Don Green and Cecilia Whitley.
Ms. Whitley provided a report concerning HUB program performance and fiscal year 2016 goals recommended by staff. She also described future initiatives to promote and educate people about TRS’ HUB program. On a motion by Ms. Sissney, seconded by Mr. Corpus, the board unanimously adopted the following resolution to approve the proposed HUB goals for fiscal year 2016:
Whereas, TRS staff met on February 25, 2016 and reviewed the report of the Texas Comptroller of Public Accounts on TRS HUB expenditures for fiscal year 2015 and discussed
the 2015 HUB Program Annual Status Report to be presented to the TRS Board of Trustees
(Board);
Whereas, TRS staff developed proposed HUB goals for fiscal year 2016 and fiscal year 2017 for the Board to consider; and
Whereas, The Board has received and discussed the HUB expenditure reports, and the
Board desires to adopt TRS’ HUB goals for fiscal year 2016 and fiscal year 2017; now,
therefore, be it Resolved, That the Board hereby adopts the following HUB expenditure goals for fiscal year 2016 and fiscal year 2017:
Category TRS FY15 Goals TRS FY15 Actual TRS FY16 and FY17 Goals
Special Trade 35% 24.18% 40%
Professional Services 5% 6.93% 5%
Other Services 15% 14.82% 15%
Commodity Purchases 45% 38.08% 40%
TRS Board Meeting: February 24-26, 2016 Page 14 of 16
28. Panel discussion on environmental, social, and governance (ESG) investing – Steve Voss and Meredith Jones, Aon Hewitt; and Dr. Keith Brown.
Mr. Harris conducted a panel discussion with Mr. Voss, Ms. Jones, and Dr. Brown on environmental, social and governance (ESG) investing. Whereupon, the board meeting recessed at 4:45 p.m. The Board of Trustees of the Teacher Retirement System of Texas met on February 26, 2016 in the Collin, Dallas, and Ellis Rooms located on the First Floor of the Region 10 Educational Service Center at 400 East Spring Valley Road in Richardson, Texas. The following board members were present: David Kelly, Chair Nanette Sissney, Vice-Chair Karen Charleston David Corpus Anita Palmer Others present:
Brian Guthrie, TRS Heather Traeger, TRS Ken Welch, TRS Dan Junell, TRS Carolina de Onís, TRS Lynn Lau, TRS Amy Barrett, TRS Rhonda Price Chris Cutler, TRS Vic Horton, TRS Katrina Daniel, TRS Katy Hoffman, TRS Barbie Pearson, TRS Rhonda Price, TRS Howard Goldman, TRS Merita Zoga, TRS Britt Harris, TRS Sylvia Bell, TRS Rebecca Merrill, TRS Mike Cromstock, Aon Hewitt Jase Auby, TRS Steve Voss, Aon Hewitt Bernie Bozzelli, TRS Keith Johnson, Reinhart Boerner Van Deuren Ronnie Bounds, TRS Steve Huff, Reinhart Boerner Van Deuren
Mr. Kelly called the meeting to order at 8:25 a.m. 1. Call roll of Board members.
Ms. Lau called the roll. A quorum was present. Mr. Barth, Mr. Colonnetta, Mr. Moss, and Ms. Ramirez were absent.
29. Provide opportunity for public comment – David Kelly. Mr. Kelly called for public comments. No public comments were received.
30. Receive an overview of the February 26, 2016 agenda – Brian Guthrie.
Mr. Guthrie provided a preview of agenda items being discussed this day.
TRS Board Meeting: February 24-26, 2016 Page 15 of 16
31. Discuss the following investment matters: A. Review of the Stock Exchange – Bernie Bozzelli.
Mr. Bozzelli provided an overview of the Stock Exchange, describing changes to the exchange since 1998 in terms of process, technological advancement, and regulations. He also discussed trends in trading metrics over the years, trading strategies, market share, current technological needs, and the impact of Dodd-Frank on trading.
B. Fast and Fair: A Market Based Solution to Market Wide Issues – Ronan Ryan,
IEX. Mr. Ryan provided a presentation on the significance and impact of technology and data transfer on trading performance. After a brief recess at 9:50 a.m., the board reconvened at 10:15 a.m.
C. Receive an update on the Emerging Manager portfolio – Sylvia Bell.
Ms. Bell provided an update on the Emerging Manager Portfolio, discussing program accomplishments and goals. She provided an overview of the recent Emerging Manager Conference. Mr. Corpus provided a positive remark on the conference.
D. TRS Investment Management Division Market and Trust Review – Britt Harris.
Mr. Harris provided an overview of the Investment Management Division, describing its organizational structure, 2015 accomplishments, 2016 goals, and portfolio performance. He also discussed U.S. and global economic and market conditions and projections. 32. Consider personnel matters, including the appointment, employment, evaluation,
compensation, performance, duties, discipline, or dismissal of the Executive Director, Chief Investment Officer, or Chief Audit Executive – David Kelly.
33. Consult with the Board's attorney(s) in Executive Session on any item listed above on this meeting agenda as authorized by Section 551.071 of the Texas Open Meetings Act (Chapter 551 of the Texas Government Code) – David Kelly.
The board took up no further business under agenda items 32 and 33.
The meeting was adjourned at 12:00 p.m.
APPROVED BY THE BOARD OF TRUSTEES OF THE TEACHER RETIREMENT SYSTEM OF TEXAS ON THE
26TH DAY OF MARCH, 2015.
TRS Board Meeting: February 24-26, 2016 Page 16 of 16
ATTESTED BY:
Dan Junell Secretary to the TRS Board of Trustees
Date

Teacher Retirement System of Texas
Brian GuthrieApril 7, 2016
Executive Director’s Report

Presentation Objectives
2
Interim Hearings.
Trending Issues.
Upcoming Agendas.

3
Interim Hearings

Interim Hearings
4
March 30
• House Pensions Committee.
• House Insurance Committee (HB 2929, 83R, Plan coverage for brain injury).
• Joint Legislative Committee on TRS Health Benefit Plans.
• Senate Finance Committee (State debt).
April 5
• House Public Health Committee (Impact of chronic diseases).
April 13
• Senate State Affairs.

5
Trending Issues
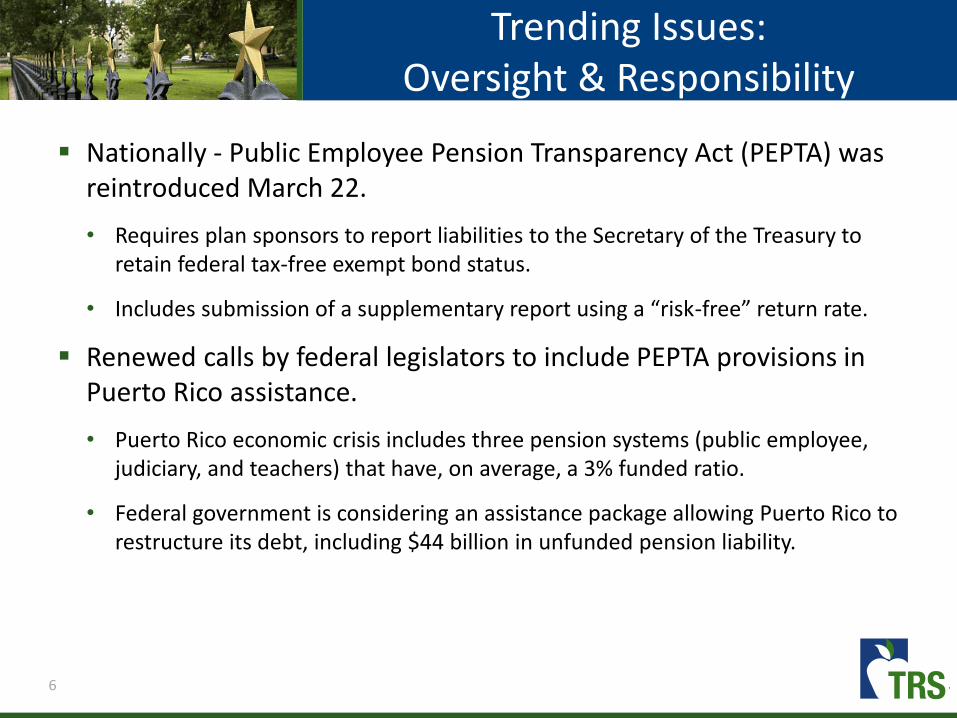
Trending Issues: Oversight & Responsibility
6
Nationally - Public Employee Pension Transparency Act (PEPTA) was reintroduced March 22.
• Requires plan sponsors to report liabilities to the Secretary of the Treasury to retain federal tax-free exempt bond status.
• Includes submission of a supplementary report using a “risk-free” return rate.
Renewed calls by federal legislators to include PEPTA provisions in Puerto Rico assistance.
• Puerto Rico economic crisis includes three pension systems (public employee, judiciary, and teachers) that have, on average, a 3% funded ratio.
• Federal government is considering an assistance package allowing Puerto Rico to restructure its debt, including $44 billion in unfunded pension liability.

Trending Issues: Oversight & Responsibility
7
In State – Harris County Representative Jim Murphy requested a formal Attorney General opinion on the state’s responsibility for payment of municipal pension liabilities, if the municipalities default.
Some municipalities have their plan documents (benefits, contributions, etc.) set in state statute.
Murphy has asked if placement of plan documents in state law results in state responsibility for payment of obligations.

8
Upcoming Agendas

Upcoming Agendas
9
Potential May 13, 2016 Items (1 Day off Quarter):
Discuss potential benefit changes for TRS-Care (Discuss in May for adoption as part of TRS-Care rates and plan design in June).
Update on the Joint Legislative Committee on TRS Health Benefit Plans.
Discuss FY 2017 Budget (Potentially hold Budget Committee Meeting and finalize adoption in May rather than June).
Discuss and review Legislative Appropriations Request (Possibly move up from June).
Review of the CEM Conference Co-hosted by TRS May 2-5, 2016.
Train new trustees, as appropriate.

10
June 16-17, 2016 Major items (2 Day Quarterly):
Report on Q1 Earnings.
TRS-Care Medicare Advantage Procurement.
Adopt FY 2017 Budget (If not adopted in May)
LAR development (If not address in May).
TRS-Care and TRS-ActiveCare Rates and Plan Design Adoption.
FY 2017 ED Goals for the Executive Incentive Pay Plan.
Committees
Audit Committee Meeting
• Items TBD.
Benefits Committee Meeting
• Recommend adoption of TRS-Care and TRS-ActiveCare Rates and Plan Design.
Budget Committee Meeting (If Not Adopted in May)
• FY 2017 Operating Budget (Recommend adoption).
Investment Management Committee Meeting
• Private Equity Review.
• Real Assets Review.
• Energy and Natural Resources Portfolio.
• Private SPN Update.
Risk Management Committee Meeting
• Enterprise Risk Management Update.
Policy Committee Meeting
• Items TBD.
Upcoming Agendas


Aon HewittRetirement and Investment
Investment advice and consulting services provided by Aon Hewitt Investment Consulting, Inc., an Aon Company.
Teacher Retirement System of Texas
Performance Review: Fourth Quarter 2015April 2016

Aon Hewitt | Retirement and InvestmentProprietary & Confidential Investment advice and consulting services provided by Aon Hewitt Investment Consulting, Inc., an Aon Company. 2
Summary
Global asset markets were generally positive for the fourth quarter.
The TRS investment portfolio returned 1.6% for the quarter and underperformed its performance benchmark by 20 basis points.
– For the trailing twelve months, TRS returned 0.3%, outperforming its performance benchmark by 29 basis points.
The primary contributor to relative performance for the quarter included outperformance within Non-U.S. Developed Equity and Emerging Markets components.
Detractors from relative results included underperformance within U.S. Equity, Hedge Funds and Real Assets.
2.8%
-1.0%
1.6%
-1.6%-1.7%-0.6%
6.3%
-7.7%-10.0%-8.0%-6.0%-4.0%-2.0%0.0%2.0%4.0%6.0%8.0%
Global Equity Policy Benchmark Stable Value Policy Benchmark Real Return Policy Benchmark Risk Parity Benchmark
Fourth Quarter 2015 One-Year

Aon Hewitt | Retirement and InvestmentProprietary & Confidential Investment advice and consulting services provided by Aon Hewitt Investment Consulting, Inc., an Aon Company. 3
1. Market Summary – Fourth Quarter 2015
Fourth Quarter One Year Three Years Five Years Ten Years
Global Equity:
MSCI U.S.A. IMI Index 6.3% 0.6% 14.7% 12.2% 7.6%
MSCI EAFE + Canada Index 3.9 -3.0 3.9 2.8 2.9
MSCI Emerging Markets Index 0.7 -14.9 -6.8 -4.8 3.6
HFRI Fund of Funds Composite Index 0.6 -0.3 3.9 2.1 2.3
State Street Private Equity Index (qtr lagged) -1.4 6.1 11.9 11.7 10.3
Global Equity Policy Benchmark 2.8 -1.7 7.1 6.0 --
Stable Value:
Barclays Long Treasury Index -1.4% -1.2% 2.6% 7.7% 6.7%
HFRI Fund of Funds Conservative Index 0.1 0.4 3.7 2.3 2.0
3 Month LIBOR + 2% 0.6 2.3 2.3 2.3 3.6
90 Day U.S. Treasury Bill 0.0 0.1 0.1 0.1 1.3
Stable Value Policy Benchmark -1.0 -0.6 2.8 6.6 --
Real Return:
Barclays U.S. TIPS Index -0.6% -1.4% -2.3% 2.5% 3.9%
NCREIF ODCE (qtr lagged) 3.4 13.9 12.4 12.9 --
Cambridge Nat. Resources (75) / CPI (qtr lagged) (25) -6.0 -20.2 -- -- --
Goldman Sachs Commodities Index -16.6 -32.9 -23.7 -15.2 -10.6
Real Return Policy Benchmark 1.6 6.3 7.2 9.0 --
Risk Parity:
Risk Parity Benchmark -1.6 -7.7 0.7 -- --
TRS Policy Benchmark 1.8% 0.0% 6.4% 7.0% 5.7%

Aon Hewitt | Retirement and InvestmentProprietary & Confidential Investment advice and consulting services provided by Aon Hewitt Investment Consulting, Inc., an Aon Company. 4
2. Market Value Change
$125,326.7
-$858.0
$2,085.8
$126,554.5
(20,000.0)
-
20,000.0
40,000.0
60,000.0
80,000.0
100,000.0
120,000.0
140,000.0
Beginning Market Value Net Additions / Withdrawals Investment Earnings Ending Market Value
Mill
ions
($)
Change in Market Value ( $Millions )From October 1, 2015 To December 31, 2015

Aon Hewitt | Retirement and InvestmentProprietary & Confidential Investment advice and consulting services provided by Aon Hewitt Investment Consulting, Inc., an Aon Company. 5
3. Asset Allocation Detail
Note: Actual allocations above are based upon Account Level information
Market Value ($ in millions)
as of 12/31/2015InterimPolicyTarget
RelativeAllocation
toInterimPolicy Target
Long TermPolicy Target
Long TermPolicy
Ranges($) (%)
Total Fund $126,554 100% --- 100% --
Total U.S.A. $25,780 20.4% 19.4% +1.0% 18% 13-23%
Non-U.S. Developed $18,756 14.8% 14.4% +0.5% 13% 8-13%
Emerging Markets $11,686 9.2% 9.9% -0.7% 9% 4-14%
Directional Hedge Funds $5,959 4.7% 4.5% +0.3% 4% 0-10%
Private Equity $15,137 12.0% 12.6% -0.6% 13% 8-18%
Global Equity $77,318 61.1% 60.6% +0.5% 57% 50-64%
Long Treasuries $12,775 10.1% 12.4% -2.3% 11% 0-20%
Stable Value Hedge Funds $5,321 4.2% 4.0% +0.2% 4% 0-10%
Absolute Return (including OAR) $2,186 1.7% 0.0% +1.7% 0% 0-20%
Cash $144 0.1% 1.0% -0.9% 1% 0-5%
Stable Value $20,426 16.1% 17.4% -1.2% 16% 11-21%
TIPS $5,466 4.3% 4.4% -0.0% 3% 0-10%
Real Assets $17,377 13.7% 13.1% +0.6% 16% 7-17%
Energy and Natural Resources $2,246 1.8% 1.8% -0.0% 3% 0-7%
Commodities $135 0.1% 0.0% +0.1% 0% 0-5%
Real Return $25,224 19.9% 19.3% +0.6% 22% 17-27%
Risk Parity $3,587 2.8% 2.7% +0.1% 5% 0-10%
Risk Parity $3,587 2.8% 2.7% +0.1% 5% 0-5%
Aon Hewitt | Retirement and InvestmentProprietary & Confidential Investment advice and consulting services provided by Aon Hewitt Investment Consulting, Inc., an Aon Company. 6
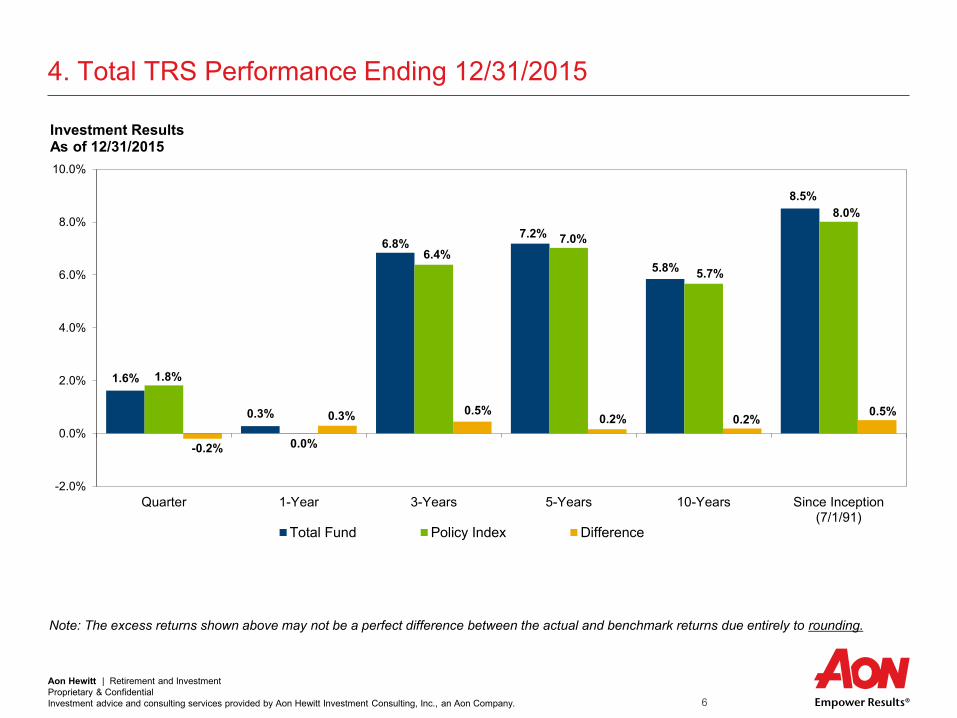
4. Total TRS Performance Ending 12/31/2015
Note: The excess returns shown above may not be a perfect difference between the actual and benchmark returns due entirely to rounding.
1.6%
0.3%
6.8%7.2%
5.8%
8.5%
1.8%
0.0%
6.4%7.0%
5.7%
8.0%
-0.2%
0.3% 0.5%0.2% 0.2% 0.5%
-2.0%
0.0%
2.0%
4.0%
6.0%
8.0%
10.0%
Quarter 1-Year 3-Years 5-Years 10-Years Since Inception(7/1/91)
Investment ResultsAs of 12/31/2015
Total Fund Policy Index Difference

Aon Hewitt | Retirement and InvestmentProprietary & Confidential Investment advice and consulting services provided by Aon Hewitt Investment Consulting, Inc., an Aon Company. 7
5. Total Fund Attribution - Quarter Ending 12/31/2015

Aon Hewitt | Retirement and InvestmentProprietary & Confidential Investment advice and consulting services provided by Aon Hewitt Investment Consulting, Inc., an Aon Company. 8
5. Total Fund Attribution – Trailing One Year Ending 12/31/2015

Aon Hewitt | Retirement and InvestmentProprietary & Confidential Investment advice and consulting services provided by Aon Hewitt Investment Consulting, Inc., an Aon Company. 9
6. Risk Profile: Total Fund Risk-Return vs. Peers
Plan Sponsor Peer Group composed of 21 public funds with total assets in excess of $10B as of 12/31/2015. An analytic outlining the asset allocation of the peer portfolios has been included in the appendix of this report.
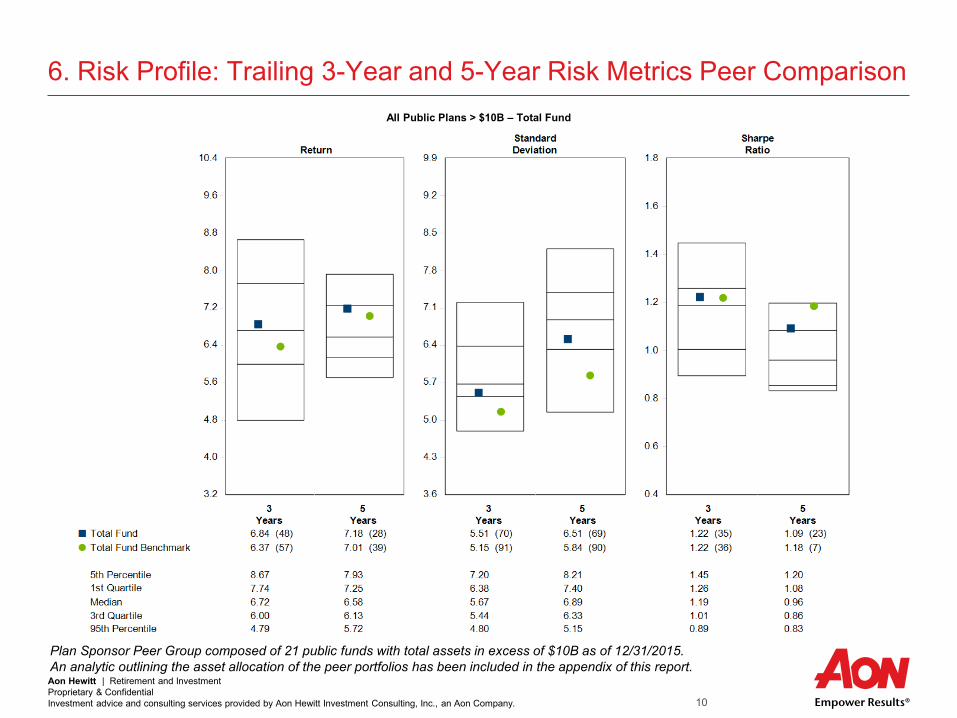
Aon Hewitt | Retirement and InvestmentProprietary & Confidential Investment advice and consulting services provided by Aon Hewitt Investment Consulting, Inc., an Aon Company. 10
6. Risk Profile: Trailing 3-Year and 5-Year Risk Metrics Peer Comparison All Public Plans > $10B – Total Fund
Plan Sponsor Peer Group composed of 21 public funds with total assets in excess of $10B as of 12/31/2015. An analytic outlining the asset allocation of the peer portfolios has been included in the appendix of this report.

Aon Hewitt | Retirement and InvestmentProprietary & Confidential Investment advice and consulting services provided by Aon Hewitt Investment Consulting, Inc., an Aon Company. 11
7. Global Equity: Performance Summary Ending 12/31/2015
Note: The excess returns shown in this presentation may differ from State Street statements due entirely to rounding. These differences are generally within a few basis points and are not material.
Fourth Quarter One Year Three Years Five Years
Total Global Equity 2.6% -0.9% 8.0% 6.6%Global Equity Benchmark 2.8 -1.7 7.1 6.0Difference -0.2 +0.8 +0.9 +0.6Total U.S. Equity 5.6 -0.8 12.9 10.9Total U.S. Equity Benchmark 6.3 0.6 14.8 12.1Difference -0.7 -1.4 -1.9 -1.2Non-U.S. Equity 3.1 -4.8 1.6 0.8Non-U.S. Benchmark 2.6 -7.9 -0.4 -0.2Difference +0.5 +3.1 +2.0 +1.0Non-U.S. Developed 4.3 1.8 6.9 4.7MSCI EAFE + Canada 3.9 -3.0 3.9 2.8Difference +0.4 +4.8 +3.0 +1.9
Emerging Markets 1.4 -14.4 -5.4 -4.0MSCI Emerging Markets 0.7 -14.9 -6.8 -4.8
Difference +0.7 +0.5 +1.4 +0.8

Aon Hewitt | Retirement and InvestmentProprietary & Confidential Investment advice and consulting services provided by Aon Hewitt Investment Consulting, Inc., an Aon Company. 12
7. Global Equity: Performance Summary Ending 12/31/2015 (cont’d)
Note: The excess returns shown in this presentation may differ from State Street statements due entirely to rounding. These differences are generally within a few basis points and are not material.
Fourth Quarter One Year Three Years Five Years
Directional Hedge Funds -1.4% -3.8% 3.8% --
HFRI Fund of Funds Composite Index 0.6 -0.3 3.9 --
Difference -2.0 -3.5 -0.1 --
Total Public Equity 3.7 -3.0 6.4 4.9
Public Equity Benchmark 3.9 -3.8 6.0 4.8
Difference -0.2 +0.8 +0.4 +0.1
Total Private Equity -1.7 9.4 15.4 14.8
Private Equity Benchmark -1.7 7.0 11.7 11.6
Difference +0.0 +2.4 +3.7 +3.2
Aon Hewitt | Retirement and InvestmentProprietary & Confidential Investment advice and consulting services provided by Aon Hewitt Investment Consulting, Inc., an Aon Company. 13
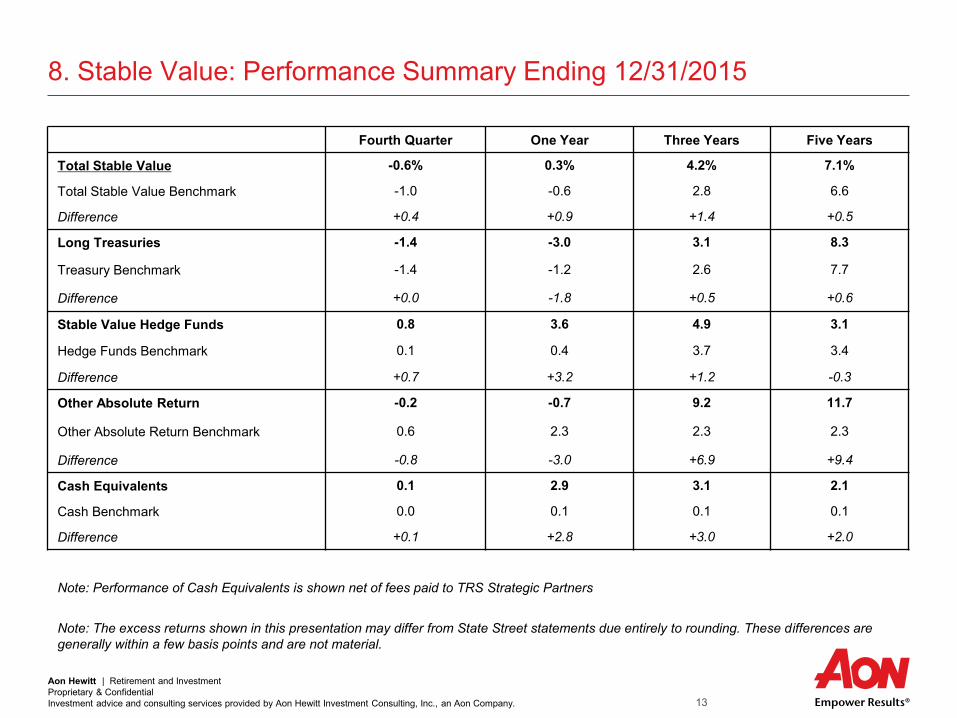
8. Stable Value: Performance Summary Ending 12/31/2015
Note: Performance of Cash Equivalents is shown net of fees paid to TRS Strategic Partners
Note: The excess returns shown in this presentation may differ from State Street statements due entirely to rounding. These differences are generally within a few basis points and are not material.
Fourth Quarter One Year Three Years Five Years
Total Stable Value -0.6% 0.3% 4.2% 7.1%
Total Stable Value Benchmark -1.0 -0.6 2.8 6.6
Difference +0.4 +0.9 +1.4 +0.5
Long Treasuries -1.4 -3.0 3.1 8.3
Treasury Benchmark -1.4 -1.2 2.6 7.7
Difference +0.0 -1.8 +0.5 +0.6
Stable Value Hedge Funds 0.8 3.6 4.9 3.1
Hedge Funds Benchmark 0.1 0.4 3.7 3.4
Difference +0.7 +3.2 +1.2 -0.3
Other Absolute Return -0.2 -0.7 9.2 11.7
Other Absolute Return Benchmark 0.6 2.3 2.3 2.3
Difference -0.8 -3.0 +6.9 +9.4
Cash Equivalents 0.1 2.9 3.1 2.1
Cash Benchmark 0.0 0.1 0.1 0.1
Difference +0.1 +2.8 +3.0 +2.0
Aon Hewitt | Retirement and InvestmentProprietary & Confidential Investment advice and consulting services provided by Aon Hewitt Investment Consulting, Inc., an Aon Company. 14
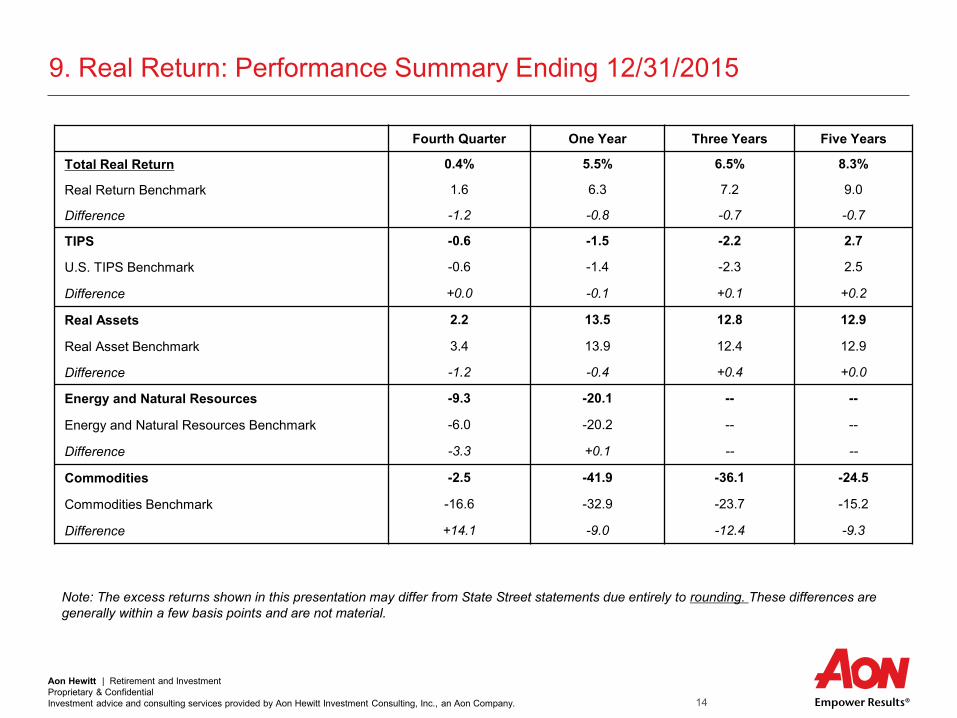
9. Real Return: Performance Summary Ending 12/31/2015
Note: The excess returns shown in this presentation may differ from State Street statements due entirely to rounding. These differences are generally within a few basis points and are not material.
Fourth Quarter One Year Three Years Five Years
Total Real Return 0.4% 5.5% 6.5% 8.3%
Real Return Benchmark 1.6 6.3 7.2 9.0
Difference -1.2 -0.8 -0.7 -0.7
TIPS -0.6 -1.5 -2.2 2.7
U.S. TIPS Benchmark -0.6 -1.4 -2.3 2.5
Difference +0.0 -0.1 +0.1 +0.2
Real Assets 2.2 13.5 12.8 12.9
Real Asset Benchmark 3.4 13.9 12.4 12.9
Difference -1.2 -0.4 +0.4 +0.0
Energy and Natural Resources -9.3 -20.1 -- --
Energy and Natural Resources Benchmark -6.0 -20.2 -- --
Difference -3.3 +0.1 -- --
Commodities -2.5 -41.9 -36.1 -24.5
Commodities Benchmark -16.6 -32.9 -23.7 -15.2
Difference +14.1 -9.0 -12.4 -9.3

Aon Hewitt | Retirement and InvestmentProprietary & Confidential Investment advice and consulting services provided by Aon Hewitt Investment Consulting, Inc., an Aon Company. 15
10. Risk Parity: Performance Summary Ending 12/31/2015
Note: The excess returns shown in this presentation may differ from State Street statements due entirely to rounding. These differences are generally within a few basis points and are not material.
Fourth Quarter One Year Three Years Five Years
Total Risk Parity -1.1% -7.0% -0.6% --
Risk Parity Benchmark -1.6 -7.7 0.7 --
Difference +0.5 +0.7 -1.3 --

Aon Hewitt | Retirement and InvestmentProprietary & Confidential Investment advice and consulting services provided by Aon Hewitt Investment Consulting, Inc., an Aon Company. 16
Appendix – Supplemental Reporting

Aon Hewitt | Retirement and InvestmentProprietary & Confidential Investment advice and consulting services provided by Aon Hewitt Investment Consulting, Inc., an Aon Company. 17
TRS Commitment Levels vs. Peers (>$10 Billion)
The chart above depicts the asset allocation of peer public funds with assets greater than $10 billion.- The ends of each line represent the 95th and 5th percentile of exposures, the middle light blue and grey lines represent the
25th and 75th percentile of exposures, and the green dot represents TRS exposure.
63.5% 63.1%
57.0%
14.7%
7.3%
57.5%
27.6%21.2%
9.3%2.8%
36.0%
17.9%
6.9%2.6%
0.0%2.8%
5.4%0.0% 0.0%
44.4%
20.3% 21.4%
13.7%
0.1% 0.0%
10.0%
20.0%
30.0%
40.0%
50.0%
60.0%
70.0%
Global Equity Total Fixed Income AlternativeInvestments
Real Estate Cash
95th 75th 25th 5th Percentile TRS

Aon Hewitt | Retirement and InvestmentProprietary & Confidential Investment advice and consulting services provided by Aon Hewitt Investment Consulting, Inc., an Aon Company. 18
Historical Excess Performance Ending 12/31/2015
Quarterly and Cumulative Excess Performance
Total Fund vs. Total Fund Benchmark

Aon Hewitt | Retirement and InvestmentProprietary & Confidential Investment advice and consulting services provided by Aon Hewitt Investment Consulting, Inc., an Aon Company. 19
TRS Asset Growth
0
20
40
60
80
100
120
140
160
Mar
ket V
alue
(Billi
ons)
Total Fund Historical Growth (September 1997 - December 2015)
$126.6

Aon Hewitt | Retirement and InvestmentProprietary & Confidential Investment advice and consulting services provided by Aon Hewitt Investment Consulting, Inc., an Aon Company. 20
External Manager Program: Public Equity Performance as of 12/31/2015
Note: The excess returns shown in this presentation may differ from State Street statements due entirely to rounding. These differences are generally within a few basis points and are not material.
Allocation ($ in billions)
FourthQuarter
One Year
Three Years
EP Total Global Equity $31.2 3.0% -4.1% 5.3%EP Global Equity Benchmark -- 3.4 -4.2 5.2Difference -- -0.4 +0.1 +0.1EP U.S.A. $7.6 4.7 -3.6 11.4EP U.S.A. Benchmark -- 6.3 0.6 14.8Difference -- -1.6 -4.2 -3.4EP Non-U.S. Developed $5.3 5.0 5.3 7.5MSCI EAFE + Canada Index -- 3.9 -3.0 3.9Difference -- +1.1 +8.3 +3.6EP Emerging Markets $6.4 1.2 -14.5 -5.8MSCI Emerging Markets Index -- 0.7 -14.9 -6.8Difference -- +0.5 +0.4 +1.0EP World Equity $6.0 5.5 0.0 8.8EP World Equity Benchmark -- 5.1 -2.0 7.8Difference -- +0.4 +2.0 +1.0EP Directional Hedge Funds $6.0 -1.4 -3.8 4.3HFRI Fund of Funds Composite Index -- 0.6 -0.3 3.9Difference -- -2.0 -3.5 +0.4

Aon Hewitt | Retirement and InvestmentProprietary & Confidential Investment advice and consulting services provided by Aon Hewitt Investment Consulting, Inc., an Aon Company. 21
External Manager Program: Stable Value/Total Program Performance as of 12/31/2015
Note: The excess returns shown in this presentation may differ from State Street statements due entirely to rounding. These differences are generally within a few basis points and are not material.
Allocation ($ in billions)
FourthQuarter
One Year
Three Years
EP Total Stable Value $5.5 0.8% 3.8% 5.9%
EP Stable Value Benchmark -- 0.1 0.5 3.7
Difference -- +0.7 +3.3 +2.2
EP Stable Value Hedge Funds $5.3 0.8 3.6 4.9
EP Stable Value Hedge Funds Benchmark -- 0.1 0.4 3.7
Difference -- +0.7 +3.2 +1.2
EP Absolute Return $0.2 1.3 9.3 32.2
EP Absolute Return Benchmark -- 0.6 2.3 2.3
Difference -- +0.7 +7.0 +29.9
Total External Public Program $36.7 2.6 -3.0 5.5
EP External Public Benchmark -- 2.9 -3.5 5.1
Difference -- -0.3 +0.5 +0.4
Aon Hewitt | Retirement and InvestmentProprietary & Confidential Investment advice and consulting services provided by Aon Hewitt Investment Consulting, Inc., an Aon Company. 22
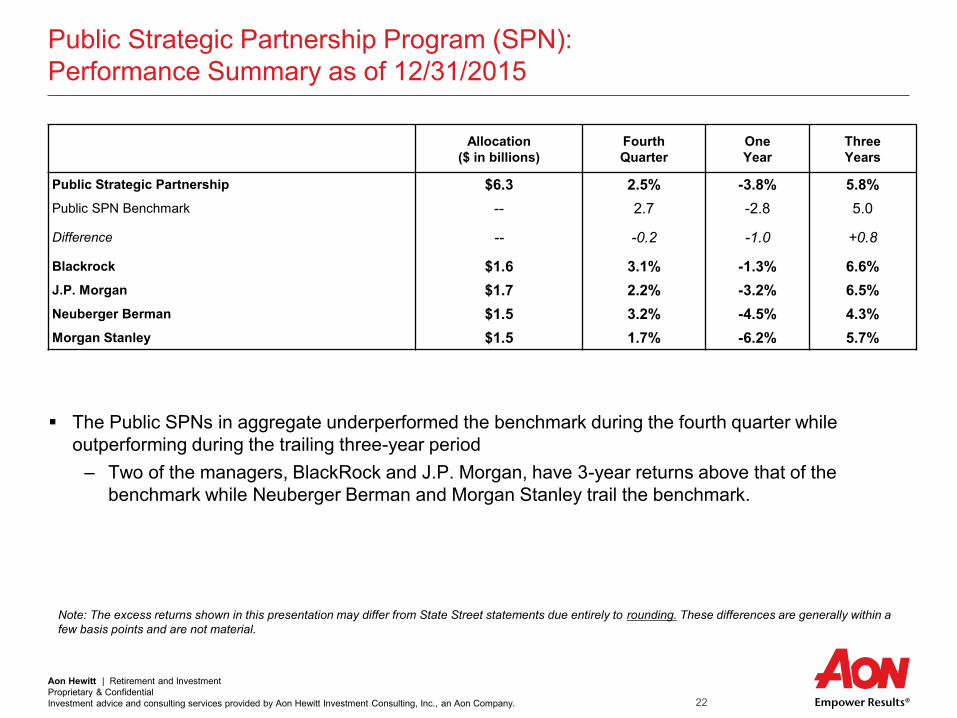
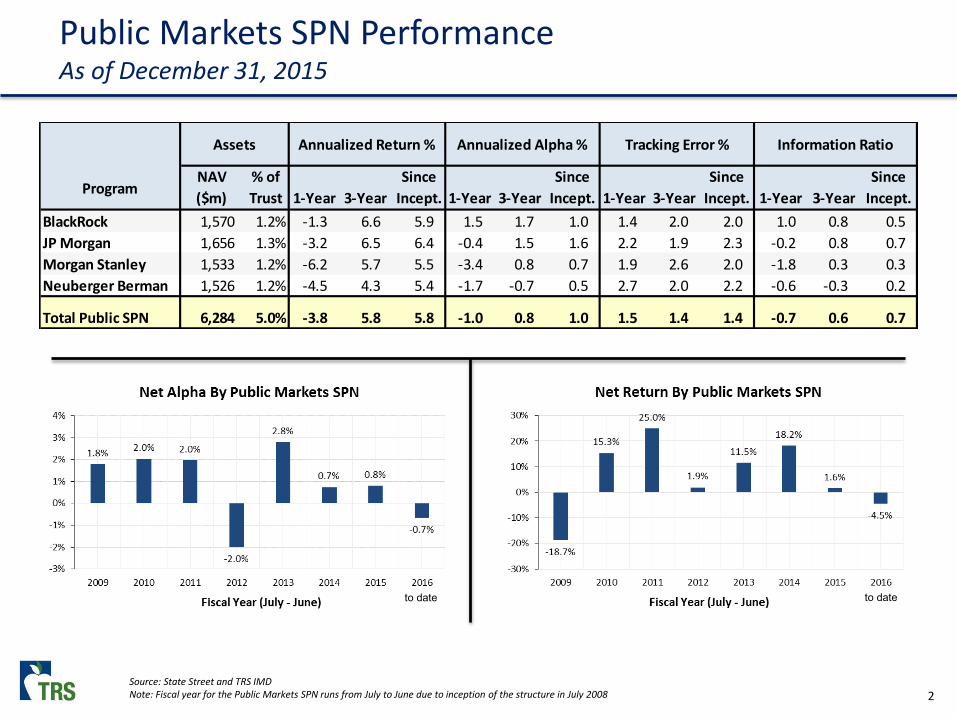
Public Strategic Partnership Program (SPN): Performance Summary as of 12/31/2015
The Public SPNs in aggregate underperformed the benchmark during the fourth quarter while outperforming during the trailing three-year period
– Two of the managers, BlackRock and J.P. Morgan, have 3-year returns above that of the benchmark while Neuberger Berman and Morgan Stanley trail the benchmark.
Note: The excess returns shown in this presentation may differ from State Street statements due entirely to rounding. These differences are generally within a few basis points and are not material.
Allocation ($ in billions)
FourthQuarter
One Year
Three Years
Public Strategic Partnership $6.3 2.5% -3.8% 5.8%Public SPN Benchmark -- 2.7 -2.8 5.0
Difference -- -0.2 -1.0 +0.8
Blackrock $1.6 3.1% -1.3% 6.6%J.P. Morgan $1.7 2.2% -3.2% 6.5%Neuberger Berman $1.5 3.2% -4.5% 4.3%Morgan Stanley $1.5 1.7% -6.2% 5.7%

Aon Hewitt | Retirement and InvestmentProprietary & Confidential Investment advice and consulting services provided by Aon Hewitt Investment Consulting, Inc., an Aon Company. 23
Benchmarks
Total Fund Performance Benchmark – 19.4% MSCI U.S.A. IMI, 9.9% MSCI Emerging Markets, 14.4% MSCI EAFE plus Canada, 4.5% HFRI FoF Composite Index, 12.6% State Street Private Equity (1 qtr lagged), 12.4% BC Long Term Treasury, 4.0% HFRI FoF Conservative Index, 1.0% Citigroup 3 Mo T-Bill, 4.4% BC U.S. TIPS, 13.1% NCREIF ODCE (1 qtr lagged), 1.8% Energy and Natural Resources Benchmark, and 2.7% Risk Parity Benchmark.
Global Equity Benchmark– 24.3% MSCI EAFE plus Canada, 32.4% MSCI U.S.A. IMI,16.6% MSCI Emerging markets index, 7.7% HFRI FoF Composite Index, and 19.0% State Street Private Equity (1 qtr lagged)
– U.S, Equity Benchmark - MSCI U.S.A. IMI Index– Emerging Markets Equity Benchmark – MSCI Emerging Markets – Non-US Developed Equity Benchmark– MSCI EAFE plus Canada– Directional Hedge Funds – HFRI Fund of Funds (FoF) Composite Index– Private Equity Benchmark - State Street Private Equity (1 qtr lagged)
Note: Returns and market values (based on account level) reported are provided by State Street. Net additions/withdrawals are reported on a gross (adjusted for expenses) total fund level as provided by State Street. All rates of return for time periods greater than one year are annualized. The excess returns shown in this presentation may differ from State Street statements due entirely to rounding. These differences are generally within a few basis points and are not material.

Aon Hewitt | Retirement and InvestmentProprietary & Confidential Investment advice and consulting services provided by Aon Hewitt Investment Consulting, Inc., an Aon Company. 24
Benchmarks (cont’d)
Stable Value Benchmark – 22.1% HFRI FoF Conservative Index, 72.4% Barclays Long Term Treasury, and 5.5% Citigroup 3 mo T-Bill.
– US Treasuries Benchmark – Barclays Long Term Treasury– Stable Value Hedge Funds – HFRI Fund of Funds (FoF) Conservative Index– Other Absolute Return Benchmark - 3 Mo LIBOR + 2%– Cash Benchmark - Citigroup 3 Mo T-Bill
Real Return Benchmark – 27.1% Barclays U.S. TIPS, 62.5% NCREIF ODCE, and 10.5% Energy & Natural Resources Benchmark
– US TIPS Benchmark – Barclays U.S. TIPS Index– Real Assets Benchmark – NCREIF ODCE (1qtr lagged) – Energy and Natural Resources – 75% Cambridge Associates Natural Resources (reweighted) /
25% quarterly Seasonally-Adjusted Consumer Price Index (1qtr lagged) – Commodities Benchmark – Goldman Sachs Commodity Index
Note: Returns and market values (based on account level) reported are provided by State Street. Net additions/withdrawals are reported on a gross (adjusted for expenses) total fund level as provided by State Street. All rates of return for time periods greater than one year are annualized. The excess returns shown in this presentation may differ from State Street statements due entirely to rounding. These differences are generally within a few basis points and are not material.

Aon Hewitt | Retirement and InvestmentProprietary & Confidential Investment advice and consulting services provided by Aon Hewitt Investment Consulting, Inc., an Aon Company. 25
Description of Performance Attribution
A measure of the source of the deviation of a fund's performance from that of its policy benchmark. Each bar on the attribution graph represents the contribution made by the asset class to the total difference in performance. A positive value for a component indicates a positive contribution to the aggregate relative performance. A negative value indicates a detrimental impact. The magnitude of each component's contribution is a function of (1) the performance of the component relative to its benchmark, and (2) the weight (beginning of period) of the component in the aggregate.
The individual Asset Class effect, also called Selection Effect, is calculated as Actual Weight of Asset Class x (Actual Asset Class Return – Asset Class Benchmark Return)
The bar labeled Allocation Effect illustrates the effect that a Total Fund's asset allocation has on its relative performance. Allocation Effect calculation = (Asset Class Benchmark Return –Total Benchmark Return) x (Actual Weight of Asset Class – Target Policy Weight of Asset Class).
The bar labeled Other is a combination of Cash Flow Effect and Benchmark Effect:– Cash Flow Effect describes the impact of asset movements on the Total Fund results. Cash Flow
Effect calculation = (Total Fund Actual Return – Total Fund Policy Return) – Current Selection Effect – Current Allocation Effect
– Benchmark Effect results from the weighted average return of the asset classes' benchmarks being different from the Total Funds’ policy benchmark return. Benchmark Effect calculation = Total Fund Policy Return – (Asset Class Benchmark Return x Target Policy Weight of Asset Class)
Cumulative EffectCumulative Effect calculation = Current Effect t *(1+Cumulative Total Fund Actual Return t-1) +Cumulative Effect t-1*(1+Total Fund Benchmark Return t)

Aon Hewitt | Retirement and InvestmentProprietary & Confidential Investment advice and consulting services provided by Aon Hewitt Investment Consulting, Inc., an Aon Company. 26
Disclaimers and Notes

Aon Hewitt | Retirement and InvestmentProprietary & Confidential Investment advice and consulting services provided by Aon Hewitt Investment Consulting, Inc., an Aon Company. 27
Disclaimers and NotesAs of December 31, 2015
Disclaimers: Please review this report and notify Aon Hewitt Investment Consulting (AHIC) with any issues or
questions you may have with respect to investment performance or any other matter set forth herein. The client portfolio data presented in this report have been obtained from the custodian. AHIC has
compared this information to the investment managers’ reported returns and believes the information to be accurate. AHIC has not conducted additional audits and cannot warrant its accuracy or completeness.
The mutual fund information found in this report is provided by Lipper Inc. and AHIC cannot warrant its accuracy or timeliness.
Russell Investment Group is the source and owner of the trademarks, service marks and copyrights related to the Russell Indexes. Russell® is a trademark of Russell Investment Group.
Notes: The rates of return contained in this report are shown on an after-fees (or before-fees) basis unless
otherwise noted. They are geometric and time weighted. Returns for periods longer than one year are annualized.
Universe percentiles are based upon an ordering system in which 1 is the best ranking and 100 is the worst ranking.
Due to rounding throughout the report, percentage totals displayed may not sum up to 100.0%. Additionally, individual fund totals in dollar terms may not sum up to the plan totals.

Master title styleMike PiaDirector
April 2016
Strategic Partnerships & Research (SPR) Update
2
Public Markets SPN PerformanceAs of December 31, 2015
Source: State Street and TRS IMDNote: Fiscal year for the Public Markets SPN runs from July to June due to inception of the structure in July 2008
to date to date
Assets Annualized Return % Annualized Alpha % Tracking Error % Information Ratio
ProgramNAV
($m)
% of
Trust 1-Year 3-Year
Since
Incept. 1-Year 3-Year
Since
Incept. 1-Year 3-Year
Since
Incept. 1-Year 3-Year
Since
Incept.
BlackRock 1,570 1.2% -1.3 6.6 5.9 1.5 1.7 1.0 1.4 2.0 2.0 1.0 0.8 0.5
JP Morgan 1,656 1.3% -3.2 6.5 6.4 -0.4 1.5 1.6 2.2 1.9 2.3 -0.2 0.8 0.7
Morgan Stanley 1,533 1.2% -6.2 5.7 5.5 -3.4 0.8 0.7 1.9 2.6 2.0 -1.8 0.3 0.3
Neuberger Berman 1,526 1.2% -4.5 4.3 5.4 -1.7 -0.7 0.5 2.7 2.0 2.2 -0.6 -0.3 0.2
Total Public SPN 6,284 5.0% -3.8 5.8 5.8 -1.0 0.8 1.0 1.5 1.4 1.4 -0.7 0.6 0.7

3
This slide intentionally left blank.
4
This slide intentionally left blank.

5
This slide intentionally left blank.

APPENDIX

7
This slide intentionally left blank.

8
This slide intentionally left blank.


7th Anniversary of the Bull Market
Britt Harris, Chief Investment Officer
April 2016

2
Results of this Bull Market Cycle
Source: Bloomberg. All returns are total returns and include income and capital appreciation.
Cumulative
Return
Annualized
Return
Annualized
Standard
Deviation
Sharpe Ratio
Global Public Equity USD 158.9% 14.6% 17.8% 0.8
Blackstone Stock 401.8% 25.9% 52.5% 0.5
REITs 395.3% 25.7% 27.6% 0.9
MSCI US Small Cap 296.5% 21.7% 23.3% 0.9
MSCI (US) Growth 250.5% 19.6% 16.1% 1.2
MSCI US Large Cap 239.2% 19.1% 16.7% 1.1
MSCI (US) Value 228.5% 18.5% 18.1% 1.0
US High Yield 139.7% 13.3% 9.6% 1.4
Europe Local 130.3% 12.7% 17.7% 0.7
Europe USD 122.4% 12.1% 21.4% 0.6
EAFE (+CA) Local 119.6% 11.9% 14.8% 0.8
EAFE (+CA) USD 114.2% 11.5% 19.0% 0.6
EM Local 107.8% 11.0% 17.2% 0.6
EM USD 92.0% 9.8% 23.3% 0.4
China USD 88.7% 9.5% 25.6% 0.4
China Local 82.2% 8.9% 25.2% 0.4
US Investment Grade Credit 63.0% 7.2% 4.3% 1.6
US L-Term Government 60.3% 7.0% 11.0% 0.6
Copper 37.9% 4.7% 25.6% 0.2
US TIPS 37.9% 4.7% 5.5% 0.8
Gold 37.0% 4.6% 16.1% 0.3
EMD (USD) 33.8% 4.2% 12.9% 0.3
HF Conservative 25.1% 3.3% 2.9% 1.1
HF Macro 15.3% 2.1% 4.6% 0.4
US Cash 0.6% 0.1% 0.0% 0.0
Oil (Brent) -6.9% -1.0% 34.3% 0.0
Wheat -9.6% -1.4% 33.8% 0.0
GSCI -36.7% -6.3% 22.5% -0.3
Starting Point: 3/9/2009
Ending Point: 3/9/2016

3
$0
$20
$40
$60
$80
$100
$120
$140
$160
2005 2006 2007 2008 2009 2010 2011 2012 2013 2014 2015
Tru
st V
alu
e (
$, B
)TRS Trust Size Over Past 10 Years
Source: State Street. As of 12/31/2015
February 2009: $70.5 B
December 2015: $126.6 B
December 2005: $95.7 B
4
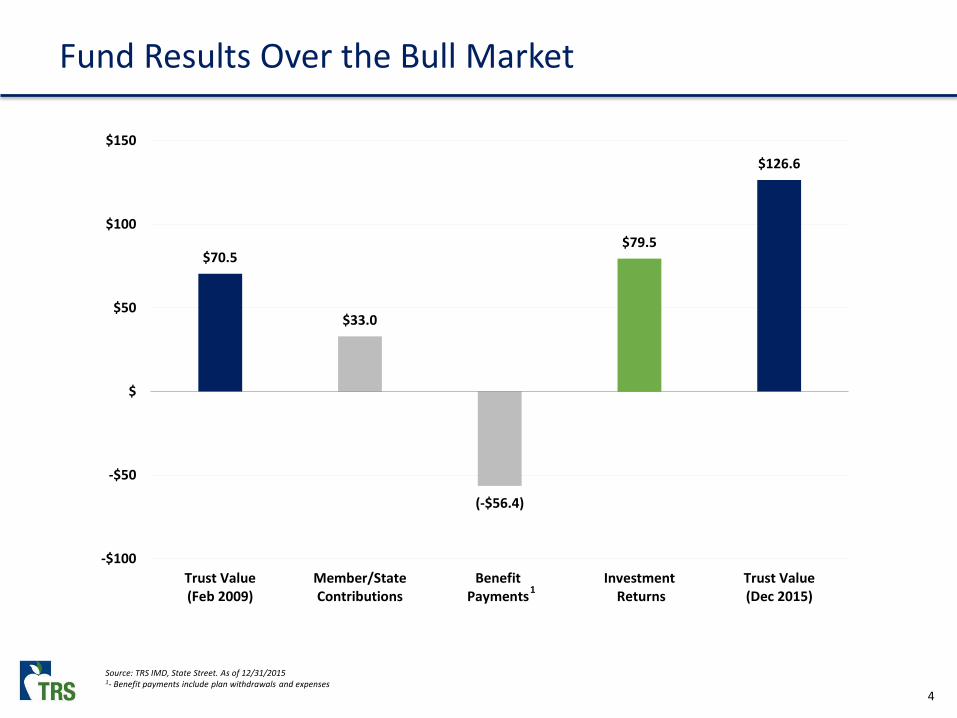
Fund Results Over the Bull Market
Source: TRS IMD, State Street. As of 12/31/20151- Benefit payments include plan withdrawals and expenses
$70.5
$33.0
(-$56.4)
$79.5
$126.6
-$100
-$50
$
$50
$100
$150
Trust Value(Feb 2009)
Member/StateContributions
BenefitPayments
Investment Returns
Trust Value(Dec 2015)
1
5
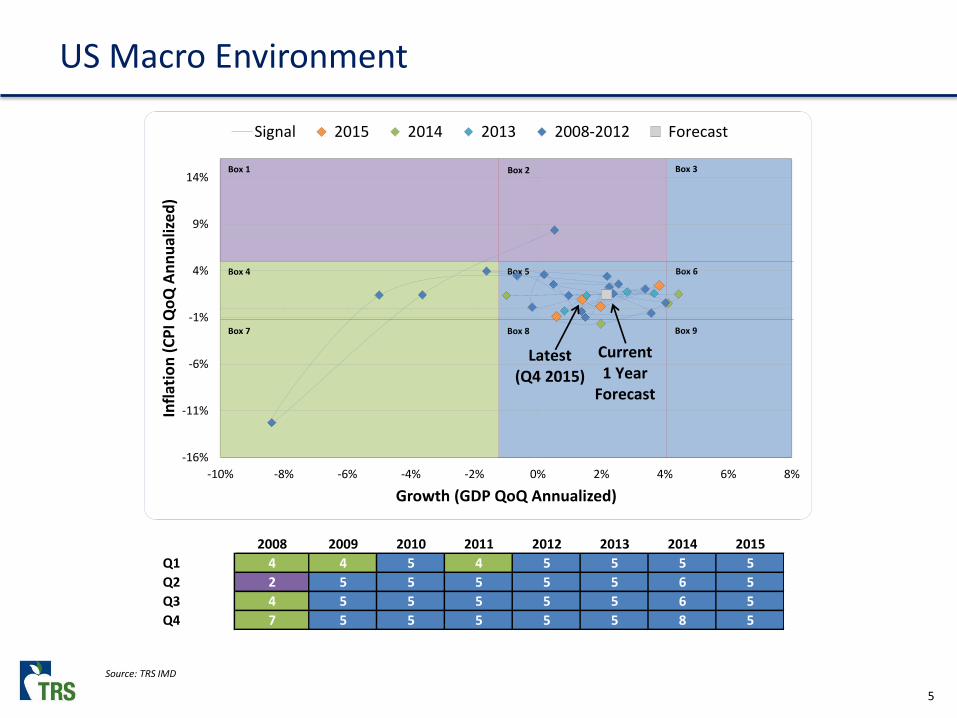
US Macro Environment
Source: TRS IMD
2008 2009 2010 2011 2012 2013 2014 2015
Q1 4 4 5 4 5 5 5 5
Q2 2 5 5 5 5 5 6 5
Q3 4 5 5 5 5 5 6 5
Q4 7 5 5 5 5 5 8 5
Box 1 Box 2 Box 3
Box 4 Box 5 Box 6
Box 7 Box 8 Box 9
-16%
-11%
-6%
-1%
4%
9%
14%
-10% -8% -6% -4% -2% 0% 2% 4% 6% 8%
Infl
atio
n (
CP
I Q
oQ
An
nu
aliz
ed
)
Growth (GDP QoQ Annualized)
Signal 2015 2014 2013 2008-2012 Forecast
Latest(Q4 2015)
Current1 Year
Forecast
6
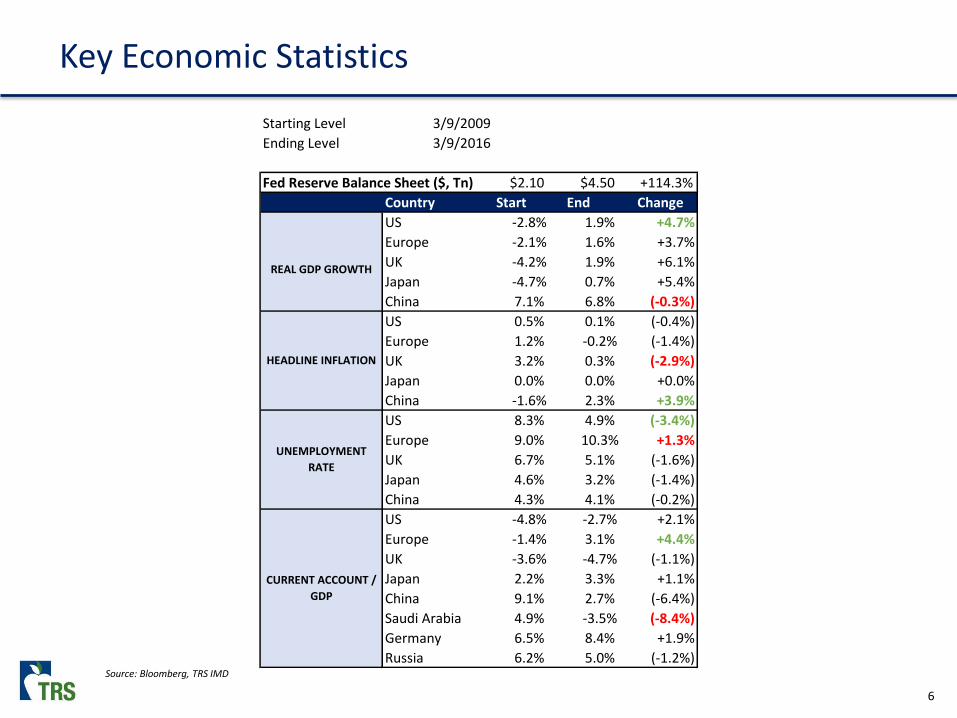
Key Economic Statistics
Source: Bloomberg, TRS IMD
Starting Level 3/9/2009
Ending Level 3/9/2016
Fed Reserve Balance Sheet ($, Tn) $2.10 $4.50 +114.3%
Country Start End Change
US -2.8% 1.9% +4.7%
Europe -2.1% 1.6% +3.7%
UK -4.2% 1.9% +6.1%
Japan -4.7% 0.7% +5.4%
China 7.1% 6.8% (-0.3%)
US 0.5% 0.1% (-0.4%)
Europe 1.2% -0.2% (-1.4%)
UK 3.2% 0.3% (-2.9%)
Japan 0.0% 0.0% +0.0%
China -1.6% 2.3% +3.9%
US 8.3% 4.9% (-3.4%)
Europe 9.0% 10.3% +1.3%
UK 6.7% 5.1% (-1.6%)
Japan 4.6% 3.2% (-1.4%)
China 4.3% 4.1% (-0.2%)
US -4.8% -2.7% +2.1%
Europe -1.4% 3.1% +4.4%
UK -3.6% -4.7% (-1.1%)
Japan 2.2% 3.3% +1.1%
China 9.1% 2.7% (-6.4%)
Saudi Arabia 4.9% -3.5% (-8.4%)
Germany 6.5% 8.4% +1.9%
Russia 6.2% 5.0% (-1.2%)
REAL GDP GROWTH
HEADLINE INFLATION
UNEMPLOYMENT
RATE
CURRENT ACCOUNT /
GDP

7
Monthly Bubble Signals by Asset Class
Source: TRS IMDNote: Bubble Monitor signal is based on 3 factors: 1) A rolling 7-year Z-score of 2.75 or above; 2) Change in correlation to a benchmark; 3) Absolute change in price within the past 7 years
-
2
4
6
8
10
12
14
05 06 07 08 09 10 11 12 13 14 15
Nu
mb
er
of
Sign
als
Monthly Bubble Signals by Asset ClassEquities Fixed Income Commodities Currencies Alternatives
• No active bubble signals• Compare this to before the Financial Crisis, when there were 10+
bubbles in some periods
8
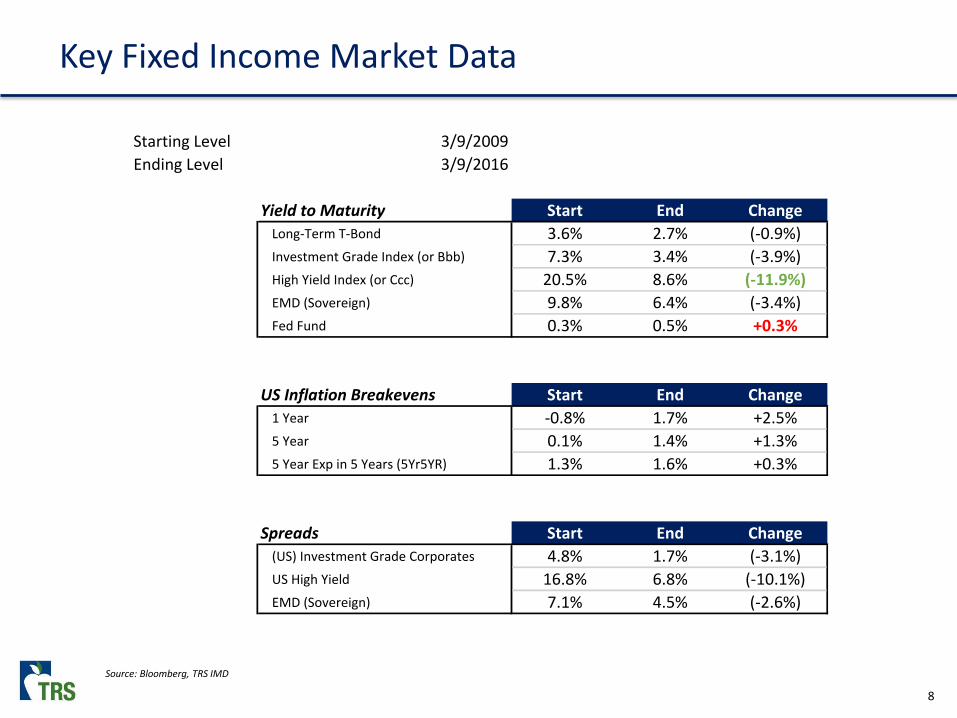
Key Fixed Income Market Data
Source: Bloomberg, TRS IMD
Starting Level 3/9/2009
Ending Level 3/9/2016
Yield to Maturity Start End Change
Long-Term T-Bond 3.6% 2.7% (-0.9%)
Investment Grade Index (or Bbb) 7.3% 3.4% (-3.9%)
High Yield Index (or Ccc) 20.5% 8.6% (-11.9%)
EMD (Sovereign) 9.8% 6.4% (-3.4%)
Fed Fund 0.3% 0.5% +0.3%
US Inflation Breakevens Start End Change
1 Year -0.8% 1.7% +2.5%
5 Year 0.1% 1.4% +1.3%
5 Year Exp in 5 Years (5Yr5YR) 1.3% 1.6% +0.3%
Spreads Start End Change
(US) Investment Grade Corporates 4.8% 1.7% (-3.1%)
US High Yield 16.8% 6.8% (-10.1%)
EMD (Sovereign) 7.1% 4.5% (-2.6%)

9
Past 10-Year Market Performance
-60%
-50%
-40%
-30%
-20%
-10%
0%
10%
20%
30%
40%
50%
60%
70%
80%
90%
100%
110%
120%
Cash EAFE EM Inv Grade SC US High Yield LT US Treasuries Commodities
Source: Bloomberg, TRS IMD. Returns are Total Returns and include both income and capital appreciation. Returns in US Dollar terms.
-60%
-50%
-40%
-30%
-20%
-10%
0%
10%
20%
30%
40%
50%
60%
70%
80%
90%
100%
110%
120%
Cash EAFE EM Inv Grade SC US High Yield LT US Treasuries Commodities

10
Key Equity Market Data
Source: Bloomberg, TRS IMD
As of 2/29/2009 Expected Trailing
L-T EPS Growth P/E P/B P/S Div. Yld EPS Yld
SP 500 10.8% 10.3 1.6 0.7 3.9% 9.7%
Russell 2000 14.6% 30.3 1.2 0.5 2.9% 3.3%
Europe 7.8% 8.9 1.2 0.6 6.6% 11.3%
UK 7.5% 8.0 1.4 0.8 6.5% 12.5%
Japan 11.7% 23.2 0.9 0.4 2.9% 4.3%
China 17.1% 16.4 1.4 1.0 2.0% 6.1%
EM 14.5% 8.3 1.2 0.8 4.6% 12.0%
As of 2/29/2016
Expected Trailing
L-T EPS Growth P/E P/B P/S Div. Yld EPS Yld
SP 500 10.1% 17.1 2.8 1.8 2.3% 5.8%
Russell 2000 14.0% 17.9 2.1 1.1 1.8% 5.6%
Europe 7.8% 16.6 1.7 1.1 3.9% 6.0%
UK 7.1% 18.4 1.8 1.2 4.5% 5.4%
Japan 9.5% 16.0 1.1 0.7 2.0% 6.3%
China 10.8% 12.5 0.9 0.8 2.3% 8.0%
EM 12.3% 10.3 1.4 1.0 3.1% 9.7%
Change Expected Trailing
L-T EPS Growth P/E P/B P/S Div. Yld EPS Yld
SP 500 (-0.7%) +6.8 +1.1 +1.1 (-1.6%) (-3.9%)
Russell 2000 (-0.6%) (-12.4) +0.9 +0.6 (-1.1%) +2.3%
Europe +0.0% +7.7 +0.5 +0.5 (-2.7%) (-5.2%)
UK (-0.5%) +10.4 +0.4 +0.4 (-2.0%) (-7.1%)
Japan (-2.2%) (-7.2) +0.2 +0.3 (-0.9%) +1.9%
China (-6.4%) (-3.9) (-0.5) (-0.2) +0.3% +1.9%
EM (-2.2%) +2.0 +0.2 +0.2 (-1.5%) (-2.3%)

11
Historical Context – Bull/Bear Market Cycles
Source: Bespoke Investment Group, BloombergChange column only reflects the percentage change in price of the S&P 500 Index, and does not include dividends
S&P 500 Bull Markets: 1928-2015 S&P 500 Bear Markets: 1928-2015
S&P 500 Price Change S&P 500 Price Change
Start Finish (%) Start Finish (%)1/2/1928 4/10/1930 17.66 25.92 46.8 829 4/9/1930 3/14/1935 25.87 8.06 -68.8 1800
3/14/1935 3/10/1937 8.06 18.67 131.6 727 3/9/1937 3/31/1938 18.54 8.5 -54.2 387
3/31/1938 11/9/1938 8.5 13.79 62.2 223 11/7/1938 4/11/1939 13.43 10.42 -22.4 155
4/11/1939 10/25/1939 10.42 13.21 26.8 197 10/24/1939 4/28/1942 13.02 7.47 -42.6 917
4/28/1942 5/29/1946 7.47 19.25 157.7 1492 5/28/1946 5/19/1947 19.2 13.77 -28.3 356
5/19/1947 6/15/1948 13.77 17.06 23.9 393 6/14/1948 6/13/1949 16.97 13.55 -20.2 364
6/13/1949 8/2/1956 13.55 49.74 267.1 2607 8/1/1956 10/22/1957 49.42 38.98 -21.1 447
10/22/1957 12/12/1961 38.98 72.64 86.4 1512 12/11/1961 6/26/1962 72.39 52.32 -27.7 197
6/26/1962 2/9/1966 52.32 94.06 79.8 1324 2/8/1966 10/7/1966 93.55 73.2 -21.8 241
10/7/1966 11/29/1968 73.2 108.37 48.0 784 11/27/1968 5/26/1970 107.76 69.29 -35.7 545
5/26/1970 1/11/1973 69.29 120.24 73.5 961 1/10/1973 10/3/1974 119.43 62.28 -47.9 631
10/3/1974 11/28/1980 62.28 140.52 125.6 2248 11/26/1980 8/12/1982 140.17 102.42 -26.9 624
8/12/1982 8/25/1987 102.42 336.77 228.8 1839 8/24/1987 12/4/1987 333.33 223.92 -32.8 102
12/4/1987 3/24/2000 223.92 1527.46 582.1 4494 3/23/2000 7/23/2002 1527.35 797.7 -47.8 852
7/23/2002 10/9/2007 797.7 1565.15 96.2 1904 10/8/2007 3/9/2009 1552.58 676.53 -56.4 518
3/9/2009 3/9/2016 676.53 1989.26 194.0 2488
Average 139.9 1501 Average -32.8 542
Calendar
DaysStart Date End Date
Calendar
DaysStart Date End Date


Legal Services
Memorandum
DATE: March 21, 2016
TO: Policy Committee and Board of Trustees
FROM: Rebecca M. Smith, Assistant General Counsel
COPY: Brian Guthrie, Executive Director Ken Welch, Deputy Director Carolina de Onís, General Counsel
RE: Proposed Amendments to Chapter 31, relating to Employment After Retirement
REQUESTED ACTION
Proposed amendments to §31.1, relating to Definitions, were recommended by staff and submitted for publication for public comment by the Executive Director as provided in Section 5.7 of the Bylaws of the Board of Trustees of the Teacher Retirement System of Texas. The proposed amendments will have been published for public comment in the Texas Register for at least 30 days before the committee and board consider their adoption. Specifically, staff proposed amendments to §31.1(b), relating to Definitions, which were published in the Texas Register at 41 TexReg 1662.
To date TRS has not received any written comments regarding the proposed amendments. Any written comments that TRS receives after the date of this memorandum will be addressed in a separate document that will be available for your review at the April meeting.
Staff requests that the Policy Committee consider recommending adoption of the proposed amendments to the Board of Trustees.
BACKGROUND OF THE REQUESTED ACTION
The proposed changes to §31.1 regard the definitions of certain terms applicable to the rules in Chapter 31 regarding employment after retirement, including school year, substitute, and third-party entity. Staff proposes amending to §31.1(b) regarding the definition of a substitute. The current definition requires that in order to be considered a substitute the retiree must be serving in the place of a current employee. The proposed changes include work in a vacant position in the definition of substitute, provided the retiree does not serve more than 20 days in a vacant position or positions.
TRS staff members have observed that retirees often exceed the limits on employment after retirement because they inadvertently combine substitute work in a vacant position with other substitute work. Under the current definition, work in a vacant position is not substitute work. When combining work as a

Page 2 of 3
substitute and other work in the same calendar month, a retiree who retired after January 1, 2011 is limited to working no more than one-half the number of work days in that calendar month. A retiree forfeits the annuity payable for the calendar month in which work exceeds the allowable amount.
The unintentional combination of work usually occurs when a retiree "substitutes" in a position that (1) the retiree does not know is vacant, or (2) the position becomes vacant due to the death of the current employee or a decision by the current employee not to return to work after the retiree begins serving in the position. The retiree serving in the now-vacant position may have already substituted for more than one-half the days in that month before learning that the position is vacant. Surcharges are also owed by the employer when the work exceeds one-half time.
In order to provide relief in these and similar circumstances, staff proposes to provide a 20-day cap on working in a position that is vacant. The 20-day limit will allow ample time for a retiree to discover that the position is vacant and/or for the employer to make other arrangements for the assignment without jeopardizing the retiree's annuity. Limiting the number of days the retiree may serve in a vacant position is also in keeping with the concept of a substitute being a person who serves on a "temporary basis."
To reduce the opportunity for “bending the rules” to benefit a particular retiree, the proposed amendments clarify that a retiree will not be considered a substitute while serving in a vacant position that was last held by that retiree.
RECOMMENDATION
Staff recommends adoption of the proposed rule amendments and requests the Policy Committee to recommend to the Board of Trustees that the proposed rule amendments be adopted as published in the Texas Register.

Page 3 of 3
Rules §31.1 Definitions
(a) School year--For purposes of employment after retirement, a twelve-month period beginning on September 1 and ending on August 31 of the calendar year.
(b) Substitute--For purposes of employment after retirement, a person who serves on a temporary basis in the place of a current employee(s). A substitute may be paid no more than the daily rate of pay set by the employer. Effective September 1, 2016, a substitute includes a retiree who serves in a vacant position for no more than 20 days. A retiree may serve as a substitute in more than one vacant position each school year provided the retiree serves no more than 20 days in each vacant position. In no event may a retiree be considered a substitute while serving in a vacant position that was last held by that retiree. Service as a substitute that does not meet this definition is not eligible substitute service for purposes of an exception to forfeiture of annuity payments under §31.13 of this title chapter (relating to Substitute Service).
(c) Third party entity--For purposes of employment after retirement, an entity retained by a Texas public educational institution to provide personnel to the institution who perform duties or provide services that employees of that institution would otherwise perform or provide.


FINANCIAL DIVISION
Memorandum
DATE: March 23, 2016
TO: TRS Policy Committee and Board of Trustees
FROM: Don Green, Chief Financial Officer, and Carolina de Onís, General Counsel
COPY: Brian Guthrie, Executive Director and Ken Welch, Deputy Director
RE: Proposed Updates to Voucher Authority Resolution
ACTION REQUESTED
Staff asks the Policy Committee to:
Conduct the comprehensive review of the Resolution Designating Persons Authorized To Sign TRS Vouchers (Voucher Authority Resolution or Resolution), which is slated for review under the Policy Review Schedule at the Committee's April 2016 meeting; and
Recommend that the Board adopt proposed changes to the Voucher Authority Resolution to update the name of the incumbent serving in one of the authorized positions.
BACKGROUND AND DISCUSSION
The Voucher Authority Resolution is filed with State Comptroller of Public Comptroller and designates TRS employees authorized to sign vouchers for payment from TRS funds. The Resolution is required by statute (Tex. Gov't Code § 825.104). Staff finds that the form of the Voucher Authority Resolution continues to comply with the statute and to serve the purpose for which it was adopted. Staff proposes limited changes to the Resolution to reflect the employment of Lauren Burroughs as the new Team Leader of Investment Accounting, one of the authorized positions. Accordingly, the Committee is asked to recommend that the Board adopt the changes to the Resolution proposed by staff.
RESOLUTION DESIGNATING PERSONS AUTHORIZED TO SIGN TRS VOUCHERS
April 7, 2016May 1, 2015
WHEREAS, In accordance with section 825.104 of the Texas Government Code, the Board of Trustees (the "Board") of the Teacher Retirement System of Texas ("TRS") has previously granted authority to certain persons to approve and sign vouchers for payment from accounts of TRS; and WHEREAS, The Board desires to re-designate those persons to whom this authority has been granted and to update the name of the incumbent serving as Team Leader of Investment Accountingcertain position titles; now, therefore, be it RESOLVED, That the Board designates the following persons to approve and sign vouchers for payment from accounts of TRS from and after April 7, 2016May 1, 2015, and until the designated person separates from employment with TRS, is no longer employed in any capacity for which authority is granted under this resolution, or is not re-designated by the Board, whichever occurs first:
Brian K. Guthrie Executive Director Ken Welch Deputy Director Don Green Chief Financial Officer Jamie Pierce Director of General Accounting & Budget Scot Leith Director of Investment Accounting Janie Duarte Assistant Director of General Accounting & Budget Cindy Haley Manager of Financial Reporting Arlene Caballero Manager of Employee Payroll & Benefits Lauren BurroughsVicki Garcia Team Leader of Investment Accounting
ATTESTED: Signed:___________________________________________ Date: April 7, 2016May 1,
2015 R. David Kelly, Board Chair
Signed:___________________________________________ Date: April 7, 2016May 1, 2015
Brian K. Guthrie, Executive Director


MEMORANDUM To: TRS Board of Trustees From: Katrina Daniel, Chief Health Care Officer Date: April 7, 2016 Re: Contract Renewal with Gabriel, Roeder, Smith and Company Health Care Consulting and Actuarial Services ____________________________________________________________________________________ In June 2008, the Board of Trustees (the “Board”) authorized a six-year contract, from September 1, 2008 through August 31, 2014, with Gabriel, Roeder, Smith and Company (“GRS”) for the provision of health care consulting and actuarial services. In July 2013, the Board approved a two-year extension of this contract, from September 1, 2014 through August 31, 2016. During the above noted eight-year period, GRS has provided a high level of professional services and assistance to TRS with regard to the administration of both the TRS-Care and TRS-ActiveCare health benefit programs, while accumulating extensive experience and knowledge of program operations. Staff seeks authorization for a one-year extension of the current GRS contract for health care consulting and actuarial services, from September 1, 2016 through August 31, 2017. Under the TRS Board Procurement Policy, the Board may authorize renewals or extensions of contracts that are nearing their scheduled expiration dates, without requiring a new acquisition process, if the Board first determines that the renewal or extension continues to provide the best overall value to TRS and serves TRS’ best interests. Staff believes that a one-year extension of the current GRS contract for health care consulting and actuarial services is necessary to provide timely analysis during the next few months as we work with the legislative Joint Committee on TRS Health Benefit Plans, in addition to maintaining routine plan administration support. An extension of one year allows:
• Continued, uninterrupted access to the GRS services and expertise needed to complete the procurement processes for a new Health Plan Administrator for the TRS-Care traditional medical plans and a new carrier for the Medicare Advantage plans offered under TRS-Care;
• Continued, uninterrupted access to the GRS services and expertise needed to quickly respond to the information needs of the Joint Interim Committee established by the Texas Legislature under S.B. 1940, which begins hearings on TRS-Care and TRS-ActiveCare in late March 2016;
• Continued, uninterrupted access to the GRS services and expertise needed to effectively respond, with consistent information provided during recent legislative sessions, to the needs and requests of the Texas Legislature during the critical, upcoming 2017 legislative session;
• Continued access to the claim data warehouse (Cognos) maintained by Mike Madalena, a GRS subcontractor, which in turn allows TRS valuable time to study the feasibility of bringing claim data in-house;
• TRS time to develop internal expertise on data analytics; and • TRS to seek external expertise to assist TRS with writing a new RFP to provide health care
consulting and actuarial services to the TRS-Care and TRS-ActiveCare programs.

If the Board grants authorization for a one-year extension, in late 2016, staff plans to issue a new RFP for the procurement of the health care consulting and actuarial services needed to administer the TRS-Care and TRS-ActiveCare health benefit programs. Staff is eager to respond to any questions or requests concerning this matter. Thank you for your consideration of this authorization request.
2


TEAM ProgramIndependent Program AssessmentBoard Presentation
April 2016

Objectives
Independent Program Assessment (IPA) Provide independent reporting and oversight to the TRS Board and Executive Director, or designee, regarding critical risks related to the TRS Enterprise Application Modernization (TEAM) Program to enable informed decision making
Critical Risks Focus:– Failure to meet TEAM program objectives– Lack of user acceptance– Program substantially delayed– Program substantially over budget
2

TEAM Program - Strengths
1. Phase 1A defect resolution progressed faster than expected allowing for certification cutover :
• HPs commitment to speedily resolve all of the very high number of outstanding severity 2 (“Major without workaround”) defects prior to cutover
• Excellent coordination between TRS Core Program Team (CPT), Quality Assurance Team, Subject Matter Experts (SMEs) and HP business analysts and development staff - triage process
2. Reporting Entity training resources and sessions:• Well organized plan for classroom training sessions for key Reporting Entity
representatives • Scheduled sessions are published on the new Reporting Entity Portal Training enrollment
web page • High quality training materials and 15 professional videos also published and accessible to
Reporting Entities
3
IPA Overall Scorecard
4
TEAM Program Governance Prior Score Current Score Observations
1. Program/Project Management 4 4 4,5, 16, 21, 24, 28
2. Risk Management 2 2 23
3. Issues Management and Tracking 2 2 19
4. Program Communication 1 1
5. Change Management/ Quality Control 3 3 18 ,22
6. Staffing and Organization 3 3 4, 13 – 15, 20
7. Budget Tracking 2 2 Cost overrun
TEAM Projects1. Line of Business Implementation 4 4 13 18, 21-27, 29-30
2. Financial System Implementation On Hold On Hold 9
3. Data Management 2 2 16
4. Reporting Entity Outreach 1 1 23,24
5. Organizational Change Management 1 1 24
6. Business Procedures and Training 2 2 20 , 23, 24
7. Decommissioning Legacy Systems 1 1 24
8. External Website Enhancement 1 1
Legend
1= LOW
2= GUARDED
3= CAUTION
4= ELEVATED
5= SEVERE
N/A= Project not started, rating is not applicable at this time

Execution Risk Areas
1. Tracking to the baseline project plan
2. Managing scope & cost
3. Code quality and defect tracking
4. Development and testing
5. Data conversion and validation, user training and documentation, cutover and contingency planning
5

Key Risks – for Phase 1
• High level of defects found and over 500 data validations for Phase 1A may cause difficulty in processing reporting entity files successfully
• Reporting entities may not be ready to send files
• Significant number of outstanding requirements change requests (Requirement Update Log – RULs and Bundling Reopened Approved Deliverables - BRADs) in Phase 1B
– changes to system functionality after already designed, TRS approved and developed increases rework resulting in further delays, increased cost and resources impact
6

Key Risks – for Phase 1
• Resource contention with other TEAM projects (WEB, FSR) may cause delays
• Phase 1B is significantly larger than Phase 1A with several external and internal interfaces and new workflow engine
• Integration of multiple technologies may cause unexpected difficulties (CRM-MS Dynamics, HP Extream, Corticon Rules Engine)
• Phase 1B will impact the daily work for a significant number of internal TRS resources
• All risks above may result in potential inadequate system performance
7
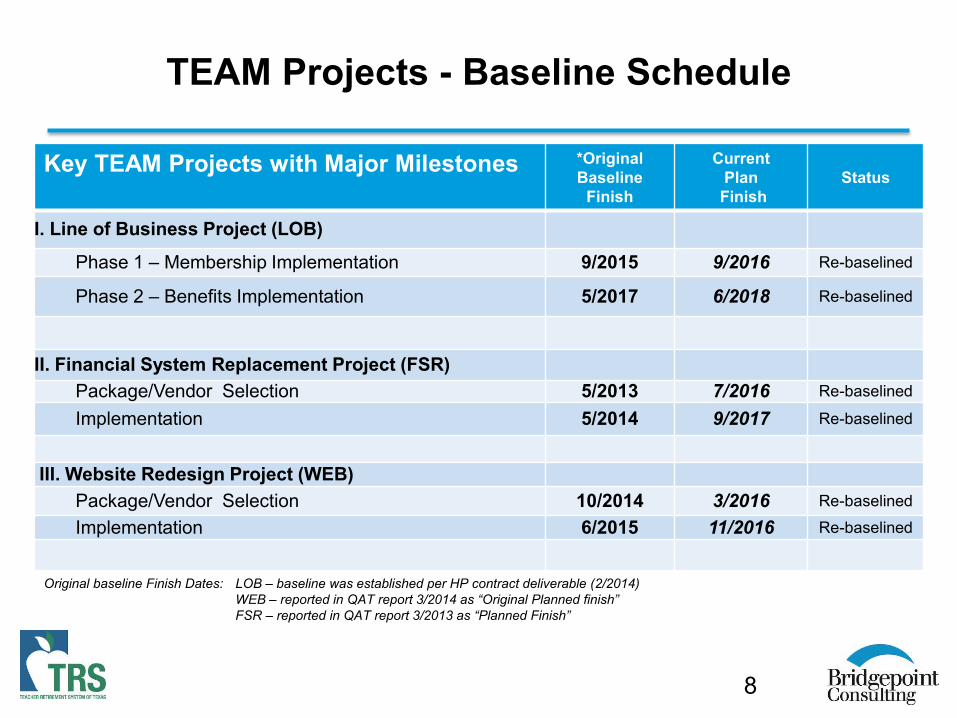
Key TEAM Projects with Major Milestones *Original Baseline
Finish
CurrentPlanFinish
Status
I. Line of Business Project (LOB)
Phase 1 – Membership Implementation 9/2015 9/2016 Re-baselined
Phase 2 – Benefits Implementation 5/2017 6/2018 Re-baselined
II. Financial System Replacement Project (FSR)Package/Vendor Selection 5/2013 7/2016 Re-baselined
Implementation 5/2014 9/2017 Re-baselined
III. Website Redesign Project (WEB)Package/Vendor Selection 10/2014 3/2016 Re-baselined
Implementation 6/2015 11/2016 Re-baselined
TEAM Projects - Baseline Schedule
8
Original baseline Finish Dates: LOB – baseline was established per HP contract deliverable (2/2014)WEB – reported in QAT report 3/2014 as “Original Planned finish” FSR – reported in QAT report 3/2013 as “Planned Finish”

LOB Project – Baseline Schedule Changes
• Baseline schedule set and approved
Feb 2014
• Rolling Wave #3 Revised Baseline due to Detail level Requirements
Sep 2014• Rolling Wave
#5 Revised Baseline due to Process Improvement Phase
Jun 2015
• Current Baseline revised due to requirements changes
Mar 2016
9
LOB implementation project baseline schedule was approved February 2014; baseline schedule changes increased LOB implementation duration from 41 months to 54 months (the LOB schedule dates drive most all other project schedules.)
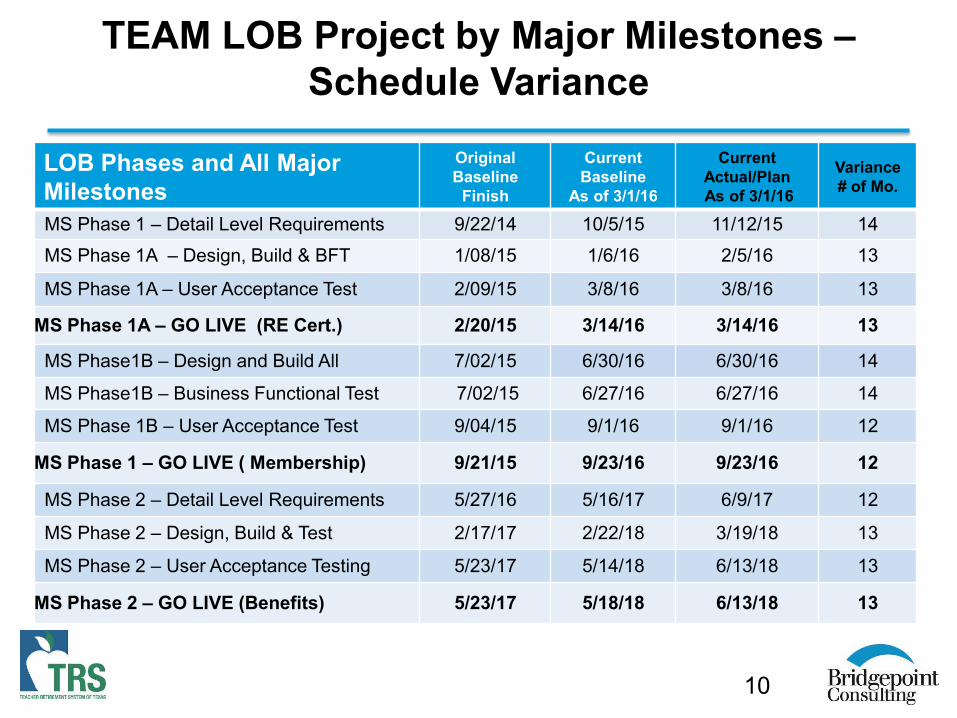
TEAM LOB Project by Major Milestones –Schedule Variance
10
LOB Phases and All MajorMilestones
OriginalBaseline
Finish
CurrentBaseline
As of 3/1/16
Current Actual/PlanAs of 3/1/16
Variance# of Mo.
MS Phase 1 – Detail Level Requirements 9/22/14 10/5/15 11/12/15 14
MS Phase 1A – Design, Build & BFT 1/08/15 1/6/16 2/5/16 13
MS Phase 1A – User Acceptance Test 2/09/15 3/8/16 3/8/16 13
MS Phase 1A – GO LIVE (RE Cert.) 2/20/15 3/14/16 3/14/16 13
MS Phase1B – Design and Build All 7/02/15 6/30/16 6/30/16 14
MS Phase1B – Business Functional Test 7/02/15 6/27/16 6/27/16 14
MS Phase 1B – User Acceptance Test 9/04/15 9/1/16 9/1/16 12
MS Phase 1 – GO LIVE ( Membership) 9/21/15 9/23/16 9/23/16 12
MS Phase 2 – Detail Level Requirements 5/27/16 5/16/17 6/9/17 12
MS Phase 2 – Design, Build & Test 2/17/17 2/22/18 3/19/18 13
MS Phase 2 – User Acceptance Testing 5/23/17 5/14/18 6/13/18 13
MS Phase 2 – GO LIVE (Benefits) 5/23/17 5/18/18 6/13/18 13

TEAM Scope Baseline Changes
LOB Changes Executed to Date:Changes with cost impact:
7 change orders executed with a cost impact to TRS (total of $4.1M)
Changes without cost impact:Hundreds of changes were executed by HP and TRS with no
additional cost impact to TRS
Potential Future LOB Changes: 175 Open RULs – Requirement Update Log (RUL) items identified by
TRS and HP These items are being prioritized and addressed to determine their
criticality
11

TEAM Cost Variance
12
Jan 2014 Lifetime Budget
Feb 2016Lifetime Budget
$ VarianceActual
Expended To Date
% Expended
TEAM $97M $110M $13M $50M 45%
Project Est. % CompleteLOB 52%FSR 12%WEB 35%
Total percent completion as reported by TEAM project management:

Activities Completed – Current Period
1. Attended TEAM Core Management Team weekly status meetings and other relevant project meetings
2. Reviewed and evaluated current project schedules and progress against schedule
3. Reviewed samples of approved deliverables and TRS acceptance documentation
4. Reviewed updated requirements traceability reports from Application Lifecycle Management (ALM) to compare systems functions to TRS business needs
5. Reviewed and analyzed Line of Business - testing defect status reports and defect tracking reports
6. Reviewed User Acceptance Testing execution results and defect tracking and resolution process.
7. Prepared TEAM IPA Status reports and reviewed risks identified with project management.
13

Activities for Next Period
1. Continue to attend and observe weekly Executive Steering Committee and Core Management Team meetings
2. Continue to evaluate updated TEAM Line of Business project schedule and all other dependent TEAM projects
3. When available, review the updated test plans for phase 1B, such as: system performance, system integration and interfaces testing, quality and system security test plans
4. Review updated Line of Business Phase1B Quality Gate criteria documentation for User Acceptance Testing entry and preliminary cutover plan.
5. Draft TEAM IPA Board report and present observations to Core Management Team (CMT) and Executive Steering Committee (ESC).
6. Continue to monitor TRS risk mitigation activities related to execution risks
14

IPA Budget Status
IPA Financial summary status through February 29, 2016
Total hours incurred 4,404
Total calculated cost incurred $773,790
Total billings for deliverables $735,000
Variance $38,790
15


Teacher Retirement System of Texas
TEAM Program Management UpdateDavid Cook, Sunitha Downing, Adam Fambrough, Howard Goldman, Rachael Hill, Jay Masci (Provaliant)
April 7, 2016

TEAM Program
2
TEAM Program Progress and Milestones TEAM Program Budget Line of Business (LOB) Project User Acceptance Testing Website Redesign First Look
Update Items

TEAM Program
3
TEAM Program Progress and MilestonesJay Masci (Provaliant)

TEAM Program
4
TEAM Progress as of February 3, 2016
PHASE 2PHASE 1
FY2016FY2015FY2014 FY2017 STATUSFY2018
RE Outreach
Website Redesign
Pension Line Of Business
Data Management
Quality Assurance (Testing)
Organizational Change Management
Decommission Legacy
Bus. Procedures & Training
FSR

TEAM Program
5
TEAM Progress as of March 22, 2016
PHASE 2PHASE 1
FY2016FY2015FY2014 FY2017 STATUSFY2018
RE Outreach
Website Redesign
Pension Line Of Business
Data Management
Quality Assurance (Testing)
Organizational Change Management
Decommission Legacy
Bus. Procedures & Training
FSR

TEAM Program
7
Pension Line of Business (LOB) Status Trend
11/2014 01/2015 03/2015 05/2015 11/201509/2015
= Future trend see the severity level (status) increasing
= Future trend see the severity level (status) decreasing
= Future trend see the severity level (status) remaining constant
02/2016 03/2016

TEAM Program
8
Previous Milestones
Previous Milestones(fiscal quarter: Mar - May)
Previous Planned Date
Current Planned Date
Status
QAP - Phase 1A – UAT All increments 02/29/16 03/09/16 Completed -Late
WEB – Assessment and Design Phase 02/29/16 03/18/16 Behind Schedule
DLS – Development Activities 03/08/16 03/28/16 Behind Schedule
QAP - Phase 1B – UAT Test Scenarios 04/15/16 Ahead of Schedule
DLS – Decommissioning Legacy System ProjectQAP – Quality Assurance ProjectWEB – Website Redesign Project

TEAM Program
9
Upcoming Milestones
Upcoming Milestones(fiscal quarter: Jun - Aug)
Previous Planned Date
Current Planned Date
Status
LOB - Phase 1B – Design and Build 06/30/16 On Schedule
DLS – Quality Assurance Activities 07/08/16 On Schedule
FSR – Procurement (Services & Software) 07/15/16 On Schedule
LOB – Line of Business ProjectDLS – Decommissioning Legacy System ProjectFSR – Financial System Replacement Project

TEAM Program
10
TEAM Program BudgetDavid Cook

TEAM Program
11
-
5.00
10.00
15.00
20.00
25.00
30.00
35.00
40.00
45.00
2014Q1
Q2 Q3 Q4 2015Q1
Q2 Q3 Q4 2016Q1
Q2 Q3 Q4 2017Q1
Q2 Q3 Q4 2018Q1
Q2 Q3 Q4 ProjectEnd
MIL
LIO
NS
FISCAL QUARTERS
LOB ProjectActual vs Projected Cumulative Expenditures*
LOB Projected Cumulative Expenditures LOB Actual Cumulative Expenditures
* Includes $7.2 million contingency

TEAM Program
12
-
20.00
40.00
60.00
80.00
100.00
120.00
2014Q1
Q2 Q3 Q4 2015Q1
Q2 Q3 Q4 2016Q1
Q2 Q3 Q4 2017Q1
Q2 Q3 Q4 2018Q1
Q2 Q3 Q4 ProjectEnd
MIL
LIO
NS
FISCAL QUARTERS
TEAM Program Total Cumulative ExpendituresCurrent Expected vs. Actual. vs Original Forecast*
Current Expected Expenditures Actual Expenditues Original Forecasted Expenditures
* Calculated figures as of 9/2012 by subtracting estimated personnel costs fromestimated total project costs
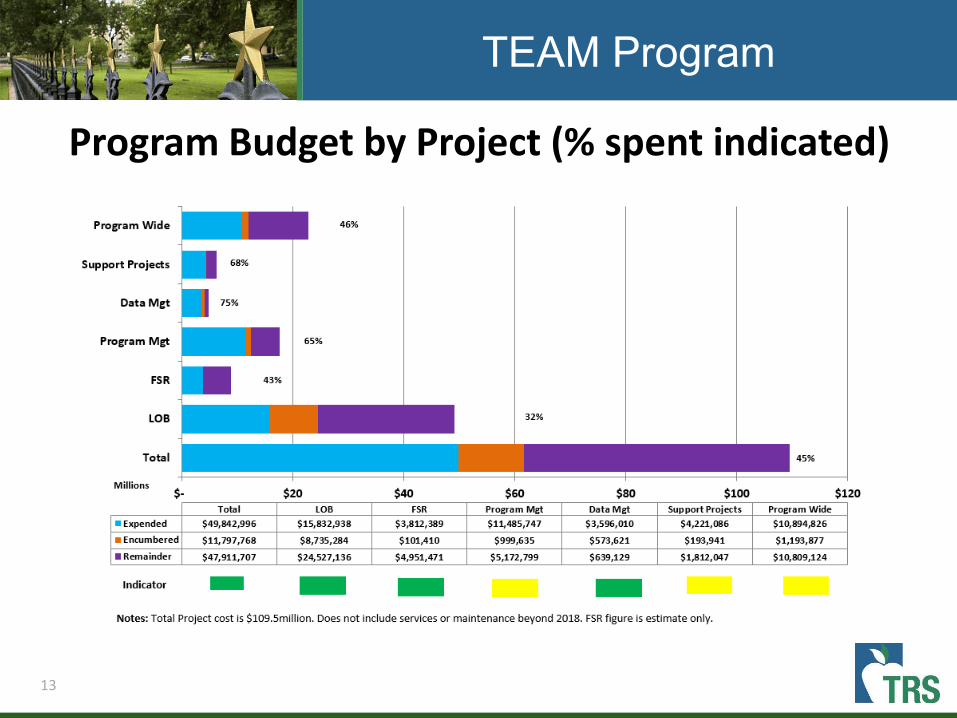
TEAM Program
13
Program Budget by Project (% spent indicated)

14
Line of Business Contract Earned Value Report
TEAM Program
$0
$5,000,000
$10,000,000
$15,000,000
$20,000,000
$25,000,000
$30,000,000
$35,000,000
$40,000,000
Q2 Q3 Q4 Q1 Q2 Q3 Q4 Q1 Q2 Q3 Q4 Q1 Q2 Q3 Q4 Q1 Q2 Q3 Q4 Q1 Q2
FY 2014 FY 2015 FY 2016 FY 2017 FY 2018 FY 2019
Planned Value (PV)
Earned Value (EV)
Actual Cost (AC)Contract reserve and optional hardware & software costs are not included, so the total contract cost used is currently $37,382,227.

TEAM Program
15
Line of Business (LOB) Project UpdateData Migration and Quality UpdateReporting Entity Training UpdateTRUST Demonstration
Adam Fambrough

TEAM Program
16
Line of Business (LOB) Project Update• User Acceptance Testing Phase 1A Complete• Phase 1A RE Portal Certification Environment Live
• Deployed on 3/14/16• Phase 1B Testing is progressing
Data Migration and Quality• Data Assessment Project Completed Early• Contract with Allied/ICON Ended Early• Conditioning of our data is progressing well

TEAM Program
17
Reporting Entity Training Update
Changes to flow of training based on user feedback
Generally positive feedback on Reporting Entity Portal
Concerns raised related to new data being requested
• Data is needed for GASB requirements and ensuring all eligible members are being reported to TRS
Inclement weather impacted some sessions
• Low attendance due to weather
• May need to schedule additional sessions
TEAM Program
18
TRUST Demonstration

TEAM Program
19
TEAM User Acceptance TestingSunitha Downing and Rachael Hill

Purpose and Scope of User Acceptance Testing
Business Process
ReportingEntity submits reports
Test Scenario & Test Condition
Scenario: Reporting Entity submits a ED20 report
Condition: Higher Education Reporting Entity submits initial demographic information for new employees
Test Case
Reporting Entity submits an electronic file with 5 new employees and includes the following for each:
EIN, First Name, Last Name, DOB, Gender
Test Scripts
Detail the step-by-step instructions and pre-existing data conditions so TRS testers can execute
TEAM Program
20

TEAM Program
21
Phase 1 User Acceptance Testing – Step 1

TEAM Program
22
Phase 1 User Acceptance Testing – Step 2
Testware Development
• Test Scenarios
• Test Cases
• Test Scripts

23
Testware – Example of a Test Script
TEAM Program
Master Test Script
Screen Step Action Control Label Field/Control Information/Data/Selection
Expected Result
TRS 6 scanned and indexed; CRM creates workflow case and routes activity to queueLog into CRM as Refund ProcessorSelect work item from queue and launch TRUST use case
View Demographic Information - Person Detail
1 Click Address Left-hand Navigation N/A View Address Details page displays
View Demographic Information - Address Detail
2 Click Phone Left-hand Navigation N/A View Phone Details page displays
View Demographic Information - Phone Detail
3 Click Email Left-hand Navigation N/A View Email Details page displays
Review Employment Information
View Employment Information
4 Click Employment Information Left-hand Navigation N/A View Employment Informaton - Employment Detail page displays
View Employment Information - Employment Detail
5 Click Position Left-hand Navigation N/A View Employment Information - Position Detail page displays
Refund History Screen 6 Click Add Account Refund Hyperlink Refund Detail Screen displaysRefund Detail Screen 7 Click Next Day Processing Check Box Next Day Processing check box is checked
8 Click Refund Status Drop Down Selected refund status displays in drop down9 Select Refund Type Drop Down Selected refund type displays in drop down
10 Type Application Received Date Text Box Entered date displays11 Type Application Entry Date Text Box Entered date displays12 Select Payee Drop Down Member Selected Payee displays
Select Refund - Application (Member)
Review Demographic Information

24
Testware – Example of a Run Plan
Day SME/CPT
Melody
Linda
Ashley
Jason
CPT - Hitesh
CPT - Liz
CPT - Ryan
Melody
Linda
Ashley
Jason
Arlene Caballero
CPT - Hitesh
CPT - Liz
CPT - Ryan
Ashley
Jason
CPT - Hitesh
CPT - Liz
CPT - Ryan
CPT - Michael
Ashley
Jason
BREAK
BREAK
BREAK
BREAK1
2
4
3 77
7
8
ED
RP
ER
10
30 Mins batches -SD70, SD71
Nightly batches -SD20, SD21
1 2 3
9
6
43 44 45 46
17
1234
13
35
15
37
39
18
60
1941
21
22 23
59
4
5
20
68 & 69
70
65
71 & 73
66
25 26
27 28
30
40 42
64
1133
1436
16
38
Combination
72 & 75
7629
6261 63
24
TEAM Program
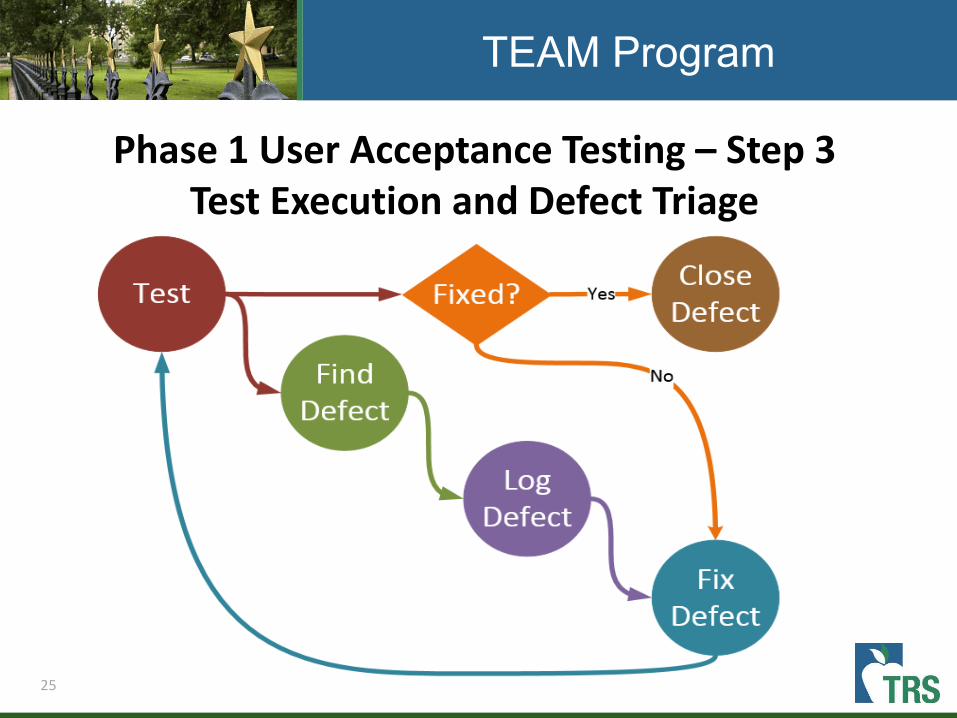
25
Phase 1 User Acceptance Testing – Step 3Test Execution and Defect Triage
TEAM Program

TEAM Program
1A User Acceptance Testing Timeline
26
2015
2016
Sep-15 Oct-15 Nov-15 Dec-15 Jan-16 Feb-16 Mar-16
11/16/2015 - 1/15/2016
Pre-UAT RE Certification
8/17/2015 - 11/13/2015
Planning3/14/2016
RE Cert Deployment
1/18/2016 - 3/9/2016
Test Execution & Defect Triage
11/16/15 - 12/18/15
Testware Development

TEAM Program
1B User Acceptance Testing Timeline
28
2015
2016
Nov-15 Dec-15 Jan-16 Feb-16 Mar-16 Apr-16 May-16 Jun-16 Jul-16 Aug-16 Sep-16
1/4/2016 - 6/28/2016
BFT and UBT
11/2/2015 - 12/31/2015
Planning
9/23/2016
GoLive PROD Phase 1 LOB
1/4/16 - 4/15/16
Testware Development
6/30/16 - 9/1/16
Test Execution & Defect Triage

• 4 months of planning & testware development
• 4 weeks UAT execution
• 2 Functional Areas
• 67 Scenarios
• 8 SMEs
29
TEAM Program
• 8 months of planning & testware development
• 9 weeks UAT execution
• 16 Functional Areas
• 100 Scenarios
• 64 SMEs
1A 1B
What is the difference between 1A and 1B UAT?

TEAM Program
30
2. Engage SMEs as soon as possible for 1B UAT
4. Have HP and CPT present throughout UAT execution
3. Execute UAT tests in BFT environments
5. Become familiar with the defect triage process
1. Designate empowered and engaged SMEs
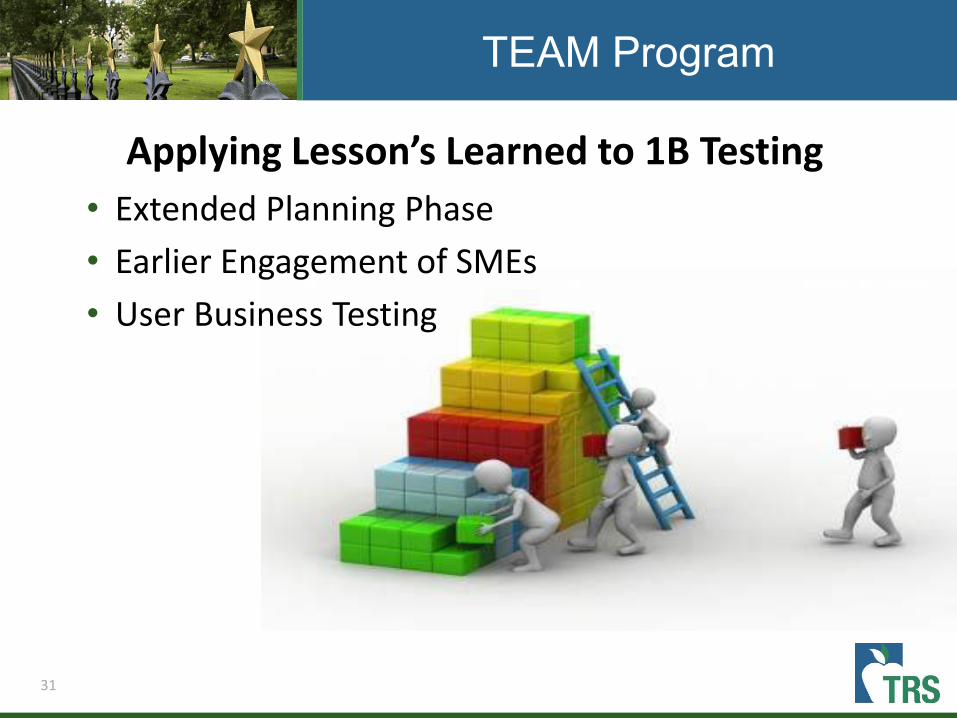
TEAM Program
31
• Extended Planning Phase
• Earlier Engagement of SMEs
• User Business Testing
Applying Lesson’s Learned to 1B Testing

TEAM Program
32
TEAM Website Redesign First LookHoward Goldman

TEAM Program
33
Website Redesign Project Implementation• Phase I complete
• Evaluation of current site and stakeholders’ needs• Design and proof of concept
• Phase II now beginning• Next steps: development of selected design,
preliminary migration• Final steps: training, testing, final migration• Launch: Fall 2016

TEAM Program
Before
After

TEAM Program
35
Home Page
Home (Desktop)

TEAM Program
36
Home Page - Tablet
Home (Desktop)

TEAM Program
37
Home Page – Mobile (Cropped)
Home (Desktop)
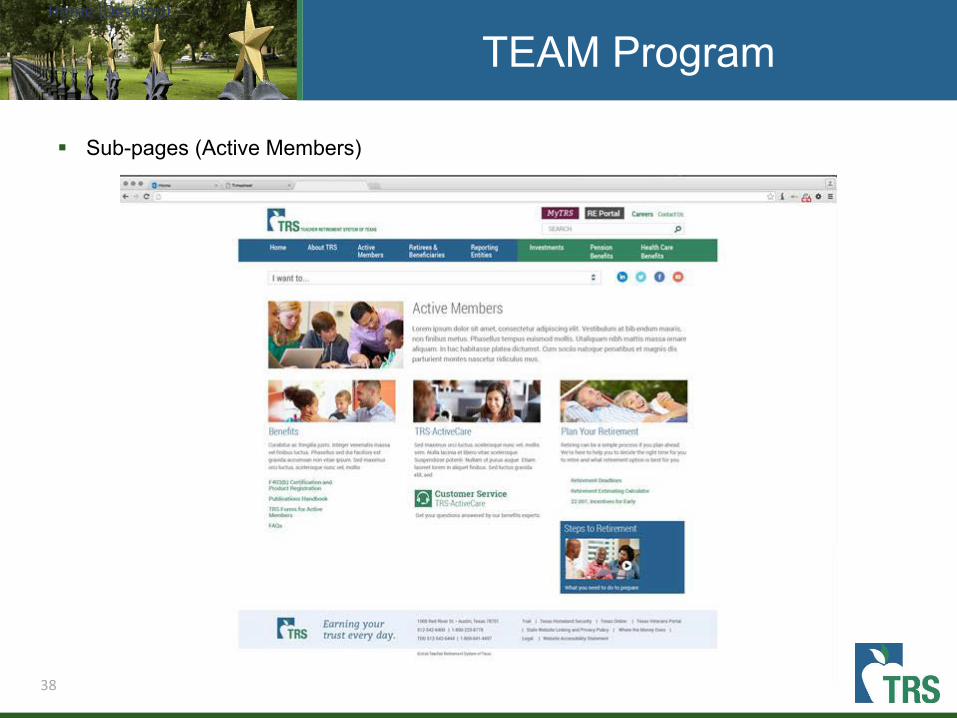
TEAM Program
38
Sub-pages (Active Members)
Home (Desktop)

39
TEAM Program
Sub-pages (Health Care Benefits)

40
TEAM Program
Sub-pages (Investments)

41
TEAM Program
Sub-pages (Investments – With left-side navigation)
TEAM Program
42

Teacher Retirement System of Texas
FY16 Mid-Year Operating Budget Review
Don Green, Chief Financial Officer
Board of Trustees MeetingApril 2016
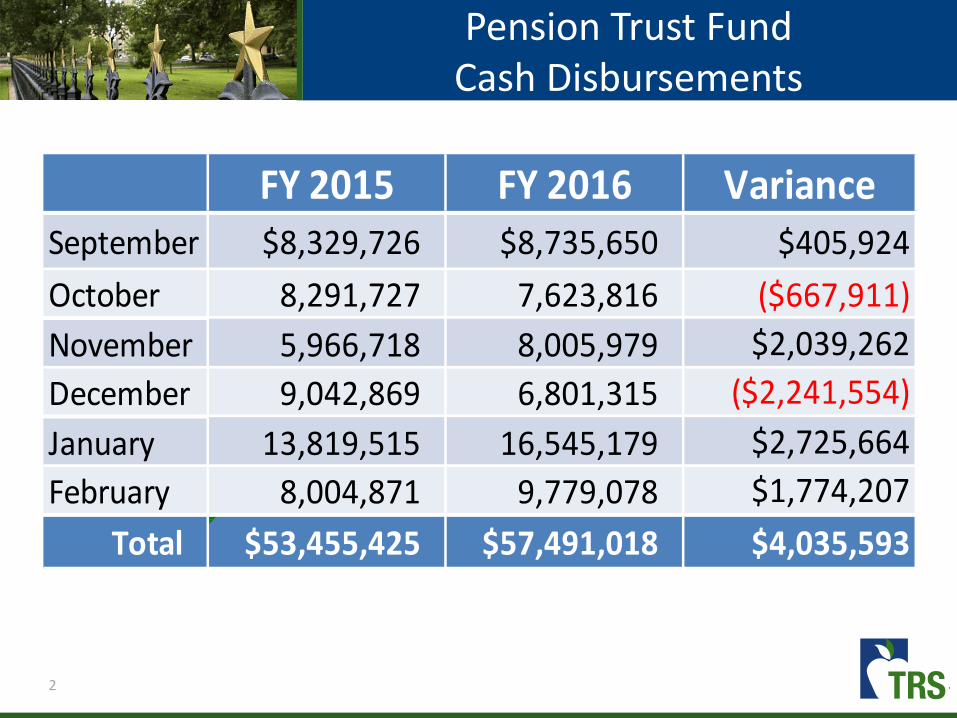
Pension Trust FundCash Disbursements
2
FY 2015 FY 2016 VarianceSeptember $8,329,726 $8,735,650 $405,924
October 8,291,727 7,623,816 ($667,911)
November 5,966,718 8,005,979 $2,039,262
December 9,042,869 6,801,315 ($2,241,554)
January 13,819,515 16,545,179 $2,725,664
February 8,004,871 9,779,078 $1,774,207
Total $53,455,425 $57,491,018 $4,035,593
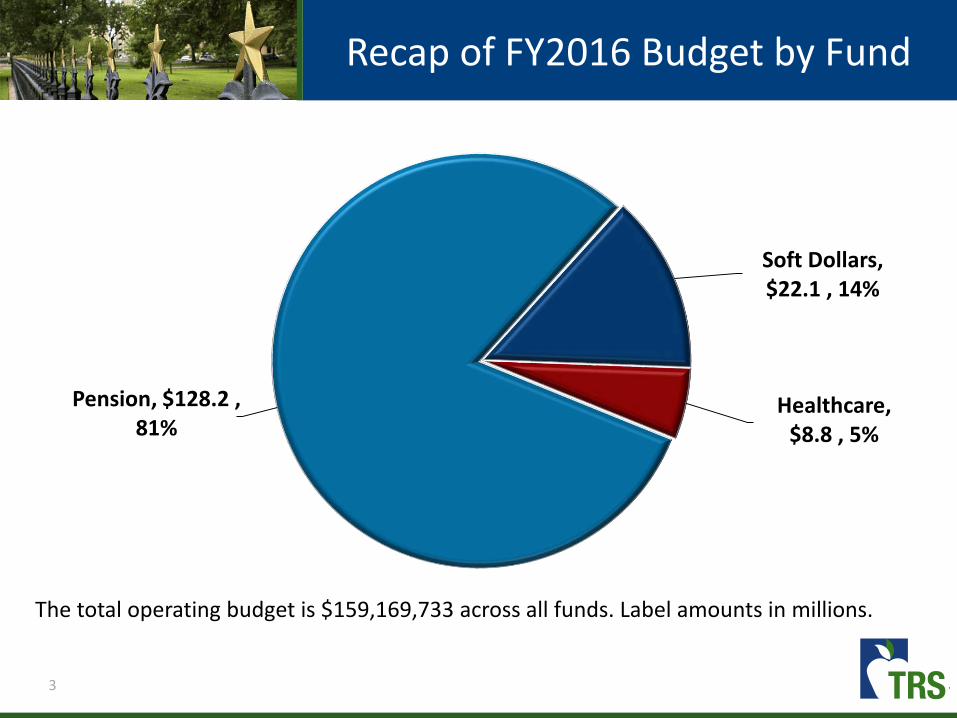
Recap of FY2016 Budget by Fund
3
Pension, $128.2 , 81%
Soft Dollars, $22.1 , 14%
Healthcare, $8.8 , 5%
The total operating budget is $159,169,733 across all funds. Label amounts in millions.

Recap of FY2016 Budget by Division
4
The Agency Support Division includes executive, human resources, communications, internal audit, strategic initiatives, risk management and legal. Label amounts in millions.
Agency Support, $18.4 ,, 12%
IMD, $63.0 , 40%
Benefits, $11.2 , 7%
Finance, $14.5 , 9%
Info Tech, $18.6 , 12%
TEAM, $24.6 , 15%
Healthcare, $8.8 , 5%

Recap of FY2016 Budget by Expense
5
Operating costs:SoftwareHardwarePostagePrintingEquipmentReference materials
Professional fees and services:ContractorsConsultantsContractual services
Support:RentBldg/equip maintUtilitiesSuppliesLabel amounts in millions.
Wages & Benefits, $84.0 ,
53%
Pro Fees/Svs, $26.9 , 17%
Support, $6.3 , 4%
Travel, $1.7 , 1%
Capital, $5.4 , 3%
Operating, $34.9 , 22%

Summary By Fund
6
Fund Budget Exp/Enc % Spent Projected
Pension 128,233,476 55,486,795 43% 107,783,818
Soft Dollars 22,137,462 9,070,178 41% 18,654,367
Care 5,325,902 2,469,445 46% 5,093,072
ActiveCare 3,387,496 1,210,801 36% 3,197,369
403(b) 85,397 17,868 21% 63,111
Totals 159,169,733 68,255,087 43% 134,791,737

Summary By Division
7
Division Budget Exp/Enc % Spent Projected
Agency Support* 18,353,077 7,658,407 42% 15,943,994
IMD 63,032,646 31,838,036 51% 56,050,977
Benefits 11,243,708 5,055,981 45% 11,273,485
Finance 14,532,916 5,336,182 37% 9,670,715
Info Tech 18,572,428 8,360,828 45% 16,778,559
TEAM 24,636,163 6,307,527 26% 16,720,442
Healthcare 8,798,795 3,698,126 42% 8,353,565
Totals 159,169,733 68,255,087 43% 134,791,737
*The Agency Support Division includes executive, human resources, communications, internal audit, strategic initiatives, risk management and legal.
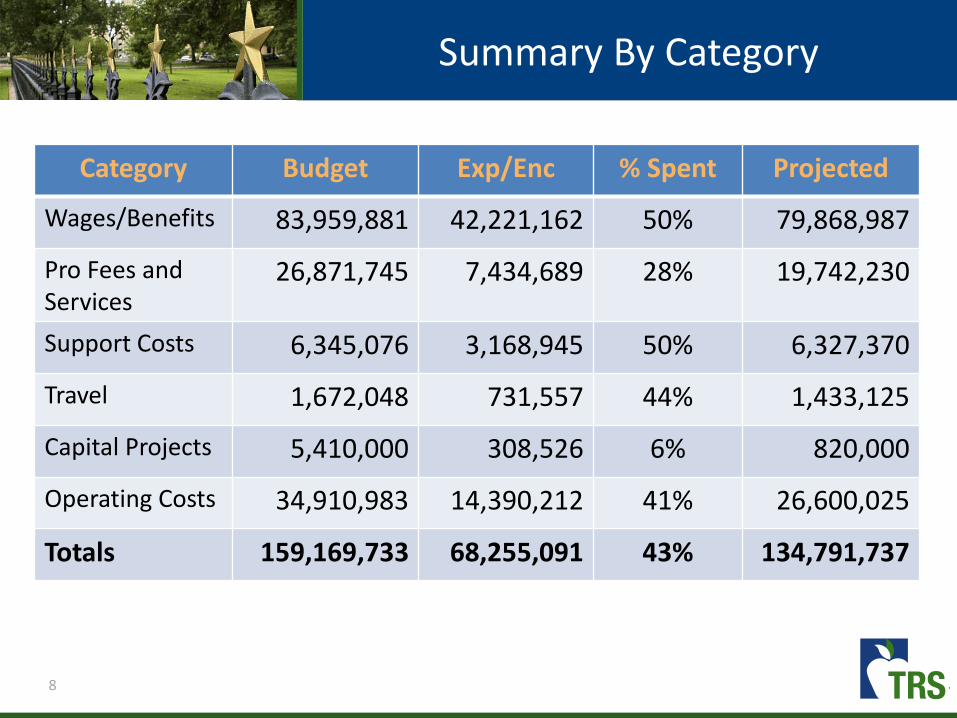
Summary By Category
8
Category Budget Exp/Enc % Spent Projected
Wages/Benefits 83,959,881 42,221,162 50% 79,868,987
Pro Fees and Services
26,871,745 7,434,689 28% 19,742,230
Support Costs 6,345,076 3,168,945 50% 6,327,370
Travel 1,672,048 731,557 44% 1,433,125
Capital Projects 5,410,000 308,526 6% 820,000
Operating Costs 34,910,983 14,390,212 41% 26,600,025
Totals 159,169,733 68,255,091 43% 134,791,737
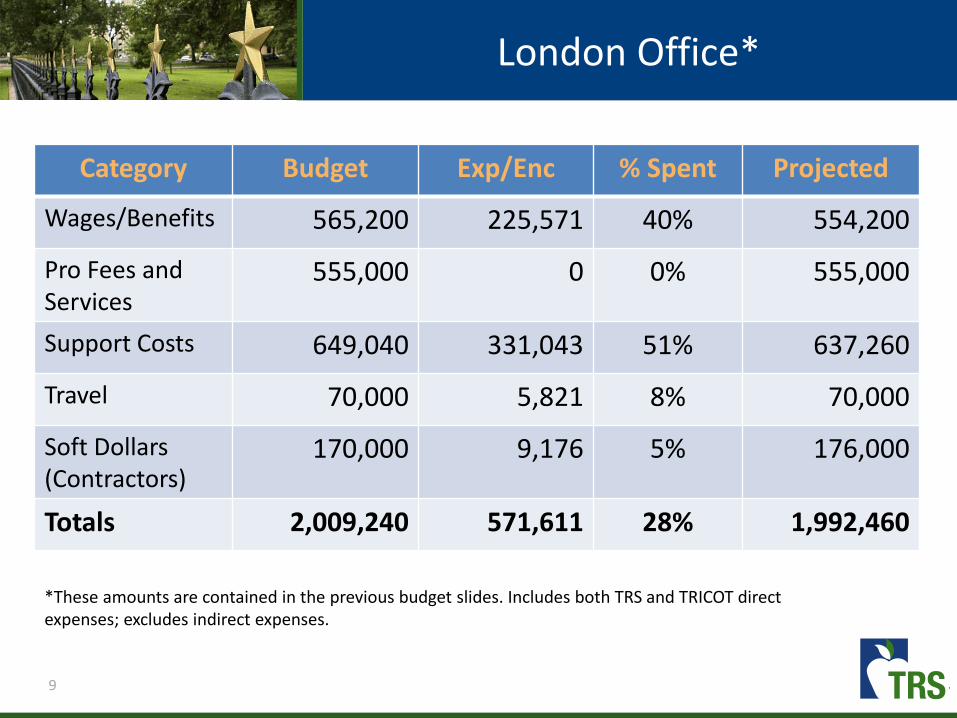
London Office*
9
Category Budget Exp/Enc % Spent Projected
Wages/Benefits 565,200 225,571 40% 554,200
Pro Fees and Services
555,000 0 0% 555,000
Support Costs 649,040 331,043 51% 637,260
Travel 70,000 5,821 8% 70,000
Soft Dollars (Contractors)
170,000 9,176 5% 176,000
Totals 2,009,240 571,611 28% 1,992,460
*These amounts are contained in the previous budget slides. Includes both TRS and TRICOT direct expenses; excludes indirect expenses.

Capital Budget (non TEAM)
10
Item Budget Exp/Enc % Spent Projected*
Investment Systems 370,000 148,879 40% 370,000
PC Upgrades 370,000 0 0% 0
Telecom Upgrades 450,000 159,647 35% 450,000
Mainframe Upgrades 420,000 0 0% 0
Bldg Renovations 500,000 0 0% 0
Data Center Generator 600,000 0 0% 0
Garage Fire Suppression 1,500,000 0 0% 0
Sump Pump System 1,200,000 0 0% 0
Totals 5,410,000 308,526 6% 820,000
* Unexpended balances will be transferred to fiscal year 2017.

Conclusions
11
Based on current projections, an estimated 15% ($24.3 million) of the budget will be unspent across all funds and departments.
Amount Item Comment
33% ($7.9 million) TEAM Carry-forward to FY 17
14% ($3.5 million) Soft Dollars Carry-forward balances
19% ($5 million) Capital Projects Carry-forward to FY 17
14% ($3.3 million) Incentive Compensation Lapse
6% ($1.6 million) Benefits Lapse
14% ($3 million) Salary & Operating Costs Lapse


Teacher Retirement System of Texas
Preparation for the FY18-19 Legislative Appropriations Process
Don Green, Chief Financial Officer
Board of Trustees MeetingApril 2016

Legislative Timeline
2
2016 Nov 8 2016
Nov 14 2016
Jan 10 2017
Mar 10 2017
May 29 2017
June 18 2017
Deadline to file bills
Pre-filing of legislation for 85th
session
Legislative Interim
Studies & Committee Hearings
General Election
85th Legislature convenes
Last day Governor can sign/veto bills
Last day of session
Senate Confirmation of New TRS Trustees The appointments process requires that the nomination of a person by the Governor be confirmed by the Texas Senate. The Senate Nominations Committee will decide during legislative session if testimony is required of the nominee and vote to place nominees before the full Senate for final confirmation.

Texas Budgeting Timeline
3
2016
Mar - April Strategic Planning Instructions to Agencies
Mar - May Negotiate Structure and Measure Changes
May Biennial Budget Request Instructions sent
June - July Agencies Submit Strategic Plans
July - August Agencies Submit Budget Requests (LARs)
August - Sept GOBPP/LBB Joint Budget Hearings
November LBB meets to adopt a spending limit
Sept - Dec LBB and GOBPP Budget Preparations
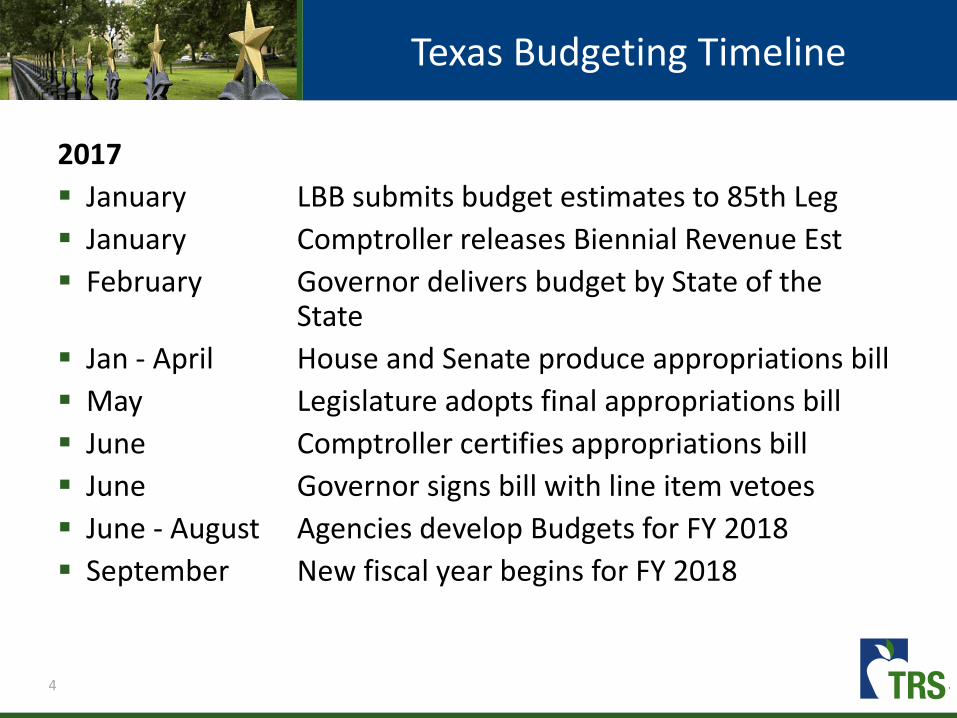
Texas Budgeting Timeline
4
2017
January LBB submits budget estimates to 85th Leg
January Comptroller releases Biennial Revenue Est
February Governor delivers budget by State of the State
Jan - April House and Senate produce appropriations bill
May Legislature adopts final appropriations bill
June Comptroller certifies appropriations bill
June Governor signs bill with line item vetoes
June - August Agencies develop Budgets for FY 2018
September New fiscal year begins for FY 2018
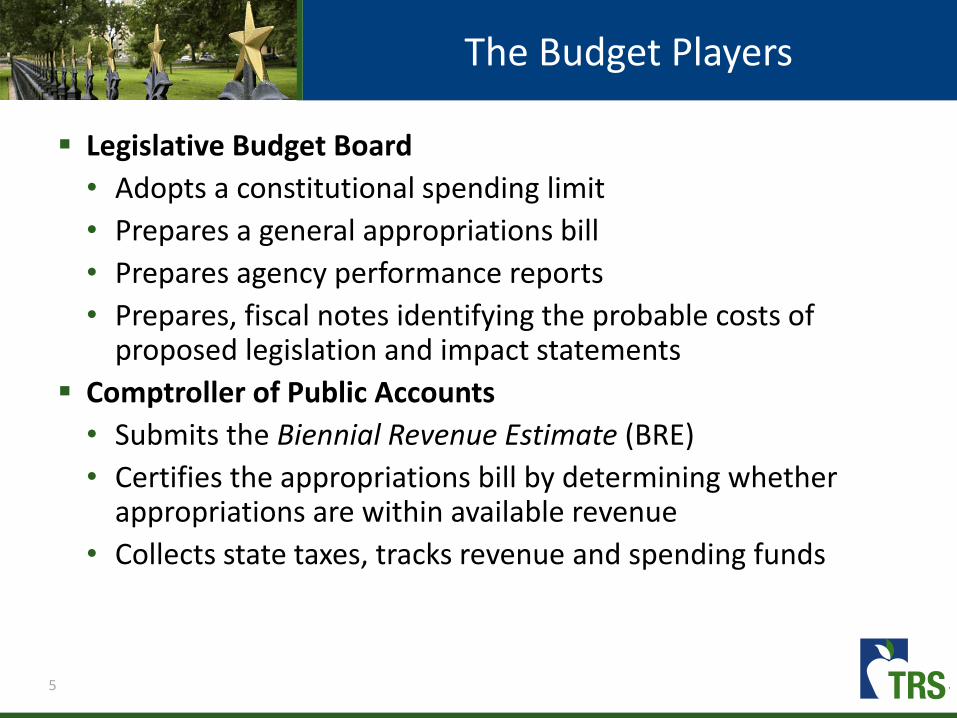
The Budget Players
5
Legislative Budget Board
• Adopts a constitutional spending limit
• Prepares a general appropriations bill
• Prepares agency performance reports
• Prepares, fiscal notes identifying the probable costs of proposed legislation and impact statements
Comptroller of Public Accounts
• Submits the Biennial Revenue Estimate (BRE)
• Certifies the appropriations bill by determining whether appropriations are within available revenue
• Collects state taxes, tracks revenue and spending funds

The Budget Players
6
Office of the Governor
• Involved in the budget process beginning with strategic planning and ending with budget execution
• Provides overall vision, mission, and philosophy, as well as statewide goals and benchmarks
• Has line-item veto power
State Auditor’s Office
• Serves as independent auditor of state agencies, including institutions of higher education
• Audits the accuracy of reported performance measures and assesses the related internal controls

Constitutional Spending Limits
7
Pay-As-You-Go Limit: Requires bills making appropriations be sent to the Comptroller of Public Accounts (CPA) for certification
Limitation on the Growth of Certain Appropriations: Limits the biennial growth of appropriations from state tax revenue not dedicated by the Constitution to the estimated rate of growth of the state’s economy (11.68%)
Welfare Spending Limit: Provides the amount that may be paid out of state funds for assistance grants not exceed 1 percent of the state budget in any biennium
Debt Limit: Limits the authorization of additional state debt, if in any fiscal year, the resulting annual debt service payable from unrestricted GR exceeds 5 percent of the average annual unrestricted GR funds for the previous three years
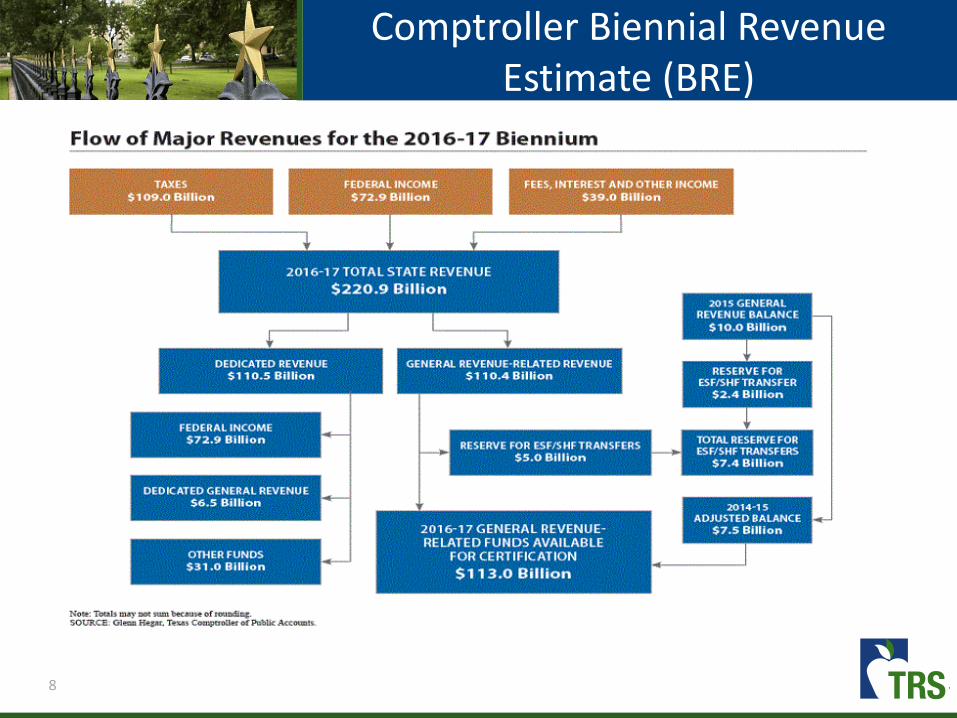
Comptroller Biennial Revenue Estimate (BRE)
8

Comptroller Biennial Revenue Estimate (BRE)
9
BRE published January 2015. Revenue estimates will change based on economic conditions, potential legal commitments and other circumstances.
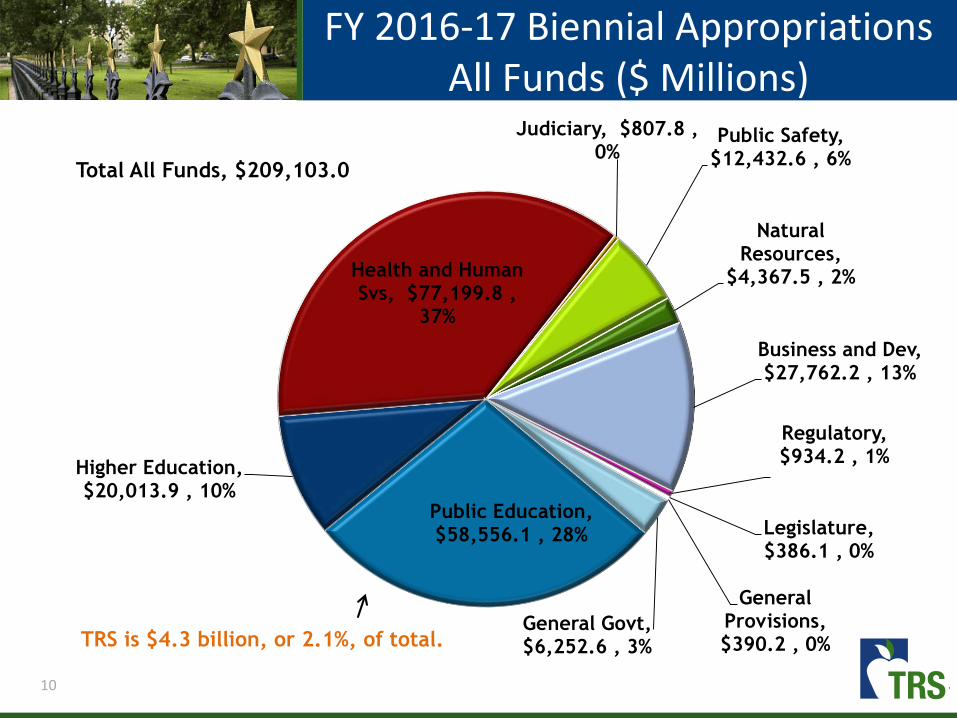
FY 2016-17 Biennial AppropriationsAll Funds ($ Millions)
10
Public Education, $58,556.1 , 28%
Higher Education, $20,013.9 , 10%
Health and Human Svs, $77,199.8 ,
37%
Judiciary, $807.8 , 0%
Public Safety, $12,432.6 , 6%
Natural Resources,
$4,367.5 , 2%
Business and Dev, $27,762.2 , 13%
Regulatory, $934.2 , 1%
Legislature, $386.1 , 0%
General Provisions, $390.2 , 0%
General Govt, $6,252.6 , 3%
Total All Funds, $209,103.0
TRS is $4.3 billion, or 2.1%, of total.
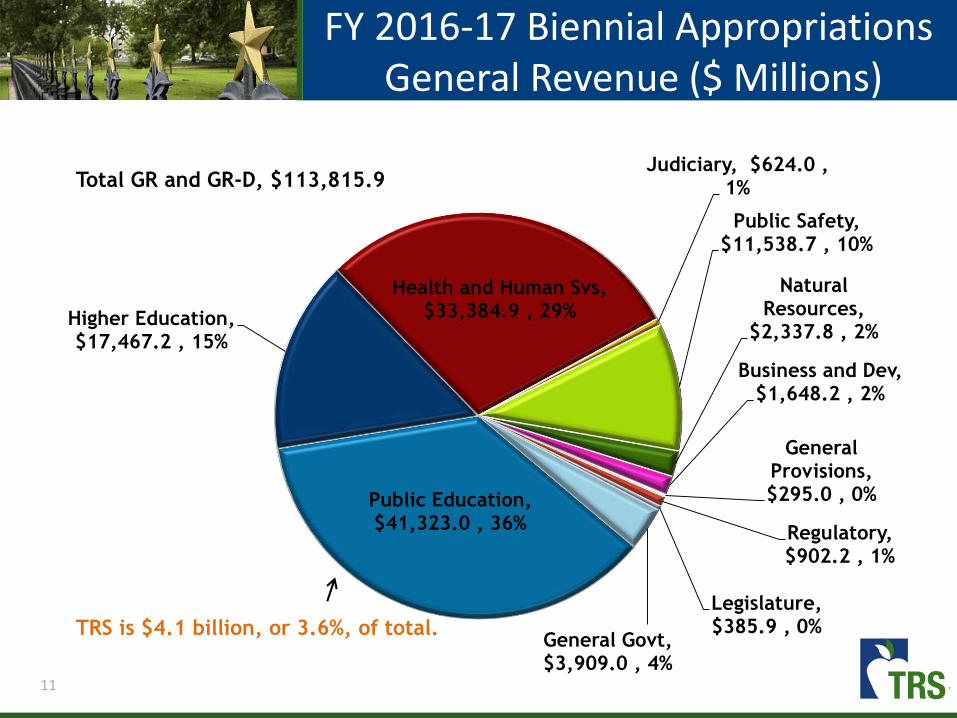
FY 2016-17 Biennial AppropriationsGeneral Revenue ($ Millions)
11
Public Education, $41,323.0 , 36%
Higher Education, $17,467.2 , 15%
Health and Human Svs, $33,384.9 , 29%
Judiciary, $624.0 , 1%
Public Safety, $11,538.7 , 10%
Natural Resources,
$2,337.8 , 2%
Business and Dev, $1,648.2 , 2%
General Provisions, $295.0 , 0%
Regulatory, $902.2 , 1%
Legislature, $385.9 , 0%
General Govt, $3,909.0 , 4%
Total GR and GR-D, $113,815.9
TRS is $4.1 billion, or 3.6%, of total.

State matching will remain at expected 6.8% contribution with assumed payroll growth
Solvency funding for TRS Care expected to be $1.5 - $2.0 billion through the end of FY2019
Final request for TEAM program; expected to be in the $8 - $10 million range for phase 2 operations
Administrative Operations Assessment of FTEs and operating expenses transitioning from TEAM
Evaluate need for additional FTEs requested for investment management, IT support, benefit services, and healthcare operations
Assessment of capital needs for new technology initiatives and efficient space management
TRS FY 18-19 Appropriations Issues
12