Troubleshooting Your Fabric€¦ · enables you to examine actual sequences of Fibre Channel frames...
24
CHAPTER Send comments to [email protected] 31-1 Fabric Manager Software Configuration Guide for the Cisco Nexus 5000 Series Switch OL-16598-01 31 Troubleshooting Your Fabric This chapter describes basic troubleshooting methods used to resolve issues with switches. This chapter contains the following sections: • Troubleshooting Tools and Techniques, page 31-1 • Analyzing Switch Device Health, page 31-3 • Analyzing Switch Fabric Configuration, page 31-4 • Analyzing End-to-End Connectivity, page 31-5 • Using the Ping Tool (fcping), page 31-7 • Using Trace Route (fctrace) and Other Troubleshooting Tools, page 31-7 • Analyzing the Results of Merging Zones, page 31-8 • Using the Show Tech Support Command, page 31-9 • Running CLI Commands, page 31-11 • Locating Other Switches, page 31-12 • Fibre Channel Timeout Values, page 31-14 • Configuring a Fabric Analyzer, page 31-16 • Configuring World Wide Names, page 31-22 • Configuring a Secondary MAC Address, page 31-22 • FC ID Allocation for HBAs, page 31-23 • Default Settings, page 31-23 Troubleshooting Tools and Techniques Multiple techniques and tools are available to monitor and troubleshoot Cisco switches. These tools provide a complete, integrated, multilevel analysis solution. Fabric Manager Server—The Cisco Fabric Manager Server provides a long-term, high-level view of storage network performance. Fabric-wide performance trends can be analyzed using Performance Manager. It provides the starting point for deeper analysis to resolve network hot-spots. Device Manager—If a performance problem is detected with the Fabric Manager Server, use Cisco Device Manager to view port-level statistics in real-time. Details on protocols, errors, discards, byte and frame counts are available. Samples can be taken as frequently as every 2 seconds, and values can be viewed in text form or graphically as pie, bar, area, and line charts.
Transcript of Troubleshooting Your Fabric€¦ · enables you to examine actual sequences of Fibre Channel frames...

C H A P T E R
Send comments to nx50 0 0 -doc feedback@c i sco .com
31-1Fabric Manager Software Configuration Guide for the Cisco Nexus 5000 Series Switch
OL-16598-01
31Troubleshooting Your Fabric
This chapter describes basic troubleshooting methods used to resolve issues with switches. This chapter contains the following sections:
• Troubleshooting Tools and Techniques, page 31-1
• Analyzing Switch Device Health, page 31-3
• Analyzing Switch Fabric Configuration, page 31-4
• Analyzing End-to-End Connectivity, page 31-5
• Using the Ping Tool (fcping), page 31-7
• Using Trace Route (fctrace) and Other Troubleshooting Tools, page 31-7
• Analyzing the Results of Merging Zones, page 31-8
• Using the Show Tech Support Command, page 31-9
• Running CLI Commands, page 31-11
• Locating Other Switches, page 31-12
• Fibre Channel Timeout Values, page 31-14
• Configuring a Fabric Analyzer, page 31-16
• Configuring World Wide Names, page 31-22
• Configuring a Secondary MAC Address, page 31-22
• FC ID Allocation for HBAs, page 31-23
• Default Settings, page 31-23
Troubleshooting Tools and TechniquesMultiple techniques and tools are available to monitor and troubleshoot Cisco switches. These tools provide a complete, integrated, multilevel analysis solution.
Fabric Manager Server—The Cisco Fabric Manager Server provides a long-term, high-level view of storage network performance. Fabric-wide performance trends can be analyzed using Performance Manager. It provides the starting point for deeper analysis to resolve network hot-spots.
Device Manager—If a performance problem is detected with the Fabric Manager Server, use Cisco Device Manager to view port-level statistics in real-time. Details on protocols, errors, discards, byte and frame counts are available. Samples can be taken as frequently as every 2 seconds, and values can be viewed in text form or graphically as pie, bar, area, and line charts.

Send comments to nx50 0 0 -doc feedback@c i sco .com
31-2Fabric Manager Software Configuration Guide for the Cisco Nexus 5000 Series Switch
OL-16598-01
Chapter 31 Troubleshooting Your FabricTroubleshooting Tools and Techniques
Traffic Analyzer—Another option is to launch the Cisco Traffic Analyzer for Fibre Channel from the Fabric Manager Server to analyze the traffic in greater depth. The Cisco Traffic Analyzer allows you to breakdown traffic by VSANs and protocols and to examine SCSI traffic at a logical unit number (LUN) level.
Protocol Analyzer—If even deeper investigation is needed, the Cisco Protocol Analyzer for Fibre Channel can be launched in-context from the Cisco Traffic Analyzer. The Cisco Protocol Analyzer enables you to examine actual sequences of Fibre Channel frames easily using the Fibre Channel and SCSI decoders Cisco developed for Wireshark.
Port Analyzer Adapter—Fabric Manager Server and Device Manager use SNMP to gather statistics. They fully utilize the built-in switch statistics counters.
Integration with the Cisco Traffic Analyzer and Cisco Protocol Analyzer extend the switch analysis capabilities by analyzing the Fibre Channel traffic itself. The Cisco Switched Port Analyzer (SPAN) enables these solutions using a flexible, nonintrusive technique to mirror traffic selectively from one or more ports to another switch port within a fabric.
The Cisco Port Analyzer Adapter (PAA) encapsulates SPAN traffic in an Ethernet header for transport to a PC or workstation for analysis. Both Fibre Channel control and data plane traffic are available using SPAN. The PAA broadcasts the Ethernet packets so they cannot be routed across IP networks. Hubs and switches can be used, provided they are in the same Ethernet subnet. Direct connections between a PAA and the PC are also supported. The PAA can reduce Ethernet traffic by truncating Fibre Channel data.
Both the Cisco Traffic Analyzer and Cisco Protocol Analyzer require the PAA to transport SPAN traffic to a PC or workstation.
Note The Cisco Traffic Analyzer works best with the Cisco Port Analyzer Adapter 2, because it provides a length value for truncated data, enabling accurate byte count reporting.
Cisco Traffic AnalyzerThe Cisco Traffic Analyzer for Fibre Channel provides real-time analysis of SPAN traffic or traffic captured previously using the Cisco Protocol Analyzer. The Fibre Channel traffic from multiple Cisco Port Analyzer Adapters (PAA) can be aggregated and analyzed by the Cisco Traffic Analyzer.
There are limits to how may SPAN sources can be sent to a single SPAN destination port. Aggregation extends the amount of information that can be analyzed in a unified set of reports by the Cisco Traffic Analyzer.
Note The aggregation capabilities are restricted to the information collect by Ethernet connections to a single PC. Aggregation across multiple PCs is not available.
The Cisco Traffic Analyzer provides reports through a Web server, so you can view them locally or remotely. The traffic analysis functions are provided by “ntop” open-source software, which was enhanced by Cisco to add Fibre Channel and SCSI analysis and enhanced inter-switch link (ISL) header support for SPAN. ntop is available on the Cisco.com software download center, under the Cisco Port Analyzer Adapter. ntop is also available on the Internet at http://www.ntop.org/ntop.html. The Cisco enhanced ntop runs under Microsoft Windows and Linux operating systems.

Send comments to nx50 0 0 -doc feedback@c i sco .com
31-3Fabric Manager Software Configuration Guide for the Cisco Nexus 5000 Series Switch
OL-16598-01
Chapter 31 Troubleshooting Your FabricAnalyzing Switch Device Health
The Cisco Traffic Analyzer for Fibre Channel presents reports with network wide statistics. The Summary Traffic report shows what percentage of traffic was within different ranges of frames sizes. A breakdown of the percentage of traffic for each protocol such as SCSI and ELS, is provided. The average and peak throughput for the SPAN traffic being analyzed are also provided.
Fibre Channel traffic can be analyzed on a per-VSAN basis with the Cisco Traffic Analyzer. The Domain Traffic Distribution graphs indicate how much traffic (bytes) were transmitted or received by a switch for a particular VSAN. FC Traffic Matrix graphs show how much traffic is transmitted and received between Fibre Channel sources and destinations. The total byte and frame counts for each VSAN are also provided.
Statistics can be analyzed for individual host and storage ports. You can see the percentage of SCSI read versus write traffic, SCSI versus other traffic, and percentage of transmitted versus received bytes and frames. The peak and average throughput values are available for data transmitted and received by each port.
Cisco Protocol AnalyzerThe Cisco Protocol Analyzer for Fibre Channel enables you to view Fibre Channel traffic frames in real-time or from a capture file. Fibre Channel and SCSI decoders enable you to view and analyze traffic at the frame level. It matches response with request for complete decoding, which greatly simplifies navigation. Response time between response and status are presented.
The Cisco Protocol Analyzer is VSAN aware, so VSANs can be used as criteria for capture and display filters. VSAN numbers can also be displayed in a column. Summary statistics are available for protocol distribution percentages and total bytes or frames transferred between specific Fibre Channel source and destination pairs. File capture and filtering controls are available. Captured files can be analyzed by either the Cisco Protocol Analyzer or the Cisco Traffic Analyzer.
Numerous features have been included for ease-of-use. You can find frames that meet particular criteria and mark them. Entries in the frame (packet) list can be colored to highlight items of interest, and columns can be added or removed as desired.
The protocol analysis functions are provided by Wireshark open-source software, which was enhanced by Cisco to decode Fibre Channel and SCSI protocols and support enhanced inter-switch link (ISL) headers for SPAN. Wireshark is available on the Cisco.com software download center, under the Cisco Port Analyzer Adapter. Wireshark is also available on the Internet at http://www.wireshark.org. Wireshark runs under Microsoft Windows, Solaris, and Linux operating systems.
Analyzing Switch Device HealthThe Switch Health option lets you determine the status of the components of a specific switch.
To use the Switch Health option in Fabric Manager to determine the status of the components of a specific switch, perform this task:
Step 1 Choose Tools > Switch Health.
You see the Switch Health Analysis window.
Step 2 Click Start to identify problems currently affecting the selected switch.
You see any problems listed in the switch health analysis window as shown in Figure 31-1.

Send comments to nx50 0 0 -doc feedback@c i sco .com
31-4Fabric Manager Software Configuration Guide for the Cisco Nexus 5000 Series Switch
OL-16598-01
Chapter 31 Troubleshooting Your FabricAnalyzing Switch Fabric Configuration
Figure 31-1 Results of a Switch Health Analysis
Step 3 Click Clear to remove the contents of the Switch Health Analysis window.
Step 4 Click Close to close the window.
Analyzing Switch Fabric ConfigurationThe Fabric Configuration option lets you analyze the configuration of a switch by comparing the current configuration to a specific switch or to a policy file. You can save a switch configuration to a file, and then compare all switches against the configuration in the file.
To use the Fabric Configuration option in Fabric Manager to analyze the configuration of a switch, perform this task:
Step 1 Choose Tools > Fabric Configuration.
You see the Fabric Configuration Analysis dialog box.
Step 2 Decide whether you want to compare the selected switch to another switch, or to a policy file.
• If you are making a switch comparison, check Policy Switch, and then choose the drop-down arrow to see a list of switches.
• If you are making a policy comparison, check Policy File. Then click the ... button to the right of this option to browse your file system and choose a policy file (*.XML).
Step 3 Click Rules to set the rules to apply when running the Fabric Configuration Analysis tool.
You see the Rules window.
Step 4 Change the rules as needed and click OK.
Step 5 Click Compare.
The system analyzes the configuration and displays issues that arise as a result of the comparison as shown in Figure 31-2.
Send comments to nx50 0 0 -doc feedback@c i sco .com
31-5Fabric Manager Software Configuration Guide for the Cisco Nexus 5000 Series Switch
OL-16598-01
Chapter 31 Troubleshooting Your FabricAnalyzing End-to-End Connectivity
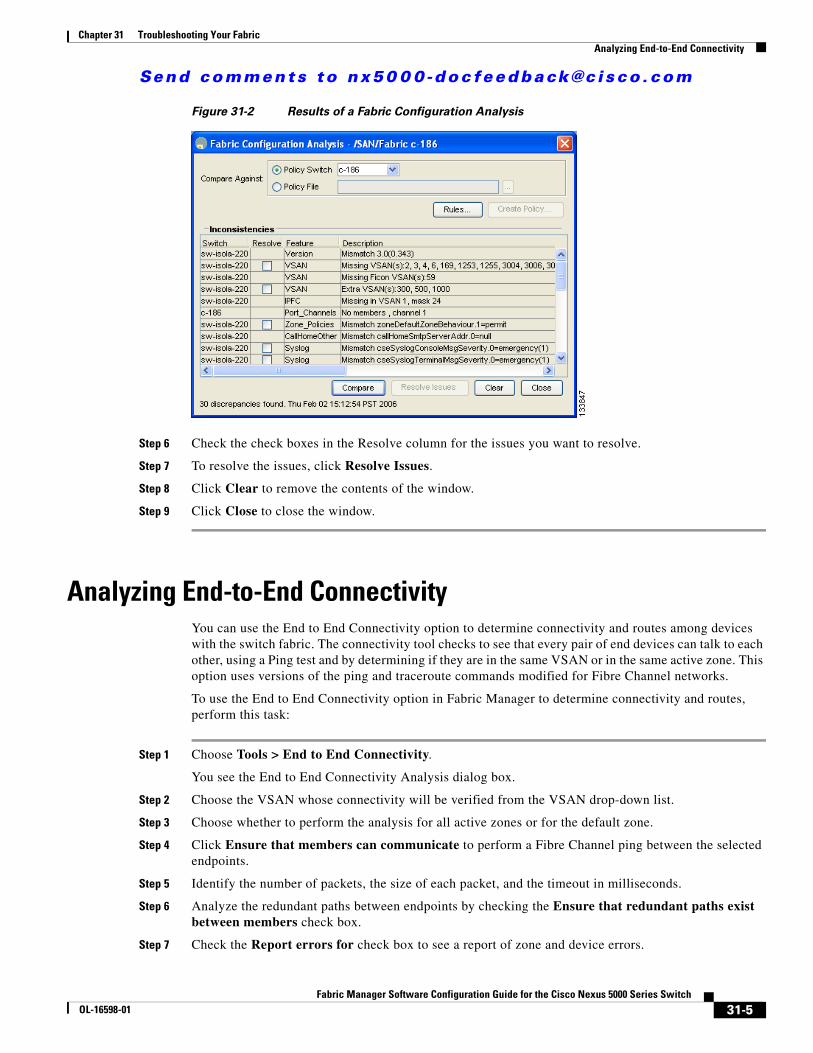
Figure 31-2 Results of a Fabric Configuration Analysis
Step 6 Check the check boxes in the Resolve column for the issues you want to resolve.
Step 7 To resolve the issues, click Resolve Issues.
Step 8 Click Clear to remove the contents of the window.
Step 9 Click Close to close the window.
Analyzing End-to-End ConnectivityYou can use the End to End Connectivity option to determine connectivity and routes among devices with the switch fabric. The connectivity tool checks to see that every pair of end devices can talk to each other, using a Ping test and by determining if they are in the same VSAN or in the same active zone. This option uses versions of the ping and traceroute commands modified for Fibre Channel networks.
To use the End to End Connectivity option in Fabric Manager to determine connectivity and routes, perform this task:
Step 1 Choose Tools > End to End Connectivity.
You see the End to End Connectivity Analysis dialog box.
Step 2 Choose the VSAN whose connectivity will be verified from the VSAN drop-down list.
Step 3 Choose whether to perform the analysis for all active zones or for the default zone.
Step 4 Click Ensure that members can communicate to perform a Fibre Channel ping between the selected endpoints.
Step 5 Identify the number of packets, the size of each packet, and the timeout in milliseconds.
Step 6 Analyze the redundant paths between endpoints by checking the Ensure that redundant paths exist between members check box.
Step 7 Check the Report errors for check box to see a report of zone and device errors.

Send comments to nx50 0 0 -doc feedback@c i sco .com
31-6Fabric Manager Software Configuration Guide for the Cisco Nexus 5000 Series Switch
OL-16598-01
Chapter 31 Troubleshooting Your FabricAnalyzing End-to-End Connectivity
Step 8 Click Analyze.
The End to End Connectivity Analysis window displays the selected endpoints including the switch to which each is attached, and the source and target ports used to connect it, as shown in Figure 31-3.
Figure 31-3 Results of an End-to-End Connectivity Analysis
The output shows all the requests that have failed:
• Ignoring empty zone—No requests are issued for this zone.
• Ignoring zone with single member—No requests are issued for this zone.
• Source/Target are unknown—No name server entries exist for the ports or we have not discovered the port during discovery.
• Both devices are on the same switch.
• No paths exist between the two devices.
• VSAN does not have an active zone set and the default zone is denied.
• Average time micro secs—The latency value was more than the threshold supplied.
Step 9 Click Clear to remove the contents of the window.

Send comments to nx50 0 0 -doc feedback@c i sco .com
31-7Fabric Manager Software Configuration Guide for the Cisco Nexus 5000 Series Switch
OL-16598-01
Chapter 31 Troubleshooting Your FabricUsing the Ping Tool (fcping)
Step 10 Click Close to close the window.
Using the Ping Tool (fcping)You can use the Ping tool to determine connectivity from another switch to a port on your switch.
To use the Ping tool in Fabric Manager to determine connectivity, perform this task:
Step 1 Choose Tools > Ping.
You can also select it from the right-click context menus for hosts and storage devices in the Fabric pane.
You see the Ping dialog box.
Step 2 Choose the source switch from the Source Switch drop-down list.
Step 3 Choose the VSAN in which you want to verify connectivity from the VSAN drop-down list.
Step 4 Choose the target end port for which to verify connectivity from the Target Endport drop-down list.
Step 5 Click Start to perform the ping between your switch and the selected port.
You see the Ping Results dialog box as shown in Figure 31-4.
Figure 31-4 Ping Results
Step 6 Click Clear to clear the contents of the window and perform another ping, or click Close to close the window.
Using Trace Route (fctrace) and Other Troubleshooting ToolsYou can use the following options on the Fabric Manager Tools menu to verify connectivity to a selected object or to open other management tools:
• Trace Route—Verify connectivity between two end devices that are currently selected on the Fabric pane.
• Device Manager— Launch the Device Manager for the switch selected on the Fabric pane.
• Command Line Interface—Open a Telnet or SSH session for the switch selected on the Fabric pane.

Send comments to nx50 0 0 -doc feedback@c i sco .com
31-8Fabric Manager Software Configuration Guide for the Cisco Nexus 5000 Series Switch
OL-16598-01
Chapter 31 Troubleshooting Your FabricAnalyzing the Results of Merging Zones
To use the Trace Route option in Fabric Manager to verify connectivity, perform this task:
Step 1 Choose Tools > Trace Route.
You see the Trace Route dialog box.
Step 2 Choose the source switch from the Source Switch drop-down list.
Step 3 Choose the VSAN for which to verify connectivity from the VSAN drop-down list.
Step 4 Choose the target end port for which to verify connectivity from the Target Endport drop-down list.
Step 5 Click Start to perform the traceroute between your switch and the selected port.
You see the results at the bottom of the dialog box as shown in Figure 31-5.
Figure 31-5 Successful Trace Route Results
Step 6 Click Clear to clear the contents of the window and perform another traceroute, or click Close to close the window.
Analyzing the Results of Merging ZonesYou can use the Zone Merge option on the Zone menu to determine if two connected switches have compatible zone configurations.
To use the Zone Merge option in Fabric Manager to determine zone configuration compatibility, perform this task:
Step 1 Choose Zone > Merge Analysis.
You see the Zone Merge Analysis dialog box.
Step 2 Choose a switch from each drop-down list.
Step 3 Choose the VSAN for which you want to perform the zone merge analysis.
Step 4 Repeat Step 3 as needed.
Step 5 Click Analyze.
The Zone Merge Analysis window displays any inconsistencies between the zone configuration of the two selected switches as shown in Figure 31-6.
Send comments to nx50 0 0 -doc feedback@c i sco .com
31-9Fabric Manager Software Configuration Guide for the Cisco Nexus 5000 Series Switch
OL-16598-01
Chapter 31 Troubleshooting Your FabricUsing the Show Tech Support Command
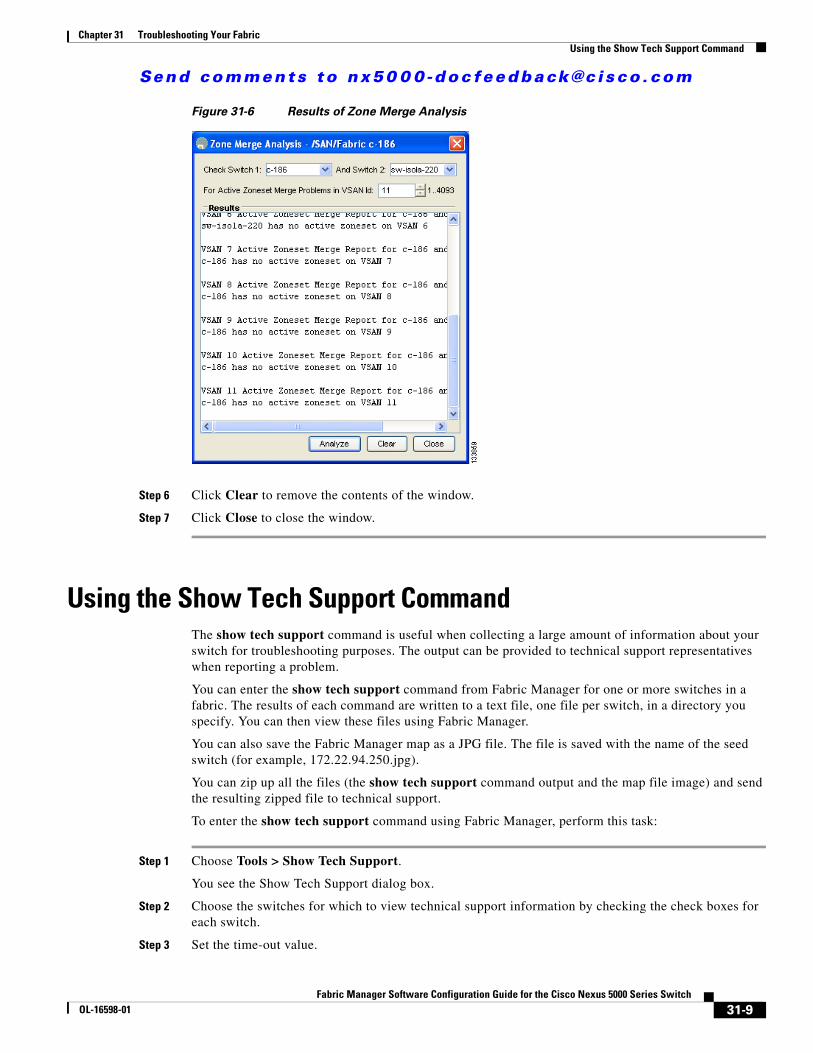
Figure 31-6 Results of Zone Merge Analysis
Step 6 Click Clear to remove the contents of the window.
Step 7 Click Close to close the window.
Using the Show Tech Support CommandThe show tech support command is useful when collecting a large amount of information about your switch for troubleshooting purposes. The output can be provided to technical support representatives when reporting a problem.
You can enter the show tech support command from Fabric Manager for one or more switches in a fabric. The results of each command are written to a text file, one file per switch, in a directory you specify. You can then view these files using Fabric Manager.
You can also save the Fabric Manager map as a JPG file. The file is saved with the name of the seed switch (for example, 172.22.94.250.jpg).
You can zip up all the files (the show tech support command output and the map file image) and send the resulting zipped file to technical support.
To enter the show tech support command using Fabric Manager, perform this task:
Step 1 Choose Tools > Show Tech Support.
You see the Show Tech Support dialog box.
Step 2 Choose the switches for which to view technical support information by checking the check boxes for each switch.
Step 3 Set the time-out value.

Send comments to nx50 0 0 -doc feedback@c i sco .com
31-10Fabric Manager Software Configuration Guide for the Cisco Nexus 5000 Series Switch
OL-16598-01
Chapter 31 Troubleshooting Your FabricUsing the Show Tech Support Command
The default is 30 seconds.
Step 4 Select the folder where you want the text files (containing the show tech support command information) to be written.
Step 5 Check the Save Map check box if you want to save a screenshot of your map as a JPG file.
Step 6 Check the Compress all files as check box to compress the files into a zip file.
Step 7 Click OK to start the show tech support command on the switches that you specified, or click Close to close the Show Tech Support dialog box without using the show tech support command (see Figure 31-7).
In the Status column next to each switch, you see a highlighted status. A yellow highlight indicates that the show tech support command is currently running on that switch. A red highlight indicates an error. A green highlight like the one shown in Figure 31-7 indicates that the show tech support command has completed successfully.
Figure 31-7 Successful Results of the show tech support Command
Step 8 If prompted, enter your user name and password in the appropriate fields for the switch in question.
Note In order for Fabric Manager to successfully enter the show tech support command on a switch, that switch must have this user name and password. Fabric Manager is unable to log into a switch that does not have a user name and password and an error is returned for that switch.
Note If you would like to view output files of the show tech support command without using Fabric Manager, open them with any text editor. Each file is named with the switch’s IP address and has a .TXT extension (for example, 111.22.33.444.txt).

Send comments to nx50 0 0 -doc feedback@c i sco .com
31-11Fabric Manager Software Configuration Guide for the Cisco Nexus 5000 Series Switch
OL-16598-01
Chapter 31 Troubleshooting Your FabricRunning CLI Commands
Running CLI CommandsYou can use the Run CLI Commands feature to run a CLI command on multiple switches. To run CLI commands using Fabric Manager, perform this task:
Step 1 Choose Tools > Run CLI Commands.
You see the Run CLI Commands dialog box with all switches selected as shown in Figure 31-8.
Figure 31-8 Run CLI Commands Dialog Box
Step 2 Uncheck the check box for the switch(es) for which you do not want to run CLI commands.
Step 3 Specify where you want the file to be saved.
Note A separate report is issued for each switch. Check the reports to verify whether a CLI command failed.
Step 4 Enter the command(s) in the Command(s) text box. If the commands are configuration mode commands, you must also enter the exit command.
Note For the commands to execute, you cannot be in configuration mode.
Step 5 Click OK to run the CLI command(s).
You see the Run CLI Commands dialog box showing the status of each switch as shown in Figure 31-9.

Send comments to nx50 0 0 -doc feedback@c i sco .com
31-12Fabric Manager Software Configuration Guide for the Cisco Nexus 5000 Series Switch
OL-16598-01
Chapter 31 Troubleshooting Your FabricLocating Other Switches
Figure 31-9 Run CLI Commands Status
Step 6 Click Close to close the dialog box.
Adjusting for Daylight Savings Time
Note Starting in 2007, daylight savings time in the United States starts on the second Sunday in March and ends on the first Sunday in November.
You can use the Run CLI Commands feature in Fabric Manager to adjust the time change configuration in your switches. Enter the following commands in the Command(s) text box:
configureno clock summer-timeclock summer-time daylight_timezone_name 2 Sunday March 02:00 1 Sunday November 02:00 60
Locating Other SwitchesThe Locate Switches option uses SNMPv2 and discovers devices responding to SNMP requests with the read-only community string public. You can use this feature in these situations:
• You have third-party switches that do not implement the FC-GS3 FCS standard that provides management IP addresses.
• You want to locate other Cisco switches in the subnet but are not physically connected to the fabric.

Send comments to nx50 0 0 -doc feedback@c i sco .com
31-13Fabric Manager Software Configuration Guide for the Cisco Nexus 5000 Series Switch
OL-16598-01
Chapter 31 Troubleshooting Your FabricLocating Other Switches
To locate switches that are not included in the currently discovered fabric using Fabric Manager, perform this task:
Step 1 Choose File > Locate Switches and Devices.
You see the Locate Switches dialog box.
Step 2 In the Comma Separated Subnets field, enter a range of specific addresses belonging to a specific subnet to limit the research for the switches.
To look for a Cisco switch belonging to subnet 192.168.199.0, use the following string:
192.168.100.[1-254]
Multiple ranges can be specified, separated by commas. For example, to look for all the devices in the two subnets 192.168.199.0 and 192.169.100.0, use the following string:
192.168.100.[1-254], 192.169.100.[1-254]
Step 3 Enter the appropriate read community string in the Read Community field.
The default value for this string is public.
Step 4 Click Display Cisco Nexus 5000 family Only to display only the Cisco Nexus 5000 Series switches in your network fabric.
Step 5 Click Search to discover switches and devices in your network fabric.
You see the results of the discovery in the Locate Switches window. (See Figure 31-10.)
Figure 31-10 Search Results for Switches and Devices
Note The number in the lower left corner of the screen increments as the device locator attempts to discover the devices in your network fabric. When the discovery process is complete, the number indicates the number of rows displayed.

Send comments to nx50 0 0 -doc feedback@c i sco .com
31-14Fabric Manager Software Configuration Guide for the Cisco Nexus 5000 Series Switch
OL-16598-01
Chapter 31 Troubleshooting Your FabricFibre Channel Timeout Values
Step 6 Click Close to close this dialog box.
Fibre Channel Timeout ValuesYou can modify Fibre Channel protocol related timer values for the switch by configuring the following timeout values (TOVs):
• Distributed services TOV (D_S_TOV)—The valid range is from 5,000 to 10,000 milliseconds. The default is 5,000 milliseconds.
• Error detect TOV (E_D_TOV)—The valid range is from 1,000 to 10,000 milliseconds. The default is 2,000 milliseconds. This value is matched with the other end during port initialization.
• Resource allocation TOV (R_A_TOV)—The valid range is from 5,000 to 10,000 milliseconds. The default is 10,000 milliseconds. This value is matched with the other end during port initialization.
Note The fabric stability TOV (F_S_TOV) constant cannot be configured.
Caution The D_S_TOV, E_D_TOV, and R_A_ TOV values cannot be globally changed unless all VSANs in the switch are suspended.
To configure timeouts using Fabric Manager, perform this task:
Step 1 Choose SAN in the Logical Domains pane to include all VSANs.
Step 2 Expand Switches, expand FC Services, and choose Timers & Policies in the Physical Attributes pane.
You see the timers for switches in the Information pane.
Step 3 Click Change Timeouts to configure the timeout values.
You see the Change Timeouts dialog box as shown in Figure 31-11.
Figure 31-11 Change Timeouts Dialog Box
Step 4 Indicate values for R_A_TOV (Resource Allocation Timeout Value), D_S_TOV (Distributed Services
Timeout Value), and E_D_TOV (Error Detect Timeout Value).
Step 5 Click Apply.

Send comments to nx50 0 0 -doc feedback@c i sco .com
31-15Fabric Manager Software Configuration Guide for the Cisco Nexus 5000 Series Switch
OL-16598-01
Chapter 31 Troubleshooting Your FabricFibre Channel Timeout Values
Step 6 Click Close to close the dialog box.
To configure timer policies in Device Manager, perform this task:
Step 1 Choose FC > Advanced > Timers/Policies.
You see timer policies for a single switch in the dialog box as shown in Figure 31-12.
Figure 31-12 Configure Timer Policies in Device Manager
Step 2 Choose a network from the drop-down list and specify a switch.
Step 3 Check the check boxes for InOrderDeliver and/or Trunk Protocol.
Step 4 Click Apply.
Step 5 Click Close to close the dialog box.
Timer Configuration Per-VSANYou can also issue an fctimer for a specified VSAN to configure different TOV values for VSANs with special links such as FC or IP tunnels. You can configure different E_D_TOV, R_A_TOV, and D_S_TOV values for individual VSANs. Active VSANs are suspended and activated when their timer values are changed.
Caution You cannot perform a nondisruptive downgrade to any earlier version that does not support per-VSAN FC timers.
Note This configuration must be propagated to all switches in the fabric; be sure to configure the same value in all switches in the fabric.
To configure per-VSAN FC timers using Fabric Manager, perform this task:
Step 1 Choose the VSAN for timer configuration from the Logical Domains pane.

Send comments to nx50 0 0 -doc feedback@c i sco .com
31-16Fabric Manager Software Configuration Guide for the Cisco Nexus 5000 Series Switch
OL-16598-01
Chapter 31 Troubleshooting Your FabricConfiguring a Fabric Analyzer
If a VSAN is not specified when you change the policies, the changed value is applied to all VSANs in the switch.
Step 2 Expand Switches, expand FC Services, and choose Timers & Policies in the Physical Attributes tree.
You see timeouts for only switches in the selected VSAN shown in the Information pane.
Step 3 Click Change Timeouts to configure the time-out values.
You see the Change Timeouts dialog as shown in Figure 31-13.
Figure 31-13 Change Timeouts per VSAN in Fabric Manager
Step 4 Change the timeout values shown in Figure 31-13.
Step 5 Indicate values for R_A_TOV (Resource Allocation Timeout Value), D_S_TOV (Distributed Services
Timeout Value), and E_D_TOV (Error Detect Timeout Value).
Step 6 Click Apply.
Step 7 Click Close to close the dialog box.
Configuring a Fabric AnalyzerFibre Channel protocol analyzers capture, decode, and analyze frames and ordered sets on a link. Existing Fibre Channel analyzers can capture traffic at wire rate speed. They are expensive and support limited frame decoding. Also, existing analyzers disrupt the traffic on the link while snooping traffic.
With the Cisco Fabric Analyzer, you can capture Fibre Channel control traffic from a switch and decode it without having to disrupt any connectivity, and without having to be local to the point of analysis.
The Cisco Fibre Channel protocol analyzer is based on two popular public-domain software applications:
• libpcap—See http://www.tcpdump.org.
• Wireshark—See http://www.wireshark.com.
Note The Cisco Fabric Analyzer is useful in capturing and decoding control traffic, not data traffic. It is suitable for control path captures, and is not intended for high-speed data path captures.

Send comments to nx50 0 0 -doc feedback@c i sco .com
31-17Fabric Manager Software Configuration Guide for the Cisco Nexus 5000 Series Switch
OL-16598-01
Chapter 31 Troubleshooting Your FabricConfiguring a Fabric Analyzer
About the Cisco Fabric AnalyzerThe Cisco Fabric Analyzer consists of two separate components (see Figure 31-14):
• Software that runs on the Cisco Cisco Nexus 5000 Series switch and supports two modes of capture:
– A text-based analyzer that supports local capture and decodes captured frames
– A daemon that supports remote capture
• GUI-based client that runs on a host that supports libpcap such as Windows or Linux and communicates with the remote capture daemon in a Cisco Cisco Nexus 5000 Series switch.
Figure 31-14 Cisco Fabric Analyzer Use
Local Text-Based Capture
This component is a command-line driven text-based interface that captures traffic to and from the supervisor module in a Cisco Cisco Nexus 5000 Series switch. It is a fully functional decoder that is useful for quick debug purposes or for use when the remote capture daemon is not enabled. Additionally, because this tool is accessed from within the Cisco Cisco Nexus 5000 Series switch, it is protected by the roles-based policy that limits access in each switch.
FC analyzer
GUI output
IPnetwork
Textual output
IPnetwork
FC analyzer
RS-232(Serial console)
Fibre Channelfabric
10/100 Ethernet(00B Mgmt)
8548
2
Remote mode Local mode
Send comments to nx50 0 0 -doc feedback@c i sco .com
31-18Fabric Manager Software Configuration Guide for the Cisco Nexus 5000 Series Switch
OL-16598-01
Chapter 31 Troubleshooting Your FabricConfiguring a Fabric Analyzer
Remote Capture Daemon
This daemon is the server end of the remote capture component. The Wireshark analyzer running on a host is the client end. They communicate with each other using the Remote Capture Protocol (RPCAP). RPCAP uses two endpoints, a TCP-based control connection and a TCP or UDP-based data connection based on TCP (default) or UDP. The control connection is used to remotely control the captures (start or stop the capture, or specify capture filters). Remote capture can only be performed to explicitly configured hosts. This technique prevents an unauthorized machine in the network from snooping on the control traffic in the network.
RPCAP supports two setup connection modes based on firewall restrictions:
• Passive mode (default)—The configured host initiates connection to the switch. Multiple hosts can be configured to be in passive mode and multiple hosts can be connected and receive remote captures at the same time.
• Active mode—The switch initiates the connection to a configured host, one host at a time.
Using capture filters, you can limit the amount of traffic that is actually sent to the client. Capture filters are specified at the client end on Wireshark, not on the switch.
GUI-Based Client
The Wireshark software runs on a host, such as a PC or workstation, and communicates with the remote capture daemon. This software is available in the public domain from http://www.wireshark.org. The Wireshark GUI front-end supports a rich interface such as a colored display, graphical help in defining filters, and specific frame searches. These features are documented on Wireshark’s website.
While remote capture through Wireshark supports capturing and decoding Fibre Channel frames from a Cisco Cisco Nexus 5000 Series switch, the host running Wireshark does not require a Fibre Channel connection to the switch. The remote capture daemon running on the switch sends the captured frames over the out-of-band Ethernet management port. This capability allows you to capture and decode Fibre Channel frames from your desktop or laptop.
Configuring the Cisco Fabric AnalyzerYou can configure the Cisco Fabric Analyzer to perform one of two captures:
• Local capture—A local capture cannot be saved to persistent storage or synchronized to standby. It launches the textual version on the fabric analyzer directly on the console screen. The capture can also be saved on the local file system.
• Remote capture—A remote capture can be saved to persistent storage. It can be synchronized to the standby supervisor module and a stateless restart can be issued, if required.
To use the Cisco Fabric Analyzer feature, traffic should be flowing to or from the supervisor module.

Send comments to nx50 0 0 -doc feedback@c i sco .com
31-19Fabric Manager Software Configuration Guide for the Cisco Nexus 5000 Series Switch
OL-16598-01
Chapter 31 Troubleshooting Your FabricConfiguring a Fabric Analyzer
Sending Captures to Remote IP Addresses
Caution You must use the eth2 interface to capture control traffic on a supervisor module.
To capture remote traffic, use one of the following options:
• The capture interface can be specified in Wireshark as the remote device:
rpcap://<ipaddress or switch hostname>/eth2
For example:
rpcap://cp-16/eth2rpcap://17.2.1.1/eth2
• The capture interface can be specified either in the capture dialog box or by using the -i option at the command line when invoking Wireshark.
wireshark -i rpcap://<ipaddress|hostname>[:<port>]/<interface>
For example:
wireshark -i rpcap://172.22.1.1/eth2
or
wireshark -i rpcap://customer-switch.customer.com/eth2
Note For example, in a Windows 2000 setup, click Start on your desktop and choose Run. In the resulting Run window, type the required command line option in the Open field.
Displaying Captured FramesYou can selectively view captured frames by using the display filters feature. For example, instead of viewing all the frames from a capture, you may only want to view Exchange Link Protocol (ELP) request frames. This feature only limits the captured view; it does not affect the captured or the saved frames. Procedures to specify, use, and save display filters are already documented in the Wireshark website (http://www.wireshark.org).
These examples show how to use this feature:
• To view all packets in a specified VSAN, use this expression:
mdshdr.vsan == 2
• To view all SW_ILS frames, use this expression:
fcswils
• To view class F frames, use this expression:
mdshdr.sof == SOFf
• To view all FSPF frames, use this expression:
swils.opcode == HLO || swils.opcode == LSU || swils.opcode == LSA

Send comments to nx50 0 0 -doc feedback@c i sco .com
31-20Fabric Manager Software Configuration Guide for the Cisco Nexus 5000 Series Switch
OL-16598-01
Chapter 31 Troubleshooting Your FabricConfiguring a Fabric Analyzer
• To view all FLOGI frames, use this expression:
fcels.opcode == FLOGI
• To view all FLOGI frames in VSAN 1, use this expression:
fcels.opcode == FLOGI && mdshdr.vsan == 2
• To view all name server frames, use this expression:
dNS
Defining Display Filters
Display filters limit the frames that can be displayed, but not what is captured (similar to any view command). The filters to be displayed can be defined in multiple ways in the GUI application:
• Auto-definition
• Manual definition
• Assisted manual definition
• Only manual definition in local capture
• No assists
Regardless of the definition, each filter must be saved and identified with a name.
Note This GUI-assisted feature is part of Wireshark, and you can obtain more information from http://www.wireshark.org.
Capture Filters
You can limit what frames are captured by using the capture filters feature in a remote capture. This feature limits the frames that are captured and sent from the remote switch to the host. For example, you can capture only class F frames. Capture filters are useful in restricting the amount of bandwidth consumed by the remote capture.
Unlike display filters, capture filters restrict a capture to the specified frames. No other frames are visible until you specify a completely new capture.
The syntax for capture filter is different from the syntax for display filters. Capture filters use the Berkeley Packet Filter (BPF) library that is used in conjunction with the libpcap freeware. The list of all valid Fibre Channel capture filter fields are provided later in this section.
Procedures to configure capture filters are already documented in the Wireshark website (http://www.wireshark.org).
These examples show how to use this feature:
• To capture frames only on a specified VSAN, use this expression:
vsan = 1
• To capture only class F frames, use this expression:
class_f

Send comments to nx50 0 0 -doc feedback@c i sco .com
31-21Fabric Manager Software Configuration Guide for the Cisco Nexus 5000 Series Switch
OL-16598-01
Chapter 31 Troubleshooting Your FabricConfiguring a Fabric Analyzer
• To capture only class Fibre Channel ELS frames, use this expression:
els
• To capture only name server frames, use this expression:
dns
• To capture only SCSI command frames, use this expression:
fcp_cmd
Note This feature is part of libpcap and you can obtain more information from http://www.tcpdump.org.
Permitted Capture Filters
This section lists the permitted capture filters:
o vsano src_port_idxo dst_port_idxo sofo r_ctlo d_ido s_ido typeo seq_ido seq_cnto ox_ido rx_ido elso swilso fcp_cmd (FCP Command frames only)o fcp_data (FCP data frames only)o fcp_rsp (FCP response frames only)o class_fo bad_fco els_cmdo swils_cmdo fcp_luno fcp_task_mgmto fcp_scsi_cmdo fcp_statuso gs_type (Generic Services type)o gs_subtype (Generic Services subtype)o gs_cmdo gs_reasono gs_reason_explo dns (name server)o udns (unzoned name server)o fcs (fabric configuration server)o zs (zone server)o fc (use as fc[x:y] where x is offset and y is length to compare)o els (use as els[x:y] similar to fc)o swils (use as swils[x:y] similar to fc)o fcp (use as fcp[x:y] similar to fc)o fcct (use as fcct[x:y] similar to fc)
Send comments to nx50 0 0 -doc feedback@c i sco .com
31-22Fabric Manager Software Configuration Guide for the Cisco Nexus 5000 Series Switch
OL-16598-01
Chapter 31 Troubleshooting Your FabricConfiguring World Wide Names
Configuring World Wide NamesThe world wide name (WWN) in the switch is equivalent to the Ethernet MAC address. As with the MAC address, you must uniquely associate the WWN to a single device. The principal switch selection and the allocation of domain IDs rely on the WWN. The WWN manager, a process-level manager residing on the switch’s supervisor module, assigns WWNs to each switch.
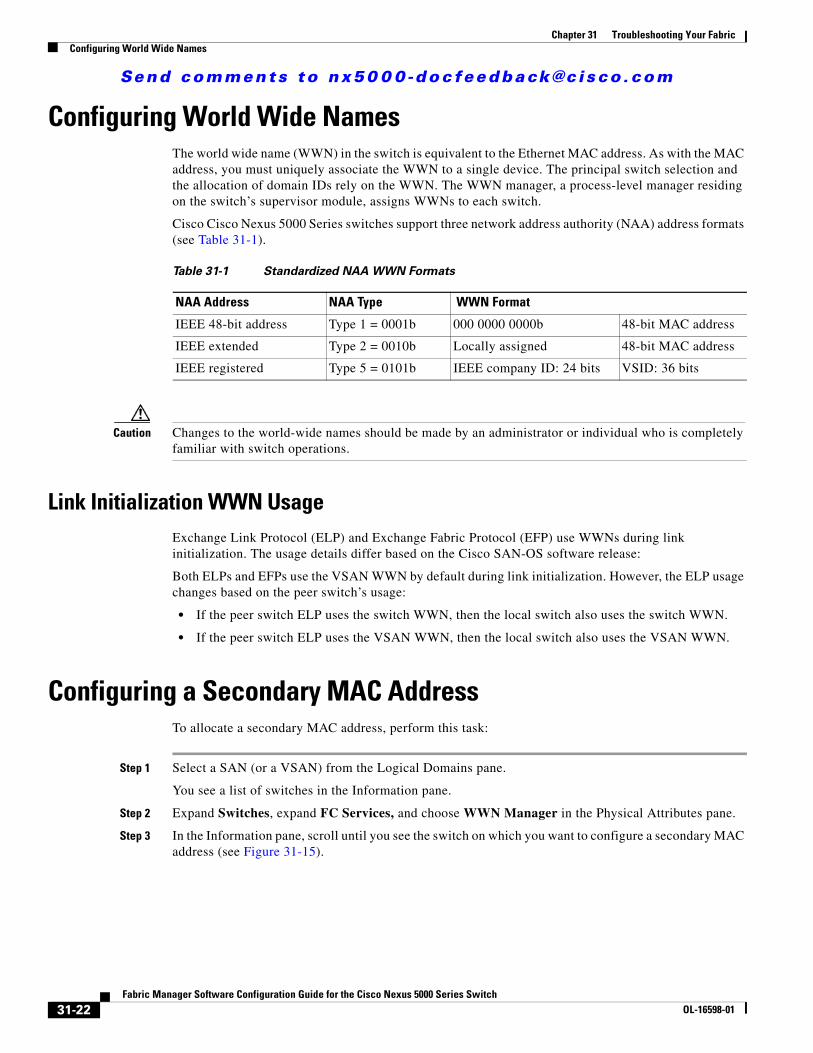
Cisco Cisco Nexus 5000 Series switches support three network address authority (NAA) address formats (see Table 31-1).
Caution Changes to the world-wide names should be made by an administrator or individual who is completely familiar with switch operations.
Link Initialization WWN Usage Exchange Link Protocol (ELP) and Exchange Fabric Protocol (EFP) use WWNs during link initialization. The usage details differ based on the Cisco SAN-OS software release:
Both ELPs and EFPs use the VSAN WWN by default during link initialization. However, the ELP usage changes based on the peer switch’s usage:
• If the peer switch ELP uses the switch WWN, then the local switch also uses the switch WWN.
• If the peer switch ELP uses the VSAN WWN, then the local switch also uses the VSAN WWN.
Configuring a Secondary MAC AddressTo allocate a secondary MAC address, perform this task:
Step 1 Select a SAN (or a VSAN) from the Logical Domains pane.
You see a list of switches in the Information pane.
Step 2 Expand Switches, expand FC Services, and choose WWN Manager in the Physical Attributes pane.
Step 3 In the Information pane, scroll until you see the switch on which you want to configure a secondary MAC address (see Figure 31-15).
Table 31-1 Standardized NAA WWN Formats
NAA Address NAA Type WWN Format
IEEE 48-bit address Type 1 = 0001b 000 0000 0000b 48-bit MAC address
IEEE extended Type 2 = 0010b Locally assigned 48-bit MAC address
IEEE registered Type 5 = 0101b IEEE company ID: 24 bits VSID: 36 bits

Send comments to nx50 0 0 -doc feedback@c i sco .com
31-23Fabric Manager Software Configuration Guide for the Cisco Nexus 5000 Series Switch
OL-16598-01
Chapter 31 Troubleshooting Your FabricFC ID Allocation for HBAs
Figure 31-15 Setting Secondary MAC Addresses
Step 4 Enter the secondary MAC address in the Secondary Mac Base field.
Step 5 Enter the range for the secondary MAC address in the Secondary Mac Range field.
Step 6 Click the Apply Changes icon.
Displaying WWN InformationTo display the status of the WWN configuration, perform this task:
Step 1 Select a SAN (or a VSAN) from the Logical Domains pane.
You see a list of switches in the Information pane.
Step 2 Choose Switches > FC Services > WWN Manager from the Physical Attributes pane.
You see the WWN information for each switch in the SAN or VSAN.
FC ID Allocation for HBAsFibre Channel standards require a unique FC ID to be allocated to an N port attached to a Fx port in any switch. To conserve the number of FC IDs used, Cisco Cisco Nexus 5000 Series switches use a special allocation scheme. See the “FC ID Allocation for HBAs” section on page 31-23.
Default SettingsTable 31-2 lists the default settings for the features included in this chapter.
Table 31-2 Default Settings for Advanced Features
Parameters Default
CIM server Disabled
CIM server security protocol HTTP
D_S_TOV 5,000 milliseconds

Send comments to nx50 0 0 -doc feedback@c i sco .com
31-24Fabric Manager Software Configuration Guide for the Cisco Nexus 5000 Series Switch
OL-16598-01
Chapter 31 Troubleshooting Your FabricDefault Settings
E_D_TOV 2,000 milliseconds
R_A_TOV 10,000 milliseconds
Time-out period to invoke fctrace 5 seconds
Number of frame sent by the fcping feature 5 frames
Remote capture connection protocol TCP
Remote capture connection mode Passive
Local capture frame limit s 10 frames
FC ID allocation mode Auto mode
Loop monitoring Disabled
Table 31-2 Default Settings for Advanced Features (continued)
Parameters Default