Tronox Limited 2015 Global Reporting Initiative Report
49
T ronox Limited 2015 Global Reporting Initiative Report
Transcript of Tronox Limited 2015 Global Reporting Initiative Report
Tronox Limited 2015 Global Reporting Initiative Report

TABLE OF CONTENTS
1
INTRODUCTION...................................................................................................................................... 2 GENERAL STANDARD DISCLOSURES .............................................................................................. 3 PERFORMANCE INDICATORS .......................................................................................................... 22 GRI INDEX............................................................................................................................................... 46
INTRODUCTION
2
July 15, 2016 This 2015 Global Reporting Initiative (GRI) Report, based on the internationally recognized GRI Framework for Sustainability Reporting, is intended to supplement the Tronox Limited 2015 Annual Report and Corporate Responsibility Report by providing additional data and information on our economic, environmental, and social performance. In developing the report we utilized the GRI G4 Guidelines, applied to data for the fiscal year ended December 31, 2015. We believe this level of data, combined with the required GRI Standard Disclosures, enables Tronox to declare this report complies with the GRI G4 Core “in accordance” option. In the past year we completed the transition from the GRI G3.1 Framework to the G4 Framework. This is therefore our first GRI Report applying the G4 Guidelines. We also took into account the G4 Mining and Metals Sector Disclosures, including several sector specific indicators. Tronox acquired the Alkali Chemicals business from FMC Corporation in April 2015, and now operates it as a business segment. Data presented in this report captures the results of the Alkali business from the date of the acquisition, April 1, 2015. Please refer to the GRI Index provided on page 46 for quick reference to specific disclosures and indicators.
GENERAL STANDARD DISCLOSURES
3
Strategy and Analysis
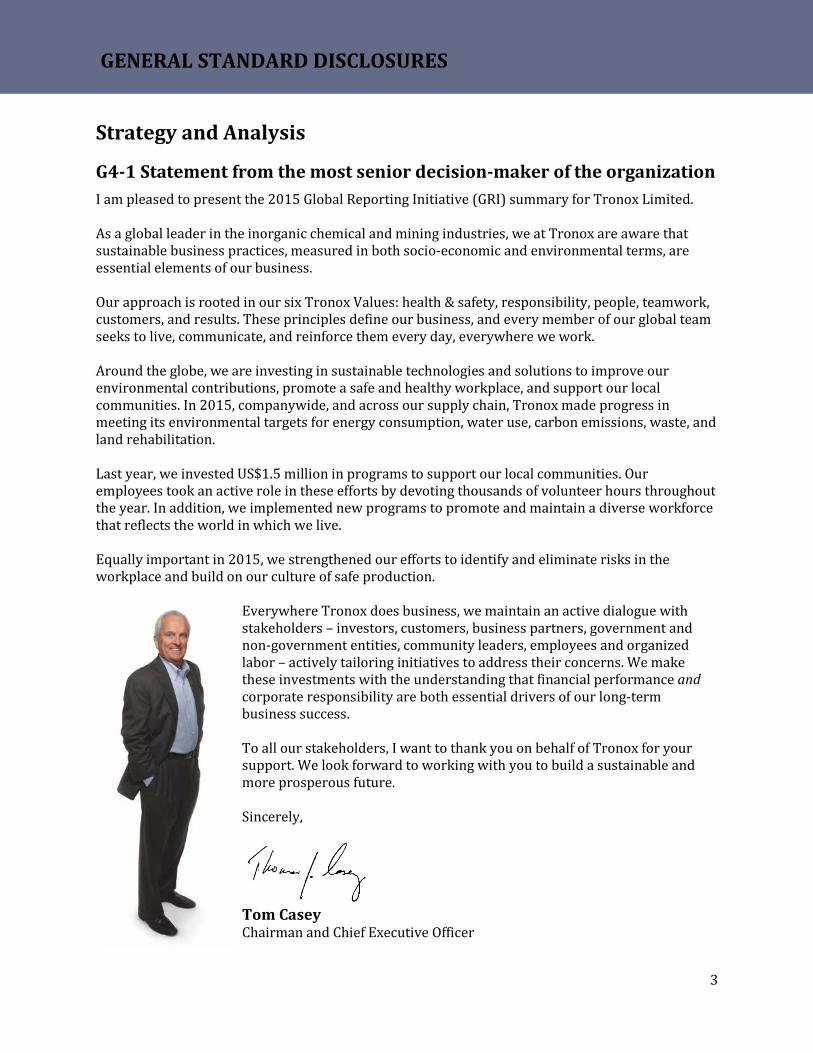
G4-1 Statement from the most senior decision-maker of the organization I am pleased to present the 2015 Global Reporting Initiative (GRI) summary for Tronox Limited. As a global leader in the inorganic chemical and mining industries, we at Tronox are aware that sustainable business practices, measured in both socio-economic and environmental terms, are essential elements of our business. Our approach is rooted in our six Tronox Values: health & safety, responsibility, people, teamwork, customers, and results. These principles define our business, and every member of our global team seeks to live, communicate, and reinforce them every day, everywhere we work. Around the globe, we are investing in sustainable technologies and solutions to improve our environmental contributions, promote a safe and healthy workplace, and support our local communities. In 2015, companywide, and across our supply chain, Tronox made progress in meeting its environmental targets for energy consumption, water use, carbon emissions, waste, and land rehabilitation. Last year, we invested US$1.5 million in programs to support our local communities. Our employees took an active role in these efforts by devoting thousands of volunteer hours throughout the year. In addition, we implemented new programs to promote and maintain a diverse workforce that reflects the world in which we live. Equally important in 2015, we strengthened our efforts to identify and eliminate risks in the workplace and build on our culture of safe production.
Everywhere Tronox does business, we maintain an active dialogue with stakeholders – investors, customers, business partners, government and non-government entities, community leaders, employees and organized labor – actively tailoring initiatives to address their concerns. We make these investments with the understanding that financial performance and corporate responsibility are both essential drivers of our long-term business success. To all our stakeholders, I want to thank you on behalf of Tronox for your support. We look forward to working with you to build a sustainable and more prosperous future. Sincerely,
Tom Casey Chairman and Chief Executive Officer

GENERAL STANDARD DISCLOSURES
4
Organizational Profile
G4-3 Name of the organization Tronox Limited (Tronox, the company, or we).
G4-4 Primary brands, products, and services Tronox brightens peoples’ lives. We operate two vertically integrated mining and inorganic chemical businesses. Tronox Titanium Dioxide (TiO2) mines and processes titanium ore, zircon, and other minerals, and manufactures titanium dioxide pigments that add brightness and durability to paints, plastics, paper, and other everyday products. Tronox Alkali mines trona ore and manufactures natural soda ash, sodium bicarbonate, caustic soda, and other compounds which are used in the production of glass, detergents, baked goods, animal nutrition supplements, pharmaceuticals, and other essential products. We operate mines in Australia, South Africa, and the United States. Our chemical plants are based in Australia, the Netherlands, and the United States. We are a diverse global workforce of more than 4,400 who are committed to safe and sustainable business practices that bring value to our shareholders, customers, and business partners. Our two businesses serve more than 1,400 customers worldwide. For more information, visit www.tronox.com. Products
Pigment Titanium Dioxide (TiO2) Titanium dioxide is a white inorganic compound used primarily in the production of paints, printing inks, paper and plastic products. Titanium dioxide has a remarkably high refractive index and exceedingly high reflectance, offering maximum opacity and imparting whiteness and brightness to the products it is used in. Electrolytic Elemental Boron / Boron Trichloride Elemental boron and boron trichloride are used by the automotive industry in airbags and as a reactant in pharmaceutical production, respectively. Electrolytic Manganese Dioxide (EMD) EMD is used in the production of alkaline primary (non-rechargeable) batteries. It is also the starting material for making lithium manganese oxide (LMO) which is used in the production of rechargeable batteries.
GENERAL STANDARD DISCLOSURES
5
Mineral Sands Ilmenite Ilmenite is the most abundant naturally occurring titanium mineral in the world. It is comprised primarily of iron titanium dioxide, as well as other elements such as magnesium and manganese. It is highly magnetic and can be isolated from other minerals by magnetic separators and other processes. Ilmenite can be further separated from iron through a smelting process to make chloride-process titanium slag or sulfate-process titanium slag. It can also be converted into synthetic rutile. Ilmenite and its related beneficiated products are used as feedstock for the production of titanium dioxide pigment and titanium metals. Rutile Naturally occurring rutile contains a very high titanium concentration and does not need to be upgraded for use in the company’s titanium dioxide pigment process. Feedstocks with high concentrations of titanium produce less waste at pigment plants and are more efficient. Rutile is also used for the coating of welding rods, and the production of titanium metal. Chloride Slag and Slag fines Tronox upgrades ilmenite using a smelting process to create chloride slag and slag fines, which are converted by pigment manufacturers into titanium dioxide. Synthetic Rutile Tronox also upgrades ilmenite into synthetic rutile using a rotary kiln. Synthetic rutile has a higher titanium content than chloride slag or slag fines, but not as high as natural rutile. Leucoxene Leucoxene is a naturally occurring mineral formed through the geological alteration of ilmenite. It is an amorphous iron-titanium oxide mineral that contains high levels of titanium. In addition to its use as a raw material for chloride-process TiO2 pigment, higher grades of leucoxene are suitable for welding rod flux manufacturing. Zircon Zircon is a primary co-product of heavy mineral sands mining. Zircon is separated from heavy mineral concentrate after being transported to a mineral separation plant or dry mill. A non-magnetic and non-conductive mineral, zircon is used in the production of ceramics, tiles and sanitary ware, refractories, TV screens, computers, and a wide range of industrial and domestic products. High-purity Pig Iron High-purity pig iron is a co-product of the titanium slag smelting process. It is typically low in manganese, phosphorous and sulfur and is sold to foundries as a diluting agent for trace elements and to steel producers for iron units. Activated Carbon Activated carbon is derived as a byproduct of the synthetic rutile reduction kiln in which coal is used as both a fuel and a reductant. Activated carbon is used as an absorbent, decolorizer or deodorizer in water, vapor and gas purification/filtration.

GENERAL STANDARD DISCLOSURES
6
Alkali Natural Soda Ash (sodium carbonate) Soda ash is an essential component in the production of every type of glass such as flat glass for autos, homes and office buildings, container glass for consumer products, lighting, and other uses including glassware, consumer electronics and solar panels. Soda ash is also widely used in soaps, detergents, and other cleaning products. It is an effective component for softening water and provides the sodium source for the production of pharmaceuticals, food preservatives, adhesives, and pulp and paper. Sodium Sesquicarbonate and S-Carb (purified sodium sesquicarbonate) Sodium sesquicarbonate is an alkali used in the manufacturing of a variety of household goods and industrial applications such as bath salts, laundry detergents, mild industrial cleaners, swimming pool pH buffering, and water softening. S-Carb is used for animal nutrition to improve electrolyte balance and improve heat stress tolerance for cattle, poultry, and swine. Sodium Bicarbonate (baking soda) Sodium bicarbonate is used for numerous industrial and consumer applications including abrasive blasting, baked food goods, carbonated beverages, household cleaning and personal hygiene products, pharmaceutical and health care goods, and animal feeds. Caustic Soda Caustic soda, or aqueous sodium hydroxide, is an essential ingredient in the manufacturing of soaps and detergents, textiles, aluminum, chemical neutralizers, bleach and paint removal solutions, pigment, and fuels.

GENERAL STANDARD DISCLOSURES
7
In the 2015 fiscal year, Tronox produced a total of 4.2 million metric tons of products, resulting in net sales of US$2,112 million. A breakdown of the 2014 and 2015 production quantities are presented below.
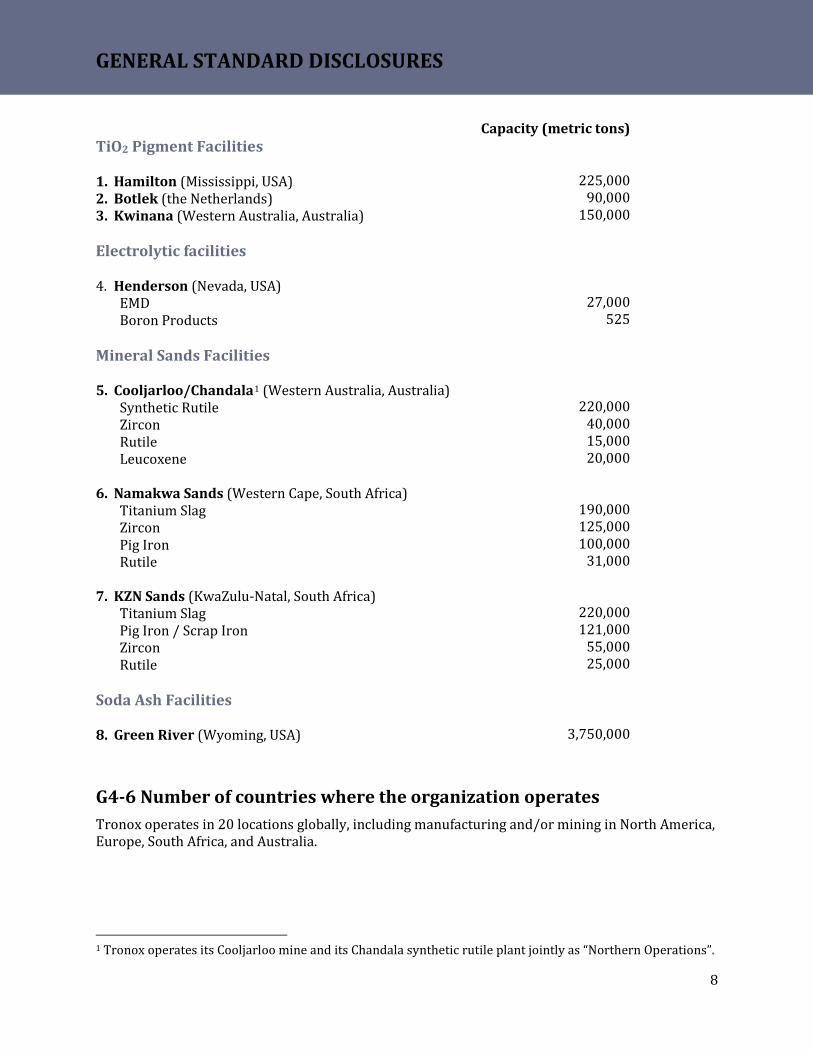
G4-5 Location of the organization’s headquarters Tronox operates manufacturing and mining facilities, research and development labs, and corporate, sales and marketing offices in 20 locations worldwide. The company maintains corporate offices in Australia and the United States, at the locations detailed on the back cover. Our eight primary manufacturing and mining facilities and their associated production capacities are summarized below.
0_
100_
200_
300_
400_
500_
2,400_
2,500_
2,600_
2,700_
thou
sand
s of m
etri
c ton
s
2015 Production by Product Distribution
0
300
600
900
1,200
1,500
1,800
2,100
2,400
2,700
Alkali TiO2
thou
sand
s of m
etri
c ton
s
2014 and 2015 Production by Business
2014
2015
TiO2
GENERAL STANDARD DISCLOSURES
8
TiO2 Pigment Facilities 1. Hamilton (Mississippi, USA) 2. Botlek (the Netherlands) 3. Kwinana (Western Australia, Australia) Electrolytic facilities 4. Henderson (Nevada, USA)
EMD Boron Products
Mineral Sands Facilities 5. Cooljarloo/Chandala1 (Western Australia, Australia)
Synthetic Rutile Zircon Rutile Leucoxene
6. Namakwa Sands (Western Cape, South Africa)
Titanium Slag Zircon Pig Iron Rutile
7. KZN Sands (KwaZulu-Natal, South Africa)
Titanium Slag Pig Iron / Scrap Iron Zircon Rutile
Soda Ash Facilities 8. Green River (Wyoming, USA)
Capacity (metric tons)
225,000 90,000
150,000
27,000 525
220,000 40,000 15,000 20,000
190,000 125,000 100,000
31,000
220,000 121,000
55,000 25,000
3,750,000
G4-6 Number of countries where the organization operates Tronox operates in 20 locations globally, including manufacturing and/or mining in North America, Europe, South Africa, and Australia.
1 Tronox operates its Cooljarloo mine and its Chandala synthetic rutile plant jointly as “Northern Operations”.
GENERAL STANDARD DISCLOSURES
9
G4-7 Nature of ownership and legal form Tronox Limited is a public company registered in the state of Western Australia, Australia under the Corporations Act 2001.
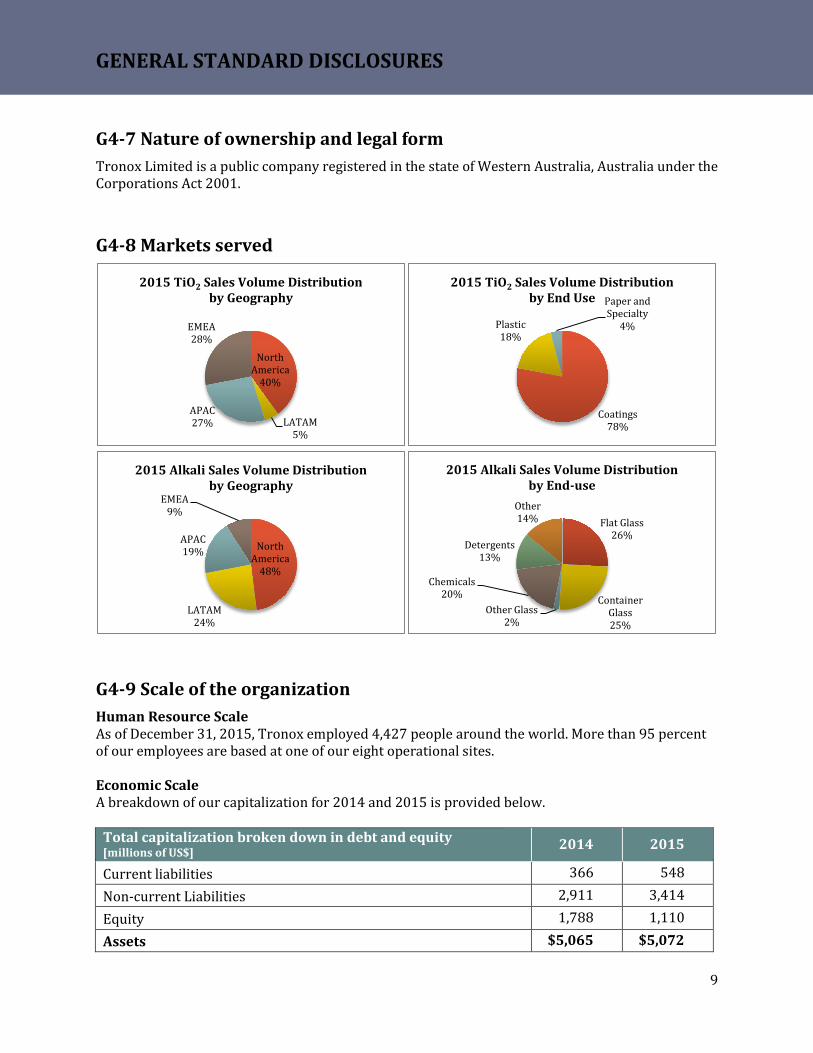
G4-8 Markets served
G4-9 Scale of the organization Human Resource Scale As of December 31, 2015, Tronox employed 4,427 people around the world. More than 95 percent of our employees are based at one of our eight operational sites. Economic Scale A breakdown of our capitalization for 2014 and 2015 is provided below.
Total capitalization broken down in debt and equity [millions of US$] 2014 2015
Current liabilities 366 548 Non-current Liabilities 2,911 3,414 Equity 1,788 1,110 Assets $5,065 $5,072
Coatings 78%
Plastic 18%
Paper and Specialty
4%
2015 TiO2 Sales Volume Distribution by End Use
Flat Glass 26%
Container Glass 25%
Other Glass 2%
Chemicals 20%
Detergents 13%
Other 14%
2015 Alkali Sales Volume Distribution by End-use
North America
48%
LATAM 24%
APAC 19%
EMEA 9%
2015 Alkali Sales Volume Distribution by Geography
North America
40%
LATAM 5%
APAC 27%
EMEA 28%
2015 TiO2 Sales Volume Distribution by Geography

GENERAL STANDARD DISCLOSURES
10
G4-10 Total workforce by employment contract, employment type, and region, broken down by gender
G4-11 Percentage of total employees covered by collective bargaining agreements
G4-12 The organization’s supply chain Tronox mines and manufactures inorganic chemical compounds in the United States, the Netherlands, South Africa, and Australia. The company operates an integrated supply chain to support its two primary businesses, Tronox Alkali and Tronox TiO2, as well as its corporate and administrative functions. Through a “hub and spoke” process, the company is able to leverage economies of scale to supply and produce materials to support our businesses operations and our
Male 83%
Female 17%
Employees by gender (as of December 31, 2015)
0%20%40%60%80%
100%
Indefinite orpermanent
Fixed term ortemporary
Employees by employment contract and gender (as of December 31, 2015)
Female
Male
0%20%40%60%80%
100%
Full-time Part-time
Permanent employees by employment type and gender (as of December 31, 2015)
Female
Male0%
20%40%60%80%
100%
Employees by region and gender (as of December 31, 2015)
Female
Male
Bargaining 54%
Non-bargaining
46%
Percentage of employees covered by collective bargaining agreements
(as of December 31, 2015)

GENERAL STANDARD DISCLOSURES
11
global customers. At the same time, we are able to work with local business partners leading to socio-economic advances in the communities in which we operate. Tronox Supplier Standards Tronox values its partnerships with suppliers and fully recognizes that our mutual success is built on open communication and a commitment to common principles and business practices. The following information summarizes our business standards for a supplier partnership, and our expectations for a shared commitment to quality, excellence, safety, and sustainable business practices. Compliance & Corporate Responsibility
• Conduct all business in an honest and ethical manner • Meet and document compliance of all applicable regulatory and statutory requirements,
including the U.S. Foreign Corrupt Practices Act (FCPA) and U.K. Bribery Act • Ensure that all third parties and subcontractors are in full compliance with contractual
agreements and compliance requirements • Inform Tronox of any changes affecting compliance with applicable regulations and partner
to resolve mutual concerns that impact our business relationship • Fully comply with all terms and conditions in contractual agreements and purchase orders • Adhere to non-disclosure agreements and protect the confidentiality of Tronox information • Demonstrate and actively work to improve a sustainable business, including a clear
commitment to a safe workplace and environmental stewardship to reduce our shared supply chain footprint
Communications • Promptly notify Tronox of changes to goods or services that may adversely impact our
product usage and/or business relationship • Inform Tronox in advance of any plans to discontinue goods or services • Do not accept specifications or requirements that you cannot meet • Respond to requests for information, technical assistance and corrective action in a timely
manner • Ensure that all Tronox locations are promptly serviced professionally and to the highest
customer service standards • Channel communications through designated Tronox procurement and supply chain
representatives • Openly share information on all elements of cost and partner to reduce costs together • When requested, share sustainability and related data and, if necessary, cooperate in a
sustainability audit • Participate in periodic review sessions to improve processes
Quality & Innovation
• Maintain a documented quality system that utilizes process controls and emphasizes defect prevention rather than defect detection
• Strive for continuous improvement in quality of goods and services in all facets of operations
• Provide goods, services or innovations that give Tronox a technical, process or service advantage over our competition

GENERAL STANDARD DISCLOSURES
12
• Partner with Tronox to develop process improvements and new applications • Research and implement productivity improvements that result in lower costs every year • Provide ideas and solutions that will drive down the total cost for goods and services
On-Time Delivery
• Keep commitments to deliver on time to the right location in the right quantity at the right time
• Comply with purchase order and contract requirements regarding schedules and deliveries for goods and services
Effective Use of Electronic Commerce • Support Tronox in improving efficiency of interaction including utilization of e-Sourcing,
e-Invoicing and other tools • Ensure that all transactions and documents contain purchase order numbers and reference
numbers where applicable • Participate, when applicable, in the construction of parts catalogs to automate the procure-
to-pay process. Finally, the Tronox Code of Ethics and Business Conduct (“Code of Conduct”) specifically addresses child labor/forced labor, and we hold our suppliers to the same standard:
We are opposed to any form of child labor and forced or compulsory labor. It is Tronox policy to prohibit child labor or the use of forced or compulsory labor in our workplaces and we expect our suppliers and contractors to do the same.
G4-13 Significant changes during the reporting period Tronox acquired the Alkali Chemicals business from FMC Corporation in April 2015, and in connection with that acquisition we redefined our business segments. In 2014 we operated with Pigment and Mineral Sands segments, plus a Corporate segment that included our Electrolytic operations. Following the Alkali acquisition, we combined Pigment, Mineral Sands and our Electrolytic operations into a new TiO2 segment, and we manage the Alkali business as a second, distinct segment. All 2015 data presented in this report includes the TiO2 segment (full year), and the Alkali segment (included from the date of the acquisition, April 1, 2015), unless indicated otherwise.

GENERAL STANDARD DISCLOSURES
13
G4-14 Explanation of whether and how the precautionary approach or principle is addressed Tronox supports the precautionary approach to evaluate and address potential environmental impacts, reflected in the Tronox Code of Conduct, which integrates our commitment to core values: • Health & Safety: We work safely – all the time.
We believe passionately that everyone at Tronox should experience a safe and healthy workplace. We proactively identify and manage risk, conduct ourselves responsibly, exercise good judgment and take responsibility for our actions.
• Responsibility: We care for our environment and our communities. We are responsible citizens, as a company and as individuals. We are stewards of our environment and active in our communities.
• People: People are our most important resource. We create opportunities for development and act intentionally to create a diverse and supportive work environment. Each of us is committed to personal growth and development, embraces change, and learns from our successes and mistakes in order to create a high-performance culture.
• Teamwork: We will win – as a team. We collaborate effectively, communicate openly, engage honestly, treat others respectfully, and make informed decisions.
• Customers: It really is all about the customer. Our collective purpose is to create and sell differentiated and competitive products and services, and to make it easy for our customers -- internal and external -- to do business with us.
• Results: We measure, own and deliver results. We encourage creativity and measure results. We set clearly defined and challenging objectives; we own those objectives, and we deliver results, with a relentless focus on operational excellence. We innovate our processes to continuously deliver better results.
Every Tronox owned-and-operated facility must comply with the company’s safety, health and environmental policies, and demonstrate compliance with all applicable safety, health, environmental and security laws pertaining to its operations. Each employee is expected to play a critical role in ensuring the quality and safety of Tronox products, from design through manufacturing, ongoing improvements, and customer support. Tronox implements these requirements through (i) management and employee engagement, (ii) allocation of sufficient human and capital resources, and (iii) rigorous measurement, review and corrective action systems. Advancing our safety, health and environmental policies is an integral part of the company’s commitment to ethical business conduct, and we have a steadfast commitment to the safety and health of our employees, those that visit our operations, and the surrounding communities in which we live and work. We maintain an equal commitment to environmental stewardship and sustainable business practices. We work with our global business partners so they can meet our standards and we provide information and assistance on how to do so.

GENERAL STANDARD DISCLOSURES
14
We have established a corporate responsibility committee, consisting of the executive committee of Tronox Limited and reporting to the corporate governance committee of the Board of Directors of Tronox Limited, to assess the company’s overall compliance with applicable law and the Code of Conduct. The Committee oversees the compliance training program and considers the appropriate response to significant compliance matters and legal developments. Any employee who learns of a suspected violation of the Code of Conduct must immediately report it by following defined procedures. Employees are required to come forward with any such information without regard to the identity or position of the suspected offender. Tronox will treat the information in a confidential manner and will ensure that no acts of retribution or retaliation will be taken against anyone for making a report in good faith.
G4-15 Externally developed economic, environmental and social charters, principles, or other initiatives Our South African operations annually publish the South African Mining Charter Scorecard. This Scorecard measures their progress against the Broad-Based Black Economic Empowerment criteria, posed by the Department of Mineral Resources in South Africa. At the date of publication of this report the 2015 Scorecard was not yet available. Once available, the Scorecards will be published on the Tronox website www.tronox.com.
G4-16 Memberships of associations and national or international advocacy organizations • Industrial Minerals Association - North America
• European Chemical Industry Council (Cefic)
o Titanium Dioxide Manufacturers Association (TDMA)
GENERAL STANDARD DISCLOSURES
15
Identified Material Aspects and Boundaries
G4-17 Entities included in the organization’s consolidated financial statements or equivalent documents In 2015, the company had two reportable operating segments: TiO2 and Alkali. This reflects a change from 2014, when we operated with Pigment and Mineral Sands segments, plus a Corporate segment that included our electrolytic operations. In connection with the acquisition of the Alkali business from FMC Corporation on April 1, 2015, we redefined our segments, and combined Pigment, Mineral Sands and our electrolytic operations into a new TiO2 segment.
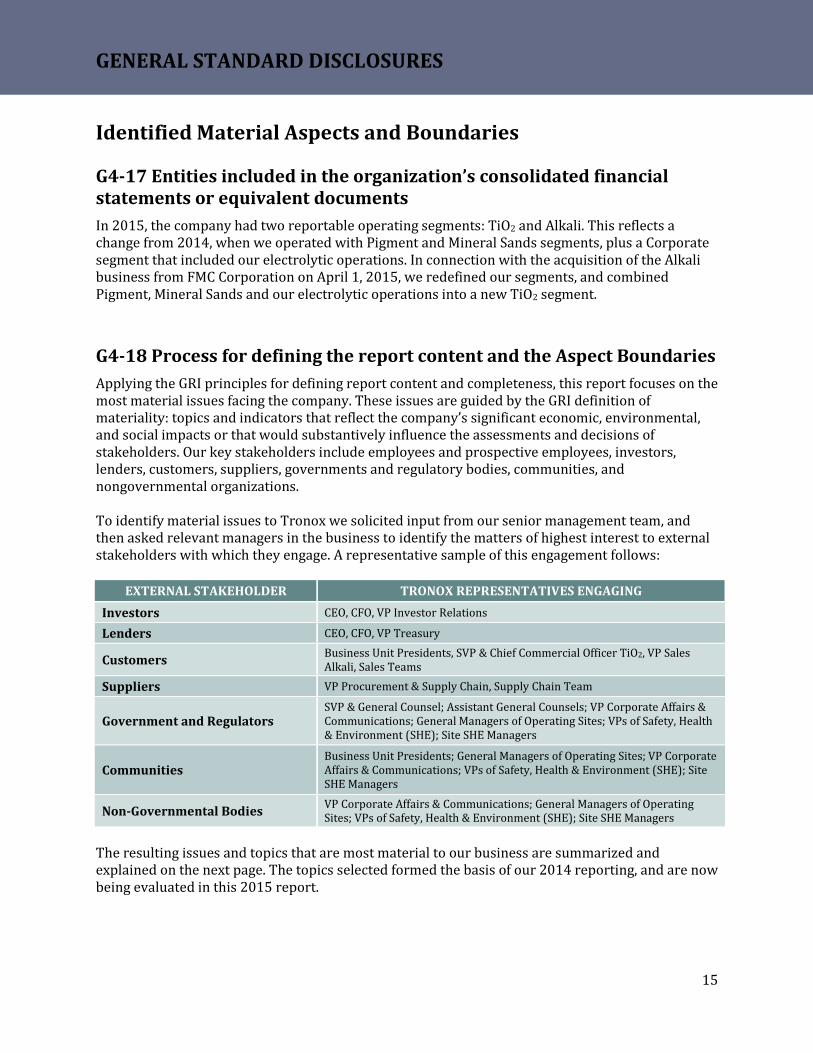
G4-18 Process for defining the report content and the Aspect Boundaries Applying the GRI principles for defining report content and completeness, this report focuses on the most material issues facing the company. These issues are guided by the GRI definition of materiality: topics and indicators that reflect the company’s significant economic, environmental, and social impacts or that would substantively influence the assessments and decisions of stakeholders. Our key stakeholders include employees and prospective employees, investors, lenders, customers, suppliers, governments and regulatory bodies, communities, and nongovernmental organizations. To identify material issues to Tronox we solicited input from our senior management team, and then asked relevant managers in the business to identify the matters of highest interest to external stakeholders with which they engage. A representative sample of this engagement follows:
EXTERNAL STAKEHOLDER TRONOX REPRESENTATIVES ENGAGING Investors CEO, CFO, VP Investor Relations
Lenders CEO, CFO, VP Treasury
Customers Business Unit Presidents, SVP & Chief Commercial Officer TiO2, VP Sales Alkali, Sales Teams
Suppliers VP Procurement & Supply Chain, Supply Chain Team
Government and Regulators SVP & General Counsel; Assistant General Counsels; VP Corporate Affairs & Communications; General Managers of Operating Sites; VPs of Safety, Health & Environment (SHE); Site SHE Managers
Communities Business Unit Presidents; General Managers of Operating Sites; VP Corporate Affairs & Communications; VPs of Safety, Health & Environment (SHE); Site SHE Managers
Non-Governmental Bodies VP Corporate Affairs & Communications; General Managers of Operating Sites; VPs of Safety, Health & Environment (SHE); Site SHE Managers
The resulting issues and topics that are most material to our business are summarized and explained on the next page. The topics selected formed the basis of our 2014 reporting, and are now being evaluated in this 2015 report.
GENERAL STANDARD DISCLOSURES
16
We welcome feedback from stakeholders on our report content, and further request that matters of additional interest that are not covered here be communicated to Tronox via the appropriate communication channels described under G4-31 on page 19.
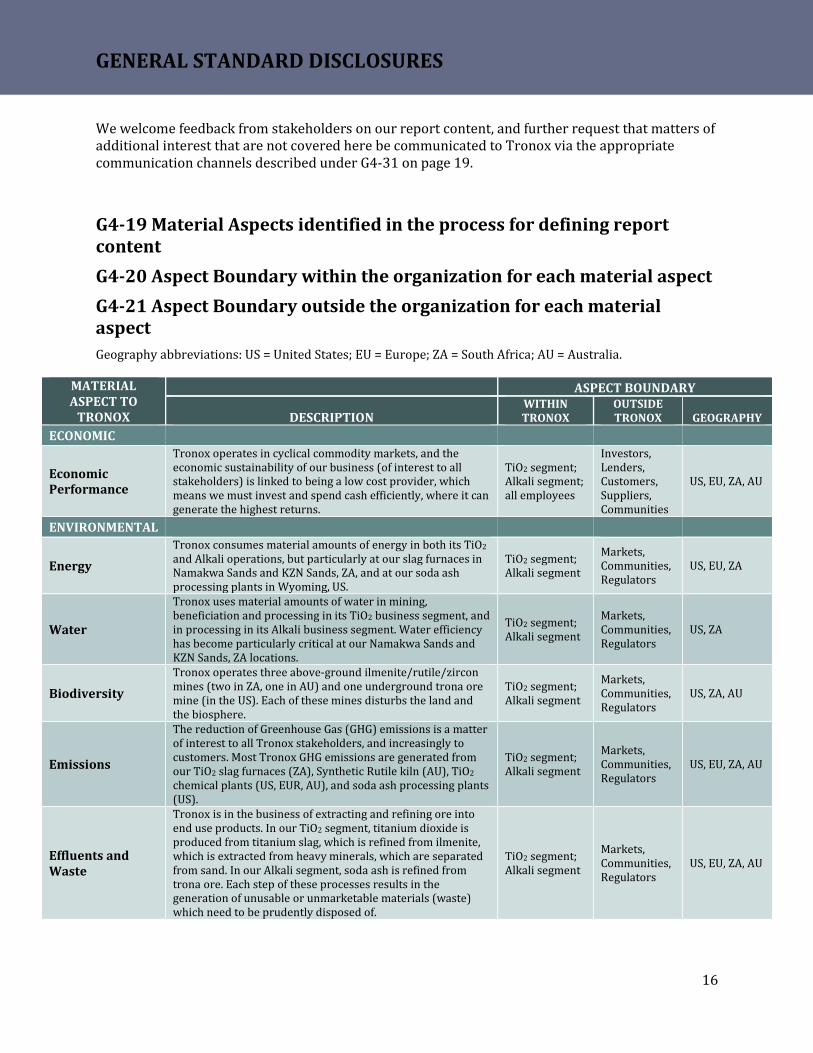
G4-19 Material Aspects identified in the process for defining report content G4-20 Aspect Boundary within the organization for each material aspect G4-21 Aspect Boundary outside the organization for each material aspect Geography abbreviations: US = United States; EU = Europe; ZA = South Africa; AU = Australia.
MATERIAL ASPECT TO
TRONOX
ASPECT BOUNDARY
DESCRIPTION WITHIN TRONOX
OUTSIDE TRONOX GEOGRAPHY
ECONOMIC
Economic Performance
Tronox operates in cyclical commodity markets, and the economic sustainability of our business (of interest to all stakeholders) is linked to being a low cost provider, which means we must invest and spend cash efficiently, where it can generate the highest returns.
TiO2 segment; Alkali segment; all employees
Investors, Lenders, Customers, Suppliers, Communities
US, EU, ZA, AU
ENVIRONMENTAL
Energy Tronox consumes material amounts of energy in both its TiO2 and Alkali operations, but particularly at our slag furnaces in Namakwa Sands and KZN Sands, ZA, and at our soda ash processing plants in Wyoming, US.
TiO2 segment; Alkali segment
Markets, Communities, Regulators
US, EU, ZA
Water
Tronox uses material amounts of water in mining, beneficiation and processing in its TiO2 business segment, and in processing in its Alkali business segment. Water efficiency has become particularly critical at our Namakwa Sands and KZN Sands, ZA locations.
TiO2 segment; Alkali segment
Markets, Communities, Regulators
US, ZA
Biodiversity Tronox operates three above-ground ilmenite/rutile/zircon mines (two in ZA, one in AU) and one underground trona ore mine (in the US). Each of these mines disturbs the land and the biosphere.
TiO2 segment; Alkali segment
Markets, Communities, Regulators
US, ZA, AU
Emissions
The reduction of Greenhouse Gas (GHG) emissions is a matter of interest to all Tronox stakeholders, and increasingly to customers. Most Tronox GHG emissions are generated from our TiO2 slag furnaces (ZA), Synthetic Rutile kiln (AU), TiO2 chemical plants (US, EUR, AU), and soda ash processing plants (US).
TiO2 segment; Alkali segment
Markets, Communities, Regulators
US, EU, ZA, AU
Effluents and Waste
Tronox is in the business of extracting and refining ore into end use products. In our TiO2 segment, titanium dioxide is produced from titanium slag, which is refined from ilmenite, which is extracted from heavy minerals, which are separated from sand. In our Alkali segment, soda ash is refined from trona ore. Each step of these processes results in the generation of unusable or unmarketable materials (waste) which need to be prudently disposed of.
TiO2 segment; Alkali segment
Markets, Communities, Regulators
US, EU, ZA, AU
GENERAL STANDARD DISCLOSURES
17
MATERIAL ASPECT TO
TRONOX
ASPECT BOUNDARY
DESCRIPTION WITHIN TRONOX
OUTSIDE TRONOX GEOGRAPHY
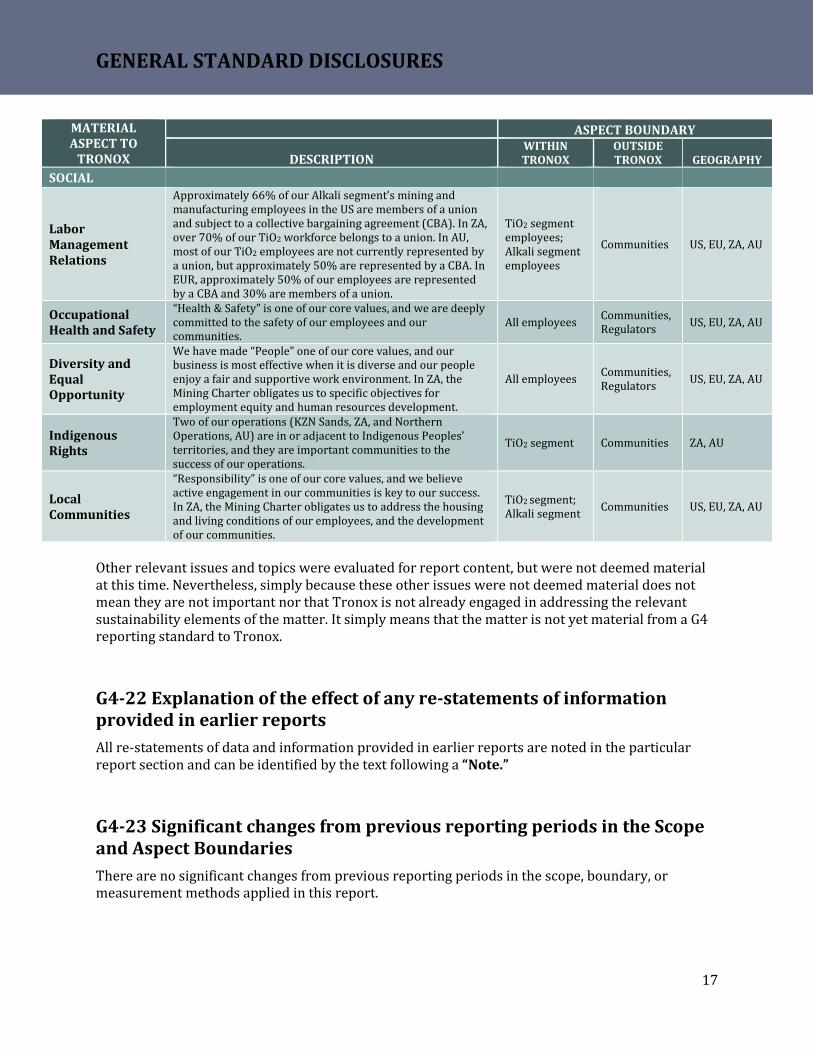
SOCIAL
Labor Management Relations
Approximately 66% of our Alkali segment’s mining and manufacturing employees in the US are members of a union and subject to a collective bargaining agreement (CBA). In ZA, over 70% of our TiO2 workforce belongs to a union. In AU, most of our TiO2 employees are not currently represented by a union, but approximately 50% are represented by a CBA. In EUR, approximately 50% of our employees are represented by a CBA and 30% are members of a union.
TiO2 segment employees; Alkali segment employees
Communities US, EU, ZA, AU
Occupational Health and Safety
“Health & Safety” is one of our core values, and we are deeply committed to the safety of our employees and our communities.
All employees Communities, Regulators US, EU, ZA, AU
Diversity and Equal Opportunity
We have made “People” one of our core values, and our business is most effective when it is diverse and our people enjoy a fair and supportive work environment. In ZA, the Mining Charter obligates us to specific objectives for employment equity and human resources development.
All employees Communities, Regulators US, EU, ZA, AU
Indigenous Rights
Two of our operations (KZN Sands, ZA, and Northern Operations, AU) are in or adjacent to Indigenous Peoples’ territories, and they are important communities to the success of our operations.
TiO2 segment Communities ZA, AU
Local Communities
“Responsibility” is one of our core values, and we believe active engagement in our communities is key to our success. In ZA, the Mining Charter obligates us to address the housing and living conditions of our employees, and the development of our communities.
TiO2 segment; Alkali segment Communities US, EU, ZA, AU
Other relevant issues and topics were evaluated for report content, but were not deemed material at this time. Nevertheless, simply because these other issues were not deemed material does not mean they are not important nor that Tronox is not already engaged in addressing the relevant sustainability elements of the matter. It simply means that the matter is not yet material from a G4 reporting standard to Tronox.
G4-22 Explanation of the effect of any re-statements of information provided in earlier reports All re-statements of data and information provided in earlier reports are noted in the particular report section and can be identified by the text following a “Note.”
G4-23 Significant changes from previous reporting periods in the Scope and Aspect Boundaries There are no significant changes from previous reporting periods in the scope, boundary, or measurement methods applied in this report.

GENERAL STANDARD DISCLOSURES
18
Stakeholder Engagement
G4-24 List of stakeholder groups engaged by the organization Tronox engages a number of external and internal stakeholder groups, including the communities in which we live and work, business partners, community and tribal leaders, and employees. In addition, we engage with a number of regional or international not-for-profit and advocacy organizations.
G4-25 Basis for identification and selection of stakeholders with whom to engage Stakeholders are identified based on active community outreach and engagement activities at all Tronox business operations worldwide.
G4-26 Approach to stakeholder engagement We are a diverse global company and as such our approach to stakeholder engagement is determined at the local, regional and corporate levels, as appropriate. Operating under our Code of Conduct and adhering to our corporate citizenship principles and guidelines, each operating site determines the frequency and level of interaction with local stakeholders. Our corporate affairs and investor relations teams conduct routine communications with key external stakeholders and shareholders.
G4-27 Key topics and concerns that have been raised through stakeholder engagement Stakeholder engagement is an integral component of the Tronox business strategy. In 2014, based on feedback from relevant constituents, the company developed and implemented comprehensive programs in areas such as:
• Health & Safety; • Suppliers and business partner standards; • Community-based initiatives that support STEM education (Science, Technology,
Engineering and Mathematics), environmental awareness, health and sanitary concerns, and equal rights and empowerment;
• Reducing waste and lowering our carbon footprint; and, • Investing in skills training and development curricula for our workforce.
GENERAL STANDARD DISCLOSURES
19
Report Profile
G4-28 Reporting period The reporting period is based on a fiscal year, which at Tronox coincides with a calendar year: January 1 to December 31.
G4-29 Date of most recent previous report The most recent report, which is the Tronox Limited 2014 Global Reporting Initiative Report, was published on September 30, 2015.
G4-30 Reporting cycle The reporting cycle of Tronox GRI Reports is on an annual basis.
G4-31 Contact point for questions regarding the report or its contents Questions regarding the report or its contents can be communicated with the Tronox Limited Corporate Affairs & Communications department: 263 Tresser Boulevard Suite 1100 Stamford, CT, USA 06901 T: +1-203-705-3800 E: [email protected] W: www.tronox.com
G4-32 Explanation of the “in accordance” option chosen This GRI Report was produced in accordance with the GRI G4 Sustainability Reporting Guidelines, at the “Core” level. See also the introduction on page 2. The location of the General Standard Disclosures and Performance Indicators in this report can be found in the GRI Index, presented on page 46.
G4-33 Policy and current practice with regard to seeking external assurance for the report Although no external assurance was obtained for the development of this report, Tronox has followed the GRI 4 “Reporting Principles” regarding (i) defining report content, and (ii) ensuring the quality of reported information.

GENERAL STANDARD DISCLOSURES
20
The environmental data in this report is subject to internal audits in line with our Environmental Management Systems, and external audits in connection with ISO 14001 certification requirements, with which the majority of our operations are compliant. In this report a total of 15 indicators are reported. We also included three indicators from the Mining and Metals Sector Supplement. Governance
G4-34 Governance structure of the organization The company’s business and affairs are managed by a multinational executive management team under the oversight of the Tronox Board of Directors, which is comprised of nine members. Six Directors are elected annually by a vote of Class A common stock holders. Three of its Directors are elected annually by Class B Shareholders. The listing standards of the New York Stock Exchange (NYSE), as well as our Corporate Governance Guidelines, require that a majority of our Board of Directors be comprised of independent directors. Our Board has affirmatively determined that eight of the nine current directors are independent. The Board’s Role in Risk Oversight The Board of Directors administers its risk oversight function directly and through its various committees. The Board’s role in the company’s risk oversight process includes receiving regular reports from members of senior management on areas of material risk to the company, including operational, financial, competitive, management retention, and legal risks. The Board of Directors routinely discusses with senior management major risk exposures, their potential financial impact, and steps taken (both short-term and long-term) to manage them. In 2012, the Board of Directors established three committees: corporate governance; human resources and compensation; and audit. Each committee is governed by a written charter. A current copy of each charter is available to our shareholders at www.tronox.com. The audit committee assists the Board of Directors in fulfilling its oversight responsibilities with respect to the areas of financial reporting, internal controls and compliance with legal and regulatory requirements, and, in accordance with NYSE requirements, discusses policies with respect to risk assessment and risk management and their adequacy and effectiveness. The audit committee routinely discusses with senior management and an independent registered public accounting firm any financial risk exposures, including risks related to financial reporting, tax, accounting, disclosure, internal control over financial reporting, financial policies and credit and liquidity matters, steps taken to manage those exposures and the company’s risk tolerance in relation to its overall strategy. In addition, the company has a nominating committee which is a subcommittee of the corporate governance committee. Each such committee is governed by a written charter, and a current copy of each such charter is available to our shareholders at www.tronox.com.

GENERAL STANDARD DISCLOSURES
21
As noted earlier in G4-14, also reporting to the corporate governance committee is the Tronox corporate responsibility committee, consisting of the executive committee of Tronox Limited. The corporate responsibility committee assesses the company’s overall compliance with applicable law and the Tronox Code of Conduct, which defines obligations for ethical behavior and corporate responsibility by Tronox employees, directors, suppliers, contractors and other related parties. During the fiscal year ended December 31, 2015, there were nine meetings held by the audit committee, four meetings held by the human resources and compensation committee, and three meetings held by the corporate governance committee. The nominating subcommittee held one meeting in 2015. The table below provides current membership and fiscal year 2015 meeting information for each of the Board committees.
NAME AUDIT HUMAN RESOURCES
AND COMPENSATION CORPORATE
GOVERNANCE NOMINATING SUB
COMMITTEE Thomas Casey* Daniel Blue • • •
Andrew P. Hines Δ
Wayne A. Hinman • Δ Δ Peter Johnston • • Ilan Kaufthal • • • • Jeffry N. Quinn Δ
* Chairman of the Board
Δ Chair
• Member
G4-56 Values, principles, standards and norms of behavior We are building a lasting foundation for growth around the six core values of Tronox: Health & Safety; Responsibility; People; Teamwork; Customers; and, Results, described more extensively under G4-14. These values define our approach to business and corporate citizenship. The Tronox Code of Conduct applies to all employees worldwide. The Code of Conduct consolidates all company policies with respect to business ethics and conflict of interest. The company has also adopted business standards and principles for all of its global business partners and suppliers.

PERFORMANCE INDICATORS ECONOMIC
22
Disclosure on Management Approach – Economic (All monetary figures are in US Dollars unless otherwise noted.) Tronox stakeholders, including investors, lenders, governments and regulators, customers, employees, suppliers and communities, have a clear preference for a business that is economically sustainable. An economically sustainable business is one that is using its resources efficiently and responsibly so that the business can operate indefinitely. Two core elements of economic sustainability are (i) generating sufficient cash profits to satisfy our providers of debt and equity capital, and (ii) spending resources in such a way as to satisfy all our other stakeholders and retain our license to operate. GRI Sustainability Guidelines identify four aspects of Economic Disclosures that may be material to an organization, of which Tronox has identified Economic Performance as the only material aspect to its stakeholders, using G4-EC1 as the Performance Indicator. Economic Performance Given that Tronox principally operates in commodity markets, the economic sustainability of our business is linked to being a low-cost provider, which mean we must invest and spend cash efficiently, where it can generate the highest returns. Our annual 10-K report, filed with the U.S. SEC and available on the tronox.com website, is the primary mechanism we use to report our economic performance, and should be read in conjunction with this report. The EC1 indicator we report here is intended to measure the economic outcomes of our activities, and the effects of those outcomes on our stakeholders. Tronox sells a range of commodity products, including titanium dioxide pigment, titanium feedstock, zircon, rutile, pig iron and soda ash. Prices for those products typically cycle upwards when supply is constrained and/or demand is high, and then cycle downwards when supply expands and/or demand decreases. In our 2015 10-K report we noted that, “Throughout 2015, selling prices for TiO2 pigments and some feedstock continued to decline to what we consider to be unsustainable levels. In response, and to position Tronox for long-term success and growth in the years ahead, the company took several significant steps to improve our overall financial performance. We initiated a broad program to reduce unnecessary spending and free up cash where we could.” We reported that the company exceeded its full-year 2015 targets for cash generated by these measures, delivering cash from cost and working capital reductions. We ended the year with $229 million of cash and equivalents and $530 million of total liquidity – a strong position in a weak market. Another action we took during the year to enhance our long-term sustainability was our acquisition of the Alkali Chemicals business from FMC Corporation, the world’s largest producer of natural soda ash. The relatively strong and stable year-over-year performance of this business serves as a counter-balance to our more cyclical TiO2 business. Subsequent to the end of the year we announced a reduction in our quarterly dividend from $0.25 per share to $0.045 per share beginning with the first quarter of 2016. This will result in a material reduction in cash paid to providers of equity capital in 2016.

PERFORMANCE INDICATORS ECONOMIC
23
G4-EC1 Direct economic value generated and distributed This indicator reflects the economic value generated2 (including community investment), distributed3, and retained4 during the fiscal year of 2015. The data includes the Tronox TiO2 business (full year), and the Tronox Alkali business (included from the date of the acquisition; April 1, 2015).
2 Direct economic value generated reflects net sales plus revenues from financial investments and sales of assets. 3 Economic value distributed reflects the sum of: (i) operating costs (payments to suppliers, non-strategic investments, royalties, and facilitation payments); (ii) employee wages and benefits (total monetary outflows for employees); (iii) payments to providers of capital (all financial payments made to the providers of capital); (iv) payments to governments (all company taxes, but not deferred taxes); and (v) community investments (voluntary donations, contributions and investment of funds in the community). 4 Economic value retained is direct economic value generated less economic value distributed.
$0
$500
$1,000
$1,500
$2,000
$2,500
2013 2014 2015
Mill
ions
Direct Economic Value Generated
Direct economicvalue generated
71.3%
28.4%
0.3%
2015 Components of Economic Value Generated
TiO2
Alkali
Interest Income
$0
$500
$1,000
$1,500
$2,000
$2,500
2013 2014 2015
Mill
ions
Economic Value Distributed
Economic valuedistributed
65.8% 18.9%
13.0% 2.2% 0.1%
2015 Components of Economic Value Distributed
Operating costs
Employee wages andbenefitsPayments to providersof capitalPayments togovernmentCommunity investments
-$200
-$150
-$100
-$50
$0
$50
$100
2013 2014 2015
Mill
ions
Economic Value Retained
Economic valueretained
$0
$500
$1,000
$1,500
$2,000
$2,500
2013 2014 2015
Thou
sand
s
Community Investment
Communityinvestment
TiO2

PERFORMANCE INDICATORS ENVIRONMENT
24
Disclosure on Management Approach – Environment Our business, mining and chemicals processing, is by definition disruptive to the environment. Among other activities, we disturb the ground to extract minerals and ore, we employ water in mineral separation, we burn carbon when we beneficiate ilmenite into titanium slag or synthetic rutile in our furnaces/kiln, we consume large amounts of energy in soda ash evaporators, we generate various emissions from our titanium dioxide pigment and soda ash plants, and we dispose of waste tailings. The Tronox Code of Conduct holds managers and employees responsible for: • Pursuing a business strategy that builds on sustainable innovation, operations and business
practices as we seek to grow our businesses and improve the quality of people’s lives everywhere;
• Openly conducting our business in a manner that is protective of public and occupational health, the environment and employee safety;
• Giving environmental considerations priority in manufacturing our products and planning for new products, facilities and processes;
• Complying with all environmental laws and regulations; • Striving to reduce emissions and waste, and use energy and natural resources efficiently as we
grow; • Actively soliciting constructive discussions with our employees, suppliers, customers,
neighbors and shareholders on managing environmental issues to ensure continuous improvement, and;
• Supporting the principles of responsible environmental stewardship as embodied in voluntary standards and management systems appropriate to our operations around the world, by working with our employees, suppliers, customers, contractors and commercial partners to promote responsible management of our products and processes through their entire life cycle, and for their intended end use, worldwide.
We implement these standards through management and employee engagement, allocation of sufficient human and capital resources, and rigorous measurement, review and corrective action systems. Tronox has determined that five of the 12 environmental aspects identified in the GRI Sustainability Guidelines are material to its stakeholders: • Energy (G4-EN3, G4-EN5) • Water (G4-EN8) • Biodiversity (G4-EN13, G4-MM1) • Emissions (G4-EN15, G4-EN16, G4-EN18) • Effluents and Waste (G4-EN23) Within these aspects we report on Environmental Indicators that cover performance related to both inputs (e.g., energy, water) and outputs (e.g., emissions, waste).

PERFORMANCE INDICATORS ENVIRONMENT
25
Energy The production of high-quality Mineral Sands, TiO2, and Alkali products are associated with considerable energy consumption demand. Energy availability issues therefore have a direct impact on operational efficiency at all locations. Also, energy consumption for mining and manufacturing operations is the primary driver of greenhouse gas (GHG) emissions. Proper management of energy consumption is therefore required in order to mitigate our impact on the local environment and on the climate. In 2015 Tronox TiO2 launched a multi-year operational excellence initiative that, among other things, addressed our energy demand. Energy efficiency improvements include, but are not limited to, process control automation, heating and cooling optimization, and insulation measures, at all locations. Tronox also invests in efficient energy generation options, the reuse of process emissions, and renewable energy sources. Examples include: the combined heat and power plant that generates electricity and steam for the Kwinana TiO2 Pigment Plant; the carbon monoxide (CO) gas facility that reuses CO gas formed during the furnace smelting operations at KZN Sands; the cogeneration plant that utilizes previously flared furnace gases to fuel eight General Electric Jenbacher gas-fired engines for electricity production at Namakwa Sands; and the consumption of renewable electricity from the hydroelectric Hoover Dam in Nevada, USA, satisfying 100 percent of Henderson’s electricity needs. Water Tronox realizes that fresh water is not an infinite resource. In fact, only 2.5 percent of all the water on Earth is considered fresh water, of which the majority is stored in glaciers and ice caps.5 We therefore focus on “fit-for-purpose” water. In this way we are matching water of a certain quality to a use appropriate for that quality, reducing our reliance on municipal water around the world. A good example of fit-for-purpose water can be found at the Mine and Mineral Separation Plant (MSP) of our Namakwa Sands Operations in South Africa, where 86 percent of total water consumption is sea water. This low quality water is sufficient for use in the concentration processes of heavy mineral sands in the Primary and Secondary Concentration Plants. At our Botlek Operations in the Netherlands, an even higher total of 95 percent of water demand is satisfied by the use of low quality brackish water from the adjacent river. At Kwinana, Western Australia, in the past ten years a large portion of municipal water has been replaced with high-quality industrial-grade water from the Kwinana Water Reclamation Plant (KWRP). The KWRP recycles industrial waste water and provides water at varying levels of quality to neighboring industries. Currently a project is investigating additional uses of water supplied by the KWRP, reducing Kwinana’s dependency on municipal water even further. Additional to our focus on fit-for-purpose water, Tronox relies on multiple water reuse and recycling systems to make sure scarce fresh water can be allocated as efficiently as possible. We also collect and consume rain water at our Green River, Wyoming, USA and KZN Sands, South Africa operations.
5 United States Geological Surveys (USGS) (2016). The World’s Water. Available on the world wide web: <http://water.usgs.gov/edu/earthwherewater.html>

PERFORMANCE INDICATORS ENVIRONMENT
26
Biodiversity Tronox operates three above-ground ilmenite/rutile/zircon mines (two of which are in South Africa, one in Australia) and one underground trona ore mine (in the United States). Activities at our mines may disturb local ecosystems which could have lasting impacts on biodiversity in the region. It is our mission to mitigate any impact from mining and beneficiation to make sure designated ecosystems are protected, restored and able to thrive in the long term. Intensive specialist studies have been conducted as part of Environmental Management Programs (EMPs) and Environmental Impact Assessments, to determine areas for mining and development, as well as for restricted areas. Rehabilitation measures have been included in the EMPs, Rehabilitation Guidelines, and Procedures, and are integrated in our way of doing business. These measures are monitored and reported on a consistent basis to ensure that closure objectives are met. In case rehabilitation of land is more effective in areas other than the affected land, Tronox identifies offset areas, such as the 12 hectare (30 acre) wetland area close to the KZN Sands’ Fairbreeze Mine in South Africa. The offset commitment made by Tronox was to restore the historical biodiversity functions of the targeted wetlands, which would not only benefit the site but also improve water quality and quantity to the Siyaya River. Our Green River, Wyoming, USA operations work closely with state and federal agencies to review opportunities to protect wildlife habitat and to replace or enhance Greater Sage-Grouse habitat to the degree that environmental conditions allow. Tronox Alkali’s reclamation and habitat protection efforts have been recognized by the US Bureau of Land Management and the Wyoming Department of Environmental Quality (see also G4-EN13/MM1 on page 31). At Northern Operations in Western Australia, Tronox has implemented plans to eradicate invasive flora, including Phytophthora Cinnamomi (Dieback), in order to protect indigenous plant species on the site. Emissions The reduction of GHG emissions is a matter of interest to all Tronox stakeholders, and increasingly to customers. GHGs absorb and emit radiation in the atmosphere and are the fundamental cause of the greenhouse effect. Most Tronox GHG emissions are generated from our four TiO2 slag furnaces (ZA), a synthetic rutile kiln (AU), three TiO2 chemical plants (US, EU, AU), soda ash processing plants (US), and (fugitive) emissions from our trona ore mine (US). GHG emissions are a direct result of the combustion of fossil fuels. The energy efficiency improvements that are a key element of our operational excellence initiative described above, directly improves our performance from a GHG emissions point of view. In addition, we employ strategies to minimize high-carbon content energy sources where possible (for example, favoring natural gas delivered by pipeline versus coal transported by truck). The amount of GHG emissions (measured in CO2-equivalents) is often used as a measure for environmental sustainability. Tronox, as a member of the TDMA, has contributed to a cradle-to-gate analysis that mapped the carbon footprint of its TiO2 operations. This analysis was later expanded to a full-size life cycle assessment, of which the carbon footprint is just one of 16 parameters
PERFORMANCE INDICATORS ENVIRONMENT
27
measured in the process. The results from these studies will be used to engage with supply chain partners to advance product life cycle sustainability. Effluents and Waste All Tronox waste is strictly managed according to local waste management procedures that are based on the principles of cradle-to-grave waste management. We ensure that all waste leaving our sites is labeled, weighed, and only handled by contracted and/or authorized service providers. Waste processed on-site is either used to fill and contour mined out areas (overburden and waste rock), deposited in sedimentation lagoons (tailings), or placed in specifically designed landfill pits (hazardous and non-hazardous waste). At the Tronox Alkali Green River facility in Wyoming, USA, process and cooling waters are captured in an on-site evaporation lake. The water quality in this lake is monitored and managed in such a way that the water can be reused in Green River’s processes. The outcome of this is an operation without discharge of process water to surface water. The Henderson, Nevada, USA electrolytic plant also maintains a zero discharge operation, which uses two waste recovery distillation systems to recover clean distillate from process wastewater. Tronox continuously aims to find alternatives for waste streams. For example, the Tronox Botlek pigment plant in the Netherlands partners with local industries to research the application of filter cake (currently land filled) in concrete. Also, roundtable sessions should result in new destinations for waste streams including sulfuric acid and hydrochloric acid. The Kwinana plant in Australia already manages to provide hydrochloric acid suitable for use in swimming pools.
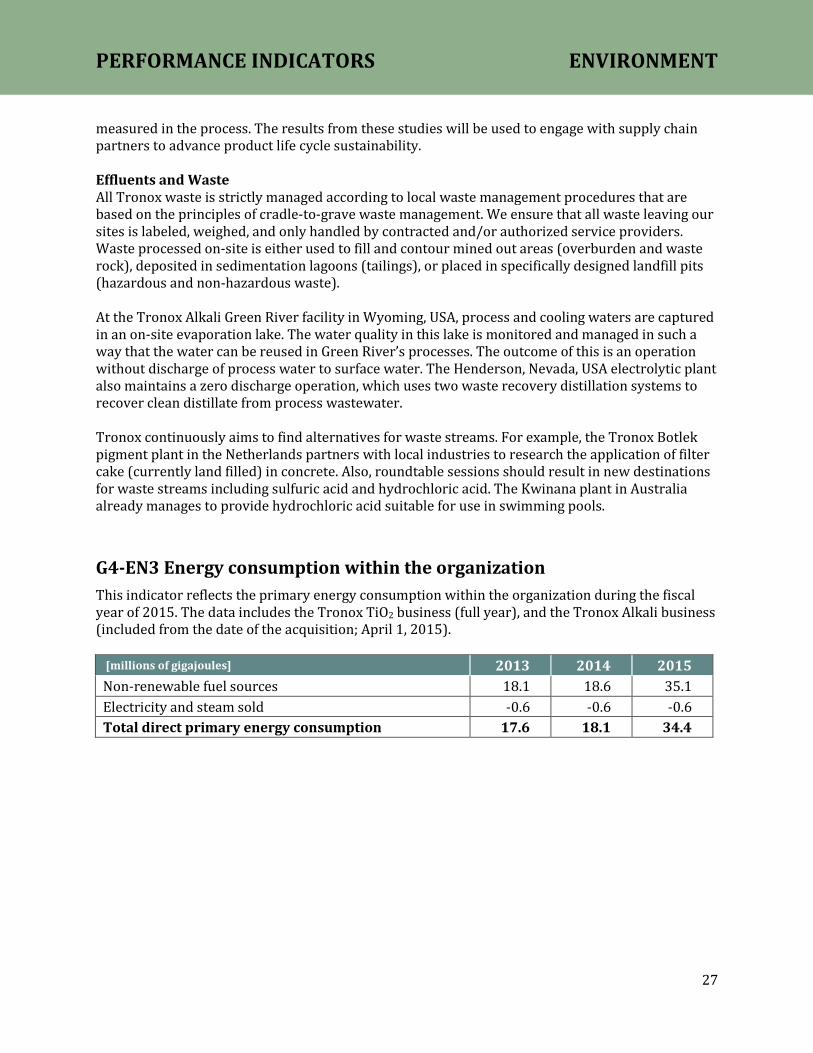
G4-EN3 Energy consumption within the organization This indicator reflects the primary energy consumption within the organization during the fiscal year of 2015. The data includes the Tronox TiO2 business (full year), and the Tronox Alkali business (included from the date of the acquisition; April 1, 2015).
[millions of gigajoules] 2013 2014 2015 Non-renewable fuel sources 18.1 18.6 35.1 Electricity and steam sold -0.6 -0.6 -0.6 Total direct primary energy consumption 17.6 18.1 34.4
PERFORMANCE INDICATORS ENVIRONMENT
28
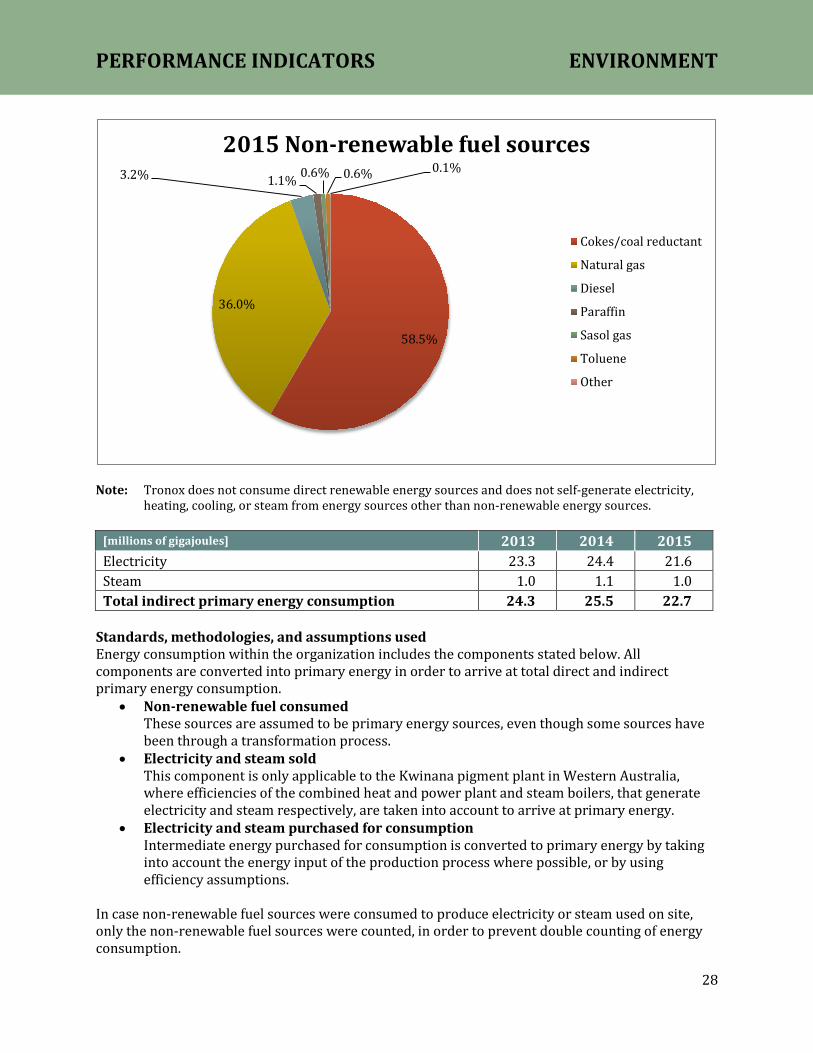
Note: Tronox does not consume direct renewable energy sources and does not self-generate electricity,
heating, cooling, or steam from energy sources other than non-renewable energy sources.
[millions of gigajoules] 2013 2014 2015 Electricity 23.3 24.4 21.6 Steam 1.0 1.1 1.0 Total indirect primary energy consumption 24.3 25.5 22.7
Standards, methodologies, and assumptions used Energy consumption within the organization includes the components stated below. All components are converted into primary energy in order to arrive at total direct and indirect primary energy consumption.
• Non-renewable fuel consumed These sources are assumed to be primary energy sources, even though some sources have been through a transformation process.
• Electricity and steam sold This component is only applicable to the Kwinana pigment plant in Western Australia, where efficiencies of the combined heat and power plant and steam boilers, that generate electricity and steam respectively, are taken into account to arrive at primary energy.
• Electricity and steam purchased for consumption Intermediate energy purchased for consumption is converted to primary energy by taking into account the energy input of the production process where possible, or by using efficiency assumptions.
In case non-renewable fuel sources were consumed to produce electricity or steam used on site, only the non-renewable fuel sources were counted, in order to prevent double counting of energy consumption.
58.5%
36.0%
3.2% 1.1% 0.6% 0.6% 0.1% 2015 Non-renewable fuel sources
Cokes/coal reductant
Natural gas
Diesel
Paraffin
Sasol gas
Toluene
Other

PERFORMANCE INDICATORS ENVIRONMENT
29
Source of the conversion factors used Calorific values that were used to convert volumes of non-renewable fuel sources into primary energy were taken from the energy suppliers where possible, or from the Guidelines for National Greenhouse Gas Inventories.6 Efficiencies used for electricity and steam sold were based on local metered input and output values and annual efficiency samples respectively. Regarding electricity and steam purchased for consumption, conversion efficiencies are provided by energy suppliers where possible, or assumptions of country-average efficiencies were taken from the Trends in Global Energy Efficiency Report.7
G4-EN5 Energy intensity This indicator reflects the primary energy intensity during the fiscal year of 2015. The data includes the Tronox TiO2 business (full year), and the Tronox Alkali business (included from the date of the acquisition; April 1, 2015).
Notes: 1) The total primary energy intensity is calculated by dividing the sum of direct and indirect primary
energy consumption by the total weight of products produced. 2) All energy sources included in G4-EN3 (non-renewable fuel, electricity, and steam, minus electricity and steam sold) are included in the energy intensity calculations.
6 Intergovernmental Panel on Climate Change (IPCC) (2006). Guidelines for National Greenhouse Gas Inventories. Hayama, Japan. 7 Asea Brown Boveri (ABB) (2011). Trends in Global Energy Efficiency 2011. Zurich, Switzerland.
10.83 10.96
8.16
14.94 15.44
5.37
25.77 26.40
13.52
0
5
10
15
20
25
30
2013 2014 2015
giga
joul
es/m
etri
c to
n pr
oduc
ed
Energy intensity
Direct primary energyintensity
Indirect primary energyintensity
Total primary energyintensity

PERFORMANCE INDICATORS ENVIRONMENT
30
In 2014, KZN Sands produced a significant quantity of slag blocks (an intermediate product manufactured by the furnaces). The slag blocks had not been processed by the slag plant, and therefore the quantity was not included in the 2014 production number. This lower production number had a negative impact on the direct and indirect energy intensity and on the GHG emissions intensity. However, in the first half of 2015, the slag plant ran at full capacity, resulting in a decrease in slag block inventory. This change impacted the 2015 energy intensity and GHG emissions intensity in a positive way. At Hamilton, the shut-down of the sodium chlorate plant in November of 2015 resulted in the cessation of sodium chlorate production. This halt in production had a negative impact on direct energy intensity, as the majority of the direct energy sources are consumed by the adjacent TiO2 plant. Contrary, the decrease in sodium chlorate production positively impacted the indirect energy intensity, as the majority of electricity was consumed by that operation.
G4-EN8 Total water withdrawal by source This indicator reflects the total water withdrawal during the fiscal year of 2015. The data includes the Tronox TiO2 business (full year), and the Tronox Alkali business (included from the date of the acquisition; April 1, 2015).
[millions of cubic meters] 2013 2014 2015 Total water withdrawal 69.4 62.9 68.0
Notes: 1) The water intensity is calculated by dividing the total water consumption by the total weight of
products produced. 2) Water intensity decreased significantly in 2014 from the prior year because of an improvement in reporting accuracy. The 2013 figure on surface water incorporates data from one of our plants that was estimated based on certain assumptions, while the 2014 figure incorporates data from that plant using a direct measurement from a flow meter.
Total water withdrawal only takes into account water that is used for the first time. In other words, water that is reused or recycled to be consumed twice or more times, either in the same process or in a different process, is not included in this indicator. In 2015 the TiO2 surface water and rain water intensities decreased because of a mining stoppage at KZN Sands, while the production of chloride slag, pig iron, and slag fines continued. The mining
53% 34%
3% 2% 8%
2015 Total water withdrawal by source
Surface water
Ground water
Rainwater
Waste water
Municipal water
42.75 38.18
16.09
0
10
20
30
40
50
2013 2014 2015cubi
c m
eter
s/m
etri
c ton
pr
oduc
ed
Water intensity
Waterintensity

PERFORMANCE INDICATORS ENVIRONMENT
31
stoppage was related to the transition from the closure of the Hillendale Mine to the opening of the new Fairbreeze Mine in South Africa.
G4-EN13 Habitats protected or restored G4-MM1 Amount of land disturbed or rehabilitated The combined indicators G4-EN13 and G4-MM1 reflect the total land use of the organization in terms of area protected, area disturbed, area in rehabilitation, and area restored. Partnerships and approval from independent external professionals are also reported on. The data includes the Tronox TiO2 business (full year), and the Tronox Alkali business (included from the date of the acquisition; April 1, 2015).
[hectares] 2013 2014 2015 Area protected 96,599 108,406 109,053 Area disturbed 4,497 4,449 7,357 Area in rehabilitation 2,193 2,012 2,073 Area restored 3,235 3,702 4,536 Total land use 106,523 118,569 123,019
Notes: 1) All data refers to a snap shot at year end (December 31 of the relevant year).
2) The land use footprint includes all Tronox operations, however, more than 95 percent of total land use can be attributed to our three titanium feedstock mines in South Africa and Australia. Our trona ore mine in the United States is an underground mine and takes in a relatively small area of surface land.
Restored habitats at our mines
Area actively mined at year end
Area restored during fiscal year
Expenditures on rehabilitation during
[hectares] [hectares] fiscal year [US$]
KZN Sands 2013 2 40 $3,278,451 2014 0 104 $4,830,660 2015 0 56 $2,223,194
Namakwa Sands
2013 1,359 69 $5,931,531 2014 1,516 246 $4,718,385 2015 1,516 73 $2,882,829
Northern Operations
2013 51 103 $1,908,364 2014 60 117 $2,044,056 2015 53 107 $2,397,500
Total 2013 1,412 212 $11,118,346 2014 1,576 467 $11,593,100 2015 1,569 236 $7,503,523
Note: Rehabilitation and restoration of mined out land is inseparably connected to the way we operate our
mines. In the table above, the area actively mined, area restored, and expenditures on rehabilitation are presented for our surface mines (titanium feedstock mines).

PERFORMANCE INDICATORS ENVIRONMENT
32
Expenditures on rehabilitation during the 2015 fiscal year decreased compared to the prior year. This can be attributed to two factors in South Africa: 1) at Namakwa Sands in 2014 more hours were spent on rehabilitation, due to long distances to rehabilitation areas as well as difficult landscaping conditions (steep areas and topographical differences); and, 2) lower than anticipated costs for the rehabilitation activities at KZN Sands. During the 2015 fiscal year less rehabilitation measures were completed (areas restored) at our surface mines than the year before. However, at the end of 2015 more areas were classified as “in rehabilitation,” compared to the prior year (see also first table on previous page). Standards, methodologies, and assumptions used We apply the following definitions to the different land use categories:
• Area protected: Reflects undisturbed land (land not affected by any operations) that remains in its original state and land that is actively protected from operations to maintain a healthy functioning ecosystem.
• Area disturbed: Reflects areas that are used during or affected by operational activities, including:
o Operational plants and units (including tank and silo storage) o Office buildings (including maintenance shops, storage locations, and contractor
areas) o Other areas (occasionally used, including roads and parking lots) o Waste treatment/storage (including ponds and storage of fine and coarse material
fractions) o Areas prepared for surface mining (i.e., areas where the top soil has been removed) o Areas actively mined o Former mining or operational areas where backfilling operations are in progress
but where the top soil has not yet been replaced • Area in rehabilitation:
Reflects former mining or operational areas where the top soil has been placed back but where rehabilitation measures have not yet been completed. Offsetting areas where rehabilitation measures have commenced are also included in this category. This is a temporary phase between area protected/disturbed and area restored.
• Area restored: Reflects former mining or operational areas where rehabilitation measures have been completed and a specified quality level has been achieved according to pre-determined agreements with authorities, or in case of absence of agreements with authorities, according to internal standards. These agreements can include restoration to farm land, native land, land with a high biodiversity value, etc. Once the agreed quality level has been achieved the area is considered to be restored, even if Tronox is still putting in effort (through third parties or otherwise) to maintain the area at that quality level.
Approval from independent external professionals Our Namakwa Sands operations in South Africa are currently in the process of determining (i) the criteria for rehabilitation success and, (ii) establishing a methodology that can measure compliance with the criteria. The process will be open for public comment and submitted to the relevant authorities for final approval.

PERFORMANCE INDICATORS ENVIRONMENT
33
At our Northern Operations location in Australia, rehabilitation monitoring is conducted by an external contractor and is undertaken to track rehabilitation development over time, to confirm successful practices and identify improvement opportunities. Tronox, with an external contractor, has developed formal rehabilitation completion criteria in order to clearly define rehabilitation objectives, how these will be achieved and measures to demonstrate success. These are outlined in the Cooljarloo Mine Closure Plan as endorsed by government. Where performance issues are recognized for any given site, appropriate corrective actions are identified and implemented. Where a solution is not obvious, further investigation is undertaken through research programs with the University of Western Australia, Murdoch University; external contractors; and internal on-site trials. Rehabilitation improvement programs have been detailed in the Cooljarloo Mine Closure Plan. The rehabilitation data is presented to the Mineral Sands Agreement Rehabilitation Coordinating Committee (MSARCC; various government departments) each year. To date, no areas of rehabilitation have been signed off. Partnerships As part of Tronox KZN Sand’s impact mitigation measures at the Fairbreeze Mine in South Africa, the company has established protected areas such as the Siyaya Biodiversity Offset (230 hectares / 568 acres). The strategic offset management plan was drafted by an outside consultant group (Eco-Pulse) and is retained by KZN Sands to finalize all offset management plans. Our Northern Operations site has provided support to Western Shield, the Western Australian Department of Parks and Wildlife’s lead animal conservation program, since 2001. The program aims to return the balance and mixture of native fauna in selected areas to levels comparable to Pre-European settlement by controlling feral animals. The sponsorship from Tronox has enabled a fox and feral cat control program to be implemented between Jurien Bay and Lancelin, an area of ±1,000 km2 (±386 miles2). Aerial baiting is carried out four times a year and forms part of the broader state-wide Western Shield fox program. Bureau of Land Management Hardrock Mineral Environmental Award The Green River region in Wyoming, USA faces an environmental challenge to safeguard the habitat of the Greater Sage-Grouse, a protected species of bird. Tronox Alkali responded by developing a detailed conservation management strategy for sage-grouse and other species, and working collaboratively with other local soda ash companies to reduce surface activities in sage-grouse breeding and nesting areas. The Tronox strategy incorporates a number of conservation measures. Surface disturbance is restricted within 1.0 km (0.6 miles) of known sage-grouse breeding areas (leks) between March 15 and June 30, and prohibited in brood rearing areas during the same period. The male sage-grouse population at all leks near Tronox facilities is monitored. Surface disturbance areas are reclaimed as soon as practicable. The results thus far have been encouraging. An inventory of leks in 2015 showed more than in previous years. A number of habitat improvement projects have also been undertaken, including the restoration of 28 sites, the conversion of barbed-wire to wildlife-friendly fencing, and the completion of sage-grouse winter use surveys for three consecutive years.

PERFORMANCE INDICATORS ENVIRONMENT
34
G4-EN15 Direct greenhouse gas (GHG) emissions (scope 1) This indicator reflects the direct GHG emissions (scope 1)8 of operations over which Tronox had operational control during the fiscal year of 2015. The data includes the Tronox TiO2 business (full year), and the Tronox Alkali business (included from the date of the acquisition: April 1, 2015).
[millions of metric tons of CO2-equivalents] 2013 2014 2015 Direct GHG emissions (scope 1) 1.4 1.5 3.7
Standards, methodologies, and assumptions used Greenhouse gases included in this indicator are in line with the GHGs covered by the United Nations Kyoto Protocol, the World Resources Institute, and the World Business Council for Sustainable Development (WBCSD) GHG Protocol Corporate Accounting and Reporting Standard:
• Carbon dioxide (CO2) • Methane (CH4) • Nitrous oxide (N2O) • Hydrofluorocarbons (HFCs) • Perfluorocarbons (PFCs) • Sulphur Hexafluoride (SF6) • Nitrogen trifluoride (NF3)
Furthermore, the reporting of scope 1 and scope 2 GHG emissions is in line with the WBCSD Standard’s Operational Control Approach.9
8 Direct GHG emissions, or scope 1 emissions, refer to GHG emissions from operations that are owned or controlled by Tronox. 9 World Business Council for Sustainable Development (WBCSD) (2004). The Greenhouse Gas Protocol: A Corporate Accounting and Reporting Standard. Washington, DC, USA.
50%
28%
2%
20%
2015 Direct GHG emissions (scope 1)
Generation of electricity, heating,cooling, and steam
Physical or chemical processing
Transport of materials, products,waste, employees, and passengers
Fugitive emissions

PERFORMANCE INDICATORS ENVIRONMENT
35
Source of the conversion factors used GHG emission factors for CO2 are based on data provided by local energy suppliers. In case this data is not readily available, the emission factors used are in line with the 2006 IPCC Guidelines for National Greenhouse Gas Inventories (default emission factors on a net calorific basis). For GHGs other than CO2, Global Warming Potentials (GWPs) are used to convert GHG emissions into CO2-equivalents. These GWPs are in line with the IPCC Fourth Assessment Report.10
G4-EN16 Indirect greenhouse gas (GHG) emissions (scope 2) This indicator reflects the indirect GHG emissions (scope 2)11 of operations during the fiscal year of 2015. The data includes the Tronox TiO2 business (full year), and the Tronox Alkali business (included from the date of the acquisition; April 1, 2015).
[millions of metric tons of CO2-equivalents] 2013 2014 2015 Indirect GHG emissions (scope 2) 2.2 2.3 2.0
Standards, methodologies, assumptions, and source of conversion factors Please refer to G4-EN15 for the type of GHGs included, the chosen consolidation approach, and the sources of emission factors and GWPs.
10 Intergovernmental Panel on Climate Change (IPCC) (2007). Fourth Assessment Report, Climate Change 2007: The Physical Science Basis. Cambridge, United Kingdom and New York, NY, USA. 11 Indirect GHG emissions, or scope 2 emissions, refer to emissions that result from the generation of purchased or acquired electricity, heating, cooling, and steam consumed by Tronox.
99%
1%
2015 Indirect GHG emissions (scope 2)
Electricity
Steam

PERFORMANCE INDICATORS ENVIRONMENT
36
G4-EN18 Greenhouse gas (GHG) emissions intensity This indicator reflects the GHG emissions intensity during the fiscal year of 2015. The data includes the Tronox TiO2 business (full year), and the Tronox Alkali business (included from the date of the acquisition: April 1, 2015).
Notes: 1) The GHG emissions intensity is calculated by dividing the sum of direct and indirect GHG
emissions by the total weight of products produced. 2) All GHG emissions included in G4-EN15 and G4-EN16 (scope 1 and scope 2) are included in the GHG emissions intensity calculations. This automatically includes all GHGs stated under G4-EN15.
As can be seen in the above graph, the direct GHG emissions intensity remains constant from 2014 to 2015, while the indirect GHG emissions intensity decreases significantly with the inclusion of the Alkali segment. This factor can be explained by the fact that the GHG emissions at Alkali are disproportionate to energy consumption. Namely, significant GHG emissions are the result of the release of CO2 during chemical processing of the Alkali products, and methane emissions from the mineral formation during mining.
0.87 0.88 0.88
1.38 1.42
0.48
2.25 2.30
1.36
0.0
0.5
1.0
1.5
2.0
2.5
2013 2014 2015
met
ric
tons
of C
O2-
equi
vale
nts/
met
ric
ton
prod
uced
GHG emissions intensity
Direct GHG emissions (scope1) intensity
Indirect GHG emissions(scope 2) intensity
Total GHG emissions (scope 1and 2) intensity
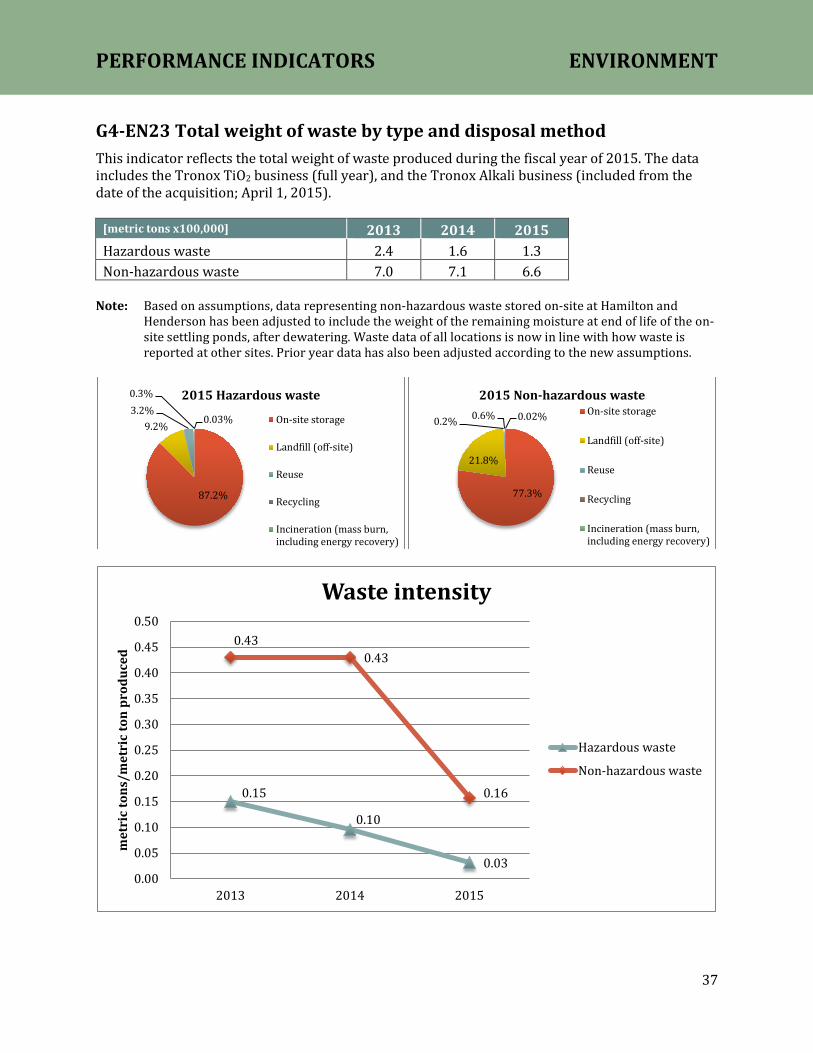
PERFORMANCE INDICATORS ENVIRONMENT
37
G4-EN23 Total weight of waste by type and disposal method This indicator reflects the total weight of waste produced during the fiscal year of 2015. The data includes the Tronox TiO2 business (full year), and the Tronox Alkali business (included from the date of the acquisition; April 1, 2015).
[metric tons x100,000] 2013 2014 2015 Hazardous waste 2.4 1.6 1.3 Non-hazardous waste 7.0 7.1 6.6
Note: Based on assumptions, data representing non-hazardous waste stored on-site at Hamilton and
Henderson has been adjusted to include the weight of the remaining moisture at end of life of the on-site settling ponds, after dewatering. Waste data of all locations is now in line with how waste is reported at other sites. Prior year data has also been adjusted according to the new assumptions.
87.2%
9.2% 3.2% 0.3%
0.03%
2015 Hazardous waste
On-site storage
Landfill (off-site)
Reuse
Recycling
Incineration (mass burn,including energy recovery)
77.3%
21.8%
0.2% 0.6% 0.02%
2015 Non-hazardous waste On-site storage
Landfill (off-site)
Reuse
Recycling
Incineration (mass burn,including energy recovery)
0.15
0.10
0.03
0.43 0.43
0.16
0.00
0.05
0.10
0.15
0.20
0.25
0.30
0.35
0.40
0.45
0.50
2013 2014 2015
met
ric
tons
/met
ric
ton
prod
uced
Waste intensity
Hazardous waste
Non-hazardous waste

PERFORMANCE INDICATORS ENVIRONMENT
38
Hazardous waste intensity decreased in 2015, primarily due to two factors in South Africa: 1) water from the filter press at KZN Sands is now routed to the effluent line and is no longer transported to the on-site landfill; and, 2) Namakwa Sands produced significantly less iron sludge due to the shutdown of a furnace. Non-hazardous waste intensity also decreased due to the following improvements at Northern Operations in Western Australia: 1) good grade in heavy mineral concentrate reporting to the processing plant; 2) increased activated carbon recovery; and, 3) increased production of standard grade synthetic rutile.

PERFORMANCE INDICATORS SOCIAL
39
Disclosure on Management Approach – Social Tronox has an impact on the social systems within which it operates, and management is engaged in understanding and addressing those social dimensions of sustainability. Our commitment to social sustainability is thoroughly addressed in both the Tronox Values and the Tronox Code of Conduct. Within the Tronox Values we define expectations for social sustainability, which include: • Creating a safe and healthy workplace and driving continuous safety and health improvements; • Care for the environment, including taking personal responsibility for environmental
stewardship; • Active involvement in our communities; • Treating people as our most important resource, creating opportunities for development and
acting intentionally to create a diverse and supportive work environment; Within the Tronox Code of Conduct we also address areas that include:
• Anti-corruption • Anti-competitive behavior • Product stewardship • Child Labor/Forced Labor • Respect for Employees’ Privacy
Tronox has determined that five of the 30 social aspects identified in the GRI Sustainability Guidelines are material to its stakeholders: Under the Subcategory Labor Practices and Decent Work:
• Labor Management Relations (G4-MM4) • Occupational Health and Safety (GA-LA6) • Diversity and Equal Opportunity (G4-LA12)
Under the Subcategory Human Rights: • Indigenous Rights (G4-MM5)
Under the Subcategory Society: • Local Communities (G4-SO1)
Labor Management Relations, because Teamwork is one of our core values and we understand that we can only win as a team. We have a commitment to collaborate effectively, communicate openly, engage honestly, treat others respectfully, and make informed decisions. While our TiO2 segment employees in the United States are not represented by a union or collective bargaining agreement, nearly 66 percent of the employees at the Tronox Alkali mining and manufacturing facility in Green River, Wyoming are members of a union and subject to a collective bargaining agreement. In South Africa, more than 70 percent of the workforce belongs to a union. In Australia, most employees are not represented by a union, but approximately 50 percent are represented by a collective bargaining agreement. In the Netherlands, approximately 50 percent of Tronox employees are represented by a collective bargaining agreement and 30 percent are members of a union. Occupational Health and Safety, because Health & Safety is one of our core values, and we believe passionately that everyone at Tronox should experience a safe and healthy workplace. We have a

PERFORMANCE INDICATORS SOCIAL
40
commitment to proactively identify and manage risk, conduct ourselves responsibly, exercise good judgment and take responsibility for our actions. Our goal is that every employee, contractor and visitor to one of our sites leaves that site completely unharmed. Diversity and Equal Opportunity, because People is one of our core values, and we believe our business is most effective when it is diverse and our people enjoy a fair and supportive work environment. We describe the behaviors we expect from our employees as follows: listens to others with diverse perspectives; supports new and different approaches; supports fairness and equality in the workplace; encourages others to be open-minded and to appreciate alternative cultural perspectives; does not tolerate discrimination. Indigenous Rights, because two of our operations (KZN Sands, South Africa, and Northern Operations, Australia) are in or adjacent to Indigenous Peoples’ territories, and they are important communities to our license to operate, and to our community objective as discussed next. Local Communities, because Responsibility is one of our core values, and we believe active engagement in our communities is key to our success. We expect our employees to seek to understand the social impacts of individual activities, resolve situations where operational goals conflict with community goals, and promote positive engagement with the community. Employees should act as advocates for the community within our organization, foster a culture of employee volunteerism and promote community initiatives related to education in science and the arts.
G4-MM4 Number of strikes and lock-outs exceeding one week’s duration There are no records of strikes or lock-outs at any Tronox location in the last ten years.
G4-LA6 Type of injury and rates of injury, occupational diseases, and total number of work-related fatalities This indicator reflects our safety results in terms of injuries and injury rates. The data includes the Tronox TiO2 business (full year), and the Tronox Alkali business (full year).
0.40 0.36 0.42
0.00.10.20.30.40.5
2013 2014 2015
2015 Disabling Injury Frequency Rate (DIFR) for employees + contractors
DIFR(employees +contractors)
0.43 0.39
0.30
0.00.10.20.30.40.5
2013 2014 2015
2015 Disabling Injury Frequency Rate (DIFR) for employees only
DIFR(employeesonly)
Please see definitions and calculation methodology for the metrics above on the next page.
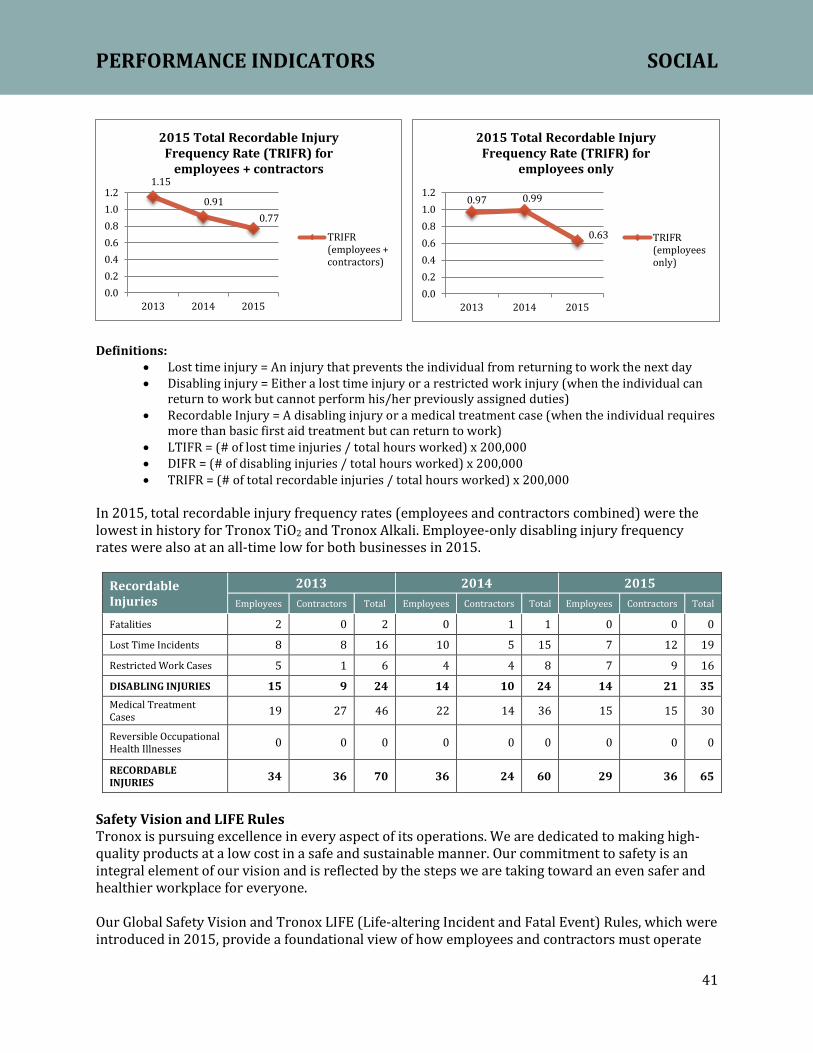
PERFORMANCE INDICATORS SOCIAL
41
1.15
0.91 0.77
0.00.20.40.60.81.01.2
2013 2014 2015
2015 Total Recordable Injury Frequency Rate (TRIFR) for
employees + contractors
TRIFR(employees +contractors)
0.97 0.99
0.63
0.00.20.40.60.81.01.2
2013 2014 2015
2015 Total Recordable Injury Frequency Rate (TRIFR) for
employees only
TRIFR(employeesonly)
Definitions:
• Lost time injury = An injury that prevents the individual from returning to work the next day • Disabling injury = Either a lost time injury or a restricted work injury (when the individual can
return to work but cannot perform his/her previously assigned duties) • Recordable Injury = A disabling injury or a medical treatment case (when the individual requires
more than basic first aid treatment but can return to work) • LTIFR = (# of lost time injuries / total hours worked) x 200,000 • DIFR = (# of disabling injuries / total hours worked) x 200,000 • TRIFR = (# of total recordable injuries / total hours worked) x 200,000
In 2015, total recordable injury frequency rates (employees and contractors combined) were the lowest in history for Tronox TiO2 and Tronox Alkali. Employee-only disabling injury frequency rates were also at an all-time low for both businesses in 2015.
Recordable Injuries
2013 2014 2015 Employees Contractors Total Employees Contractors Total Employees Contractors Total
Fatalities 2 0 2 0 1 1 0 0 0
Lost Time Incidents 8 8 16 10 5 15 7 12 19
Restricted Work Cases 5 1 6 4 4 8 7 9 16
DISABLING INJURIES 15 9 24 14 10 24 14 21 35 Medical Treatment Cases 19 27 46 22 14 36 15 15 30
Reversible Occupational Health Illnesses 0 0 0 0 0 0 0 0 0
RECORDABLE INJURIES 34 36 70 36 24 60 29 36 65
Safety Vision and LIFE Rules Tronox is pursuing excellence in every aspect of its operations. We are dedicated to making high-quality products at a low cost in a safe and sustainable manner. Our commitment to safety is an integral element of our vision and is reflected by the steps we are taking toward an even safer and healthier workplace for everyone. Our Global Safety Vision and Tronox LIFE (Life-altering Incident and Fatal Event) Rules, which were introduced in 2015, provide a foundational view of how employees and contractors must operate

PERFORMANCE INDICATORS SOCIAL
42
and act moving forward. And, it lays out our safety policy and illustrates what it means to live safety at Tronox at every level of the company. The LIFE Rules are a critical preventative tool. They are an unconditional obligation that applies to everyone at a Tronox facility, whether it is at a mine, beneficiation facility, chemical plant, or office building.
G4-LA12 Composition of governance bodies and breakdown of employees per employee category The below graphs provide information on the composition of our employee categories, including that of the Board of Directors (governance bodies category).
0%20%40%60%80%
100%
Workforce representation by gender (as of December 31, 2015)
Female
Male0%
20%40%60%80%
100%
Workforce representation by age (as of December 31, 2015)
>=60
50-59
30-49
<=29
0%20%40%60%80%
100%
Workforce representation by minorities (as of December 31, 2015)
White
Black andother minority
Not tracked
PERFORMANCE INDICATORS SOCIAL
43
G4-MM5 Total number of operations taking place in or adjacent to Indigenous Peoples’ territories, and number and percentage of operations or sites where there are formal agreements with Indigenous Peoples’ communities Two of our operations (KZN Sands, South Africa, and Northern Operations, Australia) are in or adjacent to Indigenous Peoples’ territories. A total of nine Indigenous Peoples’ territories have been identified, of which seven are in or adjacent to KZN Sands, and three are in or adjacent to Northern Operations. Tronox has formal agreements with all ten communities. KZN Sands KZN Sands has formal benefit agreements (e.g., Local Community Procurement Forum) with seven Traditional Authorities (Inkosi) in KwaZulu-Natal, South Africa, forming part of its Local Economic Development Projects that are in line with the KZN Sands’ Social and Labor Plan (SLP). The SLP is a compliance document initiated through a legislative framework called Mineral and Petroleum Resource Development Act (MPRDA). Each mining house is required to submit its SLP to the government every five years to commit to, among other things, the type of Local Economic Development Projects that the company will embark on for the duration of that five-year period. The names and communities are committed together with a corresponding budget. The seven different Indigenous Territories that KZN Sands is adjacent to or on are:
• KwaDube Traditional Authority • Somopho Traditional Authority • KwaMkhwanazi Traditional Authority • Macambini Traditional Authority • Nzuza Traditional Authority • Ogagwini Traditional Authority • Madlebe Traditional Authority
In 2015, Tronox established a skills development program for its South African operations that hosted 170 men and women from the communities surrounding Namakwa Sands and KZN Sands. At KZN Sands, Tronox worked with the seven local tribal authorities noted here to identify and select candidates for the program. At year-end, the students who had completed their course work were hired directly by Tronox or placed in apprenticeships with local businesses to receive an additional 12 months of practical training, with salaries paid by Tronox. The company is continuing this program in 2016 to reach and train another class of students. Northern Operations The Cooljarloo Mine site and Chandala processing plant in Western Australia are exempt from Indigenous Land Access Agreements because the tenements were granted prior to the introduction of Australia’s Native Title Act. However, tenements granted after the original tenements have been subject to Land Access Agreements. These include three Indigenous Territories: Falcon, Dongara Project, and Cooljarloo West. An additional tenement to the south of Cooljarloo has been rolled into the Cooljarloo West Agreement.

PERFORMANCE INDICATORS SOCIAL
44
All sites except the Dongara site are on Yued Native Title Groups land. Dongara is on the Amangu Native Title Groups land. The formal agreements associated with the three Indigenous Territories are as follow:
• Falcon Indigenous Territory: o Work Ready training program o Educational scholarships o Apprenticeships o Traineeships o Cross cultural training for Tronox staff o Business opportunities
• Dongara Project Indigenous Territory:
o Signing fee (cash component) o Establishment of administration centre o Workshops and training o Educational scholarships o Apprenticeships o Traineeships o Work Ready Program o Business Opportunities and support of business establishment o Cross Cultural Awareness training
• Cooljarloo West Indigenous Territory:
o Signing Fee (cash component) o Educational scholarships o Apprenticeships o Traineeships o Health fund o Sporting and recreational fund o Mentor program o Indigenous community centre o Mogumber training facility o Business/leadership training
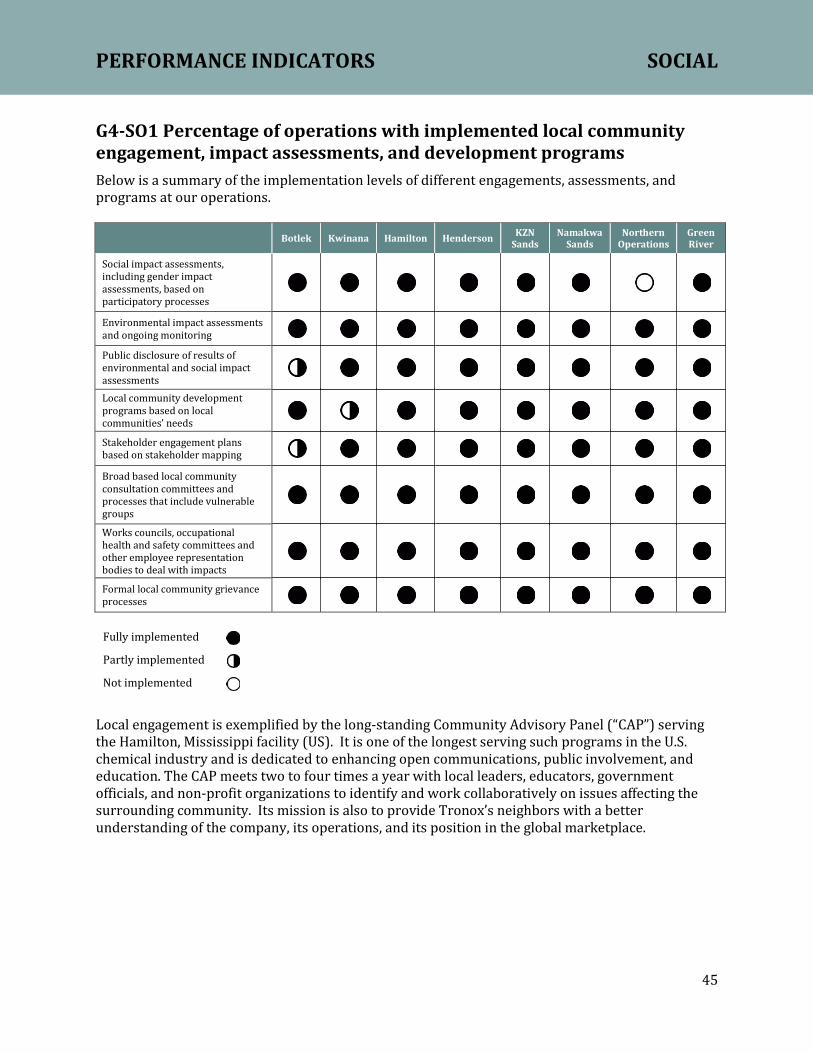
PERFORMANCE INDICATORS SOCIAL
45
G4-SO1 Percentage of operations with implemented local community engagement, impact assessments, and development programs Below is a summary of the implementation levels of different engagements, assessments, and programs at our operations.
Botlek Kwinana Hamilton Henderson KZN
Sands Namakwa
Sands Northern
Operations Green River
Social impact assessments, including gender impact assessments, based on participatory processes
Environmental impact assessments and ongoing monitoring
Public disclosure of results of environmental and social impact assessments
Local community development programs based on local communities’ needs
Stakeholder engagement plans based on stakeholder mapping
Broad based local community consultation committees and processes that include vulnerable groups
Works councils, occupational health and safety committees and other employee representation bodies to deal with impacts
Formal local community grievance processes
Fully implemented Partly implemented Not implemented
Local engagement is exemplified by the long-standing Community Advisory Panel (“CAP”) serving the Hamilton, Mississippi facility (US). It is one of the longest serving such programs in the U.S. chemical industry and is dedicated to enhancing open communications, public involvement, and education. The CAP meets two to four times a year with local leaders, educators, government officials, and non-profit organizations to identify and work collaboratively on issues affecting the surrounding community. Its mission is also to provide Tronox’s neighbors with a better understanding of the company, its operations, and its position in the global marketplace.

GRI INDEX
46
GENERAL STANDARD DISCLOSURES Strategy and Analysis ........................................................................................................................... 3
G4-1 Statement from the most senior decision-maker of the organization .................................................................... 3
Organizational Profile ......................................................................................................................... 4 G4-3 Name of the organization ............................................................................................................................................................ 4
G4-4 Primary brands, products, and services ............................................................................................................................... 4
G4-5 Location of the organization’s headquarters ..................................................................................................................... 7
G4-6 Number of countries where the organization operates ................................................................................................ 8
G4-7 Nature of ownership and legal form ...................................................................................................................................... 9
G4-8 Markets served ................................................................................................................................................................................ 9
G4-9 Scale of the organization ............................................................................................................................................................. 9
G4-10 Total workforce by employment contract, employment type, and region, broken down by gender ... 10
G4-11 Percentage of total employees covered by collective bargaining agreements ............................................... 10
G4-12 The organization’s supply chain .......................................................................................................................................... 10
G4-13 Significant changes during the reporting period ......................................................................................................... 12
G4-14 Explanation of whether and how the precautionary approach or principle is addressed ........................ 13
G4-15 Externally developed economic, environmental and social charters, principles, or other initiatives . 14
G4-16 Memberships of associations and national or international advocacy organizations ................................ 14
Identified Material Aspects and Boundaries ............................................................................. 15 G4-17 Entities included in the organization’s consolidated financial statements or equivalent documents. 15
G4-18 Process for defining the report content and the Aspect Boundaries .................................................................. 15
G4-19 Material Aspects identified in the process for defining report content ............................................................. 16
G4-20 Aspect Boundary within the organization for each material aspect ................................................................... 16
G4-21 Aspect Boundary outside the organization for each material aspect ................................................................. 16
G4-22 Explanation of the effect of any re-statements of information provided in earlier reports ..................... 17
G4-23 Significant changes from previous reporting periods in the Scope and Aspect Boundaries ................... 17
Stakeholder Engagement ................................................................................................................. 18 G4-24 List of stakeholder groups engaged by the organization ......................................................................................... 18
G4-25 Basis for identification and selection of stakeholders with whom to engage ................................................. 18
G4-26 Approach to stakeholder engagement .............................................................................................................................. 18
G4-27 Key topics and concerns that have been raised through stakeholder engagement ..................................... 18
Report Profile ....................................................................................................................................... 19 G4-28 Reporting period ........................................................................................................................................................................ 19
G4-29 Date of most recent previous report ................................................................................................................................. 19
G4-30 Reporting cycle ........................................................................................................................................................................... 19

GRI INDEX
47
G4-31 Contact point for questions regarding the report or its contents ........................................................................ 19
G4-32 Explanation of the “in accordance” option chosen ...................................................................................................... 19
G4-33 Policy and current practice with regard to seeking external assurance for the report.............................. 19
Governance ............................................................................................................................................ 20 G4-34 Governance structure of the organization ...................................................................................................................... 20
G4-56 Values, principles, standards and norms of behavior ................................................................................................ 21
PERFORMANCE INDICATORS
Disclosure on Management Approach – Economic ................................................................. 22 G4-EC1 Direct economic value generated and distributed ................................................................................................... 23
Disclosure on Management Approach – Environment........................................................... 24 G4-EN3 Energy consumption within the organization ........................................................................................................... 27
G4-EN5 Energy intensity ...................................................................................................................................................................... 29
G4-EN8 Total water withdrawal by source .................................................................................................................................. 30
G4-EN13 Habitats protected or restored ...................................................................................................................................... 31
G4-MM1 Amount of land disturbed or rehabilitated ............................................................................................................... 31
G4-EN15 Direct greenhouse gas (GHG) emissions (scope 1) ............................................................................................... 34
G4-EN16 Indirect greenhouse gas (GHG) emissions (scope 2) ........................................................................................... 35
G4-EN18 Greenhouse gas (GHG) emissions intensity ............................................................................................................. 36
G4-EN23 Total weight of waste by type and disposal method ............................................................................................ 37
Disclosure on Management Approach – Social ......................................................................... 39 G4-MM4 Number of strikes and lock-outs exceeding one week’s duration .................................................................. 40
G4-LA6 Type of injury and rates of injury, occupational diseases, and total number of work-related fatalities ........................................................................................................................................................................................................ 40
G4-LA12 Composition of governance bodies and breakdown of employees per employee category ............... 42
G4-MM5 Total number of operations taking place in or adjacent to Indigenous Peoples’ territories, and number and percentage of operations or sites where there are formal agreements with Indigenous Peoples’ communities .................................................................................................................................................... 43
G4-SO1 Percentage of operations with implemented local community engagement, impact assessments, and development programs ................................................................................................................................................................ 45

A Brighter Future – From the Ground Up
Tronox Limited Corporate Offices
AustraliaLot 22, Mason Road, Kwinana Beach,Western Australia 6167
Postal address: P.O. Box 305 Kwinana, Western Australia 6966+61.(0)8.9365.1333
United StatesSuite 1100263 Tresser BoulevardStamford, Connecticut 06901+1.203.705.3800
www.tronox.com