Trolley Tram Rome
10
Comparison between trolley-bus and tram vehicles: performances and consequent environmental impact G. M. Veca^ L. Villanti* IEEE Senior Member ^Dept of Electrical Engineering, University "La Sapienza" ofRome, Italy Abstract The Public Transportation System isnow rediscovering the use of trams due to ever increasing pollution problems. The entire system transports from 2000 to 15000 p/hd, and uses either the right of way (ROW) or the light rail transit (LRT). Nevertheless a new generation of articulated electric trolley buses (ETB) are becoming an attractive option. The ETB is "bimodal", or rather, ithas a double traction energy supply. Its engine-electric generator unit allows it to disconnect from the Overhead Catenary System (OCS) and continue operating as before. This paper compares an ETB transportation system, which uses vehicles holding 155 p, with the currentlytram system used in Rome, which uses vehicles holding 180 or 260 p. Based on the same passenger-flow, this comparison evaluates: which system, ismore cost effective for a company, reduces waiting time at bus stops, provides less environmental impact (noise, vibrations, and visual one). These steps will be followed: data collection, energetic consumption simulation program, transportation costs definition, simulation model on tramway network. The Transport Costs Analysis develops a model based on overall total cost, including the complete construction of both the tram and ETB systems on the present network. Costs include personnel, traction materials, vehicles, infrastructures and plant maintenance and amortization. Costs are calculated per vehicle km, per place km, per km run by thewholefleeton a line. 1 Introduction Today the selection of the best public transport system, to solve the mobility problem in the towns, becomes complicated by the variety of possible choices, even if this variety allows a more precise answer. Every possible system has its Urban Transport VI, C.A. Brebbia & L.J. Sucharov (Editors) © 2000 WIT Press, www.witpress.com, ISBN 1-85312-823-6
Transcript of Trolley Tram Rome

Comparison between trolley-bus and tram
vehicles: performances and consequent
environmental impact
G. M. Veca^ L. Villanti*IEEE Senior Member
D̂ept of Electrical Engineering, University "La Sapienza" of Rome, Italy
Abstract
The Public Transportation System is now rediscovering the use of trams due toever increasing pollution problems. The entire system transports from 2000 to15000 p/hd, and uses either the right of way (ROW) or the light rail transit(LRT). Nevertheless a new generation of articulated electric trolley buses (ETB)are becoming an attractive option. The ETB is "bimodal", or rather, it has adouble traction energy supply. Its engine-electric generator unit allows it todisconnect from the Overhead Catenary System (OCS) and continue operating asbefore. This paper compares an ETB transportation system, which uses vehiclesholding 155 p, with the currently tram system used in Rome, which uses vehiclesholding 180 or 260 p. Based on the same passenger-flow, this comparisonevaluates: which system, is more cost effective for a company, reduces waitingtime at bus stops, provides less environmental impact (noise, vibrations, andvisual one). These steps will be followed: data collection, energetic consumptionsimulation program, transportation costs definition, simulation model ontramway network. The Transport Costs Analysis develops a model based onoverall total cost, including the complete construction of both the tram and ETBsystems on the present network. Costs include personnel, traction materials,vehicles, infrastructures and plant maintenance and amortization. Costs arecalculated per vehicle km, per place km, per km run by the whole fleet on a line.
1 Introduction
Today the selection of the best public transport system, to solve the mobilityproblem in the towns, becomes complicated by the variety of possible choices,even if this variety allows a more precise answer. Every possible system has its
Urban Transport VI, C.A. Brebbia & L.J. Sucharov (Editors) © 2000 WIT Press, www.witpress.com, ISBN 1-85312-823-6

26 Urban Transport and the Environment for the 21st Century
own utilisation range, function of necessary transport capacities and localconditions. We can assume [2] a range of 1000-4000 p/hd for buses and trams,2000-6000 p/hd for trams sharing the roadway with private traffic, 6000-15000p/hd for tram in ROW or LRT. These traditional classes are not so distinctanymore: you can find various options from vehicles on tyres with greatcapacities, thanks to 2 or 3 carbody articulated vehicles [3], from the possibilityof bound driving with mechanical, optical or radio devices [4,5,6], from the levelof lane protection. In this paper, a general design and evaluation model havebeen developed [7], which compare two urban public transportation systems, inthe range of 1000-6000 p/hd. One of them uses different capacity trams, having2 or 3 carbodies; the other uses 2 carbody bimodal articulated ETBs, whichmeans they have a double traction energy supply, thanks to a Diesel engine-electric generator unit, that allows the same performances when vehiclesdisconnect themselves from the OCS.
Table 1. List of symbols.
symbolp/hdPsrlkmdrlkmkWh/vekm€/vekm€/plkm€/lkmph
mearpassengers per hour and directionpassengerssimple rail linear kilometresdouble rail linear kilometreskWh per vehicle and per kmeuro per vehicle and per kmeuro per place (standing or seated) aieuro per km run by a line fleet at the
ling
id per kmhighest point range of time
2 Evaluation methods
The present tramway network of Rome [8] has 6 lines equalling 68 srlkm. Someof them share part of the roadway. We assume the complete reconstruction of thewhole net at the state of art in both cases (tram or ETB on the same net), thatuses an antivibrating phonoabsorbing permanent way. About the vehicles, weconsider in this paper the trams presently used by the Rome Transport Company:- a new tram (body width: 2400 mm, total length: 30700 mm), consisting ofthree carbodies linked by two intercirculation modules. Total capacity: 260 p(we consider the European standard, that is 6 p/m*)- the usual tram, having two carbodies, whose total capacity is about 180 p- the articulated trolley-bus considered has a body width of 2500 mm, a totallength of 17985 mm and a total capacity: 155 pThe comparison evaluates, with the same capacity per hour:- which system is more convenient for the company- which one can offer better service, in terms of waiting time at the bus stops- which one can cause less environmental impact, such as traffic problems duringconstruction, vibration and noise pollution and visual impact.The work has been divided in the following steps:- data collection
Urban Transport VI, C.A. Brebbia & L.J. Sucharov (Editors) © 2000 WIT Press, www.witpress.com, ISBN 1-85312-823-6

Urban Transport and the Environment for the 21st Century 27
- use of an energetic consumption simulation program- definition of transport costs- transport costs calculus model- application of the model to the Roman transport lines
We have simplified some of the calculations: first by considering the completeconstruction of the network at its present state of art, even if there may be someold parts that are still useful (which would be a disadvantage for the tramsystem). Then, by the hypothesis of a complete electrification of the network,even if ETB can travel without the OCS when it is requested (this would be adisadvantage instead for the ETB system). Regarding energetic consumption, wehave preferred the use of a simulation program [9], instead of directmeasurement. This way the study can be generalised for cases that are differentfrom those considered here. Also because there aren't data on ETBs running inRome. The above mentioned program has been realised and validated [10] at theUniversity of Rome "La Sapienza". It needs a set of data available only for thetram running on line "8". Concerning the other trams and lines, we haveextrapolated the obtained results, considering them proportional to the weight ofthe vehicle and the range of distance. This approximation doesn't greatlyinfluence the simulation because, as we will see, consumption costs account for5% of the transport costs. In addition, we have considered equidistant bus stops.Lastly, those stretches of roadway included between two consecutive bus stops,shared between two or more lines, are treated as fractions of the whole line. Forinstance: if a line has 30 stops and 8 of them are shared with another line, thepieces of roadways shared will be 7, so the 7/30 of the transport costs of the linein our analysis will be shared with the other line.
3 Data collection
For the data collection two things are important: the first is to give the input datato the consumption simulation program, which deals with lines, runs andvehicles. The results of the simulation are given at the end of the paragraph. Thesecond need is to give the required items for the definition of infrastructures andplants costs, for the transport costs evaluation model, implemented in a calculusprogram.
3.1 Lines, runs and vehicles
The Roman tramway network has 11 srlkm and 29 drlkm in operation (tot: 69srlkm). It also has an auxiliary net of 4 srlkm and 9 srlkm in the depots. Theoverhead support system for the conductor is a transversal suspension type, withuse of plastic material tie-rods (Parafil), and the conductor is electrolytic copperof 100 mm\ There are three depots, one is used for extraordinary maintenanceand parking. There are 11 electrical power substations of 2 and 3 MW: 6 of themfeed 1 line, 3 feed 2 lines and 2 feed 3 lines. We'll contemplate fractions ofsubstations in the calculus of costs: if a line is fed by 3 stations and one of themis shared with another line, the stations will be considered 2,5. The line used
Urban Transport VI, C.A. Brebbia & L.J. Sucharov (Editors) © 2000 WIT Press, www.witpress.com, ISBN 1-85312-823-6
28 Urban Transport and the Environment for the 21st Century
[11] in the consumption simulation program is "8", which is about 5450 m longfrom one terminal to the other. It has 16 stops and 13 traffic lights that will beconsidered red (the other ones are pedestrian or immediately before stops, sothey are assumed green). Altimetric and planimetric (with all sweep radii)sections are listed. About the runs, the peak period chosen is winter, during theworking hours, when it is more intensive: in this period, the range of timebetween two runs, commercial speed and number of passengers getting on andoff the vehicle at every stop are known. The tram [12] used in this line is bi-directional, and it has a lowered floor for 75% of the passenger area, with 350mm ground clearance. Each of the two reduced wheel-base (1750 mm)motorbogies are equipped with two three-phase asynchronous motors. Overheadline voltage: 600 Vdc; max continuous power: 732 kW; max speed: 70 km/h;total seats: 54 (+2 for handicaps); dry weight: 40 t. The ETB has [13]: 360 mmground clearance; overhead voltage: 450 Vac; max continuous power: 185 kW;max speed: 60 km/h; total seats: 30 (+1 for handicap); dry weight: 19 t; Dieselengine with 95 kW power, 3,749 cm* total displacement, 3000 rpm max;generator with 205-560 V, 80 kVA power, 36,6-100 Hz frequency. Final resultson a complete run of line "8", from one terminal to the other and back, havegiven a tram consumption of 40,74 kWh. Introducing a 20% reduction due todeceleration recovered energy, it changes to 2,994 kWh/vekm (kWh/vehicle perkm). About ETB: 32,74 kWh and 2,406 kWh/vekm.
3.2 Infrastructures and Plants
Infrastructures are made up of depot-workshop and line equipment. The first onehas a workshop shed, washing-refuelling area, an ordinary and extraordinarymaintenance line, a building with offices, locker rooms, mess and services. Thesecond one includes OCS and the permanent way (this one is only for trams).And lastly, Plants are made up of the electric power substations.References [7] and [11] have given data in Table 2. Line equipment costs dependon the suspension system adopted. For a simpler calculus we assume a completeelectrification, even if bimodal ETBs can run by themselves when it is necessary.For the ETB system, we will consider a medium distribution between two-rowper every direction on poles and on hooks. Similarly about tram system one-row.About permanent ways, the state of art are the ones on prefabricated antivibrating
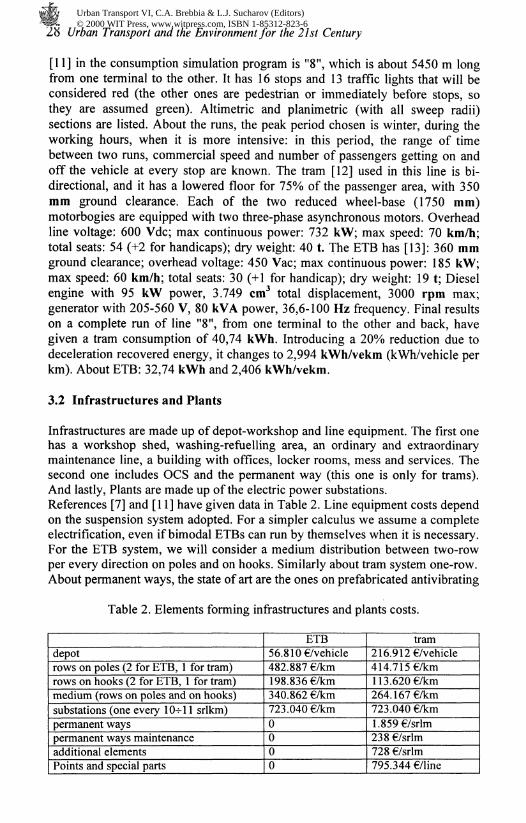
Table 2. Elements forming infrastructures and plants costs.
depotrows on poles (2 for ETB, 1 for tram)rows on hooks (2 for ETB, 1 for tram)medium (rows on poles and on hooks)substations (one every 10+11 srlkm)permanent wayspermanent ways maintenanceadditional elementsPoints and special parts
56.84821983407230000
ETB10€/vehicle887 €/km836 €/km862 €/km040 €/km
tram216.912€/vehicle414.715 €/km11 3.620 €/km264.1 67 €/km723.040€/km1.859€/srlm238 €/srlm728 €/srlm795.344 €/line
Urban Transport VI, C.A. Brebbia & L.J. Sucharov (Editors) © 2000 WIT Press, www.witpress.com, ISBN 1-85312-823-6

Urban Transport and the Environment for the 21st Century 29
floating foundations, which are more expensive but cause less problems onlaying, maintenance, noise and vibrations. Moreover, we have to add all thoseelements needed for the construction: powerlines, rail grinding, line protections,stop platforms, underground net, points remote controls, rail fastenings andantivibrating and phonoabsorbing profiles. Every line will also have points andspecial parts. Table 3 shows infrastructures and plants cost, put out by Villanti [1],having made use of Table 2, the number of vehicles in depot and the line length.
Table 3. Infrastructures and plants cost [M€].
line
830b1419225516
784833
infrastructures and plants cost [M€]ETB,752,501,661,485,087,983
tram38,34750,05027,21754,12519,38323,432
4 Transport costs definition and calculus model
Transport cost is sustained by the company to offer the public service. It can beformulated in different ways:Ctl [€/vekm], cost per km run by a vehicle;Ct2 [[€/plkm], cost per km run by an offered place (pi: standing or seated);Ct3 [€/lkmph], cost per km run by all vehicles at the same time on the line (1),during peak hours (ph).This is useful for a correct comparison having the same passenger-flow.In this model transport costs Ctl will be defined by the sum of the elementslisted in Table 4. About amortization costs, they have been reduced to Euro pervehicle and per km, considering infrastructures life, vehicles life and their annualmedium run. Some of these elements (Ip, Im, la, Ge) need infrastructures andplant costs to be known: they available in Table 3.
Table 4. Elements forming transport costs Ctl [€/vekm].
symbolDrCoVpIpVmImEsValaGe
meaningdriverscollectorsvehicles maintenance personnelinfrastructures and plants maintenance personnelvehicles maintenance materialsinfrastructures and plants maintenance materialstraction materials (energy supply, lubricants, tyres)vehicles amortisationinfrastructures and plants amortizationgeneral expenses (taxes, insurance, interests, fares collection,administration and organization)
Urban Transport VI, C.A. Brebbia & L.J. Sucharov (Editors) © 2000 WIT Press, www.witpress.com, ISBN 1-85312-823-6

30 Urban Transport and the Environment for the 21st Century
The calculus model, applied to the roman tramway network, gives the valueslisted in the Table 6. The above mentioned values have been obtained byparameters that ATAC/COTRAL and BredaMenarinibus have kindly supplied(see Table 5), except energy specific consumption, that has been calculated withits simulation program. The whole transport costs formulation is shown in Table7. The transport costs values, calculated for some of the Roman present tramwaylines, are listed in Table 8.
Table 5. Data necessary to calculate values in Table 6.
line 8driving personnel annual standard cost [€/person year]number of travelling personnel on a vehiclenumber of driver annual service hoursnumber of driver annual driving hourscommercial speed [km/h]number of vehicles usednumber of collectors per vehiclecollector personnel annual standard cost [€/person year]vehicle annual medium run [km]mainten. personnel annual medium cost [€/person year]number of persons employed per every vehicleenergy specific consumption [kWh/vekm] (calculated #)energy supply cost [KT* * €/vekm]vehicle price [€/vehicle]medium vehicle life [years]medium infrastructures and plants life [years]
ETB36.15211.6251.20017330,1138.73446.00036.1520,72/06 #10,071650.7362530
tram36.15211.6251.20017200,1138.73446.00036.1520,72,994 #10,0711.807.5993030
Table 6. Calculated values of the elements forming Ctl [1(T* * €/vekm].
line 8ETBtram
Dr177177
Co9,269,26
Vp55,055,0
Ip20,4167
Vm11,011,0
1m4,133,3
Es24230,1
Va%6131
la77,0138
Ge37,J75,3
Table 7. Transport costs formulation.
CtlCt2Ct3
Dr +Ctl /Ctl*
Co + Vp + Ip + Vmvehicle capacitynumber of vehicles
formula+ Im + Es + Va + la + Ge + Ci + Ge
at the highest point range of time
unit[€/vekm][€/p!km][€/lkmph]
Table 8. Transport costs values, calculated for some of the Roman tramway lines.
Ctl[€/vekm]Ct2 [10^*€/plkm]Ct3 [€/Ikmph]
line 8ETB4,122,63119,6
tram8,283,20140,7
line 30bETB5,233,3699,37
tram10,265,68164,1
line 19ETB5,243,5192,21
tram11,166,20167,4
line 225ETB4,532,8940,74
tram8,484,7067,88
Urban Transport VI, C.A. Brebbia & L.J. Sucharov (Editors) © 2000 WIT Press, www.witpress.com, ISBN 1-85312-823-6
Urban Transport and the Environment for the 21st Century 31
5 Results and Remarks
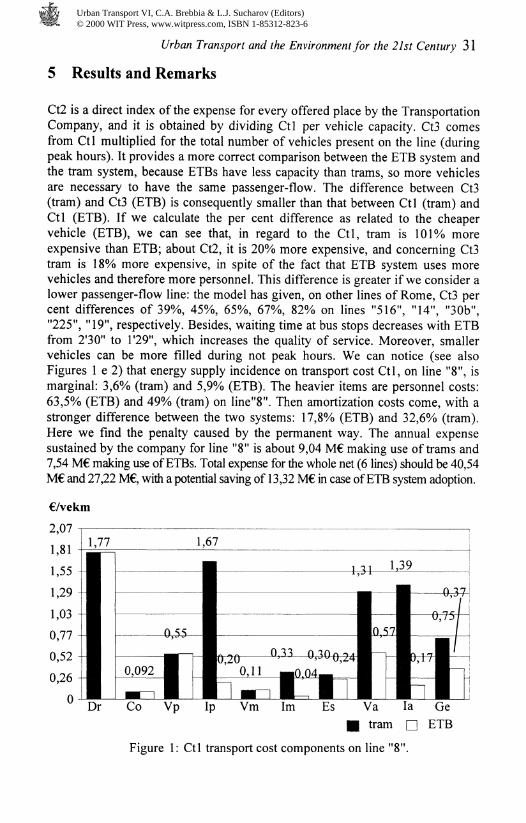
Ct2 is a direct index of the expense for every offered place by the TransportationCompany, and it is obtained by dividing Ctl per vehicle capacity. Ct3 comesfrom Ctl multiplied for the total number of vehicles present on the line (duringpeak hours). It provides a more correct comparison between the ETB system andthe tram system, because ETBs have less capacity than trams, so more vehiclesare necessary to have the same passenger-flow. The difference between Ct3(tram) and Ct3 (ETB) is consequently smaller than that between Ctl (tram) andCtl (ETB). If we calculate the per cent difference as related to the cheapervehicle (ETB), we can see that, in regard to the Ctl, tram is 101% moreexpensive than ETB; about Ct2, it is 20% more expensive, and concerning Ct3tram is 18% more expensive, in spite of the fact that ETB system uses morevehicles and therefore more personnel. This difference is greater if we consider alower passenger-flow line: the model has given, on other lines of Rome, Ct3 percent differences of 39%, 45%, 65%, 67%, 82% on lines "516", "14", "30b","225", "19", respectively. Besides, waiting time at bus stops decreases with ETBfrom 2'30" to T29", which increases the quality of service. Moreover, smallervehicles can be more filled during not peak hours. We can notice (see alsoFigures 1 e 2) that energy supply incidence on transport cost Ctl, on line "8", ismarginal: 3,6% (tram) and 5,9% (ETB). The heavier items are personnel costs:63,5% (ETB) and 49% (tram) on line"8". Then amortization costs come, with astronger difference between the two systems: 17,8% (ETB) and 32,6% (tram).Here we find the penalty caused by the permanent way. The annual expensesustained by the company for line "8" is about 9,04 M€ making use of trams and7,54 M€ making use of ETBs. Total expense for the whole net (6 lines) should be 40,54M€ and 27,22 M€, with a potential saving of 13,32 M€ in case of ETB system adoption.
€/vekm
Dr Co Vp Ip Vm Im Es Va la Ge
H tram Q ETB
Figure 1: Ctl transport cost components on line "8".
Urban Transport VI, C.A. Brebbia & L.J. Sucharov (Editors) © 2000 WIT Press, www.witpress.com, ISBN 1-85312-823-6

32 Urban Transport and the Environment for the 21st Century
3»/o
Tram
Figure 2: Ctl transport cost components on line "8", for tram and ETB
Ct2[10"**€/plkm]
2,9
2,6
4,1
-tram-ETB
5,6line 225
10,9 14,6 14,98 516 14
21,730b
29,819
length [km]
Figure 3: Ct2 transport cost [10"̂ * €/plkm] as function of line length
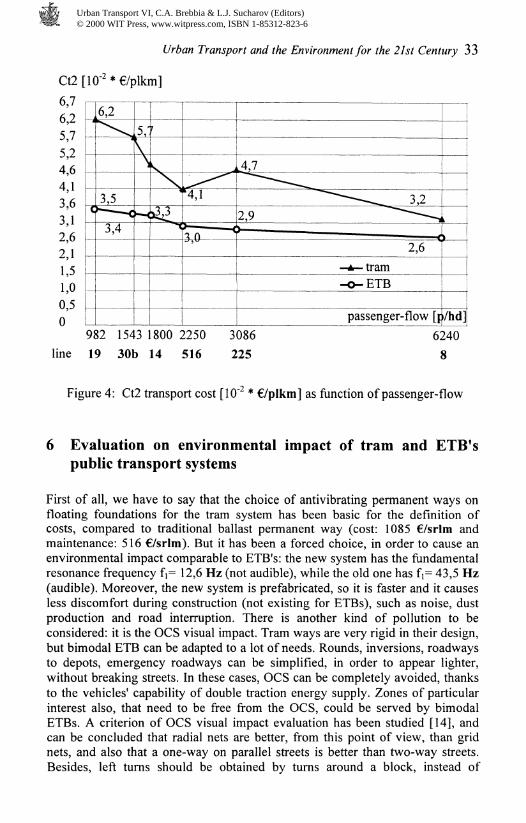
The influence of line length and of passenger-flow on Ct2 can be seen in Figures3 and 4. It's clear that infrastructures influence the costs: it's more expensive totransport one passenger through 100 km than through 20 km! That is caused bythe fare criterion adopted in Rome, as a consequence of which the cost of theticket is independent from the distance. On the contrary, passenger-flow causes amore intensive use of the system, and so more efficiency.
Urban Transport VI, C.A. Brebbia & L.J. Sucharov (Editors) © 2000 WIT Press, www.witpress.com, ISBN 1-85312-823-6
Urban Transport and the Environment for the 21st Century 33
Ct2[
6,76,25,7
5,24,6
4,13,6
3,12,6
2,11,51,0
0,50
10- *€/plkm]
— ̂
C
,6,2
3,5> <3,4
5,"
\\
j
\\
H>2̂ _t̂
^̂4,1
'̂̂ HJ'
.4,7
~̂~~-̂ 3,22,9 ^̂ ^) ,
2,6 ^
-&- tram-O-ETB
passenger-flow [\
L
»/hd]
line
982 1543 1800 2250 3086
19 30b 14 516 225
6240
8
Figure 4: Ct2 transport cost [10 * €/p!km] as function of passenger-flow
6 Evaluation on environmental impact of tram and ETB's
public transport systems
First of all, we have to say that the choice of antivibrating permanent ways onfloating foundations for the tram system has been basic for the definition ofcosts, compared to traditional ballast permanent way (cost: 1085 €/srlm andmaintenance: 516 €/srlm). But it has been a forced choice, in order to cause anenvironmental impact comparable to ETB's: the new system has the fundamentalresonance frequency f\= 12,6 Hz (not audible), while the old one has fi= 43,5 Hz(audible). Moreover, the new system is prefabricated, so it is faster and it causesless discomfort during construction (not existing for ETBs), such as noise, dustproduction and road interruption. There is another kind of pollution to beconsidered: it is the OCS visual impact. Tram ways are very rigid in their design,but bimodal ETB can be adapted to a lot of needs. Rounds, inversions, roadwaysto depots, emergency roadways can be simplified, in order to appear lighter,without breaking streets. In these cases, OCS can be completely avoided, thanksto the vehicles' capability of double traction energy supply. Zones of particularinterest also, that need to be free from the OCS, could be served by bimodalETBs. A criterion of OCS visual impact evaluation has been studied [14], andcan be concluded that radial nets are better, from this point of view, than gridnets, and also that a one-way on parallel streets is better than two-way streets.Besides, left turns should be obtained by turns around a block, instead of
Urban Transport VI, C.A. Brebbia & L.J. Sucharov (Editors) © 2000 WIT Press, www.witpress.com, ISBN 1-85312-823-6

34 Urban Transport and the Environment for the 21st Century
crossing the main street OCS. All these conditions are better satisfied by abimodal ETB rather than a tram.In conclusion the authors suggest the use of ETB in spite of tram in towns wherethe underground is not possible for urbanistic and geomorphologic configuration,and if possible, it is too much expensive.
Acknowledgements
The Authors want to thank Prof. Eng. Francesco Filippi for his qualifiedsuggestions.
References
[1] Villanti L., Confronto prestazionale e funzionale tra mezzi filoviari efilotranviari (tram, metropolitane leggere di superficie) e relative impattoambientale, Master Thesis Univ. "La Sapienza" of Rome dip. Ing. Elettrica,1998-99.
[2] Liberatore M., Sistemi di Tr asp or to di Mass a e TecnologieInnovative,Masson, Milano, 1994.
[3] Regione Lazio, Assessorato Trasporti Energia e Protezione Civile,Fattibilita del Sistema di Trasporto Filoviario, Roma, 1991.
[4] Dejeammes M., Accessible Low-Floor Bus System Approach in France,Transportation Research Record, TRR 1604, 9/1997.
[5] Bourgeois G., Le Site ^Experimentation du Trans Val-De-Marne Pour leTransports Intermediaires Guides Sur Pneus, TEC n°146, 1-2/1998.
[6] Larsen R., Feasibility of Advanced Vehicle Control System for TransitBuses, Transportation Research Record, TRR 1604, 9/1997.
[7] Muzzi G., Alternativa Tram Filobus per una Linea Dor sale a Livorno,Autostrade, 3-4/1998.
[8] ATAC/COTRAL (Roman Public Transport Company) Area ManutenzioneImmobili Sistemi Tranviari, Consistenza degli Impianti e del Rotabili della#efe rrorzWano dz #oma, 9/1998.
[9] Marra C., Modello di Simulazione della Marcia e del Consumo Energeticoin un Sistema di Trasporto Collettivo su Rotaia, Master Thesis univ. "LaSapienza" of Rome dip. Trasporti e Strade, 1997-98.
[ 10] Benfatto I., Valutazione del Consumi Energetici della Linea TranviariaCasaletto-Centro, Master Thesis univ. "La Sapienza" of Rome dip. Trasportie Strade, 1997-98.
[ 11 ] ATAC/COTRAL Divisione Ingegneria ATAC Servizio Sistemi Tranviari,Progetto Esecutivo della Tranvia Casaletto-Centro Relazione Tecnica,Roma, 3/1996.
[12] Fiat Eerroviaria, Tram a Pavimento Ribassatoper ATAC Roma.[13] BredaMenarinibus, Filobus Articolato Bimodale F32L[14] Schwartz A., Kulpa J.S., Falcocchio J.C., Evaluation of Visual Impact of
Trolley Bus Overhead Catenary System Intersections, TransportationResearch Record, TRR 1503, 1994
Urban Transport VI, C.A. Brebbia & L.J. Sucharov (Editors) © 2000 WIT Press, www.witpress.com, ISBN 1-85312-823-6