(Triticum aestivum · isolated immature embryos ol cv. Frame with a construct carrying lhe bar...
245
[k'\z'o* GENETIC TRANSFORMATION OF WHEAT (Triticum aestivum L.) ZAINUDDIN A thesis submitted in fulfillment of the requirement for the degree of Doctor of Philosophy Department of Plant Science Faculty of Agricultural and Natural Resource Sciences The University of Adelaide, Waite Campus Glen Osmond 5064 South Australia December 2000
Transcript of (Triticum aestivum · isolated immature embryos ol cv. Frame with a construct carrying lhe bar...

[k'\z'o*
GENETIC TRANSFORMATION OF WHEAT
(Triticum aestivum L.)
ZAINUDDIN
A thesis submitted in fulfillment of the requirement
for the degree of Doctor of Philosophy
Department of Plant Science
Faculty of Agricultural and Natural Resource Sciences
The University of Adelaide, Waite Campus
Glen Osmond 5064
South Australia
December 2000

TABLE OF CONTENTS
Abstract
Statement of Authorship
Acknowledgments
Abbreviations
CHAPTER ONE: GENERAL INTRODUCTION
1,1 Background
1.2 Steps in genetic engineering
1.3 Tissue culture of wheat
1.3.1 Explant sources
1.3.2 Plant growth regulators
1.3.3 Plant genotypes
1.4 Genetic transformation of wheat
1.4.1 Methods of wheat transformation
1.4.1.1 Agrobacterium tumefaciens
1.4.1.2 Direct gene transfer into protoplasts
1.4.1.3 Microprojectile bombardment
Bombardment device
Bomb a rd me nt p a ramete rs
DNA coating methods
1.4.2 Promoters and markers used in wheat transformation
1.4.2.1 Promoters
il
Page No.
vii
X
xi
xiii
10
12
13
14
16
17
18
1
2
3
5
þ
7
II
10
18

1.4.2.2 Markers
1.5 Transgene inheritance in transgenic wheat
1.6 Somaclonal variation
1.7 Aims of the project
CHAPTER TWO: TISSUE CULTURE OF WHEAT
2.1 lntroduction
2.2 Malerials and Methods
2.2.1 Plant material and growth conditions
2.2.2 Tissue culture media
2.2.3 lsolation and culture of explant tissue
2.2.4 lnduction of somatic embryos and plant regeneration
2.3 Results
2.3.1 Production of somatic embryos
2.3.2 Factors affecting tissue culture response
2.3.3 Organogenesis and plant regeneration
2.3.4 Appearance of regenerated plants
2.4 Discussion
CHAPTER THREE: TRANSFORMATION OF WHEAT
3.1 lntroduction
3.2 Materials and Methods
3.2.1 Plant material
3.2.2 lsolation and culture of explant tissue
3.2.3 Gene constructs
I

3.2.4 Preparation of gold pafticles
3.2.5 DNA coating methods
3.2.6 Bombardment conditions
3.2.7 Somatic embryo induction and selection of transformants
3.2.8 Histochemical GUS staining
3.2.9 Phosphinothricin acetyl transferase (PAT) assay
3.2.10 Herbicide leaf-dip test
3.2.11 Genomic DNA isolation
3.2.11.1 Small scale isolation of genomic DNA
3.2.11.2 Digestion of genomic DNA
3.2.11.3 Electrophoresis of DNA
3.2.12 Southern blot hybridization
3.2.12.1 Membrane preparation
3.2.12.2 Preparation of radiolabelled DNA probes
Probe DNA fragment preparation
Radiolabelling of DNA probes
3.2.12.3 Hybridization procedures
3.2.12.4 Reprobing the membrane
3.2.13 Statistical analysis
3.3 Results
3.3.1 Optimisation of bombardment conditions
3.3,2 Production of somatic embryos
3.3.3 Plant regeneration and selection of transformants
3.3.4 PAT assay
3,3.5 GUS staining

V
3.3.6 Response to the herbicide leaf-dip test
3.3.7 Southern blot analYsis
3.3.8 Appearance of the primary transformants
3.4 Discussion
CHAPTER FOUR: TRANSGENE INHERITANCE AND EXPRESSION IN
PROGENY OF TRANSFORMED WHEAT
4.1 lntroduction
4.2 Malerials and Methods
67
68
71
73
4.2.1
4.2.2
4.2.3
4.2.4
4.2.5
Plant growth conditions and maintenance
Histochemical GUS staining
PAT assay and herbicide leaf-dip test
Southern blot hybridization
Statistical analysis
82
83
84
84
84
84
85
86
87
87
87
87
88
88
90
91
91
92
92
4.3 Results
4.3.1 Transgene inheritance in T1 plants
4.3.1.1 PAT assay
4.3.1.2 Response to the herbicide leaf-dip test
4.3.1.3 GUS staining
4.3.1.4 Southern blot analysis
4.3.1.5 Appearance of T1 plants
4.3.2 Transgene inheritance in T2 plants
4.3.2.1 PAT assay
4.3.2.2 Response to the herbicide leaf-dip test
4.3.2.3 GUS staining

4.3.2.4 Southern blot analYsis
4.3.2.5 Appearance of T2 Plants
4.3.3 Transgene inheritance in T3 plants
4.3.3.1 PAT assay
4.3.3.2 Response to the herbicide leaf-dip test
4.3.3.3 GUS staining
4.3.3.4 Southern blot analysis
4,3,3.5 Appearance of T3 plants
4.4 Díscussion
CHAPTER FIVE: SUMMARY AND FUTURE DIRECTIONS
5.1 Summary of experiments described here
5.2 Future directions
5.2.1 Donor material health and transformation efficiency
5.2.2 Transgene silencing
5.2.3 Tissue culture effects
5.2.4 Analysis of transgene integration patterns
5.2.5 Field trials and evaluation of transgenic plant products
5.2.6 Production of marker-free transgenic plants
5.2.7 Inseftion of useful genes
APPENDICES
93
95
95
96
96
96
97
98
99
110
111
113
114
114
116
116
118
119
121
122
127REFERENCES

vil
Abstract
Wheat (Triticum aestivum L.) was one of the earliest crops to be
domesticated and is now becoming the world's most important food crop. The
demand for this commodity has increased in parallel with the growth of world
population. Thus, it is becoming increasingly important to secure the supply of
wheat, and it is therefore crucial to continuously enhance worldwide wheat
production. So far, the main strategy for improving wheat production has been
through conventional breeding methods. However, it is becoming apparent that to
maintain production targets it will be necessary to complement conventional
breeding methods with genetic engineering technology.
The successful application of genetic engineering in wheat is dependent on
the availability of suitable tissue culture and transformation methods, and the
development of these technologies using elite Australian wheat varieties was the
primary objective of experiments described here. The specific goals of this project
were:
. to screen Australian wheat genotypes for in vitro cullure responsiveness
. to transform the responsive wheat genotypes with selectable marker and
repofter genes, and
o to study the inheritance and expression of transgenes in successive wheat
generations.
ln testing the responsiveness of wheat genotypes in culture, four Australian
wheat genotypes (cvs. Hartog, Frame, Krichauff and Janz) were used, lmmature
scutella were cultured onto Murashige and Skoog (MS) basal medium containing
different combinations and concentrations of 2,4-dichlorophenoxyacetic acid and

viii
benzylaminopurine. Three genotypes (cvs. Hartog, Frame and Krichauff) grew
well in culture and one genotype (cv. Janz) did not. Two genotypes, namely cvs.
Hartog and Krichauff, responded well in a medium containing 2 mg/l 2,4-
dichlorophenoxyacetic acid, while another genotype (cv. Frame) needed the same
concentration of 2,4-dichlorophenoxyacetic acid with the addition of 0.1 mg/l
benzylaminopurine. With these media, almost all immature scutella produced
embryogenic callus, which was subsequently regenerated into mature, feftile
plants.
Regeneration systems developed for the three responsive genotypes were
coupled with a microprojectile bombardment-mediated transformation method. By
bombarding immature scutella oÍ cvs. Haftog, Frame and Krichauff, or freshly
isolated immature embryos ol cv. Frame with a construct carrying lhe bar gene,
with or without another construct carrying the GUS gene, four transgenic plants
(cv. Frame) were produced. Three of the four transgenic plants were shown to
carry two or more copies of the bar gene, and another plant carried one copy of
the bar gene and three or four copies of the GUS gene. The introduced
transgenes were expressed in the transgenic plants; bar gene expression was
indicated by the presence of PAT activity and herbicide tolerance, whilst the
expression of the GUS gene was followed by the presence of GUS activity in
histochemical assays that led to blue staining in both vegetative and reproductive
organs.
The bar and GUS transgenes integrated into the genome of transgenic
wheat were transmitted to successive generations. The transmission of the
transgenes showed a Mendelian pattern of inheritance, and a homozygous
genotype was achieved at T2 progeny. This suggests that the transgenic wheat

ix
analysed here had a heterozygous genotype of integrated bar and GUS
transgenes. lt was obserued that the expression of the GUS gene was stable over
several generat¡ons, but that the expression of the bar gene was inactivated in
some progeny, as indicated by the loss of PAT activity and herbicide tolerance.
The phenotypic characteristics of the primary transformants were, in most
cases, slightly inferior to non-transformed, control plants, but showed some
improvement in subsequent generations.
As a result of the work, transformation of elite Australian wheat varieties
should be achievable on a routine basis, albeit at relatively low transformation
frequency. This opens the way for the inseftion of potentially useful genes into
wheat, with the longer term aim of enhancing productivity and/or quality
characteristics.

X
Statement of AuthorshiP
This work contains no material which has been accepted for the award of
any other degree or diploma in any university or other teftiary institution and, to
the best of my knowledge and belief, contains no material previously published or
written by another person, except where due reference has been made in the text.
I give consent to this copy of my thesis, when deposited in the University
Library, being available for loan and photocopying.
Signed Date: O I aoo

XI
Acknowledgments
I am greatly indebted to my superuisors, Professor Geoffrey B. Fincher, Dr.
Javed A. Qureshi, Dr. Rachel A. Burton and Dr. Arun P. Aryan for their advice,
encouragement, knowledge, patient supervision, and critical reading of this thesis,
It is no exaggeration to say that without their help this thesis could not have been
finished. Not only has their reading of the thesis led to the elimination of many
errors, but I have been greatly assisted in my understanding of the subjects by
frequent discussion with them. I wish to thank Dr. Kenneth W. Shepherd for his
valuable discussion and constructive suggestion.
I am also indebted to Mr, Rohan R. Singh, Mr. Keith T, Gatford, Mr, Marei
S. Al-Nahdi, Mr. Andrew J. Haruey and Dr. Nona Pessina for their helpful
guidance, valuable suggestion and friendship during my studies. I would like to
thank Mr. Michael R. Dalton for his significant technical assistance. Pafticular
thanks to Mrs. Margaret Cargill for reading an earlier version of this thesis. Her
helpful suggestions led to many improvements being made.
I extend my thanks to Dr. A.J. Rathjen for providing wheat grains used
during these studies and to Mrs. Chriscintia Cohler, Mr. Ernie Nagy and Mr. Peter
Cassidy for their help in many ways. I also wish to thank to Dr. Maria Hrmova and
all friends in our laboratory for their helpful discussion, support and co-operation.
My special thanks goes to lr. Masril Bustami, MSc, the Dean of Agricultural
Department, Tadulako University, and to lr. Muslimin, MP, for their advice and
moral support during this study.

xil
Grateful thanks are also due to Australian Agency for lnternational
Devetopment (AusAID) and the Department of Plant Science, University of
Adelaide for financial assistance.
Last but not least my special thanks to my family and all my relatives for
their endless support, love and encouragement throughout my studies.

xilt
ABA
Abbreviations
Abscisic acid
Benzylaminopurine
B-glucuronidase
hectare
kilobase
milliampere
phosphinoth ricin acetyl transferase
particle delivery system
particle inflow gun
pounds per square inch
revolutions per minute
5-bromo-4-chloro-3-indolyl-B-D-glucuronic acid
2,4-dich lorophenoxyacetic acid
BA
GUS
ha
Kb
mA
PAT
PDS
PIG
ps¡
rpm
X-gluc
2,4-D

CHAPTER ONE
GENERAL INTRODUCTION

1.1 Background
Wheat is one of the most important cereal crops and was amongst the first
plants to be domesticated. lt belongs to the genus Triticum of the family Poaceae
(Cornell and Hoveling, 1998). Wheat is widely grown in subtropical countries and
is the staple food of nearly 35% of the world population (Braun et a1.,1998).
The current production of wheat in the world stands at 560 million tons per
annum and demand for wheat has increased simultaneously with the growth of
world population. lt is estimated that the demand of wheat in the world will be
around 840 (Rosegrant et al., 1995) to 1050 million tons (Kronstad, 1998) for the
second decade of the next century, To reach this demand, current global wheat
production will need to increase at least 1 .6I" annually (Braun et al., 1998).
So far, the main strategies for improving wheat production have been by
increasing yield through conventional breeding methods and through the
expansion of cultivated area. However, the implementation of these strategies
faces a number of limitations that are imposed by biological, environmental and
practical problems (Fry ef a/., 1998).
The recent innovation in agricultural biotechnology through genetic
engineering has provided a new tool for making more rapid improvements in
wheat productivity and security of supply. The successful application of genetic
engineering in wheat is largely dependent on the availability of suitable tissue
culture techniques and transformation methods, and the development of these
technologies using elite Australian wheat varieties was the primary objectives of
experiments described in this thesis.
The literature review that follows lists the major steps in genetic engineering
and highlights prior work relating to tissue culture and transformation of cereals,

Chapter One 3
predominantly focused on wheat. Further sections review the behaviour of
inherited transgenes and somaclonal variation in wheat. Finally, the detailed aims
of the project conducted in this study are presented'
1.2 Steps in genetic engineer¡ng
Genetic engineering has been developed to enhance the phenotypic
performance and agricultural value of plants, and to facilitate the investigation of
basic biological processes in genetically modified plants, such as gene
expression. Engineering plants for desirable characters involves several distinct
steps. Wilke-Douglas ef a/. (1986) have presented seven impoftant steps in plant
genetic engineering, as follows.
1) ldentification of a gene of interest, Genes that are attracting special attention
for use in plant transformation include genes that are involved in resistance to
herbicides, antibiotics, diseases and viruses, in stress tolerance and in quality
improvement. These genes can originate from bacteria, viruses, fungi, plants or
animals.
2) lsolation and characterization of the gene. The isolation of a gene of interest
begins with the construction of a gene bank or library. From the library, a gene (or
genes) of interest is isolated and identified by nucleotide sequencing. The gene
may be furlher characterized to provide basic information on the products, which
are usually proteins, specified by the gene.
3) Cloning a functional gene. The isolated gene of interest is subcloned into
appropriate vectors. Once the gene has been isolated and cloned, it can be
modified to enhance or alter its function. For example, its promoter may be

Chapter One 4
changed so that the gene can be expressed in a particular host plant, or its
sequences are modified to alter the biological function of the gene product.
4) Construction of a vector for gene transfer. The ability to join pieces of DNA
together in vitro before insertion into an organism enables the construction of a
vector for gene transfer. This process includes the assembly of a regulatory
region (promoter), trg¡_s-g¡!p"!igl_?l.and translational staft signals, the coding region
and a stop signal. The promoter may either be native or foreign to the gene.
Such hybrid genes can specify the production of new proteins or proteins that are
expressed at different times and levels or in distinct tissues.
5) lntroduction of the gene into plant cells, This is known as transformation. After
the identification, isolation and manipulation of the gene of interest, the gene is
introduced into plant cells. The ability to incorporate the introduced gene into the
plant genome is a key step in genetic engineering. Once the gene is incorporated
into the plant genome, the gene should be expressed and stably inherited.
6) Selection of transformed cells, The selection of transformed cells is generally
achieved through the use of a selectable marker in combination with the
corresponding selective agent. During the selection process, non-transformed
cells surrounding transgenic cells will die, whilst transgenic cells can grow fufther.
7) Regeneration of the engineered plant. The last step in plant genetic
engineering is to regenerate intact, fertile plants from transformed cells. This is
performed by inducing the transformed plant cells, under in vitro culture
conditions, to form so_¡qlic cells from which transgenic plants are produced.
Beside the seven steps stated above, Mendel and Teeri (1995) added a
further step which is important in establishing new transgenic cultivars of crop
plants, namely that the introduced gene should be consistently transmitted to

Chapter One 5
future generations, in a predictable fashion. This is necessary not only for the
demonstration of true integration of the introduced gene into the plant genome,
but also for the practical maintenance of the transgenic trait.
1.3 Tissue culture of wheat
Tissue culture is a term used to describe a method for the cultivation rn
vitro of plant parts at the cell, tissue or organ level. lt is carried out under aseptic
conditions, where nutrients and environmental conditions are controlled. The
application of this technique has provided a system that allows the investigation of
physiological, biochemical, genetic and structural problems related to plants and
has paved the way for the development of plant transformation technologies
(Lazzeri and Shewry, 1993).
The successful application of tissue culture or in vitro culture techniques is
dependent upon the production of competent cultures which can regenerate into
intact plants. Vasil (1987) has pointed out several factors that control regeneration
in cultures. These include the source of explants, the requirement for growth
regulators and the plant genotypes.
In vitro culture technology for wheat and other cereal plants has progressed
rapidly through the identification of such factors. Much research has been
focused on the responsiveness of explants, on favourable growth regulator
requirements for cultures and on genotypic effects. These studies are reviewed
briefly in the following subsections.

Chapter One 6
1.3.1 Explant sources
The source of explants is one of the most important factors which
determines the production of callus and embryoOelig callus. Terminologically,
callus refers to the proliferation of de-differentiated cells arising from cultured
explants, and embryogenic callus describes the ability of the callus to form an
embryo which will subsequently regenerate into an intact, fertile plant under
appropriate conditions (Dodds and Roberts, 1995).
ln wheat, a number of explant sources have shown competence to produce
embryogenic cultures and these include .Iqgt tips (Dudits ef a/., 1975; Vieftel and
Hess, 1996), anthers (Shimada and Makino, 1975; Lazar et al., 1985, 1987;
Armstrong et al., 1987; Jones and Petolino, 1987;1988; Zhou and Konzak, 1989;
Zhou et al., 1991; Ekiz and Konzak, 1997; Zheng and Konzak, 1999) and leaf
bases (Ahuja et al., 1982;Zamora and Scott, 1983; Wernicke and Milkovits, 1984;
Rajyalakshmi et al., 1991). Some research groups have repofted difficulty in
regenerating intact plants from these explants and, in addition, many have
obserued the production of albino and infeftile plants.
Other explants that have been used in tissue culture of wheat include
mature embryos (Eapen and Rao, 1982; Mohmand and Nabors, 1990, 1991;
Özgen et al., 1998), immature inflorescences (Ozias-Akins and Vasil, 1982;
Maddock et al., 1983; Barcelo et al., 1991; Sharma et al., 1995; Marcinska et al.,
1995), zygotes and ovules (Kumlehn et al., 1997";1997b). The use of such
explants in wheat tissue culture, however, has limitations, mainly associated with
difficulties in initiating suitable cultures. Fufthermore, the latter methods are labor
intensive during the maintenance and regeneration stages.

Chapter One 7
So far, immature embryos have been the most successful and most
frequently-used explant in wheat tissue culture. This was demonstrated by early
repofts that highly regenerable callus could be easily produced from immature
embryos (Chin and Scott , 1977; Gosch-Wackerle et al., 1979; Sears and Deckard,
1982). ln the following repofts, the superiority of immature embryos over other
explants was clearly demonstrated for the generation of embryogenic cultures and
for the recovery of fertile plants (He ef a/., 1986; Papenfuss and Carman, 1987;
Qureshi et al., 1989; Redway et al., 1990; Ben Amer and Börner, 1997). Based
on these repofts, it is clear that immature embryos are currently the explant of
choice for initiating regenerable cultures of wheat.
1.3.2 Plant growth regulators
Growth regulators play a crucial role in inducing explant growth in culture.
The most common growth regulator used in tissue culture is synthetic auxin,
especially 2,4-dichlorophenoxyacetic acid (2,4-D). The use of 2,4-D in tissue
culture of wheat has been reported by many research groups (Ozias-Akins and
Vasil, 1982;1983; Galiba and Erdei, 1986; Wernicke et al. 1986; Kaleikau et al.
1989; Mohmand and Nabors, 1991;Ben Amerand Börner, 1997). ln othercases
2,4-D has been combined with a low level of abscisic acid (ABA) (Brown et al.
1989; Qureshi et al. 1989). A few researchers have reported the use of Dicamba
(3,6-dichloro-o-anisic acid) (Dudits et a\.,1975) or picloram (4-amino-3,5,6-
trichloropicolinic acid) (Collins ef al., 1978) for inducing callus and regenerating
wheat plants.
It has also been noted that some wheat cultivars required cytokinins
(kinetin), in combination with synthetic auxins such as 2,4-D (Lazar et a1.,1988) or

Chapter One I
dicamba (Papenfuss and Carman, 1987), to produce regenerable callus. ln other
cases the inclusion of cytokinins in the culture medium had a negative effect on
callus growth (Dudits et a\.,1975). Based on these studies, it has become crucial
to evaluate the requirements of growth regulators in culture, especially when
testing new wheat cultivars for tissue culture responsiveness, that is the efficiency
of callus induction, callus growth and regeneration frequency.
1.3.3 Plant genotypes
The effect of genotypes on tissue culture responsiveness has been
demonstrated in several prior studies. The efficiency of callus induction, callus
growth rate and regeneration of wheat are all highly genotype dependent (Sears
and Deckard, 1982; Lazar et al., 1983; Maddock et al., 1983; Ou ef a/., 1989;
Bohorova et al., 1995). Work by Mathias and Simpson (1986) suggested that
genotype was the single most impoftant factor affecting culture response of wheat
explants.
Several groups have investigated the nature of tissue culture response
differences arising from genotype. Higgins and Mathias (1987), Kaleikau et al.
(1989) and De Buyser et al. (1992) concluded that nuclear genomes play a crucial
role in controlling the response of explants in culture, and this factor they claimed
to be the basis of genotypic differences in wheat tissue culture. ln other studies,
Mathias and Fukui (1986), Mathias et al. (1986) and Felsenburg et al. (1987)
reported that tissue culture responsiveness of wheat was determined by
cytoplasmic genes, or by interaction between cytoplasmic and nuclear genes.
From all these studies, it is apparent that the response of wheat in tissue culture is
probably influenced by both nuclear and cytoplasmic genes.

Chapter One 9
In contrast, it has been argued that different responses of cultured explants
in in vitro aulture largely result from physiological phenomena, and are
independent of the genetic background of the cultured explants. For example,
Close and Ludeman (1989) showed that the induction of somatic embryogenesis
in maize could be achieved by simply manipulating the composition of the culture
medium. Duncan et al. (1985) confirmed that cultured immature embryos of
maize obtained from well-nourished donor plants show a better response in
culture than those from nutrient-deficient plants. Similar reports on barley (Hanzel
et al., 1984) and sorghum (Ma et al., 1987) indicated that explants excised from
plants grown under different climatic conditions also responded differently in
culture. lt is concluded therefore that the re.sponse of explants in culture is
determined by many genotypic and environmental factors, each of which plays an
important role in explant response in in vitro culture. The understanding of such
factors is important for establishing a regenerable culture, which is required for
genetic transf ormation.
1.4 Genetic transformat¡on of wheat
Genetic transformation is broadly defined as the transfer of foreign genes
isolated from bacteria, viruses, plants or animals into a new genetic background
(Webb and Morris, 1992). lt will also include the transfer of a gene which might
have been isolated from the host species, manipulated in vitro, and reincorporated
into the same species. ln plants, successful genetic transformation requires the
production of fertile plants which express the insefted genes.
Focussing on the transformation of wheat, the production of transgenic
wheat plants carrying foreign genes finally became a reality after reliable

Chapter One 10
transformation methods were developed and gene expression cassettes
containing suitable promoters and marker genes were constructed.
ln the subsections below, several methods are presented, together with a
description of promoters and marker genes that have been successfully used in
wheat transformation.
1.4.1 Methods of wheat transformation
Until recently, three transformation methods were found to be successful in
the transformation of wheat, namely those effected by Agrobacterium
tumefaciens, direct gene transfer into protoplasts or by microprojectile
bombardment.
1.4.1.1 Agrobacterium tumefaciens
Agrobacterium tumefaciens is a soil bacterium whích can infect plant cells,
especially dicotyledo¡o_us plant species, resulting in crown gall disease. The
infection mechanism of Agrobacterium tumefaciens has been manipulated to
facilitate the transfer of interest genes into plant cells.
ln this transformation procedure, target tissue is coated with a suspension
of bacterial cells, which is known as co-cultivation. During the transformation
process, a specific segment of DNA in a tumor inducing (Ti) plasmid, called T-
DNA, is transferred from Agrobacterrum to the plant cells and subsequently
insefted into the nuclear genome of the infected plant. These functions require a
set of virulence genes, which also reside in the Ti plasmid (Chilton et al., 1977;
Sheng and Citovsky, 1996), The T-DNA can be engineered in vitrolo contain a
selectable marker and/or genes of interest. The Agrobacterium-based
Chapter One 11
transformation system has been facilitated by the use of a binary vector, where
the T-DNA region and the virulence genes are placed in two different plasmids. ln
this system, the transfer of T-DNA or other insefted genes located in one plasmid
is mediated by activity of the virulence region from another plasmid (Webb and
Morris, 1992).
So far, Agrobacterium tumefaciens-mediated transformation has been the
most common and widely-used method for transformation of dicotyledonous
plants, mainly because the method is simple, inexpensive and efficient (De Block,
1993). Because of its simplicity, efforts have been made to extend the method for
transforming cereal crops, including wheat. lnitially, its application for cereal
transformation was believed to be limited because monocotyledons were
considered to be outside the host range ol Agrobacterium (Potrykus, 1990).
The first successful attempt to transform wheat plants using Agobacterium
was reported by Hess et al. (1990). ln this work, a suspension of Agrobacterium
tumefaciens was pipetted into spikelg.!9-9f wheat and several kanamycin-resistant
plants were obtained from the grains. ln the following year, Mooney ef a/. (1991)
infected immature embryos of wheat wifh Agrobacterium tumefaciens and a few
kanamycin-resistant callus lines were produced,
Recently, Cheng et al. (1997) produced transgenic wheat plants showing
herbicide resistance via Agrobacterium tumefaciens. In these experiments,
immature embryos and embryogenic callus were co-cultivated with Agrobacterium
tumefaciens. A tlegtq!!-(Silwet) was routinely added to the Agrobacterium
suspensioÉi prior to inoculation of explants. The addition of the sudactant was
shown to increase the transient expression of GUS gene. This probably
enhanced Agrobacterium allachment to and infection of the co-cultivated explants.

Chapter One 12
The presence of transgenes in the transgenic wheat plants recovered in this work
was confirmed by Southern hybridization analysis and by genetic analysis.
The use of Agrobacterium-mediated transformation has been repofted in
other cereals such as rice (Chan et al., 1993; Hiei ef al., 1994), maize (lshida ef
a/., 1996) and barley (Tingay etal., 1997; Qureshi etal., 1997). lt is believedthat
further improvement of this system will eventually make it more efficient and
routine for cereal transformation. Because the successful application of the
Agrobaçterium-mediated method for wheat transformation was initially limited,
direct DNA transfer methods using microprojectile bombardment have been
developed concu rrently.
1.4.1.2 Direct gene transfer into protoplasts
Protoplasts are single plant cells from which the cell wall has been
removed. They are prepared by incubating cells or tissues in a solution containing
a mixture of cellulolytic and pectolytic enzymes (Brettell and Murray, 1995). The
success in establishing suspension cultures from wheat protoplasts from which
plants have later been regenerated has been repofted by several research groups
(Yang et al., 1991; He ef al., 1992). This success has indicated that transforming
wheat through protoplasts is a viable method.
Foreign genes are introduced into protoplasts following treatment either
with polyethylene glycol or by electroporation (Potrykus, 1991), Several groups
have reported success in delivering foreign genes into wheat protoplasts and in
obtaining transient expression (Lörz et al., 1985; Ou-Lee et al., 1986; Hauptman
et al., 1987; Oard et al., 1989). Success in the recovery of stably transformed
wheat callus from protoplasts has also been achieved, but subsequent plant

Chapter One 13
regeneration was not obtained in early exper¡ments (Marsan et al., 1993; Zhou et
a/., 1993). However, He ef a/. (199a) demonstrated the transformation of wheat
protoplasts and the production of stably transformed embryogenic colonies from
which flowering wheat plants were regenerated. Although this method has
successfully been applied to wheat transformation, the method is rarely used
because the technique is technically demanding and transformation cannot be
achieved on a regular basis.
1.4.1.3 Microprojectile bombardment
Microprojectile bombardment, or biolistics, is a DNA delivery system in
which the genetic material is coated onto micropafticles of tungsten or gold and
propelled into the target cells (Sanford, 1990). lndeed, the microprojectile
bombardment method of transformation has opened the door for cereal genetic
manipulation. The technology r/úas ¡nitially pursued and developed because of the
limited success of Agrobacterium-based methods wíth cereals. Now that this
hurdle has been cleared and Agrobacterium-mediated transformation of wheat
has been demonstrated (Cheng et al., 1997; Fry et a/., 1998), biolistics-effected
transformation is being re-examined because often produces plants containing
multiple and unwanted inseftions. The regulating bodies are becoming more
cautious and sophisticated in demanding transgenic plants with simpler insertions,
if the plants are to be accepted for commercial release. Once again attention is
focussed on Agrobacterium for producing simpler and more acceptable
transformation events.
Christou (1992) outlined several theoretical advantages with the use of
microprojectile bombardment for plant genetic transformation. These include;

Chapter One 14
1. an ability to transform intact tissues;
microprojectile bombardment can be used to target a wide range of tissues or
organs and avoids the use of protoplasts or suspension culture.
2. the rapid recovery of transformants;
by bombarding primary explants such as immature embryos, immature
scutella, microspores and meristem tissues, it is possible to accelerate and
shorten the time required for obtaining transgenic cell lines and transformed
plants.
3. the ability to use microprojectile bombardment as a universal delivery system in
all plant species;
microprojectile bombardment results in the production of transgenic plants
from many species, including monocotyledonous and dicotyledonous plants,
and this method can be used to deliver foreign genes into cells of most
genotypes. However, because transformation relies on the production of
intact, transgenic plants, the method is more successful in genotypes which
display a vigorous tissue culture response.
4. its application in studies of basic plant developmental processes;
microprojectile bombardment makes the rapid evaluation of gene function and
of gene regulation during plant growth and development.
Bombardment device
A number of microprojectile bombardment devices have been described in
the literature, ln the first successful transformation of plant cells, which were
epidermal cells of onion, a BiolisticsrM PDS accelerator (DuPont, Wilmington, DE,
USA) was used (Klein et al., 1987). ln this device an acceleration force is

Chapter One 15
generated by the explosion of gun powder. The generated force accelerates a
cylindrical polypropylene macroprojecti¡e, which is loaded with DNA-coated
micropafticles, down a 0.22 calibre barrel towards the target cells. The
polypropylene macroprojectile is stopped by a polycarbonate disk which has a
small hole through which the microparticles continue towards the target cells.
Sufficient particle velocity is achieved when the acceleration chamber is kept
under a partial vacuum. Other bombardment devices with a similar fundamental
design to the Biolistics device have been also developed, but have used
compressed air or gas (nitrogen) to generate the accelerating force (lida et al.,
1990; Oard et al., 1990).
The electric discharge particle acceleration device differs in design from the
above devices, In this device, a shock wave is generated by the discharge of a
capacitor through a small water drop inside a polyvinyl chloride expansion
chamber. The shock wave causes the upward acceleration of a thin mylar carrier
sheet carrying the DNA-coated particles towards a retaining screen. When the
sheet hits the retaining screen, the particles continue onward and penetrate into
target tissues. The use of this device in plant transformation has been reported by
several research groups (McOabe et al., 1988; Christou, 1990).
The most common bombardment device currently used in plant
transformation is the biolistic PDS-1000/He gun, which is distributed by BioRad
Laboratories (Figure 1,1). ln operation, the PDS-1000/He device is powered by
helium gas, which builds up pressure behind a rupture disk. When the disk
ruptures, a burst of helium gas accelerates a macrocarrier, upon which DNA-
coated microcarriers have been dried. The accelerated macrocarrier is retained
by a stopping screen, but the microcarriers are allowed to continue downward until


Figure 1.1 Microprojectile bombardment device. (A) the biolistic particle
delivery system (PDS)-1000/He gun. (B) bombardment principles; rupture disk
compressed by helium gas bursts at ceftain pressure and accelerates
microparticle-coated DNA that is loaded onto a macrocarrier. The macrocarrier
moves down and it is retained by a stopping screen, while microcarriers pass
through and penetrate into target tissues (Source: modified from BioRad Products
Catalog, 1998/99)

Chapter One 16
they impact and penetrate the target cellsitissues. The main chamber is
maintained under reduced pressure to increase the velocity of the microcarriers
(Kikkert, 1993). The PDS-1000iHe device possesses several advantages over
other models, such as a safer operation, more uniform distribution of microcarriers
over the target cells/tissues, and better control of bombardment power which, in
turn, enables the cells/tissues to be bombarded in a less harsh fashion (Kikkert,
1993). Until recently this bombardment device has proved to be the most versatile
method for plant transformation and has been successfully used to transform all
major cereal crops, including wheat (Vasil, et al., 1992; Weeks, et al., 1993;
Becker, et a1.,1994; Karunaratne ef a/,, 1996; Takumi and Shimada, 1997).
B o m bard me nt parameters
Since microprojectile bombardment-mediated transformation is a
mechanical method for the introduction of DNA into the plant genome, several
physical parameters should be considered in order to obtain a satisfactory result.
Such parameters include helium pressure, the distance between the rupture disk
and the macrocarrier and the flight distance of macrocarrier and microcarriers.
With the PDS-1000/He gun, the gas pressure is generally about 1100 psi, the
distance between the rupture disk and the macrocarrier is about 1 cm and the
distances of macrocarrier travel and microcarrier flight are about 1.1 cm and 12
cm, respectively (Kikkert, 1993).
Although the physical parameters for bombardment have been defined, the
method is still relatively inefficient, because only a few cells survive the physical
disruption caused by bombardment (Hunold et al. 1994). The suruival of cells
after bombardment is probably affected by the number of pafticles used. Work by
Chapter One 17
Becker et at. (1994), Jahne et al., (1995), Altpeter et al. (1996) and Rasco-Gaunt
et al. (1999) demonstrated that small numbers of gold pafticles are more
favourable for explant viability than large numbers. Higher particle densities (100-
1 16 pg gold particles per bombardment) resulted in a significant reduction in
embryogenic callus formation and plant regeneration.
Another factor which might affect the results is bombardment pressure.
Koprek et al. (1996) demonstrated that transgenic plants were successfully
recovered, even from genotypes showing low regeneration capability, by
bombarding target tissues at low pressures (60-90 psi) using the particle inflow
gun (PlG). A reduction in the production of transgenic plants was observed when
target tissues were bombarded at high pressure (800-1200 psi using the PDS-
1000/He device). Thus, physical factors can be critical for optimizing DNA delivery
and for the recovery of transgenic plants.
DNA coating methods
Several groups have endeavoured to standardize DNA coating methods
prior to microprojectile bombardment (Klein et al., 1987,1988; Russell, et al.,
1993). Usually, DNA is precipitated onto gold or tungsten particles in the
presence of CaOlz and spermidine. Microparticles of gold are often preferred to
tungsten, because gold pafticles are more spherical, more uniform in size and are
biologically inert; they do not degrade DNA or harm the impacted cells (Kikkert,
1993; Sanford et a1.,1993).
Although the coating process has been standardized, different groups often
employ slightly different procedures for DNA precipitation. For example, Perl et al.
(1992) carried out DNA precipitation with silver thiosulfate instead of calcium

Chapter One 18
chloride, and eliminated spermidine from the DNA-microparticle mixture. They
reported that their DNA precipitation procedure significantly increased transient
GUS expression in bombarded tissues and surpassed the previous reports of
Klein ef a/. (1988) and Vasil et al. (1991). ln contrast, Vasil et al. (1993) argued
that the exclusion of spermidíne from the DNA precipitation procedure drastically
reduces transgene expression.
1,4.2 Promoters and Markers used in wheat transformation
1.4.2.1 Promoters
One impoftant determinant of transformation efficiency is the promoter
used to direct expression of the transgene. Two fundamentally different kinds of
promoter are known. One kind includes constítutive promoters, which induce the
expression of transgenes in all or almost all tissues, regardless of developmental
and environmental signals.
The most commonly used constitutive promoter in plant transformation
studies to date has been lhe CaMV 35S promoter of the cauliflower mosaic virus
35S RNA gene (Bekkaoui et al., 1990; Charest et al., 1993). This promoter has
been widely used in dicotyledons and, in some cases, in cereals such as maize
(Rhodes et al., 1988), rice (Shimamoto et al., 1989), barley (Lazzeri et al., 1991)
and wheat (Vasil et al., 1991; Orliz et al., 1997). However, levels of transgene
expression driven by the CaMV 35S promoter are generally lower in
monocotyledonous species than in dicotyledonous species (Fromm ef a/., 1985;
Hauptmann et al., 1987). Consequently, efforts have been made to identify more
efficient promoters for cereals.

Chapter One 19
Based on observations made by several research groups, it was noted that
the alcohol dehydrogenasel (adhl) promoter of maize could drive transgene
expression at levels equivalent to or higher than those obtained with lhe CaMV
35S promoter (Zhang and Wu, 1988; Vasil et al., 1992), lt was also found that the
addition of an adhl or a maize shrunkenl intron between the promoter and the
coding region greatly increased the level of transgene expression in cereal plant
cells (Callis et a\.,1987; Vasil et a/., 1989).
So far, the promoters which are probably the most effective in expressing
transgenes in cereals are the rice Actinl (actl) promoter, with its first intron
(McElroy et al., 1990; Zhang et al., 1991;He and Lazzen, 1998), and the maize
ubiquitinl (ubil) promoter, along with its first intron (Christensen et al., 1992; Orliz
et al., 1997). The successful use of these promoters has been documented in
wheat (Weeks et al., 1993; Nehra et al., 1994; Takumi et al., 1994), barley (Wan
and Lemaux, 1994) and rice (Toki et a1.,1992).
ln other studies, it was found that cereal-derived promoters, such as the
adhl promoter of maize (Ellis et al., 1987), were not efficient in activating
transgene expression in dicotyledonous plants. From these studies, it appears
that dicotyledonous and monocotyledonous plants require specific promoters for
high level transcription of transgenes in their genome.
Another group of promoters includes the non-constitutive promoters, which
are activated in a tissue-specific and/or inducible fashion. These promoters
specifically activate transgene expression in ceftain tissues, in response to
physical stimuli, in response to biotic and abiotic stresses, or to physical damage.
Examples of tissue-specific and inducible promoters are the tomato rbcS and rice
rbcS promoters. These direct mesophyll-specific transcription and are induced by

Chapter One 20
light. Kyozuka et al. (1993) used these promoters to drive the expression of the
GUS gene in transgenic rice and observed that the expression of the introduced
gene was restricted to leaf blade and sheath mesophyll cells. Fufthermore,
expression was light dependent.
ln wheat, Barro et al. (1997) repofied success in using native promoters of
1Ax1 and 1DxS glutenin genes. These promoters, which are endosperm-specific,
direct the expression of their own genes, namely 1Ax1 and 1DxS genes, and
result in increased levels of glutenin in the grains of transgenic wheat plants and
their progeny. Based on repofts reviewed here, it becomes clear that the
construction of an appropriate regulatory element or a promoter is crucial for
driving transgene expression efficiently.
1.4.2.2 Markers
Marker genes, including selectable and scorable markers, are essential for
the successful transformation of wheat. Such genes, especially the selectable
markers, are important for the selection of transgenic cells from non-transgenic
cells. ln common transformation procedures, transgenic cells are recovered by
culturing transformed cells on medium containing a selective agent, which
corresponds to the selectable marker used. Transgenic cells expressíng the
acquired marker gene will suwive on the medium, while non-transgenic cells will
die or their growth will be severely retarded.
So far, the selectable markers extensively used in plant transformation
have been genes that confer antibiotic or herbicide resistance on transgenic cells.
For example, the nptll gene encodes neomycin phosphotransferase and confers
resistance to aminoglycoside antibiotics such as kanamycin, geneticin and
Chapter One 21
paramomycin (Bevan et al., 1983). This gene has been successfully used in
transformation of wheat (Nehra et a1.,1994), rice (Uchimiya et a/., 1986; Raineri ef
a/., 1990), maize (D'Halluin et al., 1992) and barley (Ritala et al., 1994). Similarly,
lhe hpt gene encodes the enzyme hygromycin phosphotransferase and confers
resistance to hygromycin (Waldron ef a/., 1985); it has been also used forwheat
(Or1iz et al., 1996), rice (Hayashimoto et al., 1990; Hiei ef al., 1994) and maize
transformation (Walters ef al., 1992).
The herbicide resistance genes CP4, encoding glyphosate tolerant
enolpyruvyl shikimate phosphate synthase (EPSPS) and GOX, encoding
glyphosate oxidoreductase, confer resistance to the herbicíde glyphosate. The
glyphosate normally inhibits EPSPS, which is a crucial "nryr" for the
biosynthesis of aromatic amino acids such as phenylalanine, tyrosine and
tryptophan. The introduction of the EPSPS gene into the plant genome results in
overproduction of EPSPS, so this could overcome the reduction in aromatic amino
acid biosynthesis caused by the glyphosate (Shah et al., 1986). The herbicide
resistant gene GOX encodes glyphosate oxidoreductase, which degrades the
herbicide glyphosate to form the non toxic compound, aminomethyl phosphonic
acid. The presence of this enzyme in plant cells can therefore protect the plants
from the toxicity of glyphosate.
Both the EPSPS and GOX genes have been used in the production of
transgenic wheat plants (Zhou et al., 1995; Qureshi et al., lgg5), but the most
common selectable marker used for wheat transformation has been the bar gene
(Vasil et al., 1993; Becker et al., 1994; Altpeter, 1996), The bar gene encodes
phosphinothricin acetyl transferase (PAT) and confers resistance to the herbicides
Basta@ and Bialaphos. This is made possible by the ability of the gene product

Chapter One 22
(PAT) to acetylate and hence detoxify phosphinothrícin, the active ingredient of
the herbicide Basta@ which inhibits plant growth by inactivating glutamine
synthase. Phosphinothricin detoxified by PAT will therefore not interfere with the
activity of glutamine synthase. Hence, assimilation of ammonia into L-glutamate
by glutamine synthase can proceed and the death of plant cells by ammonia
overload is prevented (De Block et al., 1987).
Another selective marker used in wheat transformation is lhe manA gene.
The manA gene encodes mannose-6-phosphate isomerase (MPl), which is an E,
coli glycolytic pathway enzyme, This enzyme catalyses the interconversion of
mannose-6-phosphate and fructose-6-phosphate (Miles and Guest, 19S4).
Normally, plants cannot use mannose-6-phosphate as a carbon source, but
transgenic plants carrying lhe manA gene can grow on media containing mannose
phosphate as the sole carbon source. This positive selection strategy has been
shown to work for wheat (Reed et al., 1999) and maize (Hansen and Wright,
1999), and has the potential to be a key component of future cereal
transf ormation strategies.
Progress in plant transformation has also been achieved by improvement in
the utilization of scorable markers or repofter genes. These genes are especially
important for the early detection of transgene expression in transformed cells.
Several repofter genes such as those linked to anthocyanin synthesis (Klein et al.,
1989), to chloramphenicol acetyltransferase (caf) (Kartha et a/., 1989), to firefly
luciferase (Fromm et al., 1990; Sadasivam and Gallie, 1994; Lonsdale et al.,
1998; Baruah-Wolff ef a/., 1999; Harvey et a\.,1999) and to the green fluorescent
protein (GFP) (Sheen et al., 1995; Pang et al., 1996; Fry et a/., 1998; Vain etal.,
1998; Elliott et a1.,1999), have been used in plant transformation.

Chapter One 23
Until very recently, the GUS (uidA) gene, encoding p-glucuronidase, has
been the most common repofter gene used in wheat transformation (Nehra et al.,
1994; Becker et al., 1994). This gene has been utilized both forthe development
of transformation systems and as a repofter of stable transformation. ln plants,
the expression of the this gene can be detected fluorometrically or
histochemically. Of these two methods, the histochemical procedure is easier and
more commonly employed.
The histochemical assay operates via lhe ability of the GUS gene product
(p-glucuronidase) to catalyse the hydrolysis of the colourless compound S-bromo-
4-chloro-3-indolyl-B-D-glucuronic acid to release free indolyl derivatives which are
blue in colour. The blue coloured products can be detected visually in plant
tissues. The degree of GUS gene expression is determined by the metabolic
status of the tissues (Jefferson, 1987; Jefferson et al.,1gS7).
1.5 Transgene ¡nheritance in transgen¡c wheat
Studies focused on transgene inheritance and stability in transgenic wheat
plants are still few in number. The stable transmission and expression of
transgenes in a predictable manner has been demonstrated by Vasil et al. (1993),
where the inheritance of transgene expression showed Mendelian ratios of 3:1 in
self-pollinated transgenic plants and 1:1 in cross-pollinated transgenic plants. ln
other studies, however, transgenes were unstable and were inherited in a non-
Mendelian fashion (Srivastava et al.,1996).
It has been suggested that instability of transgene expression in transgenic
plants is paftly attributable to transgene silencing. The silencing of transgenes
could be affected by the surrounding chromosomal environment into which the

Chapter One 24
transgenes were integrated (Pröls and Meyer, 1992; Demeke et al., 1998), as well
as by the age and developmental stage of the cells (Myer et al., 1992; Walter et
al., 1992).
lnactivation of transgenes in plants might also be influenced by the
presence of multiple copies of transgenes in the plant genome (Finnegan and
McElroy, 1994). However, transgene inactivation has been reported not only in
transgenic plants carrying multiple copies of the transgene (Müller et al., 1996;
Alvarez et al., 2000), but also in transgenic plants having a single copy of the
transgene (Elmayan and Vaucheret, 1996).
Based on these repofts, it is clear that more studies are needed for
investigating the behaviour of transgene inheritance and expression in transgenic
plants. Results from such studies are not only impoftant for transgenic plant
producers and plant breeders, but the results are also crucial for considering the
reliable application of transformation technology in agricultural practice.
1.6 Somaclonal variation
Somaclonal variation is a term that refers to increased genetic variation in
plants regenerated from tissue culture (Larkin and Scowcroft, 1981). In wheat,
genetic variability resulting from tissue culture includes chromosomal aberrations,
such as inversion and deletion of chromosomes (Ahloowalia, 1982; Karp and
Maddock, 1984), and alteration in the expression of single genes (Larkin et al.,
1984). lt was speculated that the occurrence of such variations arises from errors
during in vitro cell division. The occurrence of somaclonal variation is generally
higher in regenerants recovered from cells that have been in culture for a long
period (Vasil, 1987).

Chapter One 25
lnitially, much attention was devoted to the possible advantages of
somaclonal variants for producing new cultivars. However, such expectations
were not realised because most somaclonal variants showed poor agronomic
performance and low fertility, as was reported for wheat by Ahloowalia (1982) and
Ahloowalia and Sherington (1985), Qureshi et al. (1992) also provided evidence
that superior characters of somaclonal variation-derived regenerants identified
during in vitro culture were lost when the progeny of the regenerants were grown
under field conditions. Similarly, Bozorgipour and Snape (1997) repofted that
somaclonal variants which showed herbicide tolerance in culture failed to transmit
their characters to progeny.
ln relation to transformation experiments, the effects of somaclonal
variation have also been repofied. Vasil et al. (1992) showed that many
transgenic wheat plants exhibited poor growth and were mostly sterile.
Furthermore, Bregitzer et al. (1998) reported that transgenic barley progeny
exhibited retarded growth and low yields. All of these researchers believed that
the presence of such aberrant agronomic characteristics was attributable to
somaclonal variation.
To minimize the incidence of somaclonal variation during cereal
transformation, it is therefore impoftant to develop a simple regeneration system
and to avoid prolonged culture of cells.
1.7 Aims of the proiect
The main aims of the current study were to screen four Australian wheat
genotypes lor in vitro cullure responsiveness and to transform the responsive

Chapter One 26
genotypes us¡ng microprojectile bombardment. Within this overall aim, specific
goals were:
o to assess the growth regulator requirements for each wheat genotype
screened
o to develop regeneration systems for the responsive wheat genotypes. These
experiments are described in Chapter 2
o to transform the responsive wheat genotypes with selectable marker and
reporter genes. The results of this work are presented in Chapter 3
o to study the inheritance and expression of the transgenes in successive wheat
generations. Results of these studies are described in Chapter 4
Finally, possible future experimental directions arising from work described here
are outlined in Chapter 5.

CHAPTER TWO
TISSUE CULTURE OF WHEAT

ChapterTwo 28
2.1 lntroduction
The availability of an efficient regeneration system is a prerequisite for the
successful application of genetic transformation. ln wheat, the efficiency of the
regeneration system depends upon the capacity of cultured cells to produce
embryogenic callus and the ability of this callus to regenerate into fertile plants.
One impoftant factor influencing embryogenesis and regeneration in wheat
is the source of explant. So far, the most common and reliable explant for
inducing embryogenic callus and regenerating wheat plants has been the
immature embryo (Fennell et al., 1996). Besides the source of the explant, callus
induction and regeneration of wheat are affected not only by the composition of
the culture medium (Elena and Ginzo, 1988; He ef al., 1989), but also by the
genotype (Sears and Deckard, 1982; Bohorova et al., 1995). Mathias and
Simpson (1986) and Maës et al. (1996) assessed the effects of culture medium
and genotype on culture response for a range of wheat plants and suggested that
genotype appeared to be more significant than the culture medium.
Similarly, genotype considerably influences the success of wheat
transformation (Weeks ef al., 1993; Nehra et al., 1994; Takumi and Shimada,
1997; lser et al., 1999). During the development of wheat transformation
procedures, most research groups have chosen wheat genotypes which respond
well in culture rather than genotypes of agronomic importance. Consequently,
transformation procedures developed for wheat are still applicable to a limited
number of genotypes, and many of these are of iir¡t"O value in terms of
agronomic pedormance and breeding potential.
ln an attempt to broaden the range of wheat genotypes amenable to
transformation and to demonstrate a wider application of microprojectile

Chapter Two 29
bombardment-mediated transformation for wheat, it is crucial to find candidate
genotypes that grow well in culture. While it has been argued that genotype is of
secondary importance to culture "vigour" in cereal transformation, because
transgenes in a stably transformed plant can subsequently be backcrossed into
the desired genotype, cereal breeders generally support the direct incorporation of
potentially useful transgenes into elite breeding varieties or lines (Professor A.R.
Barr, Dr, A.J. Rathjen and Assoc. Prof. G.J. Hollamby, personal communication).
This generally reduces the time required to produce the final variety for release,
and allows the transgene to be evaluated in a more appropriate genetic
background.
For these reasons, four Australian elite wheat varieties were screened for
their tissue culture response. Three of the four screened varieties (cvs. Frame,
Krichauff and Janz) are widely grown across Southern Australia and another
genotype (cv. Hartog) is predomonantly planted in the north east of Australia. The
latter cultivar has also been used by a number of laboratories across Australia for
tissue culture and successful transformation of Hartog has been repofted (He ef
al., 1992; Witrzens et al., 1998). All four Australian wheat genotypes used here
are important hexaploid bread wheat cultivars. ln the work described in this
Chapter, experiments were undeftaken to screen the four Australian wheat
genotypes that were capable of producing regenerable callus in culture, and to
determine the optimal requirements and concentrations of growth regulators for
each responsive genotype.
Chapter Two 30
2.2 Materials and Methods
2.2.1 Plant material and growth conditions
Four elite Australian spring wheats (cvs. Haftog, Frame, Krichauff and
Janz) were used in these experiments. Grains were kindly provided by Dr. A.J.
Rathjen of the Department of Plant Science, University of Adelaide, Waite
Campus.
Plants were grown in the glasshouse, in growth chambers or in the field.
Temperatures in the glasshouse varied between 12oC and 3OoC, with a 10-14
hour photoperiod, depending on the season. All grains were sown in eight-inch
pots filled with Recycled Soil (RS) (see Appendix 1 for details). Seedlings of the
four genotypes were grown in the glasshouse until ready for haruest, which was
usually 80-95 days after sowing, depending on the genotype and environmental
conditions.
Pots in the glasshouse were fertilized as follows: Osmocote@ (t5-4.8-10.8
for N-P-K, respectively) (Scotts Australia Pty. Ltd, Australia) and soluble John
Innes (Jl) feeder (36-11-11 for N-P-K, respectively) (formulated by South
Australian Research and Development lnstitute; E. Nagy, personal
communication) were applied simultaneously six weeks after the grains were
sown, at a dosag e of 2 and 0.045 kg/m3 soil, respectively. Thereafter, plants were
fertilized every ten days with soluble Jl feeder, also at a dosage of 0.045 kg/m3
soil. Any plants infected with tungi were sprayed at recommended dosages with
fungicides such as Sulphine (3 g/l) or Bayfidan (0.4 ml/l), Mites were sprayed with
miticides such as Omite (2 gll) or Pyranica (1 g/l),
Some plants were grown in growth chambers, especially in the summer
season when glasshouse temperatures regularly rose above 3OoC. The

ChapterTwo 31
temperature in the chambers was maintained at 1soO during the day and 12oC
during the night, with a 10114 h day/night photoperiod. Plants were grown under
these conditions for 50 days and transferred to another chamber where the
temperature and photoperiod were increased to 1goO during the day and 16oC
during the night, with a 16/8 h day/night photoperiod, respectively. The plants
were grown in the second chamber until haruested. Plants were fertilized as
described for plants grown in the glasshouse.
Plants of three wheat genotypes (cvs. Hartog, Frame and Krichauff) were
also grown in the field at Charlick Experimental Station, Strathalbyn during the
winter season. Fertilizer (Osmocote@) was applied at sowing at a dosage of 250
kgiha. Plants grown in the field were watered as required. All plants grown in the
glasshouse, growth chamber and field were tagged at the time of pollination.
2.2.2 Tissue culture media
The basic medium used during these experiments was Murashige and
Skoog (MS) (1962) basal medium supplemented with 37o sucrose. The medium
was solidified with 0.8% Bitek agar (DIFCO, Detroit, USA) and the pH was
adjusted to 5.7 with sodium hydroxide prior to autoclaving (Appendix 2). The
media were sterilised in the autoclave al121oC for 20 min.
To test the in vitro cullure response of the wheat genotypes, three varieties
(cvs. Frame, Krichauff and Janz) were cultured on the MS basal medium
supplemented with various combinations and concentrations of 2,4-
dichlorophenoxyacetic acid (2,4-D) and benzylaminopurine (BA) (see Table 2.1 tor
the combinations and concentrations of the two growth regulators tested in these
experiments). Another genotype (cv. Hartog), which is reported to be responsive

Table 2.1 Combinations and concentrations of 2,4-D and BA tested on three
Australian wheat genotypes (cvs. Frame, Krichauff and Janz)
BA (mg/l)
0 1 3 52
O MSDOBAO MSDOBAI MSDOBA2 MSDOBA3 MSDOBA5
1 MSDI BAO MSDI BA1 MSDI BA2 MSDI BA3 MSDI BA5
2,4-D (mg/l) 2 MSD2BAO MSD2BAI MSD2BA2 MSD2BA3 MSD2BAS
3 MSD3BAO MSD3BAI MSD3BA2 MSD3BA3 MSD3BAS
5 MSD5BAO MSD5BA1 MSD5BA2 MSDsBA3 MSD5BA5
Notes: MSDOBAO is MS basal medium with no growth regulators.MSDSBA2 is MS basal medium with the addition of 3 mg/l 2,4-D (D) and 2 mg/l BA.

Chapter Two 32
in culture (Yang et al.,1991; He ef al., 1992; A. Aryan, personal communication),
was cultured on MS basal medium supplemented with 2,4-D at concentrations of
1,2,3 or 5 mg/1.
2.2.3 lsolation and culture of explant tissue
Developing grains from the four wheat genotypes were haruested ten to 14
days after pollination, when they were 1 lo 2 mm in length (Figure. 2.1A) (Nehra ef
at.,1994). The grains were stored at 4oC for a maximum of five days before use.
All grains were surface sterilised with 1 O"/" (vlv) Domestos@ 1ACl, Australia;
with active ingredients 5.25% w/v sodium hypochlorite, 1.25% w/v sodium
hydroxide and 0.5 g/l "alkaline salts") Íor 20 min and washed five times with sterile
distilled water. lmmature embryos were excised from the grains under a
dissecting microscope (Nikon, Model C-PS) and embryonic axes were carefully
removed from the immature embryos (Nehra et al., 1994). Scutella isolated from
the immature embryos were placed, scutellum face up, in g0 mm Petri dishes
containing 30 ml solid agar MS medium supplemented with the various
combinations and concentrations of growth regulators, as explained in Section
2.2.2 above. Petri dishes were sealed with Parafilm and wrapped in aluminium
foil. Callus production was induced al24-26oC for three to four weeks.
To assess the response of wheat genotypes to medium composition, ten
scutella were cultured per Petri dish. Three Petri dishes were used for each
treatment, bringing the total to 30 scutella per treatment. In the case of cy.
Haftog, the total number of scutella used per treatment varied between 17 and 66
scutella (Table 2.2).

Chapter Two 33
2.2.4 lnduction of somatic embryos and plant regenerat¡on
Callus formed during incubation in the dark was subsequently exposed to a
16 h day/8 h night photoperiod and maintained al 24-26oC fortwo to six weeks.
After two to six weeks exposure to light, the response of explants in culture was
assessed or scored for somatic embryo production. Scutella which failed to form
callus, or formed callus which failed to produce somatic embryos, were scored as
non-regenerable or non-embryogenic. Several parameters, such as the number
and percentage of cultured scutella producing embryogenic callus and the number
of somatic embryos or shoots formed per callus, were scored.
After recording relevant information regarding callus induction and somatic
embryogenesis, somatic embryos or shoots from each embryogenic callus were
picked individually and transferred to MS basal medium without 2,4-D or BA (MS
hormone-free medium) for three to four weeks, to allow plantlet formation.
Occasionally, some of the somatic embryos or the shoots were transferred to MS
hormone-free medium for two weeks and subcultured onto fresh, identical medium
for a further two weeks.
After three to four weeks on the growth regulator-free MS medium, the
number of somatic embryos or embryos producing plantlets was recorded.
Plantlets of around 3 cm in length and with a well-developed root system were
removed from the Petri dishes, washed to remove traces of agar, and planted in
three inch pots containing RS soil. The pots were placed in 37.5 x 25.0 x 25.0 cm
plastic boxes and transferred to the glasshouse. The lid of the plastic box was
closed for two weeks to avoid desiccation of plants. The pots were watered
regularly to maintain a high humidity. After two weeks, the pots were taken out of
the plastic boxes and placed on benches in the glasshouse. ln the following four

ChapterTwo 34
weeks, the growing plants were transplanted into eight-inch pots and grown to
maturity. Other control plants were grown in the same glasshouse. The
phenotypic characteristics and fertility of the tissue culture-derived plants were
recorded and compared with the control plants.

Chapter Two 35
2.3 Results
2.3.1 Production of somatic embryos
Within four to five days of culture, scutella stafted to swell and cell
proliferation commenced. Callus formed from cultured scutella was clearly
identifiable within ten to 14 days after culture, but was allowed to grow for another
two to three weeks in the dark (Figure.2.18). Afterthis time, growing callus was
examined for phenotypic characteristics. Variation was clearly evident in the
texture of the callus. Callus produced from cvs. Haftog, Frame and Krichauff was
hard and compact, whilst callus produced Írom cv. Janz was less compact and
was sometimes friable.
The callus began to produce somatic embryos five to seven days after
exposure to light. However, the response of different genotypes was variable.
Three of the four genotypes tested (cvs. Hartog, Frame and Krichauff) had a high
capacity to produce somatic embryos. One genotype, cv. Janz, showed a low
capacity for the production of somatic embryos.
The experiments also revealed genotypic differences in response to growth
regulators. Two genotypes, cvs. Hartog and Krichauff , produced somatic embryos
after scutella were cultured in the presence ol 2,4-D alone. Good results were
obtained at low concentrations (1 and 2 mg/l) of 2,4-D, whilst concentrations of 3
and 5 mgll 2,4-D led to a lower percentage of somatic embryo production. In
these experiments, the best results were for cvs. Hartog and Krichauff, where
scutella produced embryogenic callus at a f requency of 98 and 100%,
respectively. No callus initiation or embryogenic callus production occurred when
2,4-D was excluded from the induction medium.


Figure 2.1 Steps in tissue culture and regeneration of fertile wheat plants.
(A) immature grain ten to 14 days after pollination (left), isolated embryo (centre)
and isolated scutellum (right) (white bar represents approx. 1 mm); (B) callus
production on induction medium containing 2 mgll 2,4-D; (C) somatic embryo
formation at seven to ten days after exposure to light; (D) separation of somatic
embryos; (E) shoot and (F) plantlet formation in hormone-free media; (G) young,
growing plants established in soil; (H) and (l) mature, fertile plants (cvs. Hartog,
Frame and Krichauff flabelled as TA]) regenerated from tissue culture.

Chapter Two 36
Addition of BA to the ca¡¡us induction medium at all concentrations tested
showed a negative effect on embryogenic callus production, for most genotypes.
On BA-containing medium some scutella became necrotic and showed no fufther
growth.
As shown in Table 2.4,lhe production of embryogenic callus Íor cv. Frame
was less than 60% when the induction media was supplemented with 2,4-D only,
Somatic embryo production increased when the induction media was
supplemented with 1 or 2 mg/|2,4-D combined with a low level of BA (1 mg/l). A
more satisfactory result was obtained when scutella were induced on media
containing 2 mgll 2,4-D combined with a low concentration of BA (0.1 mg/l). lt
was obserued that all cultured scutella produced regenerable callus on this
medium, This contrasts with cv. Janz, which per{ormed poorly under all conditions
tested (Table 2.6). ln Tables 2.2-2.6, the numbers and percentages of
embryogenic callus production, and the number of somatic embryos and shoots
formed per callus from the four genotypes tested are presented.
2.3.2 Factors affecting tissue culture response
ln the initial experiments, which were conducted in 1995, it was
demonstrated that the response of explants in culture was influenced by plant
genotype, as well as by the type and concentration of growth regulators used.
Given an appropriate medium, most genotypes showed a high in vitro culture
response. However, in subsequent experiments in 1996 and 1997, the response
of explants in culture from the three responsive genotypes was reduced
dramatically. This was probably attributable to adverse environmental factors
affecting the quality of donor plant material.

Table 2.2 The number and percentage of embryogenic callus produced by
cv. Haftog in 1995
TreatmentNumber ofscutellacultured
Number ofscutellaproducingembryogeniccallus
Percentage ofembryogeniccallusproduction
Number of callusproducing somaticembryos and shoots1-4 5-7 I or more
Total number ofsomaticembryos andshoots formed
Average no. ofsomaticembryos andshoots formedper callus
MSDl
MSD2
MSD3
MSD5
45
66
17
21
41
65
16
14
16
34
11
11
91
98
94
67
13
26
5
3
12
5
0
0
261
315
60
49
6.37
4.85
3.75
3.50
Table 2.3 The number and percentage of embryogenic callus produced by
cy. Hartog (callus broken into 2-3 pieces) in 1995
Treatment
Number of
scutella
cultured
Number of
scutella
producing
embryogenic
callus
Percentage of
embryogenic
callus
production
Number of
callus broken
into pieces
Total number of
somatic
embryos and
shoots formed
Average no. of
somatic embryos
and shoots
formed per callus
MSD2
MSD2Cas.50*
MSD2Cas.100.*
46
59
65
35
30
45
96
95
95
44
56
62
318
274
427
9.09
9.13
9.49
Note:*;** : MSD2 media with the addition of 50 and 100 mg/l Casein hydrolysate, respectively.

Table 2.4 The number and percentage of embryogenic callus produced by
cv. Frame in 1995
TreatmentNumber ofscutellacultured
Number ofscutellaproducingembryogeniccallus
Percentage ofembryogeniccallusproduction
Total no. ofsomat¡cembryosand shootsformed
Average no. ofsomat¡cembryos andshoots formedper callus
Number of callusproducing somaticembryos and shoots1-4 5-7 I or more
MSDOBAO
MSDl BAO
MSD2BAO
MSD3BAO
MSD5BAO
MSDOBAl
MSDl BA1
MSD2BAl
MSD3BAl
MSD5BAl
MSDOBA2
MSDl BA2
MSD2BA2
MSD3BA2
MSD5BA2
MSDOBA3
MSDl BA3
MSD2BA3
MSDSBAS
MSD5BA3
MSDOBAs
MSDl BA5
MSD2BA5
MSD3BAS
MSD5BA5
Additional treatment
MSD2BAO.lO
MSD2BAO.25
MSD2Cas.100-
30
30
30
30
30
30
30
30
30
30
30
30
30
30
30
30
30
30
30
30
30
30
30
30
30
0
16
17
15
14
0
21
21
20
6
0
5
10
14
6
0
10
10
I11
0
11
16
12
4
0
0
87
79
86
17
0
12
25
32
15
0
12
30
11
21
0
17
13
31
34
162
109
82
0.00
3.94
4.65
4.20
3.21
0.00
4.'14
3.76
4.30
2.83
0.00
2.40
3.00
1.83
2.63
0.00
2.83
2.17
2.82
3.09
8.10
s.19
3.42
53
57
50
47
0
70
70
67
20
0
2
4
0
0
0
4
3
6
3
0
0
1
0
2
0
0
I5
6
2
0
0
1
0
0
0
1
0
1
0
0
0
0
0
0
0
0
0
0
1
0
0
0
0
0
0
0
0
1
3
63
79
63
45
0
5
10
6
8
0
17
33
47
20
0
17
33
20
27
100
70
80
0
5
10
6
7
0
4
I13
6
0.00
2.40
2.50
2.29
2.50
0
6
6
11
11
0
6
6
10
I
0
20
20
37
37
20
30
30
20
21
24
6
I5
3
I11
4
019
Note :
. : MSD2 media with the addit¡on of 100 mg/l Casein hydrolysate.

Table 2.5 The number and percentage of embryogenic callus produced by
cv. Krichauff in 1995
TreatmentNumber ofscutellacultured
Number ofscutellaproducingembryogeniccallus
Percentage ofembryogeniccallusproduction
Total no. ofsomaticembryosand shootsformed
Average no. ofsomaticembryos andshoots formedper callus
Number of callusproducing somaticembryos and shoots1-4 5-7 I or more
MSDOBAO
MSDl BAO
MSD2BAO
MSD3BAO
MSD5BAO
MSDOBAl
MSDl BA1
MSD2BAl
MSDSBAl
MSDsBAl
MSDOBA2
MSDlBA2
MSD2BA2
MSD3BA2
MSD5BA2
MSDOBA3
MSDlBA3
MSD2BA3
MSDSBA3
MSD5BAS
MSDOBAs
MSDl BA5
MSD2BA5
MSD3BA5
MSD5BA5
Additíonal treatment
MSD2BAO.l O
MSD2BAO.25
MSD2Cas.100-
30
42
54
30
30
30
30
30
30
30
30
30
30
30
30
30
30
30
30
30
30
30
30
30
30
0
39
54
22
20
0
93
100
73
67
0
33
20
10
0
0
22
27
17
19
0
10
6
3
0
0
11
17
5
1
0
6
10
0
0
0
178
265
79
43
0
25
'14
5
0
0.00
4.56
4.91
3.59
2.15
0.00
2.50
2.33
1.67
0.00
0
10
6
3
0
0
15
2
1
0
0
0
0
0
0
0
0
0
0
0
0
0
0
0
0
0
1
0
0
0
2
1
0
0
0
0
0
0
0
1
0
0
0
0
4
2
5
0
0
5
2
5
2
0
0
0
0
0
0
0
0
0
0
0
0
0
0
0
0
0
0
0
0
0
0
0
0
0
0
0
0
0
0
14
0
50
0
7
3
0
0
31
4
2
0
0.00
2.O7
2.00
2.00
0.00
0.00
3.40
1.50
1.60
0.00
0
17
7
17
0
0
17
3
I0
0.00
0.00
0.00
0.00
0.00
20
20
30
0
0
0
0
1
1
3
2
5
3
3
6
15
15
20
3
11
11
1.00
3.67
1.83
Note :
* : MSD2 media with the addition of 100 mg/l Casein hydrolysate.
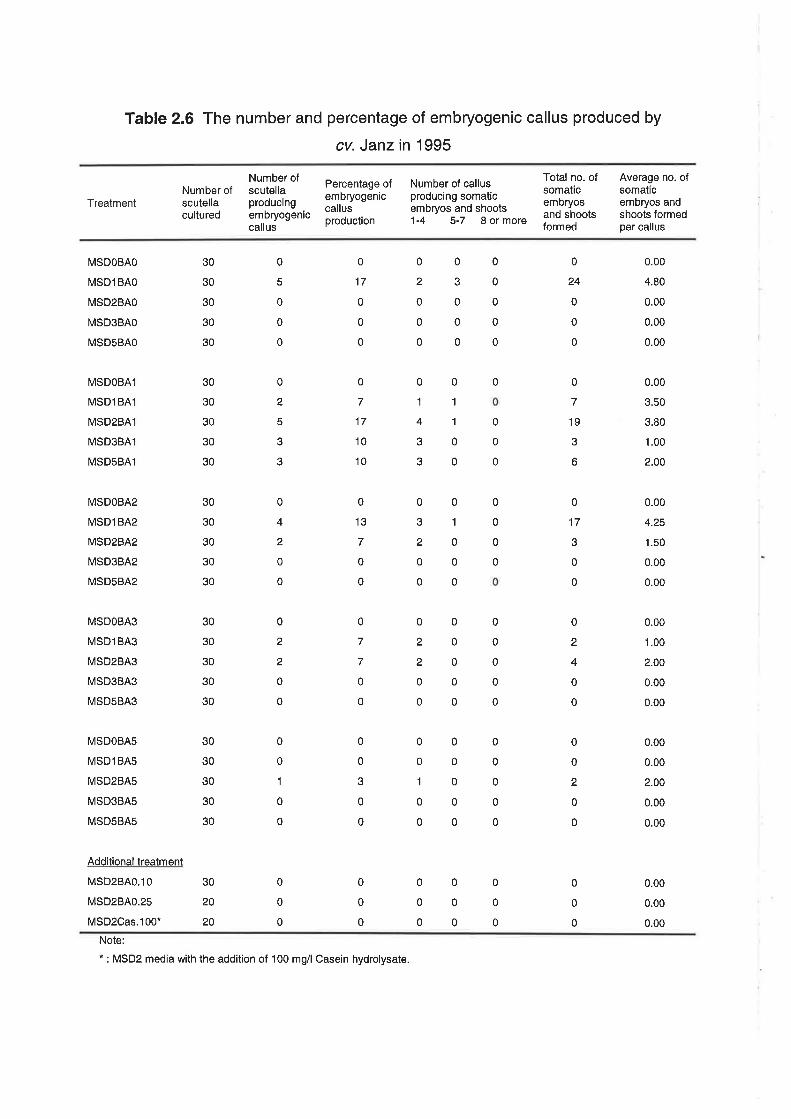
Table 2.6 The number and percentage of embryogenic callus produced by
cv. Janz in 1995
TreatmentNumber ofscutellacultured
Number ofscutellaproducingembryogeniccallus
Percentage ofembryogeniccallusproduction
Total no. ofsomaticembryosand shootsformed
Average no. ofsomaticembryos andshoots formedper callus
Number of callusproducing somaticembryos and shoots1-4 5-7 8 or more
MSDOBAO
MSDlBAO
MSD2BAO
MSD3BAO
MSDsBAO
MSDOBAl
MSDl BA1
MSD2BAl
MSD3BAl
MSD5BAl
MSDOBA2
MSDl BA2
MSD2BA2
MSD3BA2
MSD5BA2
MSDOBAS
MSDlBA3
MSD2BA3
MSD3BA3
MSD5BAS
MSDOBAS
MSDl BA5
MSD2BAS
MSD3BA5
MSDSBA5
Additional treatment
MSD2BAO.l O
MSD2BAO.25
MSD2Cas.100-
30
30
30
30
30
30
30
30
30
30
30
30
30
30
30
30
30
30
30
30
30
30
30
30
30
0
0
0
0
0
0
0
0
0
3
0
0
0
0
2
0
0
0
0
5
0
0
0
0
0
0
0
0
1
1
0
0
0
1
4
3
3
0
2
5
3
3
0
0
0
0
0
1
0
0
0
0
3
2
0
0
0
4
2
0
0
0
2
4
0
0
0
0
0
0
0
0
0
0
0
0
0
2
2
0
0
0
7
7
0
0
0
2
2
0
0
0
0
2
0
0
0
0
0
0
0
0
0
0
0
0
0
0
1
0
0
0
0
3
0
0
0
0
1
0
0
0
17
0
0
0
0.00
4.80
0.00
0.00
0.00
0
24
0
7
17
10
10
0
7
19
3
6
0
17
3
0
0
0.00
3.50
3.80
1.00
2.00
0.00
4.25
1.50
0.00
0.00
0
13
7
0
0
30
20
20
0
0
0
0
0
0
0
0
0
0
0
0
0
0
0
0
0
0
0.00
1.00
2.00
0.00
0.00
0.00
0.00
2.00
0.00
0.00
0.00
0.00
0.00
Note:. : MSD2 media with the addition of 100 mgil Casein hydrolysate.

Chapter Two 37
Several additional exper¡ments were therefore undertaken to improve the
culture response, through manipulation of medium composition, The addition of
ethylene inhibitors, examples of which are silver nitrate and copper sulphate
(Table 2.7), and the use of different sources of starting material (glasshouse-,
growth chamber- or field-grown) were attempted. lt was found that despite all
these treatments, including the use of growth chambers to grow plant material, a
low percentage of embryogenic callus production was still obserued (Tables 2.7
and 2.8) when compared with results achieved in 1995 (Tables 2.2-2.5). As a
result, this problem brought about a significant negative impact on the
transformation experiments conducted between 1996-1997. However, the
problems were overcome in 1999 (see Chapter 3).
ln late 1998, major modifications in conditions used to grow donor plants
were made in collaboration with Mr. Keith T, Gatford (Department of Plant
Science, University of Adelaide). Four different aspects of growing donor plants
were changed, namely the soil used, the watering regime, growth conditions and
fertilization protocols (Table 2.9). Recycled soil used in earlier experiments (1995-
1997) was changed to Horsham soil mix in late 1998-1999, because the recycled
soil showed some variation in texture between batches. The recycled soil also
became hard and compacted after 2-2.5 months, and this could clearly intedere
with root growth and plant development.
Furthermore, the tap water initially used was found to contain high levels of
salt, especially in summer time, and was replaced with reverse osmotic water at
this time. ln the case of the modified growing conditions, the seed/seedlings were
germinated and grown at low temperatures (10 oC) with a short photoperiod (8/16
h), The temperature and photoperiod were increased gradually, and plant growth

Table 21 The number and percentage of embryogenic callus produced f rom
various additional treatments (cv. Haftog only) in 1996
Treatment
Number of
scutella
cultured
Number of
scutella
producing
embryogenic
callus
Percentage of
embryogenic
callus
production
Number of
somatic embryos
and shoots
produced/callus
MSD2
MSD2Cas.100
MSD2Cas.1000
MSD2Cul
MSD2Cu10
MSD2AgNO3
MSD2Cef
MSD2Cu10AgNO3
MSD2CulOOef
MSD2AgNO3Cef.
MSDic2.5
MSD2Malt.
LMD2
100
60
70
70
100
30
30
30
30
30
35
30
70
23 23
23
24
26
24
23
10
17
33
13
17
17
24
1-3
1-3
1-3
1-4
1-4
1-4
1-2
1-3
1-3
1-3
1-2
1-3
1-3
14
17
18
24
7
3
5
10
4
6
5
17
Notes:
Cu : CuSO4 (1 or 10¡rM/l) Cef : Cefotaxime (60p9/l)
Malt:Maltose (6%) Cas:Casein Hydrolysate (100 or 1000 mg/l)
LMD2 : Lazzeri media with the addition of 2 mgA2.4-D (see appendix 2)
Dic : Dicamba (2.5m9/l)
AgNO3: 50mg/l

Table 2.8 The number and percentage of embryogenic callus produced by
cys. Haftog, Frame and Krichauff grown under different conditions in 1997
CultivarSource of
explants
Number of
scutella
cultured
Number of
scutella
producing
embryogenic
callus
Percentage of
embryogenic
callus
production
Total of somatic
embryos and
shoots/callus
No. of somatic
embryos and
shoots/callus
Hartog Glasshouse 3.64
Growth chamber 2.93
Field 3.27
Frame Glasshouse 3.76
Growth chamber 3.06
Field 2.86
Krichauff Glasshouse 2.98
Growth chamber 3.00
Field 3.00
Note:lmmature scutella were cultured on standard media for each genotype (e.9. MSD2BAO for cvs.Krichauff and Hafiog, and MSD2BAO.1 for cv. Frame).
50
30
23
48
28
25
80
50
50
80
50
50
80
50
50
53
30
30
193
88
98
66
60
60
188
92
66
143
84
75
63
60
46
60
56
50

Table 2.9 Modified growth conditions of donor plants
Modifications lnitially New conditions
Soil Recycled soil
Tap water
Directly germinated in soiland grown in glasshouse,growth chamber or fielduntil plants are ready tobe harvested
Using soluble John lnnesfertilizer every 10 daysduring maintenance inthe glasshouse
Horsham soil mix (appendix 3)
Reverse Osmotic (RO) water
Germinated in trays containing Horshamsoil mix for four weeks and placed in agrowth chamber with the temperature andphotoperiod of 1OoC and 8/16 h,
respectively. The seedlings were repottedin 8" pots containing Horsham soil mix andtransferred to growth rooms withtemperature and photoperiod of 1OoC and8/16 h, respectively. The temperature andphotoperiod were increased 1oC and t h
per week, respectively. Thus, at the 8rh
week, the temperature and photoperiodreached 18oC and 16/8 h, respectively. lnthe 9th week, the plants were transferred tothe glasshouse until ready to be harvested.The temperature and photoperiod in theglasshouse were maintained at 2OoC and16/8 h, respectively
Using AquasolrM fertilizer (23:4:18 for N-P-K, respectively) (Hortico Pty Ltd, Australia).The fertilizer was diluted in water (1.5 g/l)and sprayed onto the leaves of plantsevery 14 days during maintenance in thegrowth rooms and the glasshouse
Watering
Germination andgrowing plants
Additional fertilizer

ChapterTwo 38
and development improved significantly. Last, application of Jl fertilizer lo soil was
superceded by spraying Aquasol onto the leaves of plants. The modified fertilizer
regime was intended to prevent nutrient accumulation to toxic levels in soil,
especially when the soil became hard and compacted, Foliar application of
fertilizer was expected to increase the availability of nutrient to the plants.
ln addition to the modifications listed in Table 2.9, immature embryos (ten
to 12 DAA or 1 to 1.5 mm in length) (Pellegrineschi elal., 1999) were used instead
of isolated immature scutella (ten to 14 DAA or 1 to 2 mm in length) (Nehra et al.,
1994). The results of cultured immature embryos obserued from non-bombarded
(control) material in 11 bombardment experiments are presented in Table 2.10.
Although the response of explants (cv. Frame) in culture improved up to 65%,
these results were still low compared with the results obtained in early
experiments (Table 2.4).
2.3.3 Organogenesis and plant regeneration
Somatic embryos produced from scutella-derived callus (Figure 2.1C) were
allowed to germinate and to form shoots by transferring them individually to
MSD0BAO medium (Figures 2.1D-E). The shoots developed into plantlets within
two to three weeks (Figure 2.1F), although not every somatic embryo could be
induced to form a shoot or a plantlet. A variation in capacity to produce fully
developed plantlets was noted among the genotypes tested. Wheat cvs. Haftog,
Frame and Krichauff produced 4-17,5-14 and 3-10 plantlets, respectively, from
callus derived from a single cultured scutellum (data not shown). In these
experiments, no albino shoots or albino plantlets were recovered from the
genotypes tested. Once fully developed plantlets of around 3 cm in length were

Table 2.10 The number and percentage of embryogenic callus produced by
cv. Frame grown under modif ied growth conditions (1999)
Number of
immature embryos
cultured
Number of cultured
immature embryos
producing
embryogenic callus
Percentage of
embryogenic
callus
production
Number of somatic
embryos produced
per callus
2-3
2-4
2-4
1-3
1-4
2-4
2-3
2-4
1-4
2-4
1-3
50
60
58
42
60
65
60
65
55
65
50
5
6
7
5
10
10
12
12
20
20
20
20
20
20
10
12
13
12
13
11
13
5
174 102 59 1-4

Chapter Two 39
formed, these were transferred to soil and were grown under glasshouse
conditions (Figure 2.1G)
2.3.4 Appearance of regenerated plants
ln this study, 28 plantlets belonging to the three genotypes (cvs. Haftog,
Frame and Krichauff) were transferred to soil. Eight of the 28 plants transferred to
soil did not suruive; the non-surviving plants were all oÍ cv. Hartog.
Although the tissue culture-derived plants were healthy, morphologically
normal and fertile (Figures 2.1H-l), they were relatively weak and showed low
fertility compared with control plants, On average, every tissue culture-derived
plant produced approx. 250 grains, whereas the control plants produced 300-375
grains. A few sterile heads were obserued on the tissue culture-derived plants of
all genotypes, but none were obserued on the control plants. Table 2.11 shows
results of the phenotypic assessment and fertility of the tissue culture-derived and
the control plants.

Table 2.11 Phenotypic characteristics and fertility of tissue culture-derived and
control plants
Avetage
CultivarSource of
explant
Plant
grown/
regenerated
Plants
survived
to
maturity
Length of
heads
(cm)
No. of
heads
formed/
plant
No. of
empty
heads/
plant
No. of
grains/
plant
Weight of
grain
(mg/grain)
Hartog Grain (control)
Tissue culture 22
Frame Grain (control) 2
Tissue culture
Krichauff Grain(control) 2
Tissue culture
2 2
14
7
5
10 0.00 352 37
13 0.21 252 30
6
6 12 0.33 258 36
15 0.00 384 39
15 0.00 294 40
10 1 .33 250 38
3
2
3
2
3
5
53

Chapter Two 40
2.4 Discussion
Four Australian wheat genotypes have been screened for their capacity to
produce embryogenic callus from which viable plants could be recovered. The
technique employed in these experiments involved culturing ten to 14 day old
immature scutella from the four genotypes (cvs. Hartog, Frame, Krichauff and
Janz) on a MS basal medium supplemented with two types of grovrtth regulators,
at a range of concentrations, both alone and in combination. The cultured scutella
were subsequently induced by dark treatment to form callus. Callus formed during
induction was later exposed to light for somatic embryo production.
The experiments demonstrated that there were differences among the
wheat genotypes in the production of callus and in their ability to form somatic
embryos (Tables 2.2-2.6). Cultured scutella of cvs, Haftog, Frame and Krichauff
grew well in culture and produced embryogenic callus, while those Írom cv. Janz
were poor in this regard. On average, each callus from cvs. Haftog, Frame and
Krichauff produced 6, 8 and 5 somatic embryos, respectively. Additionally, using
callus from cv. Hartog, the number of somatic embryos produced per explant
could be increased if the original callus was broken into two to three pieces prior
to exposure to light (Table 2.3). When an attempt was made to regenerate the
embryogenic callus, it was noted that each callus from cv. Haftog, Frame and
Krichauff could produce 4-17,5-14 and 3-10 plantlets, respectively (data not
shown).
The results also demonstrated that each wheat genotype had a specific
growth regulator requirement (Tables 2.2-2.6). The optimum 2,4-D concentration
for callus and embryogenic callus production was 2 mg/l for most genotypes
examined. lt was noted that the presence ol 2,4-D at higher concentrations (3

Chapter Two 41
and 5 mg/l) caused more vigorous growth of callus, but the production of
embryogenic callus was reduced. Conversely, the presence of a lower level of
2,4-D (1 mg/l) frequently brought about direct shoot and/or root differentiation.
The present study indicates lhal2,4-D can stimulate callus formation and that the
concentration of 2,4-D added to induction medium is critical (Tables 2.2-2.5),
consistent with the widespread use of 2,4-D for the induction of embryogenic
wheat callus (Ozias-Akins and Vasil, 1982; Sears and Deckard, 1982; Larkin ef
al., 1984; Wernicke et a\.,1986 and Ben Amer and Börner, 1997).
Unlike 2,4-D, the presence of the cytokinin BA in the induction medium at
any of the concentrations tested resulted in a reduction in callus formation and
somatic embryo production for cvs. Krichauff and Janz (Tables 2.5 and 2.6). The
reduction in callus or somatic embryo production appeared to be proportional to
BA concentration.
ln contrast, the presence of BA in the induction medium at a low
concentration was beneficial for both callus and embryogenic callus production for
cv. Frame. lnduction medium containing low levels of BA combined with 1 -2 mgll
2,4-D resulted in higher embryogenic callus production than medium containing
only 2,4-D. The best result was found with the medium consisting of 0.1 mg/l BA
with the addition of 2 mgll 2,4-D, where all cultured Frame scutella produced
embryogenic callus (Table 2.4). Success in initiating embryogenic callus
production has also been repofted in wheat (Papenfus and Carman, 1987), barley
(Rengel and Jelaska, 1986) and rice (Fatokun and Yamada, 1984) by using
induction medium containing a combination of 2,4-D (2-2.5 mg/l) and low levels of
cytokinins (kinetin or BA at 0.05-0.5 mg/l). The presence of cytokinins at high

ChapterTwo 42
levels (>2.5-10 mg/l BA) in induction medium tended to reduce the formation of
regenerable callus (Bhaskaran and Smith, 1988; 1989).
These experiments clearly demonstrated a positive response oÍ cv. Frame
to BA (cytokinins) and a negative response Íor cvs. Haftog, Krichauff and Janz.
Previous work has provided examples of positive (Bhojwani and Hayward, 1977;
Papenfuss and Carman, 1987; Lazar et al., 1983) and negative (Dudits ef a/.,
1975) responses of cultured explants to cytokinins. lt is clear that differences in
the responses of cultured explants result from genotypic effects, as reported by
Ahloowalia (1982) and Carman et al. (1987). These authors speculated that
tissue culture response was influenced by the status of endogenous
phytohormones in the cultured explants. Ahloowalia (1982) cited several previous
research groups that had reported differing levels of cytokinins and auxin in grain
of different wheat cultivars (Gale, 1979; Mounla, 1979). Thus, differences in
endogenous phytohormone content of the grain of wheat genotypes used in these
experiments might have resulted in the obserued differences in culture response.
An additional treatment was also included to test the effect of casein
hydrolysate at concentrations of 50 mg/l or 100 mg/l ín induction medium
containing 2 mg/| 2,4-D (Altpeter et al., 1996). The addition of casein hydrolysate
in induction medium had no effect on embryogenic callus production when it was
compared with induction medium containing only 2 mgll2,4-D (Tables 2.9-2.6).
During this study, 20 tissue culture-derived plants from three genotypes
(cvs. Hartog, Frame and Krichauff) were successfully grown to maturity in the
glasshouse, Under the regeneration system used, mature, fertile plants were
obtained between 22 and 25 weeks after commencement of culture, depending
on plant genotype and season. Mortality of regenerated plants on transfer to soit

ChapterTwo 43
was around 30To. Particular care was necessary during transplanting and
maintenance of the young, growing plants, especially in the first two weeks after
transplanting.
It was obserued that tissue culture-derived plants generally showed
retarded growth and low yield (Table 2.11). The latter was clearly affected by
properties such as a shoft head, reduced numbers of grains, and shriveled grains,
compared with control plants. Poor phenotypic characteristics and reduced fefiility
were reported previously for wheat plants recovered from tissue-cultured material
by Ahloowalia (1982), Larkin et al. (1984), Ahloowalia and Sherington (1985) and
Qureshi et al. (1992). lt is believed that the reduction of vegetative and generative
growth of regenerated plants results from in vitrocullure effects (Vasil, 1988). To
eliminate the negative effects oÍ in vitro culture on tissue culture-derived plants, it
is important to apply as short a tissue culture phase as possible and/or to
undeftake crossing between seed-grown plants and the tissue culture-derived
plants to exclude any mutations or somaclonal variation.
During the current experiments, no albino shoots, plantlets or plants were
regenerated from the genotypes tested. Previous work on wheat tissue culture
has shown that the occurrence of albinos is influenced by genotype (Maddock ef
a/,, 1983; Machii et al., 1998), by the source of explants (Schaefter et al., 1979)
and by tissue culture conditions (Ziegler et a1.,1990; Zhou et al., 1991; Fellers ef
al., 1995). lt was noticed here that the response of wheat explants in culture
varied considerably from one season to another in one particular year, or between
the same season in different years. This was demonstrated by the high
regenerability of explants in culture during the 1995 experiments (Tables 2.2-2.6),
and the dramatic decrease in regenerability in later experiments (Tables 2.7 and

ChapterTwo 44
2.8). These results were similarly obserued in barley by Lührs and Lörz (1987),
where the response of explants in culture varied considerably between years. lt
can therefore be concluded that it is likely, in addition to genotype and growth
regulator requirements, that aspects of plant growth conditions, in particular the
physiological conditions of donor plants, is crucial factor in determining the
behaviour of explants in tissue culture. Studies by Jones and Petolino (1987) and
Hess and Carman (1998) have also highlighted the impoftance of optimizing
donor plant conditions for maximizing in vitro cullure response.
Having achieved high levels of embryogenesis in 1995, considerable efforts
were made to reproduce this tissue culture response in later years. These effofts
included the manipulation of media composition and the use of different sources
of explants (Tables 2.7 and 2.8). However, these efforts had only a minor impact
on tissue culture response. In further attempts, several additional modifications
were therefore devised, and mainly related to the growth conditions of donor
plants. These modifications did lead to a considerable improvement in culture
response (Table 2.1O), but culture response was still relatively lower than that
achieved in early experiments (Table 2.4), Based on these obseruations, it
appears that fufther investigation is needed to fully elucidate the effects of donor
plant condition on tissue culture response.
The cumulative results of these experiments show conclusively that three of
the four Australian wheat genotypes screened (cvs. Hartog, Frame and Krichauff)
grew well in tissue culture, and that fertile plants could be recovered. Under
appropriate tissue culture conditions, most cultured scutella from the three
genotypes produced embryogenic callus, which could be induced to regenerate
fertile plants. lt is believed that the regeneration system developed in this study

ChapterTwo 45
could be adapted for other wheat genotypes and for wheat transformation. The
application of the tissue culture and regeneration protocols in the transformation of
wheat is described in the next Chapter.

CHAPTER THREE
TRANSFORMATION OF WHEAT

Chapter Three 47
3.1 lntroduction
The first successful effort to transform wheat plants was repofted by Vasil
et al. (1992). ln this work, transgenic wheat plants carrying a herbicide resistance
gene were produced via microprojectile bombardment-mediated transformation.
This achievement has encouraged further attempts to generate transgenic wheat
having other desired characters. Transgenic wheat plants carrying various
agronomically-desirable genes, such as those for resistance to vírus (Karunaratne
et al., 1996) and disease attack (Leckband and Lörz, 1998; Bliffeld et al., 1999),
for quality improvement (Shewry et a1.,1995; Blechl and Anderson, 1996; Barro ef
al., 1997; Chibbar et al., 1998), and those for male sterility (De Block et al., 1997),
have now been produced.
However, wheat transformation protocols have generally suffered from low
efficiencies and a variety of DNA delivery systems have therefore been
developed. So far, three transformation methods have been successfully used in
wheat transformation. One is the use of direct gene transfer into protoplasts (He
et al., 1994). However, this technique is technically demanding and, owing to the
long periods of tissue culture required, many of the resulting plants are found to
lack vigour and fertility. Another method is the use of Agrobacterium tumefaciens
(Cheng et al., 1997). This method offers a number of advantages over other
methods, but has not found wide use in wheat. Until recently, the most common
transformation method used in wheat transformation has been microprojectile
bombardment (Lörz et al., 1998). The preference for microprojectile
bombardment is presumably attributable to its relative ease of use, its high
success rate, and because it can be used to deliver transgenes directly into a
range of primary tissues. Therefore, in addressing the aim of transforming wheat

Chapter Three 48
in the present project it was decided to use microprojectile bombardment as the
method of choice.
Next, it was necessary to find suitable selectable marker and reporter
genes for the transformation experiments, The most widely applied selectable
marker gene in wheat transformation vra microprojectile bombardment is the bar
gene, which confers resistance to herbicides such as Bialaphos and Basta@
(Witrzens et al., 1998). In almost all transformation experiments, the bargene has
been co-introduced with repofter genes such as the GUS gene or other genes of
interest (Becker et al., 1994; Zhang et a\.,2000). In many cases, the introduction
of two genes that reside either in the same or in different plasmids results in co-
integration. Since the introduction of transgenes yra microprojectile bombardment
is an apparently random process (Sanford et al., 1993; Pawlowski and Somers,
1996), the introduced transgenes are usually integrated as single or multiple
copies in the plant genome (Blechl and Anderson, 1996; Kohli et al., 1999).
ln the current project, results presented in Chapter 2 demonstrated that
three out of four elite Australian wheat genotypes screened grew well in culture
and that feftile plants could be regenerated. Regeneration systems outlined in
Chapter 2, in combination with the microprojectile bombardment method, were
used for the successful transformation of an elite Australian wheat genotype (cv.
Frame) with the bar and the GUS genes. The results of these experiments are
presented in this Chapter.

Chapter Three 49
3.2 Materials and Methods
3.2.1 Plant material
Three wheat cultivars (Frame, Krichauff and Hartog) were used in
transformation experiments. These three wheat varieties for the most paft, were
grown in the glasshouse. Some material was also grown in growth chambers and
some was grown in the field. The growth and maintenance conditions for the
donor plants were essentially as described in Chapter 2 (Sections 2.2.1 and
2.3.2).
3.2.2 lsolation and culture of explant tissue
Grain sterílisation and scutellum culture conditions were as described in
Section 2.2.3. Specifically, scutella isolated from immature embryos were cultured
in 90 mm plastic Petri dishes containing the appropriate induction medium for
each wheat genotype. The cultured scutella were subsequently incubated in the
dark at 24-26oC for two to three days prior to bombardment (Nehra et al., 1994).
Towards the end of this study, immature embryos instead of isolated
scutella of cv. Frame were used for transformation experiments. These embryos
were haruested from the plants grown under conditions as described in Chapler 2,
Section 2.3.2. The immature embryos were isolated from sudace sterilized grains
and immediately cultured onto osmotic medium for bombardment (Pellegrineschi
et a1.,1999).
3.2.3 Gene constructs
Plasmids pDM302 (Cao et al., 1992), pAct l-D GUS (McElroy et al., 1990)
and pAHC2S (Christensen and Quail, 1996) were used in these experiments

Chapter Three 50
(Figure 3.1). Plasmids pDM302 and pActl-D GUS were provided by Professor R.
Wu (Cornell University, lthaca, NY, USA) and pAHC2S was kindly donated by Dr.
P,H. Quail (Plant Gene Expression Centre, Albany, CA, USA). Plasmids pDM302
and pActl-D GUS consist of the bar and the GUS genes respectively, each under
the control of the rice Actinl promoter and its first intron. Plasmid pAHC25
contains both the bar and the GUS genes, both under the control of the maize
ubiquitin ubil promoter and its first intron. The bar and the GUS genes encode
phosphinothricin acetyl transferase (PAT) and p-glucuronidase (GUS),
respectively.
Plasmid DNA of the three vectors was prepared using the following
procedure. An E coli stock maintained in glycerol at -80oC was transferred, using
a sterile inoculating loop, into 5 ml LB medium (1 lof LB medium consists of 10 g
Bacto-tryptone, 5 g Bacto-yeast extract and 5 g NaCl, pH 7.5) containing 50 mg/l
ampicillin. The culture was incubated overnight at 37oC with continuous shaking.
Two 1.5 ml aliquots of the overnight culture were transferred to Eppendod tubes
and centrifuged at 13200 rpm for 30 sec at 4oC, The supernatant was removed
and the tubes were placed upside down briefly to drain the pellets. The pellets
were resuspended in 100 pl GTE solution (25 mM Tris-HCl buffer, pH 8.0,
containing 50 mM glucose and 10 mM EDTA). After 10 min al 4oC,200 ¡rl
denaturation solution {0.2 M NaOH, 1"/" (wlv) sodium dodecyl sulphate} was
added and the solution was gently mixed. The tubes were incubated on ice for 5
min before 150 pl 3 M potassium acetate, pH 4.8 was added to precipitate
chromosomal DNA. The tubes were held at -2OoC for 15 min and centrifuged at
13200 rpm for 15 min. The supernatant was transferred to a f resh Eppendod tube
and 2 volumes absolute ethanol was added to precipitate plasmid DNA. The
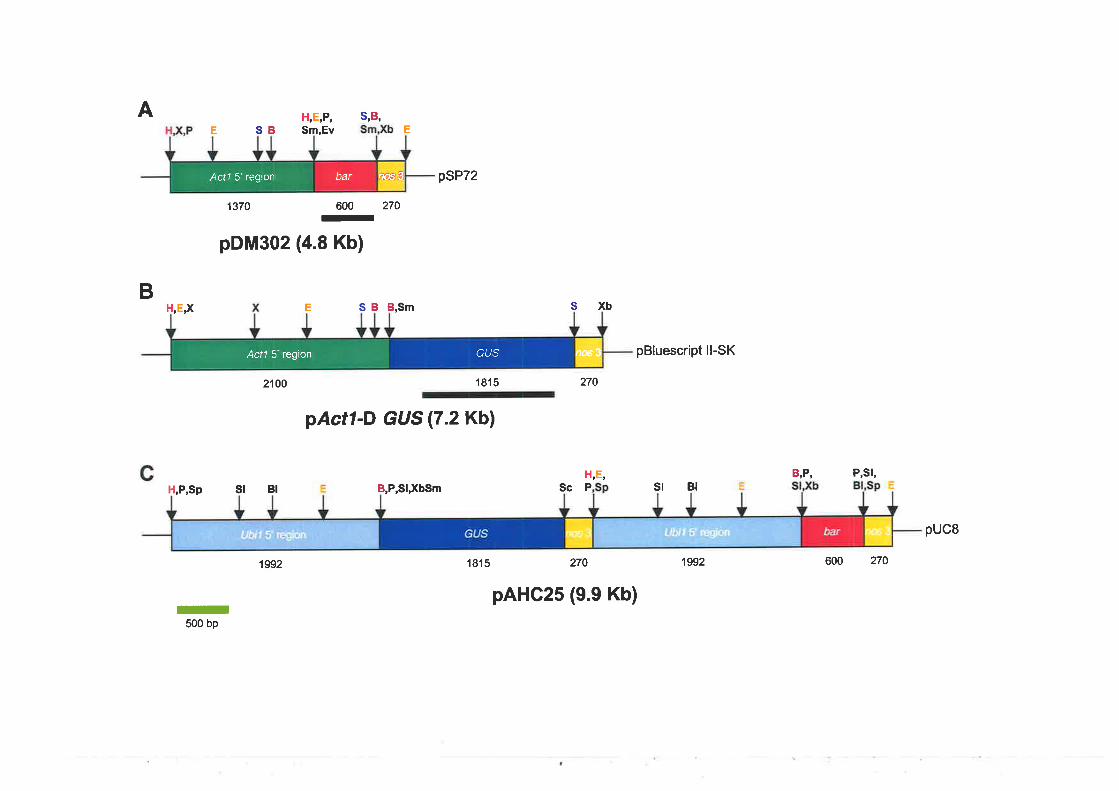
Áctl 5' region bar nos 3
S,B,AEE SB
H,E,P'Sm,Ev
psP72
1370 600 270
-
B
pDM302 (4.8 Kb)
E S B B,Sm
2100
H,P,Sp Sl Bl
1æ2
I500 bp
H,E,X sxb
270
ScP
pBluescript ll-SK
sr Bt
1992
't815
pActl-D GUS (7.2 Kb)
B,P,St,XbSm
1815
H,E, B,P, P,SI,
600 270
pucS
270
pAHC25 (9.e Kb)
nos 3ActT 5' region GUS

Figure 3.1 Schematic representation of constructs used in transformation
experiments. (A) pDM302; (B) pActl-D GUS, and (C) pAHC2S. Abbreviations:
Actl: promoter, first exon and first intron of the rice actin gene; bar: coding region
of Streptomyces hygroscopicus phosphinothricin acetyltransferase gene; nosi
transcript termination region of the Agrobacterium tumefaciens nopaline synthase
gene; Ubil: promoter, first exon and first intron of the maize ubiquitinl gene; and
GUS; coding region of E. coliB-glucuronidase gene. Abbreviations of restriction
sites: B: BamHl; Bl; Bgfll; E: EcoRl; Ev: EcoRV; H: Hindlll; P: Pstl; S: Ssfl; Sc:
Sacl; Sl; Sa/l; Sm: Smal; Sp; Sphl; X: Xhol and Xb: Xbal. The DNA fragments
used as probes in DNA blot hybridization are indicated by black lines under the
coding regions of the pDM302 and pActl -D GUS constructs.

Chapter Three 51
tubes were mixed vigorously by hand, stored at -20oC for 10 min and centrifuged
at 4oC at 13200 rpm for 15 min. The supernatant was discarded and the plasmid
DNA pellets were washed with 1 ml 70% (v/v) ethanol. The tubes were
recentrifuged at 4oC at 13200 rpm for 5 min. The supernatant was removed and
the pellets were dried under vacuum for 5 min. Plasmid DNA was dissolved in 50
pl R40 buffer (10 mM Tris-HCl buffer, pH 7.5, containing 10 mg/ml pancreatic
RNaseA and 15 mM NaCl) and adjusted to a concentration of 1 mg/ml. The DNA
was stored at -20oC until needed for bombardment.
3.2.4 Preparation of gold particles
The method used for preparation of gold particles followed the standard
procedure outlined for the Biolistic@ PDS-1000/He Particle Delivery System
(BioRad Laboratories, Hercules, CA, USA). Gold particles (1 pm diameter,25 mg)
were weighed into a 1.5 ml Eppendorf tube and washed with 1 ml absolute
ethanol. The tube was voftexed for 5 min, left for 10 min to settle, and centrifuged
at 13200 rpm for 1 min. The ethanol was removed and the washing procedure
was repeated twice. The gold particles were subsequently washed 3 times with 1
ml sterile water using the same procedure, and finally resuspended in 1 ml sterile
water. Aliquots of 50 pl, containing approximately 1250 pg gold particles, were
placed into clean 1.5 ml Eppendod tubes.
3.2.5 DNA coating methods
DNA coating methods were as described in the Biolist¡c@ PDS-1000/He
Particle Delivery System User's Guide. To an Eppendorf tube containing 50 pl
voftexed gold suspension,3 pl each plasmid pDM302 and pAcfl-D GUS, or5 pl

Chapter Three 52
plasmid pAHC2S were added. Gold particles were coated with the plasmid DNA
by adding, in the following order, 50 pl 2.5 M CaOlz and 20 pl 0.1 M spermidine.
The tubes were voftexed continuously for 3 min, left on ice for 10 min and
centrif uged at 1000 rpm for 10 sec. The supernatant was removed and the DNA-
coated gold pellet was washed with 250 pl absolute ethanol, The pellet was
resuspended in 50 pl absolute ethanol. For each bombardment, 10 pl the DNA-
gold suspension was placed in the centre of a macrocarrier, that is, approx. 250
pg gold particles per bombardment. ln some bombardment experiments, the gold
pellet was suspended in 250 pl absolute ethanol and 10 pl or 3.7 ¡tl of the DNA-
gold suspension was placed onto a macrocarrier, that is, approx. 50 pg or 18.5 pg
gold particle per bombardment. For optimisation of bombardment conditions, 5 pl
pAct 1-D GUS (1 pg/pl) was used and coated onto gold particles as described
above.
3.2.6 Bombardment conditions
During these experiments, all materials were bombarded using the
Biolistic@ PDS-1000/He Particle Delivery System (Figure 1.1), as described in
Section 3.2.2. Twenty immature scutella, when the immature scutella were shot
using 250 and 50 pg gold particles per bombardment, or 10 immature scutella,
when using 18.5 pg gold particles per bombardment, were placed in the centre of
a 55x14 mm plastic Petri dish containing callus induction medium (MSD2 or
MSD2BA0.1) supplemented with O.4 M mannitol. Osmotic treatment was
employed 4 h pre- and 16 h post-bombardment, as described by other groups
(Zhou et a\.,1995; Altpeter et al., 1996).

Chapter Three 53
The immature scutella were bombarded under a vacuum of 28 inch Hg.
The distance between the rupture disk and the macrocarrier was 2.5 cm and the
macrocarrier flight distance was 1.1 cm. The distance between the stopping
screen and the tissues was 6 cm or 9 cm, and the rupture disk pressure was 900-
1350 psi. lmmediately after osmotic treatment, the bombarded scutella were
transferred to 90 mm plastic Petri dishes containing fresh induction medium and
callus formation was induced for 20-25 days in the dark.
ln alt experiments conducted at the end of this study, freshly-isolated
immature embryos were directly cultured onto osmotic medium and subsequently
bombarded. Osmotic treatment and the handling of material after bombardment
followed procedures described above.
For the optimisation of bombardment conditions, immature scutella pre-
cultured for two days were used. All scutella were pre-treated with the mannitol
osmotic media and bombarded at distances of 6, 9 and 12 cm, with pressures of
650, 900, 1 100, 1350 or 1550 psi. Each bombardment was repeated twice. Thus,
two replicates with a total of 40 scutella were bombarded using 250 pg and 50 pg
gold particles per bombardment, and 20 scutella were bombarded using 18.5 pg
gold pafticles per bombardment.
3.2.7 Somatic embryo induction and selection of transformants
Callus formed during induction was transferred to direct light for somatic
embryo production, as described in Chapter 2, Section 2.2.4. Somatic embryos or
shoot primordia produced during exposure to light were picked and transferred to
the selection medium supplemented with 3 mg/l Bialaphos (Meiji Seika Kaisha,
Japan). The cultures were kept under direct light for ten to 14 days, and shoots

Three 54
growing on the selection medium were transferred to fresh selection medium for
another ten to 14 days. Fast growing shoots were picked and transferred to the
same medium without Bialaphos for fufther growth. Plantlets of around 5 cm in
length were transferred to soil and grown to maturity in the glasshouse, as
described in Section 2.2.4.
Towards the end of this study, all somatic embryos produced during
exposure to light were subjected to a selection medium containing 5 mg/l PPT or 5
mg/l Bialaphos, instead of 3 mg/l Bialaphos.
3.2.8 Histochemical GUS staining
GUS activity was assayed histochemically using the following buffer: 0.1
mM sodium phosphate buffer, pH 7.0, containing 0.5 mM potassium ferricyanide,
0.5 mM potassium ferrocyanide, 10 mM ethylenediaminetetraacetic acid, disodium
salt (EDTA) and OJ% (viv) Triton X-100. ln this buffer, 1 mg/ml 5-bromo-4-chloro-
3-indolyl-B-D-glucuronic acid (X-gluc, Nalgene) was dissolved, The mixture was
filter-sterilized and stored at -20oC.
For the transient expression studies, scutella induced for three days were
bombarded with the pActl-D GUS construct, Forty-eight hours after
bombardment, the scutella were incubated in the X-gluc solution at 37oC lor 24 h.
GUS expression appeared as blue spots on the bombarded scutella. These blue
spots were counted under a dissecting microscope. Each blue spot, including
blue sectors that might have resulted from the fusion of several fine spots, was
counted as one expression event. The results were expressed as the average
number of blue spots obserued on each scutellum.

Chapter Three 55
GUS express¡on in other tissues such as roots, spikelets, anthers, ovaries
and grains from putative transformants was studied in the same way as described
for scutella. Leaf tissues, however, were incubated in the X-gluc solution for an
extended period, which ranged from two to four days. ln most cases it was
essential to bleach the leaves before any blue colour could be obserued.
Bleaching was accomplished by soaking leaf piecesinTO"/" (v/v) ethanol for 48 h.
The ethanol effectively extracted the chlorophyll in that period.
3.2.9 Phosphinothricin acetyl transferase (PAT) assay
The PAT assay follows procedures described by Spencer ef al. (1990).
One hundred to 150 mg f resh leaf sample f rom putative transformants and control
plants were ground in 1 ,5 ml Eppendorf tubes with 100-150 pl extraction buffer (50
mM Tris-HCl buffer, pH 7,5, contaíning 2 mM Na2-EDTA, 0.15 mg/ml leupeptin,
0.15 mg/ml phenylmethylsulphonyl fluoride, 0.3 mg/ml bovine serum albumin, and
0.3 mg/ml dithiothreitol). The tubes were centrifuged at 13200 rpm for 10 min at
4oC. The supernatants were transferred to clean 1.5 ml Eppendort tubes and the
tubes were recentrifuged under the same conditions. The leaf extract was
transferred to fresh 1.5 ml tubes and the total protein content of the extract was
measured in a spectrophotometer (Hitachi, Model U-1100) by the Coomassie
Brilliant Blue reagent using bovine serum albumin as a standard (Bradford, 1976).
To each 1 ,5 ml eppendod tube, 15 pl extraction buffer, 3 pl [1aO]acetyl-
CoA (0.010 mCi/mmol, NENTM, Boston, MA, USA),2þl PPT (1 mM stock in 50
mM Tris-HCl buffer, pH 7.5, containing 2 mM Na2-EDTA) and an appropriate
amount of the leaf extract (25 pg total protein in 5 pl extraction buffer) were added.
The tubes containing the reaction mixture were incubated al37 oC for 30 min and

Chapter Three 56
dried in a vacuum drier Íor 2O min. The products of the reaction were resuspended
in 3 pl extraction buffer and spotted onto a silica gel thin-layer chromatography
plate (Silica gel 60, Merck, Germany). Ascending chromatography was carried out
in a 1:1 mixture of n-propanol and NH4OH. The chromatography plate was
exposed to X-ray film (RX Fuji Medical X-Ray Film; RX-U, Japan) for three days
and the film was developed in an X-ray developer (Curix 60 processor, type
94621100/140) to reveal 1aO-acetylated PPT.
3.2.10 Herbicide leaf-dip test
Herbicide was applied by dipping leaf tips, around 5-7 cm long, of putative
transformants and a control plant in Basta@ (Hoechst Australia Limited) in which
the active ingredient glufosinate ammonium was 50% (w/v). The concentrations
of Basta@ tested were O.O1% and O.1o/o (or 0.005% and 0.05% glufosinate
ammonium, respectively), and solutions were prepared in the presence of 0.1%
polyoxyethylene sorbitan monolaurate (Tween 20) to facilitate "wetting" of the
leaves. A putative transformant recovered from the thírd successful experiment
described in this thesis was subjected to herbicide application by spraying the
whole plant with a 0.1'/" Basta@ solution (or 0.05% glufosinate ammonium)
containing 0.1"/o Tween 20.
3.2.11 Genomic DNA isolation
3.2.11.1 Small scale isolation of genomic DNA
The method of DNA extraction from wheat leaf tissues was derived from
that described by Langridge ef al. (1997). A 10 cm long piece of fresh leaf of
approx. 100-150 mg was ground to a fine powder in a liquid nitrogen-chilled

Chapter Three 57
moftar. The leaf powder was transferred lo a 2 ml Eppendorf tube, and 600 pl
DNA extraction buffer (100 mM Tris-HCl buffer, pH 8.5, containing 17o sarcosyl,
100 mM NaCl and 10 mM EDTA) was added and the sample homogenised using
a stainless steel homogeniser. Phenol/chloroform (1:1, 600 pl) was added and
the tube was vigorously shaken for 30 sec and placed in a rack for partial phase
separation. The tube was centrifuged for 10 min at 13000 rpm to separate the
phases. The upper aqueous phase was carefully removed with a pipette and
transferred to a fresh tube. The phenol/chloroform extraction was repeated. The
upper phase was mixed with 60 pl 3 M Na-acetate, pH 4.8, and 600 pl
isopropanol. The tube was mixed gently by inversion and placed in a rack to
precipitate the genomic DNA. The tube was centrifuged for 5 min at 13000 rpm,
the supernatant was removed and the DNA pellet was washed with 1 mlTO% (v/v)
ethanol. The supernatant was removed entirely and the DNA pellet recovered was
allowed to air dry at 37oC for 30 min. The DNA pellet was resuspended overnight
in 50 pl R40 buffer at 4oC.
3.2.11.2 Digestion of genomic DNA
Digestion of DNA was carried out by adding successively to a 1.5 ml
Eppendorf tube: 1 pl the appropriate buffer (10x), 1 pl 1 mg/ml BSA (10x), 1 pl 40
mM spermidine, 1 pl the appropriate restriction enzyme (20,000 units/¡rl) and 6 pl
DNA sample. All restriction enzymes and their buffers were supplied by New
England Biolabs. The reaction mixtures were briefly vortexed and centrifuged for
5 sec at 13200 rpm, followed by incubation at 37oC for 5 hrs. After incubation,2
pl 6X Ficoll dye (0.1 M Tris-HCl buffer, pH 8.0, containing 0.2 M EDTA,30% Ficoll

Chapter Three 58
type 4000, O.25o/" bromophenol blue and 0.25"/o xylene cyanol FF) was added to
the digested DNA samples.
3.2.11.3 Electrophoresis of DNA
Gel electrophoresis of digested DNA was performed in a 1% agarose gel
using 1x TAE buffer (2 M Tris-acetate buffer, pH 8.0, containing 0.05 M EDTA).
Digested DNA samples (12 pl) were loaded into each lane of the gel. A marker (À
Hindll| GIBCO-BRL@) was loaded in the end lane. Electrophoresis was
performed at 35V and 31 mAfor 16 h, Afterelectrophoresis, the gel was stained
with 1pg/ml ethidium bromide and DNA bands were examined on a UV
transilluminator. Photographs were taken using a Watec (Hoya Skylight (18),
Japan) camera.
3.2.12 Southern blot hybridization
Southern blot hybridizations were performed as described by Southern
(1e7s).
3.2.12.1 Membrane preparation
After staining with ethidium bromide as described in Section 3.2.11.3
above, the gel was soaked in 200 ml denaturing solution (1.5 M NaCl, 0.5 M
NaOH) and agitated for 20 min. The gel was washed with 10x SSC solution for 2
min (1.5 M NaCl, 0.15 M trisodium citrate).
The Southern transfer apparatus was assembled as follows. A sponge,
together with 2 sheets of Whatman 3MM filter paper, were soaked in 10x SSC
solution. The sponge was placed on a plastic tray, followed by a sheet of

Chapter Three 59
Whatman filter paper. A plastic screen covered the edges of the Whatman paper.
The gel was placed upside down in the middle of the screen, and care was taken
to avoid trapping air bubbles under the gel. The membrane (HybondrM-N*,
Amersham) was rinsed in 10x SSC solution, placed on top of the gel, and any air
bubbles were removed. The membrane was covered with another sheet of
Whatman paper, followed by a 5-6 cm thick stack of dry paper towels, a glass
plate and a weight of approximately 0.25 kg on the very top. The tray below was
filled with 10x SSC solution and transfer of DNA to the membrane was effected
overnight.
After DNA transfer, the loading well positions and the side of the membrane
closest to the DNA in the gel were carefully labelled. The membrane was rinsed
in 5x SSC solution for 2 min and blotted dry on Whatman filter paper. The
membrane, with the DNA side up, was placed on a stack of Whatman filter paper
which had been soaked in O.4 M NaOH for 20 min. The membrane was
neutralised in 100 ml neutralising solution (0.5 M Tris-HCl buffer, pH 7.2,
containing 1.5 M NaCl and 0.001 M EDTA) for 5 min, followed by washing in 2x
SSC solution for 5 min. The membrane was blotted dry with a piece of Whatman
filter paper, sealed in a plastic bag, wrapped in aluminium foil and stored at 4oC.
3.2.12.2 Preparation of radiolabelled DNA probes
Probe DNA fragment preparation
The primers were chosen to provide a probe of sufficient size for efficient
labelling by random priming. Primers had a balanced G+C and A+T content with
no obvious internal homologies. Probing sequence of DNA was prepared by the
polymerase chain reaction (PCR), using approx. 100 ng DNA template,5 ¡rl 10x
Chapter Three 60
PCR buffer (GIBCO-BRL@), 3 pl 25 mM MgCl2, 2 ¡tl 5 mM dNTPs mix, 5 pl
dimethyl sulfoxide (for the bar gene only), 1 pl Taq polymerase (1,5 U/pl) (GIBCO-
BRL@) and 1 pl of each primer, in a final volume of 50 pl. Primers used were:
a) bar genel
Fo nruard (5'-CTACCATGAGCCCAGAACGACG -3')
Reve rse (5'-GAAGTCCAGCTG CCAGAAAC-3').
b) GUS gene:
Fonryard (5'-GGTGGGAAAGCGCGTTACAAG-3')
Reverse (5'-GTGATGATAATCG GCTGATG C-3').
The cycling parameters used were 94oC for 30 sec (denaturation), 52oC for
30 sec (annealing),72oC for 2 min (extension), This was repeated for 35 cycles.
A sample of the PCR reaction products was separated by electrophoresis on a lY"
agarose gel. DNA bands were detected with ethidium bromide and the gel was
photographed. The PCR product was cut out of the gel and purified using the
BRESAcleant" procedure according to the manufacturer's instructions (Bresatec
Ltd, PO Box 11, Adelaide, SA). This DNA was radiolabelled and used as a probe.
Radiolabelling ol DNA probes
Radiolabelled probes were prepared using the Megaprime (Amersham, UK)
Kit following the manufacturer's instructions. To an eppendod tube, 3 pl probe
DNA fragmenl (bar or GUS), 5 pl random hexamer primers, and 25 pl water was
added. The tube containing this solution was heated to 100oC for 5 min and
centrifuged for 5 sec. Ten pl labelling buffer, 2 pl Klenow DNA polymerase (1-2
units) and 5 pl o32P-dCTP (50 pOi) were added to the tube. The probe mixture
was incubated at 37oC for30 min. Subsequently, S0 pl fractionation dye {1XTE

Chapter Three 61
buffer, pH 8.0, containing 1.5% (w/v) dextran blue and 0.5% (w/v) orange G) was
added to the incubated probe and a Sephadex G-50 mini-column was used to
separate the unincorporated radionucleotides from the labelled DNA fragments.
The labelled DNA was heated to I OOoC for 5 min and chilled on ice for 5 min
before use.
3.2.12.3 Hybridization procedures
The membrane was prehybridized in a rotating, cylindrical glass bottle
containing 10 ml hybridization solution consisting of 500 pl H2O, 3 ml 5X HSB (0.1
M piperazine-N,N'-bis-2-ethanesulfonic acid [PIPES] buffer, pH 6,8, containing 3
M NaCl and 0.025 M NazEDTA), 3 ml Denhardt's lll {2"/" (wlv) BSA, 2% (wlv)
Ficoll, 2% (wlv) polyvinyl pyrollidone and 10% (w/v) sodium dodecyl sulfate), 3 ml
(25"/. w/v) dextran sulphate and 500 pl (5 mg/ml) carrier DNA in a hybridization
oven (Ratek, Australia) at 65oC tor 2h.
The denatured DNA probe described in Section 3.2.12.2 was added to the
bottle. Hybridization was performed overnight at 65oC in the same hybridization
oven. After hybridization, the solution was removed from the glass bottle and the
membrane was rinsed with 50 ml 2x SSC, 0.1% SDS at 65oC for 20 min. The
membrane was transferred to a plastic tray and washed successively with 200 ml
of the following solutions in a shaking waterbath at 65oC tor20 min each: 1) 1x
SSC, O.1% SDS; 2) 0.5x SSC, O.1o/" SDS; and 3) 0.2x SSC, O.1o/o SDS. The
membrane was blotted dry on a clean Whatman paper sheet, wrapped in plastic
film and exposed to a sheet of X-ray film (Fuji Medical X-Ray Film; RX-U, Japan)
in an autoradiography cassette at -80oC for two to five days. The film was

Chapter Three 62
developed in an automated X-ray developer (Curix 60 processor, type
94621100/140).
3.2.12.4 Reprobing the membrane
It was possible to perform multiple probings of the membranes using both
barand GUS gene probes. Probes were stripped from membranes in 200 ml 10%
SDS, 0.5 M EDTA at I OOoC and membranes were agitated gently for at least 30
min at room temperature. After stripping, the membrane was blotted dry on
Whatman 3MM filter paper and reprobed following the procedures described in
subsections 3.2.12.2 and 3.2.12.3 above.
3.2.13 Statistical analysis
Two-way analysis of variance (ANOVA) was used to test for significant
differences between rupture disk pressure (650 psi-1550 psi) and bombardment
distance (6 cm-1 2 cm) for the means of blue spot counted on bombarded scutella.
All analyses were performed in Genstat 5 release 4.1 (Lawes Agricultural Trust,
Rothamsted Experimental Station, UK). To satisfy normality assumptions, the
average number of blue spots was transformed on the log scale.

Chapter Three 63
3.3 Results
3.3.1 Optimisation of bombardment conditions
lnitial transformation experiments were undeftaken to optimize
bombardment conditions. lmmature scutella were prepared and bombarded from
various distances and at various rupture disk pressures. The results are
summarised in Table 3.1. Bombardment conditions clearly affect transient GUS
expression. Generally, an increase in bombardment pressure from 650 psi to
1550 psi resulted in an increased number of blue spots, and an increase in
bombardment distance from 6 cm to 12 cm resulted in a reduction of GUS
expression. Analysis of variance indicated that the interaction of rupture disk
pressure and bombardment distance was significant to lhe 1"/" level,
ln these experiments, the highest number of blue spots was obserued using
1550 psi and 12 cm for bombardment pressure and distance, respectively.
However, under these conditions, the bombarded scutella were occasionally
knocked out of the Petri dish. lt was also obserued that bombardment at high
pressure (1550 or 1350 psi), in combination with a short distance (6 cm), resulted
in a significant reduction in the number of blue spots, probably because the spots
were large and close together and multiple spots were counted as a single spot
only. The large spots may also have resulted from damaged cells on the
scutellum surface, allowing diffusion of GUS activity (blue colour) from damaged
cells into the surrounding tissues.
These experiments also indicated that bombardment at 900-1 100 psi and 6
cm, or 1350 psi and 9 cm, resulted in highernumbers of blue spots. Usingthese
conditions, approx. 85-100 blue spots per scutellum were observed (Figure 3.24).

Table 3.1 The average number of blue spots on log scale and original scale in
bombarded scutella from various distances and rupture disk pressures
Distance (cm)Rupture disk
pressure (psi)Average
6 I 12
650.
900.
1100*
1 350*
1 550.
Average
1 100**
1 100***
a3.66 (46)"
^4.42 (85)b
a4.41(97)o'
a4.15 (71)'o
"4.12 (69)d
4.15 (72)
o3.25 (27)^
u3.59 (41)b
b3.85 (51)b
u4.50 (100)'
b4.46 (94)c
3.e3 (63)
"1.50 (6)"
c2.65 (16)o
c3,42 (36)c
"3.60 (45)'
¡4.52 (104)d
3.14 (41)
2.81 (26)
3.55 (48)
3.8e (58)
4.08 (72)
4,37 (8e)
3.74 (58)
(103)
(84)
NT
NT
NT
NT
Notes :
*, **, *** : bombarded with 250, 50 and 18.5 pg gold particles per bombardment, respectively.
( ) : The average number of blue spots on original scale.
Means with the same letters are not significantly different at the 5% level according to the Least
Significant Difference test.
Superscript indicates differences at various bombardment pressures in the same distance, whilst
subscript indicates differences at various bombardment distances in the same pressure.
NT : not tested.


Figure 3.2 Transformation procedures. (A) transient GUS expression in
bombarded scutella; (B) somatic embryo production from bombarded scutella; (C)
shoot formation on hormone-free media containing 3 mg/l Bialaphos; (D) a fast
growing plantlet recovered from selection media; (E) leaf dip test showing resistant
leaf from W2 plant after 0.1% Basta@ solution (or 0.05% glufosinate ammonium)
application (bottom) and necrosis on control (top) plants; and (F) spraying test
(0.1% Basta@ solution) on transgenic (right, W9) and control (left) plants.

Chapter Three 64
At 50 pg gold part¡cles per bombardment, the number of blue spots was
very high, approx, 103 blue spots/scutellum, with a pressure of 1100 psi and a
distance of 6 cm. By reducing the amount of gold pafticles to 18.5 pg per
bombardment while keeping all other conditions constant, the average number of
blue spots observed was 84 per bombarded scutellum.
Following the optimisation of bombardment parameters, the following
conditions were routinely used for bombardment transformation experiments (see
Table 3.2for details):
. 900 or 1 100 psi, 6 cm (and occasionally 9 cm) distance with 250, 50 or 18.5 ¡tg
gold pafticles
. 1350 psi, 9 cm distance with 250 (or 50) ¡rg gold
All other bombardment conditions were discarded due to either producing too few
blue spots, or being too severe on the scutellar cells.
3.3.2 Production of somatic embryos
lmmature scutella from three wheat genotypes or freshly isolated immature
embryos of cv. Frame were bombarded as described in sections 3.2.5 and 3.2.6
(Table 3.2). After bombardment, the scutella or immature embryos were
transferred to fresh induction medium and incubated in the dark Íor 20-25 days.
Occasionally, some of the bombarded scutella were directly transferred to
selection medium, which is induction medium containing 3 mg/l Bialaphos, prior to
incubation. Following incubation in the dark, the plates were transferred to light
for somatic embryo production (Figure 3.28).
Table 3.3 shows the percentage of somatic embryo production from
bombarded and non-bombarded (control) explants. lt was generally obserued that
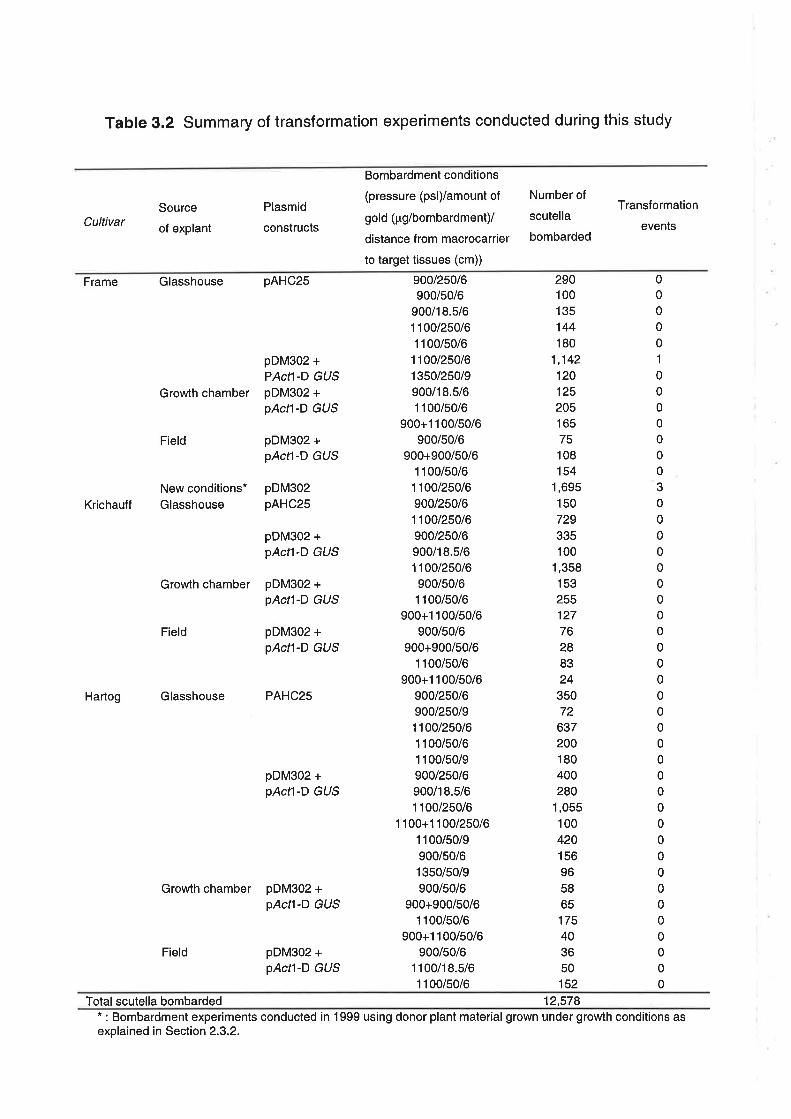
Table 3.2 Summary of transformation experiments conducted during this study
CultivarSource
of explant
Plasmid
constructs
Bombardment conditions
(pressure (psi)/amount of
gold (pg/bombardment)/
distance f rom macrocarrier
to target tissues (cm))
Transformation
events
Number of
scutella
bombarded
Frame Glasshouse pAHC25
pDM302 +
PActl-D GUS
Growth chamber pDM302 +pActl-D GUS
Field pDM302 +pActl-D GUS
900125016
900/50/6900/18.5/61100125016
1 1 00/50/61 1 00/250/61350125019
900/18.5/61 1 00/50/6
900+1 1 00/50/6900/50/6
900+900/50/61 1 00/50/6
11001250/6
900/250/61 100/250/6
900/250/6900/18.5/61 1 00/250/6
900/50/61 1 00/50/6
900+1 1 00/50/6900/50/6
900+900/50/61 1 00/50/6
900+1 1 00/50/6900125016
900/250/91 1 00/250/61 1 00/50/61 1 00/50/9900/2s0/6900/18.5/61 100/250/6
1100+1100125016
1 100/50/9900/50/6
1 350/50/9900/50/6
900+900/50/61 1 00/s0/6
900+1 1 00/50/6900/50/6
1 100/18.5/61 1 00/50/6
pDM302pAHC25
290100135'144
180
1,14212012520516575108154
1,695150729335100
1,358153
25512776288324
35072
637200180400280
1,055100420156965865175403650152
00000
1
0
00
0
000
3
00000
0
0
0
0
0
0
0
0000
0
0
000
0
0
0
00000
0
0
Krichauff
New conditions*Glasshouse
Hartog Glasshouse PAHC25
pDM302 +pActl-D GUS
Growth chamber pDM302 +pActl-D GUS
Field pDM302 +pActl-D GUS
pDM302 +pÁctl-D GUS
Growth chamber pDM302 +pAcfl-D GUS
Field pDM302 +pActl-D GUS
Total scutella bombarded 12,578* : Bombardment experiments conducted in 1999 using donor plant material grown under growth conditions asexplained in Section 2.3.2.

Tabte 3.3 Production of somatic embryos from non-bombarded and bombarded
explants
Non-bombarded explants Bombarded explantsCultivar
Cultured %EC Cultured T" EC
Frame 13* 2021"t 20
639
1O*(t¡)
20*(t'¡) 65
174(N)
Hartog 113
Krichauff 58 1,009 6
Notes:"/"EC : Percentage of explants producing embryogenic callus.* : Bombardment experiment leading to the production of transgenic plants.(N) : Donor plants were grown in new conditions as explained in Section 2.3.2.1" ; 2no; 3'd: The first, second and third successful bombardment experiments.
44
70
30
60
11
20
22
18
3g2nd
3063td
1,695
31,393
59
20
24

Chapter Three 65
somatic embryo product¡on from bombarded explants was much lower than
obtained from non-bombarded explants, From the results presented in Table 3.3,
it is evident that there was a reduction of around 60-85% in embryogenic callus
production from bombarded explants as compared with non-bombarded explants.
3.3.3 Plant regeneration and selection of transformants
Somatic embryos produced during exposure to light were picked from
callus induction medium and transferred to selection medium, that is, growth
regulator-free MS medium containing 3 mg/l Bialaphos (Weeks et al., 1993) for
experiments carried out in the early experiments, or containing 5 mg/l Bialaphos
(Altpeter et al., 1996) or 5 mg/l PPT (Becker et al., 1994) for experiments
conducted at the end of this study. The selection strategy employed in these
experiments was to germinate the somatic embryos on selection medium (see
Section 3.2.7 for details). lt seems that this selection strategy could inhibit the
growth of non bombardment-derived shoots, namely shoots grown from non-
bombarded, control callus, as well as non-transformed shoots, namely shoots
derived from bombarded, non-transgenic callus. However, in some cases
"escape" plants, namely non-transformed shoots or plantlets regenerated on
selection medium, were still recovered. Seven to ten days after the first selection
cycle, the non-bombarded and non-transformed shoots were strongly inhibited by
Bialaphos and became necrotic. The majority of shoots died during the second
selection cycle and only a few fast-growing shoots with well-developed root
systems survived after the second selection cycle (Figure 3.2C). These fast
growing shoots, which were considered to be putative transformants, were
transferred to hormone-free MS medium, without the presence of selective agent,
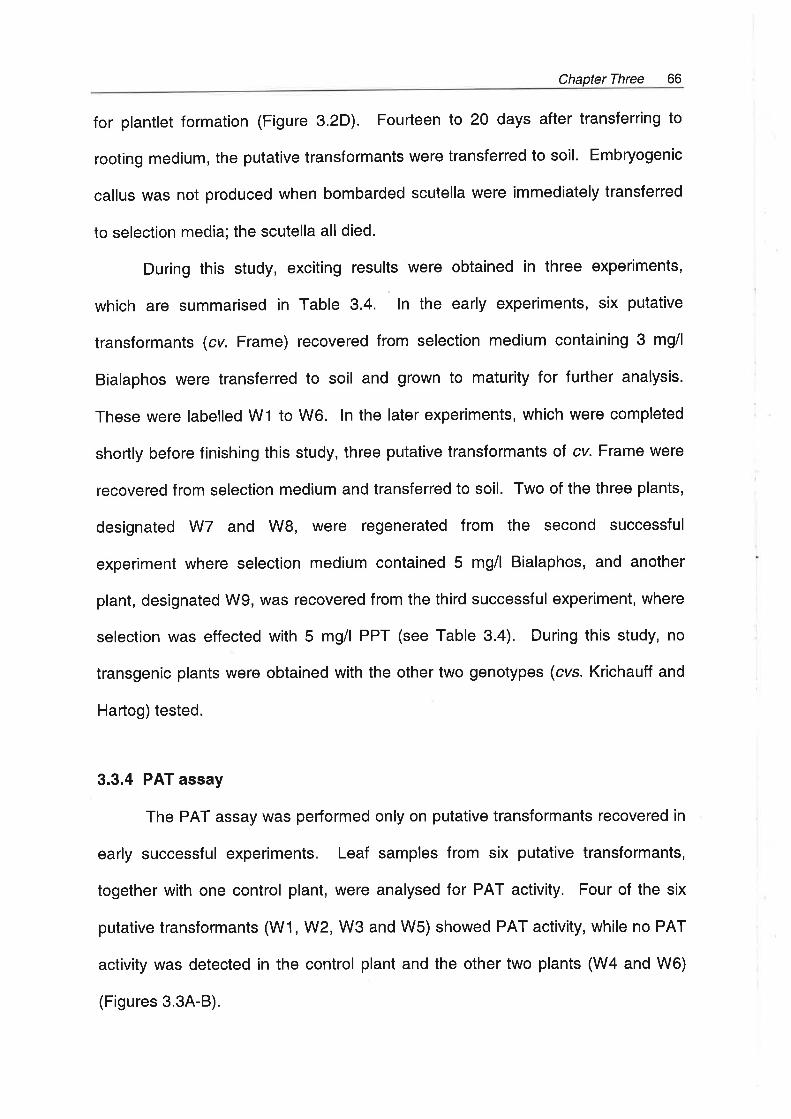
Chapter Three 66
for plantlet formation (Figure 3.2D). Foufteen to 20 days after transferring to
rooting medium, the putative transformants were transferred to soil. Embryogenic
callus was not produced when bombarded scutella were immediately transferred
to selection media; the scutella all died.
During this study, exciting results were obtained in three experiments,
which are summarised in Table 3,4. In the early experiments, six putative
transformants (crz. Frame) recovered from selection medium containing 3 mgil
Bialaphos were transferred to soil and grown to maturity for further analysis.
These were labelled W1 to W6. In the later experiments, which were completed
shortly before finishing this study, three putative transformants of cv. Frame were
recovered from selection medium and transferred to soil. Two of the three plants,
designated W7 and W8, were regenerated from the second successful
experiment where selection medium contained 5 mg/l Bialaphos, and another
plant, designated W9, was recovered from the third successful experiment, where
selection was effected with 5 mg/l PPT (see Table 3.4). During this study, no
transgenic plants were obtained with the other two genotypes (cvs. Krichauff and
Hartog) tested.
3.3.4 PAT assay
The PAT assay was pedormed only on putative transformants recovered in
early successful experiments. Leaf samples from six putative transformants,
together with one control plant, were analysed for PAT activity. Four of the six
putative transformants (W1 ,W2, W3 and W5) showed PAT activity, while no PAT
activity was detected in the control plant and the other two plants (W4 and W6)
(Figures 3.34-B).
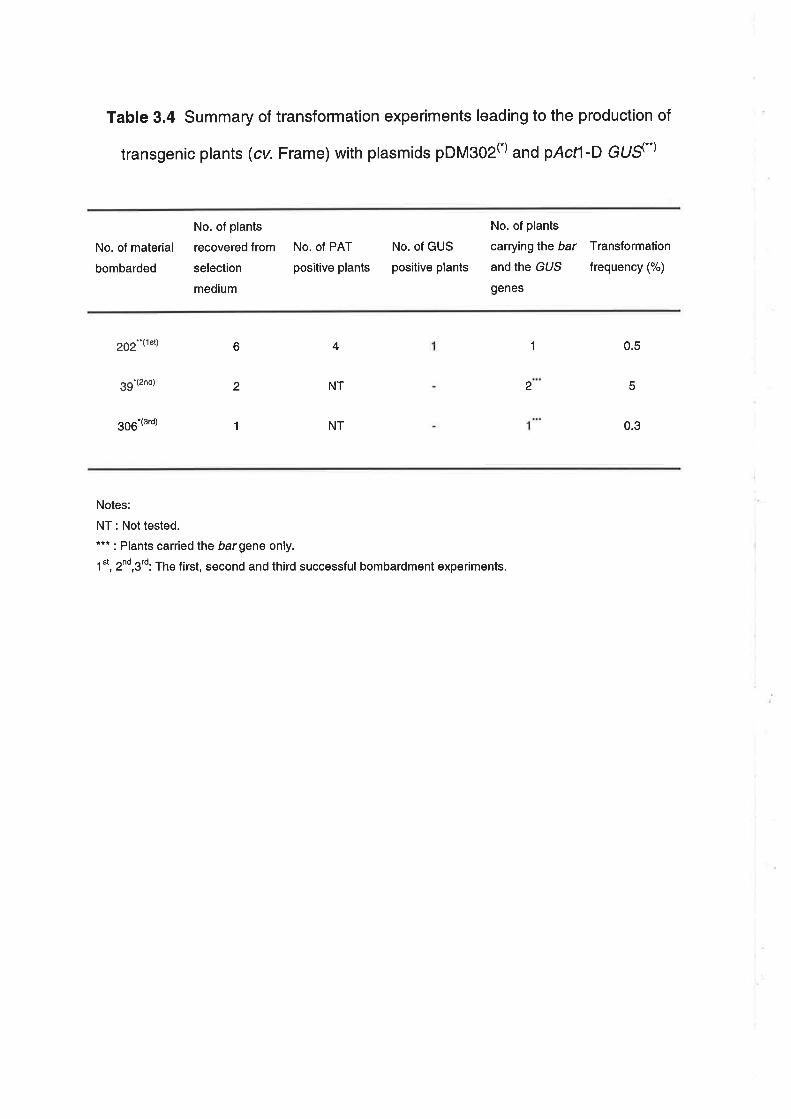
Table 3.4 Summary of transformation experiments leading to the production of
transgenic plants (cv. Frame) with plasmids pDMgOZ(.) and pActl-D GUS*)
No. of material
bombarded
No. of plants
recovered from
selection
medium
No. of PAT
positive plants
No. of GUS
positive plants
No. of plants
carrying lhe bar
and the GUS
genes
Transformation
frequency (%)
292-'(tst)
3g.(2nd)
306'(3rd)
0.5
5
0.3
14
NT
NT
6
2
1
2
Notes:
NT : Not tested.*** : Plants carried the bargene only.
1tt, 2nd,3td: The first, second and third successful bombardment experiments.

A
*
ËüIrl
Õ
t'
CfAcetylatedPPT
-
AcetylatedPPT
-
tr sÌ
#;*
5
W1 W2 W3 Wc BL B2 Bl +CcL +Cc2 +Cc3
*
???ÇoÇ f\ fr
rtÜ t
B
Tü
rd*Þ
Y*':j*¡
1-{r
r?tt t\ry4 W5 W6 Wc Bl +Cc

Figure 3.3 PAT assays of putative transformants. (A) and (B) PAT activity in
leaf extracts of putative transformants (numbered W1-6) and a wheat control
(WC). The position of acetylated phosphinothricin is indicated by an arrow.
Abbreviations: W1-6: wheat plants with their code number recovered from
selection media; WC: wheat control; B1 abd 82: samples of non-transformed
barley callus; Bl: blank sample; +Cc, +Cc|, +Cc2: positive controls of a barley
callus line transformed with pAHC2S (Christensen and Quail, 1996) (Callus
provided by R. Singh).

Chapter Three 67
3.3.5 GUS staining
GUS was used as a repofter gene only in early transformation experiments.
GUS activity was determined histochemically by staining roots, leaves, spikelets,
ovaries, anthers, microspores and grains from six putative transformants and one
control plant. Of the six putative transformants tested, only one plant (W2)
showed GUS expression. High GUS activity was obserued in spikelets, ovaries,
anthers, microspores and grains (Figures 3.48-E). Variability in the intensity of
GUS expression was also identified in anthers and grains. Some of the anthers
and the grains exhibited dark blue staining, some were light blue and some were
only very faintly blue. Furthermore, GUS activity was generally very low in the
leaves of this plant and was restricted to the veins (Figure 3.aA); no GUS
expression could be detected in the roots. No GUS expression was ever
obserued in any tissues of the control plant.
3.3.6 Response to the herbicide leaf-dip test
Two intact leaves from each of the six putative transformants from the first
successful bombardment experiment were dipped into 0.01"/" and 0.1T" Basta@
solutions or 0.005% and 0.05% glufosinate ammonium, respectively. The effect
of applying Basta@ to the leaves of the six putative transformants was graded one-
week after herbicide application. The leaves showed a varying response to
herbicide application. The leaves of one plant (W2) showed complete resistance
to both concentrations of Basta@ (Figure 3.2E). The leaves of plants W3 and W5
showed partial necrosis at a level of O.O1% Basta@ (0.005% glufosinate
ammonium) and leaves of the remaining three plants (W1, W4 and W6), together
with a control plant, showed severe leaf necrosis at both concentrations.


Figure 3.4 Stable GUS expression in different tissues of a transgenic wheat
plant. (A) GUS activity in leaves of transgenic (right) and control (left) plants; (B)
in spikelets; (C) in anthers and ovary; (D) in microspores; and (E) in grains of
transgenic (right) and control (far left) plants.

Chapter Three 68
The entire plant recovered from the third successful experiment (Wg) and a
control plant were subsequently sprayed with Basta@ at a concentration oÍ 0.1%
(or 0.05% glufosinate ammonium). A small amount of necrosis was detected on a
few leaves of the putative transformant, whilst the control plant died one week
after spraying (Figure 3.2F).
3.3.7 Southern blot analysis
Six putative transformants (W1-W6) recovered in the first successful
experiment were analysed for the presence of the bar and GUS genes by
Southern hybridization. The analysis indicated that only one of the six plants,
designated W2, possessed lhe bar gene. There were two or more hybridizing
bands observed in the EcoRl track, including the expected band of approx. 0.87
Kb (Figure 3.5). However, no discrete bands were identified in the Xhol lrack
(Figure 3.64),
To confirm this result, the Southern blot analysis was repeated using EcoRl
and other two restriction enzymes (BamHl and H,ndlll). ln this case, only three
primary transformants, namely W2, W3, W6 and control plants were analysed.
Results from the second hybridization analysis again showed the presence of the
bar gene in the W2 plant and not in the other two plants (W3 and W6). As
predicted from the restriction map of plasmid pDM302 (Figure 3.1), the barprobe
hybridized to fragments of the correct size in both EcoRl- (approx. 0.87 Kb) and
Bamt.{.l- (approx. 1 Kb) digested DNA samples (Figures 3.5 and 3.68). Beside the
expected bands, other bands were obserued in both Ìhe Bam{l and EcoRl tracks.
Fufthermore, hybridization of the bar probe to the uncut genomic DNA of
the W2 plant confirmed the presence of lhe bar gene in the high molecular weight
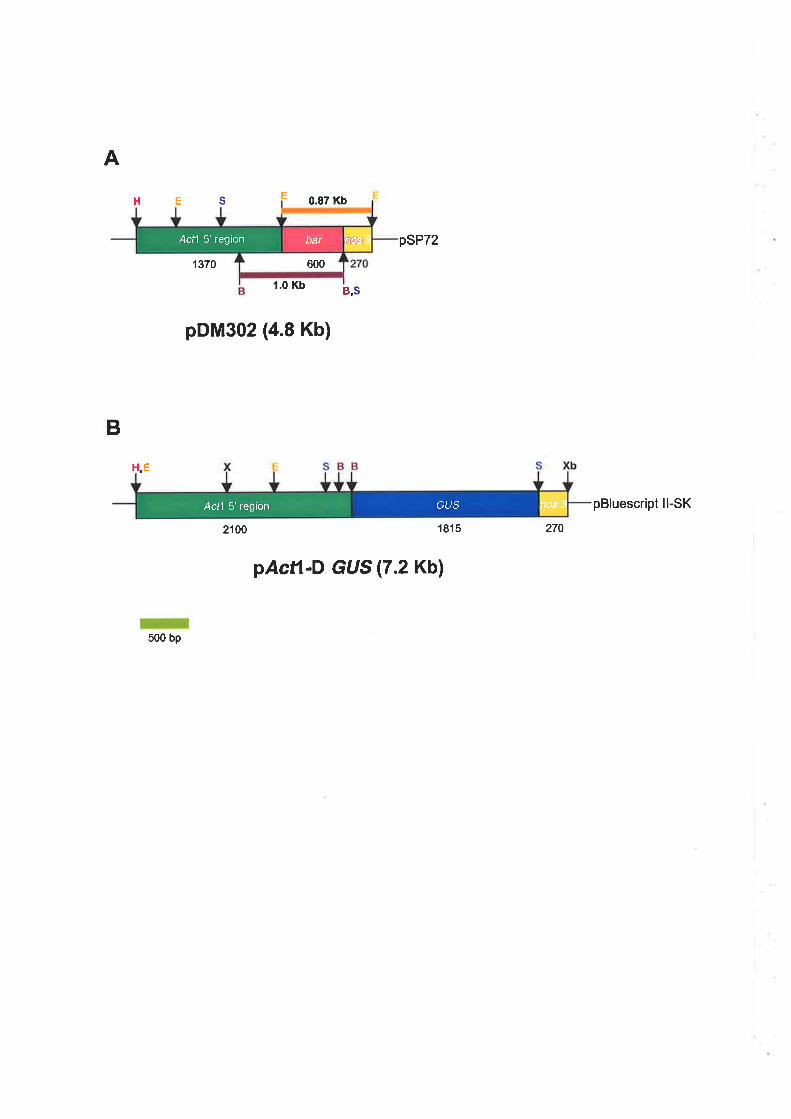
600
Actl 5'region bar nost
A
B
1370
E
r.0 Kb
HES 0.87 Kb
psP72
B,S
pDM302 (4.8 Kb)
H ,E
500 bp
pBluescript ll-SK
2100 1815 270
pActl-D GUS (7.2 Kbl
Acll 5'region GUS nos q

Figure 3.5 Restriction map. Restriction maps of (A) pDM302 and (B) pActl-D
GUS. Enzymatic restriction sites used in these experiments are shown in coloured
letters. Expected fragments from the enzymatic digestions used are indicated by
coloured thick lines. Abbreviations of restriction sites: B: BamHl; E: EcoRl; H:
Hindlll; S: Ssfl; X: Xhol and Xb: Xbal.

AControl W1 W2 W3 W4 W5 W6e{*e.ll* HE X E X E X E X E XE XU UEX
bar probe
e0.87

B Control W2HHU EB HU E B H
î
w3
E B H UE B Ho
#üî
ül
Control W2+---+p.{.,
barprobe
GUS probe
Kb
7.6
3.5
Ò.-8-
?
f a)
Kb
0.87
Kb
1.0
à¡tlÈ¡
w6cEBHU E B H
HüEE.TtI
f,-:t
tC
Kb
6.2
4.1
ì
{
a
a
aI
It
I
Ia
a
a
a.

D
Control<-EBHU
w7<+EBHU
\ry8HEBHU EBH
Þar probe
Kb
>12
Kb
3.8
1.6
1.0
+
*+
-+
+.!t+:
iù +f
1.00.87

Figure 3.6 Southern blot analysis of transgenic wheat plants. (A) Genomic
DNA isolated from primary wheat transformants (W1-6) and a control plant was
digested with EcoRl and Xhol and probed with the bar probe, showing the
expected fragment (0.87 Kb) and an additional intense band (approx. 2 Kb) in the
EcoRf track. (B) Genomic DNA otW2, W3, W6 and a control plant was redigested
with EcoRl, Bam{l and Hindlll and probed with lhe bar probe, showing the
predicted fragments in the EcoRl (0.87 Kb) and Bamïl (1,0 Kb) tracks (Figure
3.5), and (C) probed with the GUS probe, showing two hybridizing bands both in
the EcoRl (approx. 4.1 and 6.2 Kb) and in lhe BamHl (approx. 3.5 and 7.6 Kb)
tracks. (D) Genomic DNA of W7, W8, Wg and a control plant was digested with
EcoRl, BamH.l and Híndlll and probed with the bar probe, showing the predicted
fragments in the EcoRl (0.87 Kb) and Bam{l (1.0 Kb) tracks in W7 and W8, but
the hybridizing bands were larger than expected in W9. Abbreviations : W1-9:
primary (wheat) transformants; Control: wheat control; U: uncut genomic DNA; Kb:
kilobase. Abbreviations of restriction enzymes used: B: BamHl; E: EcoRl; H:
Htndlll; X: Xhol.

Chapter Three 69
DNA of this plant (Figure 3.68). However, no discrete bands were obserued in the
Hindlll track, which may indicate failure of the enzyme to properly restrict the
DNA.
After probing for the bar gene, the primary transformants were
subsequently analysed for the presence of the GUS gene. Of the six putative
transformants stained (W1-W6), only the W2 plant showed GUS activity. Hence,
Southern blot analysis was pedormed using the membrane containing genomic
DNA from this plant, together with DNA from W3 and W6. The membrane was
therefore stripped after probing with bar and subsequently probed with the GUS
fragment.
Based on Southern blot hybridization, it was found that only the W2 plant,
which had also been shown to carry lhe bar gene, carried the GUS gene, whilst
the other two plants (W3 and W6) did not have the GUS gene (Figure 3.6C). This
was indicated by the hybridization of the GUS probe to uncut genomic DNA from
the W2 plant, Fufthermore, it was obserued that two or more hybridizing bands
could be identified ín the EcoRl (approx. 4.1 and 6.2 Kb) and in the BamH.l
(approx. 3,5 and 7.6 Kb) tracks. Since EcoRl and Bam{l cut outside the coding
region of the GUS gene (Figure 3.5), this implies that more than one inseftion of
the GUS gene is present in the genome. Again no discrete bands were visible in
the Hrndlll track (Figures 3.68-C).
Based on this obseruation, it is clear that the GUS staining matched those
from the molecular analysis, because the W2 plant showed GUS activity and also
carried the GUS gene, whilst the other two plants, designated W3 and W6, did not
have the GUS gene and had no GUS activity. No further effort was made to
perform Southern blot analysis on the three remaining plants (W1, W4 and W5)

Chapter Three 70
s¡nce none of these plants showed GUS activity on staining and were therefore
considered to be GUS negative.
ln these experiments, it was impossible to repeat the Southern blot analysis
with other restriction enzymes which may have better indicated the number of
inseftions of the bar gene, since only a small number of leaves were collected for
DNA extraction before the plant died.
The presence of the transgene (baÒ in three putative transformants,
namely two plants (W7 and W8) and one plant (W9) regenerated from the second
and the third successful experiments, respectively, was also investigated by
Southern blot analysis. Genomic DNA isolated from the three plants was again
digested with EcoRl, BamHl and Hrndlll. The Hrndlll enzyme was used, because
Hindlll generated good and consistent results when it was used in analysing the
presence of transgenes in the progeny of the W2 plant (see Chapter 4). Newly
purchased enzymes were used to avoid the possible risk of partially inactivated
restriction enzymes, which were thought to cause the DNA smearing found in
analysing the W2 plant with Hrndlll (Figures 3.68-C).
Southern blot analysis showed that three plants (W7, W8 and W9) carried
lhe bar gene (Figure 3.6D). The expected fragments of lhe bar gene could be
easily obserued in W7 and W8 plants, both in the EcoRl (0.87 Kb) and BamH'l (1.0
Kb) tracks. ln W9, however, the fragments of lhe bar gene were larger than
expected (>4 Kb in EcoRl and >6 Kb in Bam{l tracks).
f n addition to the expected fragments of the bar gene in W7 and W8, extra
bands were obserued both in the EcoRl and Bam{l tracks. Multiple bands were
also obserued in both the EcoRl and Bamïl tracks of Wg. Fufthermore, the three
plants showed multiple hybridization bands in Hrndlll tracks, suggesting multiple

Chapter Three 71
integration sites of the gene. Plants designated W7 and W8 appeared to have
two integration sites for the bar gene, based on the presence of two intensive
bands (1.6 and 3,9 Kb in W7, and 2.1 and 4.7 Kb in W8) in the Hrndlll tracks. ln
W9, however, the bar gene appeared to have three or more integration sites
(Figure 3.6D).
The integration of the bar gene into the high molecular weight DNA of the
three plants was proven by the hybridization of lhe bar probe to uncut genomic
DNA of these plants (Figure 3.6D). However, an intensive hybridizing band was
also obserued in uncut genomic DNA of a control plant, and this band is believed
result f rom random hybridization of the bar probe with genomic DNA of the control
plant (background), which accumulated in the top loading well.
3.3.8 Appearance of the primary transformants
The primary transformants (W2, W7, WB and Wg) regenerated in these
experiments were normal in appearance and were fertile (Figure 3.7). Several
notes relating to phenotypic characteristics and yields of the transgenic wheat
plants, together with the other five regenerants recovered in the early experiment
and control plants are presented in Figure 3.8 (Table 3.5). Transgenic wheat plant
(W2) produced in the first successful experiment had only few tillers (Figure 3.7)
and was shofter than the transgenic plants recovered from the second (W7 and
W8) and the third (W9) successful experiments (Table 3.5). Furthermore, the total
number of grains produced by the transgenic W2 plant was less than the other
transgenic plants (W7, W8 and W9), and less than that seen in other five non-
transgenic plants regenerated from the same experiment (W1, W3-6) and control


Figure 3.7 Mature transgenic wheat plants of cv. Frame. Primary
transformants designated W2 (left), W7 (centre) and W8 (right) (see Figure 3.2F
for W9).
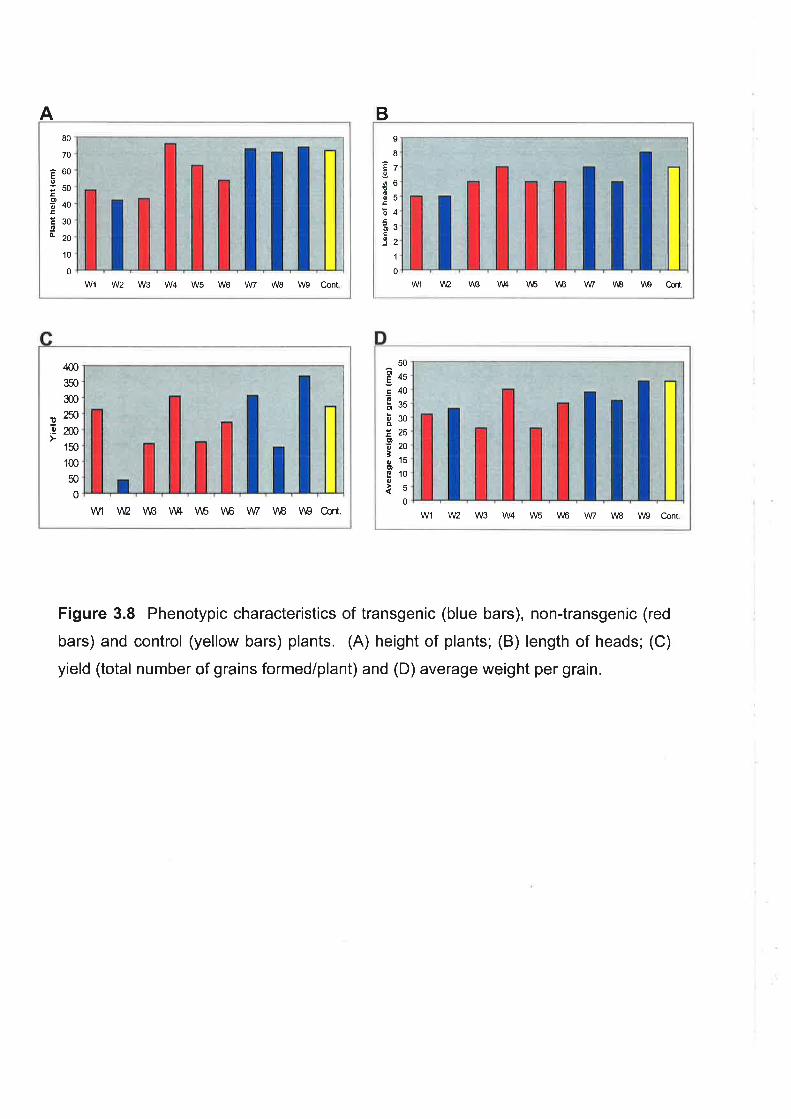
80
70
â60Èo;503¿oËso.Et20
10
0
Wl W2 W3 W4 W5 Wô Vw W8 Wg Cont
A B
EIø!{oE
oEooJ
I8
7
6
5
4
3
2
1
0
w v12 vlß w \õ \6 \u \a rß oort,
Figure 3.8 Phenotypic characteristics of transgenic (blue bars), non-transgenic (red
bars) and control (yellow bars) plants. (A) height of plants; (B) length of heads; (C)
yield (total number of grains formed/plant) and (D) average weight per grain.
4m
350
3m
2ûm150
1æ
50
0
W V\2 \ß V14 \6 \6 W \B \i9 Oq-ú.
s(,
t
50
45
40
30
25
20
15
10
5
0
o)E
sgooo
Ioìoo6o
W1 W2 W3 W4 W5 V1¿6 Vw W8 \ ß Cont

Table 3.5 Comparisons of phenotypic characteristics and yield of the transgenic
wheat plants (W2,W7, W8, and W9) with non-transgenic
and control plants (cv. Frame)
Plantcode
Height (cm)(average)
Length ofheads (cm)
Yeld (No. ofgrains/plant)
Average weightper grain (mg)
31
33
26
40
26
35
39
36
43
41
44
262
41
156
304
161
223
306
144
367
243
300
5
5
6
7
6
6
7
6
I
6
I
48
42
43
76
63
54
73
71
74
70
74
w7
w1*
w2
w3*
w4*
w5*
w6*
W8
W9
Cont. 1
Cont.2
Notes:* : non-transgenic plants confirmed by Southern blot hybridization.Cont: control plants.Average yield of control planls:272.Average weight per grain of control plants (mg) : 43.

Chapter Three 72
ptants. Transgenic plants recovered in the second and the third successful
experiments, however, usually showed similar characteristics to control plants.

Chapter Three 73
g.4 Discussion
Early transformation experiments were devoted to finding the optimum
conditions for bombardment by studying transient expression in bombarded
scutella. Based on these experiments, it was obserued that more severe
bombardment conditions, such as high pressure and short bombardment
distance, produced higher degrees of transient expression. However, such
bombardment conditions resulted in more tissue damage and adversely affected
subsequent embryogenic callus formation; this led to low transformation
efficiencies. lt is generally agreed that the degree of transient expression
obserued in a tissue is unrelated to the stable integration of the transferred gene
(Becker et al., 1994; Koprek et al., 1996). During bombardment, a stable event is
produced when the DNA coated particle penetrates the nucleus with minimal
damage to the cellular machinery and the DNA is inserted into a transcriptionally
active part of the genome, Stability is obserued if the DNA is not methylated or
inactivated in any other way. On the other hand, transient expression can be
obserued in most cells, even if they are damaged, because the introduced DNA
can be transcribed for a shofi time.
During the present study, three sets of bombardment conditions were
commonly used for transformation, namely 1) 1100 psi rupture disk pressure, 6
cm bombardment distance with 50 pg or 2) 25O pg gold particles/bombardment,
and 3) 900 psi rupture disk pressure, 6 cm bombardment distance and 250 pg
gold particles/bombardment. All results leading to the production of transgenic
plants in this study were obtained from bombardment conditions using 1 100 psi
rupture disk pressure, 6 cm bombardment distance and 250 pg gold
particles/bombardment, although this might be simply because these conditions

Chapter Three 74
were more frequently used than other bombardment conditions during
transformation experiments (Table 3.2). Because of the very low regeneration
and transformation frequencies, it was not possible to make any correlations
between transient expression and stable integration of transgenes.
The combination of a simple regeneration system developed for Australian
wheat genotypes (see Chapler 2) with appropriate bombardment conditions, led to
the production of fertile transgenic wheat plants, cv, Frame, which is an elite
Australian genotype. During this study, three successful transformation events
were achieved. In the early successful experiment, confirmation of the transgenic
nature of the plants involved four steps. Firstly, fast-growing shoots were selected
from the selection medium, which contained 3 mg/l Bialaphos. ln this experiment,
202 immature scutella were bombarded with both the bar and the GUS genes,
and six Bialaphos-resistant plantlets or putative transformants were recovered
from the selection medium. Figure 3.2D shows an example of a putative
transformant arising from the selection medium. The six putative transformants
were subsequently transferred to soil for fufther analysis.
All six putative transformants were assayed for PAT activity as the second
step in the confirmation of transformation status. This assay makes it possible to
detect the PAT enzyme, which is the product of the bar gene, using a
radiolabelled substrate followed by exposure to X-ray film. Of the six putative
transformants analysed, four showed PAT activity. These results subsequently
led to speculation that four of the six putative transformants may catry lhe bar
gene in their genomes. Figures 3.34 and 3.38 show the results of the PAT assay
from the six putative transformants.

Chapter Three 75
The third test for confirmation of transformation status was the herbicide
application test, which was performed by dipping leaf tips of the six putative
transformants into various concentrations of Basta@ solution (0.01% and 0.1%).
The six treated plants showed variable tolerance towards Basta@. One of the
putative transformants (W2) showed complete tolerance to both Basta@
concentrations tested (Figure 3.2E). This suggested that the PAT enzyme activity
protected the leaves of this plant from the toxicity of the Basta@ herbicide, Two
plants (W3 and W5) showed moderate tolerance at a concentration of 0.01%
Basta@ solution but they exhibited severe necrosis at a concentration of 0.1%.
The remaining three plants behaved like non-transformed control plants and were
sensitive to both concentrations of Basta@ tested.
Southern blot analysis was performed as the fourth step to demonstrate the
incorporation of the introduced genes into the plant genome. A Southern blot was
carried out using genomic DNA isolated from all six plants (Figure 3.64). As seen
in Figure 3.64, only one (designated W2) of the six plants showed a positive
result. Undigested DNA from this plant hybridized with the bar gene probe (Figure
3.68), suggesting that lhe bar gene was integrated into the wheat (W2) genome,
while DNA from the other plants and a control plant did not.
DNA from the W2 plant was also digested wilh BamHl and EcoRl, and
gave the expected hybridizing band corresponding to that predicted from the
restriction map (Figure 3,68). ln addition, the presence of extra bands in the
EcoRI and Bam{l tracks at a much lower intensity than the expected band were
also obserued. These extra bands appear to represent incompletely digested
DNA or additional inseftions oI bar gene fragments, and were also identified in the
progeny of this plant (Chapter 4). The integration of gene fragments into the plant

Chapter Three 76
genome is commonly obserued in transgenic plants produced via microprojectile
bombardment, because this method relies on physical force to deliver DNA into
plant cells and the shearing of transgenes could occur before integration into the
genome (Pawlowski and Somers, 1996),
In summary, the four criteria used for confirming the transformation status
of the wheat plant designated W2 were met and it was concluded that W2 was
truly transgenic for the presence of the bar gene. However, the observation that
only one of the six putative transformants produced in this experiment was
transgenic indicated that the selection strategy employed was still weak and failed
to avoid the growth of "escape" plants, Moreover, the PAT assay was not always
a reliable means to confirm transformation status and should be interpreted
carefully, because several plants showed a positive result for enzyme activity but
subsequent Southern analyses were negative for the presence of the bar gene.
Srivastava et al. (1996) have also reported the presence of PAT activity in several
putatively transformed wheat plants that were found to lack lhe bar gene when
analysed by Southern hybridization.
ln the experiments described here, all material bombarded with lhe bar
gene was also co-transformed with a plasmid containing the GUS gene, and the
six recovered plants were therefore examined for the presence of GUS gene
expression. Histochemical analysis of GUS activity was carried out on various
pafts of the six putative transformants, but only the W2 plant showed GUS activity.
GUS activity could be detected in both vegetative (leaves) and reproductive
(anthers, ovaries, microspores and grains) tissues (Figures 3.44-E), but activity in
the reproductive tissues was much higher than that in vegetative tissues, Other

Chapter Three 77
repofts have also indicated a variability of GUS activity in different tissues of the
same transgenic plant (Zhang et al., 1991 ; Demeke et al., 1998).
No GUS activity was found in the root system of W2. The absence of GUS
activity in the roots of this plant raised the possibility that W2 might be chimeric
with respect to incorporated GUS genes. Accordingly, additional tests were
per{ormed by staining anthers from every tiller of the transformed W2 plant.
Results from these experiments showed that anthers from every tiller of the W2
plant exhibited GUS activity (data not shown). This suggested that the plants was
not chimeric.
Although it was expected that the rice Actin promoter driving GUS gene in
the pAcfl-D GUSconstruct would be active in the roots (Zhang et al., 1991), this
plant showed no GUS activity in the roots, and the absence of GUS activity in the
roots was also experienced in the transgenic progeny of this plant (Chapter 4).
The reason for this is unclear, but may reflect the position in which this gene was
integrated in the genome. Such a "position effect" could cause a tissue-specific
block of GUS expression.
To confirm the presence of the GUS gene in putative transformants, it was
decided to reprobe the membrane, which contained DNA samples of plants W2,
W3 and W6, with the GUS probe. As predicted from the histochemical GUS
staining results, only W2 was found to carry the GUS gene, These analyses also
ruled out the possibility that the GUS gene had indeed been incorporated into the
W3 and W6 plants, but was simply not being expressed (Figure 3.6C).
Two or more bands hybridizing to the GUS probe were detected in the
EcoRf- and BamHl-digested DNA from W2. This indicates that more than one
integration site of the GUS gene is present. The presence of both bar and GUS in

Chapter Three 78
the same plant (W2) indicates that co-integration of the introduced transgenes has
obviously occurred. This result is in agreement with previous work using
microprojectile bombardment, where two genes introduced via lwo independent
plasmid vectors were co-integrated into the wheat plant genome (Becker et al.,
1994; Nehra et al., 1994; Chibbar et al., 1998).
As mentioned earlier, two successful bombardment experiments were
achieved towards the end of this study (Table 3.3). In these experiments, 39 and
306 immature embryos were bombarded with lhe bar gene in the second and the
third successful experiments, respectively, Because of the high incidence of
'escape' regenerants in the early experiments, efforts were made to refine the
selection procedures. Selection pressure was increased to 5 mg/l Bialaphos for
selection of W7 and W8, or to 5 mg/l of PPT for W9, compared with 3 mg/l
Bialaphos used in earlier experiments. Putative transformants recovered from the
selection medium were grown in soil and directly subjected to Southern blot
analysis (W7 and W8), or subjected to the herbicide application test, followed by
Southern blot analysis (W9).
To assess the effectiveness of the herbicide spraying test, it was decided to
spray only a single putative transformant, together with a control plant. The single
putative transformant (W9) from the third successful transformation experiment
was used for this purpose. The W9 plant showed resistance to the applied
herbicide, whilst the control plant died within one week (Figure 3.2F). This
indicated that the bar gene was expressed and could protect the plant from
herbicide toxicity.
Southern blot analysis showed that all three plants from the later
experiments (W7, W8 and W9) carried the bar gene (Figure 3.6D). Thus, it was

Chapter Three 79
demonstrated that by increasing the selection pressure and by performing a
herbicide spraying test, the incidence of 'escape' regenerants could be reduced,
The presence of 0,87 Kb and 1 .0 Kb DNA f ragment carrying the bar gene in EcoRl
and BamHl digests, respectively (Figures 3.68 and 3.6D), confirmed that intact
copies of the bar gene had been integrated into the genomes of these plants. ln
the case of W9, the presence of hybridizing bands which were larger than the
expected fragments (>4 Kb in both the EcoRl and Bam'd.l tracks) (Figure 3.6D)
indicated that the bar gene in this plant might have undergone rearrangement
when integrating into the plant genome, Since this plant showed resistance to
herbicide application, the coding region of the bar gene must have been intact.
The EcoRl and Bamïl restriction sites in the pDM302 (Figure 3.1A), might have
been lost during integration.
Based on the Southern blot results, it was believed that the three plants
had more than one integration site of lhe bar gene, which might also indicate the
presence of multiple copies of transgenes, as indicated by the presence of
multiple hybridization bands in all tracks of restriction enzymes used, particularly in
Hindlll tracks, since Hindlll cuts outside the coding region of the bar gene. The
results found here were similar to previous work reporting the integration of
multiple copies of transgenes in transgenic wheat plants produced via
microprojectile bombardment (Vasil et al., 1992; Barro et al., 1997; Lörz et al.,
1 ee8),
Agronomic characteristics of all four transgenic plants produced from the
three successful bombardment experiments were monitored. Generally, the
transgenic wheat plants were healthy and fertile (Table 3.5). Maturity of the
transgenic wheat plants was attained approx. 26-30 weeks after bombardment,

Chapter Three 80
It was also noted that the transgenic wheat plant designated W2 showed a
dwad phenotype compared with the other three transgenic plants (W7, W8 and
W9), which had physical characteristics similar to control plants (Figure 3.8).
Differences were also noted ín the number of grains produced from the four
transgenic plants. The W2 plant produced only 41 grains as compared with over
100 grains produced f rom the other three transgenic plants.
During the course of this study, around 12,500 immature scutella and
immature embryos were bombarded with various gene constructs in 77
experiments (Table 3.2). However, successful transformation was achieved in
only three experiments. The transformation frequency was approx. 0.7Yo, based
on the number of isolated scutella and immature embryos bombarded in the three
successful experiments, or approx. 0.03% based on the total number of targets
bombarded. The transformation frequency achieved in the successful
experiments (0.7%) is still in the range of transformation frequency for wheat
plants reported elsewhere (0.2-9.7%) (Weeks et al., 1993; Vasil et al., 1993;
Becker et al., 1994; Nehra et al., 1994; Orliz et a/., 1996; Dobrzañska, et al., 1997;
Zhang et a1.,2000).
It is believed that by far the most limiting factor which hindered the
production of transgenic plants on a regular basis was the condition of donor
plants, as discussed in Chapter 2. ln that Chapter, it was reported that cultured
explants from the cvs. Frame, Krichauff and Hartog responded extremely well in
initial experiments but that their growth rate in culture and regeneration capacity
deteriorated dramatically in subsequent experiments. The first successful
transformation outlined in this study was performed in 1995, when the response of
explants in culture was still high. In subsequent experiments, the response of

Chapter Three 81
bombarded explants in culture was very poor (see Chapter 2), so that although
bombardment conditions had been manipulated (see Table 3.2), no satisfactory
outcomes were achieved. Towards the end of this study in 1999, two fufther
successful experiments were achieved. Their success was attributable to
refinements in conditions for growing donor plants, which resulted in greatly
improved culture response. Based on these obseruations, it must be strongly
emphasized that a good explant response in culture is an important prerequisite
for the successful transformation of wheat.

CHAPTER FOUR
TRANSGENE INHERITANCE AND
EXPRESSION IN PROGENY OF
TRANSFORMED WHEAT

Chapter Four 83
4.1 lntroduction
The production of fertile transgenic wheat plants carrying various genes of
interest has already been reported in the literature (Chibbar et al., 1998; Bliffeld ef
al., 1999). All the indications are there to suggest that, in the near future,
genetically engineered wheat will be available for breeding programs. However,
before transgenic wheat plants can be confidently incorporated into wheat
breeding programs, it is crucial to monitor the behavior of insefted transgenes, not
just in primary transgenic wheat plants, but also in successive generations, The
faithful inheritance and expression of transgenes are particularly important
properties in the light of repofts of gene silencing in transgenic plants, through
mechanisms such as DNA methylation, co-suppression and genetic
rearrangements (Meyer, 1995"; Vaucheret, et al., 1998).
Until recently, few studies have been conducted to investigate the fate of
inherited transgenes in the progeny of transformed wheat. This might be because
inheritance studies are time-consuming and labour-intensive, or because
insufficient plant material has been available for analysis. Indeed, the majority of
work has been focussed on overcoming the technical barriers in producing
transgenic wheat, and on improving transformation frequencies (Harvey et al.,
1999; Zhang et a1.,2000).
In the current project, the integration and expression of two transgenes (bar
and GUS) have been studied in transgenic wheat plants, as presented in Chapter
3. In this Chapter, experiments are described to define how both introduced
transgenes were transmitted to and expressed in the second and third generations
after the initial transformation event.

Chapter Four 84
4.2 Materials and Methods
4.2.1 Plant growth conditions and maintenance
To study transgene inheritance in successive generations (T1 to T3), grains
produced from the self-pollinated transgenic W2 plant or its progeny plants were
randomly picked and sown in soil. Plants arising from these grains were grown to
maturity in the glasshouse as described in Chapter 2 (Section 2.2.1).
4.2.2 Histochemical GUS staining
GUS staining was performed as described in Section 3.2.8. ln order to
obserue GUS expression in roots, grains from several T1 ,T2 and T3 plants were
germinated in Petri dishes or in a vermiculite-filled tray. In the case of grains
germinated in Petri dishes, the grains were initially sterilised in 15% (v/v)
Domestos for 10 min and rinsed f ive times in sterile water. After sudace
sterilization, the grains were aseptically placed in Petri dishes on moist Whatman
3MM chromatography paper, and the seedlings were allowed to develop for two
weeks.
Before the plants were transferred to soil, two root tips approx. 4 cm in
length were cut from each seedling and stained in X-gluc solution (Section 3.2,8).
The remaining seedlings were transferred to soil and grown in the glasshouse to
maturity. Other plant parts such as leaves, ovaries, anthers and grains were
stained as described in Section 3.2.8.
4.2.3 PAT assay and herbicide leaf-dip test
ln analysing the expression of the bar gene in the progeny of the transgenic
W2 plant, both PAT assays and herbicide leaf dip tests were performed, as

Chapter Four 85
described in Sections 3.2.9 and 3.2.10, respectively. However, in leaf dip tests,
two leaves from each plant were dipped into a O.O1% Basta@ solution, and in one
case, the leaves from a number of T1 plants (Section 4.3.1.2) were also dipped
into 0.1o/" and 1% Basta@.
4.2.4 Southern blot hybridization
Southern blot analysis was carried out using procedures described in
Section 3.2.12, with several modifications. Approximately 30 pg genomic DNA
was used per restriction enzyme digest.
Based on the Southern blot analysis of T0 leaves of the primary
transformant, it appeared that the W2 plant had multiple ínsertions of the GUS
transgene, as indicated by the presence of two or more bands in the EcoRl and
BamHl tracks (Figure 3.6C). Thus, in analyzing the transmission of transgenes
from the primary transformant to its progeny, efforts were made to provide an
estímate of the copy number of the transgenes, especially the GUS gene, carried
by each progeny. For this, both single and double restriction enzyme digests were
used, as detailed in Table 4.1.
ln these experiments, Hrndlll was used to provide the estimates of copy
numbers of the GUS gene, because this restriction enzyme cuts at only one site in
the pÁcfl-D GUS construct (Zhang et al., 1991) (Figure 4.1). To overcome the
problem of incomplete digestion of DNA, as encountered in analysing the primary
transformant (W2) (Section 3.3.7), a newly purchased batch of each restriction
enzyme was used, and some modifications were made to the DNA digestion
procedure, ln all DNA restriction mixtures, a 10x "Super-DupeË' buffer (SDB)
(Langridge et al., 1999) (330 mM Tris-HCl buffer, pH 7.8, containing 650 mM

Table 4.1 The expected fragment sizes of the bar and GUS genes excised with
various restriction enzymes
Constructs Restriction enzymesExpected f ragment sizes
(approx. Kb)
pDM302(barf ragment)
pActl-D GUS(GUS f ragment)
Hindlll
BamHl + Sstl
EcoRl
Ncol
Hindlll
BamH.l + Sstl
EcoRl
Ncol
Unknown
1.0
0.87
Unknown
Unknown
1.8
Unknown
Unknown

600
Acll 5'region bat
A
B
1 370
HE 0.87 Kb
pDM302 (4.8 Kb)
1.0 KbB
2100
SE
500 bp
1.8 Kb
1815 270
xb
pBluescript ll-SK
pActl-D GUS (7.2 Kbl
GUSAcfl 5' regiontnos !,

Figure 4.1 Restriction map. Restriction maps of (A) pDM302 and (B) pActl-D
GUS. Enzymatic restriction sites used in these experiments are shown in coloured
letters. Expected fragments from enzymatic digestions used are indicated by
coloured thick lines. Abbreviations of restriction sites: B: Bam{l; E: EcoRl; H:
Hindlll; S: Ssfl; X: Xhol and Xb: Xbal.

Chapter Four 86
potassium acetate, 100 mM magnesium acetate, 40 mM spermidine and 50 mM
dithiothreitol) was used. An appropriate amount of restriction enzyme (3 pl) was
added and the mixture incubated at 37oC Íor 2 h. An additional 3 pl restriction
enzyme was added and the reaction incubated for another 3 h.
A modification was also used during Southern transfer, where 0.4 M NaOH
was used instead of 10x SSC solution.
4.2.5 Statistical analysis
The X' (Chi-square) test (Russell, 1990) was conducted to aid the
interpretation of transgene inheritance in transgenic progeny.

Chapter Four 87
4.3 Results
4.3.1 Transgene inheritance in T1 plants
Seventeen of the 41 grains (T0 grains) produced from the self-pollinated
primary transformant W2 were randomly chosen for analyzing transgene
inheritance in T1 progeny, Fourof the 17 grains were germinated in Petri dishes
lor analyzing GUS expression in the roots before transferring to soil, and the other
13 grains were directly sown in soil. All 17 grains germinated and subsequently
grew and developed into mature plants.
4.3.f .1 PAT assay
The expression of the bar gene in transgenic wheat progeny was analysed
by performing PAT assays. Of the 17 plants tested, 14 plants showed PAT
enzyme activity, but three plants (2, 6 and 10) did not show PAT activity (Figures
4.2A-B). Results from the PAT assays in leaves of T1 plants are summarized in
Table 4.2.
4.3.1.2 Response to the herbicide leaf-dip test
Results f rom the leaf dip test indicated that 13 out ol 17 T1 plants were
tolerant to 0.01% Basta@ solution (or 0.005% glufosinate ammonium), but the
remaining four plants, no. 2,6,9 and 10, were as sensitive to the herbicide as
control plants (Table 4.2). Fufthermore, of the four T1 plants (no. 14-17) tested
using high concentrations (0.1 and 1% Basta@), only one plant (no. 14) showed
tolerance to 0.1% Basta@. Leaves from the other three plants (no. 15-17)
became necrotic at this concentration. None of the four plants showed tolerance

A
AcetylatedPPT-
B
PPT
-
,ñ r¡,
Ç TF
*#* tt4s' tIt
1, 2 3 4 5 6 7 8 9 10 11 12 l3Wc1+CcWc2Bl
Ace,y,a,e, t Õ r I lt,lolr tt{|Ë;Ç'iË
Çt;tÇ
14 15 16 17 Wc +81 +82 +83 +84 +85 Bc Bl

Figure 4.2 PAT assays of T1 progeny. (A) and (B) PAT activity in leaf extracts
of T1 progeny (numbered 1-17) and in a control plant. The position of acetylated
phosphinothricin is indicated by an arrow. Abbreviations: Bl: blank sample; Wc1-2;
wheat negative control no. 1 and no.2; +81-5; positive control of transgenic barley
plants no. 1-5 (provided by Dr. Javed Qureshi); Bc: barley negative control; +Cc:
callus line positive control (provided by Mr. R. Singh).

Table 4.2 The presence and expression of the bar and GUS genes in T1 progeny
oÍ cv. Frame
Plantcode
PAT assay Leaf dip test Southern blotfor Basta@resistance bar GUS
GUS staining
Leaf Anthers
1
2
3
4
5
6
7
8
9
10
11
12
13
14
15
16
17
+
+
+
+
+
+
+
+
+
+
+
+
+
+
+
+
+
+
+
+
+
+
+
+
+
+
+
+
+
+
+
+
+
+
+
+
+
+
+
+
+
+
+
+
+
+
+ (4.)
+ (3.)
+ (3.)
+ (3.)
+ (2.)
+ (2.)
+ (2.)
+ (2.)
+ (4.)
+ (3.)
+ (2.)
+ (2.)
+ (2.)
+ (2")
+ (3.)
+
++
+++
++
++
++
+
+
+
+
++
++
++
++
+++
+
+
+++
y2 çor bar and GUS) = 1 .59** dF=1 o.2<P<0.3
Notes:+ : shows positive result for the presence or expression of transgenes.- : shows negative result for the presence or expression of transgenes.* : numbers of hybridizing bands of the GUS gene observed.** : Test of hypothesis for bar and GUS segregated in 3:1 ratio in T1 progeny (I2 = 1 .59;0.2<P<0.3), see Appendix 4.
x2 = Chi-square; dF = degree of freedom.

Chapter Four 88
al lo/" Basta@ solution (Figure 4.3A). Based on results found here, it was decided
to use a low concentration of Basta@ solution (0.01%) when this herbicide was
applied loT2 and T3 progeny.
Overall, the results of leaf dip test did not exactly match those from the PAT
assay, because one plant (no. 9) which showed PAT activity, proved to be
sensitive to herbicide application (Table 4.2).
4.3.1.3 GUS staining
The expression of the GUS gene in T1 plants was analysed in roots,
leaves, spikelets, anthers and grains. Variation in GUS activity could clearly be
obserued between tissues. Fifteen of 17 T1 plants showed high levels of GUS
activity in anthers and spikelets. No GUS activity could be detected in the roots of
the four plants tested (14-17) (Figure 4.38). Furthermore, GUS expression in
leaves was generally very low and could be detected in only seven of the 15
plants that showed activity in anthers. GUS activity could also be detected in
several samples of grains (Figures 4.3C-E). lt was noticed that the level of GUS
expression in anthers varied from low (+) to high (+++) (Table 4.2; Figure 4.3D).
4.3.1.4 Southern blot analysis
Southern blot analyses showed that 15 of the 17 T1 plants analysed,
namely the 15 plants showing GUS activity, carried the GUS gene (Figures 4.48,
4,58 and 4.68). lt was noted that eight plants had two hybridizing bands (no. 5-8,
13-16), five plants with three hybridizing bands (no.2-4, 12, and 17), two plants
had four hybridizing bands (no. 1 and 11) and two plants (no.9 and 10) had no
detectable hybridizing bands (Table 4.2).

CmlrolB
ìt
II
I
I
iirlt
iE
I'ì )t
,, 1\
I0.005
0.005
t
\
0.5
IControlT1
Control TZ seeds

Figure 4.3 Analysis of transgene activity in T1 progeny. (A) The leaf dip test
shows herbicide resistance at 0.1o/" and O.O1% Basta@ solution (or 0.05% and
0.005% glufosinate ammonium, respectively) but necrosis at 1% Basta@ solution
or 0.5T" glufosinate ammonium in leaves of transgenic plants (left). Leaves of
control plants show necrosis at 0.01% Basta@ solution (or 0.005% glufosinate
ammonium) (r¡ght); (B) Absence of GUS activity in roots; (C) GUS activity in
spikelet; (D) in anthers; and (E) in grains of transgenic (right) and control (left)
plants.

A T1 Plant No.2 4 s 6 I 9 10 1112131416 c
öar probe
GUS probe
Kb>12.0 +
6.0*
s4¡&.:s'
#,
BT1 Plant No.
2 4 5 6 I 9 10 1112131416 C
{F
*
üil!Ê.'
**#*t.-1.'#
':
{
r

Figure 4.4 Southern blot analysis of T1 progeny. Genomic DNA isolated from
T1 plants was digested with Hindlll. The digested DNA was hybridized with (A)
bar probe, showing a single band (approx. 3.a Kb); and (B) GUS probe, showing
multiple bands (2-4 bands with sizes of approx. 6.0, 7.9, 9.0 and >12.0 Kb).
Abbreviations : C: wheat control; T1: first transgenic wheat generation; Kb:
kilobase.

A Tl Plant No. T2(llPlant No.
15 16av)fIzÐÊ zÉù2
4*- + +
347ch (n ch v)A zøAzÉÅzøÅr¡
t7
zø+
I
.:.
-!+l!
t
ö I
Þar probe
GUS probe
B
1.0-
Kb>12.0-
9.0
-7.9-6.0-
Tl Plant No. T2(l7)Ptant No.
ls t6(t) ct)
z¡A zøA47
(t) (t) (tA zøå e ø A,r
t7
zú3
ct)+É zÉ
--+ +-+ ++
+
I
{ 'tö.Ü
.,+
1.8- ? Ç o

Figure 4.5 Southern blot analysis of Ti and T2 progeny. Genomic DNA
isolated f rom T1 and T2 plants (derived f rom T1 plant no. 17) was digested with
Ncol, Hindlll and Bam{l + Ssfl double digest. The digested DNA was hybridized
with (A) bar probe and shows the predicted fragment of the pDM302 vector
(approx.1.0 Kb) in the BamHl+SSfl tracks, a single band in the Hindlll (approx. 3.4
Kb) and in the Ncol (indicated by blue arrows, >12.0 Kb) tracks; and (B) GUS
probe, showing the predicted fragment of the pActl-D GUS vector (approx. 1.8
Kb) and an additional band (indicated by red arrows) in Bamïl+Ssfl tracks,
multiple bands (approx. 6.0, 7,9, 9.0 and >12.O Kb) in Hindlll tracks and one to
two bands (indicated by pink arrows, >12.0 Kb) in Ncol tracks. Abbreviations: C:
wheat control; T1 and T2: first and second transgenic wheat generations; Kb:
kilobase, Abbreviations of restriction enzymes used: B+S: BamHl and Ssfl double
digest; H: Hrndlll; N: Ncol.
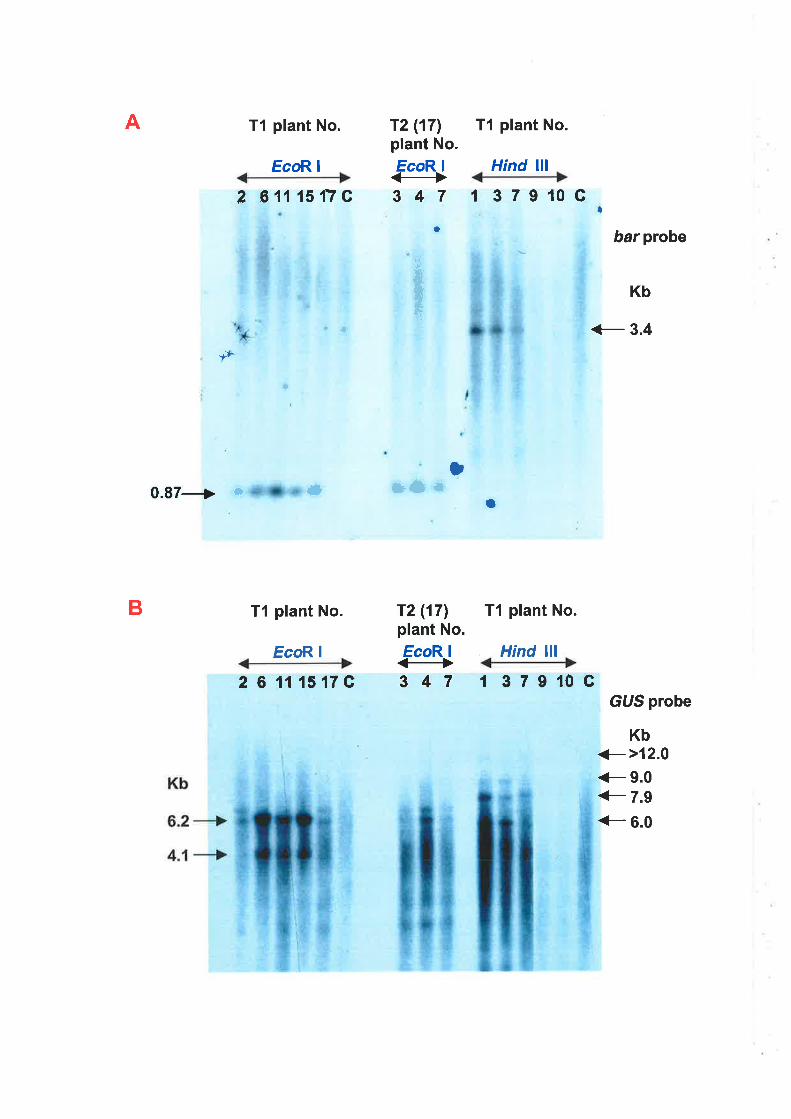
A T1 plant No.
EcoR I
2 611 15flG
12 (171plant No.
EcoR I<+3 47
)
T1 plant No.
Hind lll137 910G
T1 plant No.
Hind lll137 910C
a
I
KbåqIa
barprobe
e3.4tY'
a
0.97+ 'r * *lr
T1 plant No.
O
B
EcoR I
26111517C
12 (171plant No.
EcoR I
3 47GUS probe
Kb+>12.0+9.0+ 7.9
<- 6.0
Figure 4.6 Southern blot analysis of T1 and T2 progeny. Genomic DNA
isolated f rom T1 (2 sets of 5 plants) and T2 (3 plants derived from T1 plant no. 17)
plants was digested with either EcoRl or Hindlll. The digested DNA was
hybridized with (A) lhe bar probe, showing the predicted fragment of the pDM302
vector (approx. 0,87 Kb) in EcoRl tracks; and (B) the GUS probe, showing two
hybridizing bands in the EcoRl track. Genomic DNA from T1 plants no, 1, 3 and 7
digested with Hrndlll shows a single hybridizing band containing lhe bar gene
(approx. 3,4 Kb) and multiple bands containing the GUS gene (2-4 bands with
sizes of approx.6.0,7.9,9.0 and >12.0 Kb). Plant no.9 and 10 have not inherited
the transgenes. Abbreviations: T1: first transgenic wheat generation; T2(17):
second transgenic wheat generation derived from T1 plant no. 17; C: wheat
control; Kb: kilobase. Abbreviations of restriction enzymes used: E: EcoRl; H:
Hindlll.

Chapter Four 89
The presence of the inherited GUS gene in T1 plants was also confirmed
by the digestion of genomic DNA derived from three T1 plants (no, 15, 16 and 17)
with Ncol (Figure 4.58). This enzyme cuts only in the flanking genomic DNA since
no restriction sites are present in the pActl-D GUS construct. lt was noticed that
T1 plant no. 17 had two distinguishable hybridizing bands (indicated by pink
arrows) both of which were more than 12 Kb in size, suggesting that the copies of
the GUS gene were integrated at different sites in the plant genome. ln T1 plants
no. 15 and 16, however, only one band was visible.
Further analysis using EcoRl on the DNA from five T1 plants (no. 2, 6, 11,
15 and 17), detected two hybridizing bands of the GUS gene in all plants (Figure
4.68). One band of 6.2 Kb was common to all five plants, whilst plants no, 2 and
17 carried a fragment larger than this and plants no. 6, 11 and 15 shared a
fragment of 4.1 Kb (Figure 4.68).
lntegrity of the GUS gene was checked by digesting genomic DNA from
three T1 plants (no. 15, 16 and 17) with BamHl and Ssfl (Figure 4.58). One
intense band, which corresponds to the entire GUS gene with the size of approx.
1,8 Kb (Figure 4.1), could be easily detected in all tracks (Figure 4.58). Moreover,
it appeared that there was an additional fainter band (indicated by red arrows) in
the digests of T1 (17) and T2 (17.3-4 and 17.7).
To analyse for the presence of lhe bar gene in the T1 progeny, the
membrane was stripped and reprobed. All 15 plants carrying the GUS gene also
had the bar gene (Figures 4.4A,4.54 and 4,64). Only one hybridizing band was
detected in the Hindlll (approx, 3.4 Kb), EamHl+Ssfl (approx. 1,0 Kb), Ncol
(indicated by blue arrows, >12.0 Kb) and EcoRl (approx. 0.87 Kb) digests (Figure

Chapter Four 90
4.1). From these results, it seems that only one copy of the bar gene is integrated
in the genome of T1 Plants.
The transmission of the bar and GUS genes from the W2 primary
transformant to its T1 progeny resulted in 15 out of 17 T1 plants with both the
transgenes. The segregation of the transgenes (bar and GUS) to T1 progeny
suggested either a Mendelian pattern for two unlinked integration sites (15:1 ratio
as compared to the 15:2 ratio observed), or a single integration site (3:1 ratio with
X2= 1.59; 0.2<P<0.3; see Table 4.2 and Appendix 4),
Southern blot analyses were subsequently compared with histochemical
GUS staining, the PAT assay and the herbicide leaf-dip test, lt was found that all
15 plants carrying the transgenes showed GUS activity. However, only 13 out of
these 15 plants were positive for PAT activity and the leaf-dip test. The remaining
two plants (no. 2 and 6) lacked or had lost PAT activity, and showed sensitivity to
herbicide application.
Of the two plants (no. 9 and 10) that did not show the presence of either
transgene (Figures 4.4A-B and 4.64-8), plant no. 9 showed PAT activity (Figure
4.2; Table 4.2). This result is similar to the analysis of putative primary
transformants (Section 3.3.4) where some of the plants showed PAT activity
without lhe bar gene being present.
4.3.1.5 Appearance of T1 plants
As stated earlier, 17 grains originating f rom the one T0 plant (W2) were
successfully grown into mature plants. Visually, the majority of the T1 plants
including both the transgenic progeny and non-transgenic segregants, showed
poor phenotypic characteristics and low yield, which were relatively similar to the

Chapter Four 91
primary transformant W2 (Figures 4.7 and 4.8). Fourteen of the 17 T1 plants
showed a low yield of grain (no. of grains/plant), and one non-transgenic
segregant, that is plant no. 9, was found to be completely sterile. Only two of the
T1 plants (no.3 and 15) showed a high yield (Table a.3).
4.3.2 Transgene inheritance in T2 plants
ln analysing transgene inheritance in T2 plants, three T1 plants showing
different banding patterns of the GUS gene were chosen as parental plants,
namely plants no. 11, 15 and 17. These plants showed 4, 2 and 3 hybridizing
bands, respectively (Figures 4,48 and 4.58), which suggests that these three
plants had different numbers of inseftions of the GUS gene. Thírty-three grains
originating from these three plants (plants no. 11, 15 and 17 with 12,6 and 15
grains, respectively) were randomly selected. All grains from T1 plants no. 11 and
15 were directly sown in the soil, while grains from T1 plant no. 17 were
germinated in a vermiculite-filled tray for two weeks. Young seedlings from T1
plant no. 17 were subsequently transferred to soil and raised to maturity in the
glasshouse. Prior to transferring to soil, two root tips from each plant were cut and
stained for GUS expression.
4.3.2.1 PAT assay
PAT assays were performed on leaf extracts from all T2 plants (33 plants)
(Figures 4,94-C), PAT activity was obserued in only seven of the 12T2 (11.1-12),
two out of six T2 (15.1-6) and six out of 15 T2 (17.1-15) plants (Table 4.4). These
results clearly indicated that a considerable number of T2 plants did not show PAT
activity. To confirm these results, one of the PAT negative plants, that is T2 plant

80
70
Êoo;50Êä¿oÊË30tzv
10
0
TO T1
I7
6
5
4
3
1
0
EþGÊËcö3
T1TO
300
250
200
'150
'100
50
0
!oI
TO T1
F45.9 40
Ë.u330tzsE2oI'u910E.ìo
TO T1
Figure 4.7 Phenotypic characteristics of transgenic plants (blue bars), non-
transgenic segregants (red bars), T1 population (green bars) and control
plants (yellow bars). (A) height of plant; (B) length of head; (C) yield (no. of
grains/plant) and (D) average we¡ght per grain.

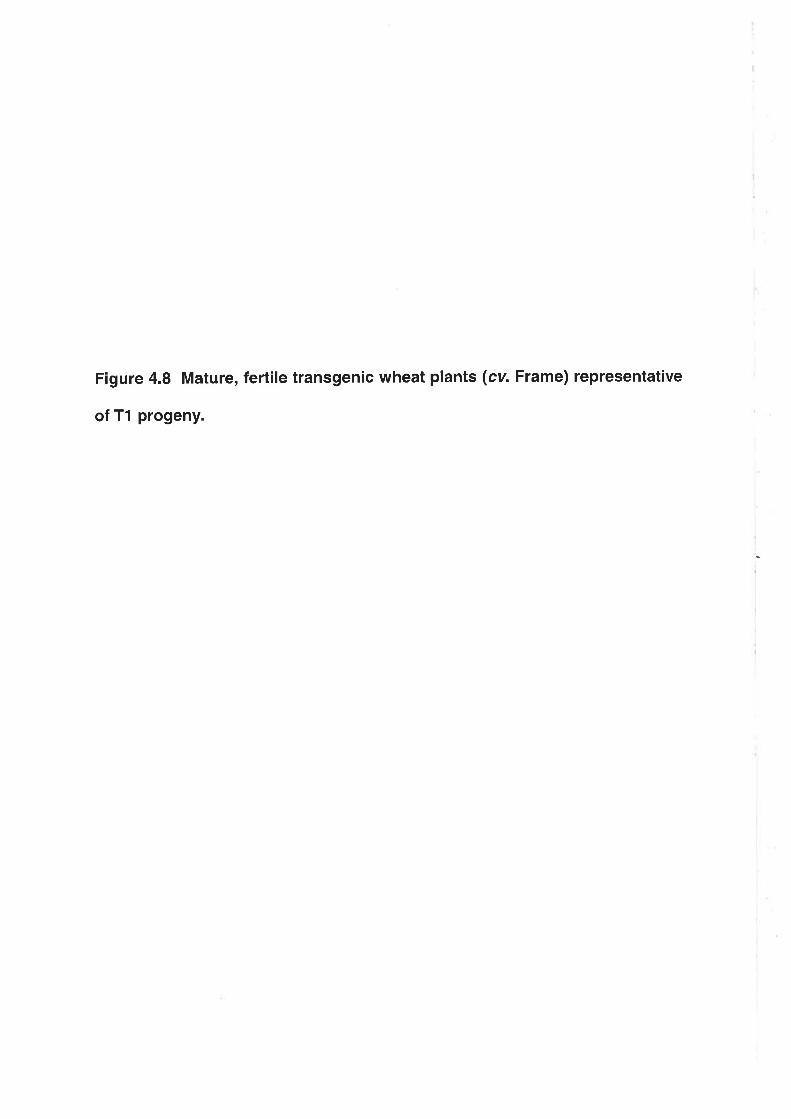
Figure 4.8 Mature, fertile transgenic wheat plants (cv. Frame) representative
ofTl progeny.

Table 4.3 Phenotypic characteristics and yield of T1 progeny oÍ cv. Frame
Plantcode
Height (cm)(average)
Length ofheads (cm)
Yield (No. ofgrains/plant)
Average weightper grain (mg)
1
2
3
4
5
6
7
8
g*
10*
11
12
13
14
15
16
17
Cont. 1
Cont.2
Cont.3
46
41
48
46
43
41
48
44
17
39
44
32
47
33
47
48
39
71
68
74
43
49
100
53
24
49
64
34
0
4
29
38
55
26
224
64
86
281
199
291
21
22
25
34
36
37
35
33
36
34
36
28
32
21
29
22
42
40
42
4
3
4
4
3
3
4
3
2
3
4
3
4
4
4
5
4
6
b
I
Notes:* : non-transgenic segregants confirmed by Southern blot hybridizationCont: control plants.Total grains produced by T1 progeny:942.Grains produced by transgenic progeny : 938.Average weight per grain of transgenic progeny (mg) : 30.Grains produced by non{ransgenic segregants : 4.Average weight per grain of non-transgenic segregants (mg) : 18.Average yield of control plants : 257.Average weight per grain of control plants (mg) : 41.

A
AcetylatedPPT +
T2(17) Plant No.
1 2 3 4 5 6 7 I 9 10 WcBl+Cc+W
' lgË *Þ ,r4its rr
^â
T2(17) Plant No.
10 L1 L2 L3 14 15 Bt +Cc Wc
+Acetylated l?ÜÇÇt üPPT+
;
;
fì
B
U
ffi''#
tç Ç ;r
*a

cT2(11) T2(1s)
1 2 3 4 5 6 7 I 9 10 Lll2l 2 3 4 5 6 Bl+CcWc
to*l''-fi Ë ; *ül ilf +lf r¡ol¿å#vrated
vv
eull|l;llrr!l-rtr:l- I.Òt
Figure 4.9 PAT assays of T2 progeny. (A) and (B) PAT activity in leaf extracts of
T2 progeny (derived from T1 plant no. 17) and (C) T2 progeny (derived from T1
plants no. 11 and 15). The position of acetylated phosphinothricin is indicated byan
arrow. Abbreviations: Bl: blank sample; Wc: wheat negative control; +Cc: callus line
positive control (provided by Mr. R. Singh); +W: positive control of transgenic wheat
progeny (T1).

Chapter Four 92
no. 17.10, was analysed twice. Based on both PAT assays, it was concluded that
this plant had lost PAT activity (Figures 4.94-8).
4.3.2.2 Response to the herbicide leaf-dip test
As performed for T1 plants, two leaf tips Írom T2 plants were dipped into
O.01"/" Basta@ solution or 0.005% glufosinate ammonium, Results from the leaf
dip test showed that seven out oÍ 12T2(11.1-12) and two out of six T2(15.1-6)
plants were tolerant to herbicide, while the other remaining plants were sensitive
and responded similarly to the control plants (Figure 4.10A). ln the case of T2
(17.1-15), six out of 15 plants showed tolerance and the other four plants showed
very low tolerance to herbicide. ln general, these results matched those of the
PAT assay, where all the herbicide tolerant plants were PAT positive, whilst the
herbicide sensitive plants were PAT negative. Results from the herbicide
application test are summarized in Table 4.4.
4.3.2.3 GUS staining
Histochemical GUS staining in T2 plants was also carried out in roots,
leaves, ovaries, anthers and grains. The results showed that nine out of 12 T2
(11), two out of sixT2 (15) and allT2 (17) showed GUS activity. The expression
of the GUS gene in these T2 plants was in most cases similar to the T1 plants in
which no GUS activity could be detected in the roots (Figure 4.38), low GUS
activity was found in the leaves and high GUS activity was obserued in ovaries,
anthers and grains (Figures 4.108-D). lt was obserued that the level of GUS
activity in anthers of these T2 plants ranged from low (+) to high (+++) (see Table
4.4 Íor details).

Table 4.4 The presence and expression of the bar and GUS transgenes in T2 (1 1
and 15) progeny of cv. Frame
Plantcode
PAT assay Leaf dip test Southern blotfor Basta@resistance Bar GUS
GUS staining
Leaf Anthers
T2(1 1)**
11.1
11.2
11.3
11.4
11.5
11.6
11.7
11.8
11.9
11.10
11.11
11.12
+
+
+
+
+
+
+
+
+
+
+
+
+
+
+
+
+
+
+
+
+
+
+
+
+
+
+
+
+ (3.)
+ (4.)
+ (3.)
+ (4.)
+ (3.)
+ (4.)
+ (3.)
+ (2.)
+ (2.)
+ (2.) +
+ (2.) +
+
++
+++
+++
+++
+++
+++
++
++
++
++
r2(f5l***15.1
15.2
15.3
15.4
15.5
15.6
+
+
+
+
+
+
Notes:+ : shows positive result for the presence or expression of transgenes.- : shows negative result for the presence or expression of transgenes." : numbers of hybridizing bands of the GUS gene observed.** '. bar and GUS genes segregating 3:1 (or 9:3) ratio in T1 (1 1)*** : T2(15) was not analyzed using the 12 since the sample size was too small (6 plants)

Table 4.4 (continued), The presence and expression of the bar and GUS
transgenes in T2 (17) progeny of cv. Frame
Plantcode
PAT assay Leaf dip test Southern blotfor Basta@resistance Baf GUg
GUS staining
Leaf Anthers
17.1
17.2
17.3
17.4
17.5
17.6
17.7
17.8
17.9
17.10
17 .11
17.12
17.13
17.14
17.15
+
+
+
+
+
+
+
+
+
+
+
+
+
+
+
+
+
+
+
+
+
+
+
+
+
+
+
+
+
+
+
+
+
+
+
+
+
+
+
+
+
+
+++
+++
+++
+++
+++
+++
++++
+++
+++
++
+++
+++
+++
(+) +++
Notes:+ : shows positive result for the presence or expression of transgenes.- : shows negative result for the presence or expression of transgenes.. : hybridizing bands of the bar (1 band) and the GUS (3 bands) genes were similar in T1 plantno.17 and its progeny (T2 [17.1-15]).( ) : plants showing low tolerance to herbicide application.
(+)
(+)
(+)
+
+
+
+
+
+
++
+
+
+

TI
ID control
I
t.q
a
er
ao
2
i
5 )q11 r5
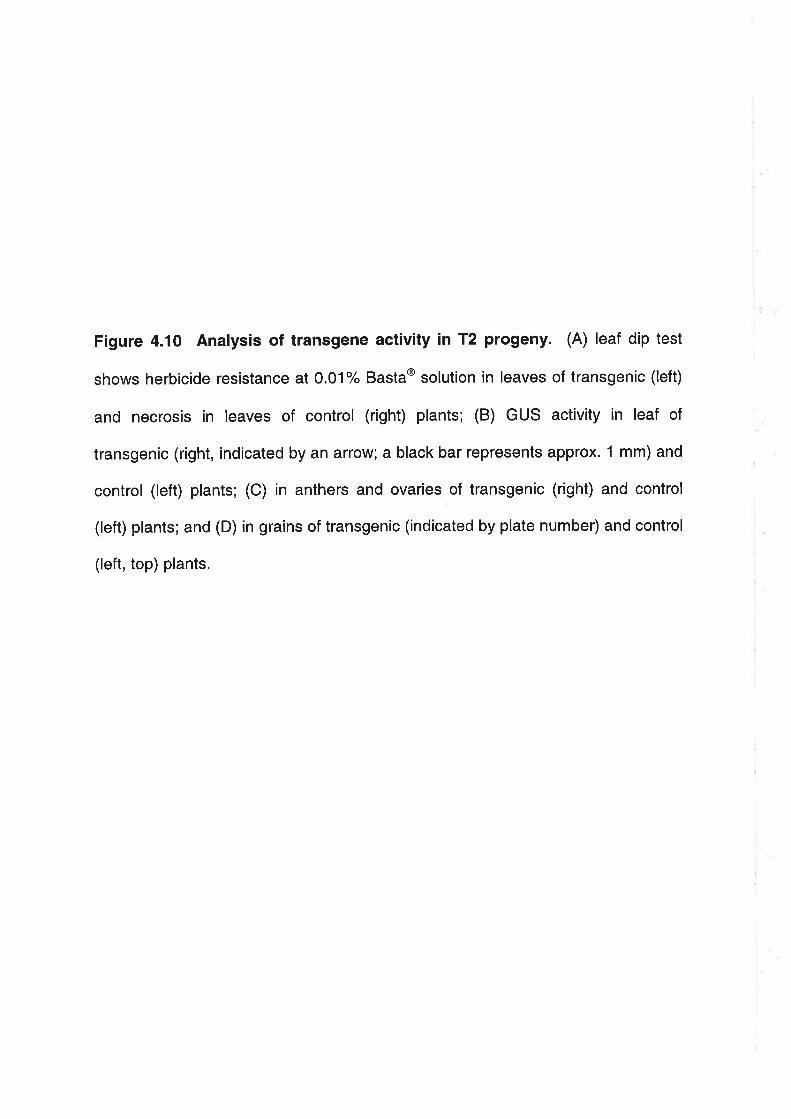
Figure 4.10 Analysis of transgene activity in T2 progeny. (A) leaf dip test
shows herbicide resistance at 0.01% Basta@ solution in leaves of transgenic (left)
and necrosis in leaves of control (right) plants; (B) GUS activity in leaf of
transgenic (right, indicated by an arrow; a black bar represents approx. 1 mm) and
control (left) plants; (C) in anthers and ovaries of transgenic (right) and control
(left) plants; and (D) in grains of transgenic (indicated by plate number) and control
(left, top) plants.

Chapter Four 93
4.3.2.4 Southern blot analYsis
lnheritance of the GUS gene in the T2 generation was confirmed by
Southern blot analysis, Genomic DNA isolated from all of the T2 plants was
digested with Hrndlll. Nine of 12T2(11), two of six T2(15) and all T2(17) plants
showed hybridization with the GUS probe, indicating the presence of the GUS
gene in these plants (Figures 4.58, 4.118 and 4.128). These results matched
those of GUS staining. The results also imply that the transmission of the GUS
gene was still segregating in T2(11) and T2(15) progeny, but not in the T2(17)
plants, suggesting that plants T1(11) and T1(15) were heterozygous and T1(17)
was homozygous for the GUS transgene.
It was observed that the GUS genes ín plant T1 no. 11 (this plant showed
four hybridizing bands of the GUS gene) segregated in its progeny. Three T2(11)
plants (no. 3, 5 and 7) had four hybridizing bands (approx. 6.0, 7.9, 9.0 and >12.0
Kb, as obserued in the parental plant), and DNA from four plants (no. 2,4, 6 and
8) produced three hybridizing bands (approx. 6.0, 7.9 and 9.0 Kb). Two plants
(no. 10 and 1 1) possessed two hybridizing bands (approx. 7.9 and >12.0 Kb) and
the remaining three plants (no. 1,9 and 12) had no positive signal forthe GUS
gene (Figure 4.118; Table 4.4),
In the case of progeny from plant T1 no. 15 (this plant showed two
hybridizing bands of the GUS gene), Southern analyses of two T2 plants (no, 15.2
and 15.5) also showed two hybridizing bands of the GUS gene (approx. 7.9 and
>12.0 Kb) (Figure 4.118), whilst the remaining four plants have no bands.
However, in plant T2 no. 17 (this plant showed three hybridizing bands of the GUS
gene), all its progeny showed three hybridizing bands of the GUS gene (approx.
6.0, 7.9 and 9.0 Kb) in a pattern identical to the parental plant (Figure 4.128).

A
Kb>',2.0+
9.0+7.9+6.0-+
T2 plant No.11
1 2 3 4 5 6 7 8 9101112
**
-15----->123456C
15+123456C
{*
+---)
+Kb
ìr
bar probe
GUS probe
3.4+ {*. O¡ üt+.i+
+--+
B T2plant No..- 11
5 6 7 8 91011121234

Figure 4.11 Southern blot analysis of T2(11 and 15) progeny. Genomic DNA
isolated f rom T2 plants (derived f rom T1 plants no. 1 1 and 15) was digested with
Hindlll. The digested DNA was hybridized with (A) bar probe, showing an intense
hybridizing band (approx, 3.4 Kb) with several additional faint bands (indicated by
red arrows); and (B) GUS probe, showing variation in the number of hybridizing
bands (2-4 hybridizing bands) in T2 plants derived from T1 plant no. 11 (T1 plant
no. 11 had 4 hybridizing bands) and 2 bands inT2 plants derived from T1 plant no.
15 (T1 plant no, 15 also had 2hybridizing bands). Abbreviations: C: wheat control;
T2: second transgenic wheat generation; Kb: kilobase,

A T2(L7)Plant No.2 5 6 I 9 1011 t2r3l4ts1
bar probe
GUS probe
B
+{Ë
T2(L7)Plant No.1 2 5 6 I 9 101112131415
*
t
*#ü
qI)+i)|}
r*ç
å
å;i

Figure 4.12 Southern blot analysis of T2(171progeny. Genomic DNA isolated
from T2 plants (derived from T1 plant no. 17) was digested with Hindlll. The
digested DNA was hybridized with (A) bar probe, showing a single band (approx.
3.4 Kb); and (B) GUS probe, showing multiple bands (3 bands as exactly obserued
for the parental plant no. 17). Abbreviation : T2: second transgenic wheat
generation; Kb: kilobase.

Chapter Four 94
Genomic DNA from three T2(17) plants (no, 3, 4 and 7) was also digested
with Ncol and BamHl+Ssfl double digest. Results from the Southern blot
hybridization showed that two hybridizing bands (indicated by pink arrows, >12'O
Kb) in the Ncol tracks (Figure 4.58). lt should be noted here that these two bands
could not be observed in T2 (17.7) because the gel was damaged near the Ncol
track. lt was also observed that a fragment of the GUS gene of approx. 1.8 Kb,
with an additional band (indicated by red arrows) in the BamHl+Ssfl tracks, was
present, as earlier seen in the parental plant (T1 no, 17) (Figure 4'5B). These
results implied that the GUS genes integrated into the T1 (17) plant genome were
transmitted to T2 (17.1-15) plants.
To confirm the presence of lhe bar gene in the T2 plants, the membrane
used for analyzing the GUS gene was stripped and reprobed with the bar probe.
Results showed that T2 plants carrying the GUS gene also had lhe bar gene.
One intense band, approx. 0.87,1.0 and 3.4 Kb in the EcoRl; BamHl+Ssfl, and
Hindlll digests, respectively, was identified in the T2 plants (Figures 4.54, 4.64
and 4.12A). A single band was identified in Ncol tracks (Figure 4.54, indicated by
blue arrows). ln Figure 4.11A, however, several fainter additional bands, which
were not detected in the T1 plants, were identified in the Hrndlll tracks.
Results from the Southern analyses were subsequently compared with the
results from the PAT assays and leaf dip tests. lt was found that the bar gene
inherited by T2 15.2 and T2 15,5 was functional, because the two plants showed
herbicide tolerance and PAT activity (Table a.a). ln the case of progeny from
T2(11) and T2(17), however, two out of nine T2 (11) and five to nine out of 15 T2
(17) plants having lhe bargene showed no herbicide tolerance and/or PAT activity
(Table 4.4).

Chapter Four 95
Unlike the results obserued for the expression of the bar gene, all plants
carrying the GUS gene showed GUS activity (Table 4.4). The presence of GUS
activity in T2(1 1.1-12) fitted a Mendelian inheritance pattern, where nine plants
carried and expressed the GUS gene, while the otherthree plants did not (9:3 or
3:1 ratio), The T2(15.1-6) plants showed a24 or 1:2 ratio, but in the T2(17.1-15)
plants a homozygous phenotype apparently had been established, since all these
progeny carried the GUS gene and showed GUS activity in a pattern identical to
the parental plant.
4.3.2.5 Appearance of T2 Plants
Thirty{hree grains originating from three self-pollinated T1 plants (no. 11,
15 and 17) were successfullygerminated and grown into mature plants. Visually,
most of the T2 plants appeared normal, Compared with the T1 plants, the T2
plants showed improved vegetative growth (Figures 4.13 and 4.14). lt was noted
that the height of several T2 plants reached 70 cm and the length of head reached
6 cm. These characteristics were better than those for T1 plants where the tallest
plant was 48 cm and the size of heads was around 3-4 cm. As observed for the
T1 plants, several T2 plants produced low yields of grain, both in transgenic
progeny and non-transgenic segregants. lt was also noticed that grains produced
by transgenic progeny and non-transgenic segregants were lighter than control
plants (Table a.5).
4.3.3 Transgene inheritance in T3 plants
For the analysis of transgene inheritance in T3 plants, T3 grains derived
from T2 (17) plants were studied. This line appeared to be homozygous at the T2

A B80
70
Êæo
¿508¿oIË30GEN
10
0TO T1 T2
I7
6
5
4
3
2
1
0
Eott6o
o
boJ
TO T1 -12
300
250
200!
Ê 150
100
50
0
TO T1 T2
45
40
35
30
25
20
15
10
5
0
CD
E
.soog:.Eoìoo6ó
T1TO T2
Figure 4.13 Phenotypic character¡stics of transgenic plants (blue bars), non-
transgenic segregants (red bars), T1 andT2 population (green bars) and control
plants (yellow bars). (A) height of plant; (B) length of head; (C) yield (no. of
grains/plant) and (D) average weight per grain.


Figure 4.14 Mature, fertile transgenic wheat plants (cv. Frame)
representative ol T2 Progeny.

Table 4.5 Phenotypic characteristics and yield of T2 progeny ol cv. Frame
Plantcode
Height (cm)(averaoe)
Length ofheads (cm)
Yield (No. oforains/olant)
Average weightoer qrain lmo)
T2.1111.1*
11.2
11.3
11.4
11.5
11.6
11.7
11.8
11.9*
11.10
11.11
11.12*12.1515.1*
15.2
15.3*
15.4*
15.5
15.6*
T2.1717.1
17.2
17.3
17.4
17.5
17.6
17.7
17.8
17.9
17.10
17.11
17.12
17.13
17.14
17.15
Cont.1
Cont.2
Cont.3
20313
79
186
282130
166
183
25314
195
389
109
415
53
214210194
681
332205341
316
498
263601
226172
2653s1
109
215268154
247
301
53
27
55
44
42
44
44
53
50
29
59
70
49
77
46
61
60
65
45
51
43
34
38
41
40
41
36
32
48
41
45
47
48
65
75
77
4
3
5
4
4
4
4
5
4
3
4
6
4
6
4
4
4
5
6
6
5
5
6
6
5
6
5
4
5
5
5
5
5
5
7
I
33
33
41
41
33
40
29
35
34
44
36
40
30
36
36
35
34
35
33
29
34
41
42
43
39
39
38
26
33
30
32
39
35
38
44
44
Notes:Cont: Control plants* : Non-transgenic segregants confirmed by Southern blot hybridization.Grains produced by transgenic T1 progeny : 6,716. Average weight per grain of transgenic T1 progeny (mg) : 36.
Grains produced by non-transgenic segregants : 1 ,415. Average weight per grain of non-transgenic segregants (mg) : 35.
Average yield of control plants : 234. Average weight per grain of control plants (mg) : a2.
Chapter Four 96
stage. Six grains, each originating from self-pollinated T2 plants numbers 17'1
and 17.S, were selected and germinated in vermiculite for two weeks. Young
seedlings were subsequently transferred to soil and grown to maturity in the
glasshouse. Prior to transferring to soil, two root tips from each plant were cut and
stained in X-gluc solution in order to test for GUS expression in the roots.
4.3.3.1 PAT assay
A PAT assay was pedormed on the 12 T3 plants. PAT activity was
detectable in all plants (Figure 4.15 and summarized in Table 4.6), but for at least
two of the 12 plants, activity was low.
4.3.3.2 Response to the herbicide leaf'dip test
Two leaf tips f rom the T3 plants were dipped into O.O1% Basta@. Ten of the
12 T3 plants were tolerant to herbicide, while the other two plants were sensitive.
The herbicide sensitive plants and control plants showed necrosis within seven
days after herbicide application (Figure 4.164). The results from the herbicide leaf
dip test on T3 plants are summarized in Table 4.6.
4.3.3.3 GUS staining
Histochemical GUS staining in T3 plants was also carried out for roots,
leaves, ovaries, anthers and grains. The patterns of GUS activity in T3 plants
were in most cases similar to the T1 and T2 plants in which no GUS activity could
be detected in the roots, low GUS activity was found in the leaves and high GUS
activity was obserued in anthers, ovaries and grains (Figures 4,168-D). lt was

AcetylatedPPT + v v,v
1
v
tt345
vf:?Itw?
¡vl
2 6 7 8 9 10 11 l^zBl+CcWc
T3(17.1) T3(17.s)
Figure 4.15 PAT assay of T3 progeny. PAT activity in leaf extracts of T3 progeny
(derived from T2 plants no. 17.1 and 17.5) and a control plant. The position of
acetylated phosphinothricin is indicated by an arrow. Abbreviations: Bl: blank
sample; Wc: wheat negative control; +Cc: callus line positive control (provided by
Mr. R. Singh).

Table 4.6 The presence and expression of the bar and GUS transgenes in T3
(17.1 and 17.5) progeny ol cv. Frame
Plantcode
PAT assay Leaf dip test Southern blotfor Basta@resistance Baf GUS
GUS staining
Leaf Anthers
T3(17.1)
17.1.1
17.1.2
17.1.3
17.1.4
17.1.5
17.1.6
+
+
+
(+)
(+)
+
+
+
+
+
+
+
+
+
+
+
+
+
+
+
+
+
+
+
+
+
+
+++
+++
+++
++
+++
++
+++
+++
+++
+++
++
+++
+
T3(17.5)
17.5.7
17.5.8
17.5.9
17.5.10
17.5.11
17.5.12
+
+
+
+
+
+
+
+
+
+
+
+
+
+
+
+
+
+
+
+
+
+
+
+
+
+
+
+
Note:+ : shows positive result for the presence or expression of transgenes.- : shows negative result for the presence or expression of transgenes.. : hybridizing bands of the bar (1 band) and the GUS (3 bands) genes were similar inT2 (17.1
and 17.5) plants and its progeny (T3 [17.1.1-6 and 17.5.7-12]).
O : plants showing low PAT activity.

B
e
I2
\
D
loa
\ ì\
-\llt
c
t
oa ¡
D
** Ia?
I
t

Figure 4.16 Analysis of transgene activity in T3 progeny. (A) leaf dip test
shows herbicide resistance at 0.01% Basta@ solution in leaves of transgenic (right)
and necrosis in leaves of control (left) plants; (B) GUS activity in anthers; (C) in
ovaries of transgenic (right) and control (left) plants; and (D) in grains of transgenic
(right) and control (left) plants.

Chapter Four 97
found that all the T3 plants showed GUS activity in their anthers and the levels
ranged from medium (++) to high (+++) (Table 4.6).
4.3.3.4 Southern blot analYsis
The presence of lhe bar and the GUS genes in the T3 generation was
confirmed by Southern blot analysis, As for T1 and T2 plants, genomic DNA
isolated from the 12Tg plants was digested with Hindlll. All the T3 plants showed
hybridization with lhe bar and GUS probes, indicating the presence of the bar and
the GUS genes in the genome of these plants. These plants carried a single bar
gene (approx. 3.4 Kb) and three "copies" of the GUS gene (approx. 6.0, 7.9 and
9.0 Kb), as identified in plant T1 no. 17 and T2 plants no. 17.1 and 17.5 (Figures
4.17A-B). As shown in Figure 4.17A, all plants had extra faint bands for the bar
gene, and these extra bands were also observed in the primary transformant and
T2 progeny.
Since all T3 plants analysed here possessed the same apparent copy
numbers for both the GUS and the bar genes as the parental plants (T1 no. 17;
T2 no. 17.1 and 17.5), it was concluded that this line was homozygous for the
transgenes.
Results from the molecular analysis were subsequently compared with the
results from histochemical GUS staining, the PAT assay and leaf dip tests. lt was
found that the results from the molecular analysis matched those from
histochemical GUS staining, since all plants carried and stably expressed the
GUS gene. However, although the results from the molecular analysis of lhe bar
gene matched those from the PAT assay, some of the plants showed very low
PAT activity and reduced tolerance to herbicide application (Table 4.6).

A T3 plant No.17.1+ <- 17.5+
1 2 3 4 5 6 7 I 9101112C
T3 plant No..F- 17.1+ F17.5+12 3 4 5 6 7I910'11 12C
+
+
bar probe
GUS probe
Kb
3.4+
Kb9.0 +7.9 +6.0 +
+
+
B

Figure 4.17 Southern blot analysis of T3 progeny. Genomic DNA isolated
from T3 plants (derived from T2 plants no. 17.1 and 17.5) was digested with
Hindlll. The digested DNA was hybridized with (A) bar probe, showing an intense
hybridizing band (approx. 3.4 Kb) with several additional faint bands (indicated by
red arrows); and (B) GUS probe, showing multiple bands (3 bands as obserued for
the parental T1 plant no. 17 and T2 plants no. 17.1 and 17.5). Abbreviations: C:
wheat control; T3: third transgenic wheat generation; Kb: kilobase.

Four 98
4.3.3.5 Appearance of T3 Plants
All grains (12 grains) originating f rom self-pollinated T2 plants (no. 17.1 and
17.S) grew into mature plants. Visually, the majority of the T3 plants grew
healthily (Figure 4.18). lt was noticed that the vegetative growth of the T3 plants
was in most cases similar to the T2 plants, The incidence of low fertility (low yield)
was found in only one of the T3 plants (Table 4.7). Compared with control plants,
the transgenic progeny showed retarded growth, lower yields and lighter grains.
phenotypic characteristics of the T3 plants and control plants are shown in Figure
4.19.

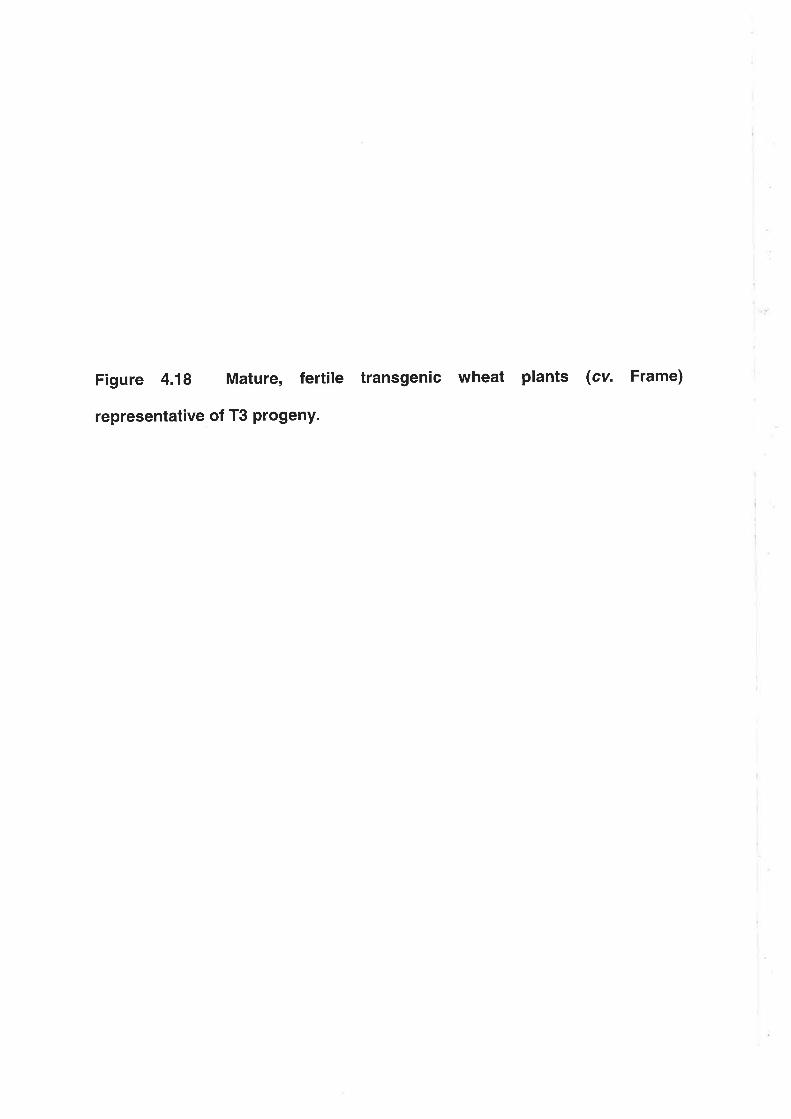
Figure 4.18 Mature, fertile transgenic wheat plants (cv. Frame)
representative of T3 Progeny.

Table 4.7 Phenotypic characteristics and yield of T3 progeny ol cv. Frame
Plantcode
Height (cm)(average)
Length ofheads (cm)
Yield (No. ofgrains/plant)
Average weightper grain (mg)
T3.17.1
1
2
3
4
5
6
T3.17.5
7
8
9
10
11
12
Cont. 1
Cont.2
Cont.3
58
49
51
42
50
49
4
4
4
4
4
4
4
4
4
3
4
4
7
I8
327
171
156
147
310
246
37
31
31
30
32
34
30
32
31
24
35
30
43
44
40
48
42
51
27
47
54
70
74
72
339
211
200
23
218
244
251
273
302
Notes:Cont:control plants.Total grains produced by T3 progeny:2,592.Average weight per grain of T3 progeny (mg) : 31.
Average yield of control plants : 275.Average weight per grain of control plants (mg) : 42.

80
70
ÊooI¡503¿o¡Ë30.9 ^-L¿U
10
0TO T1 T2 T3
A B
Dc
Figure 4.19 Phenotypic characteristics of transgenic plants (blue bars), T1, T2
and T3 population (green bars) and cgntrol plants (yellow bars). (A) height of
plant; (B) length of head; (C) yield (no. of grains/plant) and (D) average weight
per grain.
,90
Et
!6dO!¡J
o4Eooc32
1
0TO T1 T2 T3
300
250
200
150
'100
50
0
!ot
TO T1 T2 T3
45
40
35
30
25
20
15't0
5
0
oE
.=EBoeE.9o¡ooEo
TO T1 T2 T3

Chapter Four 99
4.4 Discussion
The integration and expression of the bar and the GUS genes in the W2
primary transformant (T0 plant) have been described in Chapter 3. ln the present
Chapter, it is demonstrated that the transgenes were both inherited and in most
cases expressed in successive generations up to and including the T3 generation.
The presence of lhe bar gene in T1 plants was confirmed by Southern blot
hybridization. From 17 T1 plants analysed, 15 plants carried lhe bar gene
(Figures 4.4A,4,54 and 4.6A). Only one hybridizing band was found Íorlhe bar
gene in digests of all restriction enzymes used, although in subsequent analysis of
T2 and T3 plants, several additional weak bands were also detected (Figures
4.4A,4.54 and 4.64). The weak bands could be due to integration of a truncated
fragment of the bar gene, or to incomplete DNA digestion. The presence of the
bar gene in T1 plants implies that the bar gene earlier identified in the primary
transformant (T0) was transmitted to T1 plants.
The 15 plants carrying lhe bar gene also had the GUS gene, whilst the two
plants which were negative for the bar gene did not have the GUS gene (Figures
4.48, 4.58 and 4.68). Based on Southern blot analysis, it appears that the
introduced GUS genes have been incorporated as multiple copies. This is
indicated by the presence of multiple hybridizing bands (2-4 bands) of the GUS
gene in Hrndlll digests and at least two different fragments in EcoRl digests
(Figures 4.48, 4.58 and 4.68). However, a single band of predicted size,
corresponding to the coding region the GUS gene, was found in BamHl+Ssfl
digests, together with one extra, anomalous band (Figure 4.58). The extra band
could again result from partial hydrolysis of plant DNA. The GUS gene copies
appear to occupy different sites in the genome, as indicated by the presence of

Chapter Four 100
two hybridizing bands in Ncol digests (Figure 4,58, see plants T1 17 and
T2117.3,4,71).
Based on all molecular analyses presented here, it is clear that the
transgenes integrated into the genome of the primary transformant (W2 plant)
were transmitted to the T1 progeny. Since only a small number of plants were
analysed during this study, it is difficult to deduce with surety the transgene
inheritance pattern. With the availability of data collected in analysing T1 plants, it
appeared that the transmission of transgenes from the primary transformant to T1
plants showed a Mendelian pattern fortwo unlinked inseftions, e.g,a 15:1 ratio,
which was close to the 15:2 ratio found here (Table 4.4). However, such a
segregation pattern failed to explain the absence of segregants carrying one of
the transgenes, especially the GUS gene.
Another possible pattern of transgene inheritance which would fit the
segregation ratio found here was a Mendelian pattern for a single insertion, e.g a
3:1 ratio, which is still comparable to a segregation ratio of 15:2 (15:2 or 7.5:1 with
X2 = 1.59; 0.2<P< 0,3, Appendix 4). Based on this segregation pattern, it is
possible that the bar and the GUS transgenes were integrated into the same
region of one chromosome, and as a consequnce the inheritance of the
transgenes behaved as a single dominant trait (heterozygous genotype) (Figure
4.20). This possibility was subsequently strengthened by the obseruation that the
transmission of transgenes from T1 to T2 plants, in this case from T1(11) to T2
(11.1-12), showed and fitted the expected Mendelian ratio of 3:1 (Table a.a). lt
was noted that the nine T2 (11.1-12) plants carried lhe bar gene and multiple
hybridizing bands (2-4 bands with sizes of approx.6.0,7.9,9.0 and >12.0 Kb) of
the GUSgene, as had been seen in theTl plants (Figures 4.4A'B'4.5A-B,4.64-

Model of transgene integration
A DB
>12.0 Kb --)9.0 Kb+
3.4 Kb --+
€ 6.0 Kb+ 7.9 Kb
u+w+yu+w+zu+x+yu+x+zv+w+yv+w+zv+X+yv+x+z
u
Gamete cell
+X
u+w+yu+w+zu+x+yu+x+zv+w+yV+W+Zv+X+yv+x+z
Notes:u : chromosome carrying the bar (3.4
Kb) and GUS (7.9, 6.0, 9.0 with orwithout >12.0 Kb fragments) genes.v, w, x, y, z : chromosomes carryingno transgene.
Gamete cellcombination
u+w+y u+w+z u+x+y u+x+z v+w+y v+w+z v+x+y v+x+z
u+w+yu+w+yu+w+y
u+w+zu+w+y
u+x+yu+w+y
u+x+zu+w+y
v+w+yu+w+y
v+w+zu+w+y
v+x+yu+w+V
v+x+zu+w+y
u+w+z u+w+yu+w+z
u+w+zu+w+z
u+x+yu+w+z
u+x+zu+w+z
v+w+yu+w+z
v+w+zu+w+z
v+x+yu+w+z
v+x+zu+w+z
u+x+yu+w+yu+x+y
u+w+zu+x+y
u+x+yu+x+y
u+x+zu+x+y
v+w+yu+x+y
v+w+zu+x+y
v+x+yu+x+y
v+x+zu+x+y
u+x+zu+w+yu+x+z
u+w+zu+x+z
u+x+yu+x+z
u+x+zu+x+z
v+w+yu+x+z
v+w+zu+x+z
v+x+yu+x+z
v+x+zu+x+z
v+w+yu+w+yv+w+y
u+w+zv+w+y
u+x+yv+w+y
u+x+zv+w+y
v+w+yv+w+y
v+w+zv+w+V
v+x+yv+w+y
v+x+zv+w+y
v+w+zu+w+yv+w+z
u+w+zv+w+z
u+X+yv+w+z
u+x+zv+w+z
v+w+yv+w+z
v+w+zv+w+z
v+x+yv+w+z
v+x+zv+w+z
v+x+yu+w+yv+x+y
u+w+zv+x+y
u+x+yv+x+y
u+x+zv+x+y
v+w+yv+x+y
v+w+zv+x+y
v+x+yv+x+y
v+x+zv+x+y
v+x+zu+w+yv+x+z
u+w+zv+x+z
u+x+yv+x+z
u+x+zv+x+z
v+w+yv+x+z
v+w+zv+x+z
v+x+yv+x+z
v+x+zv+x+z

Figure 4.20 The proposed model of GUS and bar transgene integration into the
genome of transformed wheat. Three copies (indicated by blue bars with sizes of
7.g, 6.0 and 9.0 Kb) or four copies (the three blue bars and one pink bar with sizes
of >12.0 Kb) of the GUS gene and a single copy of lhe bar gene (3.4 Kb) were
integrated into the same chromosome ("u"). According to this model, the pattern
of transgene segregation is 3:1, and the chance of producing a homozygous
genotype is 25o/o, a heterozygous genotype is 50%, and the chance of a non-
transgenic segregant is 25'/". In addition, it is unlikely that plants carrying either
the GUS or the bar gene would be produced, because the GUS and bar genes sit
in the same chromosome. Notes: A, B and D represent the three wheat genomes.
Blue bars and a pink bar across chromosome "u" represent the copy numbers of
the GUS gene and the red bar represent lhe bar gene which integrates into the
genome. The positions of coloured bars indicate copies of the transgenes, but
does not represent the actual integration distance in the plant genome.

Table 4.8 Comparison of expected and obserued numbers of plant progeny
carrying lhe bar and GUS transgenes
Segregationpossibilities(size of GUS
fragments, Kb)
Expectednumber in 64possibilities(Figure 4.21)
Expectedpercentage
(/.)
T1 r2(11)
Observednumber(n= 17)
Observedpercentage
(%)
Observednumber(n= 12)
Observedpercentage
(v.)
bar+ GUS
None(no barand
no GUS)
48
16
75
25
15
2
88
12
I
3
75
25
Total 64 100 17 100 '12 100
Ratio(lbar+GUS)
None)3:1
7.5i1(showinga3:l ratio;
12= 1,59; 0.2<P<O'3)3:1

O¡
I
B and 4.11A-B). ln this analysis, several extra bands of the bargenefrag
could be detected (Figure 4.114). The presence of additional bands here is not
surprising because these had also been observed in analysing the primary
transformant (Figure 3.68). These bands could have resulted from the integration
of fragments of the original pDM302 vector, from the rearrangement oÍ lhe bar
genes in the plant genome, or from partial hydrolysis of the plant DNA prior to
Southern hybridization analysis.
Although the appearance of some of the GUS hybridizing bands could be
formally attributed to incomplete DNA digestion prior to Southern hybridization
analysis, it should be emphasized that multiple banding during hybridization with
the bar gene probe was minimal, Thus, DNA digestion appeared complete for the
bar gene analysis. lt should be noted that in these experiments, the Southern
analysis was initially performed with the GUS gene, after which the same
membrane was stripped and re-probed with the bar gene.
Segregation of transgenes was also found in the progeny of T2 plants
derived from T1 plant no. 15. Of six plants analysed, only two carried the
transgenes, in a 1:2 ralio. Again, the anomalous ratio of inherited transgenes
(1:2) might result from the small number of plants analysed, Both the bar gene
and the two hybridizing bands of the GUS genes identified in the parental plant
(T1 plant no. 15) were inherited by the two T2 plants (no. 15.2 and 15.5) (Figures
4.54-8 and 4.11A-B).
Unlike the pattern of transgenes observed in T2(1 1) and T2(15) progeny, all
progeny (15 plants) of T2(17) analysed carried lhe bar gene and three hybridizing
bands of the GUS gene, exactly as obserued in the T1 parent (Figures 4.54-8 and
4.12A-B). This suggests that T1 plant no. 17 is homozygous for the transgenes.

Chapter Four 102
To confirm this hypothesis, analysis was extended to the T3 progeny derived from
this line. Again, all T3 progeny (12 plants) tested carried lhe bar and three
hybridizing bands of the GUS gene, as identified in both the T1 and T2 parental
generations (Figures 4.5A-8, 4.12A'B and 4.17A-B). The occurrence of a
homozygous genotype, in this case in the T1 (17) plant and its progeny, was not
surprising because it could be explained by simple segregation of a multiple
inseftion in one region of a single chromosome, which behaves similarly to a
Mendelian inheritance for a single inseftion, by self-pollination of transgenic plants
(w2).
To illustrate potential integration sites of the transgenes, a model of initial
transgene insertion is proposed (Figure 4.20). As identified from Southern blot
hybridization, three (7.9, 6.0 and 9.0 Kb f ragments) or four (7.9, 6.0, 9.0 and >12.0
Kb f ragments) "copies" of the GUS gene and a single "copy" of the bar gene (3.4
Kb fragment) were possibly integrated into the same region of a single
chromosome. lf only three copies of the GUS gene copies had been integrated,
the transgenic progeny plants should regularly have three hybridizing bands.
Thus, to explain the presence of some plants showing two or four hybridizing
bands, it can be postulated that there may be incomplete DNA digestion in some
cases. When genomic DNA was completely digested, three hybridizing bands
(6.0,7.9 and 9.0 Kb) would occur(Figure 4.12F- as an example). However, if the
genomic DNA was not completely digested, four bands (6.0,7.9,9.0 and >12.0
Kb) are possible. The 7.9 Kb GUS gene (Figure 4.118) was obserued in all
transgenic progeny, and this may indicate that this copy was digested more readily
than the others. The 6.0 and 9.0 Kb copies of the GUS gene, however, might be
digestion products of a larger, incompletely digested fragment (>12.0 Kb).

Chapter Four 103
Therefore, complete digestion would give three bands and incomplete digestion
could result in two or four bands, depending on whether the larger fragment was
undigested (two bands) or partially digested (four bands). However, banding
patterns of the bar gene suggested that digestion was complete'
lf the GUS gene were integrated as four "copies", the possible outcomes
are as follows. The four copies of the GUS gene were located in the same
chromosome, but in three different sites (designated sites 1, 2 and 3). lt is
suggested that the 7.9 Kb GUS gene was integrated close to the single copy of
the bar gene (3.4 Kb) in one site (site 1), whilst the other three GUS gene copies
were integrated into two other sites. lt is proposed that the 6.0 and 9.0 Kb GUS
gene "copies" were integrated close together in one site (site 2), while the larger
fragment (>12.O Kb) was integrated in another site (site 3) (Figure 4.20). lt
appeared that the site where the 7.9 Kb GUS gene fragment and the bar gene
were integrated (site 1) was stably inherited. lt could be that this site was close to
centromere and that low frequencies of recombination were therefore expected.
However, the sites carrying the 6.0 and 9.0 Kb GUS gene "copies" (site 2) and the
largerfragment (>12.0 Kb) (site 3) were not stably inherited. This might indicate
that these two sites are far from the centromere and, as a result, the sites could
undergo recombination during meiosis, and one of the two sites (site 2 [6.0 and
9.0 Kbl or site 3 [>12.0 Kb]) might have been deleted. Deletion of transgenes has
also been reported in other transgenic plants (Spencer et al., 1992; Srivastava ef
a/., 1996). ln the current situation, the various possibilities of GUS gene copies
obserued in transgenic progeny would be four copies (all three sites present),
three copies (sites 1 and 2 present) and two copies (sites 1 and 3 present).

Chapter Four 104
Following transgene integration and segregation as proposed in this model
(Figure 4.20), a single copy of the bargene and multiple copies of the GUS gene
occupied the same chromosome. In such situation, where lhe bar and GUS
transgenes were integrated close to each other in one chromosome, it is unlikely
that plants carrying one of the integrated transgenes (bar or GUS) would be
produced (as opposed to two unlinked insertions). With this model (Figure 4.20),
in which multiple copies of the transgene(s) were integrated into one chromosome
of a heterozygous genotype, the segregation of transgenes in the progeny would
be expected to show a Mendelian inheritance pattern, namely a 3:1 segregation
ratio. ln this model, a homozygous genotype for transgenes would be expected in
25% ol progeny, heterozygous genotypes in 50% of progeny and a recessive
genotype in 25./". Overall, the ratio of plants expected to carry and not to carry
transgenes would be 3:1 (Table 4.8). The results observed here are similar to
those reported by other research groups (Fromm et a1.,1990; Barcelo et a1.,1994;
Becker et al., 1994; Nehra et al., 1994; Somers, et al., 1994).
The expression of the GUS and bar transgenes in each generation was
also investigated. Based on histochemical GUS staining results, it was found that
GUS was functionally expressed in all plants carrying the GUS gene. GUS
expression could be easily identified in spikelets, anthers, ovaries, grains and, in
some cases, in leaves (Figures 4.3,4.10 and 4.16). ln general, the GUS gene
was inherited and expressed in a Mendelian pattern, as found in the T1 (15',2 or
7.5:1 ratio with X2 = 1.59; 0.2<P< 0.3, Appendix 4) and the T2(11) (3:1 ratio)
plants (Table 4.4). The segregation of transgenes in the progeny of T2(15),
however, did not showed a 3:1 ratio, probably because of the small number of
plants examined. As predicted from their homozygous genotype, all T2 and T3

ChapterFour 105
plants derived from T1(17) showed GUS express¡on. The results are all in
agreement with previous studies (Vasil et a1.,1993; Lörz et a/., 1998), which repoft
that the segregation of transgenes in the progeny of transformed wheat follows a
Mendelian inheritance pattern (as obserued here in T1 plants and T2[11]
progeny), and the occurrence of a homozygous phenotype for the transgenes (as
obserued in the progeny oÍ T2l17l and T3[17.1 and 17.5]) in transgenic wheat
generations.
Unlike the expression of the GUS gene, it seems that the expression of the
bar gene has been silenced in some plants. This is indicated by the lack of PAT
activity and herbicide tolerance, as identified in a number of T1, T2 and T3 plants
(Tables 4.2, 4.4 and 4.6), A similar obseruation has been found by several
research groups who reported the loss of expression of the bar gene but stable
expression of the GUS gene over successive generations of transgenic wheat
(Kluth et al., 1998; Lörz et a/., 1998). ln otherwork, however, lhe bar gene was
found to be stably expressed in transgenic wheat (Witrzens et al., 1998). ln that
work, lhe bar gene was driven by the ubil promoter, whilsl lhe bar gene used
during this study was under the control of the rice Actinl promoter. However,
Kumpatla and Hall (1998) repofted that the bar gene, which was also driven by the
ubil promoter, did undergo inactivation in transgenic plants. Based on results
accumulated here and on other published repofts, it is clear that the cause of
transgene inactivation does not solely result from the different promoters used.
Results from the present study also showed that T1 plant no. 9, which did
not carry the bar gene, showed PAT activity (Figures 4.2,4.4A and 4.64). This
result was similar to those from the primary transformants, where a number of
plants showed PAT activity without lhe bar gene being present. As mentioned in
Chapter Four 106
Chapter B, such results could be attributed to problems that were exper¡enced with
the reliability of the PAT assay.
As mentioned above, the bar gene was apparently subjected to
inactivation, whilst the GUS gene was stably expressed in all generations. The
occurrence of transgene inactivation obserued here might be explained by the
methylation of the bar gene. lt has been reported that DNA methylation in plants
occurs at cytosine residues that are located within the target sequences CG and
CnG, where n can be any base (McElroy and Brettell, 1994; Meyer, 19951.
Within the two plasmids used in these experiments, the bar and the GUS genes
contain approx. 70"/" and 50% GC contents, respectively, so it is likely that the
incidence of potential methylation sites in the bargene sequences might be higher
than in the GUS gene. A number of other research groups has reported bar gene
methylation which resulted in its inactivation in transgenic wheat (Srivastava et al.,
1996; Karunaratne et al., 1996). Work by Kumpatla and Hall (1998) clearly
demonstrated that the incidence of bar gene inactivation in transgenic seedlings
solely resulted from methylation. ln that work, it was demonstrated that the
methylated bar gene could be re-activated by growing the transgenic seedlings on
a medium containing S-azacytidine. Re-activation of the bar gene in the
transgenic seedlings was indicated by resistance of the seedlings to herbicide
application.
The transgene inactivation might also be explained in terms of the number
of transgenes integrated into the plant genome. ln this case, the presence of
several GUS gene copies in the plant genome may help stabilize GUS expression
in successive generations because inactivation of one or more copies could be
compensated by expression of the other copies present. Several studies have

Chapter Four 107
been directed to a comparison of transgene expression in relation to transgene
copy number (Cooley et al., 1995; Srivastava et al., 1996). lt is generally
assumed that the presence of high numbers of transgene cop¡es in the plant
genome result in lower levels of expression. For instance, Hobbs et al. (1990)
found that transgene silencing frequently occured in plants having high copy
numbers of transgenes. ln contrast to such obseruations, transgene inactivation
also occurs in plants carrying a single copy of the transgene (Elmayan and
Vaucheret, 1996; Kohli etal., 1999). WorkbyKlein etal. (1989) andSpenceret
al. (1990) showed stable expression of transgenes in plants having high or low
copy numbers of the transgene. Therefore, the effects of transgene copy
numbers on transgene expression remain unclear,
The incidence of transgene inactivation could also result from the physical
location at which the GUS and the bar genes are integrated into the genome. In
this instance the GUS gene may have a more favorable location for expression
than the bar gene. Such "position effects" have been well-documented in the
literature. Work by Pedersen ef al. (1997) demonstrated that the majority of
transgenes introduced by microprojectile bombardment were integrated into distal
regions, which are the most decondensed pafts of chromosomes and contain the
bulk of actively transcribed genes. Transgenes integrated into actively transcribed
regions are often stably expressed, while those integrated into transcriptionally-
inactive regions or in highly condensed chromatin regions are often inactive (Pröls
and Meyer, 1992; Meyer et al., 1993; Stam et al., 1997).
Another possible explanation is trans inactivation (co-suppression) of
transgenes as described by Matzke et al. (1989). This may be related to the fact
that the two plasmids (pDM302 and pActl-D GUS) used in these experiments

ChapterFour 108
conta¡n the same promoter sequence (rice Actinl promoter). The presence of
homologous regions in the two plasmids may have an undesired effect on
transgene activity, which in this case leads to the loss of, or the decline in bar
gene expression in successive generations, possibly through recombination
events (Jorgensen, 1990; Matzke and Matzke, 1990; Meyer, 1995")'
The phenotypic characteristics and yields of transgenic wheat plants were
also monitored. The majority of T1 plants, both transgenic progeny and non-
transgenic segregants, showed poor vegetative growth and low yields, as
observed with the primary transformant W2 (T0 plant) (Figure 4.8 and Tables 3.5
and 4.3). Substantial improvements in the phenotypic characteristics and yields
were noted from the T1 to the T3 generations, but the appearance and yields of
the transgenic progeny (T1 to T3) were always poorer than control plants (Figure
4.19). lt was also noted that retarded growth and low yields were found not only in
the transgenic progeny, but also in non-transgenic segregants (see Tables 4.3,
4.5 and 4.7). lt is therefore likely that such effects were linked to the tissue culture
procedures. Somaclonal variation could adversely affect agronomic pedormance,
as could the transformation (bombardment and selection) procedures. Both
transgenic and non-transgenic segregants originated from a single primary
transformant (W2) which was regenerated from in vitro culture after the
transformation and tissue culture procedures, Results found here were similar to
work described by Bregitzer et al. (1998), who reported the occurrence of
retardation in plant growth and reduction in yield of transgenic barley progeny.
This research group emphasized the adverse effects of tissue culture and
transformation procedures on agronomic traits, rather than the presence of the
transgene itself. Based on results accumulated during this study and repofted

Chapter Four 109
elsewhere, it is obvious that the effects of somaclonal variation in transgenic
plants are mostly undesirable. One of the possible strategies to alleviate such
problems is to cross the transgenic plants with parental seed-grown plants, This
should remove any deleterious mutations resulting from the tissue culture and/or
transformation process.
Conclusions
All results accumulated during this study show that regeneration
procedures developed for elite Australian wheat genotypes can be incorporated
into a microprojectile bombardment-mediated transformation method, leading to
the production of transgenic wheat carrying both the bar and the GUS genes.
This is one of the first transgenic Australian wheat genotypes (cv. Frame) which
shows stable expression and inheritance of the GUS gene (Murray et al., 1998;
Witrzens et a1.,1998). Although a model has been presented to describe possible
transgene integration and inheritance patterns, the actual integration and
inheritance patterns of the transgenes, especially the GUS gene, in the primary
transformant and its progeny are still unclear. Therefore, it is necessary to
analyse more samples of transgenic progeny in more detail, before integration
and segregation patterns can be unequivocally described.

CHAPTER FIVE
SUMMARY AND FUTURE
DIRECTIONS

Chapter Five 111
5.1 Summary of exper¡ments described here
The main objective of work described in this thesis was to screen four
Australian wheat genotypes (Hartog, Frame, Krichauff and Janz) tor in vitro cullure
responsiveness, and to transform responsive genotypes with marker genes (bar
and GUS) using the microprojectile bombardment technique. ln early
experiments, these genotypes were cultured on MS basal medium (Murashige
and Skoog, 1962) containing different combinations and concentrations of 2,4-D
and benzylaminopurine.
Using immature scutella as starting material, three of the four genotypes
tested (cvs. Haftog, Frame and Krichauff) responded well in culture. Two
genotypes (cvs. Hartog and Krichauff) required 2 mg/ 2,4-D for embryogenic
callus induction while the third genotype (cv. Frame) required the addition of 0.1
mg/l benzylaminopurine as well, When cultured on the appropriate medium,
isolated scutella of Hartog, Frame and Krichauff produced embryogenic callus
capable of producing fertile plants,
ln the second part of the study, using the regeneration systems developed
for the three above-mentioned genotypes, a microprojectile bombardment strategy
was used to achieve genetic transformation of these varieties. lsolated scutella or
freshly isolated immature embryos were bombarded with a construct (pDM302)
carrying the selectable marker bar gene with or without another construct (pActl-D
GUS) containing the reporter GUS gene. Four transgenic plants (cv. Frame) were
produced from three separate experiments. The presence of transgenes in the
four transgenic wheat plants was confirmed by Southern blot analysis. Based on
the Southern blot analysis, the four transgenic plants each carried at least one
intact copy of the introduced transgenes. The introduced transgene(s) were

Chapter Five 't't2
expressed in the transgenic plants, as indicated by the presence of PAT activity,
herbicide tolerance and GUS activity in both vegetative and reproductive organs,
including leaves, spikelets, anthers and grains. The transformation frequency
achieved in this study was approximately 0.7o/", based on the number of explants
bombarded in three successful experiments, or approximately 0.03%, based on
the total number of explants bombarded during this study'
Toward the end of this study, the transmission and inheritance of the
introduced genes was demonstrated up to the T3 progeny derived from the plant
designated W2. A detailed analysis of progeny arising from the other 3 transgenic
plants was not performed in this study owing to time constraints. The incidence of
transgene inactivation was obserued for the bar gene in several transgenic
progeny, but this did not occur in the case of the GUS gene. The suppression or
inactivation of the GUS gene was not obserued, perhaps because the presence of
multiple gene copies ensured that at least one copy was always functional.
The primary transformants were healthy but not as robust as the seed
derived plants. However, subsequent generations showed a clear trend of
phenotypic improvement.

Chapter Five 1 13
5.2 Future directions
The application of transformation technology for wheat has widened during
the past decade, but still there is not a routine method available for the majority of
genotypes, There is no doubt that in some university laboratories like the
University of Florida or the University of Hamburg and in some industrial
laboratories such as Novaftis or Monsanto, wheat transformation using biolistics is
routinely achieving transformation frequencies of up lo 40"/" (Sparks et al., 1998;
Qureshi, personal communication). Such success gives these laboratories the
ability to transfe r an array of genes which may be either potential commercial
targets or used for functional analysis. Neveftheless, the varietal barrier is still
present and success in wheat transformation is not yet achievable across the
board. A case can be made that perhaps we do not need such an achievement in
order to move fonruard, since transformed model varieties can be used as donors
of newly introduced traits through backcrossing procedures. Perhaps a universal
system for transforming all wheat genotypes will never be found, but it is not
unreasonable to expand the technology to include as many elite varieties as
possible or to those model varieties which share close relationships with new
cultivars. The promise of biotechnology is in innovation and economy of time and
labor. Hence, prolonged breeding efforts (many back-cross cycles) to move newly
introduced characters from model varieties to elite varieties may render the
technology less attractive. Therefore, expanding the technology to elite material
remains important.

Chapter Five 114
5.2.1 Donor mater¡al health and transformation efficiency
As observed from the work described in this thesis, the response of
explants in culture appeared to be affected not only by plant genotypes and/or
type and concentration of growth regulators used, but also by the condition of
donor plants. Thus, one of the most impoftant considerations in the future is the
physiological condition of donor plants. lt is fully understood that the successful
outcome of transformation experiments is very much dependent upon the tissue
culture response of the targets and upon the selection process. Thus, attention
must be focused on these issues, Better donor plant management, careful tissue
culture manipulations and the use of culture-friendly selectable markers will
certainly help improve the overall efficiency of the method.
5.2.2 Transgene silencing
Transgene silencing is an important factor that adds to the unpredictability
of the continued expression of the trait for which the line was produced. For the
technology to be commercially viable, genetically modified lines must be stable
and dependable. ln the present study, the loss or silencing of the introduced bar
gene expression was discovered in some transgenic wheat progeny. As
illustrated in the literature, transgene silencing is a fairly common feature in
transgenic plants. The loss of transgene activity may be caused by integration of
transgenes into transcriptionally-inactive regions of the genome, by the insertion of
multiple copy numbers of the transgenes, or by methylation of the transgenes.
The microprojectile bombardment method is adirect and relatively primitive
method of gene delivery. Through this method genes are inse¡ted into the
genome randomly and generally in high copy numbers (multiple integration sites

Chapter Five 115
and multiple inseftions per site). Also the choice of vectors where sometimes two
genes are driven by the same promoter, can cause expression problems. To
alleviate such problem, it is necessary to develop transformation strategies which
could control the integration of transgenes into the plant genome. One approach
is the targeted integration system (Cre-lox integration system) (Bayley et al',
1992). The principle of this system is to target or to direct the integration of
transgenes into a specific site. This system is described briefly as follows.
lnitially, plants are transformed with a construct containing 355-lox'Cre.
Transgenic plants carrying such genes are subsequently re-transformed with a
plasmid carrying a promoterless /ox-hpf construct, where hpt encodes hygromycin
phosphotransferase. When lhe lox-hpf construct is present in the genomic DNA
of transgenic plants carrying the 35S-/ox- Cre and expressing the Cre enzyme, the
Cre enzyme will direct the insertion of lox-hpt into the genomic 359'lox'Cre site to
produce a 35S-/ox-hpt-lox-Cre linkage (Albert et al., 1995). In this system the
transgene, in this instance the hpt gene, is targeted to integrate into a specific
region (35S-/ox-Cre). Therefore, this system could avoid random and multiple
transgene integration,
Another choice is to replace microprojectile bombardment with
Agrobacterium-mediated transformation. Although this method is not yet readily
available for wheat, efforts to develop this method will pay dividends in the future.
The available evidence in the literature for Agrobacterrum-mediated
transformation of both dicots and monocots indicates that through this method
more simple events are produced, For registration purposes as well, in the future,
acceptance by consumers and regulatory bodies of transgenic crops generated

Chapter Five 116
through biolistics may prove more difficult that those generated through
Agrobacterium-based methods (Pawlowski and Somers, 1 996).
5.2.3 Tissue culture effects
It was obserued in this study that the transgenic plant (W2) and its progeny
exhibited poor agronomic characteristics and low yields compared with seed-
derived (control) plants. One of the possible causes of such problems is
somactonal variation (Bregitzer et â1., 1998). To minimise the effects of
somaclonal variation on transgenic plants, it may be necessary to reduce the
tissue culture phase or ideally, to entirely omit it. Some of the methods that can
avoid tissue culture phase include the pipetting of Agrobacterium onto
reproductive organs (Hess et al., 1990) and the application of Agrobacterium onlo
apical meristem tissues (Gould et a\.,1991; Zhang et a1.,1999).
Another approach which could alleviate the effects of tissue culture is to
backcross the transgenic plants with wild-type plants. The purpose of the crossing
is to exclude any aberrant chromosomes or deleterious mutations, which could
occur during tissue culture and/or transformation passage, from the genome of
transgenic plants (Brettell and Murray, 1995).
5.2.4 Analysis of transgene integration patterns
ln this study, it was shown that the bar and GUS transgenes had apparently
been integrated into a single and multiple copies, respectively. All lhe bar and the
GUS transgenes could have been integrated in one closely linked region as
indicated by the pattern of inheritance showing a Mendelian pattern for a single
inseftion site.
Chapter Five 117
To investigate the real copy numbers of the GUS gene, we could analyse
more plants grown from T1 , -f2, -fg and T4 grains. The grains used for analysis
should be mainly chosen from plants showing two (7.9 and >12.0 Kb fragments)
and four (6.0, 7.9, 9.0 and >12.0 Kb fragments) hybridizing bands. In pedorming
Southern blot analysis, it is important to guarantee that each sample of genomic
DNA derived from these plants can be digested properly, and for these, several
critical factors should be considered, including the purity of genomic DNA, the use
of newly purchased restriction enzymes, and the time for incubation. The
unequivocal determination of whether the plants have three or four GUS
hybridizing bands will enable more accurate models for integration and inheritance
of transgenes to be devised.
To determine the copy number of the GUS gene, crossing of wild-type
wheat plants and transgenic wheat plants showing the three banding patterns
namely plants having two (7.9 and >12.0 Kb fragments), three (6.0, 7.9 and 9.0 Kb
fragments) and four (6.0,7.9,9,0 and >12.0 Kb fragments) hybridizing bands,
could be performed. Genomic DNA from the progeny of the crossed plants would
be analysed using Southern blot hybridization. With such analyses, the copy
numbers of the GUS gene in each progeny could be determined. The results
could ultimately be used to trace the actual copy numbers of the GUS gene in the
genome of primary transformant (W2 plant).
Another approach is to map the location of the bar and the GUS genes.
This could be pedormed using fluorescence in sifu hybridization (FISH) (Pedersen
et a1.,1997). With this method, the integration of transgenes in the plant genome,
even in a single-copy insertions, can be localized. The mapping of transgenes
could also be done by inverse PCR (IPCR) where the known transgene sequence

Chapter Five 1 18
is used to design the primers. IPCR products can be sequenced and should
contain parts of the DNA flanking the inseftions. These can be compared w¡th
database sequences and any genes identified could subsequently be located on a
genetic map.
5.2.5 Field trials and evaluation of transgenic plant products
As demonstrated here, transgenic wheat plants carrying herbicide
resistance genes were successfully produced, Recently, the use of such genes
for producing transgenic plants has raised public concerns (Chèvre, et al., 1997;
Daniell, 1gg9). One of the concerns relates to the potential transfer of the
herbicide resistance genes to related plant species which might subsequently
become resistant to the herbicide. With the availability of a considerable number
of seeds collected during this study, field trials could be carried out to investigate
the lateral transfer of transgenes from transgenic plants to neighbouring plant
populations, These trials could also be used to study the effects of transgenes on
phenotypic characteristics of transgenic plants grown under field conditions.
Other concerns arising in the community are the unforeseen impact of
transgenic plant products on human and animal health (Kessler etal., 1992). To
overcome such concerns, long term studies must be undertaken to examine the
safety of foods and feeds made from transgenic plants. Such studies will play a
pivotal role in the public acceptance of this vital technology for human sustenance
in the future.

Chapter Five 119
5.2.6 Production of marker-free transgenic plants
With the increasing concerns relating to the presence of marker genes in
transgenic plants (Käppeli and Auberson, 1998), transformation strategies must
be in place to produce marker-free transgenics. One of the strategies is the use
of co-transformation where the marker and gene of interest are carried on
separate plasmids. lf the co-introduced DNAs integrate in different locations, they
would segregate independently in subsequent progeny, so that marker-free
transgenic plants could be selected by repeated backcrossing experiments (Yoder
and Goldsbrough, 1994). The success in using such strategy has been
demonstrated by Komari et al. (1996) and Daley et al. (1998). In this work, two
separate DNA fragments, one of which contains a selectable marker, were
introduced into the plant genome using Agrobacterium tumefaciens and resulted
in marker-free plants in the transgenic progeny. Using microprojectile
methodology for transformation, however, the co-transformed genes usually
integrate very close to each other and therefore create a potential problem for
segregation (Pawlowski and Somers, 1996).
A potentially useful approach is to make use of site-specific recombination
methods. The principle of these methods is as follows. Initially, plants are
transformed with a selectable marker and a gene of interest. The selectable
marker gene must be placed in a ceftain region, namely between two shot't,
specific DNA sequences (i.e. /ox), while the gene of interest is located outside this
region (or in another vector). When transgenic plants are produced, in this case
transgenic plants having lhe lox sequences, another gene (e.9. Cre) is introduced
into the /ox containing plants. lf the Cre gene can also integrate and express in
the transgenic plants, the Cre enzyme will catalyze recombination between two /ox
Chapter Five 120
sequences result¡ng in excision of internal sequences, in this case the selectable
marker. As a result, the selectable marker will be removed from genomic DNA
and eventually selectable marker-free transgenic plants will be produced (Russell
et a1.,1992).
Another system for eliminating marker genes from transgenic plants is by
per{orming transposition-based methods (Goldsbrough et al., 1993). ln this
system, plants are transformed using a construct (or constructs) containing a gene
of interest, the transposase gene (Ac element) and a marker gene which is placed
within the Ds elements. lf this construct(s) is integrated into the plant genome, the
transposase will activate the excision of the Ds elements, in this case the region
where the selectable marker sits. After excision, the Ds elements containing the
selectable marker will be moved and re-inserted into another site in the plant
genome. lf the marker gene integrates into a new region which has sufficient
genetic distance for recombination, this allows the segregation of marker gene
and gene of interest in subsequent generations, so that marker-free transgenic
progeny will be obtained, Fufthermore, when the Ds element containing the
selectable marker has been excised by transposase, but fails to reintegrate into
the plant genome (Belzile et a1.,1989), the selectable marker will be lost, and as a
result marker-free transgenic plants will be produced'
To avoid the difficulties associated with eliminating the selectable markers
from transgenic plants, 'positive selection'strategies (Joersbo and Okkels, 1996),
for example by the use of genes such as xylose isomerase (Haldrup et al., 1998)
and mannose-6-phosphate isomerase (Reed et a1.,1999) can be used, instead of
herbicide resistance or antibiotic resistance-based selection. The use of such
selection procedures precludes the use of selectable markers, so that these

Chapter Five 121
strateg¡es might be more acceptable and could tackle concerns relating to the
presence of marker genes in transgenic plants.
5.2.7 lnsertion of useful genes
ln this study, regeneration systems and bombardment procedures have
been successfully developed for an Australian wheat genotype, cv. Frame. With
the availability of these regeneration and transformation protocols, it is now
possible to introduce potentially useful genes into cv, Frame as the genotype of
choice. Examples of available genes include those encoding barley limit
dextrinase, limit dextrinase inhibitor, isoamylase, B-glucan synthases, (1+3)-B-
glucanase, (1+3, 1+a)-B-glucanase and thaumatin-like proteins. These genes
are now available in this laboratory (G,8. Fincher, personal communication).

APPENDICES

Appendices 123
Appendix 1 Recycled soil composition
One cubic metre of used experimental soil was steam sterilized at 100 oC
for 45 min, and cooled. Following this, 0,2 metre3 of Eurotod peatmoss, 1 kg
blood meal, 0.4 kg agricultural lime, 0.4 kg potassium sulphate and 0.2 kg
superphosphate were mixed with the soil. The soil was sieved through a 1 cm grid
size sieve. The pH of the soil was about 6.5'
Source : SARDI, Plant Growth Seruice section.

Appendices 124
Appendix 2 Culture media
INGR ENTS MS LI(ms/l) (ms/l)
MACROSALTSNH¿NOgKNOsKHzPO¿MoSO¿.7HzOCaClz.2HzO
MICROSALTSMnSO¿.4HzOHsBO¿ZnSO+.7HzOKINazMoO¿.2HzOCuSO¿.5HzOCoClz.6HzO
IRON SOLUTIONNa2EDTAFeSO¿.7HzO
VITAMINSAscorbic acidBiotinCa-panthothenateCholine chlorideFolic acidmvo-lnositolNicotinic acidp-Aminobenzo¡c acidPyridoxine-HClRiboflavinThiamine-HClGlvcine
AMINO ACIDSGlutamineL-ProlineAsparaqine
SUGARSucroseMaltose
OTHER2,4-DBAP
.25
.o25
.o25
1
570000
1
000
1
1
1
0.110
0.5
0.12
1 6501 900170370440
22.36.28.60.8o.250.0250.025
1000.5
30000
2*0.1"
7501 750200350450
3728
0.2100
750150100
50000
2
5.7
5
.5
.75
3727
38
00555
PH 5.7*: decided after preliminary experiment as described in Chapter 2 section 2.2.1.Sources : MS ; Murashige and Skoog media (Murashige and Skoog, 1962)
L1 i Lazzeri media (Lazzeri ef a/., 1991).

Appendices 125
Appendix 3 Horsham soil mix composition
composted pine bark is mixed with the following ferlilizers
Composted pine bark 600 litres
Osmocote (high P) 1.8 kg
Ammonium nitrate 0.135 kg
Micro max (micro-nutrients) 0.135 kg
lron sulphate O-27 kg
Agricultural lime 1'33 kg
The mix is not heat treated and the pH is about 6.0 - 6.5
Source : SARDI, Plant Growth Service section

Appendices 126
Appendix 4 Calculation of X2 on T1 plants (based on molecular analysis for both
lhe bar and the GUS genes, see Table 4.2)
GenotypeObseruednumber (O)
Expectednumber (E)
o-E (o-E)' (o-E)'z/E
barlGUS (+)
barlGUS (-)
Total
15
2
17
12.75
4.25
2.25
-2.25
0,00
5.0625
5.0625
0.40
1.19
1.59
X2 = 1.59 dF=1 o.2<P<0.3
Notes :
y2: Chi-square.dF : Degree of freedomP : Probability.

REFERENCES

References 128
Ahloowalia, B.S. 1982. Plant regeneration from callus culture in wheat. Crop
Science.,22: 405-410.
Ahloowalia, B.S. and Sherington, J. 1985. Transmission of somaclonal variation
in wheat. EuPhYtica, 34: 525-537.
Ahuja, p.S., pental, D. and Cocking, E.C. 1982. Plant regeneration from leaf base
callus and cell suspensions of Triticum aestivum. Z. Pflanzenzuchtg., S9:
139-144.
Albeft, H., Dale, E.C., Lee, E., Ow, D.W, 1995. Site-specific integration of DNA
into wild-type and mutant /ox sites placed in the plant genome, The Plant
J ou rnal, 7(a) : 649-659.
Altpeter, F., Vasil, V., Srivastava, V., Stoger, E. and Vasil, I'K. 1996. Accelerated
production of transgenic wheat (Triticum aestivum L.) plants. Plant Cell
Repofts,16: 12'17.
Alvarez, M.L., Guelman, S., Halford, N'G', Lustig, S., Reggiardo, M'l',
Ryabushkina, N., Shewry, P., Stein, J. and Vallejos, R,H. 2000. Silencing
of HMW glutenins in transgenic wheat expressing extra HMW subunits.
Theor. Appl. Genet., 1 00: 31 9-327.
Armstrong, T.A., Metz, S.G. and Mascia, P,N. 1987. Two regeneration systems
for the production of haploid plants from wheat anther culture. Plant
Science, 51: 231'237.
Barcelo, P., Hagel, C., Becker, D., Maftin, A, and Lörz, H. 1994. Transgenic
cereal (tritordeum) plants obtained at high frequency by microproiectile
bombardment of inflorescence tissue. The Plant Journal,5(4): 583-592.
Barcelo, P.,Lazzeri, P.4., Martin, A. and Lörz, H. 1991. Competence of cereal
leaf cells. l. Patterns of proliferation and regeneration capability tn vitro ol
the inflorescence sheat leaves of barley, wheat and tritordeum. Plant
Science,TT: 243'251 .
Barro, F., Rooke, L., Bekes, F., Gras, P., Tatham, 4.S., Fido, R', Lazzert, P.4.,
Shewry, P.R. and Barcelo, P. 1997. Transformation of wheat with high
molecular weight subunit genes results in improved functional properties.
Nature Biotechnol., 1 5: 1 295-1 299.

References 129
Baruah-Wolff, J., Hanruood, W.A., Lonsdale, D.4., Haruey, 4., Hull, R. and Snape,
J,W. 1ggg. Luciferase as a reporter gene fortransformation studies in rice
(Oriza sativaL.). Plant Cell Repotfs, 18: 715-720.
Bayley, c.c., Morgan, M., Dale, E.c. and ow, D.w. 1992. Exchange of gene
activity in transgenic plants catalyzed by the Cre-lox site-specific
recombination system. Plant Mol. Biol.,18(2): 353-361.
Becker, D., Brettschneider, R. and Lörz, H. 1994. Fertile transgenic wheat from
microprojectile bombarment of scutellar tissue. The Plant Journal, 5(2):
299-307.
Bekkaoui, F., Datla, R.S.S., Pilon, M., Tautorus, T.W., Crosby, W.L. and Dunstan,
D.l. 1ggo. The effects of promoter on transient express¡on in conifer cell
lines. Theor. Appl. Genet.,79: 353-359.
Belzile, F., Lassner, M.W., Tong, Y., Khush, R, and Yoder, J.l. 1989. Sexual
transmission of transposed Acfivator elements in transgenic tomatoes.
Genetics, 123: 181 -1 89.
Ben Amer, l.M. and Börner, A. 1997. The relationship between green spot
initiation and plantlet regeneration of wheat callus grown under shoft-term
conditions . Plant Cell, Tissue and Organ Culture, S0: 67-69'
Bevan, M.W., Flavell, R.B. and Chilton, M.D. 1983. A chimeric antibiotic
resistance marker gene as a selectable marker for plant cell transformation.
Nature,304: 1 84-187.
Bhaskaran, S. and Smith, R.H. 1988. Enhanced somatic embryogenesis in
Sorghum bicolortrom shoot tip culture. ln Vitro Cellular and Developmental
Biology,24: 65-70.
Bhaskaran, S. and Smith, R.H. 1989. Control of morphogenesis in sorghum by
2,4-dichlorophenoxyacetic acid and cytokinins. Annals of Botany,64: 217'
224.
Bhojwani, S,S. and Hayward, C. 1977. Some obseruations and comments on
tissue culture of wheat. Z. Pflanzenphysiol., 35: 341-347.
Blechl, A.E. and Anderson, O.D. 1996. Expression of a novel high-molecular-
weight glutenin subunit gene in transgenic wheat. Nature Biotechnol., 14:
875-879.

References 130
Bliffeld, M., Mundy, J., Potrykus, l. and Fütterer, J. 1999. Genetic engineering of
wheat for increased resistance to powdery mildew disease. Theor. Appl.
Genet.,98: 1079-1086.
Bohorova, N.E,, Van Ginkel, M., Rajaram, S. and Hoisington, D.A. 1995. Tissue
culture response of CIMMYT elite bread wheat cultivars and evaluation of
regenerated plants. Cereal Research Communications, 23(3): 243'249.
Bozorgipour, R, and Snape, J.W. 1997. An assessment of somaclonal variation
as a breeding tool for generating herbicide tolerant genotypes in wheat
(Triticum aestivum L.). Euphytica, 94: 335-340.
Bradford, M.M. 1976. A rapid and sensitive method for quantitation of microgram
quantities of protein utilizing the principle of protein dye binding. Anal'
Biochem. , 72: 248-254 .
Braun, H.-J., Payne, T.S., Morgounov,4.1., van Ginken, M. and Rajaram, S' 1998'
The challenge : one billion tons of wheat by 2020. Proc. of the 9th
international wheat genetics symposium, Saskatoon, Canada, p33-40.
Bregitzer, P., Halbeft, S.E. and Lemaux, P.G. 1998. Somaclonal variation in the
progeny of transgenic barley. Theor. Appl. Genet',96: 421'425.
Brettell, R.l.S. and Murray, F.R. 1995. DNA transfer and gene expression in
transgenic cereals. ln Biotechnology and genetic engineering reviews.
Tombs, M.P. (ed). lntercept, Andevor, 13: 315-334'
Brown, C., Brooks, F,J., Pearson, D. and Mathias, R.J. 1989. Control of
embryogenesis and organogenesis in immature wheat embryo callus using
increased medium osmolarity and abscisic acid. J. Plant Physiol., 133:
727-733.
Callis, J., Fromm, M. and Walbot, V. 1987. lntrons increase gene expression in
cultured maize cells. Genes and Development, 1 : 1 1 83-1200.
Cao, J., Duan, X., McElroy, D.and Wu, R. 1992. Regeneration of herbicide
resistant transgenic rice plants following microprojectile-mediated
transformation of suspension culture cells, Plant Cell RepoÍs, 11: 586-591 .
Carman, J.G,, Jefferson, N.E. and Campbell, W.F. 1987. lnduction of
embryogenic Triticum aestivum L. calli. L quantification of genotype and
culture medium effects. Plant Cell, Tissue and Organ Culture,l0: 101 -1 13.

References 131
Chan, M.T,, Chang, H.H., Ho, S'L., Tong, W'F' and Yu, S'M' 1993'
Agrobacterium mediated product¡on of transgenic rice plants expressing a
chimeric alpha-amylase promoter/beta-glucuronidase gene. Plant Mol.
Biol.,22:491-506.
Charest, P,J., Calero, N., Lachance, D., Datla, R.S.S., Duchesne, L.C' and Tsang,
E,W,T. 1g93. Microprojectile-DNA delivery in conifer species: factors
affecting assessment of transient gene expression using the B-
glucuronidase gene. Plant Cell Reporls, 12: 189-193'
Cheng, M., Fry, J,E., Pang, S., Zhou, H., Hironaka, C.M., Duncan, D'R', Corner,
T.W. and Wan, Y. 1997. Genetic transformation of wheat mediated by
Agrobacterium tumefaciens. Plant Physiol',1 15: 971 -980'
Chèvre, A.-M., Baranger, F.E.A. and Renard, M. 1997. Gene flow from transgenic
crops. Nature, 389: 924.
Chibbar, R.N., Baga, M., Caswell, K., Repellin, 4., Leung, N', Abdel Aal, E' and
Hucl, P. 1998. Genetic transformation strategies to alter starch structure in
wheat. Proc. of the gth international wheat genetics symposium,
Saskatoon, Canada, P167-170.
Chilton, M.D., Drummond, M.H., Merlo, D.J., Saiky, D., Montoya, A.L., Gordon,
M.P. and Nester, E.W. 1977. Stable incorporation of plasmid DNA into
higher plant cells; the molecular basis of crown gall tumorogenesis. Cell,
11:263-271.
Chin, J.C. and Scott, K.J. 1977. Studies on the formation of roots and shoots in
wheat callus cultures. Ann. Bot., 41: 473-481.
Christensen, A.H. and Quail, P.H. 1996, Ubiquitin promoter-based vectors for
high-level expression of selectable and/or screenable marker genes in
monocotyledonous plants. Transgenic Research, 5: 213-218.
Christensen, 4.H., Sharrock, R.A. and Quail, P.H. 1992. Maize polyubiquitin
genes: structure, thermal perturbation of expression and transcript splicing,
and promoter activity following transfer to protoplasts by electroporation.
Plant MoL Biol.,18(3): 675-689,
Christou, P. 1990. Soybean transformation by electric discharge particle
acceleration. Physiol. Plantarum, 794; 210-212.

References '132
Christou, P. 1gg2. Genetic transformation of crop plants using microprojectile
bombardm enl. The Plant Journal,2(3): 275-281 .
Close, K.R., and Ludeman, L.A.G. 1989. Structure-activity relationships of auxin-
like plant growth regulators and genetic influences on the culture induction
response in maize (Zea maysL.). Plant science,6l:245-252.
Collins, G.8., Vian, W.E. and Phillips, G.C. 1978. Use of 4-amino-3,5,6-
trichloropicolinic acid as an auxin source in plant tissue cultures. Crop
Science.,18: 286-288.
Cooley, J., Ford, T. and Christou, P. 1995. Molecular and genetic characterization
of elite transgenic rice plants produced by electric-discharge particle
acceleration. Theor. Appl. Genet',90: 97-104.
Cornell, H.J. and Hoveling, A.W. 1998. Wheat: chemistry and utilization.
Technomic Publishing Co. lnc., Lancaster, pp.426.
Daley, M., Knauf, V.C., Summedelt, K.R. and Turner, J.F. 1998. Co-
transformation with one Agrobacterium tumefaciens strain containing two
binary plasmids as a method for producing marker-free transgenic plants.
Plant Cell Repofts, 17:489-496.
Daniell, H. 1999. GM crops: public perception and scientific solutions. Trends in
Plant Scíence, a(2): 467 -469.
De Block, M. 1993. The cell biology of plant transformation: current state,
problems, prospects and the implications for the plant breeding. Euphytica,
71:1-14.
De Block, M., Botterman, J., Vandewiele, M., Dockx, J', Thoef,, C., Gossele, V.,
Mowa, N,R., Thompson, C., van Montagu, M. and Leemans, J. 1987.
Engineering herbicide resistance in plants by expression of a detoxifying
enzyme. The Embo Journal,6(9): 2513-2518.
De Block, M., Debrouwer, D. and Moens, T. 1997. The development of a nuclear
male sterility system in wheat. Expression of the barnase gene under the
control of tapetum specific promoters . Theor. Appl. Genet.,95: 125-131 .
De Buyser, J., Marcotte, J.L. and Henry, Y. 1992. Genetic analysis ol in vitro
wheat somatic embryogenesis. Euphytica, 63: 265'270.

Beferences 133
Demeke, T., Hucl, P., Baga, M., Caswell, K., Leung, N. and Chibbar, R'N. 1998'
Transgene stability and inheritance in spring wheat, Proc. of the 9th
international wheat genetics symposium, Saskatoon, Canada' p1 03-1 06'
D'Halluin, K., Bonne, E,, Bossut, M., De Beuckeleer, M. and Leemans, J. 1992.
Transgenic maize plants by tissue electroporation. The Plant CelL4:1495-
1 505.
Dobrzañskâ, M., Krysiak, c. and Kraszewska, E. 1997. Transient and stable
transformation of wheat with DNA preparat¡ons delivered by a biolistic
method, Acta Physiologiae Plantarum, 19(3): 277-284.
Dodds, J.H. and Robefts, L.W. 1995. Experiments in plant tissue culture.
Cambridge University Press, New york, pp.256.
Dudits, D., Nemet, G. and Haydu, Z. 1975. Study of callus growth and organ
formation in wheat (Triticum aestivum) tissue cultures. Can. J. Bot, 53:
957-963.
Duncan, D.R., Williams, M.E., Zehr, B.E. and widholm, J.M. 1985. The
production of callus capable of plant regeneration from immature embryos
of numerous Zea mays genotypes. Planta,165:322'332.
Eapen, S. and Rao, P.S. 1982. Plant regeneration from callus cultures of durum
and emmer wheat. Plant Cell Repot?s, 1: 215'218.
Ekiz, H. and Konzak, C.F. 1997. Effects of light regimes on anther culture
response in bread wheat. Plant Cell, Tissue and Organ Culture, 50:7'12.
Elena, E.B. and Ginzo, H,D. 1988. Effect of auxin levels on shootformation with
different embryo tissues from a cultivar and a commercial hybrid of wheat
(Triticum aestivum L.). J. Plant Physiol.,132: 600-603.
Elliott, 4.R., Campbell, J.4., Dugdale, 8., Brettell, R.l.S. and Grof, C.P.L. 1999.
Green-fluorescent protein facilitates rapid in vivo detection of genetically
transformed plant cells. Plant Cell Repods, 18: 707-714.
Ellis, J.G., Llewellyn, D.J., Dennis, E.S. and Peacock, W.J, 1987. Maize Adh-1
promoter sequences control anaerobic regulation: addition of upstream
promoter elements from constitutive genes is necessary for expression in
tobacco. The EMBO Journal.,6(1): 1 1 -16.

References 134
Elmayan, T. and Vaucheret, H. 1996. Expression of single cop¡es of a strongly
expressed 35S transgene can be silenced post-transcriptionally. The Plant
Jou rnal, 9(6): 7 87 -7 97 .
Fatokun, C.A, and Yamada, Y. 1984. Variations in callus formation and plant
regeneration in African rice (Oryza gtaberrima Steud.), J. Plant Physiol.,
117: 179-1 83.
Fellers, J.P., Guenzi, A.C. and Taliaferro, C.M. 1995. Factors affecting the
establishment and maintenance of embryogenic callus and suspension
cultures of wheat (Triticum aestivumL.). Plant Cell Reporfs, 15: 232-237 '
Felsenburg, T., Feldman, M. and Galun, E. 1987. Aneuploid and alloplasmic lines
as tools for the study of nuclear and cytoplasmic control of culture ability
and regeneration of scutellar calli from common wheat. Theor. Appl.
Genet.,74:8O2-810.
Fennell, S., Bohorova, N., Van Ginkel, M., Crossa, J' and Hoisington, D. 1996.
plant regeneration from immature embryos of 48 elite CIMMYT bread
wheats, Theor. Appl. Genet.,92: 163-169.
Finnegan, J. and McElroy, D. 1994. Transgene inactivation: plants fight back!
BiolTech nol., 12: 883-888.
Fromm, M.E., Taylor, L.P. and Walbot, V. 1985. Expression of genes transferred
into monocot and dicot plant cells by electroporation. Proc. Natl. Acad. Sci.
USA.,82: 5824-5828.
Fromm, M.E., Morrish, F., ArmStrong, C., Williams, R., Thomas, J. and Klein, T.M'
1gg0. lnheritance and expression of chimeric genes in the progeny of
transgenic maize plants. BiolTechnol., 8'. 833-839.
Fry, J.E., Cheng, M., Hu, T., Layton, J., Wan, Y., Zhou, H', Duncan, D.R',
Hironaka, C., Pang, S., Liang, J. and Conner, T. 1998. Advances in the
genetic engineering of wheat. Proc. of the 9th international wheat genetics
symposium, Saskatoon, Canada, p1 56-1 58.
Gale, M.D. 1979. Genetic variation for hormonal activity and yield. In Crop
physiology and cereat breeding. Spiertz, J.H,J. and Kramer, Th. (eds).
Centre for Agric. Pub. and Doc', Wageningen. p29-34'
Galiba, A. and Erdei, L. 1986. Dependence of wheat callus growth, differentiation
and mineral content on carbohydrate supply, Plant Science,45: 65-70,
References 135
Goldsbrough, A.P., Lastrella, C.N. and Yoder, J.l. 1993. Transposition mediated
re-positioning and subsequent elimination of marker genes from transgenic
tomato. BiolTechnol., 11: 1286'1292.
Gosch-Wackerle, G., Avivi, L. and Galun, E. 1979' lnduction, culture and
differentiation of callus from immature rachises, seeds and embryos of
triticum. Z. Pflanzenphysiol. 91: 267-278.
Gould, J., Devey, M., Hasegawa, o., ulian, E.c,, Peterson, G. and smith, R.H.
1g91. Transformation o1 Zea mays L. using Agrobacterium tumefaciens
and the shoot apex. Plant Physiol',95: 426'434.
Haldrup,4., Petersen, S.G. and Okkels, F.T. 1998. Positive selection: a plant
selection principle based on xylose isomerase, an enzyme used in the food
industry. Plant Cell Repolfs, 18: 76-81.
Hansen,G. and Wright, M.S. 1999. Recent advances in the transformation of
plants. Trends in Plant Science, 4:226'231.
Hanzel, J.J., Miller, J.P., Brinkman, M.A. and Fendos, E. 1984. Genotype and
media effects on callus formation and regeneration in barley. Crop
Science,2S: 27-31 .
Harvey, A., Moisaî, L., Lindup, S, and Lonsdale, D. 1999. Wheat regenerated
from scutellum callus as a source of material for transformation. Plant Cell,
Tissue and Organ Culture,5T: 153-156.
Hauptmann, R.M., Ozias-Akins, P,, Vasil, V., Tabaetzadeh, 2., Rogers, S.G',
Horsch, R.8,, Vasil, l.K. and Fraley, R.T. 1987. Transient expression of
electroporated DNA in monocotyledonous and dicotyledonous species.
Plant Cell Repods, 6: 265-270.
Hayashimoto, 4., Li, Z. and Murai, N. 1990. A PEG-mediated protoplast
transformation system for production of fertile transgenic rice plants. Plant
Physiol.,93: 857-863.
He, G.Y. andLazzeri, P.A. 1998. Analysis and optimisation of DNA delivery into
wheat scutellum and tritordeum inflorescence explants by tissue
electroporation. Plant Cell RepoÍs, 18: 64'70.
He, D.G., Mouradov, A., Yang, Y.M., Mouradova, E. and Scott, K.J. 1994.
Transformation of wheat (Triticum aestivum L.) through electroporation of
protoplasts. Plant Cell Repofts, 14'. 192-196.

References 136
Hê, D.G., Tanner, G. and Scott, K.J. 1986. Somatic embryogenesis and
morphogenesls in callus derived from the epiblast of immature embryos of
wheat (Triticum aestivumL.\. Plant Science,45: 119-124'
He, D.G., yang, Y.M. and Scott, K.J. 1989. The effect of macroelements in the
induction of embryogenic callus from immature embryos of wheat (Triticum
aestivum L.). Plant Science, 64:. 251 -258.
He, D.G., yang, Y.M. and Scott, K,J. 1992. Plant regeneration from protoplasts of
wheat (Triticum aestivum cv. Hartog). Plant Cell Repo,fis, 11: 16-19'
Hess, J.R. and Carman, J.G. 1998. Embryogenic competence of immature wheat
embryos: genotype, donor plant environment and endogenous hormone
levels. CroP Science, 38: 249-253.
Hess, D,, Dressler, K. and Nimmrichter, R. 1990. Transformation experiments by
pipetting Agrobacteriuminlo the spikelets of Wheat (Triticum aestivumL.)'
P lant Science, 72:. 233'244.
Hiei, y., Ohta, S., Komari, T. and Kumashiro, T. 1994. Efficient transformation of
rice (Oryza sativa L.) mediated by Agrobacterium and sequence analysis of
the boundaries of the T-DNA. The Plant Journal,6(2):271-282.
Higgins, P. and Mathias, R,J. 1987. The effect of the 48 chromosomes of
hexaploid wheat on the growth and regeneration of callus cultures. Theor.
Appl. Genet., 7 4: 439-444.
Hobbs, S,L.A., Kpodar, P. and Delong, C.M.O. 1990. The effect of T-DNA copy
number, position and methylation on repofter gene expression in tobacco
transformants. Plant MoL Biol.,15: 851-864.
Hunold, R., Bronner, R. and Hahne, G. 1994. Early events in microprojectile
bombardment: cell viability and particle location. The Plant Journal, 5(4);
593-604.
lida, 4., Seki, M., Kamada, M., Yamada, Y. and Morikawa, H' 1990. Gene
delivery into cultured plant cells by DNA-coated gold particles accelerated
by a pneumatic particle gun. Theor. Appl.Genet.,80: 813-816.
lser, M,, Fettig, S., Scheyhing, F., Vieftel, K. and Hess, D. 1999. Genotype-
dependent stable genetic transformation in German spring wheat varieties
selected for high regeneration potential. J. Plant Physiol.,154:509-516.

References 137
lshida,Y., Saito, H., Ohta, S., Hiei, Y., Komari, T. and Kumashiro, T. 1996. High
efficiency transformation of maize (Zea mays L.) meditedby Agrobacterium
tumefaciens. Nature Biotechnol., 14: 7 45'750'
Jahne, A., Becker, D. and Lörz, H. 1995. Genetic engineering of cereal crop
plants: a review. Euphytica, 85: 35-44.
Jefferson, R.A. 1g87. Assaying chimeric genes in plants: the GUS gene fusion
system. Ptant Mol. Biol. Reporter, S(a): 387-405.
Jefferson, R.A., Kavanagh, T.A. and Bevan, M.W. 1987. GUS fusions: B-
glucuronidase as a sensitive and versatile gene fusion marker in higher
plants, The EMBO Journal,6(13): 3901-3907'
Joersbo, M. and Okkels, F.T. 1996. A novel principle for selection of transgenic
plant cells: positive selection. Plant cell Repo,rls, 16: 219-221.
Jones, A.M. and Petolino, J,F. 1987. Effects of donor plant genotype and growth
environment on anther culture of soft-red winter wheat (Triticum aestivum
L.). Ptant Cell, Tissue and Organ Culture, S:215'223.
Jones, A.M. and Petolino, J,F. 1988. Effects of support medium on embryo and
plant production from cultured anthers of soft-red winter wheat (Triticum
aestivumL.). Plant cell, Tissue and organ culture,12:253-261.
Jorgensen, R. 1990. Altered gene expression in plants due to frans interactions
between homologous genes. TIBTECH., 8: 340-344.
Kaleikau, E,K., Sears, R.G. and Gill, B.S. 1989. Monosomic analysis of tissue
culture response in wheat (Triticum aestivum L.). Theor. Appl. Genet.,78:
625-632.
Käppeli, O. and Auberson, L. 1998. How safe is safe enough in plant genetic
engineering? Trends in Plant Science, 3(7): 276-281'
Karp, A. and Maddock, S,E. 1984. Chromosome variation in wheat plants
regenerated from cultured immature embryos. Theor. Appl. Genet., 67:
249-255.
Kartha, K.K., Chibbar, R.N., Georges, F., Leung, N., Caswell, K., Kendall E. and
Qureshi, J. 1989. Transient expression of chloramphenicol
acetyltransferase (caf) gene in barley cell cultures and immature embryos
through microprojectile bombardment. Plant Cell Repolts, 8: 429-432.

References 138
Karunaratne, S., Sohn, 4., Mouradov, A', Scott, J., Steinbiss, H' and Scott, K'J'
1996. Tranformation of wheat with the gene encoding the coat protein of
barley yellow mosaic v¡rus. Aust. J. Plant Physiol.,23: 429-435.
Kessler, D.4., Taylor, M.R., Maryansk¡, J.H., Flamm, E.L. and Kahl, L'S' 1992'
The safety of foods developed by biotechnology. Science,256: 1747-1832'
Kikkefi, J.R. 19g3. The biolistic PDS-1000/He device. Plant Cell, Tissue and
Organ Culture, 33: 221 -226'
Klein, T.M,, Gradziel, T., Fromm, M.E. and Sanford, J'C. 1988' Factors
influencing gene delivery into Zea mays cells by high-velocity
microprojectiles. BiolTechnol', 6: 559-563.
Klein, T.M., Wolf, E.D., Wu, R. and Sanford, J.C. 1987. High-velocity
microprojectiles for delivering nucleic acids into living cells. Nature,327:
70-73.
Klein, T.M., Roth, B.A. and Fromm, M.E. 1989. Regulation of anthocyanin
biosynthetic genes introduced into intact maize tissues by microprojectiles'
Proc. Natl. Acad. Sci. USA.,85: 6681-6685.
Kluth,4., Brettschneider, R., Lörz, H. and Becker, D' 1998. lnheritance and
expression of transgenes in hexaploid wheat. Proc. of the 9th international
wheat genetics symposium, Saskatoon, Canada, p192-194.
Kohli, A., Gahakwa, D., Vain, P., Laurie, D,A.and Christou, P. 1999. Transgene
expression in rice engineered through particle bombardment: molecular
factors controlling stable expression and transgene silencing. Planta,2OS:
88-97.
Komari, T,, Hiei, Y., saito, Y., Murai, N. and Kumashiro, T. 1996. Vectors carrying
two separate T-DNAs for co-transformation of higher plants mediated by
Agrobacterium tumefaciens and segregation of transformants free from
selection markers. The Plant Journal,l0: 165-174.
Koprek, T., Hänsch, R., Nerlich, 4., Mendel, R,R. and Schulze, J. 1996. Fertile
transgenic barley of different cultivars obtained by adjustment of
bombardment conditions to tissue response. Plant Science, 119: 79-91 .
Kronstad, W.E. 1998. Agricultural development and wheat breeding in the 20th
century. ln Braun, H.-J,, Altay, F., Kronstad, W.E., Beniwal, S.P.S and
McNab, A. (eds). Wheat: prospects for global improvement. Proc. of the

References 139
bth lnt. Wheat Conf., Ankara, Turkey. Developments in plant breeding, v. 6.
Kluwer Academic Publishers. Dordrecht. p1-10'
Kumlehn, J., Brettschneider, R., Lörz, H. and Kranz, E' 19974. Zygote
implantation to cultured ovules leads to direct embryogenesis and plant
regeneration of wheat. The Plant Journal,l2(6): 1473-1479.
Kumlehn, J., Schieder, O. and Lörz, H. 1997b. ln vitro development of wheat
(Triticum aestívum L.) from zygote to plant via ovule culture. Plant Cell
Reports,l6: 663-667.
Kumpatla, S.P. and Hall, T.C. 1998. Longevity ol 1-azacytidine-mediated gene
expression and re-establishment of silencing in transgenic rice. Plant Mol.
Biol.,38: 1113-1122.
Kyozuka, J., McElroV, D., Hayakawa, T., Xie, Y, Wu, R. and Shimamoto, K. 1993.
Light-regulated and cell specific expression of tomato rbcS-GUS and rice
rbcs-GtJSfusion genes in transgenic rice. Plant Physiol.,102: 991-1000.
Langridge, P., Karakousis, A. and Nield, J. 1997. Practical workshop in basic
recombinant DNA techniques, Centre for cereal biotechnology. Waite
Agricultural Research lnstitute. University of Adelaide, South Australia.
Langridge, P., Karakousis, 4., Nield, J. and Handford, D. 1999. Molecular
markers in plant breeding short course. Cooperative Research Centre
Molecular Plant Breeding. Waite Agricultural Research lnstitute, University
of Adelaide, South Australia.
Larkin, P.J. and Scowcroft, W.R. 1981. Somaclonal variation - a novel source of
variability from cell cultures for plant improvement. Theor. Appl. Genet.,6O:
197-214.
Larkin, P.J., Ryan, S.4., Brettell, R.l.S. and Scowcroft, W.R. 1984. Heritable
somaclonal variation in wheat. Theor. Appl. Genet,67: 443-455.
Lazar, M.D., Chen, T.H.H., Gusta, L.V. and Kaftha, K.K. 1988. Somaclonal
variation for freezing tolerance in a population derived from norstar winter
wheat. Theor. Appl. Genet., 75: 48Q-484.
Lazar, M.D., Chen, T.H.H., Scoles, G.J. and Kartha, K.K. 1987. lmmature embryo
and anther culture of chromosome addition lines of rye in chinese spring
wheat. Plant Science, 51:77'81 .

References 140
Lazar, M.D., Collins, G.B. and vian, w.E. 1983. Genetic and environmental
effects on the growth and differentiation of wheat somatic cell cultures. Ihe
Journal of HereditY,T4:353-357 '
Lazar. M.D., Schaeffer, G.W., and Baenziger, P.S' 1985. The physical
environment in relation to high frequency callus and planlet development in
anther cultures of wheat (Triticum aestivum L.) cv. Chris. J. Plant Physiol.,
121:103-109.
Lazzeri, p.A. and Shewry, P.R. 1993. Biotechnology of cereals. ln Biotechnology
and Genetic Engineering Reviews. Tombs, M.P. (ed). Intercept, Andevor,
11:79-146.
Lazzeri, P.4., Brettschneider, R., Luhrs, R. and Lörz, H. 1991. Stable
transformation of barley via PEG-induced direct DNA uptake into
protoplasts. Theor. Appl. Genet', 81 437-444.
Leckband, G. and Lörz, H. 1998. Transformation and expression of a stilbene
synthase gene of Vitis vinifera L. in barley and wheat for increased fungal
resistance. Theor. Appl. Genet',96: 1004-1012.
Lonsdale, D.M., Moisan, L.J. and Haruey, A.J. 1998. The effect of altered codon
usage on luciferase activity in tobacco, maize and wheat. Plant Cell
Reports,lT: 396-399,
Lörz, H., Becker, D. and Lütticke, S, 1998. Molecular wheat breeding by direct
gene transfer. Euphytica, 100: 219-223.
Lörz,H., Becker, D. and Schell, J. 1985. Gene transferto cereal cells mediated
by protoplast transformation. Mol. Gen. Genet.,199: 178'182.
Lührs, R. and Lörz, H. 1987. Plant regeneration in vitro from embryogenic
cultures of spring- and wintertype barley (Hordeum vulgare L.) varieties,
Theor. Appl. Genet., 75: 16-25'
Ma, H., Gu, M. and Liang, G.H. 1987. Plant regeneration from cultured immature
embryos ol Sorghum bicolor (L.) Moench. Theor. Appl. Genet., 73: 389-
394.
Machii, H., Mizuno, H., Hirabayashi, T., Li, H. and Hagio, T. 1998. Screening
wheat genotypes for high callus induction and regeneration capability from
anther and immature embryo cultures. Plant Cell, Tissue and Organ
Culture, SS:67'74.

References '141
Maddock, S.E., Lancaster, V.A., Risiott, R. and Franklin, J. 1983. Plant
regeneration from cultured immature embryos and inflorescences oÍ 25
cultivars of wheat (Triticum aestivum). Journal of Exp. Bot.,34(144): 915-
926.
Maris, O.C., Chibbar, R.N., Caswell, K., Leung, N. and Kaftha, K.K. 1996.
Somatic embryogenesis from isolated scutella of wheat: effects of physical,
physiological and genetic factors. Plant science, 121:75-84.
Marcinska, 1., Dubert, F. and Biesaga-Koscielniak, J. 1995. Transfer of the ability
to flower in winter wheat via callus tissue regenerated from immature
inflorescences. Ptant Cell, Tissue and Organ Culture, 41:285'288.
Marsan, P.4., Lupotto, E., Locatelli, F., Qiao, Y.M. and Cattaneo, M. 1993.
Analysis of stable events of transformation in wheat vr,a PEG-mediated
DNA uptake into protoplasts. Plant Science,93: 85-94.
Mathias, R.J. and Fukui, K. 1986. The effect of specific chromosome and
cytoplasm substitutions on the tissue culture response of wheat (Triticum
aestivum) callus. Theor. Appl. Genet., 71: 797-80O.
Mathias, R.J. and Simpson, E,S. 1986. The interaction of genotype and culture
medium on the tissue culture responses of wheat (Triticum aestivum L. em.
thell) callus. Plant Cell, Tissue and Organ Culture, T: 31'37.
Mathias, R.J., Fukui, K. and Law, C.N. 1986. Cytoplasmic effects on the tissue
culture response of wheat (Triticum aestivum) callus. Theor. Appl. Genet.,
72:70-75.
Matzke, M.A. and Matzke, E.J.M, 1990. Gene interactions and epigenetic
variation in transgenic plants. Developm. Genet., 11: 214-223.
Matzke, M.4., Primig, M., Trnovsky, J. and Matzke, A.J.M. 1989. Reversible
methylation and inactivation of marker genes in sequentially transformed
tobacco plants. The EMBO Journal, S(3): 643-649.
McOabe, D.E., Swain, W,F., Maftinell, B.J. and Christou, P. 1988' Stable
transformation of soybean (Glycine Max) by particle bombardment.
Bio/Technol., 6; 923-926.
McElroy, D. and Brettell, R.l.S, 1994. Foreign gene expression in transgenic
cereals. TIBTECH., 12: 62-68.

Heferences 142
McElroy, D., Zhang, w., cao, J. and wu, R. 1990. lsolation of an efficient actin
promoter for use in rice transformation. The Plant Cell, 2: 163-171 '
Mendel, R,R. and Teeri, T.H, 1995. Barley, wheat, oat and other small-grain
cereal crops. ln Transformation of plants and soil microorganisms. Wang,
K., Herrera-Estrella, A. and Van Montagu, M. (eds)., Cambridge University
Press, London, P. 81-98'
Meyer, p. 1g95". Variation of transgene expression in plants. Euphytica, 85: 359-
366.
Meyer, p. 1gg5b. Understanding and controlling transgene expression.
TIBTECH., 13: 332-337 .
Meyer, P., Heidmann, l. and Niedenhof, l. 1993. Differences in DNA-methylation
are associated with a paramutation phenomenon in transgenic petunia'
The Plant Journal, a(1): 89-100.
Miles, J.S. and Guest, J.R. 1984. Nucleotide sequence and transcriptional start
point of the phosphomannose isomerase gene (manA) oÍ Escherichia coli.
Gene,32: 41-48.
Mohmand, A.S. and Nabors, M.W. 1990. Somaclonal variant plants of wheat
derived from mature embryo explants of three genotypes. Plant Cell
Reports, S: 558-560.
Mohmand, A.S. and Nabors, M.W. 1991. Comparison of two methods for callus
culture and plant regeneration in wheat (Triticum aestivum). Plant Cell,
Tissue and Organ Culture,26: 185-187'
Mooney, P,A., Godwin, P.8., Dennis, E.S. and Llewellyn, D.J. 1991.
Agrobacterium tumefaciens gene transfer into wheat tissues. Plant Cell,
Tissue and Organ Culture, 25: 209'218.
Mounla, M.A.Kh. 1979. Phytohormones and grain growth in cereals. ln Crop
physiotogy and cereal breeding. Spieftz, J.H.J. and Kramer, Th. (eds).
Centre for Agric. Pub. and Doc., Wageningen. p20-28.
Müller, E.,Lörz, H. and Lütticke, S. 1996. Variability of transgene expression in
clonal cell lines of wheat. Plant Science, 114:71-82.
Murashige, T. and Skoog, F. 1962. A revised medium for rapid growth and bio-
assays with tobacco tissue cultures. Physiol. Plantarum,lS: 473'497.

References 143
Murray, F.R., H¡ll, A., Appels, R,and Brettell, R.l.S. 1998. Transformation of
Australian wheat cultivars. Proc. of the 9th international wheat genetics
symposium, Saskatoon, Canada, p1 59-162.
Myer, P,, Linn, F., Heidmann, 1., Meyer, H., Niedenhof, l. and Saedler, H. 1992.
Endogenous and environmental factors influence 35S promoter methylation
of a maize A1 gene construct in transgenic petunia and its colored
phenotype. Mol. Gen. Genet.,231: 345-352.
Nehra, N.S., Chibbar, R.N., Leung, N., Caswell, K., Mallard, C', Steinhauer, L.,
Baga, M. and Kaftha, K,K. 1994. Self-fertile transgenic wheat plants
regenerated from isolated scutellar tissues following microprojectile
bombardment with two distinct gene constructs. The Plant Journal, 5(2):
285-297.
Oard, J.H., Paige, D.F. and Dvorak, J, 1989. Chimeric gene expression using
maize intron in cultured cells of breadwheat. Plant Cell Repods, 8: 156-
1 60.
Oard, J.H., Paige, D.F,, Simmonds, J.A, and Gradzei, T.M. 1990. Transient gene
expression in maize, rice and wheat cells using an airgun apparatus. Plant
Physiol.,92: 334-339.
Orliz, J.P.A., Reggiardo, M.1., Ravizzini, R,A., Altabe, S.G., Cervigni, G.D.L.,
Spitteler, M.A., Morata, M.M., Elias, F.E. and Vallejos, R.H. 1996.
Hygromycin resistance as an efficient selectable marker for wheat stable
transformation. Plant Cell Repotls, 15: 877-881.
Ortiz, J.P.A., Ravizzini, R.4., Morata, M.M. and Vallejos, R.H. 1997. A rapid
system for studying foreign gene expression in wheal (Triticum aestivum
L.). J. Appl. Genet.,38(2): 123-130,
Ou, G., Wang, W.C. and Gyuyen, H.T. 1989. lnheritance of somatic
embryogenesis and organ regeneration from immature embryo cultures of
winter wheat. Theor. Appl. Genet., 78: 137-142.
Ou-Lee, T.M., Turgeon, R. andWu, R. 1986. Expression of aforeign gene linked
to either a plant-virus or a Drosophila promoter, after electroporation of
protoplasts of rice, wheat and sorghum. Proc. Natl. Acad. Scr. USA., 83:
6815-6819.

References 144
özgen, M., Türet, M., Altinok, S. and Sancak, C, 1998. Efficient callus induction
and plant regeneration from mature embryo culture of winter wheat
(Triticum aestivum L,) genotypes. Plant cell Repods, 18: 331-335.
Ozias-Akins, P. and Vasil, l.K. 1982. Plant regeneration from cultured immature
embryos and inflorescences of Triticum aestivum L. (wheat): evidence for
somatic embryogenesis' Protoplasma, 110: 95-1 05'
Ozias-Akins, P. and Vasil, l.K. 1983. lmproved efficiency and normalization of
somatic embryogenesis in Triticum aestivum (wheat). Protoplasma, 117:
40-44.
Pang, S-2., De Boer, D.L., Wan, Y., Ye, G., Layton, J'G', Neher, M.K., Armstrong,
C.L., Fry, J.E., Hinchee, M.A.W. and Fromm, M.E. 1996. An improved
green fluorescent protein gene as a marker in plants. Plant Physiol., 112:
893-900.
Papenfuss, J.M. and Carman, J.G. 1987. Enhanced regeneration from wheat
callus cultures using dicamba and kinetin. Crop Science,2T;588-593.
pawlowski, W.P. and Somers, D.A. 1996. Transgene inheritance in plants
genetically engineered by microprojectile bombardment. Mol. Biotechnol.,
6: 17-30.
Pedersen, C., Zimny, J., Becker, D., Jahne, A and Lörz, H. 1997. Localization of
introduced genes on the chromosomes of transgenic barley, wheat and
triticale by fluorescence in situ hybridization. Theor. Appl. Genet.,94:749-
757.
Pellegrineschi, 4., Fennell, S., Mclean, S.D., Brito, R.M., Yelázquez. L., Salgado,
M., Olivares, J.J., Hernández, R. and Hoisington, D.A. 1999. Wheat
transformation in CIMMYT: a description of a seruice laboratory. ln Vitro
Cellular and Developmental Biology, 35(3): 43.
Perl,4., Kless, H., Blumenthal,4., Galili, G. and Galun, E. 1992. lmprovement of
plant regeneration and GUS expression in scutellar wheat calli by
optimization of culture conditions and DNA-microprojectile delivery
procedures. Mol. Gen. Genet., 235: 279-284.
Potrykus, l. 1990. Gene transferto cereals: an assessment. Bio/Technol., 8: 535-
542.

References 145
potrykus, l. 1gg1. Gene transfer to plants: assessment of published approaches
and results. Annu. Rev. Ptant Physiol. Plant Mol. Biol',42:205'225.
pröls, F. and Meyer, P. 1992. The methylation patterns of chromosomal
integration regions influence gene activity of transferred DNA in Petunia
hybrida. The Plant Journal, 2$): 465-a75.
eureshi, J.4., Hucl, P. and Kaftha, K.K. 1992. ls somaclonal variation a reliable
tool for spring wheat improvement? Euphytica,6O'- 221-228'
Qureshi, J.4., Jordan, M.C,, Chibbar, R.N., Kaftha, K.K., Rodriguez, D. and
Fromm, M.E. 1995. Genetic engineering of wheat for glyphosate tolerance.
proc. Conf. on "Value-added Cereals through Biotechnology", Canada, p59.
Qureshi, J.A., Kartha, K.K., Abrams, S.R. and Steinhauer, L. 1989. Modulation of
somatic embryogenesis in early and late-stage embryos of wheat (Triticum
aestivum L.) under the influence of abscisic acid and its analogs. Plant
Cell, Tissue and Organ Culture,lS: 55-69.
Qureshi, J.A., Singh, R.R., Basri, 2., Stewaft, R.R., Bufton, R.4., Kollmorgen, J.F'
and Fincher, G.B. 1997. Strategies for genetic transformation of elite
Australian barley varieties. Proc. of the 8th Australian barley technical
symposium, Queensland, Australia, p2:8.9-2:8.1 1.
Raineri, D.M., Bottino, P., Gordon, M.P. and Nester, E.W. 1990. Agrobacterium
mediated transformation of rice (Oryza sativa). Bio/Technol., 8: 33-38.
Rajyalakshmi, K., Grover, A., Maheshwari, N., Tyagi, A.K. and Maheshwari, S.C.
1991. High frequency regeneration of plantlets from the leaf-bases vra
somatic embryogenesis and comparison of polypeptide profiles from
morphogenic and non-morphogenic calli in wheat (Triticum aestivum).
Physiol. Plantarum, 82: 61 7 -623.
Rasco-Gaunt, S., Riley, 4., Barcelo, P. and Lazzeri, P.A. 1999. Analysis of
particle bombardment parameters to optimise DNA delivery into wheat
tissues. PlantCell Repotfs, 19: 118-127.
Redway, F,4., Vasil, V., Lu, D. and Vasil, I.K. 1990. ldentification of callus types
for long-term maintenance and regeneration from commercial cultivars of
wheat (Triticum aestivum L.). Theor. Appl. Genet.,79: 609-617.
Reed, J.R., Chang, Y,-F, Wang, H., McNamara, D., Beer, S., Miles, P., Hill, K' and
Qureshi, J.A. 1999. Mannose-6-phosphate isomerase (MPl) encoded by
Beferences 146
lhe man A gene is an efficient selectable marker for wheat transformation.
proc, of the 16th Long Ashton lnternational Symposium. Biotechnology of
cereals: tools, targets and triumphs. IACR-Long Ashton Research Station,
Bristol, UK, P66.
Rengel, Z. and Jelaska, S, 1986. Somatic embryogenesis and plant regeneration
from seedling tissues ol Hordeum vulgare L. J. Plant Physiol., 124: 385-
392.
Rhodes, C.4., Pierce, D.4., Mettler, LJ., Mascarenhas, D. and Detmer, J.J. 1988.
Genetically transformed maize plants from protoplasts. Science, 240: 204-
207.
Ritala, 4., Aspegren, K., Kurten, U., Salmenkallio-Maftilla, M., Mannonen, L.,
Hannus, R., Kauppinen, V., Teeri, T.H. and Enari, T. 1994. Fertile
transgenic barley by particle bombardment of immature embryos. Plant
Mol. Biol., 2aQ): 317 -325'
Rosegrant, M.W., Agcaoili-Sombilla, A. and Perez, N. 1995. Global food
projections to 2020. Discussion paper 5. washington, D,C., lFPR|.
Russell, P.J. 1gg0. Genetics. Second edition. Scott, Foresman and Company,
London, pp913.
Russell, S.H., Hoopes, J.L. and Odell, J.T. 1992. Directed excision of a transgene
from the plant genome. Mol. Gen. Genet.,234:49'59.
Russell, D.R,, Wallace, K.M., Bathe, J,H., Maftinell, B.J. and McOabe, D.E. 1993'
Stable transformation of phaseolus vulgaris vra electric-discharge mediated
particle acceleration. Plant Cell Reports, 12: 165-169.
Sadasivam, S. and Gallie, D,R. 1994. lsolation and transformation of rice
aleurone protoplasts. Plant Cell Reports, 13:394-396.
Sanford, J.C. 1990. Biolistic plant transformation. Physiol. Plant.,79:206-209.
Sanford, J.C., Smith, F.D. and Russell, J.A. 1993. Optimizing the biolistic process
for different biological applications. Methods En4rmol., 217: 483-509.
Schaeffer, G.W., Baenziger, P.S. and worley, J. 1979. Haploid plant development
from anthers and in vitro embryo culture of wheat. Crop Science,l9: 697-
702.
Sears, R.G. and Deckard, E.L. 1982, Tissue culture variability in wheat: callus
induction and plant regeneration. Crop Science, 22: 546-550.

References 147
shah, D., Horsch, R.8., Klee, H,J., KiShOre, G.M,, Winter, J.4., TUmer, N.E.,
Hironaka, c.M., sanders, P.R., Gasser, C.S., Aykent, s., siegel, N.R.,
Rogers, S,G. and Fraley, R.T. 1986. Engineering herbicide tolerance in
transgenic plants. Science, 233: 478'481.
Sharma, V.K,, Rao, 4,, Varshney, A. and Kothari, S.L. 1995. Comparison of
developmental stages of inflorescence for high frequency plant
regeneration in Triticum aestivum L. and T. durum Desf. Plant Cell
Reports, 15: 227-231 .
Sheen, J., Hwang, S., Niwa, Y., Kobayashi, H. and Galbraith, D.W' 1995. Green-
fluorescent protein as a new vital marker in plant cells, The Plant Journal,
8(5):777-784.
Sheng, J. and Citovsky, V. 1996. Agrobacterium-planl cell DNA transport: have
virulence proteins, will travel. The Plant Cell, 8: 1699-171 0.
Shewry, P.R., Tatham,4.S,, Barro, F., Barcelo, P. and Lazzeri, P. 1995.
Biotechnology of breadmaking: unraveling and manipulating the multi-
protein gluten complex. Bio/technol., l3: 1185-1190.
Shimada, T. and Makino, T. 1975. ln vitro culture of wheat, lll. antherculture of
the A genome aneuploids in common wheat. Theor. Appl. Genet.,46:407-
410.
Shimamoto, K., Terada, R., lzawa, T. and Fujimoto, H. 1989. Fertile transgenic
rice plants regenerated from transformed protoplasts, Nature, 338: 274-
276.
Somers, D.4., Torbeft, K.4., Pawlowski, W.P. and Rines, H.W. 1994. Genetic
engineering of oat. ln lmprovement of cereal quality by genetic
engineering. Henry, R.J. and Ronalds, J.A. (eds). Plenum, NewYork,pST-
46.
Southern, E.M. 1975. Detection of specific sequences among DNA fragments
separated by gel electrophoresis. J. Mol. Biol', 98:503-517.
Sparks, C., Rasco-Gaunt, S., Riley, 4., Barcelo, P. and Lazzeri, P.A. 1998.
Development of transformation systems for current wheat varieties. Proc.
of the 9th international wheat genetics symposium, Saskatoon, Canada,
p212-214.

Beferences 148
Spencer, T.M., Gordon-Kamm, W.J., Daines, R.J', Staft, W'G. and Lemaux, P'G'
1ggg. Bialaphos selection of stable transformants from maize cell culture.
Theor. APPL Genet.,79: 625-631'
Spencer, T.M., O'Brien, J.V., Start, W.G. and Adams, T.R. 1992. Segregation of
transgenes in maize. Plant Mol. Biol.,18(2): 201-210'
Srivastava, V., Vasil, V. and Vasil, 1.K. 1996. Molecular characterization of the
fate of transgenes in transformed wheat (Triticum aestivumL'). Theor Appl.
Genet.,92: 1031-1037.
Stam, M., Mol, J.N.M. and Kooter, J.M. 1997. The silence of genes in transgenic
plants, Ann. Bot.,79: 3'12'
Takumi, S. and Shimada, T. 1997. Variation in transformation frequencies among
six common wheat cultivars through particle bombardment of scutellar
tissues. Genes Genet. Sysf., 72: 63-69.
Takumi, S., Otani, M. and Shimada, T. 1994. Effect of six promoter-intron
combinations on transient reporter gene expression in einkorn, emmer and
common wheat cells by particle bombardment. Plant Science, 103: 161-
1 66.
Tingay, S., McElroY, D., Kalla, R., Fieg, S., Wang, M., Thornton, S. and Brettell,
R,l.S. 1997. Agrobacterium tumefaciens-mediated barley transformation,
The Plant Journal, 1 1 (6): 1 369-1 376.
Toki, S., Takamatsu, S., Nojiri, C., Ooba, S., Anzai, H., lata, M', Christensen,
4.H., Quail, P.H. and Uchimiya, H. 1992. Expression of a maize ubiquitin
gene promoter- bar chtmeric gene in transgenic rice plants. Plant Physiol.,
100:1503-1507.
Uchimiya, H., Fushimi, T., Hashimoto, H., Haradâ, H., Syono, K. and Sugawara,
Y. 1gBO. Expression of a foreign gene in callus derived f rom DNA{reated
protoplasts of rice (Oryza sativaL.). Mol. Gen. Genet.,2O4:204-207.
Vain, P., Worland, 8., Kohli, A., Snape, J.W. and Christou, P. 1998. The green
fluorescent protein GFn as a vital screenable marker in rice
transformation. Theor. Appl. Genet.,96: 164-169.
Vasil, l.K. 1987. Developing cell and tissue culture systems for the improvement
of cereal and grass crops. J. Plant. Physiol', 128: 193-218.

References 149
Vasil, LK. 1ggg. progress in the regeneration and genetic manipulation of cereal
crops. Bio/Technol', 6: 397-402.
vasil, v,, Brown, s.M., Re, D., Fromm, M.E. and vasil, LK. 1991. stably
transformed callus lines from microprojectile bombardment of cell
suspension cultures of wheat. BiolTechnol.,9:743-747 '
Vasil, v., castillo, A.M., Fromm, M.E. and vasil, l.K. 1992. Herbicide resistant
fertile transgenic wheat plants obtained by microprojectile bombardment of
regenerable embryogenic callus. Bio/Technol., 1o: 667-674.
Vasil, V,, Clancy, M., Ferl, R.J., Vasil, LK. and Hannah, L.C. 1989' lncreased
gene expression by the first intron of maize shrunken locus in grass
species. Plant Physiol.,9l : 1575-1579.
Vasil, V., Srivastava, V., Castillo, A,M., Fromm, M.E. and Vasil, l.K. 1993' Rapid
production of transgenic wheat plants by direct bombardment of cultured
immature embryos. Biofiechnol', 11: 1553-1558.
vaucheret, H., Béclin, c., Elmayan, T., Feuerbach, F., Godoñ, c., Morel, J.-8.,
Mourrain, P., Palauqui, J.-C, and Vernhettes, S. 1998' Transgene-induced
gene silencing in plants. The Plant Journal,l6(6): 651-659.
Vieftel, K. and Hess, D. 1996. Shoot tips of wheat as an alternative source for
regenerable embryogenic callus cultures. Plant Cell, Tissue and Organ
Culture,44: 183-188.
Waldron, C., Murphy, E.B., Roberts, J.L,, Gustafson, G.D., Armoux, S.L. and
Malcolm, S.K. 1985. Resistance to hygromycin B; a new marker for plant
transformation studies. Plant Mol. Biol.,5(2): 103-108'
Walter, C., Broer, 1., Hillmann, D. and Pühler, A. 1992. High frequency, heat
treatment-induced inactivation of the phosphinothricin resistance gene in
transgenic cell suspension of Medicago sativa. Mol. Gen. Genet., 235:
1 89-1 96.
Walters, D.4., Vetsch, C.S., Potts, D'E. and Lundquist, R.C. 1992.
Transformation and inheritance of a hygromycin phosphotransferase gene
in maize plants. Plant MoL Biol.,18(2): 189-200.
Wan, Y. and Lemaux, P.G, 1994. Generation of large numbers of independently
transformed fertile barley plants. Plant Physiol.,104: 37-48.

References 150
Webb, K.J. and Morris, P. 1992. Methodologies of plant transformation. ln Plant
genetic manipulation for crop protection. Gatehouse, A.M.R', Hilder, V'A'
and Boulter, D. (eds). Redwood Press, Melksham, p7'43'
Weeks, J.T., Anderson, O.D. and Blechl, A.E. 1993. Rapid production of multiple
independent lines of fertile transgenic wheat (Triticum aestivum)- Plant
Physiol., 102: 1 077 -1084.
Wernicke, W. and Milkovits, L, 1984. Developmental gradients in wheat leaves-
response of leaf segments in different genotypes cultured in vitro' J. Plant
Physiol.,115: 49-58.
Wernicke, W,, Gorst, J. and Milkovits, L' 1986. The ambiguous role of 2,4'
dichlorophenoxyacetic acid in wheat tissue culture. Physiol. Plantarum,6S:
597-602.
Wilke-Douglas, M., Perani, L., Radke, S. and Bossert, M. 1986. The application
of recombinant DNA technology toward crop improvement. Physiol.
Plantarum, 68: 560-565.
Witrzens, 8., Brettell, R.l.S., Murray, F.R., McElroy, D., Li, Z. and Dennis, E.S.
1gg3. Comparison of three selectable marker genes for transformation of
wheat by microprojectile bombardment. Ausf . J. Plant Physiol.,25:39'44.
Yang, Y.M., Hê, D.G. and Scott, K.J. 1991, Establishment of embryogenic
suspension cultures of wheat by continuous callus selection. Aust. J. Plant
Physiol., 18: 445-452.
yoder, J.l. and Goldsbrough, A.P. 1994. Transformation systems for generating
marker-f ree transgenic plants. Bio/Technol., 12'. 263'267 .
Zamora, A.B. and Scott, K.J, 1983. Callus formation and plant regeneration from
wheat leaves. Plant Science Letters,29: 183-189.
Zhang, W. and Wu, R. 1988. Efficient regeneration of transgenic plants from rice
protoplasts and correctly regulated expression of the foreign gene in the
plants. Theor. Appl. Genet.,76: 835-840.
Zhang, S., Cho, M.-J., Koprek, T. and Yun, R, 1999. Genetic transformation of
commercial cultivars of oat (Avena sativa L.) and barley (Hordeum vulgare
L.) using in vitro shoot meristematic cultures derived from germinated
seedlings. Plant Cell Repo,Ís, 18: 959-966.

References 151
Zhang,W., McElroy, D. and Wu, R' 1991. Analysis of rice actl 5'region activity
in transgenic rice plants. The Plant cell, 13: 1 155-1 165.
zhang, L., Rybczynski, J.J., Langenberg, w.G., Mitra, A. and French, R' 2000.
An efficient wheat transformation procedure: transformed calli with long-
term morphogenic potential for plant regeneration. Plant Cell Bepods, 19:
241-250.
Zheng, M.y. and Konzak, C.F. 1999. Effect o12, -dichlorophenoxyacetic acid on
callus induction and plant regeneration in anther culture of wheat (Triticum
aestivumL.). Plant Cell Repoñs, 19: 69-73'
Zhou, H. and Konzak, C.F. 1989, lmprovement of anther culture methods for
haploid production in wheat. Crop Science,29:817-821'
zhou, H., Arrowsmith, J.w., Fromm, M.E., Hironaka, c.M., Taylor, M'L',
Rodriguez, D., Pajeau, M.E., Brown, s.M., santino, c.G. and Fry, J.E.
1gg5. Glyphosate{olerant CP4 and GOX genes as a selectable marker in
wheat transformation. Plant Cell Reporfs, 15: 159-163'
Zhou, H., Stiff, C.M. and Konzak, C.F. 1993. Stably transformed callus of wheat
by electroporation-induced direct gene transfer. Plant Cell Reports, 12:
612-616.
Zhou, H., Zheng, Y. and Konzak, C.F. 1991. Osmotic potential of media affecting
green plant percentage in wheat anther culture. Plant Cell RepoÍs, 10: 63-
66.
Ziegler, G., Dressler, K. and Hess, D. 1990. lnvestigations on the anther
culturability of four German spring wheat cultivars and the influence of light
on regeneration of green ys. albino plants. Plant Breeding,l05: 40-46'